Embed Size (px)
Citation preview
ECONOMIC RECOVERY
PATHWAYS FOR
CANADA'S ENERGY
INDUSTRY: PART 2 -
CANADIAN CRUDE OIL
AND NATURAL GAS
STUDY NO. 192B SEPTEMBER 2020
3512 - 33 Street NW, #150, Calgary, AB T2L 2A6350 Sparks Street, #805, Ottawa, ON K1R 7S8
403.282.1231 | www.ceri.ca | [email protected]
@ceri_canada
Canadian Energy Research Institute


ECONOMIC RECOVERY PATHWAYS FOR CANADA’S ENERGY INDUSTRY: PART 2 – CANADIAN CRUDE OIL AND NATURAL GAS

Economic Recovery Pathways for Canada's Energy Industry: Part 2 - Canadian Crude Oil and Natural Gas
Authors: Mohamed Refaei, Tosin Adeyemo, Toufigh Bararpour, Eranda Bartholameuz, Nurul Hossain, Dinara Millington, Marc Mikhail, Hamid Rahmanifard Recommended Citation (Author-date style): Refaei, Mohamed, Tosin Adeyemo, Toufigh Bararpour, Eranda Bartholameuz, A K M Nurul Hossain, Dinara Millington, Marc Mikhail and Hamid Rahmanifard. 2020. “Economic Recovery Pathways for Canada's Energy Industry: Part 2 - Canadian Crude Oil and Natural Gas.” Study No. 192B. Calgary, AB: Canadian Energy Research Institute. https://ceri.ca/assets/files/Study_192B_Full_Report.pdf Recommended Citation (Numbered style): M. Refaei, T. Adeyemo, T. Bararpour, E. Bartholameuz, A.N. Hossain, D. Millington, M. Mikhail, and H. Rahmanifard, “Economic Recovery Pathways for Canada's Energy Industry: Part 2 - Canadian Crude Oil and Natural Gas,” Canadian Energy Research Institute, Calgary, AB, Study No. 192B, 2020. URL: https://ceri.ca/assets/files/Study_192B_Full_Report.pdf Copyright © Canadian Energy Research Institute, 2020 Sections of this study may be reproduced in magazines and newspapers with acknowledgment to the Canadian Energy Research Institute
September 2020 Printed in Canada
Acknowledgements: The authors of this report would like to extend their thanks and sincere gratitude to all CERI staff, the Board of Directors and the Research Advisory Committee involved in the production and editing of the material. The authors would also like to acknowledge the following reviewers for providing helpful and valuable insights for this study:
• Randy Green, Sproule • Elizabeth Aquin, PSAC • GLJ Ltd.
Responsibility for any errors, interpretations, or omissions lies solely with CERI.
ABOUT THE CANADIAN ENERGY RESEARCH INSTITUTE Founded in 1975, the Canadian Energy Research Institute (CERI) is an independent, registered charitable organization specializing in the analysis of energy economics and related environmental policy issues in the energy production, transportation, and consumption sectors. Our mission is to provide relevant, independent, and objective economic research of energy and environmental issues to benefit business, government, academia, and the public.
For more information about CERI, visit www.ceri.ca
CANADIAN ENERGY RESEARCH INSTITUTE 150, 3512 – 33 Street NW, Calgary, Alberta T2L 2A6, Email: [email protected], Phone: 403-282-1231
September 2020
Economic Recovery Pathways for Canada’s Energy Industry: Part 2 – Canadian Crude Oil and Natural Gas iii
Table of Contents List of Figures ................................................................................................................................................ v
List of Tables ............................................................................................................................................... vii
Acronyms and Abbreviations ....................................................................................................................... ix
Executive Summary ...................................................................................................................................... xi
Chapter 1: Introduction and Background ..................................................................................................... 1
Introduction .............................................................................................................................................. 1
Background - Summary Statistics ............................................................................................................. 1
Chapter 2: Modelling Methodology and Assumptions ................................................................................. 5
Modelling Methodology and Assumptions .............................................................................................. 5
Economic Model ................................................................................................................................... 5
Economic Impacts ................................................................................................................................ 6
Federal Programs ................................................................................................................................. 9
Provincial Programs ............................................................................................................................ 11
Oil and Gas Operations and Revenues ............................................................................................... 13
Chapter 3: Economic Impacts of Relief Measures and Industry Operations .............................................. 17
Economic Impacts of Relief Measures .................................................................................................... 17
Gross Domestic Product Impact ......................................................................................................... 19
Employment Impact ........................................................................................................................... 20
Net Tax Impact ................................................................................................................................... 21
Labour Income Impact ....................................................................................................................... 22
Economic Impacts of Oil and Gas Revenues ........................................................................................... 23
Economic Impacts of Conventional Crude Oil Development ............................................................. 23
Economic Impacts of Natural Gas Production ................................................................................... 25
Economic Impacts of Oil Sands Production ........................................................................................ 28
Chapter 4: Challenges and Opportunities for the Recovery of Canada's Oil and Gas Sector ..................... 33
Chapter 5: Conclusions ............................................................................................................................... 37
Bibliography ................................................................................................................................................ 39
Appendix A: Federal and Provincial Relief Measures ................................................................................. 43
Relief Measures by Categories ............................................................................................................... 43
Credit-Loans ....................................................................................................................................... 43
iv Canadian Energy Research Institute
September 2020
Subsidies ............................................................................................................................................. 45
Tax Deferrals ...................................................................................................................................... 46
Grants ................................................................................................................................................. 48
Appendix B: Input/output Results .............................................................................................................. 53
Credit Loans ............................................................................................................................................ 53
Canada Emergency Business Account (CEBA) .................................................................................... 53
Regional Relief and Recovery Fund (RRRF) ........................................................................................ 57
Business Credit Availability Program (BCAP) ...................................................................................... 61
Subsidies ................................................................................................................................................. 65
Canada Emergency Wage Subsidy (CEWS) ......................................................................................... 65
Canada Emergency Commercial Rent Assistance (CECRA) ................................................................ 69
Temporary Wage Subsidy for Employers (TWS) ................................................................................ 73
Tax Deferrals ........................................................................................................................................... 77
Deferral of Sales Tax Remittance and Customs Duty ......................................................................... 77
Income Tax (Federal, provincial, and other related provincial taxes) ................................................ 81
Grants ..................................................................................................................................................... 85
Orphan and Inactive Oil and Gas Wells Grant .................................................................................... 85
September 2020
Economic Recovery Pathways for Canada’s Energy Industry: Part 2 – Canadian Crude Oil and Natural Gas v
List of Figures Figure 1.1: Oil and Gas Sector Employment by Province (Number of Jobs) ................................................. 2
Figure 1.2: Oil and Gas GDP Contribution by Subsector (Million CAD$)....................................................... 3
Figure 2.1: Input-Output Framework ............................................................................................................ 6
Figure 2.2: FTE Job Multipliers by Province and Sector ................................................................................ 7
Figure 2.3: GDP Multipliers by Province and Sector ..................................................................................... 8
Figure 2.4: 2020-2025 Canadian Oil and Gas Production Forecast ............................................................ 14
Figure 2.5: Oil and Gas Price Forecasts ....................................................................................................... 15
Figure 3.1: GDP Impacts of Stimulus Packages ........................................................................................... 19
Figure 3.2: Employment Impacts of Stimulus Packages ............................................................................. 20
Figure 3.3: Net Tax Impacts of Stimulus Packages ...................................................................................... 21
Figure 3.4: Labor Income Impacts of Stimulus Packages ............................................................................ 22
Figure 3.5: Annual GDP Impacts of Crude Oil Production, 2020-2025 ....................................................... 23
Figure 3.6: Annual Net Tax Impacts of Crude Oil Production, 2020-2025 .................................................. 24
Figure 3.7: Labour income (A) and the Employment (B) Impacts of Crude Oil Production, 2020-2025 ........................................................................................ 25
Figure 3.8: Annual GDP Impacts of Natural Gas Production, 2020-2025 ................................................... 26
Figure 3.9: Annual Net Tax Impacts of Natural Gas Production, 2020-2025 .............................................. 27
Figure 3.10: Labour income (A) and the Employment (B) Impacts of Natural Gas Production, 2020-2025 .................................................................................... 28
Figure 3.11: Annual GDP Impacts of Oil Sands Production, 2020-2025 ..................................................... 29
Figure 3.12: Annual Net Tax Impacts of Oil Sands Production, 2020-2025 ................................................ 30
Figure 3.13: Annual Labour Income Impacts of Oil Sands Production, 2020-2025 .................................... 31
Figure 3.13: Annual Employment Impacts of Oil Sands Production, 2020-2025 ........................................ 32
Figure 4.1: SWOT Analysis........................................................................................................................... 36

vi Canadian Energy Research Institute
September 2020
September 2020
Economic Recovery Pathways for Canada’s Energy Industry: Part 2 – Canadian Crude Oil and Natural Gas vii
List of Tables Table E.1: Annualized Economic Impact Gap for the E&P Sector .............................................................. xii
Table 1.1: Oil and Gas Sector’s Employment Changes (Month over Month) ............................................... 2
Table 1.2: Oil and Gas Sector’s GDP Changes (Month over Month) ............................................................. 3
Table 2.1: Stimulus Programs and Funds for all Sectors ............................................................................... 9
Table 2.2: Stimulus Programs and Fund Allocation for O&G Sector in BC, AB, SK, NL ............................... 11
Table 2.3: Field Decommissioning Programs in Western Canada .............................................................. 12
Table 3.1: Summary Table........................................................................................................................... 18
Table 4.1: Annualized Economic Impact Gap for the E&P Sector ............................................................... 33
Table 4.2: Employment Comparison Between 2020 and Last Five Years Average for O&G Services ........ 34
Table B.1: Impacts of the Canada Emergency Business Account (CEBA) in British Columbia .................... 53
Table B.2: Impacts of the Canada Emergency Business Account (CEBA) in Alberta ................................... 54
Table B.3: Impacts of the Canada Emergency Business Account (CEBA) in Saskatchewan ........................ 55
Table B.4: Impacts of the Canada Emergency Business Account (CEBA) in Newfoundland and Labrador 56
Table B.5: Impacts of the Regional Relief and Recovery Fund (RRRF) in British Columbia ........................ 57
Table B.6: Impacts of the Regional Relief and Recovery Fund (RRRF) in Alberta ....................................... 58
Table B.7: Impacts of the Regional Relief and Recovery Fund (RRRF) in Saskatchewan ............................ 59
Table B.8: Impacts of the Regional Relief and Recovery Fund (RRRF) in Newfoundland and Labrador ..... 60
Table B.9: Impacts of the Business Credit Availability Program (BCAP) in British Columbia ...................... 61
Table B.10: Impacts of the Business Credit Availability Program (BCAP) in Alberta .................................. 62
Table B.11: Impacts of the Business Credit Availability Program (BCAP) in Saskatchewan ....................... 63
Table B.12: Impacts of the Business Credit Availability Program (BCAP) in Newfoundland and Labrador 64
Table B.13: Impacts of the Canada Emergency Wage Subsidy (CEWS) in British Columbia ....................... 65
Table B.14: Impacts of the Canada Emergency Wage Subsidy (CEWS) in Alberta ..................................... 66
Table B.15: Impacts of the Canada Emergency Wage Subsidy (CEWS) in Saskatchewan .......................... 67
Table B.16: Impacts of the Canada Emergency Wage Subsidy (CEWS) in Newfoundland and Labrador ... 68
Table B.17: Impacts of the Canada Emergency Commercial Rent Assistance (CECRA) in British Columbia .................................................................................................................................................................... 69
Table B.18: Impacts of the Canada Emergency Commercial Rent Assistance (CECRA) in Alberta ............. 70
Table B.19: Impacts of the Canada Emergency Commercial Rent Assistance (CECRA) in Saskatchewan .. 71
Table B.20: Impacts of the Canada Emergency Commercial Rent Assistance (CECRA) in NL ..................... 72
viii Canadian Energy Research Institute
September 2020
Table B.21: Impacts of the Temporary Wage Subsidy for Employers (TWS) in British Columbia .............. 73
Table B.22: Impacts of the Temporary Wage Subsidy for Employers (TWS) in Alberta ............................. 74
Table B.23: Impacts of the Temporary Wage Subsidy for Employers (TWS) in Saskatchewan .................. 75
Table B.24: Impacts of the Temporary Wage Subsidy for Employers (TWS) in NL ..................................... 76
Table B.25: Impacts of the Deferral of Sales Tax Remittance and Customs Duty in British Columbia ....... 77
Table B.26: Impacts of the Deferral of Sales Tax Remittance and Customs Duty in Alberta ...................... 78
Table B.27: Impacts of the Deferral of Sales Tax Remittance and Customs Duty in Saskatchewan ........... 79
Table B.28: Impacts of the Deferral of Sales Tax Remittance and Customs Duty in NL ............................. 80
Table B.29: Impacts of the Federal, provincial, and other related provincial taxes in British Columbia .... 81
Table B.30: Impacts of the Federal, provincial, and other related provincial taxes in Alberta .................. 82
Table B.31: Impacts of the Federal, provincial, and other related provincial taxes in Saskatchewan ....... 83
Table B.32: Impacts of the Federal, provincial, and other related provincial taxes in NL .......................... 84
Table B.33: Impacts of the Orphan and Inactive Oil and Gas Wells Grant in British Columbia .................. 85
Table B.34: Impacts of the Orphan and Inactive Oil and Gas Wells Grant in Alberta ................................ 86
Table B.35: Impacts of the Orphan and Inactive Oil and Gas Wells Grant in Saskatchewan ..................... 87
September 2020
Economic Recovery Pathways for Canada’s Energy Industry: Part 2 – Canadian Crude Oil and Natural Gas ix
Acronyms and Abbreviations AB Alberta
ACOA Atlantic Canada Opportunities Agency
AECO Alberta Energy Company
AT1 Additional Tier 1
BC British Columbia
BCAP Business Credit Availability Program
BDC Business Development Bank of Canada
CAD Canadian Dollars
CanNor Canadian Northern Economic Development Agency
CBC Canadian Broadcasting Corporation
CBSA Canada Board Services Agency
CEBA Canada Emergency Business Account
CECRA Canada Emergency Commercial Rent Assistance
CEDQ Canada Economic Development for Quebec Regions
CERI Canadian Energy Research Institute
CEWS Canada Emergency Wage Subsidy
COVID-19 Corona Virus Disease 2019
CPA Chartered Professional Accountant
CRA Canada Revenue Agency
DWF Decommissioning Work Funding
EDC Export Development Canada
ERF Emissions Reduction Fund
E&P Exploration and Production
FedDev Federal Economic Development Agency for Southern Ontario
FedNor Federal Economic Development Initiative in Northern Ontario
FTE Full-Time Equivalent
GDP Gross Domestic Product
IEA International Energy Agency
x Canadian Energy Research Institute
September 2020
I-O Input-Output
kbpd Thousand barrels per day
KXL Keystone Export Limited
LEEFF Large Employer Emergency Financing Facility
LMI Labour Market Information
LNG Liquified Natural Gas
MMbpd Million barrels per day
MMcf/d Million cubic feet per day
MRIO Multi-regional Input-Output
NEB National Energy Board
NL Newfoundland and Labrador
O&G Oil and Gas
OWA Orphan Well Association
PBO Parliamentary Budget Officer
Petro LMI Petroleum Labour Market Information
PLCAC Pipeline Contractors Association of Canada
PNG Petroleum and Natural Gas
PPE Personal Protective Equipment
PSAC Petroleum Services Association of Canada
Q1 First Quarter
Q2 Second Quarter
RRRF Regional Relief Recovery Fund
SK Saskatchewan
SWOT Strengths, Weaknesses, Opportunities and Threats
TWS Temporary Wage Subsidy
USD United States Dollar
WCB Workers' Compensation Board
WD Western Economic Diversification Canada
September 2020
Economic Recovery Pathways for Canada’s Energy Industry: Part 2 – Canadian Crude Oil and Natural Gas xi
Executive Summary Part 1 of the four part series, Economic Recovery Pathways for Canada’s Energy Industry, provided an overview of COVID-19 impacts on the energy sector. In Part 2, the Canadian Energy Research Institute (CERI) will review some of the central government assistance programs and assess how they can aid in the recovery of the oil and gas sector in Canada.
CERI’s Canadian Multi-regional Input-Output (MRIO) model was used to analyze the economic impacts of various relief measures for the sector as well as the economic impacts of oil and gas revenues generated from their operations. The economic impacts are determined in terms of major macroeconomic indicators such as impacts on GDP, employment, tax revenues and labour income. This report focuses on major oil and gas producing provinces. It is important to note that the economic impacts in this report are not limited to the producing provinces. The results include direct and indirect impacts on all Canadian provinces and territories (i.e. producing and non-producing).
The economic impacts of government relief measures are evaluated over the three years of 2020-2022. The results of the total economic impacts are as follows:
• The GDP impact of the stimulus packages over the period (Direct + Indirect) is CAD$7,936 million. • The total number of FTE jobs (Direct + Indirect) is 42,495 across Canada, with the most significant
impact to be felt in provinces where oil and gas is extracted. • The overall net tax impact is CAD$78 million. • The average annual income per person for the job created or preserved is CAD$91,600/year.
We show that relief measures could aid in the recovery of the oil and gas sector in the short term1. Still, it is not a panacea for the sector as there are broader market challenges.
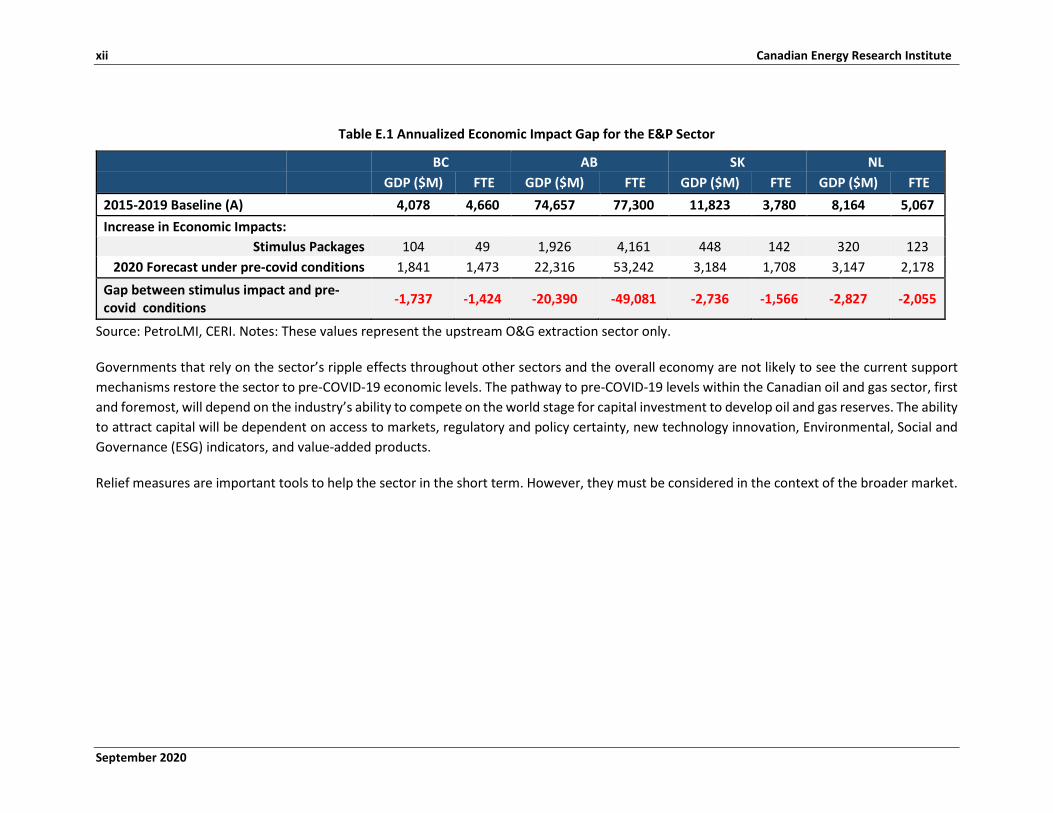
An illustrative example shown in Table E.1 highlights 2020 GDP and Employment direct impacts from both stimulus packages plus revenues and compares them to the historical 2015-2019 baseline for the upstream oil and gas sector in four oil and gas producing provinces. We note that the assessment of the stimulus packages creates some increase in job creation and GDP. However, a much larger impact on jobs and GDP can be forecasted if oil and gas markets were to return to pre-covid conditions. This means there is a gap between the economic activity supported by stimulus programs and revenues from the upstream oil and gas sector and the historical baseline, at least for the year 2020.
1 Two programs that CERI did not evaluate due to the nature of the programs are Large Employer Emergency Financing Facility (LEEFF) and the Emission Reduction Fund (ERF).
xii Canadian Energy Research Institute
September 2020
Table E.1 Annualized Economic Impact Gap for the E&P Sector
BC AB SK NL GDP ($M) FTE GDP ($M) FTE GDP ($M) FTE GDP ($M) FTE
2015-2019 Baseline (A) 4,078 4,660 74,657 77,300 11,823 3,780 8,164 5,067 Increase in Economic Impacts:
Stimulus Packages 104 49 1,926 4,161 448 142 320 123 2020 Forecast under pre-covid conditions 1,841 1,473 22,316 53,242 3,184 1,708 3,147 2,178
Gap between stimulus impact and pre-covid conditions -1,737 -1,424 -20,390 -49,081 -2,736 -1,566 -2,827 -2,055
Source: PetroLMI, CERI. Notes: These values represent the upstream O&G extraction sector only.
Governments that rely on the sector’s ripple effects throughout other sectors and the overall economy are not likely to see the current support mechanisms restore the sector to pre-COVID-19 economic levels. The pathway to pre-COVID-19 levels within the Canadian oil and gas sector, first and foremost, will depend on the industry’s ability to compete on the world stage for capital investment to develop oil and gas reserves. The ability to attract capital will be dependent on access to markets, regulatory and policy certainty, new technology innovation, Environmental, Social and Governance (ESG) indicators, and value-added products.
Relief measures are important tools to help the sector in the short term. However, they must be considered in the context of the broader market.
September 2020
Economic Recovery Pathways for Canada’s Energy Industry: Part 2 – Canadian Crude Oil and Natural Gas 1
Chapter 1: Introduction and Background Introduction The COVID-19 pandemic has adversely impacted Canada's oil and natural gas industry (O&G), in addition to already limited egress for exports, volatile crude oil prices, and increased competition even before the pandemic. By all internationally accepted analyses, fossil fuels will continue to be in demand for the foreseeable future.
Part 1 of this four-part series, Economic Recovery Pathways of Canada’s Energy Industry, introduced many of the COVID-19 impacts on the oil and gas sector. In Part 2), the Canadian Energy Research Institute (CERI) will review central government assistance programs and assess how they can aid in the recovery of the oil and gas sector in Canada. Government aid programs have been organized into four major categories: credit loans, subsidies, tax deferrals, and grants. The analysis includes an assessment of the economic impacts of oil and gas revenues generated from the sector’s operations.
Background - Summary Statistics Prior to the COVID-19 pandemic, market access, regulatory uncertainty, and the actions of OPEC+ were already having a negative impact on employment rates and performance within the O&G sector.
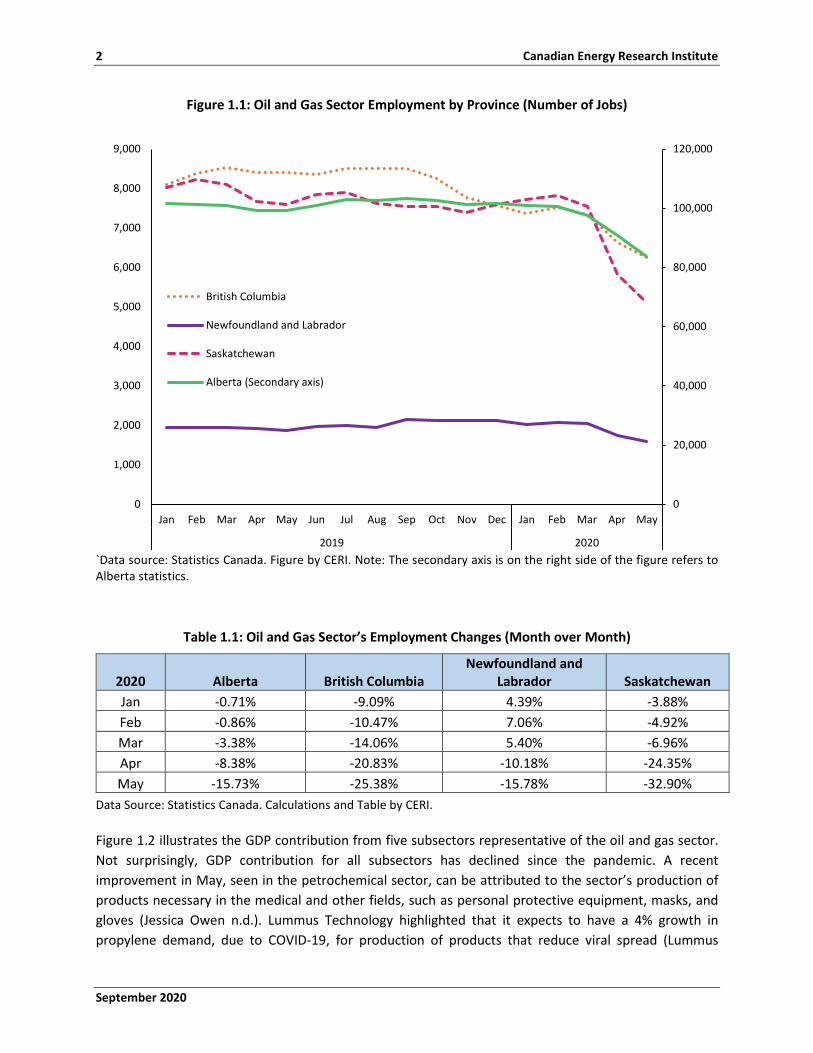
Figure 1.1 shows monthly provincial employment rates within the oil and gas sector from January 2019 to May 2020 (the most recent monthly data available at the time of writing). Alberta saw the highest decline in number of jobs with a loss of almost 14,000 jobs from March to May 2020. Since the pandemic, and the ensuing country-wide lock-down introduced in March, unemployment rates have increased in all oil and gas producing provinces. It is uncertain how long it will be before the sector returns to pre-pandemic employment levels (Statistics Canada 2020a). The steepest rate of decline in employment was observed in Saskatchewan, with a -17.39% drop in employment from March to May 2020, followed by British Columbia and Alberta. (see Table 1.1 for provincial percentage change in employment).
2 Canadian Energy Research Institute
September 2020
Figure 1.1: Oil and Gas Sector Employment by Province (Number of Jobs)
`Data source: Statistics Canada. Figure by CERI. Note: The secondary axis is on the right side of the figure refers to Alberta statistics.
Table 1.1: Oil and Gas Sector’s Employment Changes (Month over Month)
2020 Alberta British Columbia Newfoundland and
Labrador Saskatchewan Jan -0.71% -9.09% 4.39% -3.88% Feb -0.86% -10.47% 7.06% -4.92% Mar -3.38% -14.06% 5.40% -6.96% Apr -8.38% -20.83% -10.18% -24.35% May -15.73% -25.38% -15.78% -32.90%
Data Source: Statistics Canada. Calculations and Table by CERI.
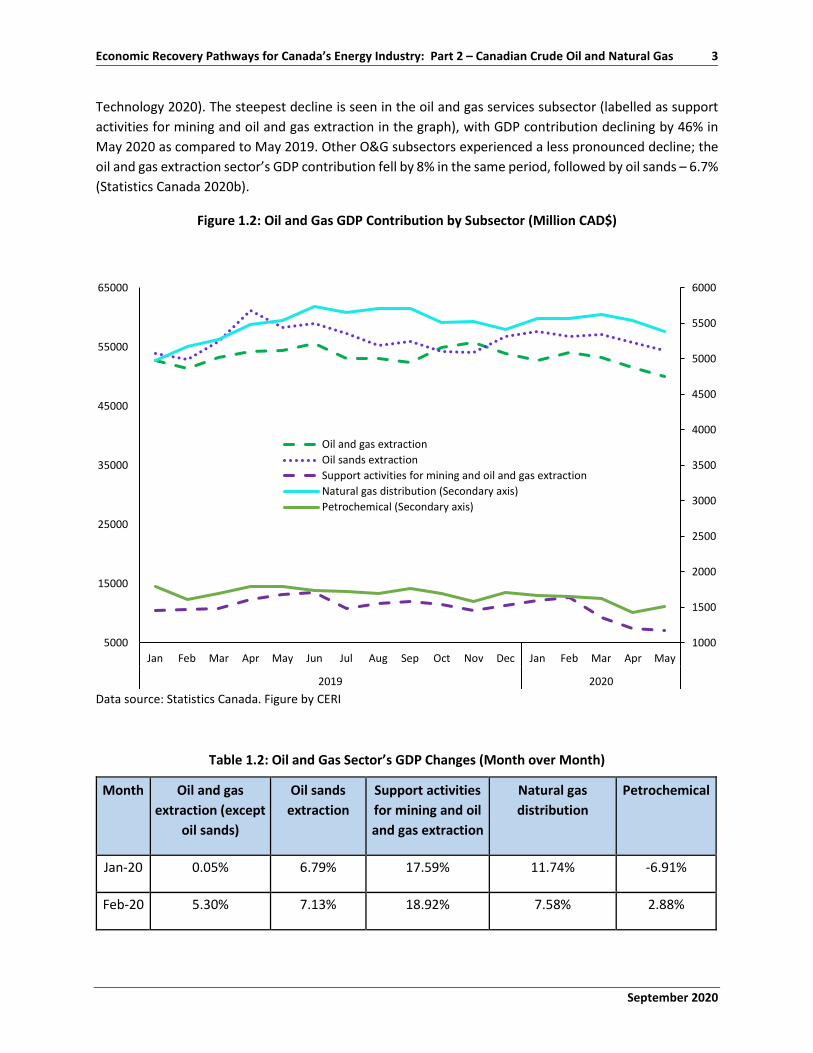
Figure 1.2 illustrates the GDP contribution from five subsectors representative of the oil and gas sector. Not surprisingly, GDP contribution for all subsectors has declined since the pandemic. A recent improvement in May, seen in the petrochemical sector, can be attributed to the sector’s production of products necessary in the medical and other fields, such as personal protective equipment, masks, and gloves (Jessica Owen n.d.). Lummus Technology highlighted that it expects to have a 4% growth in propylene demand, due to COVID-19, for production of products that reduce viral spread (Lummus
0
20,000
40,000
60,000
80,000
100,000
120,000
0
1,000
2,000
3,000
4,000
5,000
6,000
7,000
8,000
9,000
Jan Feb Mar Apr May Jun Jul Aug Sep Oct Nov Dec Jan Feb Mar Apr May
2019 2020
British Columbia
Newfoundland and Labrador
Saskatchewan
Alberta (Secondary axis)
September 2020
Economic Recovery Pathways for Canada’s Energy Industry: Part 2 – Canadian Crude Oil and Natural Gas 3
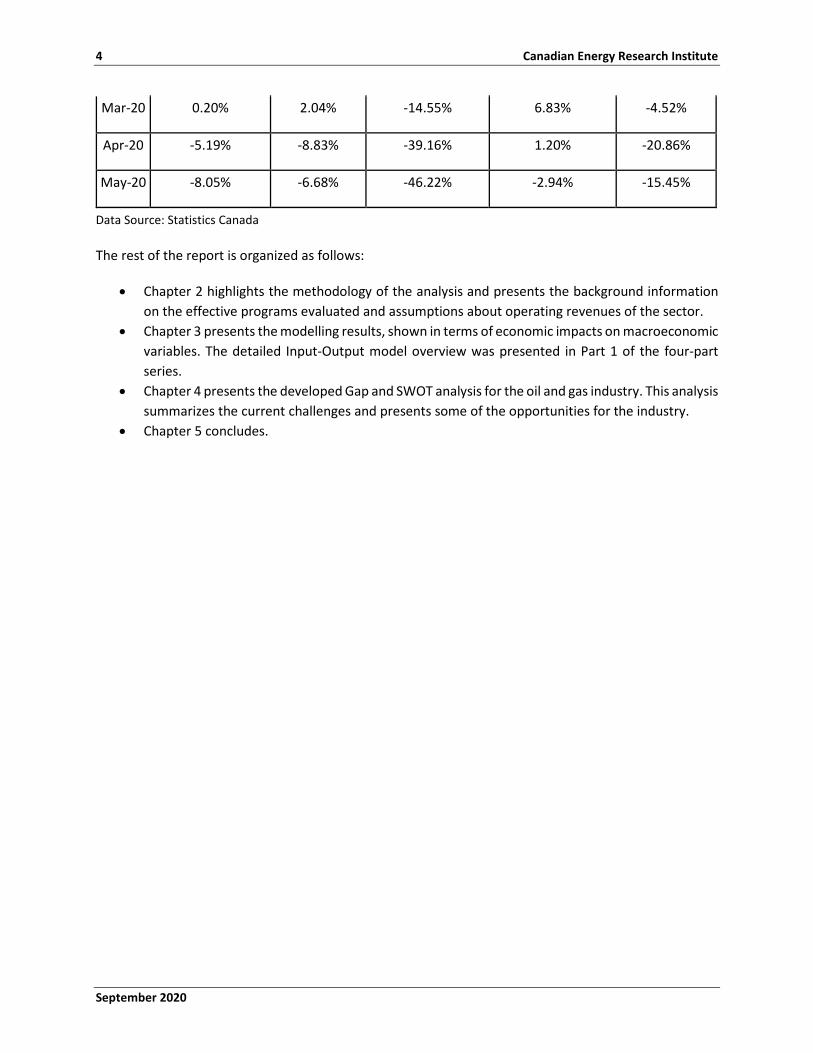
Technology 2020). The steepest decline is seen in the oil and gas services subsector (labelled as support activities for mining and oil and gas extraction in the graph), with GDP contribution declining by 46% in May 2020 as compared to May 2019. Other O&G subsectors experienced a less pronounced decline; the oil and gas extraction sector’s GDP contribution fell by 8% in the same period, followed by oil sands – 6.7% (Statistics Canada 2020b).
Figure 1.2: Oil and Gas GDP Contribution by Subsector (Million CAD$)
Data source: Statistics Canada. Figure by CERI
Table 1.2: Oil and Gas Sector’s GDP Changes (Month over Month)
Month Oil and gas extraction (except
oil sands)
Oil sands extraction
Support activities for mining and oil and gas extraction
Natural gas distribution
Petrochemical
Jan-20 0.05% 6.79% 17.59% 11.74% -6.91%
Feb-20 5.30% 7.13% 18.92% 7.58% 2.88%
1000
1500
2000
2500
3000
3500
4000
4500
5000
5500
6000
5000
15000
25000
35000
45000
55000
65000
Jan Feb Mar Apr May Jun Jul Aug Sep Oct Nov Dec Jan Feb Mar Apr May
2019 2020
Oil and gas extractionOil sands extractionSupport activities for mining and oil and gas extractionNatural gas distribution (Secondary axis)Petrochemical (Secondary axis)
4 Canadian Energy Research Institute
September 2020
Mar-20 0.20% 2.04% -14.55% 6.83% -4.52%
Apr-20 -5.19% -8.83% -39.16% 1.20% -20.86%
May-20 -8.05% -6.68% -46.22% -2.94% -15.45%
Data Source: Statistics Canada
The rest of the report is organized as follows:
• Chapter 2 highlights the methodology of the analysis and presents the background information on the effective programs evaluated and assumptions about operating revenues of the sector.
• Chapter 3 presents the modelling results, shown in terms of economic impacts on macroeconomic variables. The detailed Input-Output model overview was presented in Part 1 of the four-part series.
• Chapter 4 presents the developed Gap and SWOT analysis for the oil and gas industry. This analysis summarizes the current challenges and presents some of the opportunities for the industry.
• Chapter 5 concludes.
September 2020
Economic Recovery Pathways for Canada’s Energy Industry: Part 2 – Canadian Crude Oil and Natural Gas 5
Chapter 2: Modelling Methodology and Assumptions
The CERI Canadian Multi-regional Input-Output (MRIO) model was used to analyze the economic impacts of various government relief measures as well as impacts resulting from revenue generated by daily operations in the upstream oil and gas sector. The model is based on the most recent Statistics Canada 2016 Supply and Use tables data. The economic impacts are determined in terms of major macroeconomic indicators such as impacts on GDP, employment, net tax revenues and labour income.
A detailed description and the mathematical framework of the model were presented in Part 1 of this four-part series. A detailed description of various stimulus and relief packages from the federal and provincial governments is available in Appendix A.
Modelling Methodology and Assumptions Economic Model Input-Output (I/O) models are used to estimate the impact that discrete changes in the economic activities within an economic sector or industry could have across the whole economy, given the interdependence that exists among industries. Notably, the use of outputs from one industry as inputs into another industry’s production process. I/O models provide estimates on the impact of various economic variables due to the introduction of a set of expenditures or ‘shocks.’ However, as mentioned by Poole (2005), the I/O model "shocks" are only capable of reproducing the average structure of the economy and not the marginal effects due to the linearity of the model and absence of feed-back effects (Poole 2005).
The estimates in this report are primarily used over short-term time horizons. Given that the most recent Supply and Use tables (Statistics Canada 2018), which are required to build the model, contain 2016 data, the economic impacts are based on the relationships prevailing in that year. Any structural changes that have happened since the collection of the data have been left out of the model, and the results could be either over- or under-estimated.
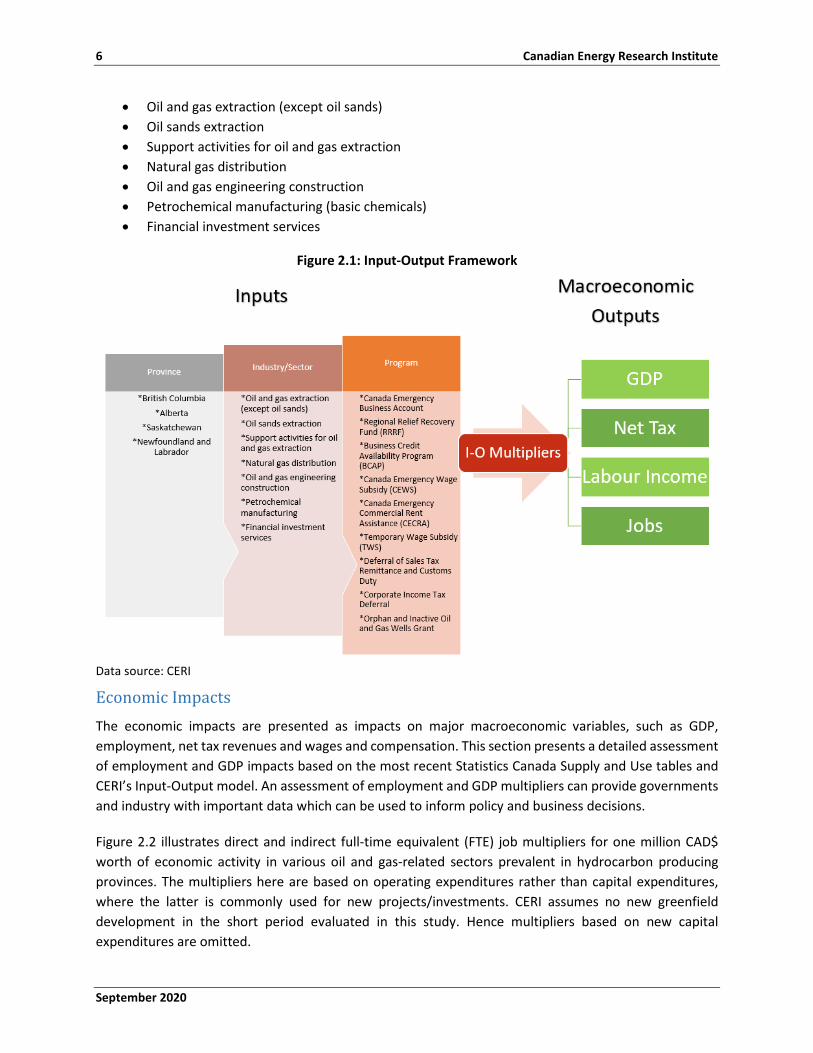
As shown in Figure 2.1, the analysis investigated the macroeconomic impacts of different stimulus programs or “shocks” on the following economic sectors in major oil and gas producing provinces of British Columbia (BC), Alberta (AB), Saskatchewan (SK), and Newfoundland and Labrador (NL):
• CERI’s MRIO model is used to analyse economic impacts. • The economic impacts are determined in terms of major macroeconomic indicators such as
impacts on GDP, employment, tax revenues and labour income. • CERI has identified 9 federal programs relevant to the oil and gas sector in addition to
provincial tax deferrals. • CERI estimated economic impacts of daily operations of the upstream oil and gas sector
(based on estimated revenues) to compare the results to a historical baseline.
6 Canadian Energy Research Institute
September 2020
• Oil and gas extraction (except oil sands) • Oil sands extraction • Support activities for oil and gas extraction • Natural gas distribution • Oil and gas engineering construction • Petrochemical manufacturing (basic chemicals) • Financial investment services
Figure 2.1: Input-Output Framework
Data source: CERI
Economic Impacts The economic impacts are presented as impacts on major macroeconomic variables, such as GDP, employment, net tax revenues and wages and compensation. This section presents a detailed assessment of employment and GDP impacts based on the most recent Statistics Canada Supply and Use tables and CERI’s Input-Output model. An assessment of employment and GDP multipliers can provide governments and industry with important data which can be used to inform policy and business decisions.
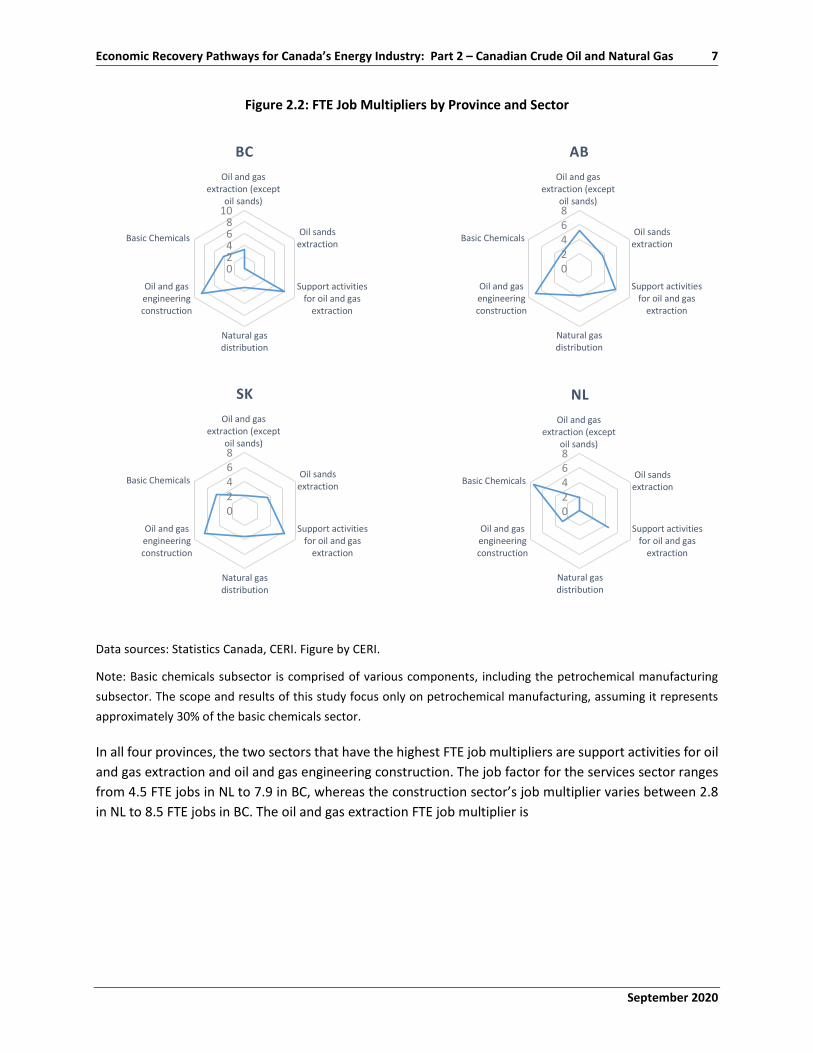
Figure 2.2 illustrates direct and indirect full-time equivalent (FTE) job multipliers for one million CAD$ worth of economic activity in various oil and gas-related sectors prevalent in hydrocarbon producing provinces. The multipliers here are based on operating expenditures rather than capital expenditures, where the latter is commonly used for new projects/investments. CERI assumes no new greenfield development in the short period evaluated in this study. Hence multipliers based on new capital expenditures are omitted.
September 2020
Economic Recovery Pathways for Canada’s Energy Industry: Part 2 – Canadian Crude Oil and Natural Gas 7
Figure 2.2: FTE Job Multipliers by Province and Sector
Data sources: Statistics Canada, CERI. Figure by CERI.
Note: Basic chemicals subsector is comprised of various components, including the petrochemical manufacturing subsector. The scope and results of this study focus only on petrochemical manufacturing, assuming it represents approximately 30% of the basic chemicals sector.
In all four provinces, the two sectors that have the highest FTE job multipliers are support activities for oil and gas extraction and oil and gas engineering construction. The job factor for the services sector ranges from 4.5 FTE jobs in NL to 7.9 in BC, whereas the construction sector’s job multiplier varies between 2.8 in NL to 8.5 FTE jobs in BC. The oil and gas extraction FTE job multiplier is
02468
10
Oil and gasextraction (except
oil sands)
Oil sandsextraction
Support activitiesfor oil and gas
extraction
Natural gasdistribution
Oil and gasengineeringconstruction
Basic Chemicals
BC
02468
Oil and gasextraction (except
oil sands)
Oil sandsextraction
Support activitiesfor oil and gas
extraction
Natural gasdistribution
Oil and gasengineeringconstruction
Basic Chemicals
AB
02468
Oil and gasextraction (except
oil sands)
Oil sandsextraction
Support activitiesfor oil and gas
extraction
Natural gasdistribution
Oil and gasengineeringconstruction
Basic Chemicals
SK
02468
Oil and gasextraction (except
oil sands)
Oil sandsextraction
Support activitiesfor oil and gas
extraction
Natural gasdistribution
Oil and gasengineeringconstruction
Basic Chemicals
NL
8 Canadian Energy Research Institute
September 2020
the highest in Alberta (5.2 for conventional oil and gas and 3.6 for oil sands), which is not surprising, given that Alberta produces the largest share of Canadian oil and gas. The Figure highlights which oil and gas subsectors can benefit the most from stimulus packages in terms of job creation.
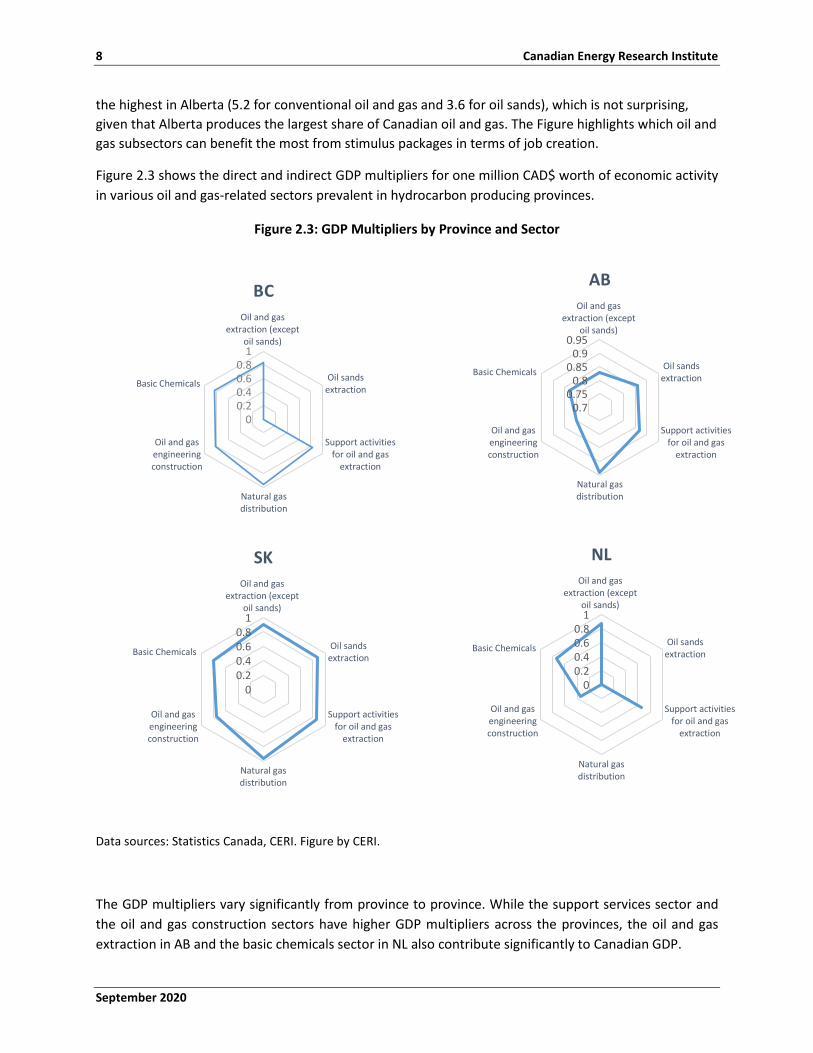
Figure 2.3 shows the direct and indirect GDP multipliers for one million CAD$ worth of economic activity in various oil and gas-related sectors prevalent in hydrocarbon producing provinces.
Figure 2.3: GDP Multipliers by Province and Sector
Data sources: Statistics Canada, CERI. Figure by CERI.
The GDP multipliers vary significantly from province to province. While the support services sector and the oil and gas construction sectors have higher GDP multipliers across the provinces, the oil and gas extraction in AB and the basic chemicals sector in NL also contribute significantly to Canadian GDP.
00.20.40.60.8
1
Oil and gasextraction (except
oil sands)
Oil sandsextraction
Support activitiesfor oil and gas
extraction
Natural gasdistribution
Oil and gasengineeringconstruction
Basic Chemicals
NL
00.20.40.60.8
1
Oil and gasextraction (except
oil sands)
Oil sandsextraction
Support activitiesfor oil and gas
extraction
Natural gasdistribution
Oil and gasengineeringconstruction
Basic Chemicals
BC
0.70.75
0.80.85
0.90.95
Oil and gasextraction (except
oil sands)
Oil sandsextraction
Support activitiesfor oil and gas
extraction
Natural gasdistribution
Oil and gasengineeringconstruction
Basic Chemicals
AB
00.20.40.60.8
1
Oil and gasextraction (except
oil sands)
Oil sandsextraction
Support activitiesfor oil and gas
extraction
Natural gasdistribution
Oil and gasengineeringconstruction
Basic Chemicals
SK
September 2020
Economic Recovery Pathways for Canada’s Energy Industry: Part 2 – Canadian Crude Oil and Natural Gas 9
Federal Programs Considering the nature of the pandemic, identifying related data and information for stimulus packages was challenging. Some programs are still in the development process, such as the Emissions Reduction Fund (ERF). At this point, it was challenging to identify which companies may qualify for the program. It is not clear if this will be for research and development or for programs that may create more jobs. At the time of writing this report, the ERF program was going through a public survey process to determine the best implementation for the program. (Government of Canada 2020a).
CERI identified that the industry might consider the Large Employer Emergency Financing Facility program (LEEFF) as a last resort after considering the traditional capital markets (Varcoe 2020; Quan 2020). From an industry point of view, this loan is not attractive compared to the Business Credit Availability Program (BCAP) program. The main reason is the higher interest rate, which starts at 8% and increases by 2% each year. Also, recipient companies would be required to publish annual climate-related disclosure reports consistent with the Financial Stability Board’s Task Force on Climate-related Financial Disclosures, including how their future operations will support environmental sustainability and national climate goals.
Opposite to BCAP, there is no loan guarantee for the LEEFF program (Government of Canada 2020b). The nature of the LEEFF program is more characteristic of a commercial program rather than stimulus aid that might encourage companies to create more jobs in the sector. At the time of writing the report, CERI did not observe significant interest from the industry for this program. Hence, this report did not consider the LEEFF program.
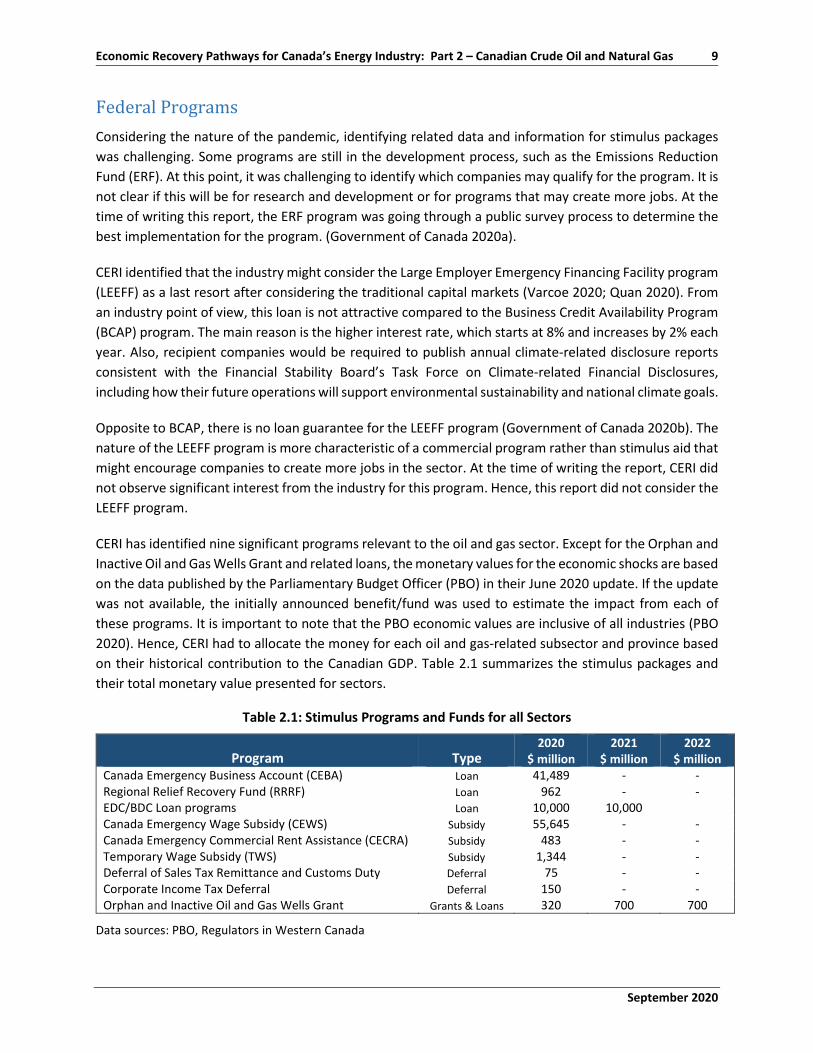
CERI has identified nine significant programs relevant to the oil and gas sector. Except for the Orphan and Inactive Oil and Gas Wells Grant and related loans, the monetary values for the economic shocks are based on the data published by the Parliamentary Budget Officer (PBO) in their June 2020 update. If the update was not available, the initially announced benefit/fund was used to estimate the impact from each of these programs. It is important to note that the PBO economic values are inclusive of all industries (PBO 2020). Hence, CERI had to allocate the money for each oil and gas-related subsector and province based on their historical contribution to the Canadian GDP. Table 2.1 summarizes the stimulus packages and their total monetary value presented for sectors.
Table 2.1: Stimulus Programs and Funds for all Sectors
Program Type 2020
$ million 2021
$ million 2022
$ million Canada Emergency Business Account (CEBA) Loan 41,489 - - Regional Relief Recovery Fund (RRRF) Loan 962 - - EDC/BDC Loan programs Loan 10,000 10,000 Canada Emergency Wage Subsidy (CEWS) Subsidy 55,645 - - Canada Emergency Commercial Rent Assistance (CECRA) Subsidy 483 - - Temporary Wage Subsidy (TWS) Subsidy 1,344 - - Deferral of Sales Tax Remittance and Customs Duty Deferral 75 - - Corporate Income Tax Deferral Deferral 150 - - Orphan and Inactive Oil and Gas Wells Grant Grants & Loans 320 700 700
Data sources: PBO, Regulators in Western Canada
10 Canadian Energy Research Institute
September 2020
We considered three loan and credit programs: Canada Emergency Business Account (CEBA), Regional Relief Recovery Fund (RRRF), and the Business Credit Availability Program (BCAP) provided by the Business Development Bank of Canada (BDC) and Export Development Canada (EDC).
The subsidy programs for the analysis include the Canada Emergency Wage Subsidy (CEWS), the Canada Emergency Commercial Rent Assistance (CECRA), and the Temporary Wage Subsidy (TWS).
Two payment deferral programs include the Federal Income Tax Deferral and the Deferral of Sales Tax Remittance and Customs Duty Payments, which was in effect until June 2020. The industry-wide economic benefit is the direct 2020 estimated cost from PBO for these programs. For corporate income tax, the PBO value includes both personal and corporate income tax amounts. Using the latest published data (Department of Finance Canada 2018), CERI estimated that 25% of total tax applies to corporate taxes, with the other 75% being personal income tax.
For the CEBA program, CERI assumes a 1% payment default rate, a 25% loan forgiveness (a grace period of December 31st, 2022, as announced), and a 3.5% interest income to the government of the total amount to calculate the amount of funds released in 2020 to the economy through the program. The current CERI estimate is CAD$41,489 million.
The RRRF is announced as CAD$962 million total available through regional development agencies and Community Futures Network. Considering the application deadline date and the urgent need for financial relief, CERI assumes all CAD$962 million to be used in 2020.
The BCAP program has a maximum of CAD$20 billion. While some of these funds may not be released, CERI adopts PBO's assumption that all the funds will be issued by the years 2020 and 2021.
The Orphan and Inactive Oil and Gas Wells Grant shown in Table 2.1 is the only package available solely to the oil and gas sector.
Based on the PBO estimates, Table 2.2 shows CERI’s estimates of the allocation of funds to the oil and gas industry. Information for field decommissioning and reclamation programs and related assumptions were taken from various sources (PBO 2020; Government of Saskatchewan 2020b; Bennett Jones 2020; Government of British Columbia 2020a; BC Oil and Gas Commission 2019; Ministry of Energy, Mines and Petroleum 2020; Government of Alberta 2020b; Government of Saskatchewan 2018, 2017–18; Government of Alberta 2020e; PSAC 2019; AltaCorp Capital 2020; CRA 2020).
September 2020
Economic Recovery Pathways for Canada’s Energy Industry: Part 2 – Canadian Crude Oil and Natural Gas 11
Table 2.2: Stimulus Programs and Fund Allocation for O&G Sector in BC, AB, SK, NL
Program Type 20201
$ million 20211
$ million 20221
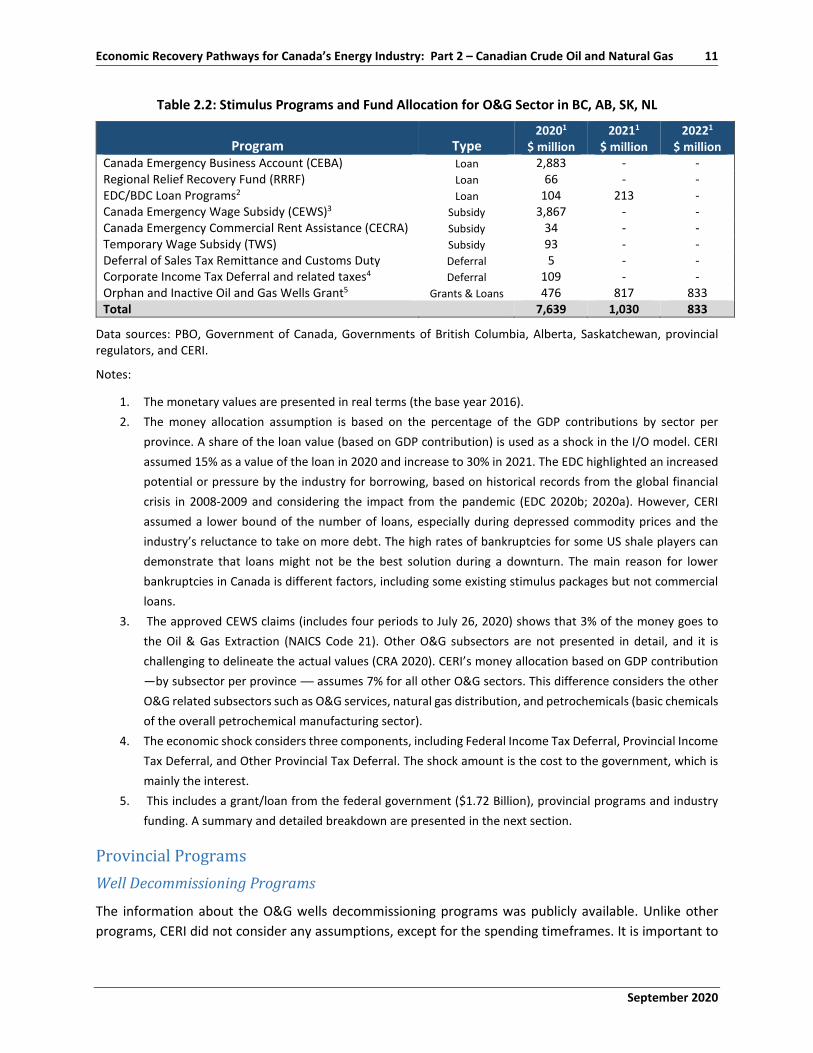
$ million Canada Emergency Business Account (CEBA) Loan 2,883 - - Regional Relief Recovery Fund (RRRF) Loan 66 - - EDC/BDC Loan Programs2 Loan 104 213 - Canada Emergency Wage Subsidy (CEWS)3 Subsidy 3,867 - - Canada Emergency Commercial Rent Assistance (CECRA) Subsidy 34 - - Temporary Wage Subsidy (TWS) Subsidy 93 - - Deferral of Sales Tax Remittance and Customs Duty Deferral 5 - - Corporate Income Tax Deferral and related taxes4 Deferral 109 - - Orphan and Inactive Oil and Gas Wells Grant5 Grants & Loans 476 817 833 Total 7,639 1,030 833
Data sources: PBO, Government of Canada, Governments of British Columbia, Alberta, Saskatchewan, provincial regulators, and CERI.
Notes:
1. The monetary values are presented in real terms (the base year 2016). 2. The money allocation assumption is based on the percentage of the GDP contributions by sector per
province. A share of the loan value (based on GDP contribution) is used as a shock in the I/O model. CERI assumed 15% as a value of the loan in 2020 and increase to 30% in 2021. The EDC highlighted an increased potential or pressure by the industry for borrowing, based on historical records from the global financial crisis in 2008-2009 and considering the impact from the pandemic (EDC 2020b; 2020a). However, CERI assumed a lower bound of the number of loans, especially during depressed commodity prices and the industry’s reluctance to take on more debt. The high rates of bankruptcies for some US shale players can demonstrate that loans might not be the best solution during a downturn. The main reason for lower bankruptcies in Canada is different factors, including some existing stimulus packages but not commercial loans.
3. The approved CEWS claims (includes four periods to July 26, 2020) shows that 3% of the money goes to the Oil & Gas Extraction (NAICS Code 21). Other O&G subsectors are not presented in detail, and it is challenging to delineate the actual values (CRA 2020). CERI’s money allocation based on GDP contribution —by subsector per province — assumes 7% for all other O&G sectors. This difference considers the other O&G related subsectors such as O&G services, natural gas distribution, and petrochemicals (basic chemicals of the overall petrochemical manufacturing sector).
4. The economic shock considers three components, including Federal Income Tax Deferral, Provincial Income Tax Deferral, and Other Provincial Tax Deferral. The shock amount is the cost to the government, which is mainly the interest.
5. This includes a grant/loan from the federal government ($1.72 Billion), provincial programs and industry funding. A summary and detailed breakdown are presented in the next section.
Provincial Programs Well Decommissioning Programs
The information about the O&G wells decommissioning programs was publicly available. Unlike other programs, CERI did not consider any assumptions, except for the spending timeframes. It is important to
12 Canadian Energy Research Institute
September 2020
note that the projected timeframes have considered different factors, including the application processing timelines during the 2nd quarter of 2020, the average decommissioning work per year by different organizations, the nature of the decommissioning work as some work is dependant on the season such as winter access or surface reclamation works (OWA 2020; BC Oil and Gas Commission 2019; Government of Saskatchewan 2020a; Government of Alberta 2020c).
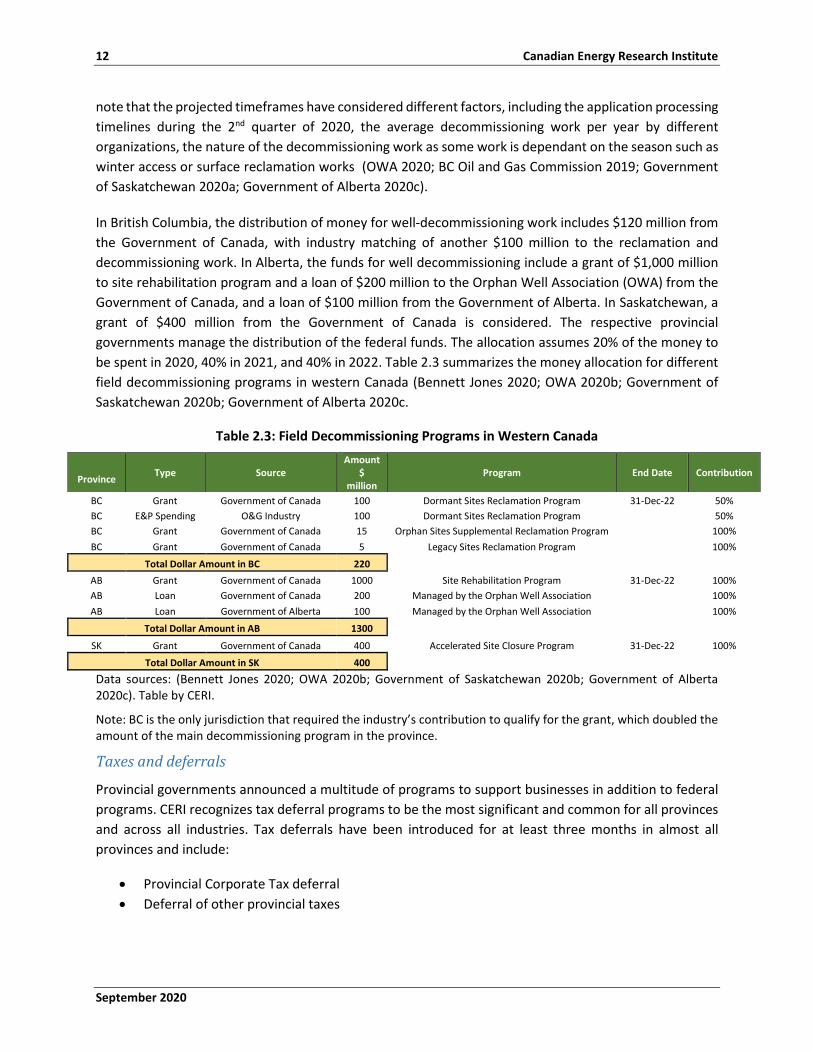
In British Columbia, the distribution of money for well-decommissioning work includes $120 million from the Government of Canada, with industry matching of another $100 million to the reclamation and decommissioning work. In Alberta, the funds for well decommissioning include a grant of $1,000 million to site rehabilitation program and a loan of $200 million to the Orphan Well Association (OWA) from the Government of Canada, and a loan of $100 million from the Government of Alberta. In Saskatchewan, a grant of $400 million from the Government of Canada is considered. The respective provincial governments manage the distribution of the federal funds. The allocation assumes 20% of the money to be spent in 2020, 40% in 2021, and 40% in 2022. Table 2.3 summarizes the money allocation for different field decommissioning programs in western Canada (Bennett Jones 2020; OWA 2020b; Government of Saskatchewan 2020b; Government of Alberta 2020c.
Table 2.3: Field Decommissioning Programs in Western Canada
Province Type Source
Amount $
million Program End Date Contribution
BC Grant Government of Canada 100 Dormant Sites Reclamation Program 31-Dec-22 50% BC E&P Spending O&G Industry 100 Dormant Sites Reclamation Program 50% BC Grant Government of Canada 15 Orphan Sites Supplemental Reclamation Program 100% BC Grant Government of Canada 5 Legacy Sites Reclamation Program 100%
Total Dollar Amount in BC 220 AB Grant Government of Canada 1000 Site Rehabilitation Program 31-Dec-22 100% AB Loan Government of Canada 200 Managed by the Orphan Well Association 100% AB Loan Government of Alberta 100 Managed by the Orphan Well Association 100%
Total Dollar Amount in AB 1300 SK Grant Government of Canada 400 Accelerated Site Closure Program 31-Dec-22 100%
Total Dollar Amount in SK 400 Data sources: (Bennett Jones 2020; OWA 2020b; Government of Saskatchewan 2020b; Government of Alberta 2020c). Table by CERI.
Note: BC is the only jurisdiction that required the industry’s contribution to qualify for the grant, which doubled the amount of the main decommissioning program in the province.
Taxes and deferrals
Provincial governments announced a multitude of programs to support businesses in addition to federal programs. CERI recognizes tax deferral programs to be the most significant and common for all provinces and across all industries. Tax deferrals have been introduced for at least three months in almost all provinces and include:
• Provincial Corporate Tax deferral • Deferral of other provincial taxes
September 2020
Economic Recovery Pathways for Canada’s Energy Industry: Part 2 – Canadian Crude Oil and Natural Gas 13
Other government payment deferrals include sales tax deferral, carbon tax deferral, workers compensation deferral, etc. More detail about the provincial programs is available in Appendix A.
To estimate the provincial level tax deferral benefits, CERI uses the federal corporate income tax deferral value estimated by the PBO and calculates the provincial tax deferral amounts based on tax rates between federal and provincial governments. Once the provincial and federal corporate income taxes are estimated, CERI uses Statistics Canada Supply Use Tables to estimate other taxes on production. CERI assumes all other taxes on production represents all deferred provincial taxes, excluding corporate income tax.
Although CERI focuses only on deferral of provincial taxes and payments, some other provincial programs that may be of significance are as follows:
• The delayed carbon tax increase in BC • Corporate Tax reduction in AB (from 10% to 8% in July 2020) • Small Business relaunch and emergency payments in AB and SK
Oil and Gas Operations and Revenues This section highlights the methodology for evaluating the oil and gas producer’s gross revenues (operations), which are used as inputs, or injections, into the CERI MRIO model to estimate the economic impacts of the upstream oil and gas sectors. The revenues are calculated based on CERI’s most recent production outlooks published in CERI Studies 190 and 191 (CERI 2020a; 2020b). In particular, we only consider Scenario II production levels for the period of 2020-2025, inclusive2.
For ease of reference, CERI estimated a crude oil production loss of 1 million barrels per day (MMbpd) in 2020 and 700 thousand barrels per day (kbpd) in 2021. After 2021, a permanent production loss of 200 kbpd is considered, meaning that between 2022 and 2025, the annual oil production in Canada will decrease by 200 kbpd compared to the respective values forecasted in CERI’s 2019 production forecasts (CERI 2019a; 2019b).
It is assumed that the following major oil-producing provinces, i.e., British Columbia (BC), Alberta (AB), Saskatchewan (SK), and Manitoba (MB), are affected by the production cuts. We exempt Newfoundland and Labrador (NL) because of its specific geographical situation and market structure and its ability to access global Brent prices. Additionally, data for March and April 2020 does not show a significant change in the crude oil production in NL (C-NLOPB 2020).
The production loss is split among oil and gas producing provinces based on historical production shares. We consider the average shares between the years of 2014-2018 as the production share of each province of the total crude oil production in Canada (CAPP 2019).
We assume that the natural gas exports to the US and the domestic natural gas consumption will not alter significantly in different industrial sectors except for Alberta’s oil sands industry. However, owing to the
2 Readers are encouraged to familiarize themselves with the abovementioned studies to understand the production forecasts, production losses and provincial shares assignment.
14 Canadian Energy Research Institute
September 2020
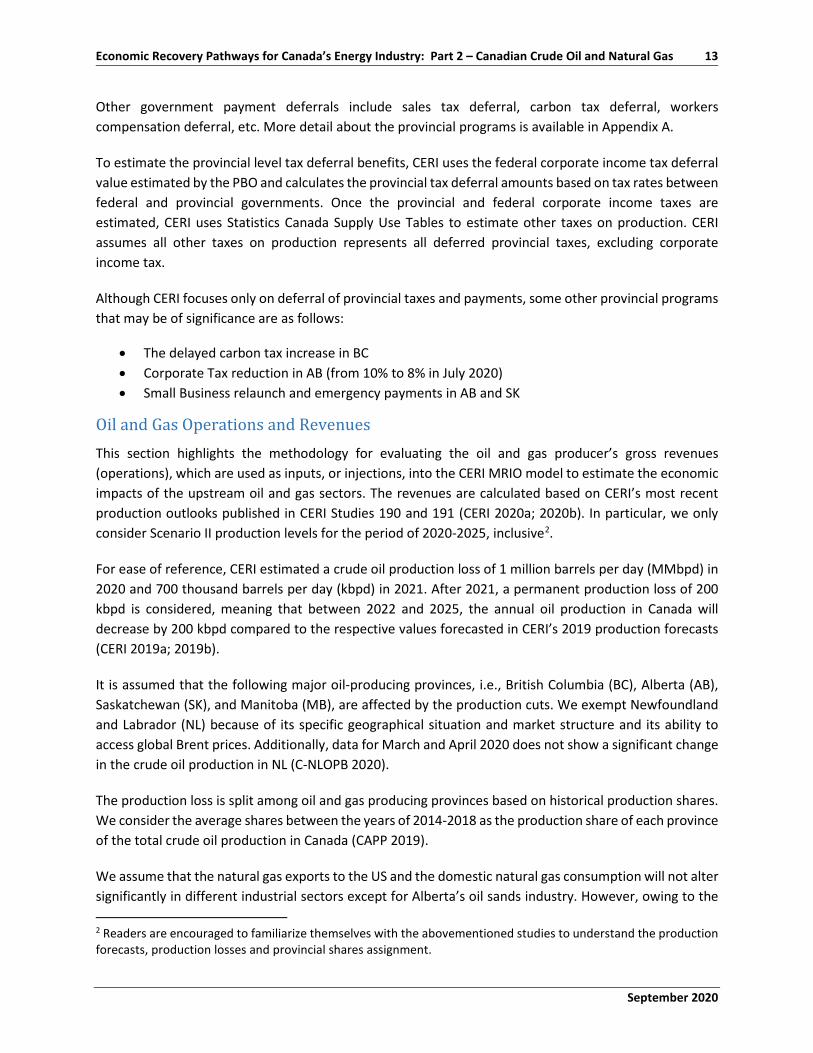
production decline and the high consumption of natural gas in Alberta’s oil sands industry, Alberta’s natural gas production will decrease accordingly. To estimate the natural gas production loss, we calculate the consumption intensities for in-situ and mined oil sand extraction processes based on the available historical data from 2014 to 2018. Figure 2.4 illustrates the oil and gas production outlook for western Canadian provinces with Newfoundland and Labrador between 2020 and 2025 based on the above assumptions.
Figure 2.4: 2020-2025 Canadian Oil and Gas Production Forecast
Sources: (CERI 2020a; 2020b)
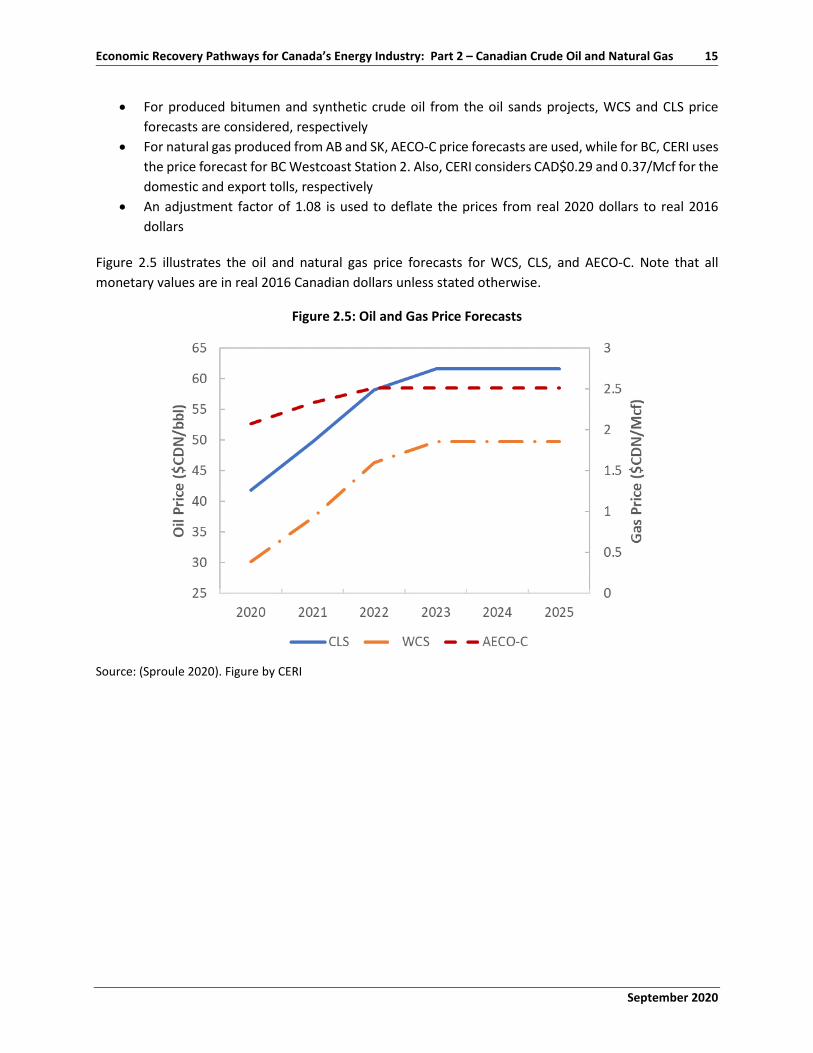
To estimate the revenues from the produced oil and gas, CERI used various commodity price forecasts as estimated by Sproule (Sproule 2020), which are summarized as follows:
• For onshore Canadian light/medium and heavy oil, the Canadian Light Select (CLS) and Western Canadian Select (WCS) are considered, respectively
• For offshore Canadian light/medium and heavy oil, the Canadian Light Select (CLS) and Mexico Maya prices applying a differential of US$2.5/bbl are considered, respectively
September 2020
Economic Recovery Pathways for Canada’s Energy Industry: Part 2 – Canadian Crude Oil and Natural Gas 15
• For produced bitumen and synthetic crude oil from the oil sands projects, WCS and CLS price forecasts are considered, respectively
• For natural gas produced from AB and SK, AECO-C price forecasts are used, while for BC, CERI uses the price forecast for BC Westcoast Station 2. Also, CERI considers CAD$0.29 and 0.37/Mcf for the domestic and export tolls, respectively
• An adjustment factor of 1.08 is used to deflate the prices from real 2020 dollars to real 2016 dollars
Figure 2.5 illustrates the oil and natural gas price forecasts for WCS, CLS, and AECO-C. Note that all monetary values are in real 2016 Canadian dollars unless stated otherwise.
Figure 2.5: Oil and Gas Price Forecasts
Source: (Sproule 2020). Figure by CERI

16 Canadian Energy Research Institute
September 2020
September 2020
Economic Recovery Pathways for Canada’s Energy Industry: Part 2 – Canadian Crude Oil and Natural Gas 17
Chapter 3: Economic Impacts of Relief Measures and Industry Operations
This chapter presents the summary results of economic I/O analysis and the resulting economic impacts on major macroeconomic variables. The first section of the Chapter highlights the summary of impacts from government relief measures. The second section details the economic impacts stemming from generated revenues of the upstream oil and gas exploration and production sector (E&P). Detailed I/O results from stimulus packages are also available in Appendix B.
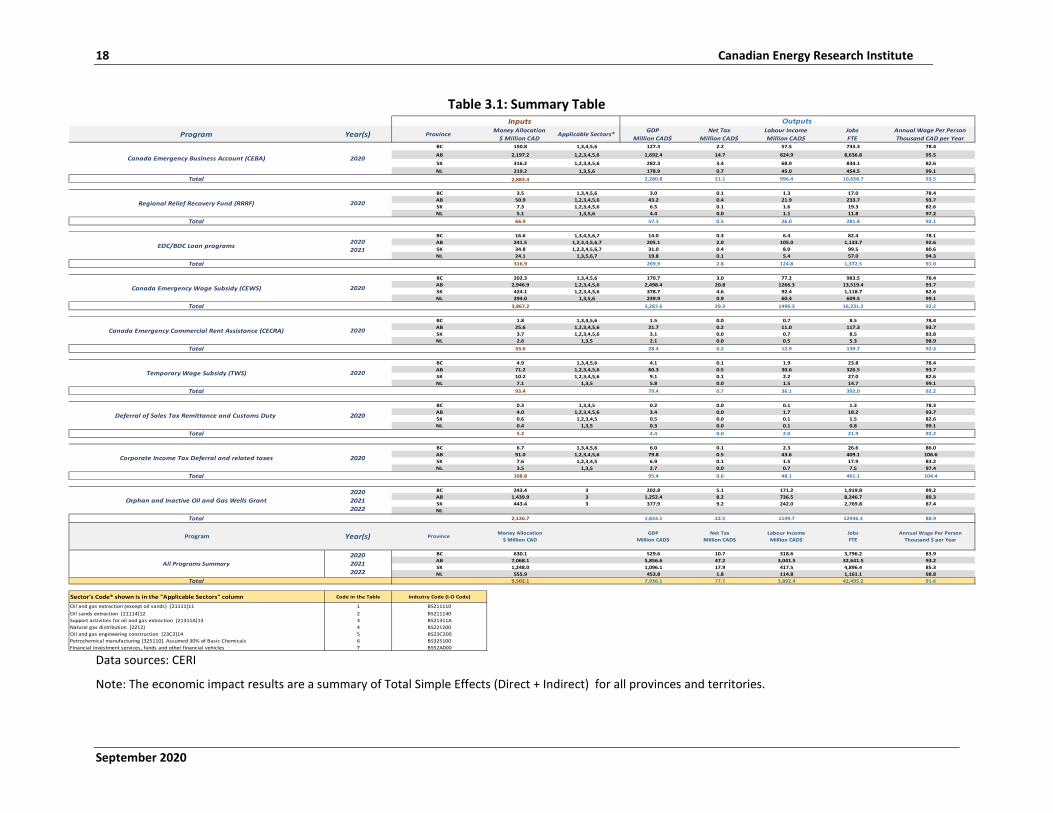
Economic Impacts of Relief Measures This section presents the short-term economic impacts of various government stimulus packages on the oil and gas producing jurisdictions and the Canadian economy overall. Given the short-term nature of the various programs, the results are evaluated and presented for three years, from 2020 to 2022, inclusive. Table 3.1 shows a summary of the input and output data. The economic impacts represent the total simple effects (direct + indirect) for the four producing provinces as well as other Canadian provinces and territories.
The total GDP impact over the studied period could amount to almost CAD$8 billion, including direct and indirect impacts within producing regions as well as indirect impacts within all other regions in Canada. The overall employment impact is estimated to be almost 42.5 thousand FTE jobs and labour income amounting to almost CAD$4 billion, with an average annual salary of CAD$91.6 thousand per person. The associated net tax revenues that could be realized are almost CAD$78 million over the 2020-2022 period.
• Total economic Impacts (direct and indirect) of stimulus packages over 2020-2022 period could amount to:
o GDP impact of CAD$7,936 million; Employment impact of 42,495 FTE jobs; Net tax impact of CAD$78 million; Labour income impact of CAD$3,892 million with an average annual salary per person of CAD$91,600.
• Total economic Impacts of upstream oil and gas operations (direct and indirect) over the 2020-2025 period are estimated to be:
o GDP impact of CAD$177 billion (conventional oil), CAD$53 billion (natural gas), and CAD$300 billion (oil sands).
o Employment impact of 801 thousand FTE (conventional oil), 294 thousand FTE (natural gas), and 1.3 million FTE (oil sands).
18 Canadian Energy Research Institute
September 2020
Table 3.1: Summary Table
Data sources: CERI
Note: The economic impact results are a summary of Total Simple Effects (Direct + Indirect) for all provinces and territories.
Inputs
Program Year(s) Province Money Allocation $ Million CAD
Applicable Sectors* GDPMillion CAD$
Net TaxMillion CAD$
Labour IncomeMillion CAD$
JobsFTE
Annual Wage Per PersonThousand CAD per Year
BC 150.8 1,3,4,5,6 127.3 2.2 57.5 733.3 78.4
AB 2,197.2 1,2,3,4,5,6 1,692.4 14.7 824.9 8,636.8 95.5
SK 316.2 1,2,3,4,5,6 282.3 3.4 68.9 834.1 82.6NL 219.2 1,3,5,6 178.9 0.7 45.0 454.5 99.1
Total 2,883.4 2,280.8 21.1 996.4 10,658.7 93.5Program Province Money Allocation Applicable Sectors GDP Net Tax Labour Income Jobs
BC 3.5 1,3,4,5,6 3.0 0.1 1.3 17.0 78.4AB 50.9 1,2,3,4,5,6 43.2 0.4 21.9 233.7 93.7SK 7.3 1,2,3,4,5,6 6.5 0.1 1.6 19.3 82.6NL 5.1 1,3,5,6 4.4 0.0 1.1 11.8 97.2
Total 66.9 57.1 0.5 26.0 281.8 92.1Program Province Money Allocation Applicable Sectors GDP Net Tax Labour Income Jobs
BC 16.6 1,3,4,5,6,7 14.0 0.3 6.4 82.4 78.1AB 241.5 1,2,3,4,5,6,7 205.1 2.0 105.0 1,133.7 92.6SK 34.8 1,2,3,4,5,6,7 31.0 0.4 8.0 99.5 80.6NL 24.1 1,3,5,6,7 19.8 0.1 5.4 57.0 94.3
Total 316.9 269.9 2.8 124.8 1,372.5 91.0Program Province Money Allocation Applicable Sectors GDP Net Tax Labour Income Jobs
BC 202.3 1,3,4,5,6 170.7 3.0 77.2 983.5 78.4AB 2,946.9 1,2,3,4,5,6 2,498.4 20.8 1266.3 13,519.4 93.7SK 424.1 1,2,3,4,5,6 378.7 4.6 92.4 1,118.7 82.6NL 294.0 1,3,5,6 239.9 0.9 60.4 609.5 99.1
Total 3,867.2 3,287.6 29.3 1496.3 16,231.2 92.2Program Province Money Allocation Applicable Sectors GDP Net Tax Labour Income Jobs
BC 1.8 1,3,4,5,6 1.5 0.0 0.7 8.5 78.4AB 25.6 1,2,3,4,5,6 21.7 0.2 11.0 117.3 93.7SK 3.7 1,2,3,4,5,6 3.1 0.0 0.7 8.5 83.8NL 2.6 1,3,5 2.1 0.0 0.5 5.3 98.9
Total 33.6 28.4 0.2 12.9 139.7 92.3Program Province Money Allocation Applicable Sectors GDP Net Tax Labour Income Jobs
BC 4.9 1,3,4,5,6 4.1 0.1 1.9 23.8 78.4AB 71.2 1,2,3,4,5,6 60.3 0.5 30.6 326.5 93.7SK 10.2 1,2,3,4,5,6 9.1 0.1 2.2 27.0 82.6NL 7.1 1,3,5 5.8 0.0 1.5 14.7 99.1
Total 93.4 79.4 0.7 36.1 392.0 92.2Program Province Money Allocation Applicable Sectors GDP Net Tax Labour Income Jobs
BC 0.3 1,3,4,5 0.2 0.0 0.1 1.3 78.3AB 4.0 1,2,3,4,5,6 3.4 0.0 1.7 18.2 93.7SK 0.6 1,2,3,4,5 0.5 0.0 0.1 1.5 82.6NL 0.4 1,3,5 0.3 0.0 0.1 0.8 99.1
Total 5.2 4.4 0.0 2.0 21.9 92.2Program Province Money Allocation Applicable Sectors GDP Net Tax Labour Income Jobs
BC 6.7 1,3,4,5,6 6.0 0.1 2.3 26.6 86.0AB 91.0 1,2,3,4,5,6 79.8 0.5 43.6 409.1 106.6SK 7.6 1,2,3,4,5 6.9 0.1 1.5 17.9 83.2NL 3.5 1,3,5 2.7 0.0 0.7 7.5 97.4
Total 108.8 95.4 0.6 48.1 461.1 104.4Program Province Money Allocation Applicable Sectors GDP Net Tax Labour Income Jobs
BC 243.4 3 202.8 5.1 171.2 1,919.8 89.2AB 1,439.9 3 1,252.4 8.2 736.5 8,246.7 89.3SK 443.4 3 377.9 9.2 242.0 2,769.8 87.4NL
Total 2,126.7 1,833.1 22.5 1149.7 12936.3 88.9
Program Year(s) Province Money Allocation $ Million CAD
GDPMillion CAD$
Net TaxMillion CAD$
Labour IncomeMillion CAD$
JobsFTE
Annual Wage Per PersonThousand $ per Year
BC 630.1 529.6 10.7 318.6 3,796.2 83.9AB 7,068.1 5,856.6 47.2 3,041.5 32,641.5 93.2SK 1,248.0 1,096.1 17.9 417.5 4,896.4 85.3NL 555.9 453.8 1.8 114.8 1,161.1 98.8
Total 9,502.1 7,936.1 77.7 3,892.4 42,495.2 91.6
Sector's Code* shown is in the "Applicable Sectors" column Code in the Table Industry Code (I-O Code)
Oil and gas extraction (except oil sands) [21111]11 1 BS211110Oil sands extraction [21114]12 2 BS211140Support activities for oil and gas extraction [21311A]13 3 BS21311ANatural gas distribution [2212] 4 BS221200Oil and gas engineering construction [23C2]14 5 BS23C200Petrochemical manufacturing [325110]. Assumed 30% of Basic Chemicals 6 BS325100Financial investment services, funds and other financial vehicles 7 BS52A000
2020
2020
2020
202020212022
202020212022
Canada Emergency Business Account (CEBA)
Regional Relief Recovery Fund (RRRF)
Outputs
2020
2020
20202021
2020
2020
Orphan and Inactive Oil and Gas Wells Grant
All Programs Summary
EDC/BDC Loan programs
Canada Emergency Wage Subsidy (CEWS)
Canada Emergency Commercial Rent Assistance (CECRA)
Temporary Wage Subsidy (TWS)
Deferral of Sales Tax Remittance and Customs Duty
Corporate Income Tax Deferral and related taxes
September 2020
Economic Recovery Pathways for Canada’s Energy Industry: Part 2 – Canadian Crude Oil and Natural Gas 19
The next four sections describe the direct and indirect impacts on GDP, employment, tax revenues and labour income within each producing province. The indirect impacts on other provinces and territories are aggregated.
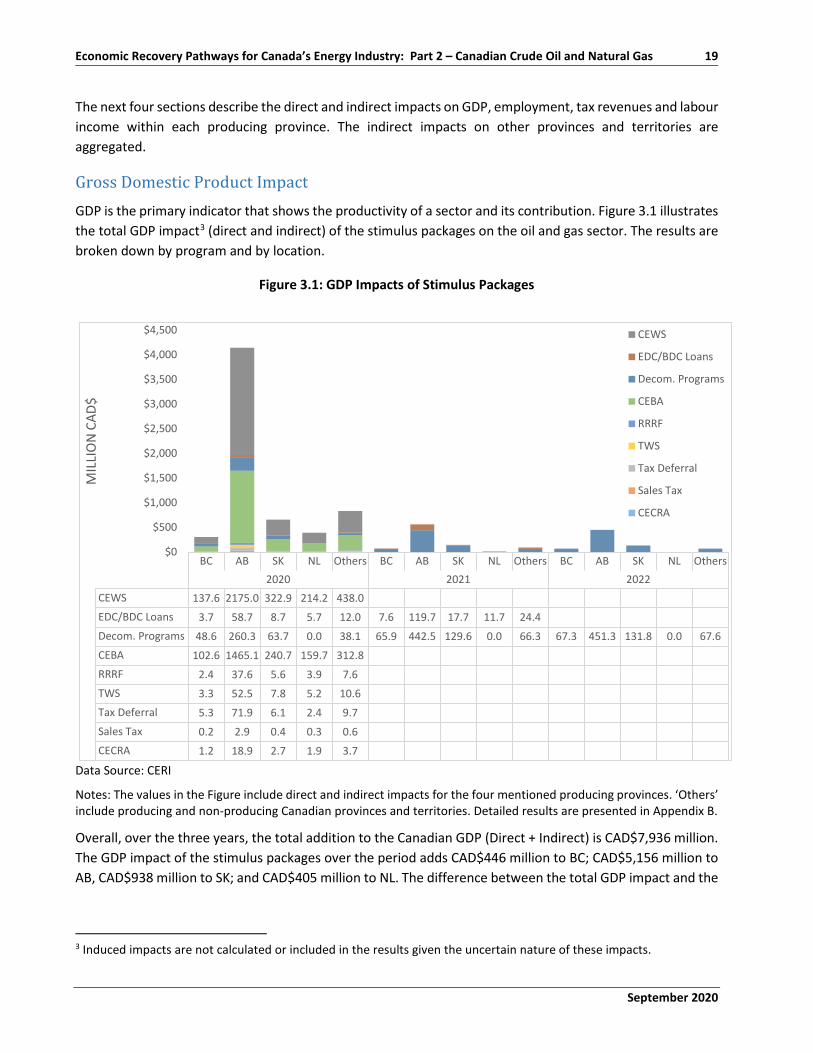
Gross Domestic Product Impact GDP is the primary indicator that shows the productivity of a sector and its contribution. Figure 3.1 illustrates the total GDP impact3 (direct and indirect) of the stimulus packages on the oil and gas sector. The results are broken down by program and by location.
Figure 3.1: GDP Impacts of Stimulus Packages
Data Source: CERI
Notes: The values in the Figure include direct and indirect impacts for the four mentioned producing provinces. ‘Others’ include producing and non-producing Canadian provinces and territories. Detailed results are presented in Appendix B.
Overall, over the three years, the total addition to the Canadian GDP (Direct + Indirect) is CAD$7,936 million. The GDP impact of the stimulus packages over the period adds CAD$446 million to BC; CAD$5,156 million to AB, CAD$938 million to SK; and CAD$405 million to NL. The difference between the total GDP impact and the
3 Induced impacts are not calculated or included in the results given the uncertain nature of these impacts.
BC AB SK NL Others BC AB SK NL Others BC AB SK NL Others2020 2021 2022
CEWS 137.6 2175.0 322.9 214.2 438.0EDC/BDC Loans 3.7 58.7 8.7 5.7 12.0 7.6 119.7 17.7 11.7 24.4Decom. Programs 48.6 260.3 63.7 0.0 38.1 65.9 442.5 129.6 0.0 66.3 67.3 451.3 131.8 0.0 67.6CEBA 102.6 1465.1 240.7 159.7 312.8RRRF 2.4 37.6 5.6 3.9 7.6TWS 3.3 52.5 7.8 5.2 10.6Tax Deferral 5.3 71.9 6.1 2.4 9.7Sales Tax 0.2 2.9 0.4 0.3 0.6CECRA 1.2 18.9 2.7 1.9 3.7
$0
$500
$1,000
$1,500
$2,000
$2,500
$3,000
$3,500
$4,000
$4,500
MIL
LIO
N C
AD$
CEWS
EDC/BDC Loans
Decom. Programs
CEBA
RRRF
TWS
Tax Deferral
Sales Tax
CECRA
20 Canadian Energy Research Institute
September 2020
impacts for the four producing provinces is attributed to GDP impacts that could be felt in other provinces and territories.
While CEWS will provide the most significant short-term benefit, the field decommissioning and reclamation programs in western Canada will be the primary source of government stimulus for the sector, in particular, the oil and gas services sector over the next two years.
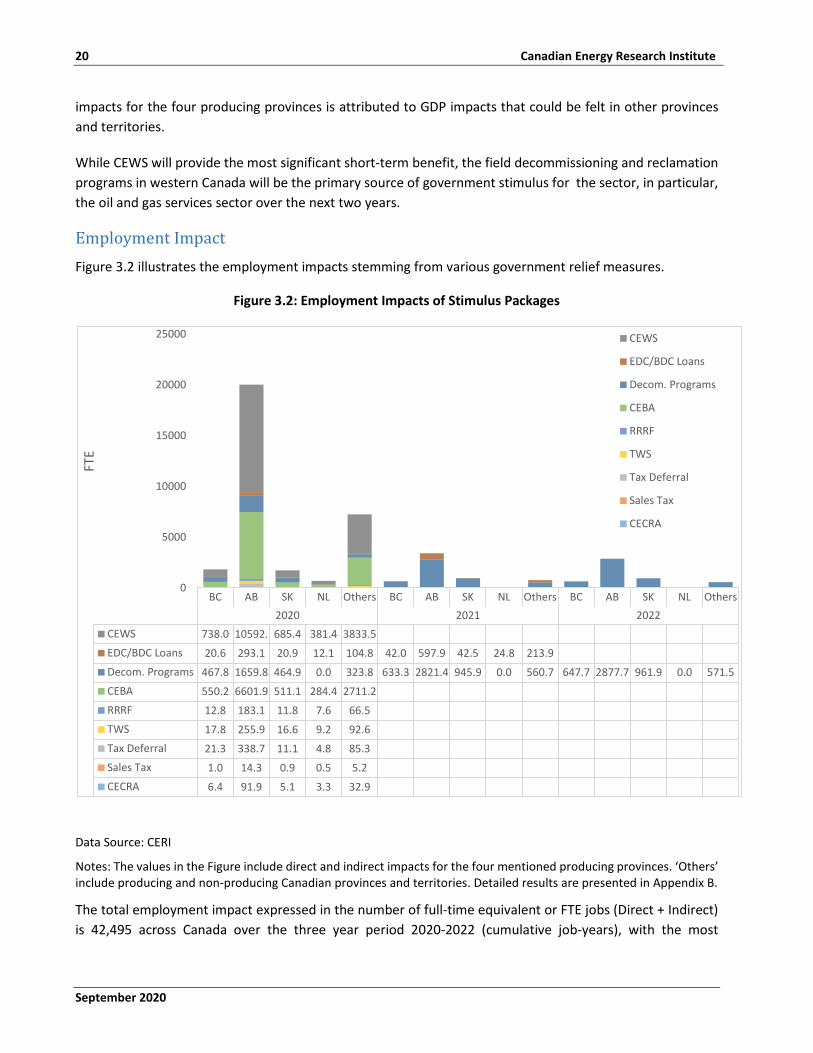
Employment Impact Figure 3.2 illustrates the employment impacts stemming from various government relief measures.
Figure 3.2: Employment Impacts of Stimulus Packages
Data Source: CERI
Notes: The values in the Figure include direct and indirect impacts for the four mentioned producing provinces. ‘Others’ include producing and non-producing Canadian provinces and territories. Detailed results are presented in Appendix B.
The total employment impact expressed in the number of full-time equivalent or FTE jobs (Direct + Indirect) is 42,495 across Canada over the three year period 2020-2022 (cumulative job-years), with the most
BC AB SK NL Others BC AB SK NL Others BC AB SK NL Others2020 2021 2022
CEWS 738.0 10592. 685.4 381.4 3833.5EDC/BDC Loans 20.6 293.1 20.9 12.1 104.8 42.0 597.9 42.5 24.8 213.9Decom. Programs 467.8 1659.8 464.9 0.0 323.8 633.3 2821.4 945.9 0.0 560.7 647.7 2877.7 961.9 0.0 571.5CEBA 550.2 6601.9 511.1 284.4 2711.2RRRF 12.8 183.1 11.8 7.6 66.5TWS 17.8 255.9 16.6 9.2 92.6Tax Deferral 21.3 338.7 11.1 4.8 85.3Sales Tax 1.0 14.3 0.9 0.5 5.2CECRA 6.4 91.9 5.1 3.3 32.9
0
5000
10000
15000
20000
25000
FTE
CEWS
EDC/BDC Loans
Decom. Programs
CEBA
RRRF
TWS
Tax Deferral
Sales Tax
CECRA
September 2020
Economic Recovery Pathways for Canada’s Energy Industry: Part 2 – Canadian Crude Oil and Natural Gas 21
substantial impact to be felt in provinces where oil and gas is extracted. The peak year is 2020, which results in 31,554 FTE due to the CEWS program. Within the total employment impact, the employment impact of decommissioning and reclamation programs could yield almost 13 thousand FTE jobs. Field decommissioning programs have become the leading employment contributors for 2021 and 2022.
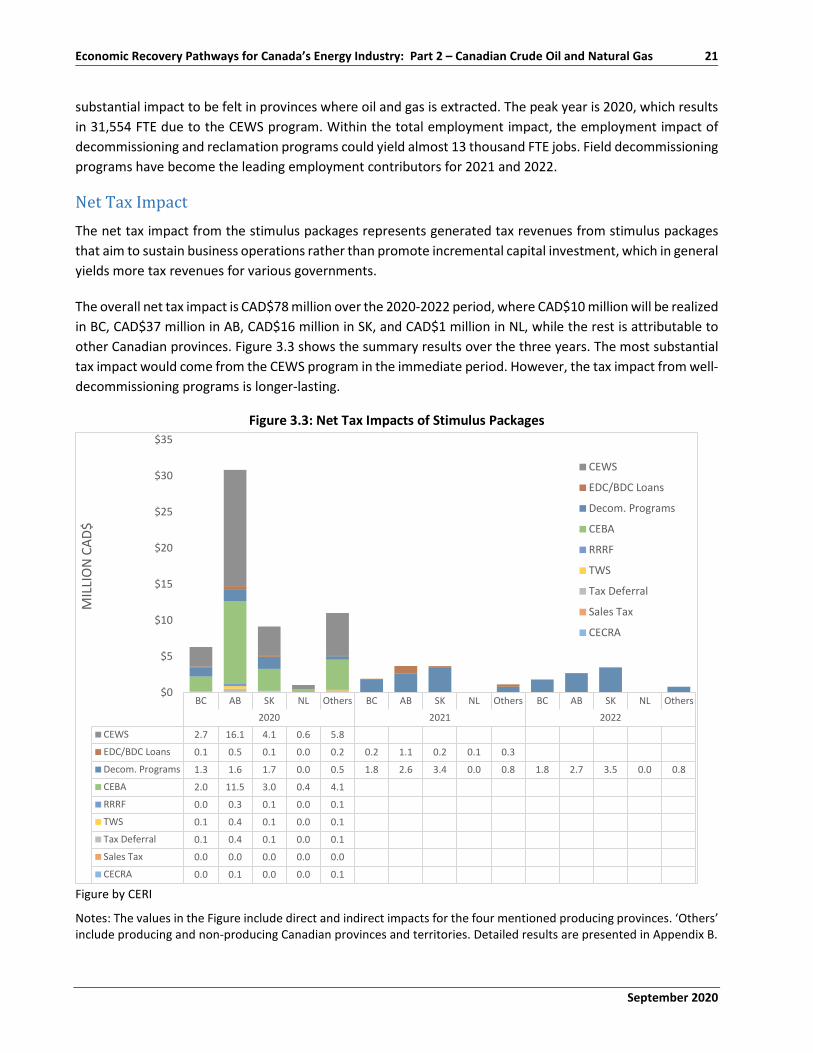
Net Tax Impact The net tax impact from the stimulus packages represents generated tax revenues from stimulus packages that aim to sustain business operations rather than promote incremental capital investment, which in general yields more tax revenues for various governments.
The overall net tax impact is CAD$78 million over the 2020-2022 period, where CAD$10 million will be realized in BC, CAD$37 million in AB, CAD$16 million in SK, and CAD$1 million in NL, while the rest is attributable to other Canadian provinces. Figure 3.3 shows the summary results over the three years. The most substantial tax impact would come from the CEWS program in the immediate period. However, the tax impact from well-decommissioning programs is longer-lasting.
Figure 3.3: Net Tax Impacts of Stimulus Packages
Figure by CERI
Notes: The values in the Figure include direct and indirect impacts for the four mentioned producing provinces. ‘Others’ include producing and non-producing Canadian provinces and territories. Detailed results are presented in Appendix B.
BC AB SK NL Others BC AB SK NL Others BC AB SK NL Others2020 2021 2022
CEWS 2.7 16.1 4.1 0.6 5.8
EDC/BDC Loans 0.1 0.5 0.1 0.0 0.2 0.2 1.1 0.2 0.1 0.3
Decom. Programs 1.3 1.6 1.7 0.0 0.5 1.8 2.6 3.4 0.0 0.8 1.8 2.7 3.5 0.0 0.8
CEBA 2.0 11.5 3.0 0.4 4.1
RRRF 0.0 0.3 0.1 0.0 0.1
TWS 0.1 0.4 0.1 0.0 0.1
Tax Deferral 0.1 0.4 0.1 0.0 0.1
Sales Tax 0.0 0.0 0.0 0.0 0.0
CECRA 0.0 0.1 0.0 0.0 0.1
$0
$5
$10
$15
$20
$25
$30
$35
MIL
LIO
N C
AD$
CEWS
EDC/BDC Loans
Decom. Programs
CEBA
RRRF
TWS
Tax Deferral
Sales Tax
CECRA
22 Canadian Energy Research Institute
September 2020
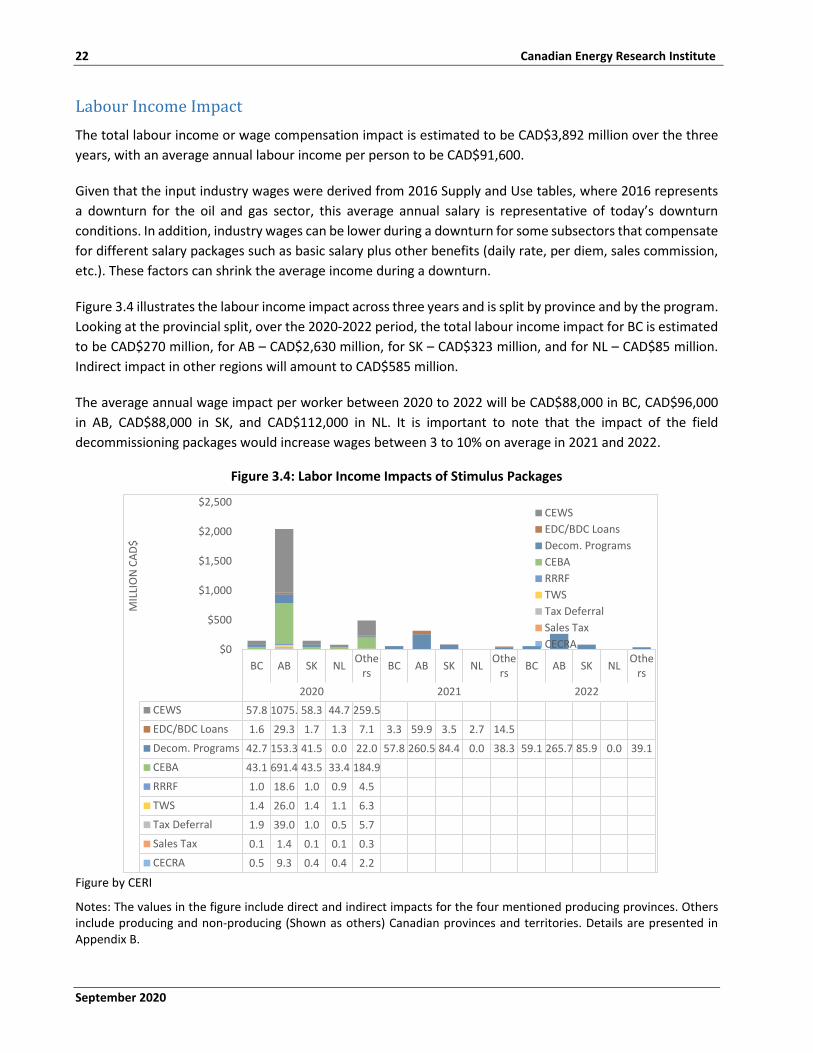
Labour Income Impact The total labour income or wage compensation impact is estimated to be CAD$3,892 million over the three years, with an average annual labour income per person to be CAD$91,600.
Given that the input industry wages were derived from 2016 Supply and Use tables, where 2016 represents a downturn for the oil and gas sector, this average annual salary is representative of today’s downturn conditions. In addition, industry wages can be lower during a downturn for some subsectors that compensate for different salary packages such as basic salary plus other benefits (daily rate, per diem, sales commission, etc.). These factors can shrink the average income during a downturn.
Figure 3.4 illustrates the labour income impact across three years and is split by province and by the program. Looking at the provincial split, over the 2020-2022 period, the total labour income impact for BC is estimated to be CAD$270 million, for AB – CAD$2,630 million, for SK – CAD$323 million, and for NL – CAD$85 million. Indirect impact in other regions will amount to CAD$585 million.
The average annual wage impact per worker between 2020 to 2022 will be CAD$88,000 in BC, CAD$96,000 in AB, CAD$88,000 in SK, and CAD$112,000 in NL. It is important to note that the impact of the field decommissioning packages would increase wages between 3 to 10% on average in 2021 and 2022.
Figure 3.4: Labor Income Impacts of Stimulus Packages
Figure by CERI
Notes: The values in the figure include direct and indirect impacts for the four mentioned producing provinces. Others include producing and non-producing (Shown as others) Canadian provinces and territories. Details are presented in Appendix B.
BC AB SK NL Others BC AB SK NL Othe
rs BC AB SK NL Others
2020 2021 2022CEWS 57.8 1075. 58.3 44.7 259.5EDC/BDC Loans 1.6 29.3 1.7 1.3 7.1 3.3 59.9 3.5 2.7 14.5Decom. Programs 42.7 153.3 41.5 0.0 22.0 57.8 260.5 84.4 0.0 38.3 59.1 265.7 85.9 0.0 39.1CEBA 43.1 691.4 43.5 33.4 184.9RRRF 1.0 18.6 1.0 0.9 4.5TWS 1.4 26.0 1.4 1.1 6.3Tax Deferral 1.9 39.0 1.0 0.5 5.7Sales Tax 0.1 1.4 0.1 0.1 0.3CECRA 0.5 9.3 0.4 0.4 2.2
$0
$500
$1,000
$1,500
$2,000
$2,500
MIL
LIO
N C
AD$
CEWSEDC/BDC LoansDecom. ProgramsCEBARRRFTWSTax DeferralSales TaxCECRA
September 2020
Economic Recovery Pathways for Canada’s Energy Industry: Part 2 – Canadian Crude Oil and Natural Gas 23
Economic Impacts of Oil and Gas Revenues The economic impacts stemming from oil and gas revenues are highly dependent on production and price levels. Hence any variation to either or both of those variables will alter the economic impacts estimated and presented in this section.
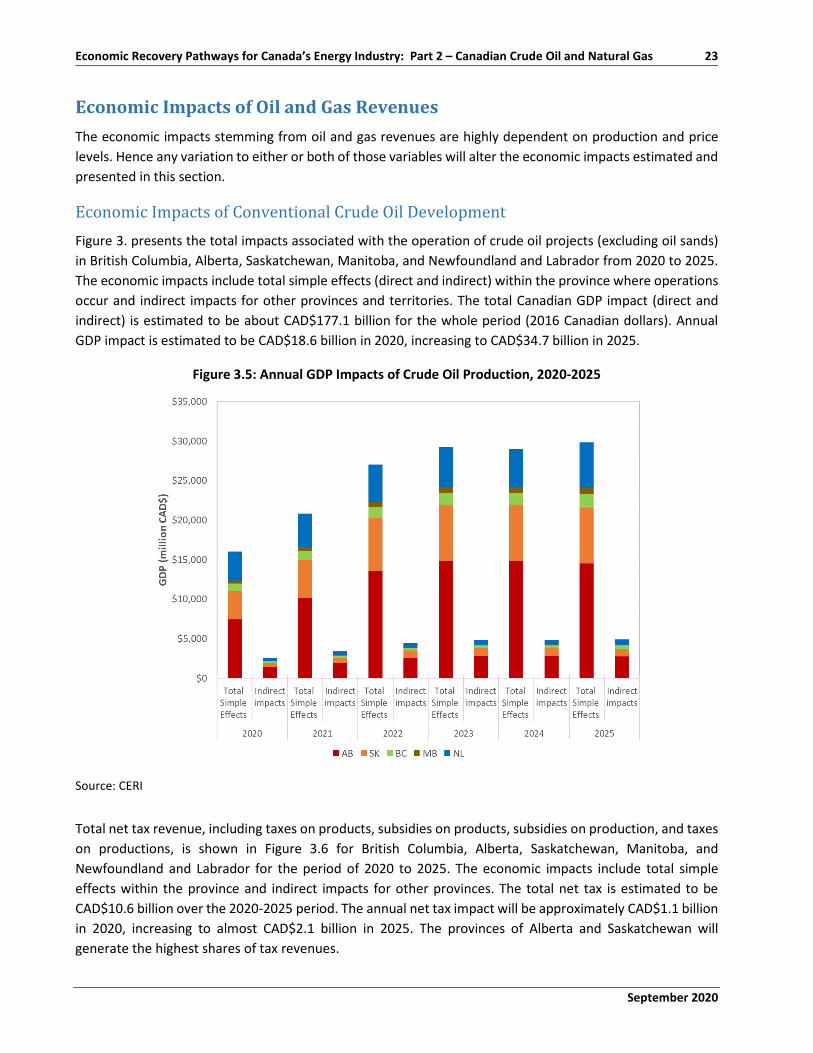
Economic Impacts of Conventional Crude Oil Development Figure 3. presents the total impacts associated with the operation of crude oil projects (excluding oil sands) in British Columbia, Alberta, Saskatchewan, Manitoba, and Newfoundland and Labrador from 2020 to 2025. The economic impacts include total simple effects (direct and indirect) within the province where operations occur and indirect impacts for other provinces and territories. The total Canadian GDP impact (direct and indirect) is estimated to be about CAD$177.1 billion for the whole period (2016 Canadian dollars). Annual GDP impact is estimated to be CAD$18.6 billion in 2020, increasing to CAD$34.7 billion in 2025.
Figure 3.5: Annual GDP Impacts of Crude Oil Production, 2020-2025
Source: CERI
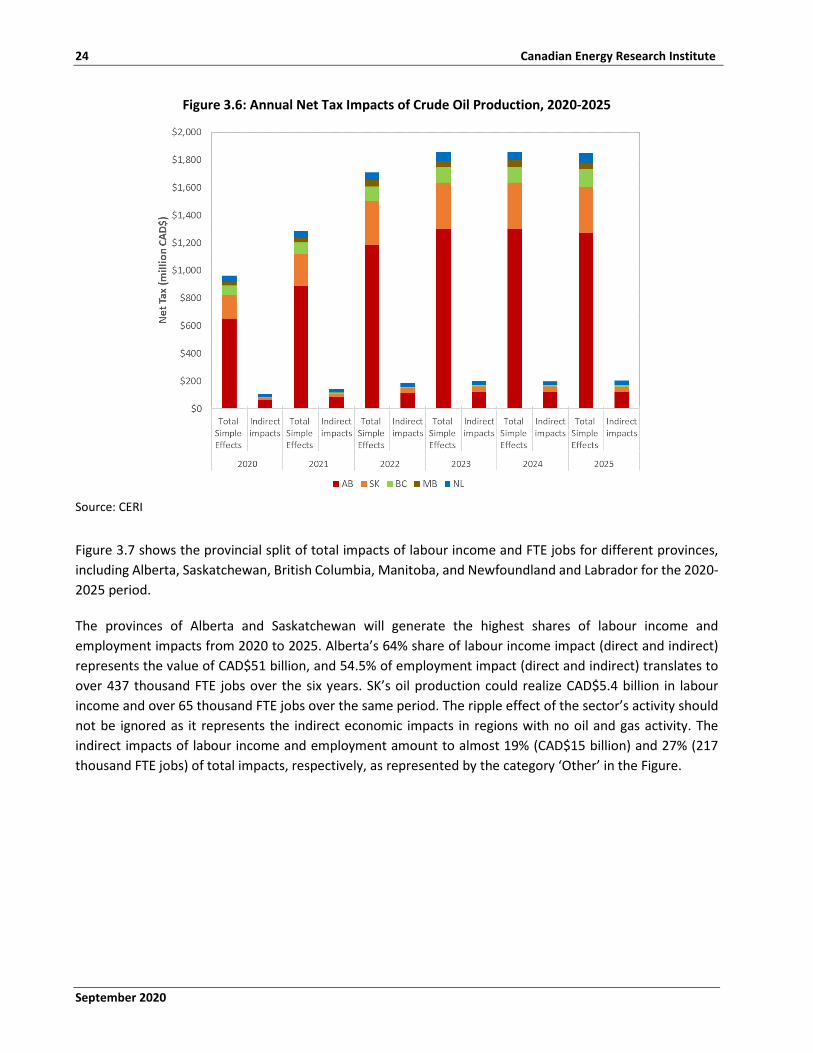
Total net tax revenue, including taxes on products, subsidies on products, subsidies on production, and taxes on productions, is shown in Figure 3.6 for British Columbia, Alberta, Saskatchewan, Manitoba, and Newfoundland and Labrador for the period of 2020 to 2025. The economic impacts include total simple effects within the province and indirect impacts for other provinces. The total net tax is estimated to be CAD$10.6 billion over the 2020-2025 period. The annual net tax impact will be approximately CAD$1.1 billion in 2020, increasing to almost CAD$2.1 billion in 2025. The provinces of Alberta and Saskatchewan will generate the highest shares of tax revenues.
24 Canadian Energy Research Institute
September 2020
Figure 3.6: Annual Net Tax Impacts of Crude Oil Production, 2020-2025
Source: CERI
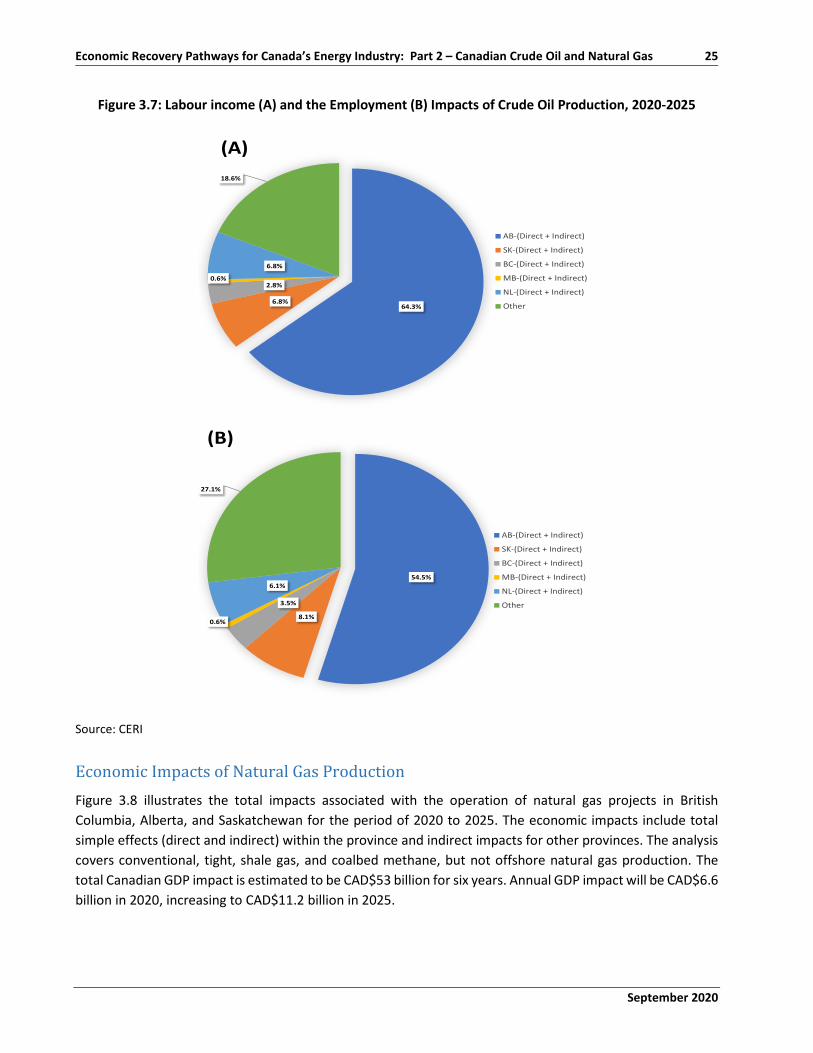
Figure 3.7 shows the provincial split of total impacts of labour income and FTE jobs for different provinces, including Alberta, Saskatchewan, British Columbia, Manitoba, and Newfoundland and Labrador for the 2020-2025 period.
The provinces of Alberta and Saskatchewan will generate the highest shares of labour income and employment impacts from 2020 to 2025. Alberta’s 64% share of labour income impact (direct and indirect) represents the value of CAD$51 billion, and 54.5% of employment impact (direct and indirect) translates to over 437 thousand FTE jobs over the six years. SK’s oil production could realize CAD$5.4 billion in labour income and over 65 thousand FTE jobs over the same period. The ripple effect of the sector’s activity should not be ignored as it represents the indirect economic impacts in regions with no oil and gas activity. The indirect impacts of labour income and employment amount to almost 19% (CAD$15 billion) and 27% (217 thousand FTE jobs) of total impacts, respectively, as represented by the category ‘Other’ in the Figure.
September 2020
Economic Recovery Pathways for Canada’s Energy Industry: Part 2 – Canadian Crude Oil and Natural Gas 25
Figure 3.7: Labour income (A) and the Employment (B) Impacts of Crude Oil Production, 2020-2025
Source: CERI
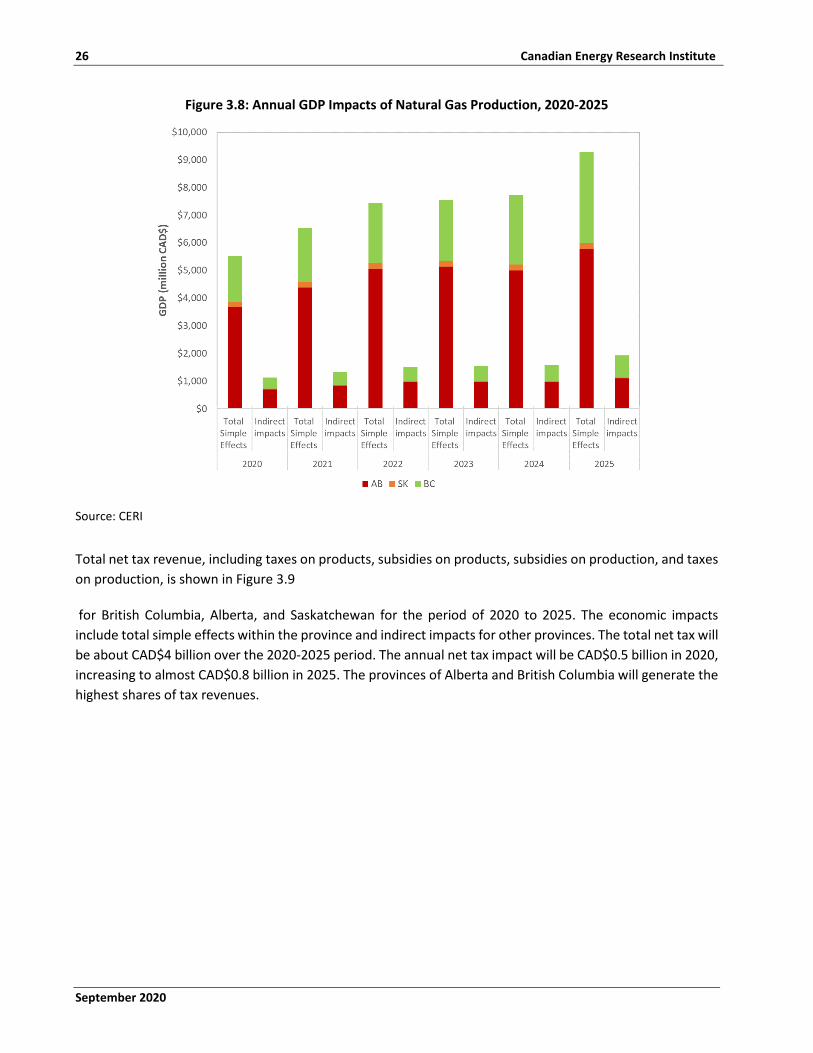
Economic Impacts of Natural Gas Production Figure 3.8 illustrates the total impacts associated with the operation of natural gas projects in British Columbia, Alberta, and Saskatchewan for the period of 2020 to 2025. The economic impacts include total simple effects (direct and indirect) within the province and indirect impacts for other provinces. The analysis covers conventional, tight, shale gas, and coalbed methane, but not offshore natural gas production. The total Canadian GDP impact is estimated to be CAD$53 billion for six years. Annual GDP impact will be CAD$6.6 billion in 2020, increasing to CAD$11.2 billion in 2025.
64.3%6.8%
2.8%0.6%
6.8%
18.6%
AB-(Direct + Indirect)
SK-(Direct + Indirect)
BC-(Direct + Indirect)
MB-(Direct + Indirect)
NL-(Direct + Indirect)
Other
(A)
54.5%
8.1%
3.5%
0.6%
6.1%
27.1%
AB-(Direct + Indirect)
SK-(Direct + Indirect)
BC-(Direct + Indirect)
MB-(Direct + Indirect)
NL-(Direct + Indirect)
Other
(B)
26 Canadian Energy Research Institute
September 2020
Figure 3.8: Annual GDP Impacts of Natural Gas Production, 2020-2025
Source: CERI
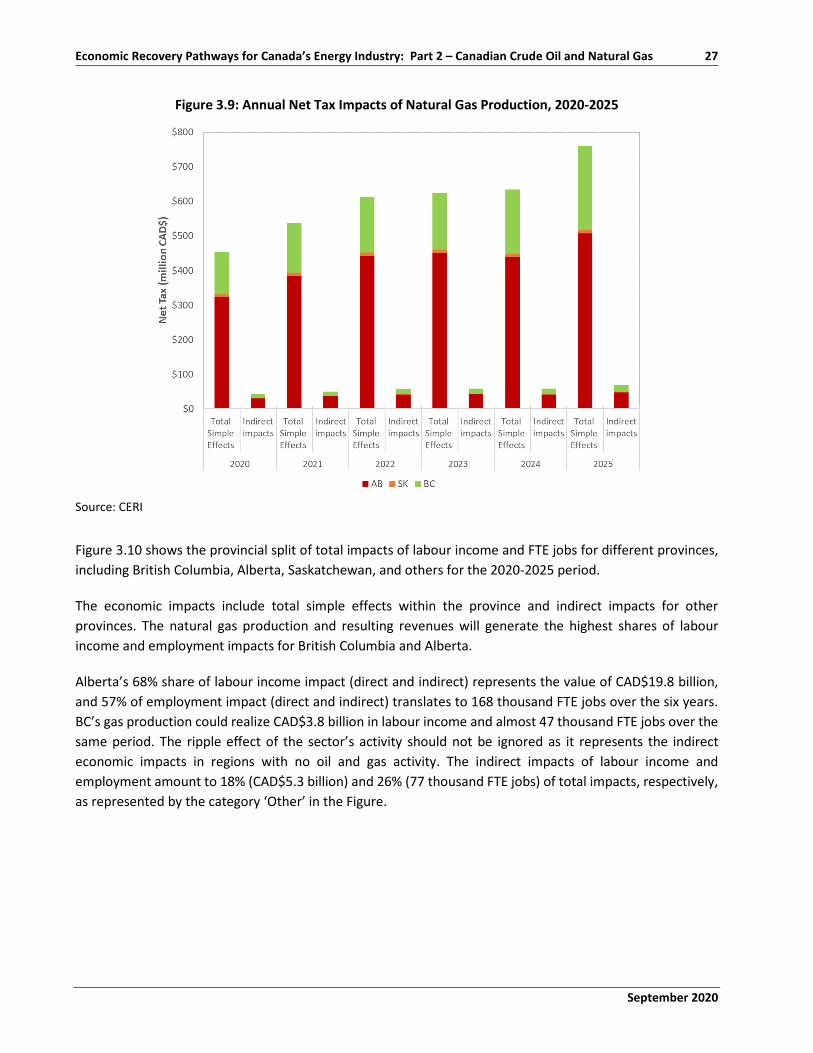
Total net tax revenue, including taxes on products, subsidies on products, subsidies on production, and taxes on production, is shown in Figure 3.9
for British Columbia, Alberta, and Saskatchewan for the period of 2020 to 2025. The economic impacts include total simple effects within the province and indirect impacts for other provinces. The total net tax will be about CAD$4 billion over the 2020-2025 period. The annual net tax impact will be CAD$0.5 billion in 2020, increasing to almost CAD$0.8 billion in 2025. The provinces of Alberta and British Columbia will generate the highest shares of tax revenues.
September 2020
Economic Recovery Pathways for Canada’s Energy Industry: Part 2 – Canadian Crude Oil and Natural Gas 27
Figure 3.9: Annual Net Tax Impacts of Natural Gas Production, 2020-2025
Source: CERI
Figure 3.10 shows the provincial split of total impacts of labour income and FTE jobs for different provinces, including British Columbia, Alberta, Saskatchewan, and others for the 2020-2025 period.
The economic impacts include total simple effects within the province and indirect impacts for other provinces. The natural gas production and resulting revenues will generate the highest shares of labour income and employment impacts for British Columbia and Alberta.
Alberta’s 68% share of labour income impact (direct and indirect) represents the value of CAD$19.8 billion, and 57% of employment impact (direct and indirect) translates to 168 thousand FTE jobs over the six years. BC’s gas production could realize CAD$3.8 billion in labour income and almost 47 thousand FTE jobs over the same period. The ripple effect of the sector’s activity should not be ignored as it represents the indirect economic impacts in regions with no oil and gas activity. The indirect impacts of labour income and employment amount to 18% (CAD$5.3 billion) and 26% (77 thousand FTE jobs) of total impacts, respectively, as represented by the category ‘Other’ in the Figure.
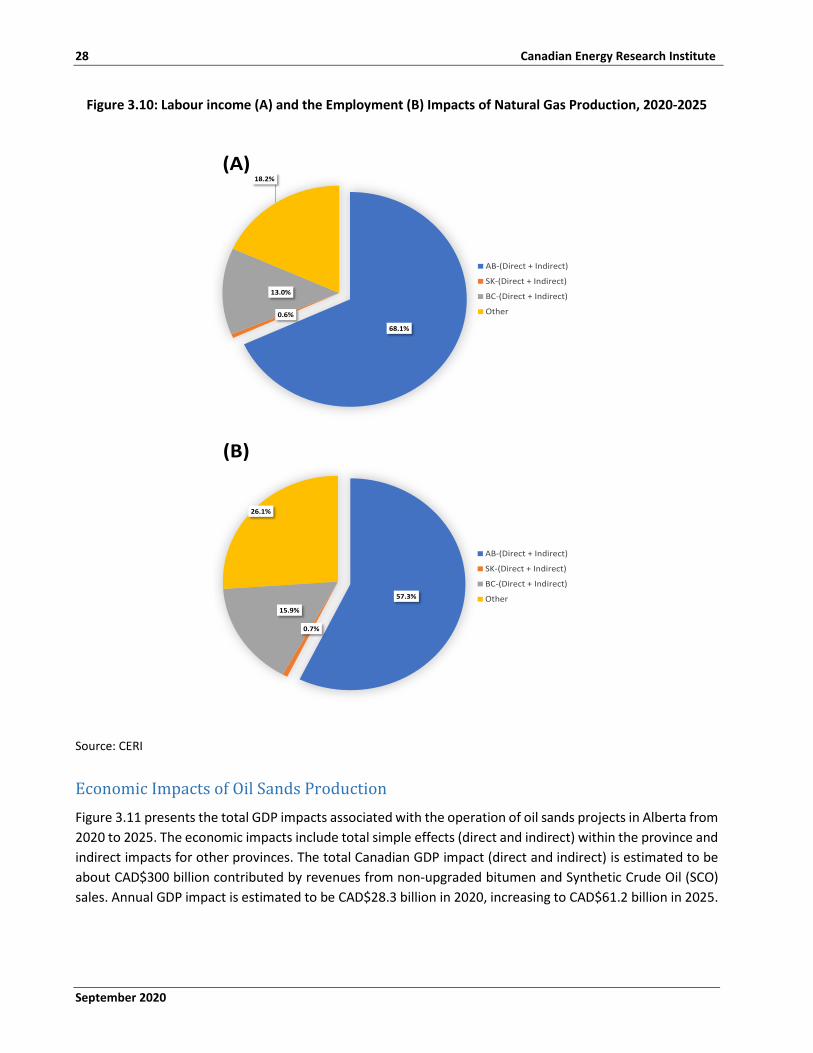
28 Canadian Energy Research Institute
September 2020
Figure 3.10: Labour income (A) and the Employment (B) Impacts of Natural Gas Production, 2020-2025
Source: CERI
Economic Impacts of Oil Sands Production
Figure 3.11 presents the total GDP impacts associated with the operation of oil sands projects in Alberta from 2020 to 2025. The economic impacts include total simple effects (direct and indirect) within the province and indirect impacts for other provinces. The total Canadian GDP impact (direct and indirect) is estimated to be about CAD$300 billion contributed by revenues from non-upgraded bitumen and Synthetic Crude Oil (SCO) sales. Annual GDP impact is estimated to be CAD$28.3 billion in 2020, increasing to CAD$61.2 billion in 2025.
68.1%
0.6%
13.0%
18.2%
AB-(Direct + Indirect)
SK-(Direct + Indirect)
BC-(Direct + Indirect)
Other
(A)
57.3%
0.7%
15.9%
26.1%
AB-(Direct + Indirect)
SK-(Direct + Indirect)
BC-(Direct + Indirect)
Other
(B)
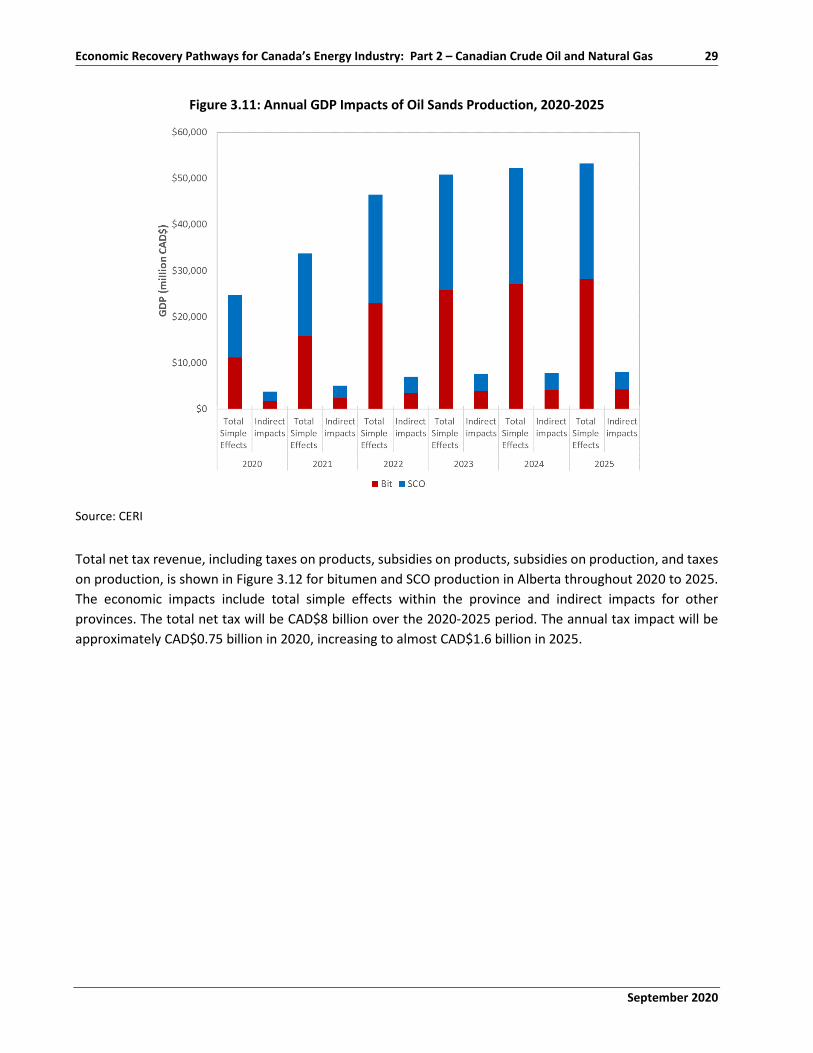
September 2020
Economic Recovery Pathways for Canada’s Energy Industry: Part 2 – Canadian Crude Oil and Natural Gas 29
Figure 3.11: Annual GDP Impacts of Oil Sands Production, 2020-2025
Source: CERI
Total net tax revenue, including taxes on products, subsidies on products, subsidies on production, and taxes on production, is shown in Figure 3.12 for bitumen and SCO production in Alberta throughout 2020 to 2025. The economic impacts include total simple effects within the province and indirect impacts for other provinces. The total net tax will be CAD$8 billion over the 2020-2025 period. The annual tax impact will be approximately CAD$0.75 billion in 2020, increasing to almost CAD$1.6 billion in 2025.
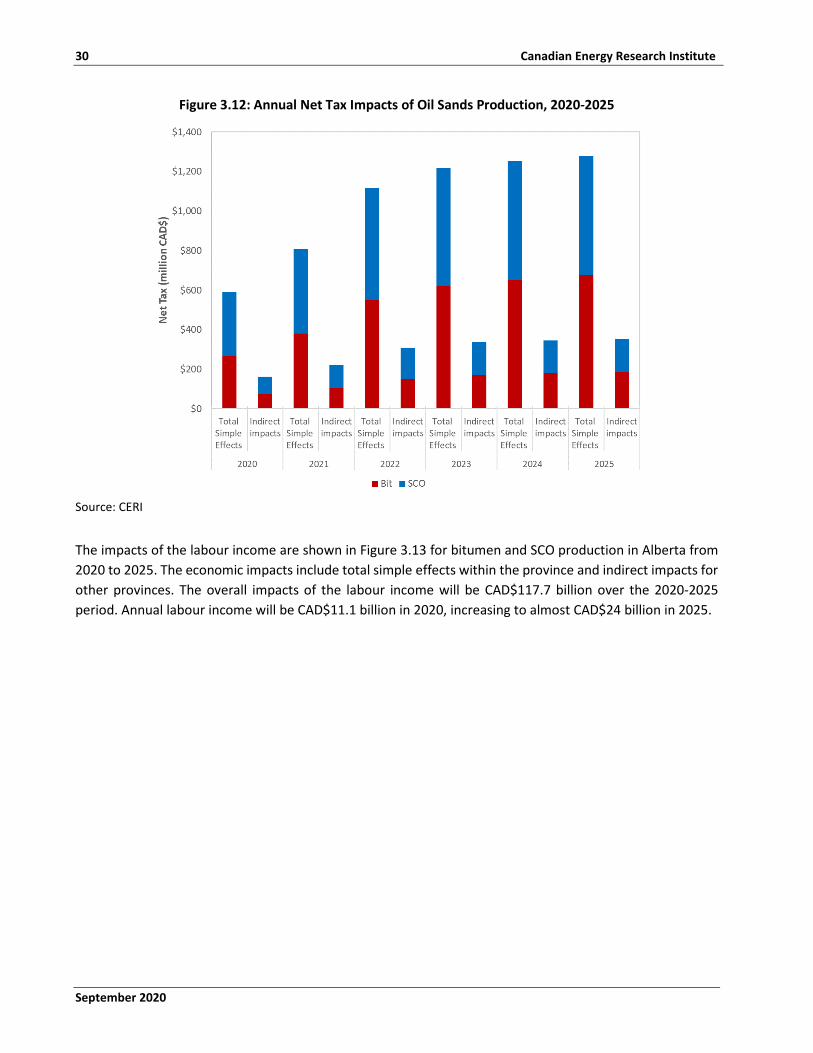
30 Canadian Energy Research Institute
September 2020
Figure 3.12: Annual Net Tax Impacts of Oil Sands Production, 2020-2025
Source: CERI
The impacts of the labour income are shown in Figure 3.13 for bitumen and SCO production in Alberta from 2020 to 2025. The economic impacts include total simple effects within the province and indirect impacts for other provinces. The overall impacts of the labour income will be CAD$117.7 billion over the 2020-2025 period. Annual labour income will be CAD$11.1 billion in 2020, increasing to almost CAD$24 billion in 2025.
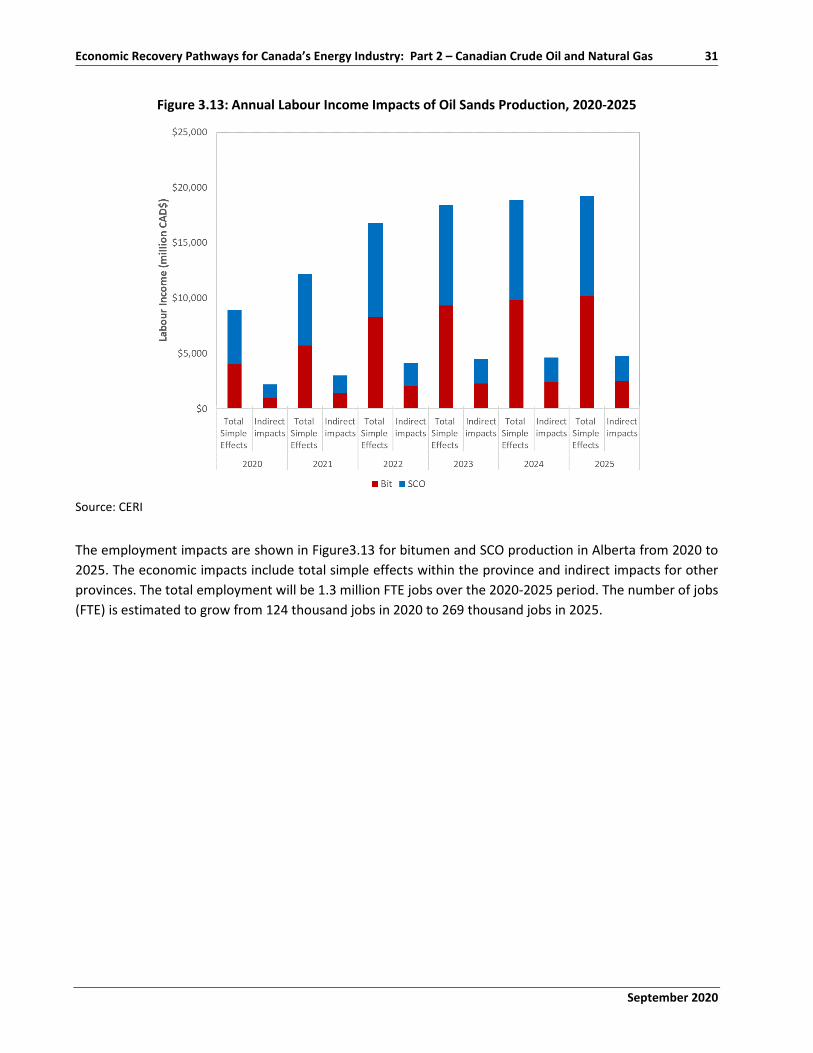
September 2020
Economic Recovery Pathways for Canada’s Energy Industry: Part 2 – Canadian Crude Oil and Natural Gas 31
Figure 3.13: Annual Labour Income Impacts of Oil Sands Production, 2020-2025
Source: CERI
The employment impacts are shown in Figure3.13 for bitumen and SCO production in Alberta from 2020 to 2025. The economic impacts include total simple effects within the province and indirect impacts for other provinces. The total employment will be 1.3 million FTE jobs over the 2020-2025 period. The number of jobs (FTE) is estimated to grow from 124 thousand jobs in 2020 to 269 thousand jobs in 2025.
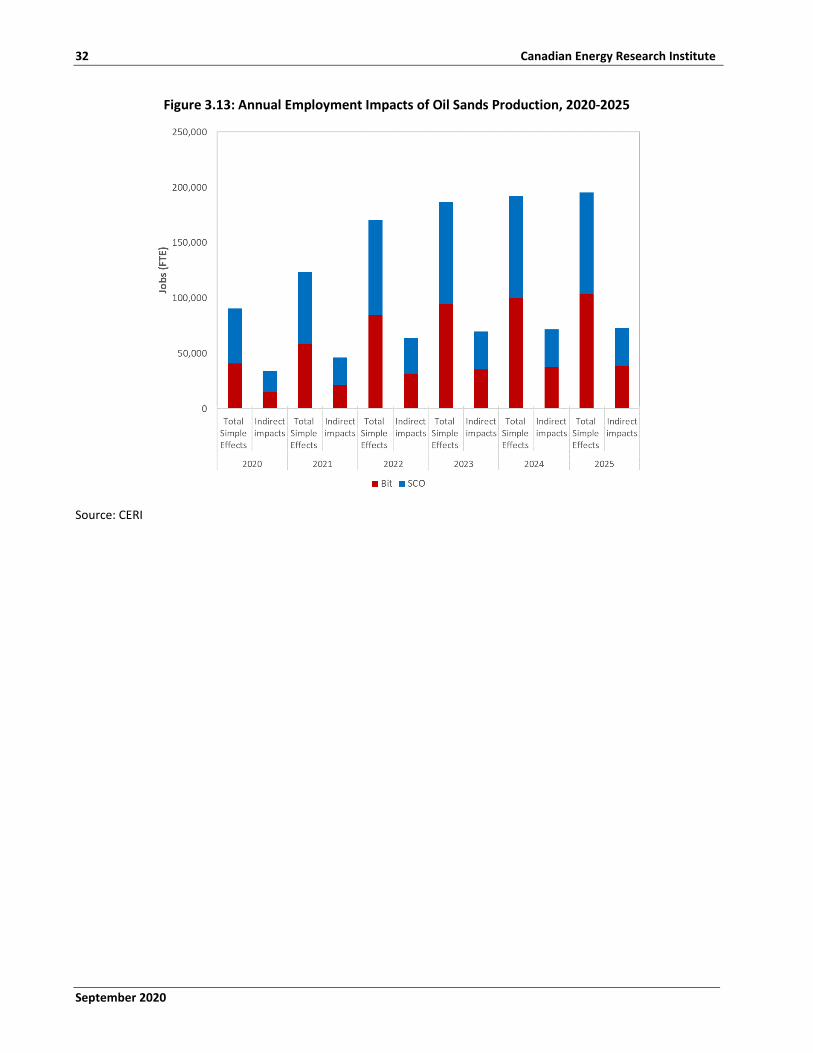
32 Canadian Energy Research Institute
September 2020
Figure 3.13: Annual Employment Impacts of Oil Sands Production, 2020-2025
Source: CERI
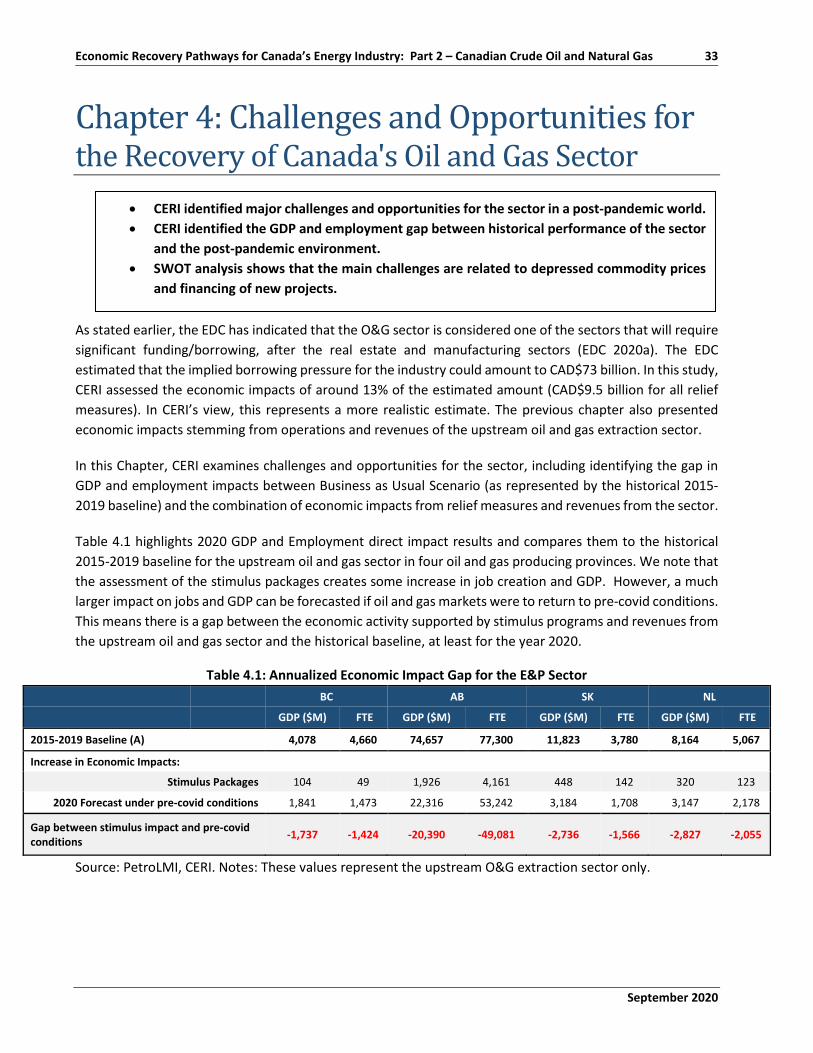
September 2020
Economic Recovery Pathways for Canada’s Energy Industry: Part 2 – Canadian Crude Oil and Natural Gas 33
Chapter 4: Challenges and Opportunities for the Recovery of Canada's Oil and Gas Sector
As stated earlier, the EDC has indicated that the O&G sector is considered one of the sectors that will require significant funding/borrowing, after the real estate and manufacturing sectors (EDC 2020a). The EDC estimated that the implied borrowing pressure for the industry could amount to CAD$73 billion. In this study, CERI assessed the economic impacts of around 13% of the estimated amount (CAD$9.5 billion for all relief measures). In CERI’s view, this represents a more realistic estimate. The previous chapter also presented economic impacts stemming from operations and revenues of the upstream oil and gas extraction sector.
In this Chapter, CERI examines challenges and opportunities for the sector, including identifying the gap in GDP and employment impacts between Business as Usual Scenario (as represented by the historical 2015-2019 baseline) and the combination of economic impacts from relief measures and revenues from the sector.
Table 4.1 highlights 2020 GDP and Employment direct impact results and compares them to the historical 2015-2019 baseline for the upstream oil and gas sector in four oil and gas producing provinces. We note that the assessment of the stimulus packages creates some increase in job creation and GDP. However, a much larger impact on jobs and GDP can be forecasted if oil and gas markets were to return to pre-covid conditions. This means there is a gap between the economic activity supported by stimulus programs and revenues from the upstream oil and gas sector and the historical baseline, at least for the year 2020.
Table 4.1: Annualized Economic Impact Gap for the E&P Sector
Source: PetroLMI, CERI. Notes: These values represent the upstream O&G extraction sector only.
BC AB SK NL
GDP ($M) FTE GDP ($M) FTE GDP ($M) FTE GDP ($M) FTE
2015-2019 Baseline (A) 4,078 4,660 74,657 77,300 11,823 3,780 8,164 5,067
Increase in Economic Impacts:
Stimulus Packages 104 49 1,926 4,161 448 142 320 123
2020 Forecast under pre-covid conditions 1,841 1,473 22,316 53,242 3,184 1,708 3,147 2,178
Gap between stimulus impact and pre-covid conditions -1,737 -1,424 -20,390 -49,081 -2,736 -1,566 -2,827 -2,055
• CERI identified major challenges and opportunities for the sector in a post-pandemic world. • CERI identified the GDP and employment gap between historical performance of the sector
and the post-pandemic environment. • SWOT analysis shows that the main challenges are related to depressed commodity prices
and financing of new projects.
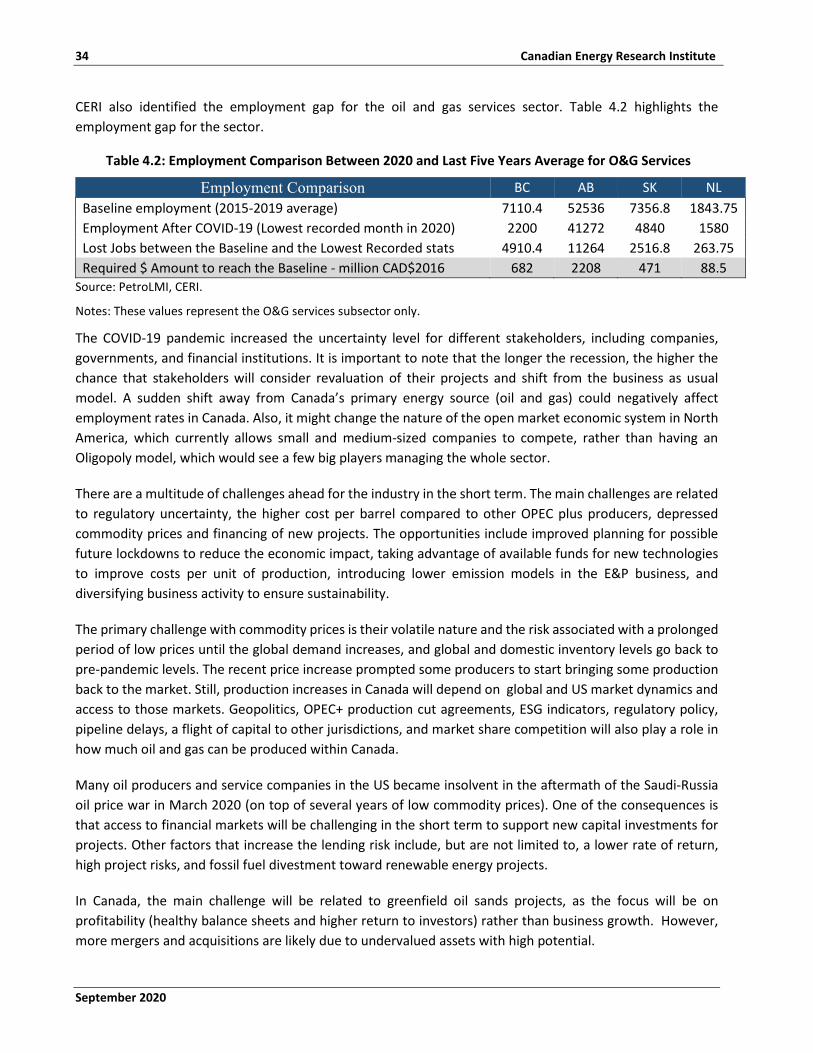
34 Canadian Energy Research Institute
September 2020
CERI also identified the employment gap for the oil and gas services sector. Table 4.2 highlights the employment gap for the sector.
Table 4.2: Employment Comparison Between 2020 and Last Five Years Average for O&G Services
Employment Comparison BC AB SK NL Baseline employment (2015-2019 average) 7110.4 52536 7356.8 1843.75 Employment After COVID-19 (Lowest recorded month in 2020) 2200 41272 4840 1580 Lost Jobs between the Baseline and the Lowest Recorded stats 4910.4 11264 2516.8 263.75 Required $ Amount to reach the Baseline - million CAD$2016 682 2208 471 88.5
Source: PetroLMI, CERI.
Notes: These values represent the O&G services subsector only.
The COVID-19 pandemic increased the uncertainty level for different stakeholders, including companies, governments, and financial institutions. It is important to note that the longer the recession, the higher the chance that stakeholders will consider revaluation of their projects and shift from the business as usual model. A sudden shift away from Canada’s primary energy source (oil and gas) could negatively affect employment rates in Canada. Also, it might change the nature of the open market economic system in North America, which currently allows small and medium-sized companies to compete, rather than having an Oligopoly model, which would see a few big players managing the whole sector.
There are a multitude of challenges ahead for the industry in the short term. The main challenges are related to regulatory uncertainty, the higher cost per barrel compared to other OPEC plus producers, depressed commodity prices and financing of new projects. The opportunities include improved planning for possible future lockdowns to reduce the economic impact, taking advantage of available funds for new technologies to improve costs per unit of production, introducing lower emission models in the E&P business, and diversifying business activity to ensure sustainability.
The primary challenge with commodity prices is their volatile nature and the risk associated with a prolonged period of low prices until the global demand increases, and global and domestic inventory levels go back to pre-pandemic levels. The recent price increase prompted some producers to start bringing some production back to the market. Still, production increases in Canada will depend on global and US market dynamics and access to those markets. Geopolitics, OPEC+ production cut agreements, ESG indicators, regulatory policy, pipeline delays, a flight of capital to other jurisdictions, and market share competition will also play a role in how much oil and gas can be produced within Canada.
Many oil producers and service companies in the US became insolvent in the aftermath of the Saudi-Russia oil price war in March 2020 (on top of several years of low commodity prices). One of the consequences is that access to financial markets will be challenging in the short term to support new capital investments for projects. Other factors that increase the lending risk include, but are not limited to, a lower rate of return, high project risks, and fossil fuel divestment toward renewable energy projects.
In Canada, the main challenge will be related to greenfield oil sands projects, as the focus will be on profitability (healthy balance sheets and higher return to investors) rather than business growth. However, more mergers and acquisitions are likely due to undervalued assets with high potential.
September 2020
Economic Recovery Pathways for Canada’s Energy Industry: Part 2 – Canadian Crude Oil and Natural Gas 35
One of the critical concerns for recovery is to consider how regulatory mechanisms affect Canada’s competitiveness. Global competitors may be able to adjust more quickly, which gives them the advantage to produce and export faster and make profits even at lower commodity prices. In a recent CERI study that investigated the Competitiveness of Canada's Regulatory Framework, it was found that Canada has a competitive disadvantage for large project investments such as pipelines and LNG projects, with regulatory uncertainty and the additional time needed in Canada to complete project reviews identified as the main issue (CERI 2020c).
On the other hand, there are some opportunities for the industry in Canada. The abundant natural resource base and proximity to desired markets (if access to markets is achieved) lend the sector an opportunity to monetize Canada’s resources. One of the benefits of previous downturns was learning how to be more efficient and drive operating and capital costs for projects down. With technology improvements, further diversification, ESG strategies, and regulatory improvements, Canada’s oil and gas sector can compete globally.
To summarize and present various challenges and opportunities, CERI conducted a SWOT analysis for the industry. Figure 4.1 illustrates the Strengths, Weaknesses, Opportunities and Threats for the industry and future development of Canadian oil and gas resources.
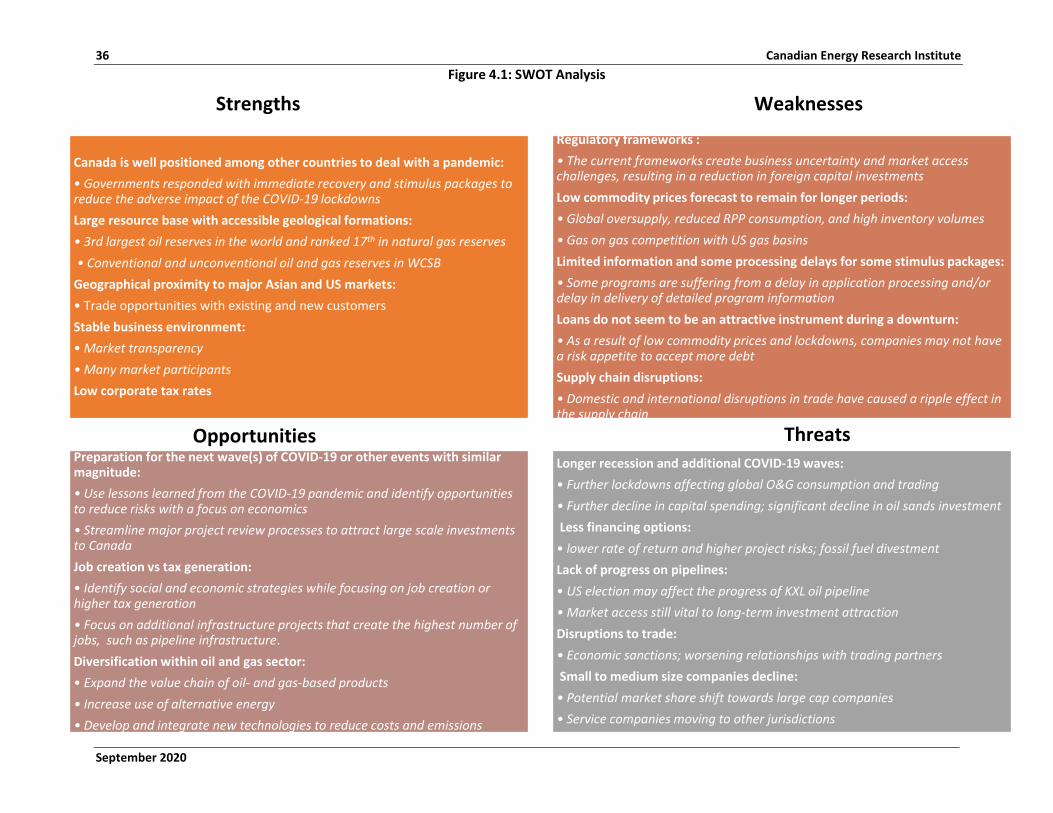
36 Canadian Energy Research Institute
September 2020
Figure 4.1: SWOT Analysis
Strengths Weaknesses
Opportunities Threats
Data source: CERI
Canada is well positioned among other countries to deal with a pandemic:• Governments responded with immediate recovery and stimulus packages to reduce the adverse impact of the COVID-19 lockdownsLarge resource base with accessible geological formations:• 3rd largest oil reserves in the world and ranked 17th in natural gas reserves • Conventional and unconventional oil and gas reserves in WCSB
Geographical proximity to major Asian and US markets:• Trade opportunities with existing and new customersStable business environment:• Market transparency• Many market participantsLow corporate tax rates
Regulatory frameworks :• The current frameworks create business uncertainty and market access challenges, resulting in a reduction in foreign capital investmentsLow commodity prices forecast to remain for longer periods:• Global oversupply, reduced RPP consumption, and high inventory volumes• Gas on gas competition with US gas basinsLimited information and some processing delays for some stimulus packages:• Some programs are suffering from a delay in application processing and/or delay in delivery of detailed program informationLoans do not seem to be an attractive instrument during a downturn:• As a result of low commodity prices and lockdowns, companies may not have a risk appetite to accept more debtSupply chain disruptions:• Domestic and international disruptions in trade have caused a ripple effect in the supply chain
Preparation for the next wave(s) of COVID-19 or other events with similar magnitude:• Use lessons learned from the COVID-19 pandemic and identify opportunities to reduce risks with a focus on economics• Streamline major project review processes to attract large scale investments to CanadaJob creation vs tax generation:• Identify social and economic strategies while focusing on job creation or higher tax generation• Focus on additional infrastructure projects that create the highest number of jobs, such as pipeline infrastructure.Diversification within oil and gas sector:• Expand the value chain of oil- and gas-based products• Increase use of alternative energy• Develop and integrate new technologies to reduce costs and emissions
Longer recession and additional COVID-19 waves:• Further lockdowns affecting global O&G consumption and trading• Further decline in capital spending; significant decline in oil sands investment Less financing options:
• lower rate of return and higher project risks; fossil fuel divestment Lack of progress on pipelines:• US election may affect the progress of KXL oil pipeline• Market access still vital to long-term investment attractionDisruptions to trade:• Economic sanctions; worsening relationships with trading partnersSmall to medium size companies decline:
• Potential market share shift towards large cap companies• Service companies moving to other jurisdictions
September 2020
Economic Recovery Pathways for Canada’s Energy Industry: Part 2 – Canadian Crude Oil and Natural Gas 37
Chapter 5: Conclusions This report is Part 2 of the four-part series analyzing the impact on the Canadian economy (nation-wide and province-specific) if the oil and gas sector were able to make use of relief programs relevant to the sector (either sector-specific or industry-wide relief programs). CERI shows that relief measures could aid in the recovery of the oil and gas sector in the immediate short term (2020-2022). This analysis shows that relief measures studied are not a panacea for a struggling sector or the governments that rely on ripple effects throughout other sectors and the overall economy. The economic impacts of operations of the sector highlight the fact that the most considerable economic impacts still stem from operations of the sector and not the government aid programs.
The longevity of the Canadian oil and gas sector, first and foremost, depends on the industry’s ability to compete on the world stage for capital investment to develop Canada’s oil and gas reserves. The ability to attract capital will be dependent on access to markets, regulatory certainty, new technology, industry’s ESG indicators, and value-added products.
As the research indicates, there are opportunities to increase the economic contribution of the oil and gas sector. Adapting to market trends is an important consideration, and CERI has identified the following themes for discussion and future research:
• Where does Canadian oil and gas fit in the global energy mix: o Canadian oil and gas competitiveness on the global cost curve o Product exports – LNG, crude oil, LPG, hydrogen o With changes in the market due to the pandemic, what does “success” mean for a
Canadian company? o What role does energy security play in the debate?
• How does the sector shift in terms of ESG metrics, standardization and reporting:
o What ESG metrics to report? o What framework to adopt? o Do recently introduced carbon tariffs in Europe level the playing field for energy exports
coming from countries that have a domestic carbon policy, like Canada, versus exports coming from jurisdictions that don’t, like the US?
o How do Canadian regulations fit with ESG reporting? o How does Canada address the issue of “carbon leakage”?
• Technological Innovation:
o What technologies need to be adopted and commercialized to reduce the environmental footprint and cost structure of the sector?
o Are there disruptive technologies in other sectors that the oil and gas sector can adopt? o Are there different business models that allow for more rapid adoption of technological
breakthroughs?

38 Canadian Energy Research Institute
September 2020
o What role do governments and academia play?
• “Knowing is not enough; We must apply. Willing is not enough; We must do.” (Bruce Lee): o What is the sector doing well, and where does it need to improve? o How do companies and governments address risks – market, regulatory, environmental,
business?
September 2020
Economic Recovery Pathways for Canada’s Energy Industry: Part 2 – Canadian Crude Oil and Natural Gas 39
Bibliography AltaCorp Capital. 2020. “Energy Services Impact of the Federal Well Abandonment Aid Package.”
BC Oil and Gas Commission. 2019. “Orphan Site Reclamation Fund Annual Report.” https://www.bcogc.ca/files/reports/Technical-Reports/2017-18-and-2018-19-orphan-site-reclamation-fund-annual-report.pdf.
BDC. 2020a. “Mid-Market Financing Program | BDC.Ca.” 2020. https://www.bdc.ca/en/pages/mid-market-financing-program.aspx.
———. 2020b. “New Small and Medium-Sized Enterprise Loan and Guarantee Program to Help Ease Access to Credit for Entrepreneurs Impacted by COVID-19.” BDC. March 27, 2020. https://www.bdc.ca/en/about/mediaroom/news_releases/pages/new-small-medium-sized-enterprise-loan-guarantee-program-help-ease-access-credit-entrepreneurs-impacted-covid-19.aspx.
———. 2020c. “Business Credit Availability Program (BCAP).” Overview of SME Loan and Guarantee Program. April 27, 2020. https://www.bdc.ca/en/documents/special-support/BCAP-program-overview-external.pdf.
———. 2020d. “Canada Emergency Business Account (CEBA).” BDC. July 7, 2020. https://www.bdc.ca/en/pages/canada-emergency-business-account-ceba.aspx.
Bennett Jones. 2020. “British Columbia Announces Funding to Clean Up Orphan and Inactive Wells.” Brad Gilmour. 2020. https://www.bennettjones.com:443/Blogs-Section/British-Columbia-Announces-Funding-to-Clean-Up-Orphan-and-Inactive-Wells.
Bloomberg News. 2020. “No LEEFF Loans Were Approved in Program’s First Month - BNN Bloomberg.” BNN. June 24, 2020. https://www.bnnbloomberg.ca/no-leeff-loans-were-approved-in-program-s-first-month-1.1455697.
Canada Revenue Agency. 2020. “Canada Emergency Wage Subsidy (CEWS).” Aem. 2020. https://www.canada.ca/en/revenue-agency/services/subsidy/emergency-wage-subsidy.html.
CAPP. 2019. “Statistical Handbook.” Canadian Association of Petroleum Producers. 2019. https://www.capp.ca:443/publications-and-statistics/statistics/statistical-handbook.
CERI. 2019a. “Canadian Crude Oil and Natural Gas Production, Supply Costs, Economic Impacts and Emissions Outlook (2019-2039).” Study No. 182. Calgary, AB: Canadian Energy Research Institute. https://ceri.ca/assets/files/Study_182_Full_Report.pdf.
———. 2019b. “Canadian Oil Sands Supply Costs and Development Projects (2019-2039).” https://ceri.ca/assets/files/Study_183_Full_Report.pdf.
———. 2020a. “Canadian Crude Oil and Natural Gas Production and Emissions Outlook (2020-2039).” https://ceri.ca/studies/canadian-crude-oil-and-natural-gas-production-and-emissions-outlook-2020-2039.
———. 2020b. “Canadian Oil Sands Production and Emissions Outlook (2020-2039).” https://ceri.ca/studies/canadian-oil-sands-production-and-emissions-outlook-2020-2039.
40 Canadian Energy Research Institute
September 2020
———. 2020c. Competitiveness of Canada’s Regulatory Framework for the Oil and Gas Sector. https://ceri.ca/studies/competitiveness-of-canadas-regulatory-framework-for-the-oil-and-gas-sector.
C-NLOPB. 2020. “Statistical Information.” C-NLOPB. 2020. https://www.cnlopb.ca/information/statistics/.
CPA. 2020. “Federal Government COVID-19 Tax Updates.” 2020. https://www.cpacanada.ca/en/members-area/profession-news/2020/march/cra-covid19-updates.
CRA. 2020. “Approved Canada Emergency Wage Subsidy (CEWS) Claims by Period and Industry Sector.” https://www.canada.ca/content/dam/cra-arc/serv-info/tax/business/topics/cews/statistics/cews-p1-p4-tbl2-e.pdf.
Deloitte. 2020. “COVID 19: Government Financing Programs for Small to Medium-Sized Business.” 2020. http://www.chamber.ca/resources/pandemic-preparedness/Financing_BCAP_POV_EN.pdf.
Department of Finance Canada. 2018. “Annual Financial Report of the Government of Canada Fiscal Year 2017–2018.” Not available. Aem. October 19, 2018. https://www.canada.ca/en/department-finance/services/publications/annual-financial-report/2018/report.html.
EDC. 2020a. “Challenges Mount for Many Canadian Sectors.” https://www.edc.ca/en/guide/covid-19-sector-challenges-in-canada.html.
———. 2020b. “COVID-19 Literature Review.” 2020. https://www.edc.ca/en/guide/covid-literature-review.html?utm_source=linkedin&utm_medium=social-paid&utm_campaign=comms_social&utm_content=covid-literature-review_aug-20_e.
———. 2020c. “EDC BCAP Guarantee – Frequently Asked Questions.” 2020. https://www.edc.ca/en/financial-institutions/bcap-fi-guide/frequently-asked-questions.html.
———. 2020d. “EDC Announces Expanded Support for Canadian Companies during the COVID-19 Crisis.” May 11, 2020. https://www.edc.ca/en/about-us/newsroom/edc-coronavirus-medium-sized-support.html.
ESAA. 2020. “SRP Survey Results.” 2020. https://www.esaa.org/srp-survey/.
Government of Alberta. 2020a. “Alberta Tax Overview.” 2020. https://www.alberta.ca/taxes-levies-overview.aspx.
———. 2020b. “Site Rehabilitation Program – Apply for a Grant.” 2020. https://www.alberta.ca/site-rehabilitation-program-apply-for-a-grant.aspx.
———. 2020c. “Site Rehabilitation Program – Grant Funding Status.” 2020. https://www.alberta.ca/site-rehabilitation-program-grant-funding-status.aspx.
———. 2020d. “Tenure_Extensions_for_Petroleum_and_Natural_Gas_Agreements,_Oil_Sands_Agreements,_and_Metallic_and_Industrial_Permits,” May, 1.
Government of Alberta, Park. 2020e. “Site Rehabilitation Program Application Information and Guidelines.” https://www.alberta.ca/assets/documents/energy-site-rehabilitation-program-guidelines.pdf.
Government of British Columbia. 2020a. “Dormant Sites Reclamation Program - Province of British Columbia.” Province of British Columbia. 2020.
September 2020
Economic Recovery Pathways for Canada’s Energy Industry: Part 2 – Canadian Crude Oil and Natural Gas 41
https://www2.gov.bc.ca/gov/content/industry/natural-gas-oil/responsible-oil-gas-development/dormant-sites-reclamation-program.
———. 2020b. “Taxes & Tax Credits - Province of British Columbia.” Province of British Columbia. 2020. https://www2.gov.bc.ca/gov/content/taxes.
Government of Canada. 2020a. “Emissions Reduction Fund.” Natural Resources Canada. 2020. https://www.nrcan.gc.ca/science-data/funding-partnerships/funding-opportunities/current-funding-opportunities/emissions-reduction-fund/22781.
———. 2020b. “LEEFF Factsheet.” 2020. https://www.cdev.gc.ca/leeff-factsheet/.
———. 2020c. “Prime Minister Announces Additional Support for Businesses to Help Save Canadian Jobs.” Prime Minister of Canada. May 11, 2020. https://pm.gc.ca/en/news/news-releases/2020/05/11/prime-minister-announces-additional-support-businesses-help-save.
———. 2020d. “Canada Emergency Business Account (CEBA).” July 22, 2020. https://ceba-cuec.ca/.
Government of Saskatchewan. 2000. The Income Tax Act.
———. 2018. “Saskatchewan Oil and Gas Orphan Fund Annual Report for 2017-18.” https://pubsaskdev.blob.core.windows.net/pubsask-prod/107676/107676-2017-18OrphanWellsAnnualReport.pdf.
———. 2020a. “$12 Million Of Work Approved In First Tranche Of Well Abandonment Program.” Government of Saskatchewan. 2020. https://www.saskatchewan.ca/government/news-and-media/2020/july/16/accelerated-site-closure-program.
———. 2020b. “Accelerated Site Closure Program.” Government of Saskatchewan. 2020. https://www.saskatchewan.ca/business/agriculture-natural-resources-and-industry/oil-and-gas/accelerated-site-closure-program.
———. 2020c. “SSBEP Program Overview and Application Instructions.”
Innovation Government of Canada. 2020. “Regional Relief and Recovery Fund: COVID-19 - Innovation, Science and Economic Development Canada.” About Us. Innovation, Science and Economic Development Canada. July 3, 2020. https://www.ic.gc.ca/eic/site/icgc.nsf/eng/h_07682.html.
Jessica Owen. n.d. “Federal Procurement Shifts to Made-in-Canada Solutions for PPE.” OrilliaMatters.Com. Accessed September 1, 2020. https://www.orilliamatters.com/coronavirus-covid-19-local-news/federal-procurement-shifts-to-made-in-canada-solutions-for-ppe-2318198.
KPMG. 2020. “Canada: Tax Developments in Response to COVID-19 - KPMG Global.” KPMG. 2020. https://home.kpmg/xx/en/home/insights/2020/04/canada-tax-developments-in-response-to-covid-19.html.
Lim, Jolson. 2020. “LEEFF Program Remains Untouched by Big Business.” IPolitics (blog). June 16, 2020. https://ipolitics.ca/2020/06/16/leeff-program-remains-untouched-by-big-business/.
Lummus Technology. 2020. “Lummus Technology’s Olefins Conversion Technology (OCT): A Sustainable Path to Propylene.”
Ministry of Energy, Mines and Petroleum. 2020. “Dormant Well Clean-up Program Nearly Fully Subscribed on First Day.” 2020. https://archive.news.gov.bc.ca/releases/news_releases_2017-2021/2020EMPR0015-000949.htm.
42 Canadian Energy Research Institute
September 2020
Myra. 2020. “Large Employer Emergency Financing Facility (LEEFF) Program.” Mentor Works Ltd. (blog). May 25, 2020. https://www.mentorworks.ca/blog/government-funding/large-employer-emergency-financing-facility/.
OWA. 2020. “OWA 2019 Annual Report.” 2020. http://www.orphanwell.ca/wp-content/uploads/2020/06/OWA-Annual_2019.pdf.
PBO. 2020. “Scenario Analysis Update" COVID-19 Pandemic and Oil Price Shocks.” June 18, 2020. https://www.pbo-dpb.gc.ca/web/default/files/Documents/Reports/RP-2021-009-S/RP-2021-009-S_en.pdf.
Poole, Erik. 2005. “A Concise Description of Statistics Canada’s Input-Output Models.” Canadian Journal of Regional Science 18 (2): 255–70.
PSAC. 2019. “Well Closure Workforce Study.” https://www.psac.ca/Studies/2019_12_Well_Closure_Workforce.pdf.
Quan, Holly. 2020. “Federal Oil and Natural Gas Liquidity Aid Explained.” Context Magazine by CAPP. 2020. https://context.capp.ca:443/articles/2020/article-petroleum-101-federal-funding-explainer-story.
RBC. 2020. “RBC Clients Can Now Access the Export Development Canada Business Credit Availability Program.” 2020. http://www.rbc.com/newsroom/news/2020/20200417-edc-launch.html.
Rennie, Lisa. 2020. “What Is The Canada Emergency Business Account (CEBA)?” Loans Canada (blog). 2020. https://loanscanada.ca/business/what-is-the-canada-emergency-business-account-ceba/.
Scotia Bank. 2020. “The BDC BCAP Mid-Market Financing Program | Scotiabank Canada.” 2020. https://www.scotiabank.com/content/scotiabank/ca/en/personal/scotia-support/business-banking/commercial/bdc-bcap-mid-market-financing-program.html.
Sproule. 2020. “Sproule Price Forecast.” Sproule. 2020. https://sproule.com/price-forecast/.
Statistics Canada. 2018. “Supply and Use Tables, Detail Level, Provincial and Territorial.” March 13, 2018. https://www150.statcan.gc.ca/t1/tbl1/en/cv.action?pid=3610047801.
———. 2020a. “Employment by Industry, Monthly, Unadjusted for Seasonality.” 2020. https://www150.statcan.gc.ca/t1/tbl1/en/tv.action?pid=1410020101.
———. 2020b. “Gross Domestic Product (GDP) at Basic Prices, by Industry, Monthly.” 2020. https://www150.statcan.gc.ca/t1/tbl1/en/tv.action?pid=3610043401.
Thornton, Grant. 2020. “New Credit and Loan Programs through the Business Credit Availability Program (BCAP) and the Business Development Bank of Canada (BDC).” Grant Thornton. 2020. https://www.grantthornton.ca/globalassets/1.-member-firms/canada/insights/covid-19-downloadable-resources/gt-20-154-bcap-article_3_partial.pdf.
Varcoe, Chris. 2020. “Varcoe: Federal Help Finally Set to Arrive, but Is It Too Late for the Oilpatch?” Calgary Herald. 2020. https://calgaryherald.com/opinion/columnists/varcoe-federal-help-finally-set-to-arrive-but-is-it-too-late-for-the-oilpatch.
September 2020
Economic Recovery Pathways for Canada’s Energy Industry: Part 2 – Canadian Crude Oil and Natural Gas 43
Appendix A: Federal and Provincial Relief Measures Relief Measures by Categories Credit-Loans Canada Emergency Business Account (CEBA)
Small businesses experiencing many challenges during these uncertain times birthed the Canada Emergency Business Account (CEBA) program to assist in capital expenditure. The program aims to normalize product services to the community as well as create and maintain employment. The Government of Canada has made available CAD$55 billion for small business in all sectors, inclusive of the oil and gas sector, and up to CAD$40,000 with zero-interest (Government of Canada 2020d). A pardonable repayable balance of 25% conducted over full loan repayment on or before the 31st of December 2022 is incorporated (BDC 2020d).
However, where repayment of the loan is not feasible at the stipulated time, a 3-year installment plan could be organized with a five percent interest rate starting from the 1st of January 2023, to the 31st of December 2025. At this deadline, the businesses must pay the entirety of the loan amount plus accrued interest. Failure to repay might prompt the government to devise further solutions to assist companies across Canada.
Eligibility for this loan ties intrinsically to having a viable Canadian business with involvement in the Federal taxation system as well as Financial institutions. Nonetheless, prospective applicants with a payroll less than CAD$20,000 have to prove eligibility for a non-deferrable expense (between CAD$40,000 and CAD$1,500,000 in 2020). Owners of more than one business are eligible, provided they are registered with separate CRA Business numbers and not operating the business (es) on a Personal Bank Account (Rennie 2020).
Loan Guarantee for Small and Medium-Sized Enterprises
The Federal Government, through the Export Development Bank (EDC), provides short-term loans to small and -medium-sized businesses with access to over CAD$6.25 million in funds to accommodate operating costs such as payroll and rent (BDC 2020c). This program, known as the EDC Loan Guarantee Program, offers flexible terms on extended repayment time and benefits of six months’ initial payment deferral. It is administered through the applicant’s financial institution through new operating lines of credit and termed loans with the loan size at the discretion of the financial institutions (Deloitte 2020).
However, EDC serves as a surety to financial institutions of prospective creditors on most of the borrowed liquidity to ensure increased access to credit and cash flow for business operations. The maturity rate of the loan is five years maximum without a stipulated repayment period. However, the repayment terms
44 Canadian Energy Research Institute
September 2020
include 100% repayment at maturity date and exclude fixed interest rates, accommodating variable rates over the lifespan of the loan (EDC 2020c).
Nevertheless, the Export Bank of Canada (EDC) charge an interest of 1.8% yearly on the loans with options of paying quarterly or deferring for up to 6 months. According to BDC, businesses could obtain funds from more than two relief programs (RBC 2020). In addition to the EDC Loan Guarantee program, the Federal Government has other relief measures enveloped under the BCAP program, namely, the Co-Lending Program, Mid Market Financing Program, Mid Market Guarantee and Financing Program as well as the Large Employer Emergency Financing Facility (LEEFF).
Co-Lending Program for Small and Medium-Sized Enterprises
The Co-Lending Program, as the name implies, incorporates loans that are risk-shared by both the prospective small- to medium-sized businesses’ financial institutions and the Business Development Bank of Canada (BDC). This program was announced on the 27th of March 2020 to have CAD$40 billion as an additional lending option to assist businesses. Two streams of lending are involved in this program. The first stream includes the incremental loan amounts of equal to CAD$5 million, constituting 80% of the total additional loan assured and payable by BDC. In comparison, the second stream is 20% payable by the prospective businesses’ financial institution (BDC 2020b).
Furthermore, eligibility is based on the direct or indirect impact of COVID-19 on business finances. Three thresholds distinguish businesses and promote understanding of loan variability. Businesses with annual revenues above CAD$50 million could access a maximum loan amount of CAD$12.5 million with a maximum BDC contribution of CAD$10 million. Businesses with annual revenues of more than CAD$1 million but less than CAD$50 million, and those with incomes less than 1 million each, could receive maximum loan amounts of CAD$3.125 million and CAD$312 500, respectively. The maturity date for the annual revenues in all thresholds is a maximum of 10 years with a repayment period of 20 years (Thornton 2020; BDC 2020c).
Mid-Market Financing and Mid-Market Guarantee and Financing Programs
The Mid Market Financing Program and the Mid Market Guarantee and Financing Program are both available under the BCAP and are somewhat similar with distinctive differences:
The Mid Market Financing is a junior loan between CAD$12.5 million and CAD$60 million for medium-sized businesses. In comparison, the Mid Market Guarantee and Financing Program is an expanded program that loans to midsize companies CAD$16.75 million to a maximum of CAD$80 million.
The Mid Market Financing program helps to relieve companies with revenues of CAD$100 million to CAD$500 million while the Mid Market Guarantee and Financing program assists in the relief of companies with revenues of CAD$50 million and CAD$300 million.
The Mid Market Financing Program is a merger with the Oil and Gas Financing Programs assisting and managing loan requests. The loan for this program spans four years, after which a balloon payment of the principal amount is required. Interest rates are capitalized for the first year, and payments are due at the
September 2020
Economic Recovery Pathways for Canada’s Energy Industry: Part 2 – Canadian Crude Oil and Natural Gas 45
maturity date (BDC 2020a; EDC 2020d). The loan is 90% financed by the BDC and 10% by respective financial institutions (Scotia Bank 2020).
Large Employer Emergency Financing Facility
LEEFF was announced on the 11th of May 2020 as a new component of the economic response plan to bridge financing of large companies that cannot access funds through conventional routes. Large companies capable of withstanding the hit of COVID-19 are excluded from this program (Myra 2020). The eligibility criteria focus on the impact of the prospective applicants to the Canadian economy, the company’s ability to demonstrate annual revenue of CAD$300 Million as well as a minimum loan size of CAD$60 million. The aggregate loan amounts to 80% for an unsecured facility, which accumulates an interest rate of 5% payable quarterly with an incremental 2% increase per annum and a loan size of 20% with an interest rate based on the applicant’s current debts for a secured facility. This program, overseen by the Canada Enterprise Emergency Funding Corporation, has a repayment plan of 5 years for an unsecured facility and a loan duration equivalent to the existing debts for secured loans (Government of Canada 2020c).
Subsidies
Canada Emergency Wage Subsidy (CEWS)
The CEWS program aims to support businesses with a subsidy of 75% of employee wages to protect and prevent job losses and provide opportunities to rehire laid-off employees. Since the 15th of March 2020, 3 million jobs have been sustained or restored. The Government of Canada has announced the extension of the program until the 19th of December 2020, to support more businesses whose business revenue is equal to orbelow 30% of revenue realized prior to COVID-19. Though oil and gas companies were not explicitly listed under the eligible businesses, they can be classified under businesses with income tax obligations. The extension of the CEWS program supports a wide range of businesses that need to recover slowly from the COVID 19 surge (Canada Revenue Agency 2020).
Alberta
Oil and Gas Tenure Extension
As part of the COVID-19 relief measures, the Alberta Government announced a one-year extension for Mineral agreements. According to the replacement information letter 2020-21, the extension falls under the agreements and permits related to the Mines and Minerals Act, expiring in the period from March 2020 to March 2021. This program aims to assist businesses in raising capital and planning for activities futuristically within the extended timeline, thereby construing an optimistic economy in this period.
In as much as the Petroleum and Natural Gas Regulation indicates usual channels for application for extensions and continuation of projects, that is, PNG Tenure Reg. sections 16,17 and 18, and Alberta Energy’s inexplicit Information letter 2020-09 about the matter (Government of Alberta 2020d); inference renders that the one-year extension could apply to the PNG Tenure Regulation. However, the Information
46 Canadian Energy Research Institute
September 2020
letter 2020-21 presents that Alberta Energy is sure to grant a one-year extension under section 8(1)(h) of the Mines and Minerals Act (Government of Alberta 2020d).
Though there are no specific timeframes for reviewing agreements to ensure the timely launch of the one-year extension, Alberta Energy encourages the prompt assessment and application of relevant contracts within the stipulated expiry timeframe to utilize the extension benefits.
WCB Premium Payments (Small and Medium)
Alberta Government, in its announcement in March, stated the deferral of the 2020 Workers’ Compensation Board’s premium of all private companies to 2021. For this deferral, all private companies are automatically eligible, inclusive of charitable companies with premium coverage in place, before the 23rd of March 2020. Furthermore, private companies that might have paid towards their 2020 premium receive a reimbursement and an automatic deferral, while WCB advises those who might have received premium invoices to ignore.
Also, the Alberta Government proclaimed that 50% of 2020 WCB premiums would be waived for small and medium private sector companies when premiums resume in 2021. Small and medium-sized companies with insurable earnings of CAD$10 million or less are eligible for this discount. The waivers are to begin on or after February 2021, with a total value of CAD$350 million and no direct cost to qualified companies.
Saskatchewan
Oil and Gas Administrative Levy and Invoice Delay
This measure aims to relieve immediate fluidity and administrative challenges in the oil and gas sector by providing a 50% reduction of the administrative levy portion stipulated for this year and delaying the balance invoice until October 2020. The cut back in administrative levy values at CAD$11 million to the sector. The Saskatchewan Government states that the sector faces tremendous challenges due to COVID-19 and oil price fall, causing land sales to decline.
Tax Deferrals
Federal
Income Tax Deferral
As a response to COVID-19, the Canadian Federal Government has announced several tax aids and deferral possibilities. The government has allowed a total of CAD$55 billion in tax deferrals as part of the CAD$95 billion COVID-19 Economic Response Plan to support and stabilize the Canadian economy and various businesses across the country. The tax deferral forms about 58% of the total government response plan expenditure, as announced in Q1 2020. The Canada Revenue Agency, CRA, has extended the income tax deadline providing flexibility for firms, organizations, individuals and registered charities. Corporations could benefit from the extended timeline which could allow for for reallocation of the tax payment to
September 2020
Economic Recovery Pathways for Canada’s Energy Industry: Part 2 – Canadian Crude Oil and Natural Gas 47
capital expenditure to stabilize their business activities. This approach could encourage firms to file their total income tax with flexibility as fines or interest as well as relevant grants and subsidies plans may be negligible. Additionally, the time extension could help businesses in filing the non-capital loss to reduce income tax. In the meantime, government bodies may disallow extensive tax deferral periods, as public and major national projects might be impacted, especially in planning and execution phases, with similar effects on the provincial level.
Sales Tax/Income Duty Deferral
Businesses were permitted to defer sales tax, including goods, services and harmonized sales tax, until the 30th of June 2020, for the amounts owed between the end of March and June 2020.
In addition, the customs duty for importers was deferred to the 30th of June; however, the Canada Border Services Agency (CBSA) also temporarily suspended import and export activities to allow for the assessment of relief applications. The CBSA suspension continues to impact the production of several industries, namely the oil and gas import/export sector, and tax deferrals may provide some relief (CPA 2020).
British Columbia
In British Columbia, the government aligned with other jurisdictions and announced an immediate extension of filing for provincial sales tax to the end of September (Government of British Columbia 2020b). The extended period should help local businesses retain cashflow and capitalize on funds for a prolonged interval. Comparable to the municipal and regional district tax, relief for regional house owners and habitats should supersede. Likewise, carbon and motor fuel tax filing and payment have been granted a deadline for submission by the 30th of September 2020. Corporations could defer payments of employer health tax for 2019 if their payroll exceeds CAD$500,000; however, there are exemptions for businesses with a salary less than this amount for the same calendar year.
Alberta
Provincially, the Government of Alberta has started tax payment deferrals (Government of Alberta 2020a). Local businesses in Alberta are to pay the corporate income tax owed between the 18th of March and 31st of August 2020 by the extended deadline; however, no tax deferral applies to owed taxes before the 18th of March (KPMG 2020). Corporations were also permitted to submit an AT1 filing for a corporate income tax return by June 1, 2020, for returns between the 18th of March and the 1st of June 2020. In contrast, the AT1 filing deadline for June, July and August returns has been extended until the 1st of September 2020. Also, the Government of Alberta offered businesses six months of tax deferral on educational properties as an essential endeavour to assist enterprises in managing their credits and maintaining their personnel.
In Alberta, premium payment for Workers Compensation Board (WCB) requirements has been deferred until early 2021 for large private organizations, with an option for businesses that have already paid to apply for reimbursement (Government of Alberta 2020a). The local government in Alberta is committed
48 Canadian Energy Research Institute
September 2020
to approximately CAD$350 million, covering 50% of the WCB premium for small and medium enterprises. Some large organizations in Alberta could benefit from the premium deferralby investing in the acquisition of local small or medium enterprises according to financial capacity. Llarge businesses could benefit from joining forces with smaller sized businesses, as well as taking advantage of the current tax benefits and government grants and subsidies such as fund capitalization, rather than tax payments.
Saskatchewan
In Saskatchewan, businesses that are facing cashflow issues, due to COVID-19 and provincial sales tax remittance challenges, are currently offered filing and settlement relief, in the form of a three-month extension. The Government of Saskatchewan is encouraging local businesses to re-organize and establish settlement arrangements. However, the extension may be insufficient to provide robust financial assistance to struggling companies. Also, the audit program and compliance activities have been suspended indefinitely due to the audit costs such as travelling expenses. In contrast, corporations may be better suited to prioritize work health and safety. (KPMG 2020; Government of Saskatchewan 2000).
Additionally, local companies could benefit from no interest or late charges applied to utility bills up to six months. Such a program gives a substantial boost, especially to production industries relying heavily on utilities. In this period, businesses could optimize their plans and usage of services to recover while upholding a resilient cashflow. Alternatively, some businesses could flexibly plan their business termination, with zero extra utilities late charges or interests.
Similar to the Government of Alberta, the Government of Saskatchewan has extended the deadline for payment of WCB premiums, with a more rigid deadline, to the end of July 2020. The Government of Alberta’s WCB premium payment deferral provides companies with an extended period, as well as a fee waiver, depending on the scale.
Saskatchewan has also provided a 50% reduction of ‘Administrative Levy’ for this financial year, which remits nearly CAD$11.4 million back to the sector to deal with liquidation risks. The administrative levy, formally known as ‘Well Levy’, comprises licensing, reviewing plans and permits, inspections, reporting of production, abandonment of relevant facilities and environmental reviews. This type of provincial assistance provides the oil and gas sector with the potential to enhance compliance activities while reducing or expanding business activities.
Grants
Federal
Orphan and Inactive Well Cleanup
An inactive well is a well that has ceased to operate, but has yet to be permanently abandoned. An orphan well refers to a well site that has been taken out of production, without any party legally or financially responsible to deal with decommissioning and reclamation obligations. In April 2020, CAD$1.7 billion was announced to clean up orphaned and abandoned oil and gas wells in Western Canada.
September 2020
Economic Recovery Pathways for Canada’s Energy Industry: Part 2 – Canadian Crude Oil and Natural Gas 49
British Columbia
British Columbia received CAD$120 million of the federal funding program. The Government of British Columbia has identified the following restoration categories:
• Dormant Sites Reclamation program is designed to use CAD$100 million to reclaim oil and gas wells that have been inactive for five years. The program provides 50% of the costs for total site cleanup.
• Orphan Sites Supplemental Reclamation Program is designed to use CAD$15 million to reclaim oil and gas sites that have no operator history.
• Legacy Sites Reclamation Program is designed to use CAD$5 million to reclaim historical sites of oil and gas activities that have continued to impact the environment and the customary use of Indigenous communities.
Since the 25th of May 2020, British Columbia has received approximately 1000 applications from over 60 service contractors identifying more than 2400 inactive or abandoned wells.
Alberta
Alberta received CAD$1.2 billion. Funds were allocated to the Government of Alberta and the Alberta Orphan Well Association (OWA) at a ratio of 5:1, respectively. The Government of Alberta has identified CAD$1 billion for its Site Rehabilitation program, intended for the reclamation of wells, pipeline and other upstream oil and gas infrastructure. Since the 31st of July, 35,758 of 36,134 applications have been processed. 376 applications were unsuccessful based on incomplete application, inaccuracies and unqualified sites contained in the application (Government of Alberta 2020e). In total, funds worth CAD$118.8 million have been approved to over 100 Alberta-based companies. Applications combine to create more than 700,000 work hours, as stipulated in the applications (Government of Alberta 2020c) (Government of Alberta, 2020b). The OWA received CAD$200 million in addition to a pre-COVID-19 repayable loan of CAD$100 million to assist with reclamation work already underway. (OWA 2020).
Saskatchewan
In Saskatchewan, the grant of CAD$400 million has led to the launch of the Accelerated Site Closure program. The program, divided into phases to accelerate the reclamation process, is designed to clean up abandoned wells and reclaim inactive wells and facilities. The first phase provides CAD$100 million in funds to the service sector for the reclamation of abandoned wells. There are no updates on the statistics of reclaimed wells as of the publishing of this study.
REGIONAL RELIEF RECOVERY FUND (RRRF)
As COVID-19 continued to propagate across Canada, causing damage and destruction to businesses, organizations and workers, the Government of Canada implemented further assistance in an effort to provide business continuity, help manage financial burden and support various projects in preparation for the recovery phase. Th RRRF initiative makes available CAD$1 billion in support, comprised of the following two components:
50 Canadian Energy Research Institute
September 2020
• CAD$675 million funding to businesses, regional economies and communities in all Canadian regions
• CAD$287 million financing to small businesses and rural communities across Canada
Financial support is allocated to each region based on their individual needs. Allocation is as follows (Innovation Government of Canada, 2020):
• Atlantic Canada Opportunities Agency (ACOA) – CAD$110 million
• Canada Economic Development for Quebec Regions (CEDQ) – CAD$211 million
• Federal Economic Development Agency for Southern Ontario (FedDev) – CAD$252.4 million
• Federal Economic Development Initiative in Northern Ontario (FedNor) – CAD$49.5 million
• Western Economic Diversification Canada (WD) – CAD$342.8 million
• Canadian Northern Economic Development Agency (CanNOr) – CAD$34.3 million
The RRRF is created to complement and close gaps of other government relief measures that might have rendered some small and medium businesses incapacitated in acquiring financing for continuous operations. It also assists in situations where other obtained governmental relief measures did not adequately address business hardships. It should be noted that businesses are required to apply for other administrative relief measures before applying to RRRF for consideration (Innovation Government of Canada 2020).
Emissions Reduction Fund
Methane is the second-largest greenhouse gas in Canada, contributing 15% to overall emissions. On the 17th of April 2020, the Government of Canada announced the CAD$750 million relief measure to combat methane emissions as part of the job protection package. This fund is repayable and is designed to reduce pollution, protect jobs, assistwith research and development schemes as well as increase competitiveness for businesses in the sector. 10% of the total allocation is to offshore sector companies to reduce methane emissions in that area while the remaining CAD$675 million is for onshore oil and gas companies.
Alberta
Relaunch Funding
This grant specifies financial assistance to Alberta small- and- medium businesses, corporations and not-for-profit organizations that experienced operational closure and lost almost half of regular revenue due to COVID-19. The Government of Alberta has pledged a one-time payment of CAD$200 million to eligible organizations to offset relaunch costs including physical barrier implementation, rent and workers wage amount, PPEs and disinfectant purchases, amongst others. These costs are covered to a maximum of
September 2020
Economic Recovery Pathways for Canada’s Energy Industry: Part 2 – Canadian Crude Oil and Natural Gas 51
CAD$5000 per organization based on a 15% calculation of the eligible organizations’ monthly revenue prior to COVID-19.
Organizations must meet all criteria in order to access financial assistance. Criteria includerecognition as a legal entity (e.g. corporation registered under the Business Corporations Act), possess below 500 workers, not applied to any Federal grant for the same purpose and many more. It is important to note that sourcing of the appropriate grant is paramount as awarded applicants may be audited to verify their claimed financial positions.
Saskatchewan
Saskatchewan Small Business Emergency Payment (SSBEP)
Similar to Alberta, the Government of Saskatchewan provided financial support for small businesses who experienced an impact to operations as a result of COVID-19. The same percentage calculations and eligibility criteria applied. Unlike Alberta, the program, launched on the 17th of April, budgeted CAD$50 million in financial assistance. Over 4500 applications have been processed, providing more than CAD$15 million in aid to business. In addition, the Government of Saskatchewan issued a second payment to eligible small businesses with no requirement to reapply for program continuity (Government of Saskatchewan 2020c).
Primary applicants who were eligible for the program seem to be ineligible for the extension as the clause for the extension stated that ‘…revenues and cash flow continue to be majorly impacted by COVID-19.’

52 Canadian Energy Research Institute
September 2020
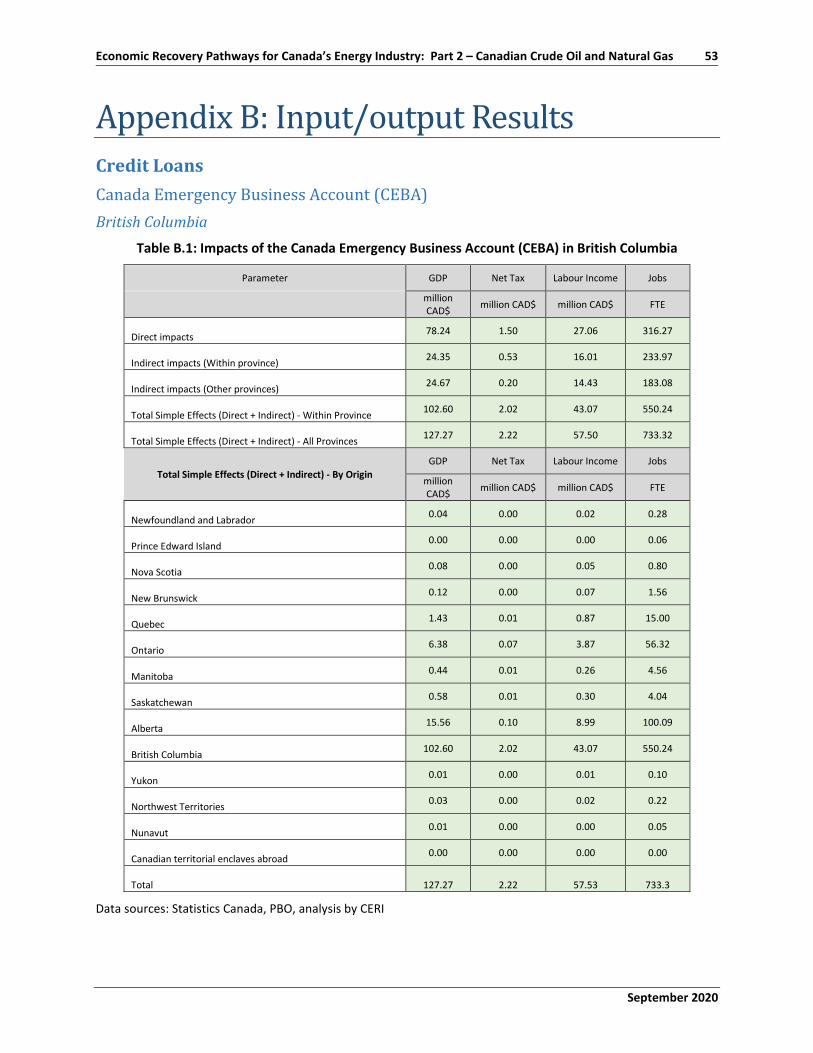
September 2020
Economic Recovery Pathways for Canada’s Energy Industry: Part 2 – Canadian Crude Oil and Natural Gas 53
Appendix B: Input/output Results Credit Loans Canada Emergency Business Account (CEBA) British Columbia
Table B.1: Impacts of the Canada Emergency Business Account (CEBA) in British Columbia
Parameter GDP Net Tax Labour Income Jobs
million CAD$ million CAD$ million CAD$ FTE
Direct impacts 78.24 1.50 27.06 316.27
Indirect impacts (Within province) 24.35 0.53 16.01 233.97
Indirect impacts (Other provinces) 24.67 0.20 14.43 183.08
Total Simple Effects (Direct + Indirect) - Within Province 102.60 2.02 43.07 550.24
Total Simple Effects (Direct + Indirect) - All Provinces 127.27 2.22 57.50 733.32
Total Simple Effects (Direct + Indirect) - By Origin GDP Net Tax Labour Income Jobs
million CAD$ million CAD$ million CAD$ FTE
Newfoundland and Labrador 0.04 0.00 0.02 0.28
Prince Edward Island 0.00 0.00 0.00 0.06
Nova Scotia 0.08 0.00 0.05 0.80
New Brunswick 0.12 0.00 0.07 1.56
Quebec 1.43 0.01 0.87 15.00
Ontario 6.38 0.07 3.87 56.32
Manitoba 0.44 0.01 0.26 4.56
Saskatchewan 0.58 0.01 0.30 4.04
Alberta 15.56 0.10 8.99 100.09
British Columbia 102.60 2.02 43.07 550.24
Yukon 0.01 0.00 0.01 0.10
Northwest Territories 0.03 0.00 0.02 0.22
Nunavut 0.01 0.00 0.00 0.05
Canadian territorial enclaves abroad 0.00 0.00 0.00 0.00
Total 127.27 2.22 57.53 733.3
Data sources: Statistics Canada, PBO, analysis by CERI
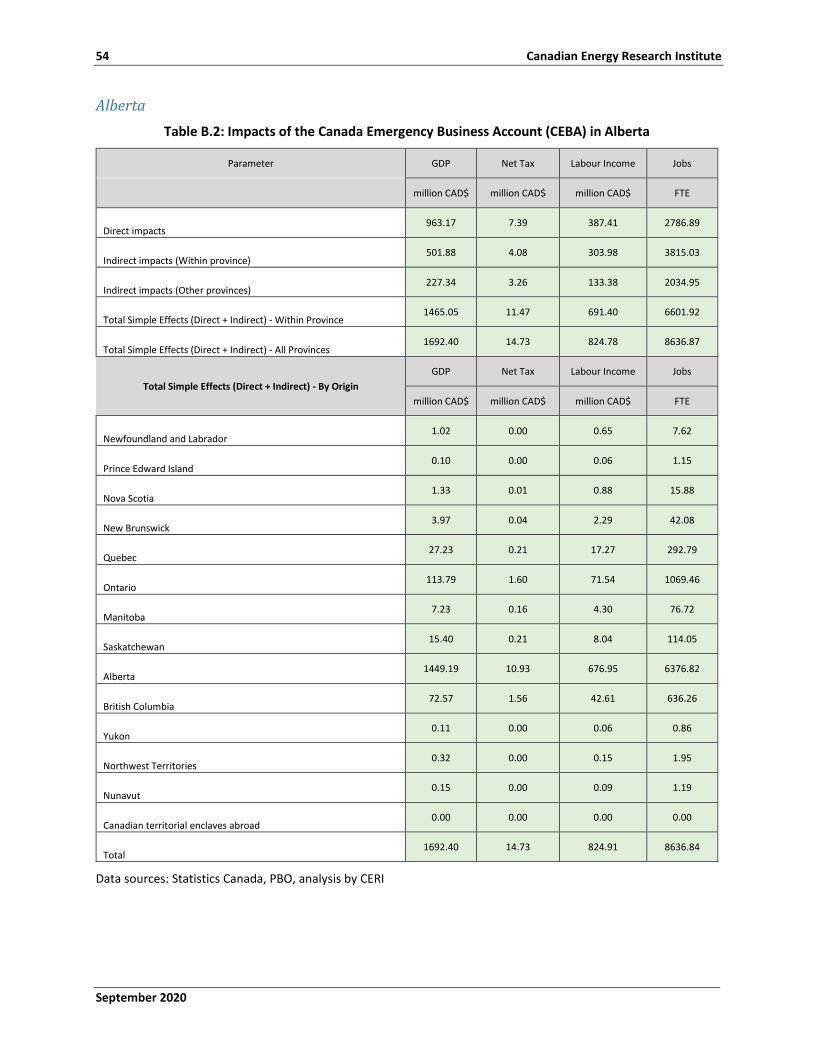
54 Canadian Energy Research Institute
September 2020
Alberta Table B.2: Impacts of the Canada Emergency Business Account (CEBA) in Alberta
Parameter GDP Net Tax Labour Income Jobs
million CAD$ million CAD$ million CAD$ FTE
Direct impacts 963.17 7.39 387.41 2786.89
Indirect impacts (Within province) 501.88 4.08 303.98 3815.03
Indirect impacts (Other provinces) 227.34 3.26 133.38 2034.95
Total Simple Effects (Direct + Indirect) - Within Province 1465.05 11.47 691.40 6601.92
Total Simple Effects (Direct + Indirect) - All Provinces 1692.40 14.73 824.78 8636.87
Total Simple Effects (Direct + Indirect) - By Origin GDP Net Tax Labour Income Jobs
million CAD$ million CAD$ million CAD$ FTE
Newfoundland and Labrador 1.02 0.00 0.65 7.62
Prince Edward Island 0.10 0.00 0.06 1.15
Nova Scotia 1.33 0.01 0.88 15.88
New Brunswick 3.97 0.04 2.29 42.08
Quebec 27.23 0.21 17.27 292.79
Ontario 113.79 1.60 71.54 1069.46
Manitoba 7.23 0.16 4.30 76.72
Saskatchewan 15.40 0.21 8.04 114.05
Alberta 1449.19 10.93 676.95 6376.82
British Columbia 72.57 1.56 42.61 636.26
Yukon 0.11 0.00 0.06 0.86
Northwest Territories 0.32 0.00 0.15 1.95
Nunavut 0.15 0.00 0.09 1.19
Canadian territorial enclaves abroad 0.00 0.00 0.00 0.00
Total 1692.40 14.73 824.91 8636.84
Data sources: Statistics Canada, PBO, analysis by CERI
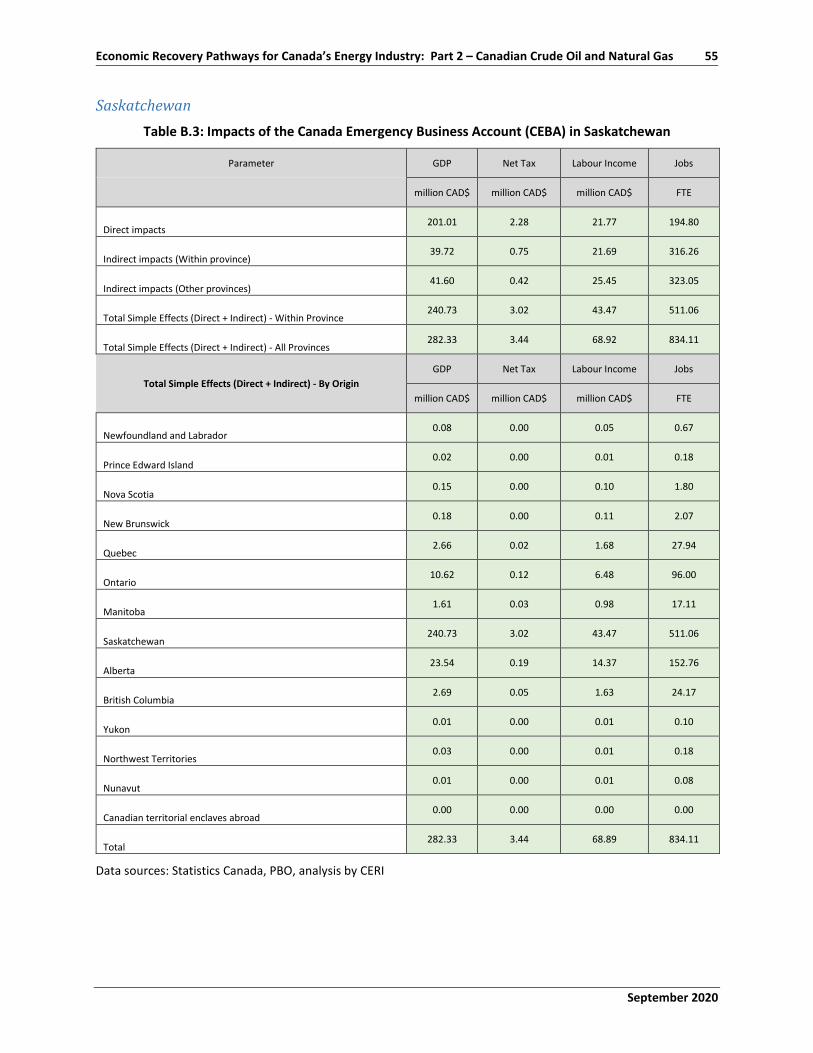
September 2020
Economic Recovery Pathways for Canada’s Energy Industry: Part 2 – Canadian Crude Oil and Natural Gas 55
Saskatchewan Table B.3: Impacts of the Canada Emergency Business Account (CEBA) in Saskatchewan
Parameter GDP Net Tax Labour Income Jobs
million CAD$ million CAD$ million CAD$ FTE
Direct impacts 201.01 2.28 21.77 194.80
Indirect impacts (Within province) 39.72 0.75 21.69 316.26
Indirect impacts (Other provinces) 41.60 0.42 25.45 323.05
Total Simple Effects (Direct + Indirect) - Within Province 240.73 3.02 43.47 511.06
Total Simple Effects (Direct + Indirect) - All Provinces 282.33 3.44 68.92 834.11
Total Simple Effects (Direct + Indirect) - By Origin GDP Net Tax Labour Income Jobs
million CAD$ million CAD$ million CAD$ FTE
Newfoundland and Labrador 0.08 0.00 0.05 0.67
Prince Edward Island 0.02 0.00 0.01 0.18
Nova Scotia 0.15 0.00 0.10 1.80
New Brunswick 0.18 0.00 0.11 2.07
Quebec 2.66 0.02 1.68 27.94
Ontario 10.62 0.12 6.48 96.00
Manitoba 1.61 0.03 0.98 17.11
Saskatchewan 240.73 3.02 43.47 511.06
Alberta 23.54 0.19 14.37 152.76
British Columbia 2.69 0.05 1.63 24.17
Yukon 0.01 0.00 0.01 0.10
Northwest Territories 0.03 0.00 0.01 0.18
Nunavut 0.01 0.00 0.01 0.08
Canadian territorial enclaves abroad 0.00 0.00 0.00 0.00
Total 282.33 3.44 68.89 834.11
Data sources: Statistics Canada, PBO, analysis by CERI
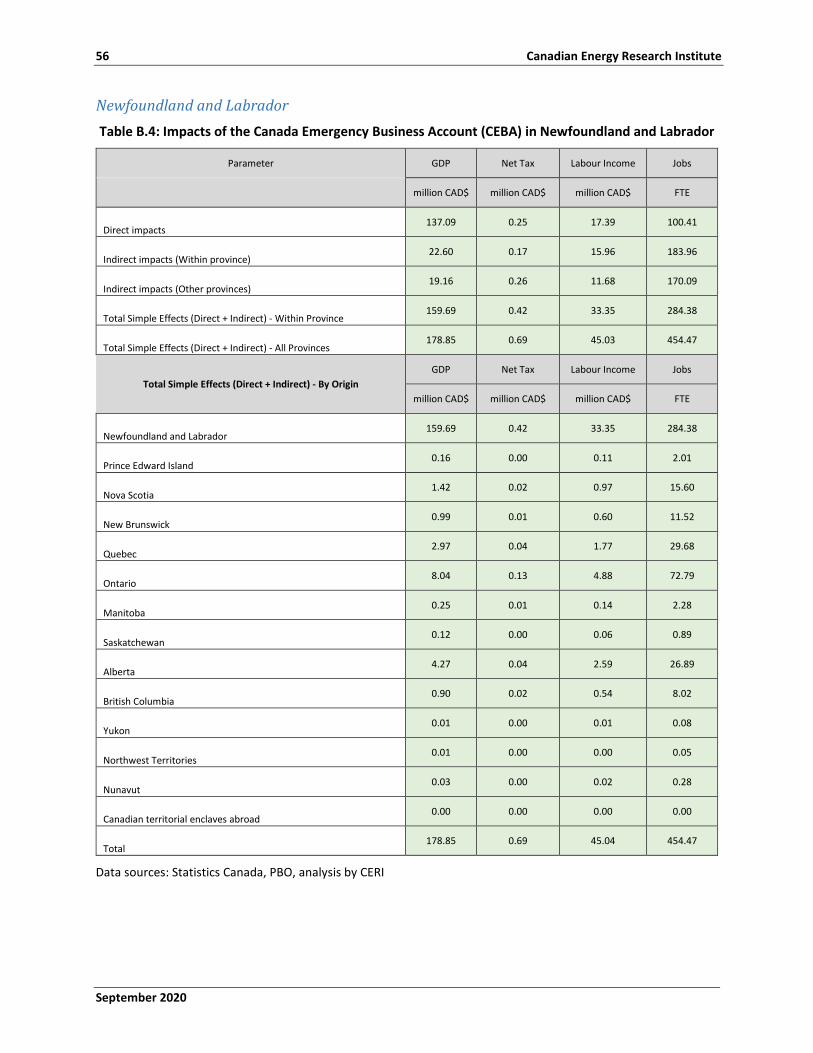
56 Canadian Energy Research Institute
September 2020
Newfoundland and Labrador Table B.4: Impacts of the Canada Emergency Business Account (CEBA) in Newfoundland and Labrador
Parameter GDP Net Tax Labour Income Jobs
million CAD$ million CAD$ million CAD$ FTE
Direct impacts 137.09 0.25 17.39 100.41
Indirect impacts (Within province) 22.60 0.17 15.96 183.96
Indirect impacts (Other provinces) 19.16 0.26 11.68 170.09
Total Simple Effects (Direct + Indirect) - Within Province 159.69 0.42 33.35 284.38
Total Simple Effects (Direct + Indirect) - All Provinces 178.85 0.69 45.03 454.47
Total Simple Effects (Direct + Indirect) - By Origin GDP Net Tax Labour Income Jobs
million CAD$ million CAD$ million CAD$ FTE
Newfoundland and Labrador 159.69 0.42 33.35 284.38
Prince Edward Island 0.16 0.00 0.11 2.01
Nova Scotia 1.42 0.02 0.97 15.60
New Brunswick 0.99 0.01 0.60 11.52
Quebec 2.97 0.04 1.77 29.68
Ontario 8.04 0.13 4.88 72.79
Manitoba 0.25 0.01 0.14 2.28
Saskatchewan 0.12 0.00 0.06 0.89
Alberta 4.27 0.04 2.59 26.89
British Columbia 0.90 0.02 0.54 8.02
Yukon 0.01 0.00 0.01 0.08
Northwest Territories 0.01 0.00 0.00 0.05
Nunavut 0.03 0.00 0.02 0.28
Canadian territorial enclaves abroad 0.00 0.00 0.00 0.00
Total 178.85 0.69 45.04 454.47
Data sources: Statistics Canada, PBO, analysis by CERI
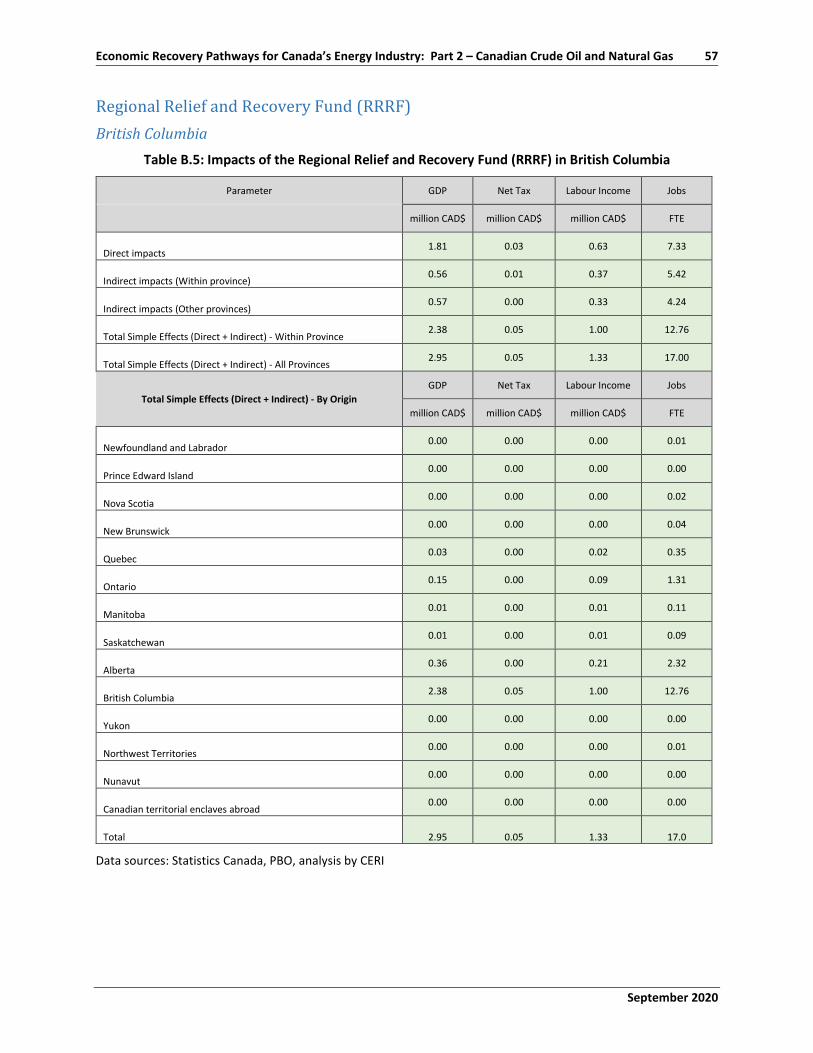
September 2020
Economic Recovery Pathways for Canada’s Energy Industry: Part 2 – Canadian Crude Oil and Natural Gas 57
Regional Relief and Recovery Fund (RRRF) British Columbia
Table B.5: Impacts of the Regional Relief and Recovery Fund (RRRF) in British Columbia
Parameter GDP Net Tax Labour Income Jobs
million CAD$ million CAD$ million CAD$ FTE
Direct impacts 1.81 0.03 0.63 7.33
Indirect impacts (Within province) 0.56 0.01 0.37 5.42
Indirect impacts (Other provinces) 0.57 0.00 0.33 4.24
Total Simple Effects (Direct + Indirect) - Within Province 2.38 0.05 1.00 12.76
Total Simple Effects (Direct + Indirect) - All Provinces 2.95 0.05 1.33 17.00
Total Simple Effects (Direct + Indirect) - By Origin GDP Net Tax Labour Income Jobs
million CAD$ million CAD$ million CAD$ FTE
Newfoundland and Labrador 0.00 0.00 0.00 0.01
Prince Edward Island 0.00 0.00 0.00 0.00
Nova Scotia 0.00 0.00 0.00 0.02
New Brunswick 0.00 0.00 0.00 0.04
Quebec 0.03 0.00 0.02 0.35
Ontario 0.15 0.00 0.09 1.31
Manitoba 0.01 0.00 0.01 0.11
Saskatchewan 0.01 0.00 0.01 0.09
Alberta 0.36 0.00 0.21 2.32
British Columbia 2.38 0.05 1.00 12.76
Yukon 0.00 0.00 0.00 0.00
Northwest Territories 0.00 0.00 0.00 0.01
Nunavut 0.00 0.00 0.00 0.00
Canadian territorial enclaves abroad 0.00 0.00 0.00 0.00
Total 2.95 0.05 1.33 17.0
Data sources: Statistics Canada, PBO, analysis by CERI
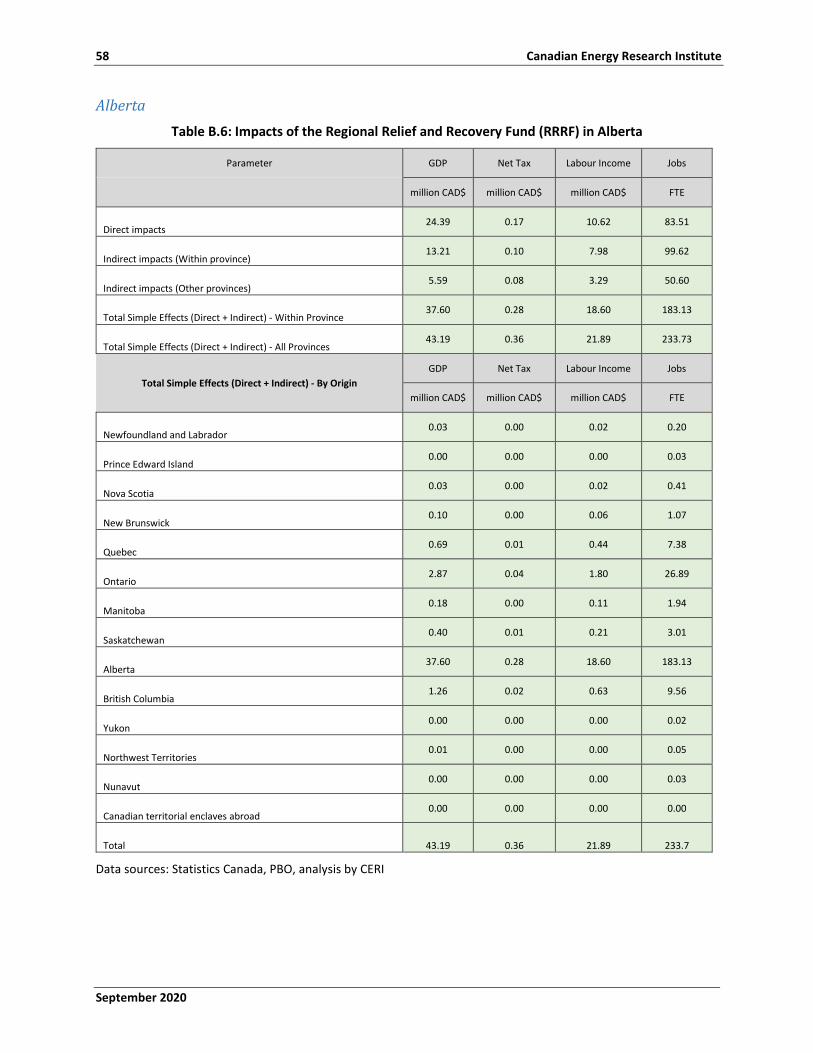
58 Canadian Energy Research Institute
September 2020
Alberta Table B.6: Impacts of the Regional Relief and Recovery Fund (RRRF) in Alberta
Parameter GDP Net Tax Labour Income Jobs
million CAD$ million CAD$ million CAD$ FTE
Direct impacts 24.39 0.17 10.62 83.51
Indirect impacts (Within province) 13.21 0.10 7.98 99.62
Indirect impacts (Other provinces) 5.59 0.08 3.29 50.60
Total Simple Effects (Direct + Indirect) - Within Province 37.60 0.28 18.60 183.13
Total Simple Effects (Direct + Indirect) - All Provinces 43.19 0.36 21.89 233.73
Total Simple Effects (Direct + Indirect) - By Origin GDP Net Tax Labour Income Jobs
million CAD$ million CAD$ million CAD$ FTE
Newfoundland and Labrador 0.03 0.00 0.02 0.20
Prince Edward Island 0.00 0.00 0.00 0.03
Nova Scotia 0.03 0.00 0.02 0.41
New Brunswick 0.10 0.00 0.06 1.07
Quebec 0.69 0.01 0.44 7.38
Ontario 2.87 0.04 1.80 26.89
Manitoba 0.18 0.00 0.11 1.94
Saskatchewan 0.40 0.01 0.21 3.01
Alberta 37.60 0.28 18.60 183.13
British Columbia 1.26 0.02 0.63 9.56
Yukon 0.00 0.00 0.00 0.02
Northwest Territories 0.01 0.00 0.00 0.05
Nunavut 0.00 0.00 0.00 0.03
Canadian territorial enclaves abroad 0.00 0.00 0.00 0.00
Total 43.19 0.36 21.89 233.7
Data sources: Statistics Canada, PBO, analysis by CERI
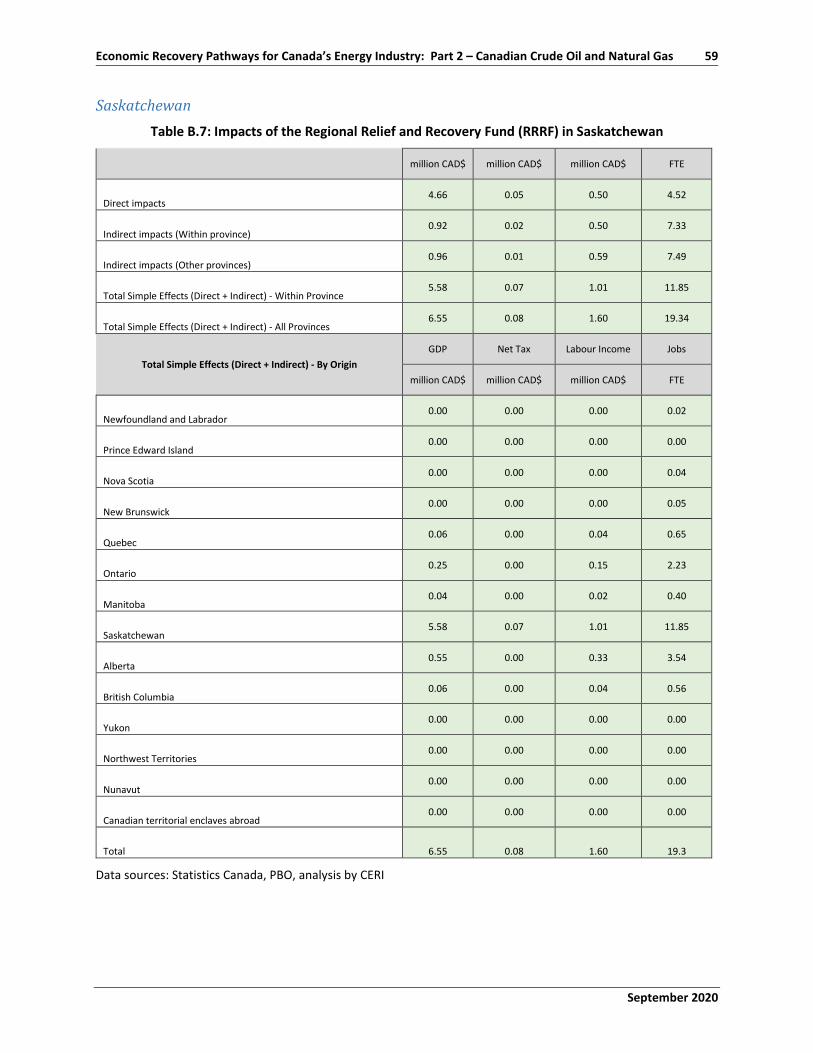
September 2020
Economic Recovery Pathways for Canada’s Energy Industry: Part 2 – Canadian Crude Oil and Natural Gas 59
Saskatchewan Table B.7: Impacts of the Regional Relief and Recovery Fund (RRRF) in Saskatchewan
million CAD$ million CAD$ million CAD$ FTE
Direct impacts 4.66 0.05 0.50 4.52
Indirect impacts (Within province) 0.92 0.02 0.50 7.33
Indirect impacts (Other provinces) 0.96 0.01 0.59 7.49
Total Simple Effects (Direct + Indirect) - Within Province 5.58 0.07 1.01 11.85
Total Simple Effects (Direct + Indirect) - All Provinces 6.55 0.08 1.60 19.34
Total Simple Effects (Direct + Indirect) - By Origin GDP Net Tax Labour Income Jobs
million CAD$ million CAD$ million CAD$ FTE
Newfoundland and Labrador 0.00 0.00 0.00 0.02
Prince Edward Island 0.00 0.00 0.00 0.00
Nova Scotia 0.00 0.00 0.00 0.04
New Brunswick 0.00 0.00 0.00 0.05
Quebec 0.06 0.00 0.04 0.65
Ontario 0.25 0.00 0.15 2.23
Manitoba 0.04 0.00 0.02 0.40
Saskatchewan 5.58 0.07 1.01 11.85
Alberta 0.55 0.00 0.33 3.54
British Columbia 0.06 0.00 0.04 0.56
Yukon 0.00 0.00 0.00 0.00
Northwest Territories 0.00 0.00 0.00 0.00
Nunavut 0.00 0.00 0.00 0.00
Canadian territorial enclaves abroad 0.00 0.00 0.00 0.00
Total 6.55 0.08 1.60 19.3
Data sources: Statistics Canada, PBO, analysis by CERI
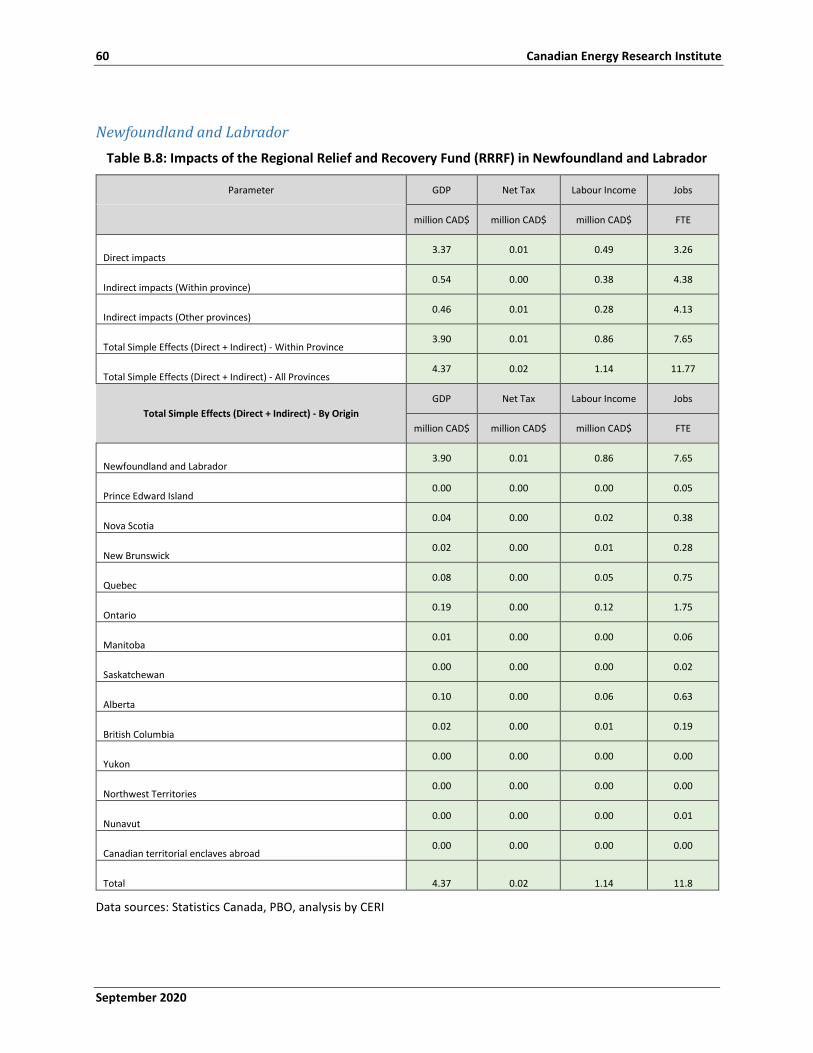
60 Canadian Energy Research Institute
September 2020
Newfoundland and Labrador Table B.8: Impacts of the Regional Relief and Recovery Fund (RRRF) in Newfoundland and Labrador
Parameter GDP Net Tax Labour Income Jobs
million CAD$ million CAD$ million CAD$ FTE
Direct impacts 3.37 0.01 0.49 3.26
Indirect impacts (Within province) 0.54 0.00 0.38 4.38
Indirect impacts (Other provinces) 0.46 0.01 0.28 4.13
Total Simple Effects (Direct + Indirect) - Within Province 3.90 0.01 0.86 7.65
Total Simple Effects (Direct + Indirect) - All Provinces 4.37 0.02 1.14 11.77
Total Simple Effects (Direct + Indirect) - By Origin GDP Net Tax Labour Income Jobs
million CAD$ million CAD$ million CAD$ FTE
Newfoundland and Labrador 3.90 0.01 0.86 7.65
Prince Edward Island 0.00 0.00 0.00 0.05
Nova Scotia 0.04 0.00 0.02 0.38
New Brunswick 0.02 0.00 0.01 0.28
Quebec 0.08 0.00 0.05 0.75
Ontario 0.19 0.00 0.12 1.75
Manitoba 0.01 0.00 0.00 0.06
Saskatchewan 0.00 0.00 0.00 0.02
Alberta 0.10 0.00 0.06 0.63
British Columbia 0.02 0.00 0.01 0.19
Yukon 0.00 0.00 0.00 0.00
Northwest Territories 0.00 0.00 0.00 0.00
Nunavut 0.00 0.00 0.00 0.01
Canadian territorial enclaves abroad 0.00 0.00 0.00 0.00
Total 4.37 0.02 1.14 11.8
Data sources: Statistics Canada, PBO, analysis by CERI
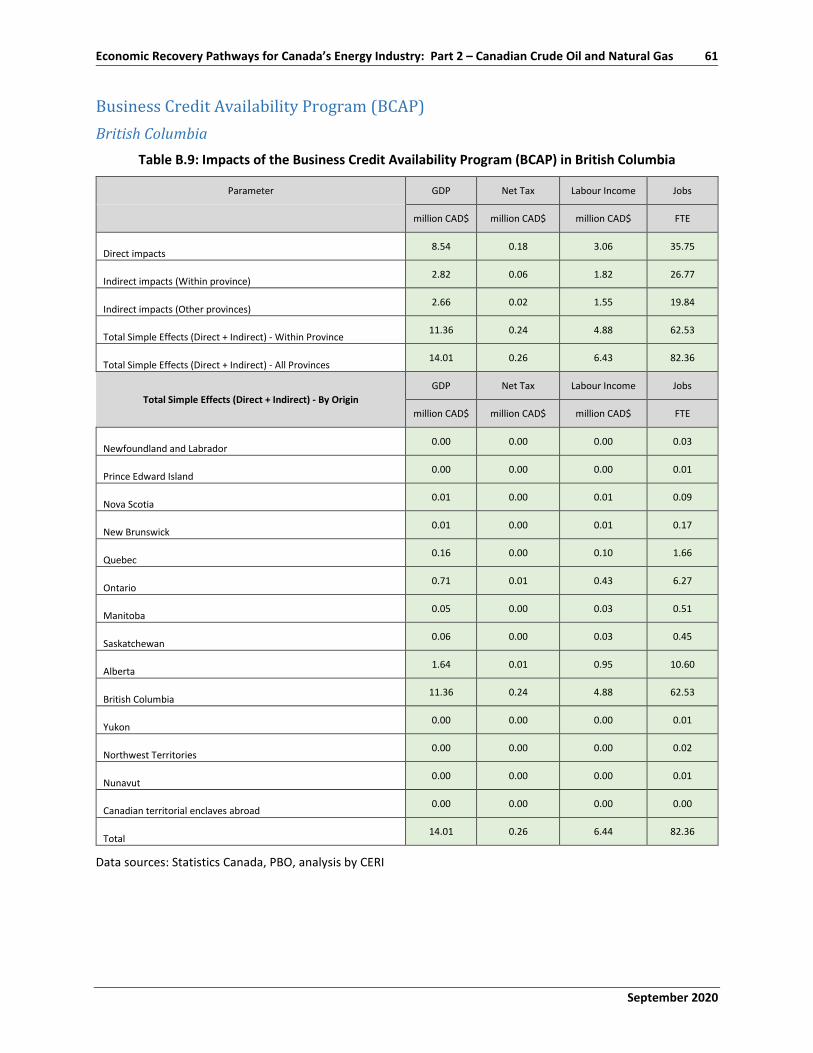
September 2020
Economic Recovery Pathways for Canada’s Energy Industry: Part 2 – Canadian Crude Oil and Natural Gas 61
Business Credit Availability Program (BCAP) British Columbia
Table B.9: Impacts of the Business Credit Availability Program (BCAP) in British Columbia
Parameter GDP Net Tax Labour Income Jobs
million CAD$ million CAD$ million CAD$ FTE
Direct impacts 8.54 0.18 3.06 35.75
Indirect impacts (Within province) 2.82 0.06 1.82 26.77
Indirect impacts (Other provinces) 2.66 0.02 1.55 19.84
Total Simple Effects (Direct + Indirect) - Within Province 11.36 0.24 4.88 62.53
Total Simple Effects (Direct + Indirect) - All Provinces 14.01 0.26 6.43 82.36
Total Simple Effects (Direct + Indirect) - By Origin GDP Net Tax Labour Income Jobs
million CAD$ million CAD$ million CAD$ FTE
Newfoundland and Labrador 0.00 0.00 0.00 0.03
Prince Edward Island 0.00 0.00 0.00 0.01
Nova Scotia 0.01 0.00 0.01 0.09
New Brunswick 0.01 0.00 0.01 0.17
Quebec 0.16 0.00 0.10 1.66
Ontario 0.71 0.01 0.43 6.27
Manitoba 0.05 0.00 0.03 0.51
Saskatchewan 0.06 0.00 0.03 0.45
Alberta 1.64 0.01 0.95 10.60
British Columbia 11.36 0.24 4.88 62.53
Yukon 0.00 0.00 0.00 0.01
Northwest Territories 0.00 0.00 0.00 0.02
Nunavut 0.00 0.00 0.00 0.01
Canadian territorial enclaves abroad 0.00 0.00 0.00 0.00
Total 14.01 0.26 6.44 82.36
Data sources: Statistics Canada, PBO, analysis by CERI

62 Canadian Energy Research Institute
September 2020
Alberta Table B.10: Impacts of the Business Credit Availability Program (BCAP) in Alberta
Parameter GDP Net Tax Labour Income Jobs
million CAD$ million CAD$ million CAD$ FTE
Direct impacts 114.54 1.07 50.89 410.56
Indirect impacts (Within province) 63.78 0.51 38.31 480.47
Indirect impacts (Other provinces) 26.77 0.40 15.80 242.64
Total Simple Effects (Direct + Indirect) - Within Province 178.33 1.58 89.20 891.03
Total Simple Effects (Direct + Indirect) - All Provinces 205.10 1.98 105.00 1133.68
Total Simple Effects (Direct + Indirect) - By Origin GDP Net Tax Labour Income Jobs
million CAD$ million CAD$ million CAD$ FTE
Newfoundland and Labrador 0.13 0.00 0.08 0.95
Prince Edward Island 0.01 0.00 0.01 0.14
Nova Scotia 0.16 0.00 0.11 1.95
New Brunswick 0.49 0.00 0.28 5.07
Quebec 3.30 0.03 2.09 35.28
Ontario 13.84 0.20 8.69 129.44
Manitoba 0.88 0.02 0.52 9.27
Saskatchewan 1.90 0.03 1.00 14.18
Alberta 178.33 1.58 89.20 891.03
British Columbia 6.00 0.12 3.01 45.88
Yukon 0.01 0.00 0.01 0.11
Northwest Territories 0.04 0.00 0.02 0.23
Nunavut 0.02 0.00 0.01 0.14
Canadian territorial enclaves abroad 0.00 0.00 0.00 0.00
Total 205.10 1.98 105.02 1133.67
Data sources: Statistics Canada, PBO, analysis by CERI
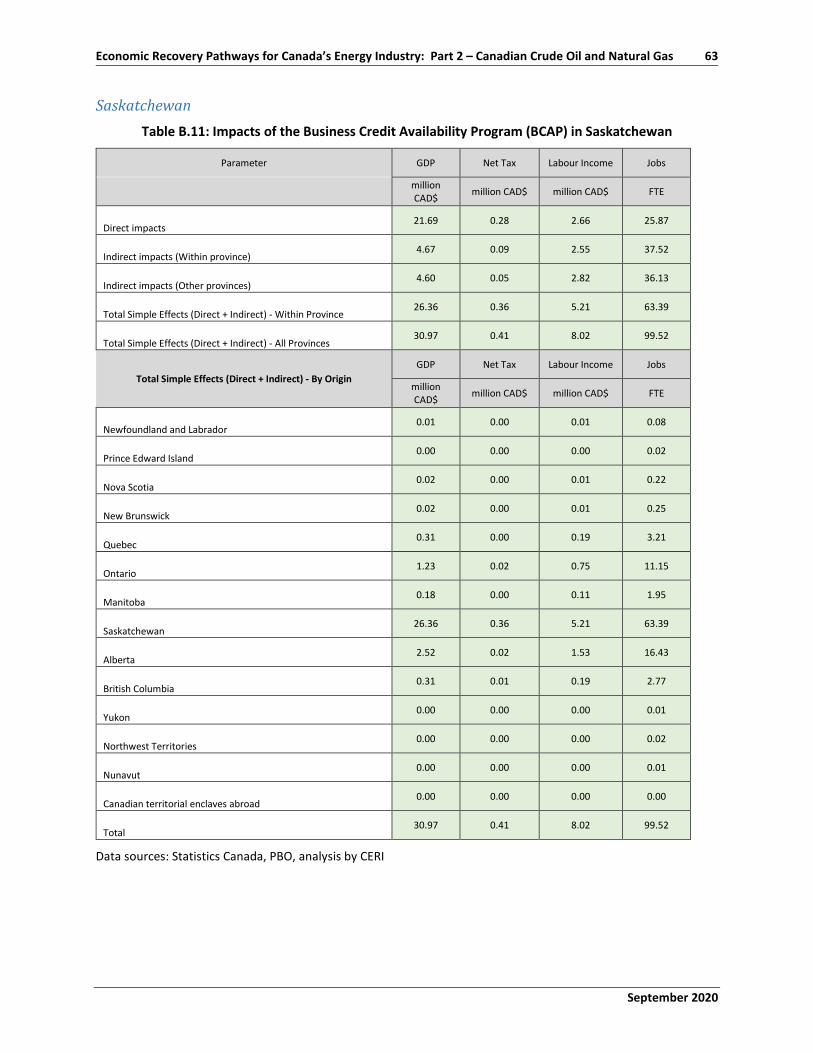
September 2020
Economic Recovery Pathways for Canada’s Energy Industry: Part 2 – Canadian Crude Oil and Natural Gas 63
Saskatchewan Table B.11: Impacts of the Business Credit Availability Program (BCAP) in Saskatchewan
Parameter GDP Net Tax Labour Income Jobs
million CAD$ million CAD$ million CAD$ FTE
Direct impacts 21.69 0.28 2.66 25.87
Indirect impacts (Within province) 4.67 0.09 2.55 37.52
Indirect impacts (Other provinces) 4.60 0.05 2.82 36.13
Total Simple Effects (Direct + Indirect) - Within Province 26.36 0.36 5.21 63.39
Total Simple Effects (Direct + Indirect) - All Provinces 30.97 0.41 8.02 99.52
Total Simple Effects (Direct + Indirect) - By Origin GDP Net Tax Labour Income Jobs
million CAD$ million CAD$ million CAD$ FTE
Newfoundland and Labrador 0.01 0.00 0.01 0.08
Prince Edward Island 0.00 0.00 0.00 0.02
Nova Scotia 0.02 0.00 0.01 0.22
New Brunswick 0.02 0.00 0.01 0.25
Quebec 0.31 0.00 0.19 3.21
Ontario 1.23 0.02 0.75 11.15
Manitoba 0.18 0.00 0.11 1.95
Saskatchewan 26.36 0.36 5.21 63.39
Alberta 2.52 0.02 1.53 16.43
British Columbia 0.31 0.01 0.19 2.77
Yukon 0.00 0.00 0.00 0.01
Northwest Territories 0.00 0.00 0.00 0.02
Nunavut 0.00 0.00 0.00 0.01
Canadian territorial enclaves abroad 0.00 0.00 0.00 0.00
Total 30.97 0.41 8.02 99.52
Data sources: Statistics Canada, PBO, analysis by CERI
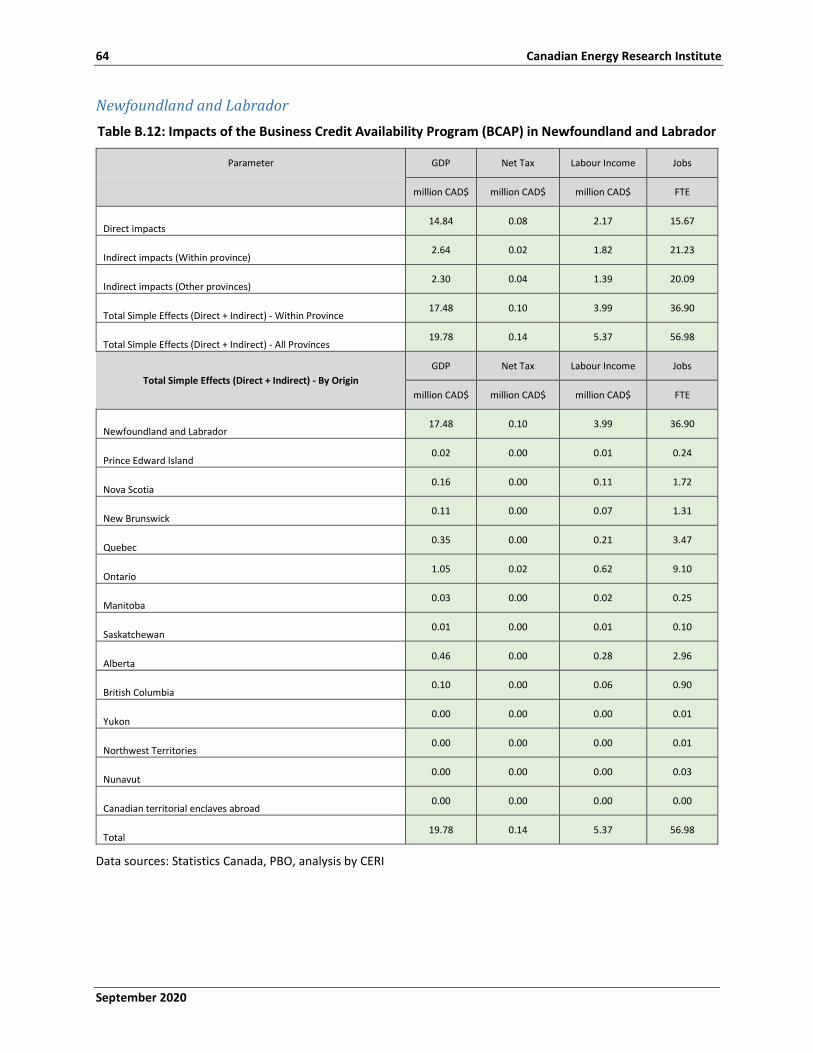
64 Canadian Energy Research Institute
September 2020
Newfoundland and Labrador Table B.12: Impacts of the Business Credit Availability Program (BCAP) in Newfoundland and Labrador
Parameter GDP Net Tax Labour Income Jobs
million CAD$ million CAD$ million CAD$ FTE
Direct impacts 14.84 0.08 2.17 15.67
Indirect impacts (Within province) 2.64 0.02 1.82 21.23
Indirect impacts (Other provinces) 2.30 0.04 1.39 20.09
Total Simple Effects (Direct + Indirect) - Within Province 17.48 0.10 3.99 36.90
Total Simple Effects (Direct + Indirect) - All Provinces 19.78 0.14 5.37 56.98
Total Simple Effects (Direct + Indirect) - By Origin GDP Net Tax Labour Income Jobs
million CAD$ million CAD$ million CAD$ FTE
Newfoundland and Labrador 17.48 0.10 3.99 36.90
Prince Edward Island 0.02 0.00 0.01 0.24
Nova Scotia 0.16 0.00 0.11 1.72
New Brunswick 0.11 0.00 0.07 1.31
Quebec 0.35 0.00 0.21 3.47
Ontario 1.05 0.02 0.62 9.10
Manitoba 0.03 0.00 0.02 0.25
Saskatchewan 0.01 0.00 0.01 0.10
Alberta 0.46 0.00 0.28 2.96
British Columbia 0.10 0.00 0.06 0.90
Yukon 0.00 0.00 0.00 0.01
Northwest Territories 0.00 0.00 0.00 0.01
Nunavut 0.00 0.00 0.00 0.03
Canadian territorial enclaves abroad 0.00 0.00 0.00 0.00
Total 19.78 0.14 5.37 56.98
Data sources: Statistics Canada, PBO, analysis by CERI
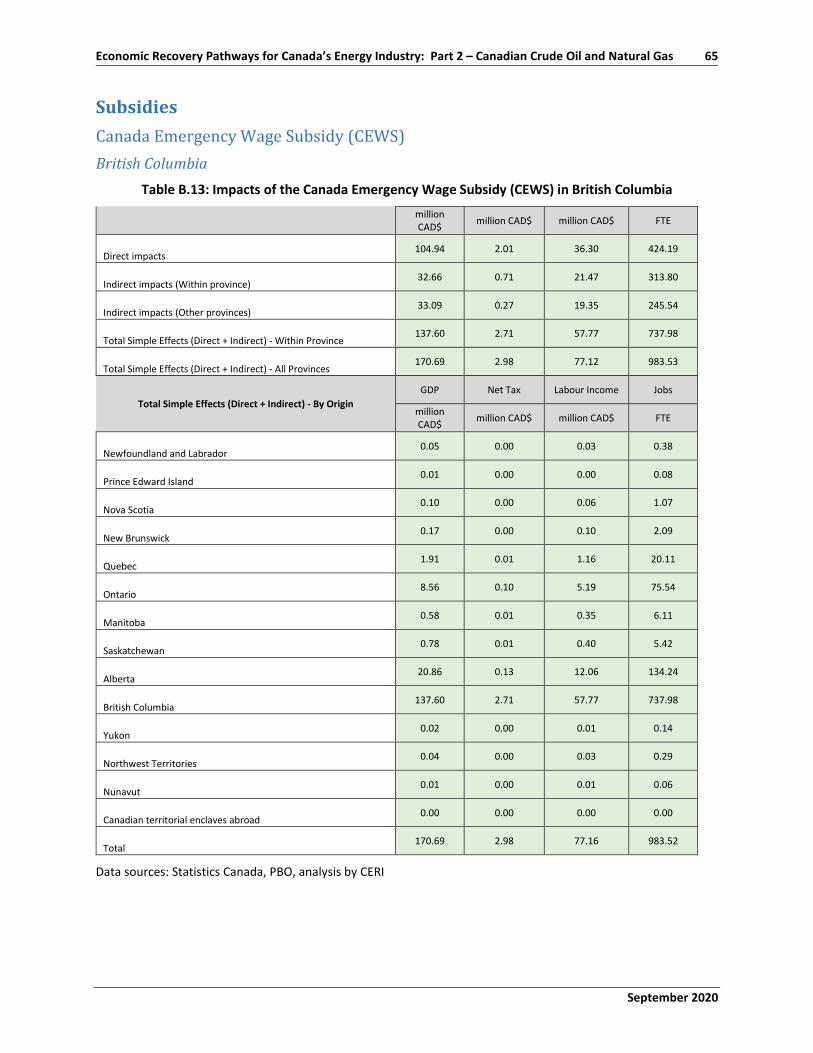
September 2020
Economic Recovery Pathways for Canada’s Energy Industry: Part 2 – Canadian Crude Oil and Natural Gas 65
Subsidies Canada Emergency Wage Subsidy (CEWS) British Columbia
Table B.13: Impacts of the Canada Emergency Wage Subsidy (CEWS) in British Columbia
million CAD$ million CAD$ million CAD$ FTE
Direct impacts 104.94 2.01 36.30 424.19
Indirect impacts (Within province) 32.66 0.71 21.47 313.80
Indirect impacts (Other provinces) 33.09 0.27 19.35 245.54
Total Simple Effects (Direct + Indirect) - Within Province 137.60 2.71 57.77 737.98
Total Simple Effects (Direct + Indirect) - All Provinces 170.69 2.98 77.12 983.53
Total Simple Effects (Direct + Indirect) - By Origin GDP Net Tax Labour Income Jobs
million CAD$ million CAD$ million CAD$ FTE
Newfoundland and Labrador 0.05 0.00 0.03 0.38
Prince Edward Island 0.01 0.00 0.00 0.08
Nova Scotia 0.10 0.00 0.06 1.07
New Brunswick 0.17 0.00 0.10 2.09
Quebec 1.91 0.01 1.16 20.11
Ontario 8.56 0.10 5.19 75.54
Manitoba 0.58 0.01 0.35 6.11
Saskatchewan 0.78 0.01 0.40 5.42
Alberta 20.86 0.13 12.06 134.24
British Columbia 137.60 2.71 57.77 737.98
Yukon 0.02 0.00 0.01 0.14
Northwest Territories 0.04 0.00 0.03 0.29
Nunavut 0.01 0.00 0.01 0.06
Canadian territorial enclaves abroad 0.00 0.00 0.00 0.00
Total 170.69 2.98 77.16 983.52
Data sources: Statistics Canada, PBO, analysis by CERI
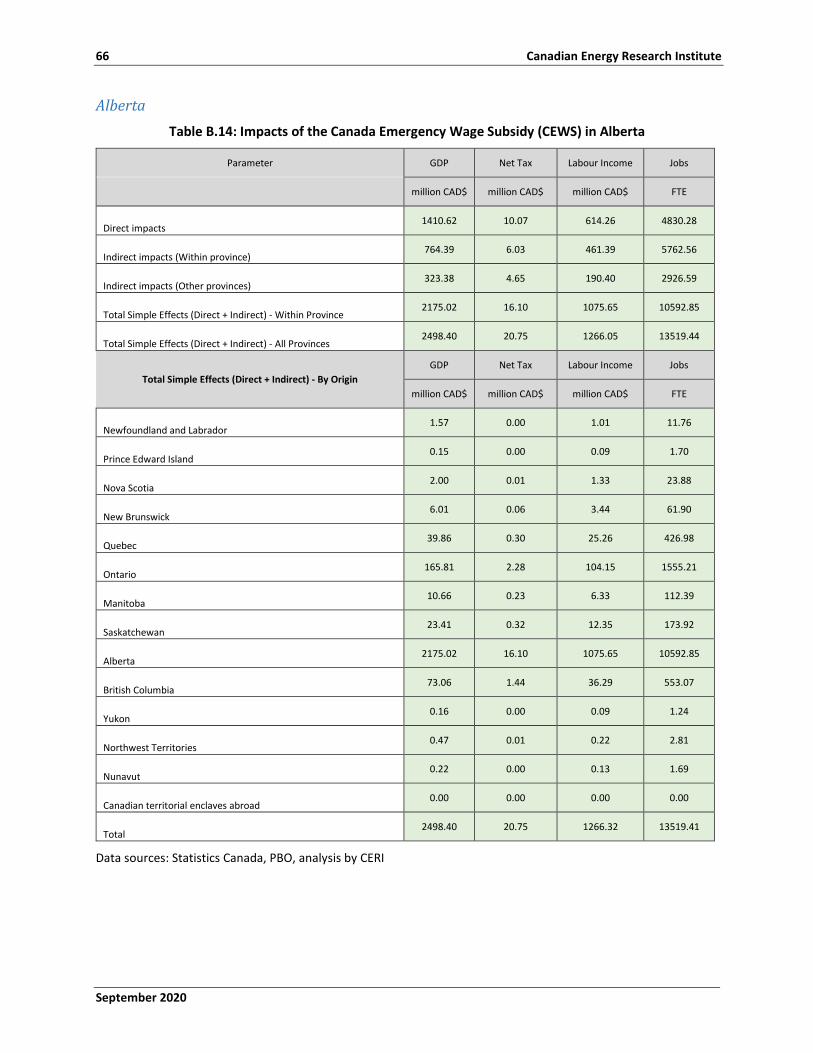
66 Canadian Energy Research Institute
September 2020
Alberta Table B.14: Impacts of the Canada Emergency Wage Subsidy (CEWS) in Alberta
Parameter GDP Net Tax Labour Income Jobs
million CAD$ million CAD$ million CAD$ FTE
Direct impacts 1410.62 10.07 614.26 4830.28
Indirect impacts (Within province) 764.39 6.03 461.39 5762.56
Indirect impacts (Other provinces) 323.38 4.65 190.40 2926.59
Total Simple Effects (Direct + Indirect) - Within Province 2175.02 16.10 1075.65 10592.85
Total Simple Effects (Direct + Indirect) - All Provinces 2498.40 20.75 1266.05 13519.44
Total Simple Effects (Direct + Indirect) - By Origin GDP Net Tax Labour Income Jobs
million CAD$ million CAD$ million CAD$ FTE
Newfoundland and Labrador 1.57 0.00 1.01 11.76
Prince Edward Island 0.15 0.00 0.09 1.70
Nova Scotia 2.00 0.01 1.33 23.88
New Brunswick 6.01 0.06 3.44 61.90
Quebec 39.86 0.30 25.26 426.98
Ontario 165.81 2.28 104.15 1555.21
Manitoba 10.66 0.23 6.33 112.39
Saskatchewan 23.41 0.32 12.35 173.92
Alberta 2175.02 16.10 1075.65 10592.85
British Columbia 73.06 1.44 36.29 553.07
Yukon 0.16 0.00 0.09 1.24
Northwest Territories 0.47 0.01 0.22 2.81
Nunavut 0.22 0.00 0.13 1.69
Canadian territorial enclaves abroad 0.00 0.00 0.00 0.00
Total 2498.40 20.75 1266.32 13519.41
Data sources: Statistics Canada, PBO, analysis by CERI
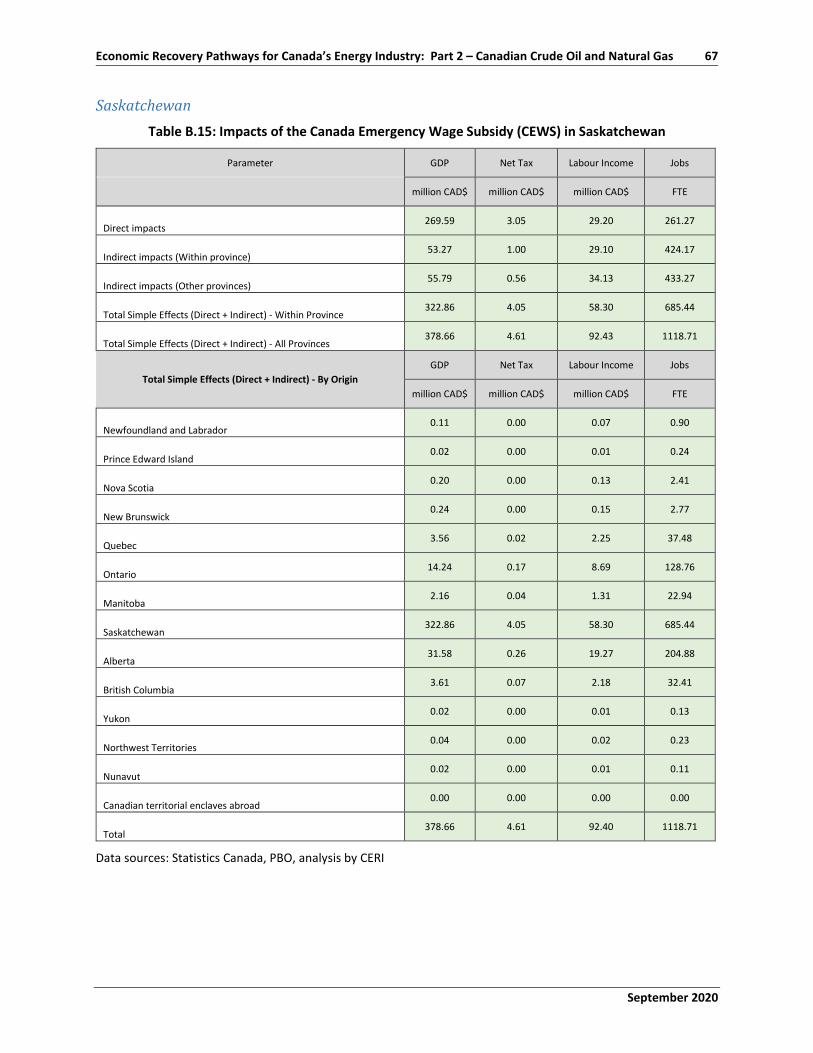
September 2020
Economic Recovery Pathways for Canada’s Energy Industry: Part 2 – Canadian Crude Oil and Natural Gas 67
Saskatchewan Table B.15: Impacts of the Canada Emergency Wage Subsidy (CEWS) in Saskatchewan
Parameter GDP Net Tax Labour Income Jobs
million CAD$ million CAD$ million CAD$ FTE
Direct impacts 269.59 3.05 29.20 261.27
Indirect impacts (Within province) 53.27 1.00 29.10 424.17
Indirect impacts (Other provinces) 55.79 0.56 34.13 433.27
Total Simple Effects (Direct + Indirect) - Within Province 322.86 4.05 58.30 685.44
Total Simple Effects (Direct + Indirect) - All Provinces 378.66 4.61 92.43 1118.71
Total Simple Effects (Direct + Indirect) - By Origin GDP Net Tax Labour Income Jobs
million CAD$ million CAD$ million CAD$ FTE
Newfoundland and Labrador 0.11 0.00 0.07 0.90
Prince Edward Island 0.02 0.00 0.01 0.24
Nova Scotia 0.20 0.00 0.13 2.41
New Brunswick 0.24 0.00 0.15 2.77
Quebec 3.56 0.02 2.25 37.48
Ontario 14.24 0.17 8.69 128.76
Manitoba 2.16 0.04 1.31 22.94
Saskatchewan 322.86 4.05 58.30 685.44
Alberta 31.58 0.26 19.27 204.88
British Columbia 3.61 0.07 2.18 32.41
Yukon 0.02 0.00 0.01 0.13
Northwest Territories 0.04 0.00 0.02 0.23
Nunavut 0.02 0.00 0.01 0.11
Canadian territorial enclaves abroad 0.00 0.00 0.00 0.00
Total 378.66 4.61 92.40 1118.71
Data sources: Statistics Canada, PBO, analysis by CERI
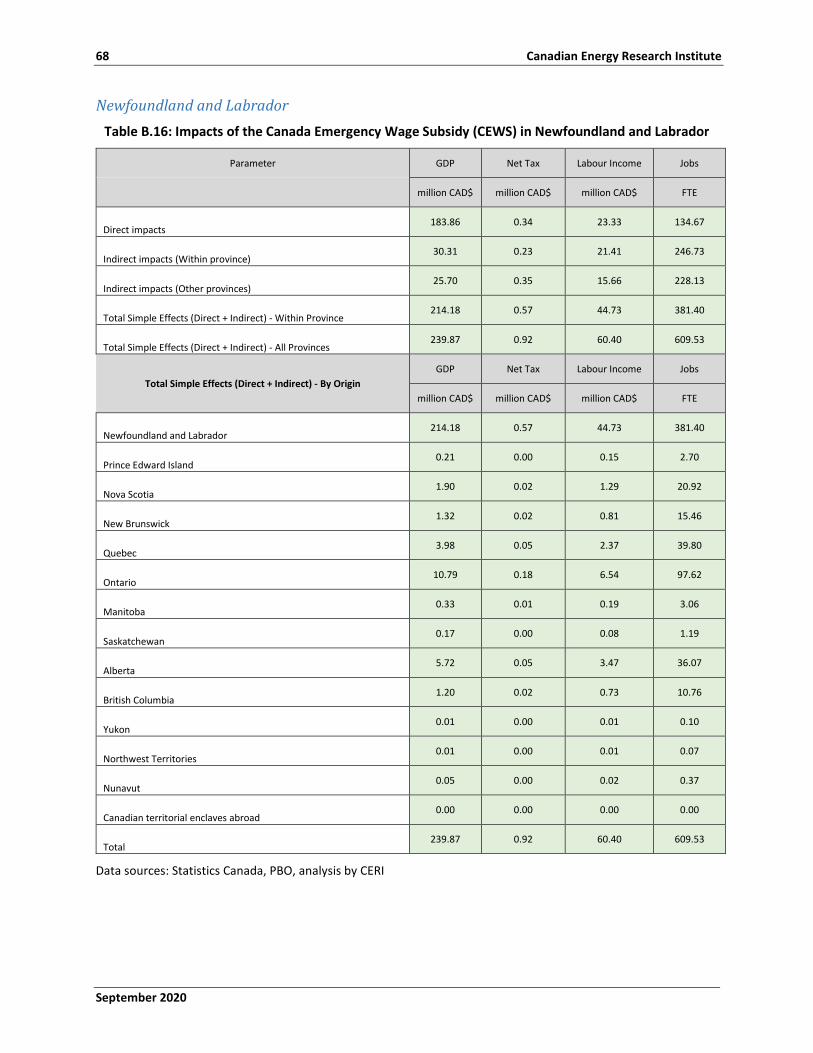
68 Canadian Energy Research Institute
September 2020
Newfoundland and Labrador Table B.16: Impacts of the Canada Emergency Wage Subsidy (CEWS) in Newfoundland and Labrador
Parameter GDP Net Tax Labour Income Jobs
million CAD$ million CAD$ million CAD$ FTE
Direct impacts 183.86 0.34 23.33 134.67
Indirect impacts (Within province) 30.31 0.23 21.41 246.73
Indirect impacts (Other provinces) 25.70 0.35 15.66 228.13
Total Simple Effects (Direct + Indirect) - Within Province 214.18 0.57 44.73 381.40
Total Simple Effects (Direct + Indirect) - All Provinces 239.87 0.92 60.40 609.53
Total Simple Effects (Direct + Indirect) - By Origin GDP Net Tax Labour Income Jobs
million CAD$ million CAD$ million CAD$ FTE
Newfoundland and Labrador 214.18 0.57 44.73 381.40
Prince Edward Island 0.21 0.00 0.15 2.70
Nova Scotia 1.90 0.02 1.29 20.92
New Brunswick 1.32 0.02 0.81 15.46
Quebec 3.98 0.05 2.37 39.80
Ontario 10.79 0.18 6.54 97.62
Manitoba 0.33 0.01 0.19 3.06
Saskatchewan 0.17 0.00 0.08 1.19
Alberta 5.72 0.05 3.47 36.07
British Columbia 1.20 0.02 0.73 10.76
Yukon 0.01 0.00 0.01 0.10
Northwest Territories 0.01 0.00 0.01 0.07
Nunavut 0.05 0.00 0.02 0.37
Canadian territorial enclaves abroad 0.00 0.00 0.00 0.00
Total 239.87 0.92 60.40 609.53
Data sources: Statistics Canada, PBO, analysis by CERI
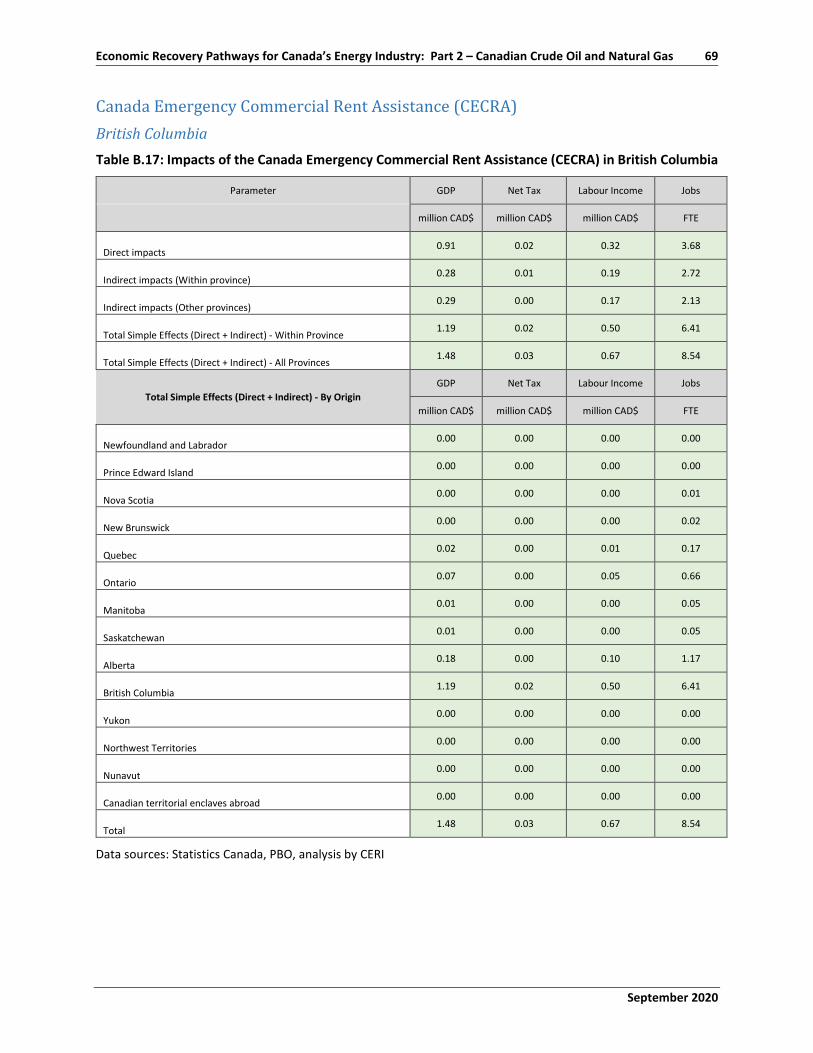
September 2020
Economic Recovery Pathways for Canada’s Energy Industry: Part 2 – Canadian Crude Oil and Natural Gas 69
Canada Emergency Commercial Rent Assistance (CECRA) British Columbia Table B.17: Impacts of the Canada Emergency Commercial Rent Assistance (CECRA) in British Columbia
Parameter GDP Net Tax Labour Income Jobs
million CAD$ million CAD$ million CAD$ FTE
Direct impacts 0.91 0.02 0.32 3.68
Indirect impacts (Within province) 0.28 0.01 0.19 2.72
Indirect impacts (Other provinces) 0.29 0.00 0.17 2.13
Total Simple Effects (Direct + Indirect) - Within Province 1.19 0.02 0.50 6.41
Total Simple Effects (Direct + Indirect) - All Provinces 1.48 0.03 0.67 8.54
Total Simple Effects (Direct + Indirect) - By Origin GDP Net Tax Labour Income Jobs
million CAD$ million CAD$ million CAD$ FTE
Newfoundland and Labrador 0.00 0.00 0.00 0.00
Prince Edward Island 0.00 0.00 0.00 0.00
Nova Scotia 0.00 0.00 0.00 0.01
New Brunswick 0.00 0.00 0.00 0.02
Quebec 0.02 0.00 0.01 0.17
Ontario 0.07 0.00 0.05 0.66
Manitoba 0.01 0.00 0.00 0.05
Saskatchewan 0.01 0.00 0.00 0.05
Alberta 0.18 0.00 0.10 1.17
British Columbia 1.19 0.02 0.50 6.41
Yukon 0.00 0.00 0.00 0.00
Northwest Territories 0.00 0.00 0.00 0.00
Nunavut 0.00 0.00 0.00 0.00
Canadian territorial enclaves abroad 0.00 0.00 0.00 0.00
Total 1.48 0.03 0.67 8.54
Data sources: Statistics Canada, PBO, analysis by CERI
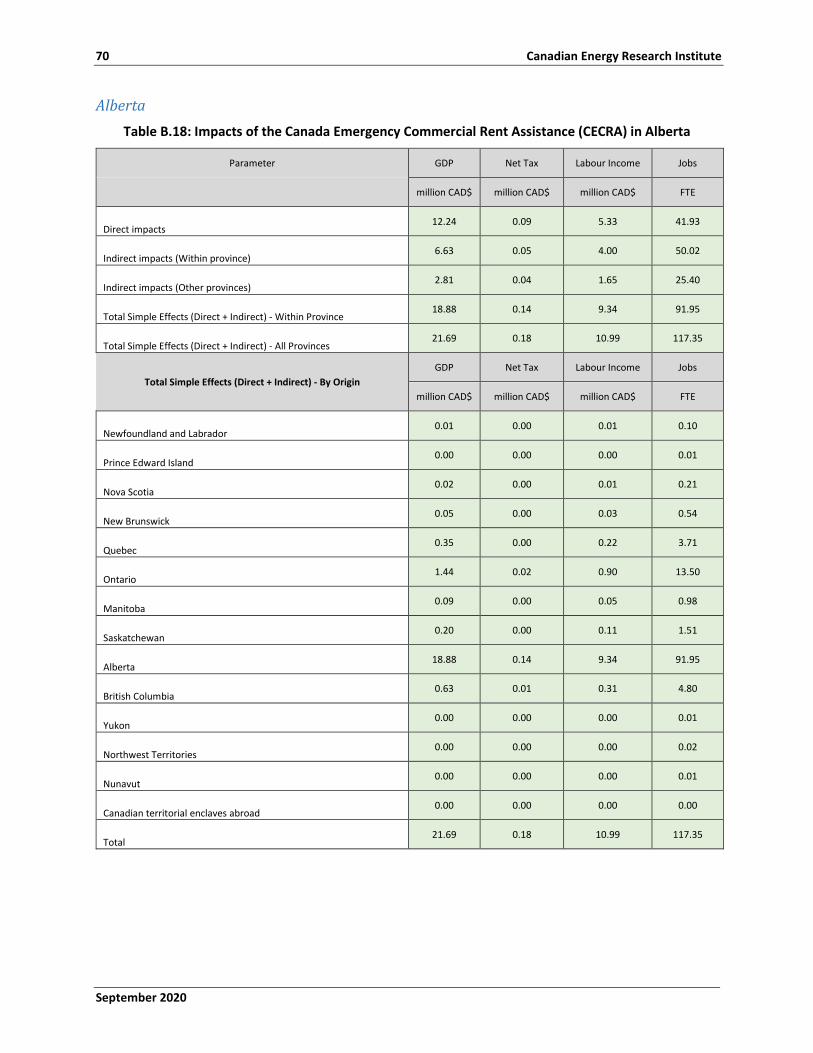
70 Canadian Energy Research Institute
September 2020
Alberta Table B.18: Impacts of the Canada Emergency Commercial Rent Assistance (CECRA) in Alberta
Parameter GDP Net Tax Labour Income Jobs
million CAD$ million CAD$ million CAD$ FTE
Direct impacts 12.24 0.09 5.33 41.93
Indirect impacts (Within province) 6.63 0.05 4.00 50.02
Indirect impacts (Other provinces) 2.81 0.04 1.65 25.40
Total Simple Effects (Direct + Indirect) - Within Province 18.88 0.14 9.34 91.95
Total Simple Effects (Direct + Indirect) - All Provinces 21.69 0.18 10.99 117.35
Total Simple Effects (Direct + Indirect) - By Origin GDP Net Tax Labour Income Jobs
million CAD$ million CAD$ million CAD$ FTE
Newfoundland and Labrador 0.01 0.00 0.01 0.10
Prince Edward Island 0.00 0.00 0.00 0.01
Nova Scotia 0.02 0.00 0.01 0.21
New Brunswick 0.05 0.00 0.03 0.54
Quebec 0.35 0.00 0.22 3.71
Ontario 1.44 0.02 0.90 13.50
Manitoba 0.09 0.00 0.05 0.98
Saskatchewan 0.20 0.00 0.11 1.51
Alberta 18.88 0.14 9.34 91.95
British Columbia 0.63 0.01 0.31 4.80
Yukon 0.00 0.00 0.00 0.01
Northwest Territories 0.00 0.00 0.00 0.02
Nunavut 0.00 0.00 0.00 0.01
Canadian territorial enclaves abroad 0.00 0.00 0.00 0.00
Total 21.69 0.18 10.99 117.35
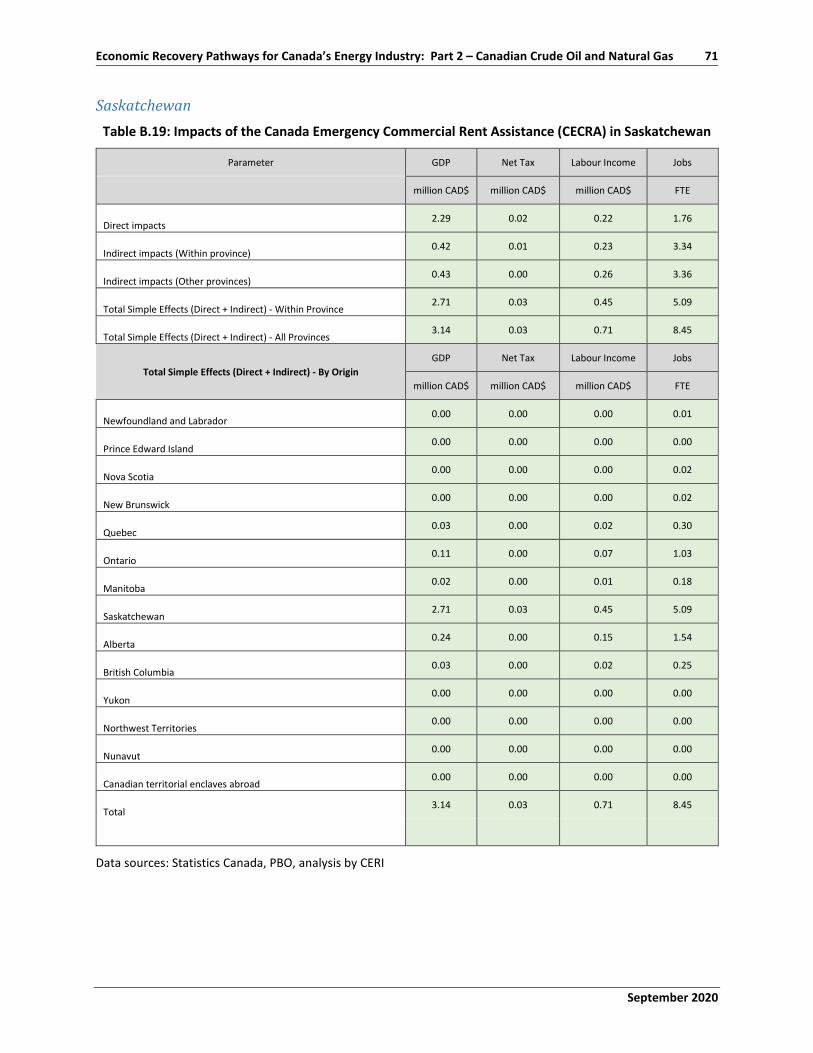
September 2020
Economic Recovery Pathways for Canada’s Energy Industry: Part 2 – Canadian Crude Oil and Natural Gas 71
Saskatchewan Table B.19: Impacts of the Canada Emergency Commercial Rent Assistance (CECRA) in Saskatchewan
Parameter GDP Net Tax Labour Income Jobs
million CAD$ million CAD$ million CAD$ FTE
Direct impacts 2.29 0.02 0.22 1.76
Indirect impacts (Within province) 0.42 0.01 0.23 3.34
Indirect impacts (Other provinces) 0.43 0.00 0.26 3.36
Total Simple Effects (Direct + Indirect) - Within Province 2.71 0.03 0.45 5.09
Total Simple Effects (Direct + Indirect) - All Provinces 3.14 0.03 0.71 8.45
Total Simple Effects (Direct + Indirect) - By Origin GDP Net Tax Labour Income Jobs
million CAD$ million CAD$ million CAD$ FTE
Newfoundland and Labrador 0.00 0.00 0.00 0.01
Prince Edward Island 0.00 0.00 0.00 0.00
Nova Scotia 0.00 0.00 0.00 0.02
New Brunswick 0.00 0.00 0.00 0.02
Quebec 0.03 0.00 0.02 0.30
Ontario 0.11 0.00 0.07 1.03
Manitoba 0.02 0.00 0.01 0.18
Saskatchewan 2.71 0.03 0.45 5.09
Alberta 0.24 0.00 0.15 1.54
British Columbia 0.03 0.00 0.02 0.25
Yukon 0.00 0.00 0.00 0.00
Northwest Territories 0.00 0.00 0.00 0.00
Nunavut 0.00 0.00 0.00 0.00
Canadian territorial enclaves abroad 0.00 0.00 0.00 0.00
Total 3.14 0.03 0.71 8.45
Data sources: Statistics Canada, PBO, analysis by CERI
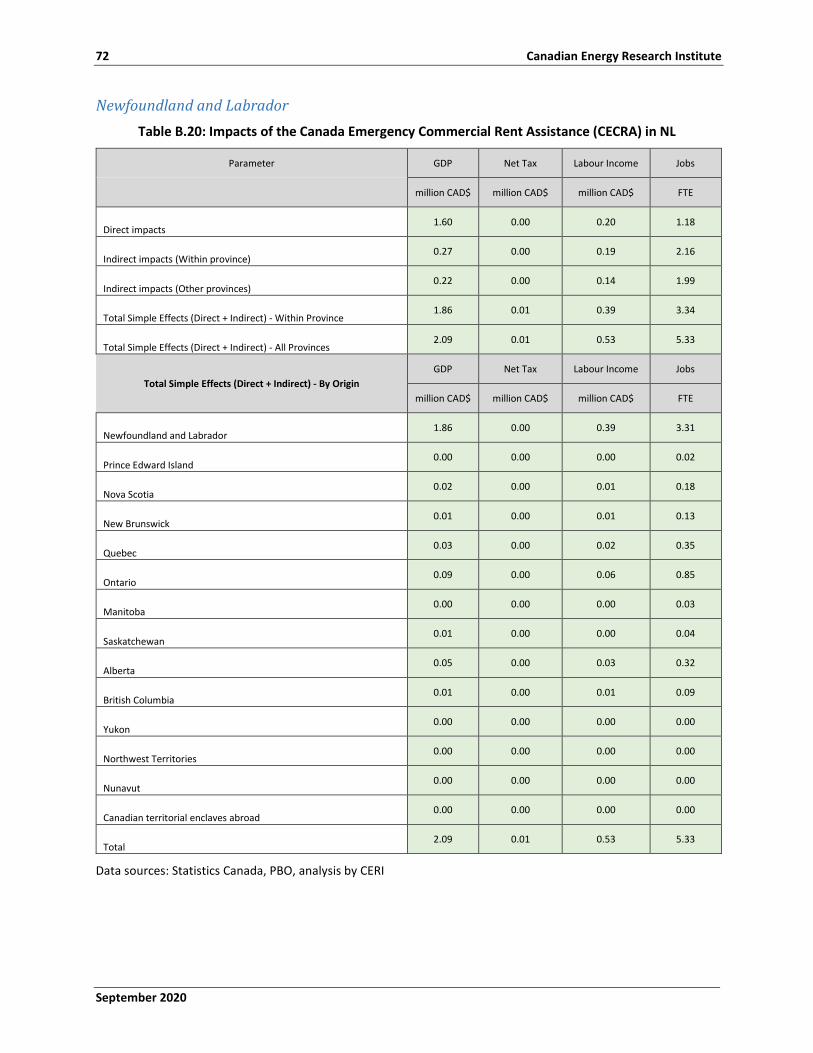
72 Canadian Energy Research Institute
September 2020
Newfoundland and Labrador Table B.20: Impacts of the Canada Emergency Commercial Rent Assistance (CECRA) in NL
Parameter GDP Net Tax Labour Income Jobs
million CAD$ million CAD$ million CAD$ FTE
Direct impacts 1.60 0.00 0.20 1.18
Indirect impacts (Within province) 0.27 0.00 0.19 2.16
Indirect impacts (Other provinces) 0.22 0.00 0.14 1.99
Total Simple Effects (Direct + Indirect) - Within Province 1.86 0.01 0.39 3.34
Total Simple Effects (Direct + Indirect) - All Provinces 2.09 0.01 0.53 5.33
Total Simple Effects (Direct + Indirect) - By Origin GDP Net Tax Labour Income Jobs
million CAD$ million CAD$ million CAD$ FTE
Newfoundland and Labrador 1.86 0.00 0.39 3.31
Prince Edward Island 0.00 0.00 0.00 0.02
Nova Scotia 0.02 0.00 0.01 0.18
New Brunswick 0.01 0.00 0.01 0.13
Quebec 0.03 0.00 0.02 0.35
Ontario 0.09 0.00 0.06 0.85
Manitoba 0.00 0.00 0.00 0.03
Saskatchewan 0.01 0.00 0.00 0.04
Alberta 0.05 0.00 0.03 0.32
British Columbia 0.01 0.00 0.01 0.09
Yukon 0.00 0.00 0.00 0.00
Northwest Territories 0.00 0.00 0.00 0.00
Nunavut 0.00 0.00 0.00 0.00
Canadian territorial enclaves abroad 0.00 0.00 0.00 0.00
Total 2.09 0.01 0.53 5.33
Data sources: Statistics Canada, PBO, analysis by CERI
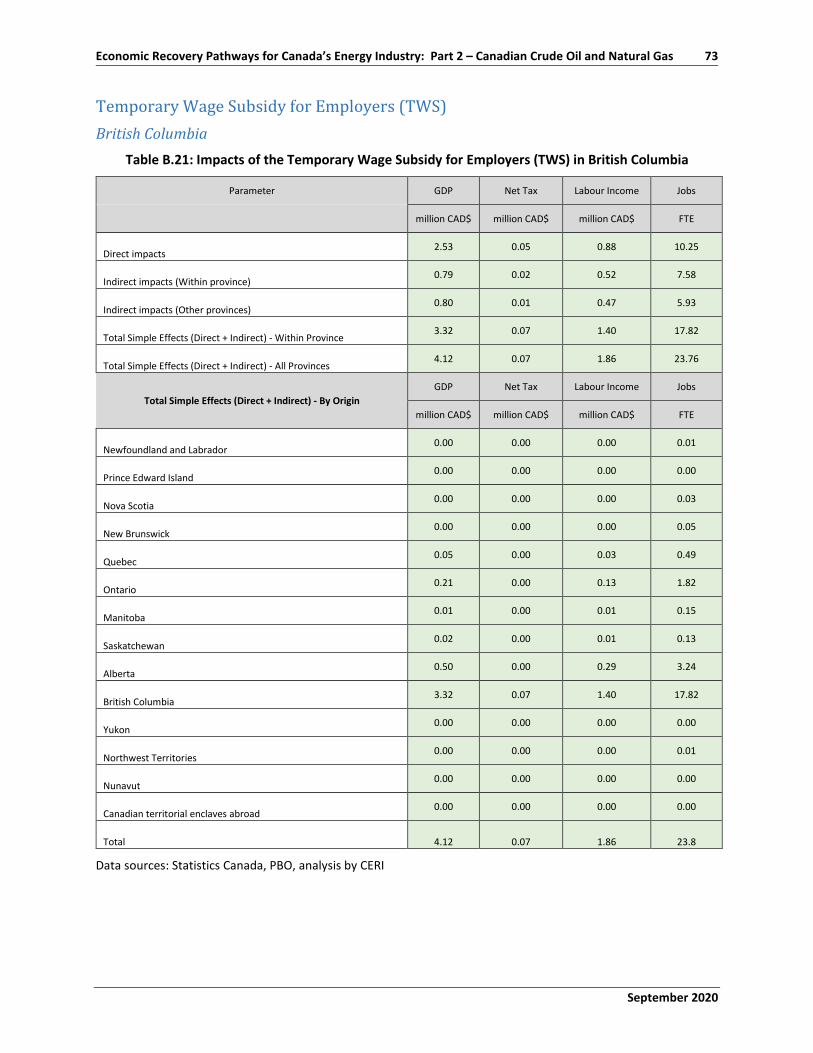
September 2020
Economic Recovery Pathways for Canada’s Energy Industry: Part 2 – Canadian Crude Oil and Natural Gas 73
Temporary Wage Subsidy for Employers (TWS) British Columbia
Table B.21: Impacts of the Temporary Wage Subsidy for Employers (TWS) in British Columbia
Parameter GDP Net Tax Labour Income Jobs
million CAD$ million CAD$ million CAD$ FTE
Direct impacts 2.53 0.05 0.88 10.25
Indirect impacts (Within province) 0.79 0.02 0.52 7.58
Indirect impacts (Other provinces) 0.80 0.01 0.47 5.93
Total Simple Effects (Direct + Indirect) - Within Province 3.32 0.07 1.40 17.82
Total Simple Effects (Direct + Indirect) - All Provinces 4.12 0.07 1.86 23.76
Total Simple Effects (Direct + Indirect) - By Origin GDP Net Tax Labour Income Jobs
million CAD$ million CAD$ million CAD$ FTE
Newfoundland and Labrador 0.00 0.00 0.00 0.01
Prince Edward Island 0.00 0.00 0.00 0.00
Nova Scotia 0.00 0.00 0.00 0.03
New Brunswick 0.00 0.00 0.00 0.05
Quebec 0.05 0.00 0.03 0.49
Ontario 0.21 0.00 0.13 1.82
Manitoba 0.01 0.00 0.01 0.15
Saskatchewan 0.02 0.00 0.01 0.13
Alberta 0.50 0.00 0.29 3.24
British Columbia 3.32 0.07 1.40 17.82
Yukon 0.00 0.00 0.00 0.00
Northwest Territories 0.00 0.00 0.00 0.01
Nunavut 0.00 0.00 0.00 0.00
Canadian territorial enclaves abroad 0.00 0.00 0.00 0.00
Total 4.12 0.07 1.86 23.8
Data sources: Statistics Canada, PBO, analysis by CERI

74 Canadian Energy Research Institute
September 2020
Alberta Table B.22: Impacts of the Temporary Wage Subsidy for Employers (TWS) in Alberta
Parameter GDP Net Tax Labour Income Jobs
million CAD$ million CAD$ million CAD$ FTE
Direct impacts 34.07 0.24 14.84 116.67
Indirect impacts (Within province) 18.46 0.15 11.14 139.18
Indirect impacts (Other provinces) 7.81 0.11 4.60 70.69
Total Simple Effects (Direct + Indirect) - Within Province 52.53 0.39 25.98 255.85
Total Simple Effects (Direct + Indirect) - All Provinces 60.34 0.50 30.58 326.54
Total Simple Effects (Direct + Indirect) - By Origin GDP Net Tax Labour Income Jobs
million CAD$ million CAD$ million CAD$ FTE
Newfoundland and Labrador 0.04 0.00 0.02 0.28
Prince Edward Island 0.00 0.00 0.00 0.04
Nova Scotia 0.05 0.00 0.03 0.58
New Brunswick 0.15 0.00 0.08 1.50
Quebec 0.96 0.01 0.61 10.31
Ontario 4.00 0.06 2.52 37.56
Manitoba 0.26 0.01 0.15 2.71
Saskatchewan 0.57 0.01 0.30 4.20
Alberta 52.53 0.39 25.98 255.85
British Columbia 1.76 0.03 0.88 13.36
Yukon 0.00 0.00 0.00 0.03
Northwest Territories 0.01 0.00 0.01 0.07
Nunavut 0.01 0.00 0.00 0.04
Canadian territorial enclaves abroad 0.00 0.00 0.00 0.00
Total 60.34 0.50 30.59 326.5
Data sources: Statistics Canada, PBO, analysis by CERI
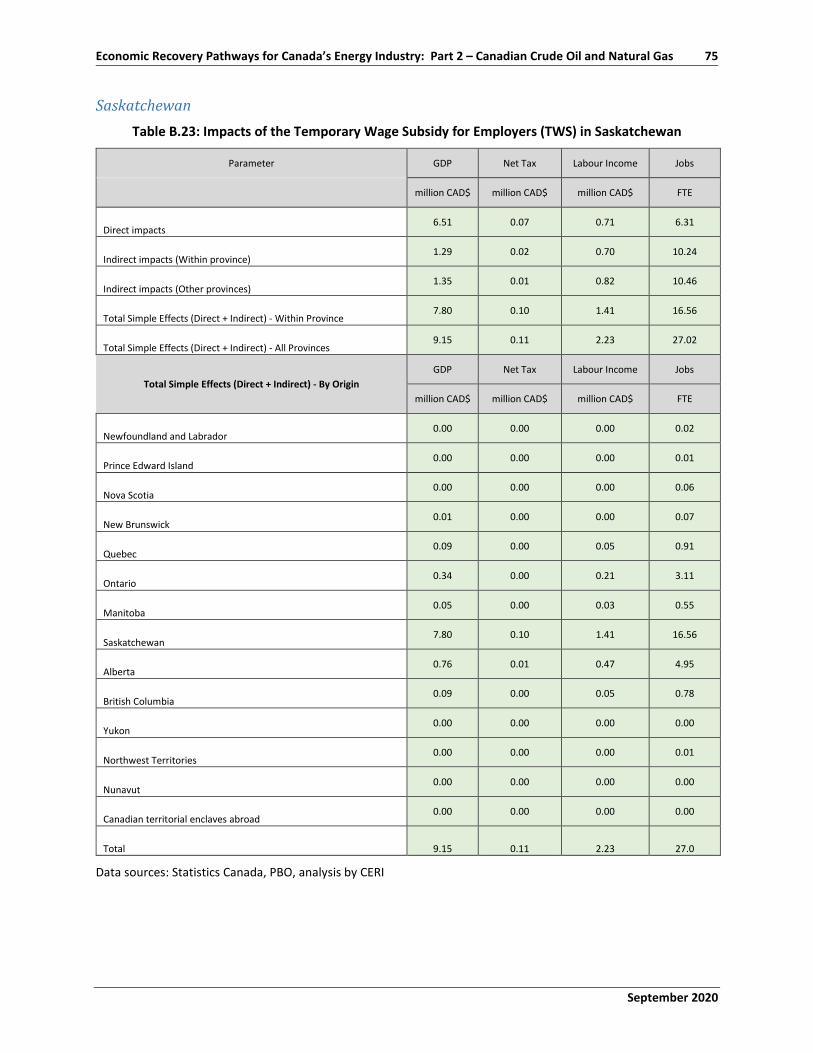
September 2020
Economic Recovery Pathways for Canada’s Energy Industry: Part 2 – Canadian Crude Oil and Natural Gas 75
Saskatchewan Table B.23: Impacts of the Temporary Wage Subsidy for Employers (TWS) in Saskatchewan
Parameter GDP Net Tax Labour Income Jobs
million CAD$ million CAD$ million CAD$ FTE
Direct impacts 6.51 0.07 0.71 6.31
Indirect impacts (Within province) 1.29 0.02 0.70 10.24
Indirect impacts (Other provinces) 1.35 0.01 0.82 10.46
Total Simple Effects (Direct + Indirect) - Within Province 7.80 0.10 1.41 16.56
Total Simple Effects (Direct + Indirect) - All Provinces 9.15 0.11 2.23 27.02
Total Simple Effects (Direct + Indirect) - By Origin GDP Net Tax Labour Income Jobs
million CAD$ million CAD$ million CAD$ FTE
Newfoundland and Labrador 0.00 0.00 0.00 0.02
Prince Edward Island 0.00 0.00 0.00 0.01
Nova Scotia 0.00 0.00 0.00 0.06
New Brunswick 0.01 0.00 0.00 0.07
Quebec 0.09 0.00 0.05 0.91
Ontario 0.34 0.00 0.21 3.11
Manitoba 0.05 0.00 0.03 0.55
Saskatchewan 7.80 0.10 1.41 16.56
Alberta 0.76 0.01 0.47 4.95
British Columbia 0.09 0.00 0.05 0.78
Yukon 0.00 0.00 0.00 0.00
Northwest Territories 0.00 0.00 0.00 0.01
Nunavut 0.00 0.00 0.00 0.00
Canadian territorial enclaves abroad 0.00 0.00 0.00 0.00
Total 9.15 0.11 2.23 27.0
Data sources: Statistics Canada, PBO, analysis by CERI
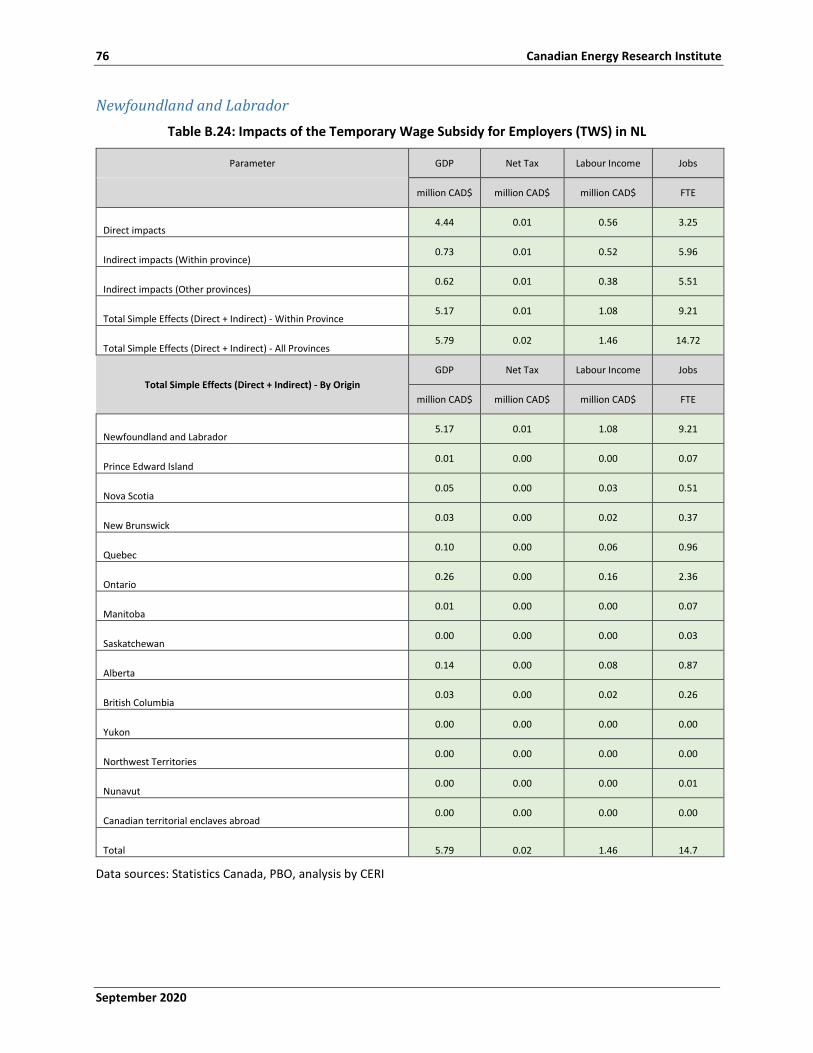
76 Canadian Energy Research Institute
September 2020
Newfoundland and Labrador Table B.24: Impacts of the Temporary Wage Subsidy for Employers (TWS) in NL
Parameter GDP Net Tax Labour Income Jobs
million CAD$ million CAD$ million CAD$ FTE
Direct impacts 4.44 0.01 0.56 3.25
Indirect impacts (Within province) 0.73 0.01 0.52 5.96
Indirect impacts (Other provinces) 0.62 0.01 0.38 5.51
Total Simple Effects (Direct + Indirect) - Within Province 5.17 0.01 1.08 9.21
Total Simple Effects (Direct + Indirect) - All Provinces 5.79 0.02 1.46 14.72
Total Simple Effects (Direct + Indirect) - By Origin GDP Net Tax Labour Income Jobs
million CAD$ million CAD$ million CAD$ FTE
Newfoundland and Labrador 5.17 0.01 1.08 9.21
Prince Edward Island 0.01 0.00 0.00 0.07
Nova Scotia 0.05 0.00 0.03 0.51
New Brunswick 0.03 0.00 0.02 0.37
Quebec 0.10 0.00 0.06 0.96
Ontario 0.26 0.00 0.16 2.36
Manitoba 0.01 0.00 0.00 0.07
Saskatchewan 0.00 0.00 0.00 0.03
Alberta 0.14 0.00 0.08 0.87
British Columbia 0.03 0.00 0.02 0.26
Yukon 0.00 0.00 0.00 0.00
Northwest Territories 0.00 0.00 0.00 0.00
Nunavut 0.00 0.00 0.00 0.01
Canadian territorial enclaves abroad 0.00 0.00 0.00 0.00
Total 5.79 0.02 1.46 14.7
Data sources: Statistics Canada, PBO, analysis by CERI
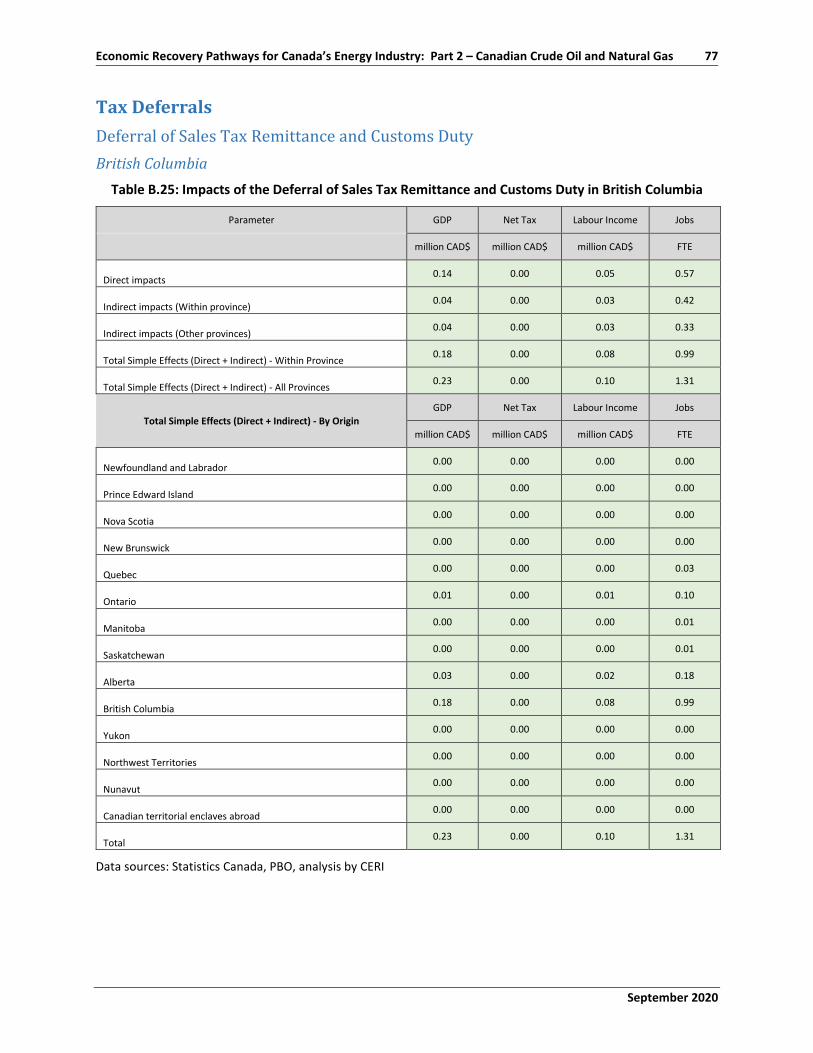
September 2020
Economic Recovery Pathways for Canada’s Energy Industry: Part 2 – Canadian Crude Oil and Natural Gas 77
Tax Deferrals Deferral of Sales Tax Remittance and Customs Duty British Columbia
Table B.25: Impacts of the Deferral of Sales Tax Remittance and Customs Duty in British Columbia
Parameter GDP Net Tax Labour Income Jobs
million CAD$ million CAD$ million CAD$ FTE
Direct impacts 0.14 0.00 0.05 0.57
Indirect impacts (Within province) 0.04 0.00 0.03 0.42
Indirect impacts (Other provinces) 0.04 0.00 0.03 0.33
Total Simple Effects (Direct + Indirect) - Within Province 0.18 0.00 0.08 0.99
Total Simple Effects (Direct + Indirect) - All Provinces 0.23 0.00 0.10 1.31
Total Simple Effects (Direct + Indirect) - By Origin GDP Net Tax Labour Income Jobs
million CAD$ million CAD$ million CAD$ FTE
Newfoundland and Labrador 0.00 0.00 0.00 0.00
Prince Edward Island 0.00 0.00 0.00 0.00
Nova Scotia 0.00 0.00 0.00 0.00
New Brunswick 0.00 0.00 0.00 0.00
Quebec 0.00 0.00 0.00 0.03
Ontario 0.01 0.00 0.01 0.10
Manitoba 0.00 0.00 0.00 0.01
Saskatchewan 0.00 0.00 0.00 0.01
Alberta 0.03 0.00 0.02 0.18
British Columbia 0.18 0.00 0.08 0.99
Yukon 0.00 0.00 0.00 0.00
Northwest Territories 0.00 0.00 0.00 0.00
Nunavut 0.00 0.00 0.00 0.00
Canadian territorial enclaves abroad 0.00 0.00 0.00 0.00
Total 0.23 0.00 0.10 1.31
Data sources: Statistics Canada, PBO, analysis by CERI
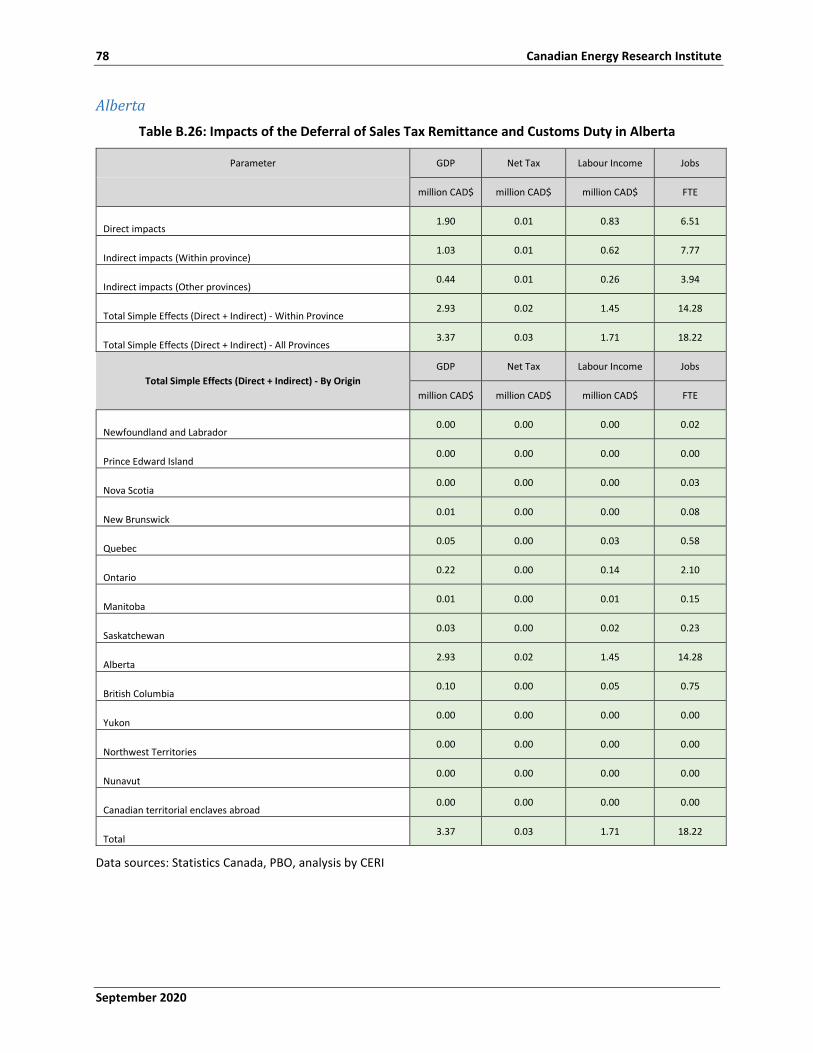
78 Canadian Energy Research Institute
September 2020
Alberta Table B.26: Impacts of the Deferral of Sales Tax Remittance and Customs Duty in Alberta
Parameter GDP Net Tax Labour Income Jobs
million CAD$ million CAD$ million CAD$ FTE
Direct impacts 1.90 0.01 0.83 6.51
Indirect impacts (Within province) 1.03 0.01 0.62 7.77
Indirect impacts (Other provinces) 0.44 0.01 0.26 3.94
Total Simple Effects (Direct + Indirect) - Within Province 2.93 0.02 1.45 14.28
Total Simple Effects (Direct + Indirect) - All Provinces 3.37 0.03 1.71 18.22
Total Simple Effects (Direct + Indirect) - By Origin GDP Net Tax Labour Income Jobs
million CAD$ million CAD$ million CAD$ FTE
Newfoundland and Labrador 0.00 0.00 0.00 0.02
Prince Edward Island 0.00 0.00 0.00 0.00
Nova Scotia 0.00 0.00 0.00 0.03
New Brunswick 0.01 0.00 0.00 0.08
Quebec 0.05 0.00 0.03 0.58
Ontario 0.22 0.00 0.14 2.10
Manitoba 0.01 0.00 0.01 0.15
Saskatchewan 0.03 0.00 0.02 0.23
Alberta 2.93 0.02 1.45 14.28
British Columbia 0.10 0.00 0.05 0.75
Yukon 0.00 0.00 0.00 0.00
Northwest Territories 0.00 0.00 0.00 0.00
Nunavut 0.00 0.00 0.00 0.00
Canadian territorial enclaves abroad 0.00 0.00 0.00 0.00
Total 3.37 0.03 1.71 18.22
Data sources: Statistics Canada, PBO, analysis by CERI
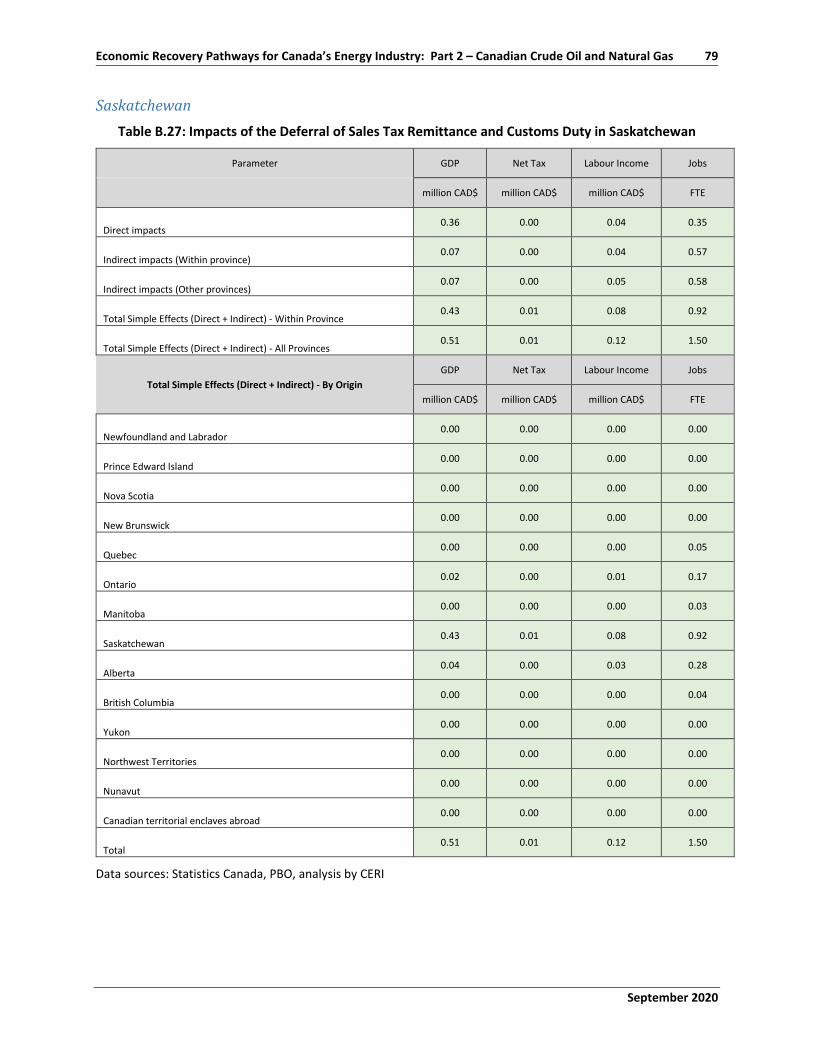
September 2020
Economic Recovery Pathways for Canada’s Energy Industry: Part 2 – Canadian Crude Oil and Natural Gas 79
Saskatchewan Table B.27: Impacts of the Deferral of Sales Tax Remittance and Customs Duty in Saskatchewan
Parameter GDP Net Tax Labour Income Jobs
million CAD$ million CAD$ million CAD$ FTE
Direct impacts 0.36 0.00 0.04 0.35
Indirect impacts (Within province) 0.07 0.00 0.04 0.57
Indirect impacts (Other provinces) 0.07 0.00 0.05 0.58
Total Simple Effects (Direct + Indirect) - Within Province 0.43 0.01 0.08 0.92
Total Simple Effects (Direct + Indirect) - All Provinces 0.51 0.01 0.12 1.50
Total Simple Effects (Direct + Indirect) - By Origin GDP Net Tax Labour Income Jobs
million CAD$ million CAD$ million CAD$ FTE
Newfoundland and Labrador 0.00 0.00 0.00 0.00
Prince Edward Island 0.00 0.00 0.00 0.00
Nova Scotia 0.00 0.00 0.00 0.00
New Brunswick 0.00 0.00 0.00 0.00
Quebec 0.00 0.00 0.00 0.05
Ontario 0.02 0.00 0.01 0.17
Manitoba 0.00 0.00 0.00 0.03
Saskatchewan 0.43 0.01 0.08 0.92
Alberta 0.04 0.00 0.03 0.28
British Columbia 0.00 0.00 0.00 0.04
Yukon 0.00 0.00 0.00 0.00
Northwest Territories 0.00 0.00 0.00 0.00
Nunavut 0.00 0.00 0.00 0.00
Canadian territorial enclaves abroad 0.00 0.00 0.00 0.00
Total 0.51 0.01 0.12 1.50
Data sources: Statistics Canada, PBO, analysis by CERI
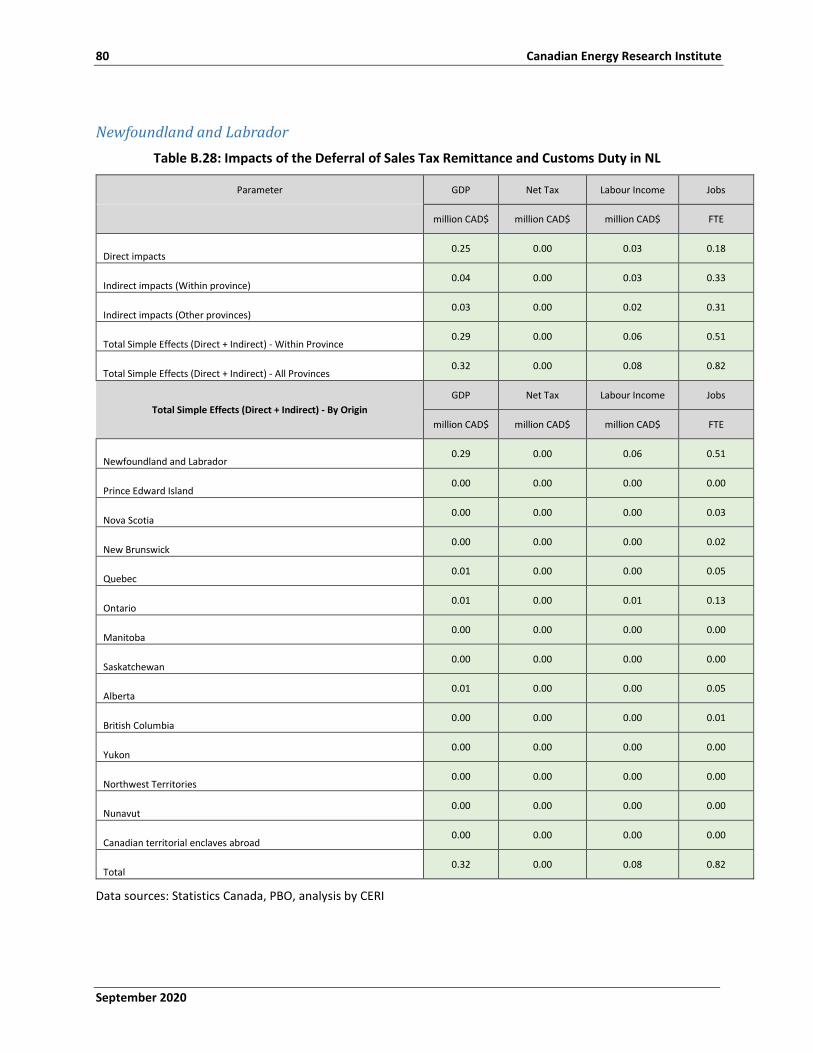
80 Canadian Energy Research Institute
September 2020
Newfoundland and Labrador Table B.28: Impacts of the Deferral of Sales Tax Remittance and Customs Duty in NL
Parameter GDP Net Tax Labour Income Jobs
million CAD$ million CAD$ million CAD$ FTE
Direct impacts 0.25 0.00 0.03 0.18
Indirect impacts (Within province) 0.04 0.00 0.03 0.33
Indirect impacts (Other provinces) 0.03 0.00 0.02 0.31
Total Simple Effects (Direct + Indirect) - Within Province 0.29 0.00 0.06 0.51
Total Simple Effects (Direct + Indirect) - All Provinces 0.32 0.00 0.08 0.82
Total Simple Effects (Direct + Indirect) - By Origin GDP Net Tax Labour Income Jobs
million CAD$ million CAD$ million CAD$ FTE
Newfoundland and Labrador 0.29 0.00 0.06 0.51
Prince Edward Island 0.00 0.00 0.00 0.00
Nova Scotia 0.00 0.00 0.00 0.03
New Brunswick 0.00 0.00 0.00 0.02
Quebec 0.01 0.00 0.00 0.05
Ontario 0.01 0.00 0.01 0.13
Manitoba 0.00 0.00 0.00 0.00
Saskatchewan 0.00 0.00 0.00 0.00
Alberta 0.01 0.00 0.00 0.05
British Columbia 0.00 0.00 0.00 0.01
Yukon 0.00 0.00 0.00 0.00
Northwest Territories 0.00 0.00 0.00 0.00
Nunavut 0.00 0.00 0.00 0.00
Canadian territorial enclaves abroad 0.00 0.00 0.00 0.00
Total 0.32 0.00 0.08 0.82
Data sources: Statistics Canada, PBO, analysis by CERI
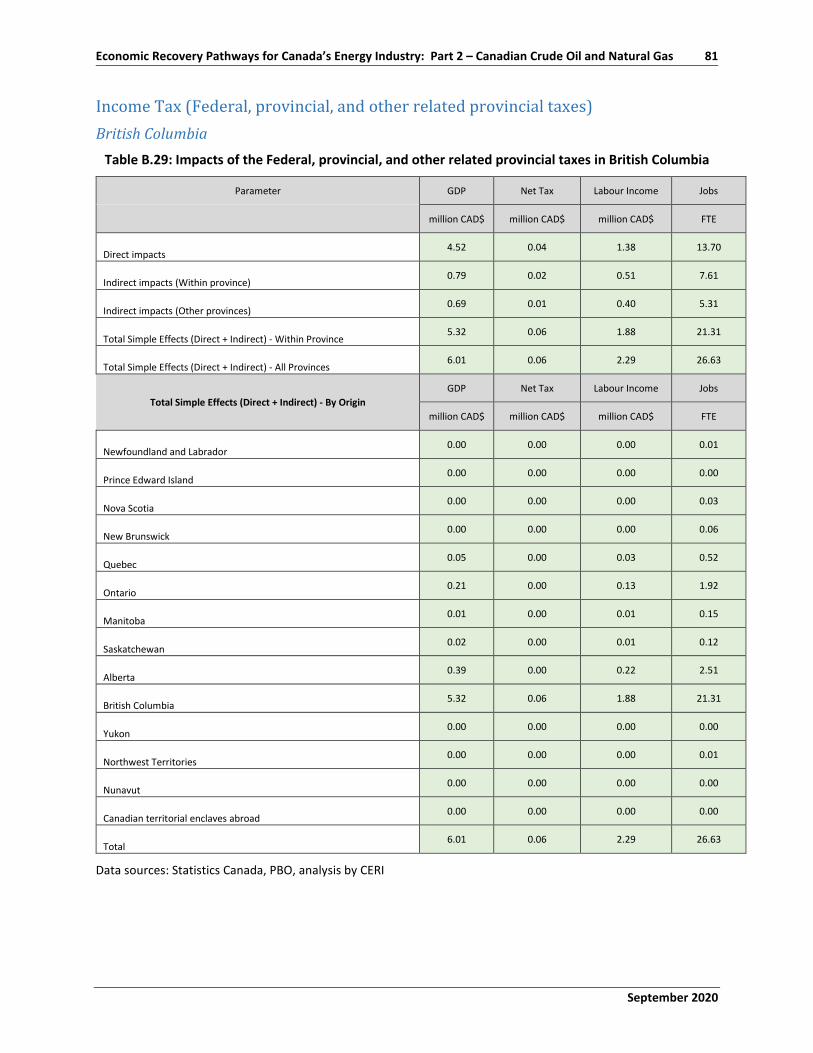
September 2020
Economic Recovery Pathways for Canada’s Energy Industry: Part 2 – Canadian Crude Oil and Natural Gas 81
Income Tax (Federal, provincial, and other related provincial taxes) British Columbia
Table B.29: Impacts of the Federal, provincial, and other related provincial taxes in British Columbia
Parameter GDP Net Tax Labour Income Jobs
million CAD$ million CAD$ million CAD$ FTE
Direct impacts 4.52 0.04 1.38 13.70
Indirect impacts (Within province) 0.79 0.02 0.51 7.61
Indirect impacts (Other provinces) 0.69 0.01 0.40 5.31
Total Simple Effects (Direct + Indirect) - Within Province 5.32 0.06 1.88 21.31
Total Simple Effects (Direct + Indirect) - All Provinces 6.01 0.06 2.29 26.63
Total Simple Effects (Direct + Indirect) - By Origin GDP Net Tax Labour Income Jobs
million CAD$ million CAD$ million CAD$ FTE
Newfoundland and Labrador 0.00 0.00 0.00 0.01
Prince Edward Island 0.00 0.00 0.00 0.00
Nova Scotia 0.00 0.00 0.00 0.03
New Brunswick 0.00 0.00 0.00 0.06
Quebec 0.05 0.00 0.03 0.52
Ontario 0.21 0.00 0.13 1.92
Manitoba 0.01 0.00 0.01 0.15
Saskatchewan 0.02 0.00 0.01 0.12
Alberta 0.39 0.00 0.22 2.51
British Columbia 5.32 0.06 1.88 21.31
Yukon 0.00 0.00 0.00 0.00
Northwest Territories 0.00 0.00 0.00 0.01
Nunavut 0.00 0.00 0.00 0.00
Canadian territorial enclaves abroad 0.00 0.00 0.00 0.00
Total 6.01 0.06 2.29 26.63
Data sources: Statistics Canada, PBO, analysis by CERI
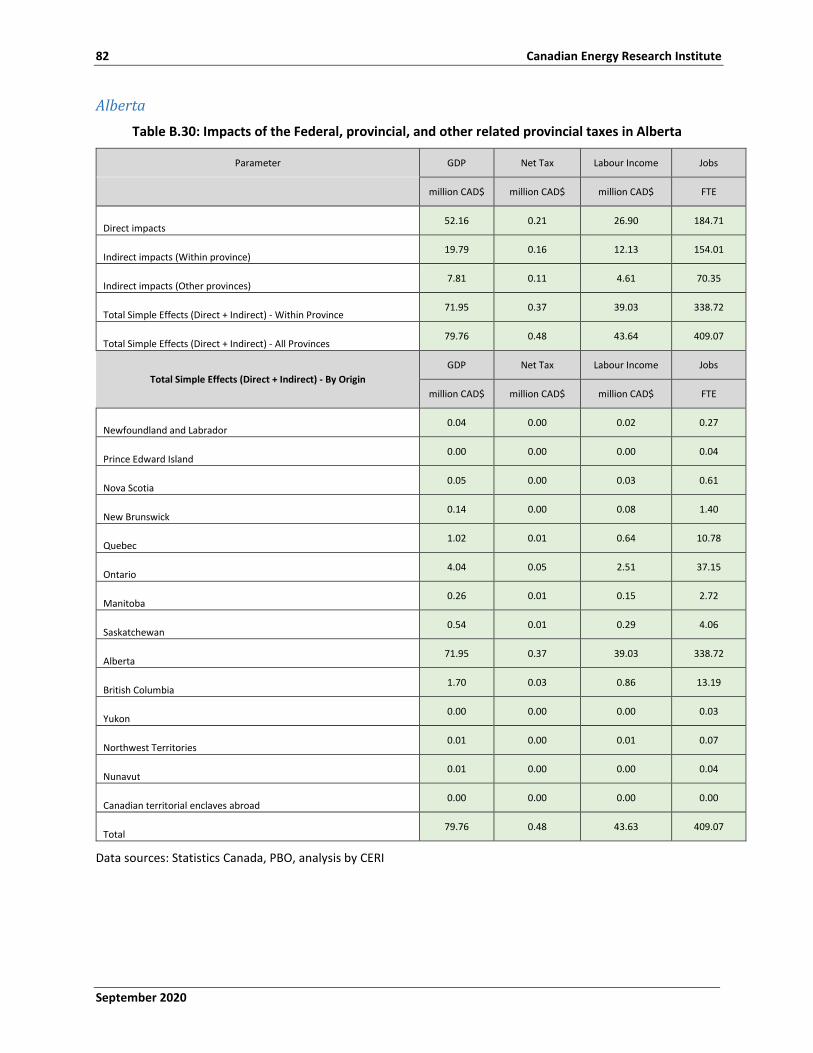
82 Canadian Energy Research Institute
September 2020
Alberta Table B.30: Impacts of the Federal, provincial, and other related provincial taxes in Alberta
Parameter GDP Net Tax Labour Income Jobs
million CAD$ million CAD$ million CAD$ FTE
Direct impacts 52.16 0.21 26.90 184.71
Indirect impacts (Within province) 19.79 0.16 12.13 154.01
Indirect impacts (Other provinces) 7.81 0.11 4.61 70.35
Total Simple Effects (Direct + Indirect) - Within Province 71.95 0.37 39.03 338.72
Total Simple Effects (Direct + Indirect) - All Provinces 79.76 0.48 43.64 409.07
Total Simple Effects (Direct + Indirect) - By Origin GDP Net Tax Labour Income Jobs
million CAD$ million CAD$ million CAD$ FTE
Newfoundland and Labrador 0.04 0.00 0.02 0.27
Prince Edward Island 0.00 0.00 0.00 0.04
Nova Scotia 0.05 0.00 0.03 0.61
New Brunswick 0.14 0.00 0.08 1.40
Quebec 1.02 0.01 0.64 10.78
Ontario 4.04 0.05 2.51 37.15
Manitoba 0.26 0.01 0.15 2.72
Saskatchewan 0.54 0.01 0.29 4.06
Alberta 71.95 0.37 39.03 338.72
British Columbia 1.70 0.03 0.86 13.19
Yukon 0.00 0.00 0.00 0.03
Northwest Territories 0.01 0.00 0.01 0.07
Nunavut 0.01 0.00 0.00 0.04
Canadian territorial enclaves abroad 0.00 0.00 0.00 0.00
Total 79.76 0.48 43.63 409.07
Data sources: Statistics Canada, PBO, analysis by CERI
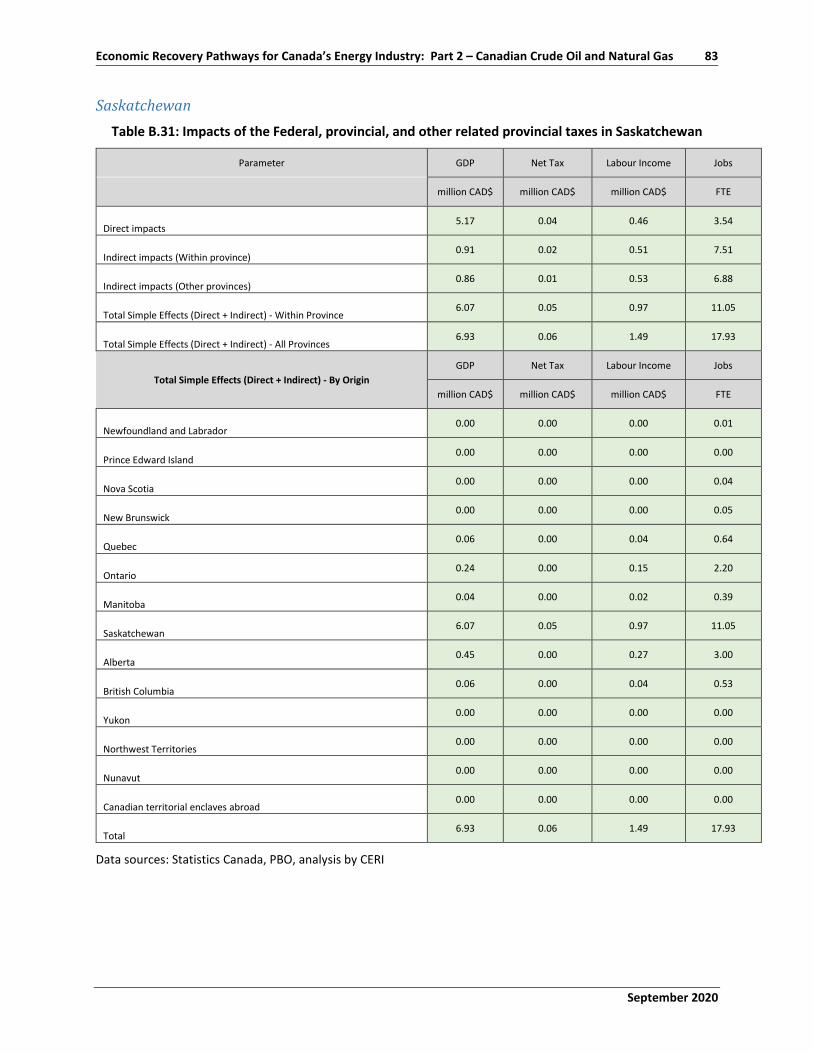
September 2020
Economic Recovery Pathways for Canada’s Energy Industry: Part 2 – Canadian Crude Oil and Natural Gas 83
Saskatchewan Table B.31: Impacts of the Federal, provincial, and other related provincial taxes in Saskatchewan
Parameter GDP Net Tax Labour Income Jobs
million CAD$ million CAD$ million CAD$ FTE
Direct impacts 5.17 0.04 0.46 3.54
Indirect impacts (Within province) 0.91 0.02 0.51 7.51
Indirect impacts (Other provinces) 0.86 0.01 0.53 6.88
Total Simple Effects (Direct + Indirect) - Within Province 6.07 0.05 0.97 11.05
Total Simple Effects (Direct + Indirect) - All Provinces 6.93 0.06 1.49 17.93
Total Simple Effects (Direct + Indirect) - By Origin GDP Net Tax Labour Income Jobs
million CAD$ million CAD$ million CAD$ FTE
Newfoundland and Labrador 0.00 0.00 0.00 0.01
Prince Edward Island 0.00 0.00 0.00 0.00
Nova Scotia 0.00 0.00 0.00 0.04
New Brunswick 0.00 0.00 0.00 0.05
Quebec 0.06 0.00 0.04 0.64
Ontario 0.24 0.00 0.15 2.20
Manitoba 0.04 0.00 0.02 0.39
Saskatchewan 6.07 0.05 0.97 11.05
Alberta 0.45 0.00 0.27 3.00
British Columbia 0.06 0.00 0.04 0.53
Yukon 0.00 0.00 0.00 0.00
Northwest Territories 0.00 0.00 0.00 0.00
Nunavut 0.00 0.00 0.00 0.00
Canadian territorial enclaves abroad 0.00 0.00 0.00 0.00
Total 6.93 0.06 1.49 17.93
Data sources: Statistics Canada, PBO, analysis by CERI
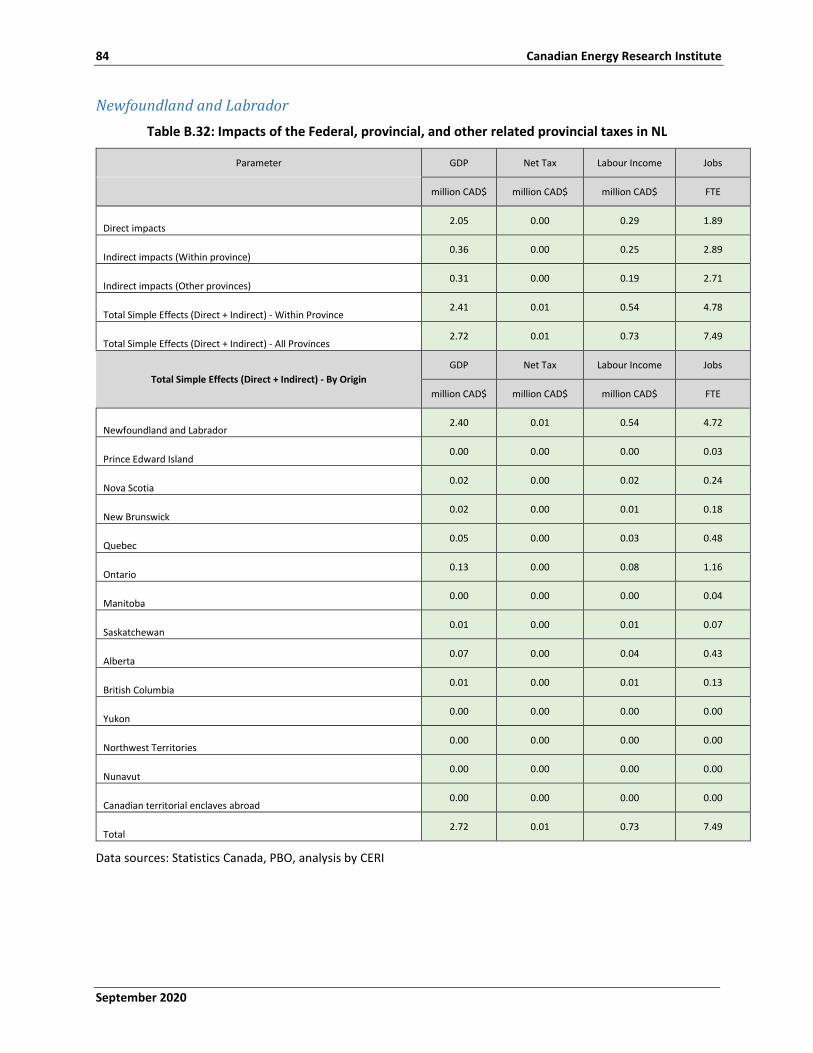
84 Canadian Energy Research Institute
September 2020
Newfoundland and Labrador Table B.32: Impacts of the Federal, provincial, and other related provincial taxes in NL
Parameter GDP Net Tax Labour Income Jobs
million CAD$ million CAD$ million CAD$ FTE
Direct impacts 2.05 0.00 0.29 1.89
Indirect impacts (Within province) 0.36 0.00 0.25 2.89
Indirect impacts (Other provinces) 0.31 0.00 0.19 2.71
Total Simple Effects (Direct + Indirect) - Within Province 2.41 0.01 0.54 4.78
Total Simple Effects (Direct + Indirect) - All Provinces 2.72 0.01 0.73 7.49
Total Simple Effects (Direct + Indirect) - By Origin GDP Net Tax Labour Income Jobs
million CAD$ million CAD$ million CAD$ FTE
Newfoundland and Labrador 2.40 0.01 0.54 4.72
Prince Edward Island 0.00 0.00 0.00 0.03
Nova Scotia 0.02 0.00 0.02 0.24
New Brunswick 0.02 0.00 0.01 0.18
Quebec 0.05 0.00 0.03 0.48
Ontario 0.13 0.00 0.08 1.16
Manitoba 0.00 0.00 0.00 0.04
Saskatchewan 0.01 0.00 0.01 0.07
Alberta 0.07 0.00 0.04 0.43
British Columbia 0.01 0.00 0.01 0.13
Yukon 0.00 0.00 0.00 0.00
Northwest Territories 0.00 0.00 0.00 0.00
Nunavut 0.00 0.00 0.00 0.00
Canadian territorial enclaves abroad 0.00 0.00 0.00 0.00
Total 2.72 0.01 0.73 7.49
Data sources: Statistics Canada, PBO, analysis by CERI
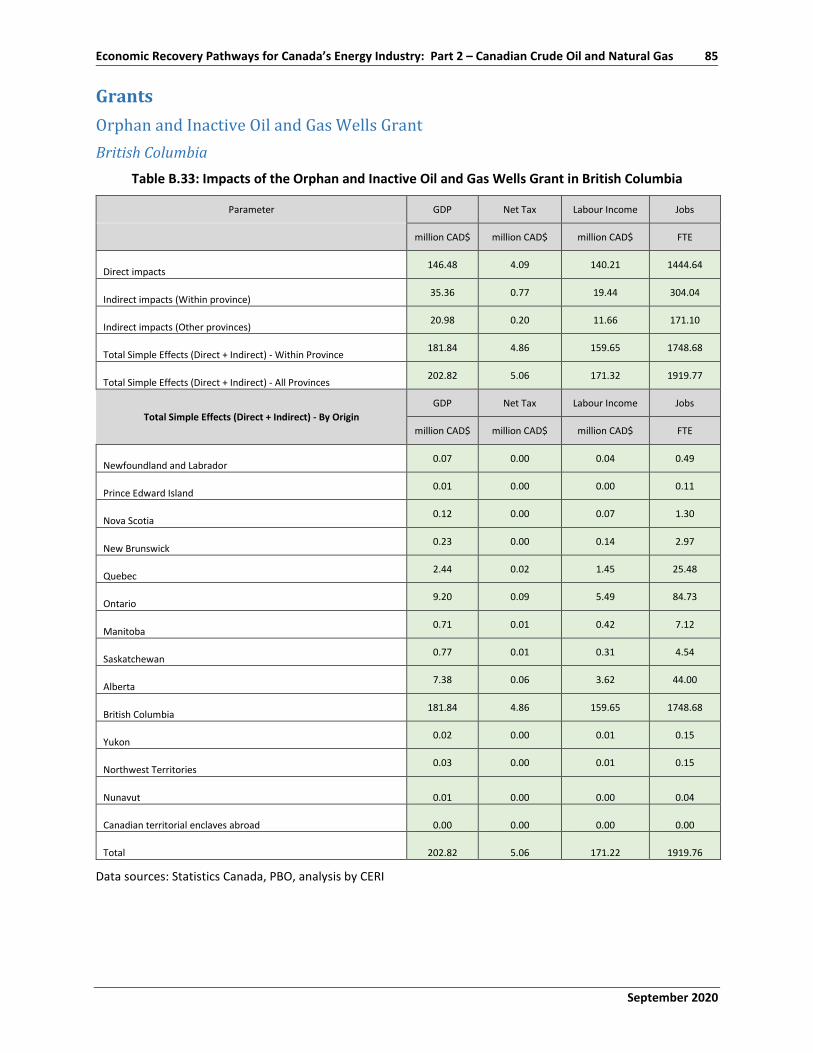
September 2020
Economic Recovery Pathways for Canada’s Energy Industry: Part 2 – Canadian Crude Oil and Natural Gas 85
Grants Orphan and Inactive Oil and Gas Wells Grant British Columbia
Table B.33: Impacts of the Orphan and Inactive Oil and Gas Wells Grant in British Columbia
Parameter GDP Net Tax Labour Income Jobs
million CAD$ million CAD$ million CAD$ FTE
Direct impacts 146.48 4.09 140.21 1444.64
Indirect impacts (Within province) 35.36 0.77 19.44 304.04
Indirect impacts (Other provinces) 20.98 0.20 11.66 171.10
Total Simple Effects (Direct + Indirect) - Within Province 181.84 4.86 159.65 1748.68
Total Simple Effects (Direct + Indirect) - All Provinces 202.82 5.06 171.32 1919.77
Total Simple Effects (Direct + Indirect) - By Origin GDP Net Tax Labour Income Jobs
million CAD$ million CAD$ million CAD$ FTE
Newfoundland and Labrador 0.07 0.00 0.04 0.49
Prince Edward Island 0.01 0.00 0.00 0.11
Nova Scotia 0.12 0.00 0.07 1.30
New Brunswick 0.23 0.00 0.14 2.97
Quebec 2.44 0.02 1.45 25.48
Ontario 9.20 0.09 5.49 84.73
Manitoba 0.71 0.01 0.42 7.12
Saskatchewan 0.77 0.01 0.31 4.54
Alberta 7.38 0.06 3.62 44.00
British Columbia 181.84 4.86 159.65 1748.68
Yukon 0.02 0.00 0.01 0.15
Northwest Territories 0.03 0.00 0.01 0.15
Nunavut 0.01 0.00 0.00 0.04
Canadian territorial enclaves abroad 0.00 0.00 0.00 0.00
Total 202.82 5.06 171.22 1919.76
Data sources: Statistics Canada, PBO, analysis by CERI
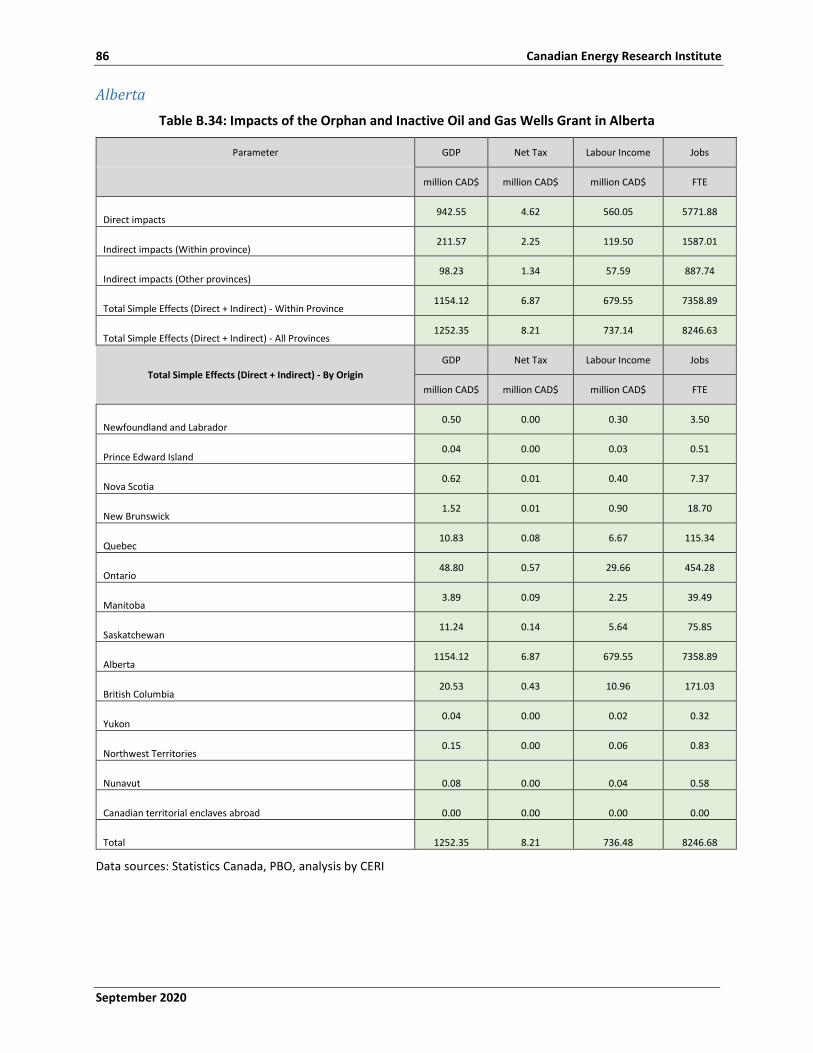
86 Canadian Energy Research Institute
September 2020
Alberta Table B.34: Impacts of the Orphan and Inactive Oil and Gas Wells Grant in Alberta
Parameter GDP Net Tax Labour Income Jobs
million CAD$ million CAD$ million CAD$ FTE
Direct impacts 942.55 4.62 560.05 5771.88
Indirect impacts (Within province) 211.57 2.25 119.50 1587.01
Indirect impacts (Other provinces) 98.23 1.34 57.59 887.74
Total Simple Effects (Direct + Indirect) - Within Province 1154.12 6.87 679.55 7358.89
Total Simple Effects (Direct + Indirect) - All Provinces 1252.35 8.21 737.14 8246.63
Total Simple Effects (Direct + Indirect) - By Origin GDP Net Tax Labour Income Jobs
million CAD$ million CAD$ million CAD$ FTE
Newfoundland and Labrador 0.50 0.00 0.30 3.50
Prince Edward Island 0.04 0.00 0.03 0.51
Nova Scotia 0.62 0.01 0.40 7.37
New Brunswick 1.52 0.01 0.90 18.70
Quebec 10.83 0.08 6.67 115.34
Ontario 48.80 0.57 29.66 454.28
Manitoba 3.89 0.09 2.25 39.49
Saskatchewan 11.24 0.14 5.64 75.85
Alberta 1154.12 6.87 679.55 7358.89
British Columbia 20.53 0.43 10.96 171.03
Yukon 0.04 0.00 0.02 0.32
Northwest Territories 0.15 0.00 0.06 0.83
Nunavut 0.08 0.00 0.04 0.58
Canadian territorial enclaves abroad 0.00 0.00 0.00 0.00
Total 1252.35 8.21 736.48 8246.68
Data sources: Statistics Canada, PBO, analysis by CERI
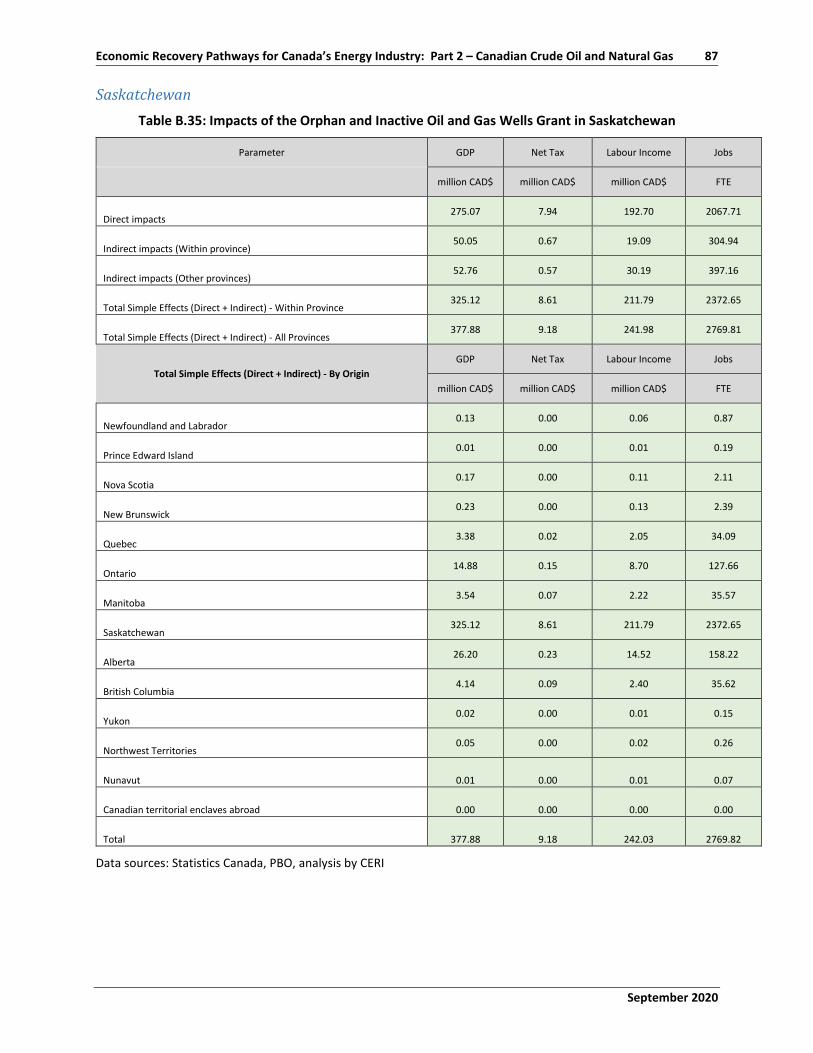
September 2020
Economic Recovery Pathways for Canada’s Energy Industry: Part 2 – Canadian Crude Oil and Natural Gas 87
Saskatchewan Table B.35: Impacts of the Orphan and Inactive Oil and Gas Wells Grant in Saskatchewan
Parameter GDP Net Tax Labour Income Jobs
million CAD$ million CAD$ million CAD$ FTE
Direct impacts 275.07 7.94 192.70 2067.71
Indirect impacts (Within province) 50.05 0.67 19.09 304.94
Indirect impacts (Other provinces) 52.76 0.57 30.19 397.16
Total Simple Effects (Direct + Indirect) - Within Province 325.12 8.61 211.79 2372.65
Total Simple Effects (Direct + Indirect) - All Provinces 377.88 9.18 241.98 2769.81
Total Simple Effects (Direct + Indirect) - By Origin GDP Net Tax Labour Income Jobs
million CAD$ million CAD$ million CAD$ FTE
Newfoundland and Labrador 0.13 0.00 0.06 0.87
Prince Edward Island 0.01 0.00 0.01 0.19
Nova Scotia 0.17 0.00 0.11 2.11
New Brunswick 0.23 0.00 0.13 2.39
Quebec 3.38 0.02 2.05 34.09
Ontario 14.88 0.15 8.70 127.66
Manitoba 3.54 0.07 2.22 35.57
Saskatchewan 325.12 8.61 211.79 2372.65
Alberta 26.20 0.23 14.52 158.22
British Columbia 4.14 0.09 2.40 35.62
Yukon 0.02 0.00 0.01 0.15
Northwest Territories 0.05 0.00 0.02 0.26
Nunavut 0.01 0.00 0.01 0.07
Canadian territorial enclaves abroad 0.00 0.00 0.00 0.00
Total 377.88 9.18 242.03 2769.82
Data sources: Statistics Canada, PBO, analysis by CERI