Embed Size (px)
Citation preview

Economic Questions and Data

Economic Questions
Economics suggests important relationships, often with policy implications, but virtually never suggests quantitative magnitudes of causal effects.

Examples of economic questions.
Does reducing class size improve elementary school education?
Is there racial discrimination in the market for home loans?
How much do cigarette taxes reduce smoking? What will the rate of inflation be next year?

Q1: Reducing Class Size (Pros)
With fewer students in the classroom, each student gets more of the teacher’s attention, fewer class disruptions, and learning is enhanced and grades improve.
Solve the problem of teacher’s excess supply

Q1: Reducing Class Size (Cons)
The observation does not seem to consistent with the actual data.
Maintaining a smaller class size costs more money.
根據教育部的資料, 93 學年度到 96 學年度,平均每年有 17 萬 169 名教師考績是甲等,約占 98.69% ,乙等和丙等都只有一千多人,都不到 1% 。

Q2: Racial Discrimination
The law prohibit the US lending institution to take race into consideration when deciding to grant or deny a request of mortgage.
Researchers of Boston Fed found that 28% of black applicants are denied for mortgages while only 9% of whites applicants are denied.
Is there a racial discrimination?

Q3: Cigarette Tax Many of the cost of smoking, such as the medical
expenses of caring or the second hand smoking, are borne by the other members of society. Because of that, there is a role of government intervention.
Basic economics suggest that raising the cigarette tax is a way to limit its consumption. But how much? NT10, NT20, or NT150?
The answer depends on the price elasticity of smoking

Q4: Inflation
Forecasting the price level in the next year is in the interests of firms (investment decision), banks (mortgages rates), financial institutions (interest rates), and economists (jobs).
The price level is especially important for central banks because the size of inflation is the key reason to hike the primary interest rates.
It is very difficult to predict the price level of the next year.

This course is about how to use data to measure causal effects.
How can we identify the causal effect?

Causality
But what is, precisely, a causal effect? The original question is a question about a causal
effect: what is the quantitative effect of an intervention that reduces class size?
The common-sense definition of causality isn’t precise enough for our purposes.
One way to identify the causal effect is through ideal randomized controlled experiment.
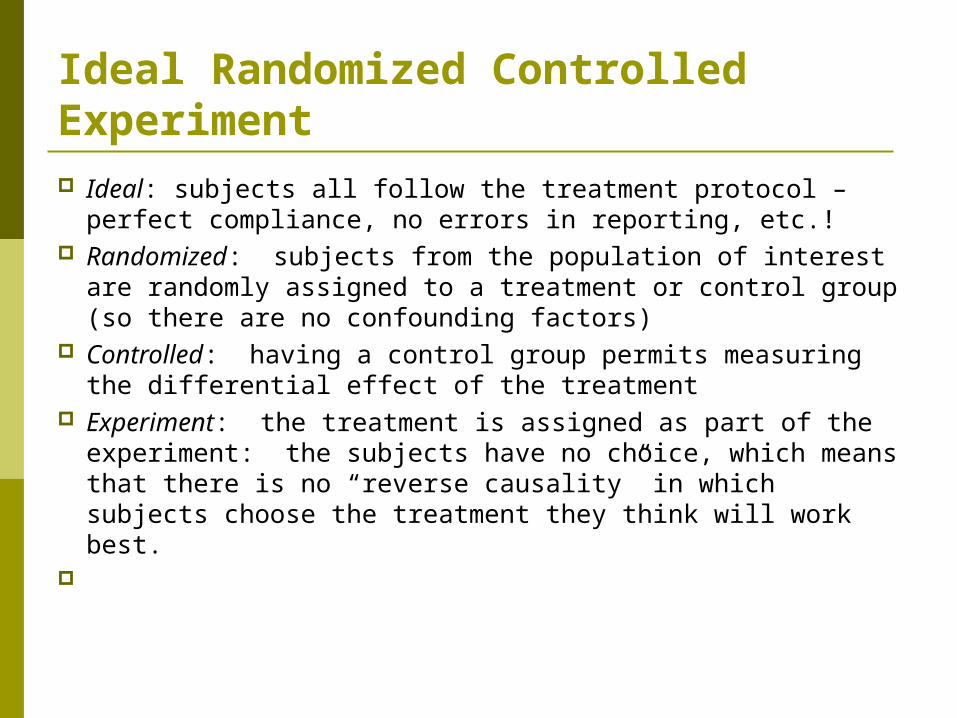
Ideal Randomized Controlled Experiment Ideal: subjects all follow the treatment protocol – perfect
compliance, no errors in reporting, etc.! Randomized: subjects from the population of interest
are randomly assigned to a treatment or control group (so there are no confounding factors)
Controlled: having a control group permits measuring the differential effect of the treatment
Experiment: the treatment is assigned as part of the experiment: the subjects have no choice, which means that there is no “reverse causality” in which subjects choose the treatment they think will work best.

Example
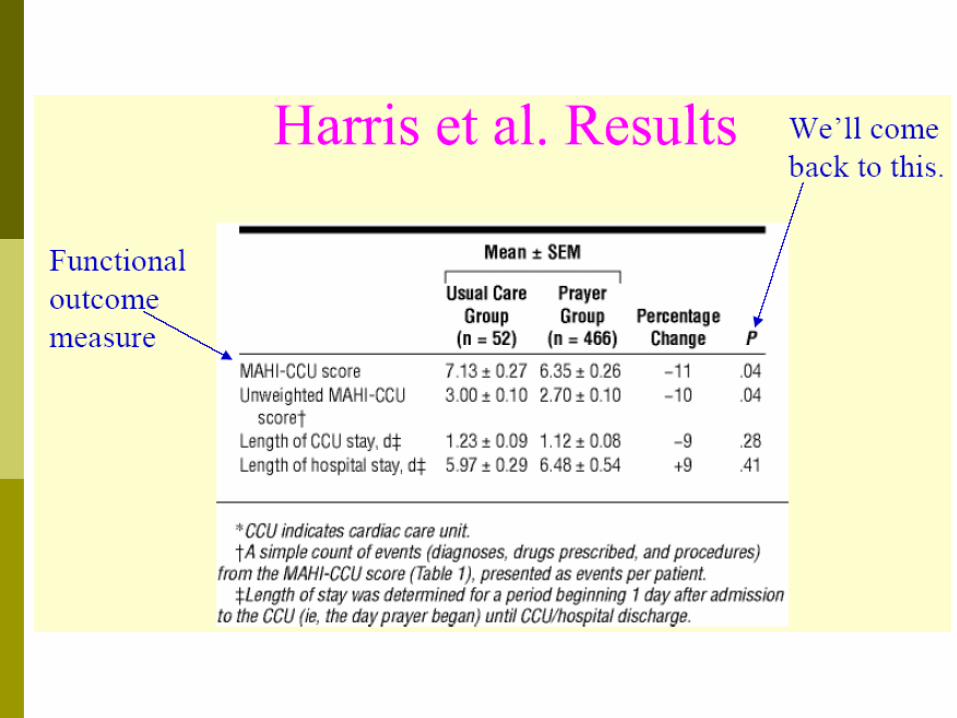
Example (Harris et al.): “A randomized, controlled trial of the effects of remote, intercessory prayer on outcomes in patients admitted to the coronary care unit”

Principles of randomized trails
Random : patients are randomly assigned into the treatment and control group
Controlled: only one group receives remote prayers
Double blind : patients (and doctors) do not know which group they are in
Ex-ante : randomly assigned prior to the experiment
Simultaneous : record outcomes for the treatment and the control at the same time

Harris et el. 的設計
Esther Duflo Ted’s lecture How to do immunizations? How to reduce malaria? How to increase child’s education?

Ideally, we would like an experiment. class size; returns to education; cigarette prices;
But almost always we only have observational (nonexperimental) data.

Problems with observational data
Observational data poses major challenges: consider estimation of returns to education
Possible Problems confounding effects (omitted factors), simultaneous causality, correlation does not imply causality.
Estimating the Demand Elasticity of Health Care for Children under 3:
Evidence from Taipei Children Subsidy Program
Hsien-Ming Lien National Cheng-Chi University
Hsing-Wen HanNational Cheng-Chi University

Motivations
Recently, there is a growing trend worldwide to lower the demand price of health care for young children
In U. S., there is a huge voice to ask the government to expand the eligibility of Medicaid, so that more children of low-income families can have the coverage
In Taiwan, the government in 2002 launched a national children subsidy program that further reduces the copayment of children under 3 to zero, despite the presence of National Health Insurance (20% copayment)

While this type of welfare program are generally well appalled, it remains unclear whether these children can benefit from a lower demand price of health care. It is widely believed that the health use of young children is unlikely to be affected by the demand price.
In other words, do children, particularly young children, obtain more health care when the price of health care is lower?
The answer hinges on the demand elasticity of health care for young children

Research Questions
How large is the demand elasticity for children under 3 in Taiwan?
How different is the demand elasticity across different income groups ?
We use the change of children subsidy program in Taiwan to estimate the demand elasticity of health care for young children.

Children Subsidy Programs in Taiwan
Year 2000: Taipei Children Subsidy Program (TCCSP) is
available for eligible children in Taipei City Subsidy includes copayment exemption and
registration fee discount Cover outpatient, ambulance, and inpatient
services Year 2001:
Anticipating a similar national program was going to start in 2001, TCCSP was substantially reduced at the beginning of that year
Outpatient service is no longer covered

Year 2002: Due to the legislation delay, Taiwan Children
Subsidy Program (TWCSP) is available for all children in Taiwan in Mar 2002
Its subsidy is similar to that in TCCSP, except for no registration fee discount
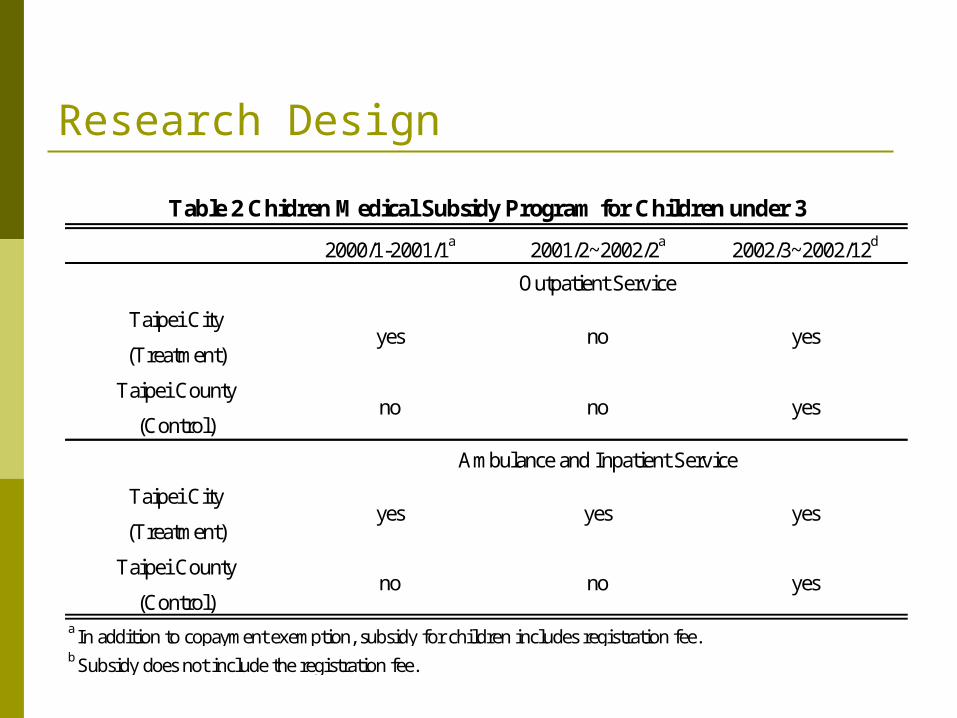
Research Design
2000/1-2001/1a 2001/2~2002/2a 2002/3~2002/12d
Taipei City
(Treatment)
Taipei County
(Control)
Taipei City
(Treatment)
Taipei County
(Control)no no yes
yes
yesnoyes
Ambulance and Inpatient Service
Outpatient Service
b Subsidy does not include the registration fee.
Table 2 Chidren Medical Subsidy Program for Children under 3
a In addition to copayment exemption, subsidy for children includes registration fee.
yes yes yes
no no

Conventional Method
2000/1-2001/1a 2001/2~2002/2a 2002/3~2002/12d
Taipei City
(Treatment)
Taipei County
(Control)
Taipei City
(Treatment)
Taipei County
(Control)no no yes
yes
yesnoyes
Ambulance and Inpatient Service
Outpatient Service
b Subsidy does not include the registration fee.
Table 2 Chidren Medical Subsidy Program for Children under 3
a In addition to copayment exemption, subsidy for children includes registration fee.
yes yes yes
no no
Problems with before and after comparison
The simple comparison [ Use (City, 2001) – Use (City, 2000)] is problematic because it ignores the effect of other confounding factors occurring over time.
In addition, children who valued the medical subsidy might move out Taipei City after the termination of TCCSP, resulting in another selection bias in the simple comparison

DID strategy
Because TCCSP is available only for children in Taipei City, not for those in nearby Taipei County, we can use children under 3 in Taipei County as the control group
Consider whether the “utilization difference” of young children between Taipei City and Taipei County decreases after the termination of TCCSP

DID Strategy (DID 1)
2000/1-2001/1a 2001/2~2002/2a 2002/3~2002/12d
Taipei City
(Treatment)
Taipei County
(Control)
Taipei City
(Treatment)
Taipei County
(Control)no no yes
yes
yesnoyes
Ambulance and Inpatient Service
Outpatient Service
b Subsidy does not include the registration fee.
Table 2 Chidren Medical Subsidy Program for Children under 3
a In addition to copayment exemption, subsidy for children includes registration fee.
yes yes yes
no no

養雞生蛋或殺雞取卵:論期交稅之降稅效果
連賢明 政大財政
動機和目的 研究動機:近年來政府實施一連串降稅政策,引發許多討
論,但彼此對降稅效果無共識,討論沒有交集。
本文目的:以 2006 年期交稅調降為例,分析降期交稅對台灣股票指數期貨(簡稱台指期)交易量和稅收影響。

研究設計: 傳統估算:比較降稅前後交易量的變化
Q 台指期(降稅後) - Q 台指期(降稅前) 降稅時機可能是內生決定,造成估計上的偏誤
本研究採差異中的差異法估計降稅效果 DID 估算:以台指期為實驗組,摩台期為控制組
[Q 台指期(降稅後) - Q 台指期(降稅前) ]- [Q 摩台期(降稅後) - Q 摩台期(降稅前) ] 透過控制組的變化,排除外生環境影響

台指期月均量趨勢2
00
00
30
00
04
00
00
50
00
06
00
00
(2
00
4-2
00
7)
口
2004/01/01 2005/01/01 2006/01/01 2007/01/01 2008/01/01時間
台指期 摩台指

台指期與摩台期月均量趨勢20
000
30
000
40
000
50
000
60
000
(2
004-2
00
7)
口
2004/01/01 2005/01/01 2006/01/01 2007/01/01 2008/01/01時間
台指期 摩台期

傳統方式高估降稅效果。 傳統估算:一年內交易量增加 26.7% DID 估算:一年內交易量增加 11.4%
降稅政策長期效果並沒有短期效果大。 傳統估算:兩年內交易量增加 30.2% DID 估算:兩年內交易量增加 4.9%
估計結果
In this course you will Learn methods for estimating causal effects using
observational data Learn some tools that can be used for other purposes,
for example forecasting using time series data; Focus on applications – theory is used only as needed to
understand the “why”s of the methods; Learn to evaluate the regression analysis of others – this
means you will be able to read/understand empirical economics papers in other econ courses;
Get some hands-on experience with regression analysis in your problem sets.

Data: Cross-Sectional Data
California School District Data
Data: Pooled Cross-Sectional Data
Can pool random cross sections and treat similar to a normal cross section. Will just need to account for time differences.

Data: Time Series Data
CPI Inflation and Unemployment in the United States, 1959-2000.

Data: Panel Data
Cigaratte Sales, Prices, and Taxes by State and Year for U.S. States, 1985-95.