Embed Size (px)
Citation preview

Bureau of Economic Geology, The University of Texas at Austin
Economic & Policy ConsiderationsReserves Symposium, July 19, 2011

©CEE-UT, 2
Dr. Michelle Michot Foss, CEE/BEG/JSG/UT
Do You Believe???
• Reserves estimation is “science + art”• Usefulness of reserves is contingent on
confidence– Reliability, quality of reporting– Due diligence is equal opportunity, but costly
• Frontier, unconventional plays raise new challenges
• FD cost, commodity price variability

©CEE-UT, 3
Dr. Michelle Michot Foss, CEE/BEG/JSG/UT
“Art”: A Proposed Definition
The ability to visualize, build and executea concept for optimal commercialization of upstream assets based on valuations using thorough analysis of, and reasonable and sound scientific interpretation of, G&G and engineering data and information.

©CEE-UT, 4
Dr. Michelle Michot Foss, CEE/BEG/JSG/UT
Project Based
http://www.spe.org/industry/docs/PRMS_Development_Process_Slides.pdf

©CEE-UT, 5
Dr. Michelle Michot Foss, CEE/BEG/JSG/UT
SPE Description of Uncertainty
http://www.spe.org/industry/docs/PRMS_Development_Process_Slides.pdf
©CEE-UT, 6
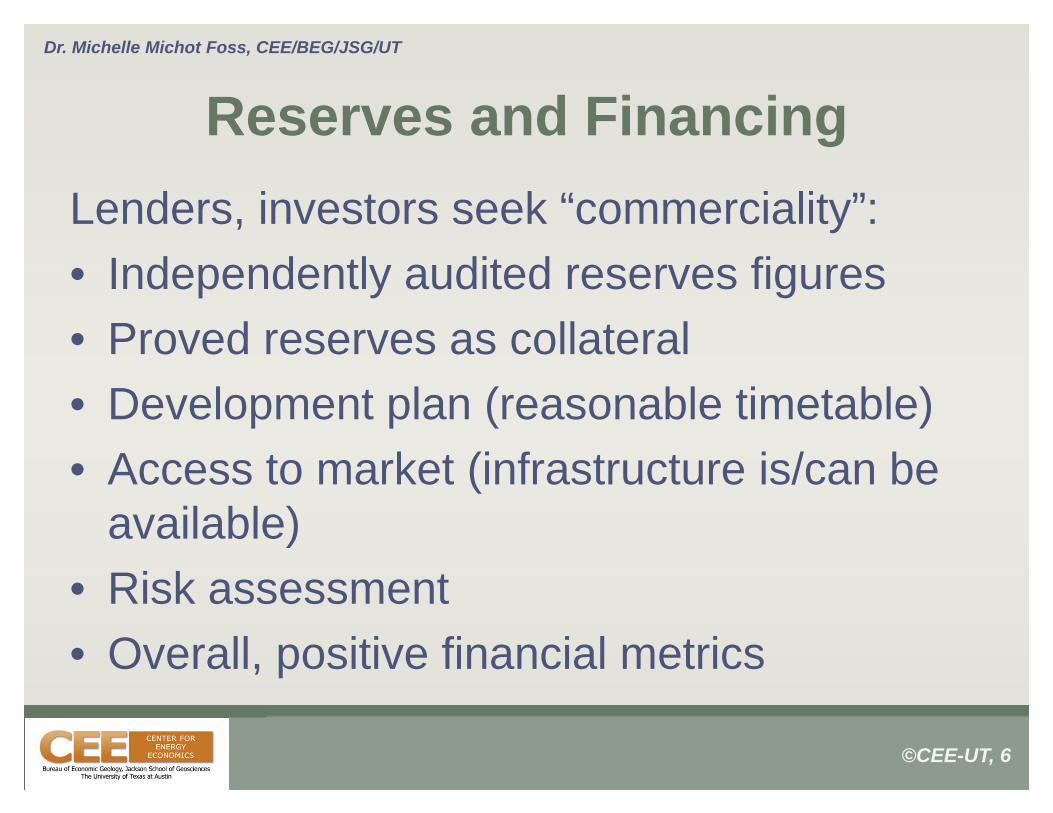
Dr. Michelle Michot Foss, CEE/BEG/JSG/UT
Reserves and FinancingLenders, investors seek “commerciality”:• Independently audited reserves figures• Proved reserves as collateral• Development plan (reasonable timetable)• Access to market (infrastructure is/can be
available)• Risk assessment• Overall, positive financial metrics

©CEE-UT, 7
Dr. Michelle Michot Foss, CEE/BEG/JSG/UT
Reserves Definitions Matter• IOCs investing globally have to comply with
regulations and market expectations– Fiscal regimes have to be conducive to
reporting and revenues to shareholders• Governments and NOCs
– Petrobras pays Brazilian government about 50% of value it generates
– Pemex pays Mexican government about 80% of value it generates

©CEE-UT, 8
Dr. Michelle Michot Foss, CEE/BEG/JSG/UT
CEE analysis based on U.S. EIA FRS

©CEE-UT, 9
Dr. Michelle Michot Foss, CEE/BEG/JSG/UT
U.S. Nat Gas Cost Structure, 1

©CEE-UT, 10
Dr. Michelle Michot Foss, CEE/BEG/JSG/UT
U.S. Nat Gas Cost Structure, 2
$(3.00)
$(2.50)
$(2.00)
$(1.50)
$(1.00)
$(0.50)
$‐
$0.50
$1.00
$1.50
$2.00
1 2 3 4 5 6 7 8 9 10 11 12 13 14
U.S. 09 Cash Exploration Costs $/MCFE
U.S. Cash Operating Costs $/MCFE
U.S. All Source FD Costs, $/MCFE
Differences, 2009‐2010
Avg.
Challenges:•High variability in geology (matrix porosity)•High variability in cost structure

©CEE-UT, 11
Dr. Michelle Michot Foss, CEE/BEG/JSG/UT
API

©CEE-UT, 12
Dr. Michelle Michot Foss, CEE/BEG/JSG/UT
API

©CEE-UT, 13
Dr. Michelle Michot Foss, CEE/BEG/JSG/UT
Fiscal Agreements Decisions

©CEE-UT, 14
Dr. Michelle Michot Foss, CEE/BEG/JSG/UT
Upstream Regimes
Approximations based on Foss, et.al., 1998, Best Practices in Energy Sector Reform (CEE-UT).
Recent fiscal regime changes (up is more favorable)
Relative Risk, Reserve Position (Prospectivity)
Qua
lity
of C
omm
erci
al
Fram
ewor
ks
Favorable
Colombia
Canada
Saudi Arabia
VenezuelaRussia
United States (all)
ChinaIndiaBrazil
Mexico
Norway
FavorableKuwait
United Kingdom
U.S. Gulf of Mexico(Federal, non-moratoria)
Iraq
Nigeria
UAE
Iran Other FSU
2001
2007
(Alberta)
Note: Investor (oil company) perspective
©CEE-UT, 15
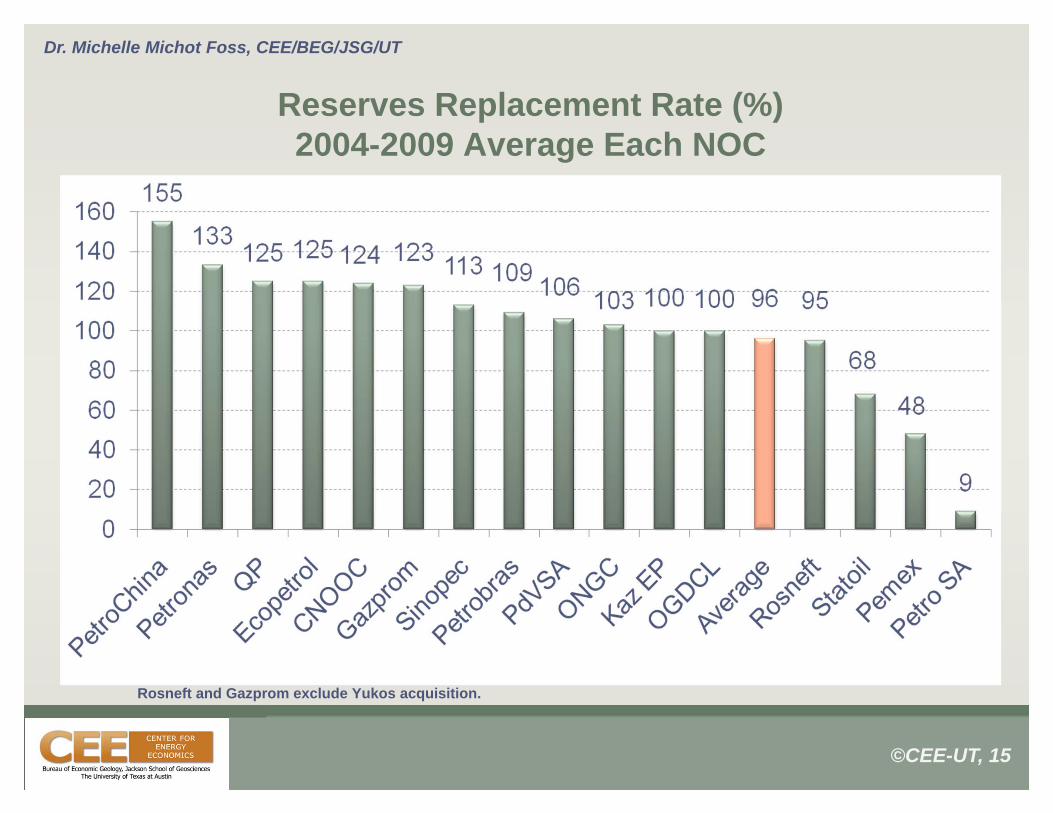
Dr. Michelle Michot Foss, CEE/BEG/JSG/UT
Reserves Replacement Rate (%)2004-2009 Average Each NOC
Rosneft and Gazprom exclude Yukos acquisition.

©CEE-UT, 16
Dr. Michelle Michot Foss, CEE/BEG/JSG/UT
All Source Reserve Replacement Cost US$/BOE2004-2009 Average Each NOC
* Companies with less than 6 years of data
Challenges:•High variability in cost structure•Maturity and regime

©CEE-UT, 17
Dr. Michelle Michot Foss, CEE/BEG/JSG/UT
Conclusions
• It’s not a perfect world– Transparency is critical
• Technical challenges need to be addressed– Everyone loses if envelope pushed too far
• Substitutes to reserves are not attractive