Embed Size (px)
Citation preview
Economic Planning in the Presence of Natural Disasters
by Associate Professor Mehmet Ulubasoglu
Date: 10 February 2011
Scope of Presentation
Problem Identification
Economic Model as the Workhorse of Economic Planning
Integrating Natural Disaster Shocks into the Economic Model
Results and Policy Simulation Analysis
Conclusion and Recommendations
One Model: Many Names
Econometric Model;
Macroeconometric Model;
Structural Model;
Economic Model
Feature of a Good Economic Model
Be simple in construction but realistic in forecasting;
Cover the whole economy which can be displayed with a simple diagram;
be consistent with economic logic;
able to utilize enough data (i.e., historical information)
Objectives of Constructing an Economic Model
Covering the basic linkages in the economy
Forecasting the impact of shocks
Assessing scenario outcomes
Policy-making
Generic Steps in working with an Economic Model
Step 1: Locating a Suitable Model
Step 2: Analyzing the Feasibility of the Model
Step 3: Establishing a Baseline Forecast
Step 4: Preparing the Policy Change to be Analyzed
Step 5: Running the Policy Scenario
Step 6: Assessing the Results
Economic Planning with Economic Model
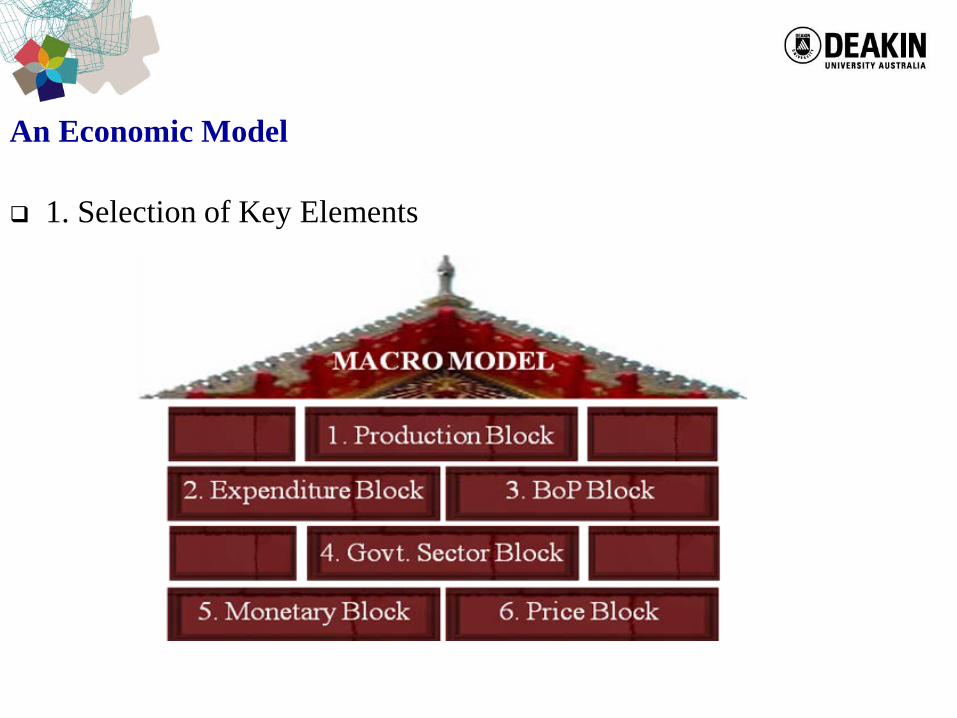
An Economic Model
1. Selection of Key Elements
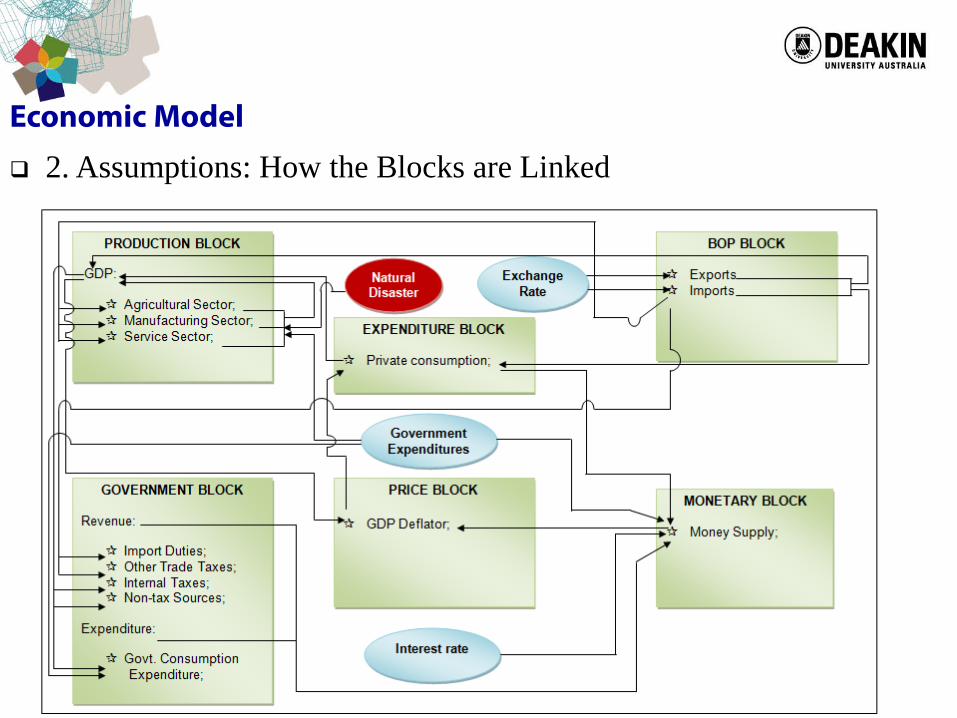
Economic Model
2. Assumptions: How the Blocks are Linked
Economic Model
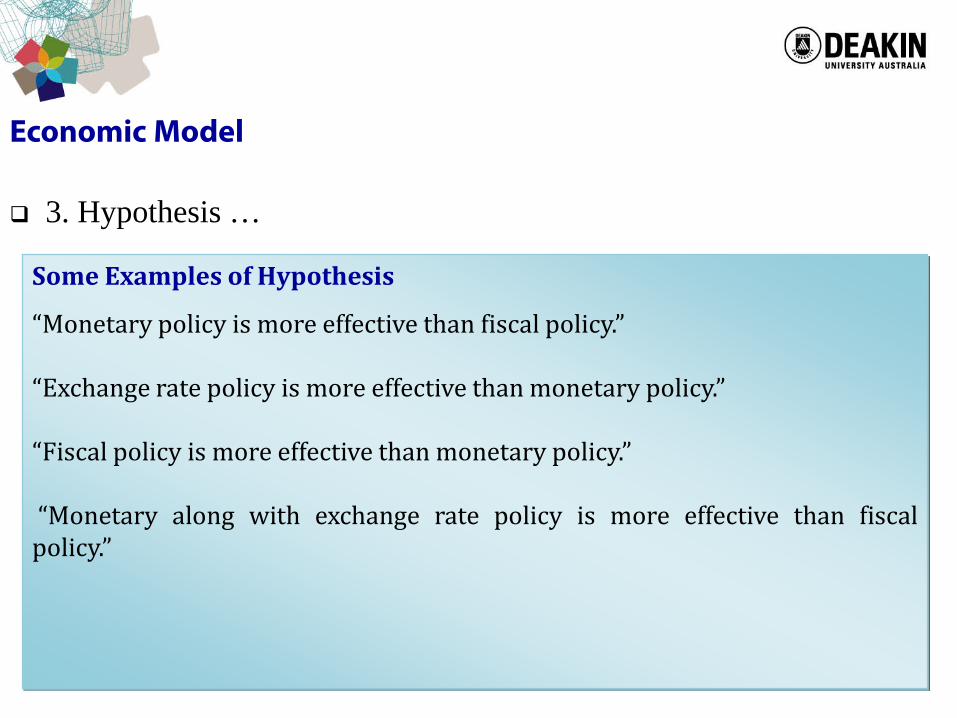
3. Hypothesis …
Some Examples of Hypothesis
“Monetary policy is more effective than fiscal policy.”
“Exchange rate policy is more effective than monetary policy.”
“Fiscal policy is more effective than monetary policy.”
“Monetary along with exchange rate policy is more effective than fiscalpolicy.”
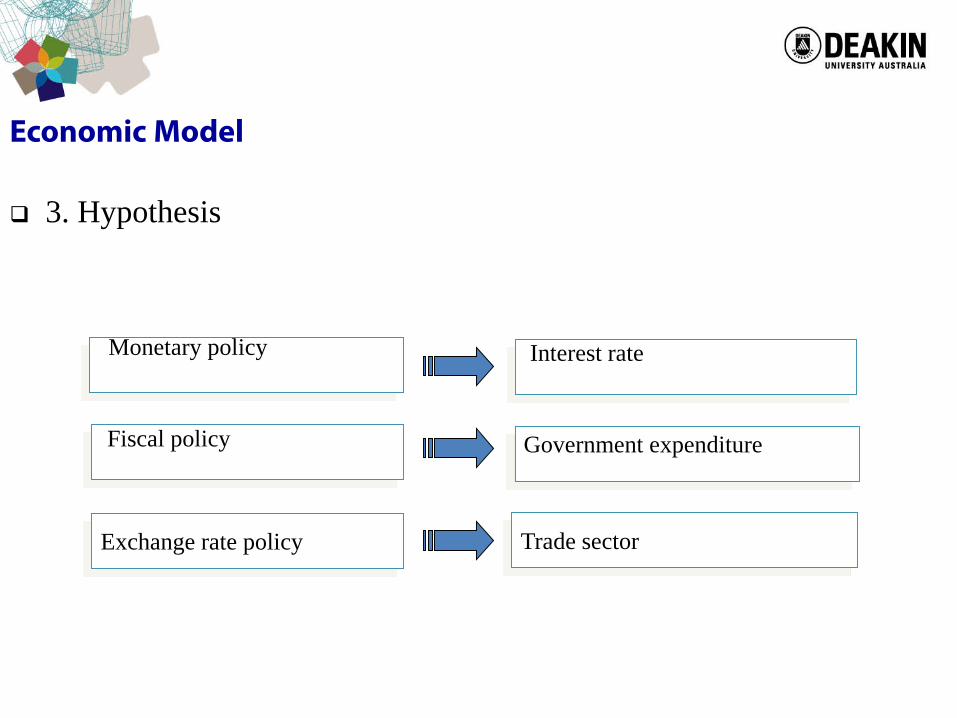
Economic Model
3. Hypothesis
Monetary policy Interest rate
Fiscal policy Government expenditure
Trade sectorExchange rate policy
Methodology:Integration of Natural Disasters
into Economic Planning
Natural Disasters and Economic Model
4. Inputs of the Model: Estimation of Damages due to Natural Disasters
From Risk Assessment to Pre-disaster Loss Estimation
From Damage Assessment to Post-disaster Loss Estimation
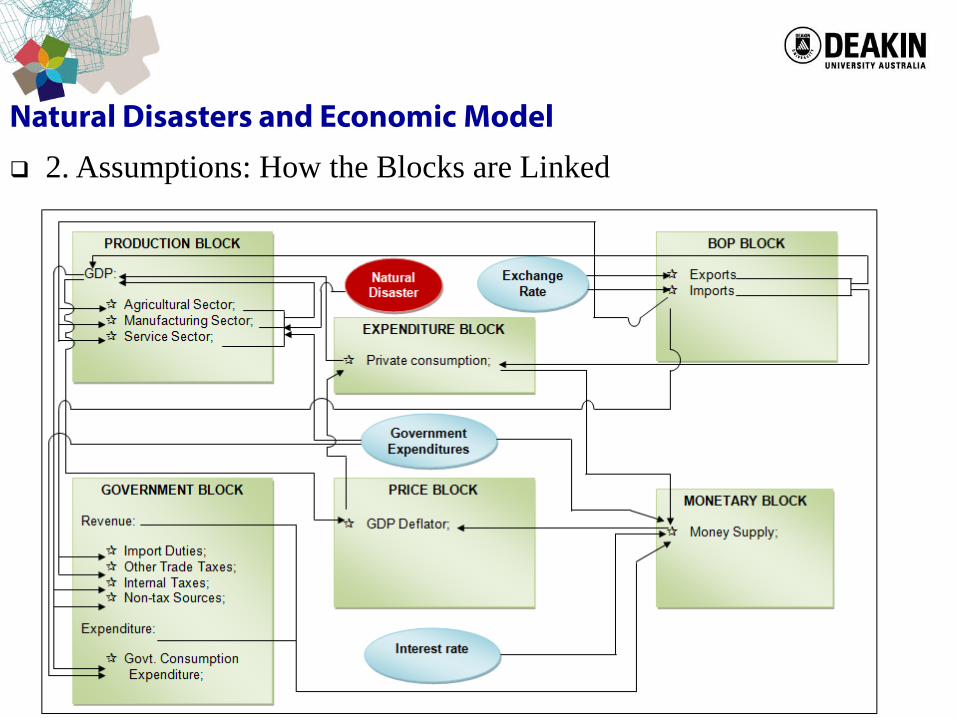
Natural Disasters and Economic Model
2. Assumptions: How the Blocks are Linked
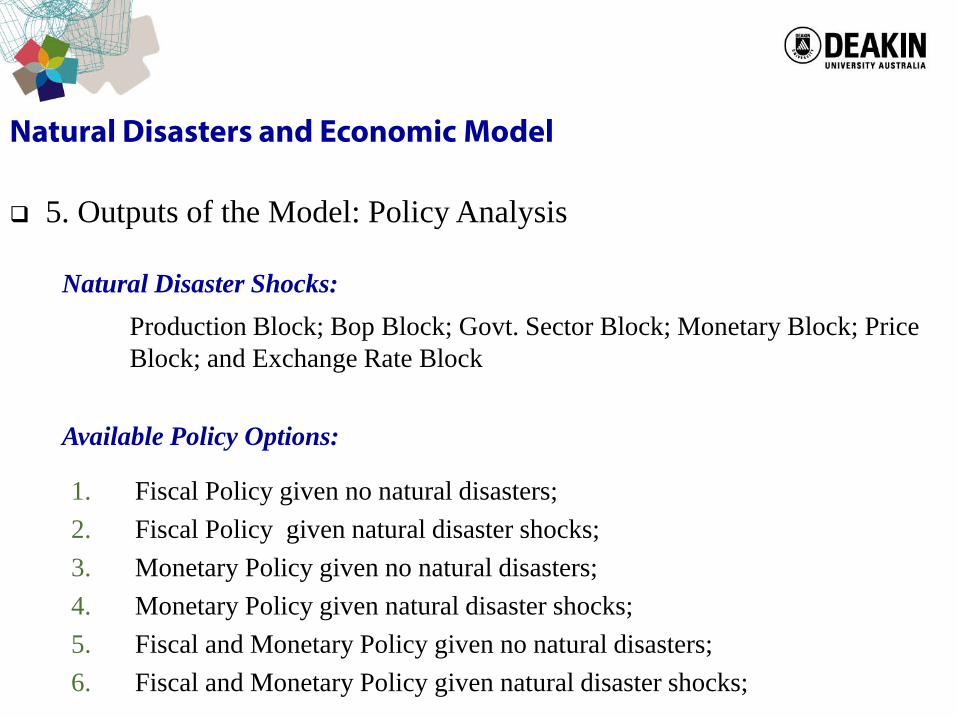
Natural Disasters and Economic Model
5. Outputs of the Model: Policy Analysis
Available Policy Options:
1. Fiscal Policy given no natural disasters;2. Fiscal Policy given natural disaster shocks;3. Monetary Policy given no natural disasters;4. Monetary Policy given natural disaster shocks;5. Fiscal and Monetary Policy given no natural disasters;6. Fiscal and Monetary Policy given natural disaster shocks;
Production Block; Bop Block; Govt. Sector Block; Monetary Block; Price Block; and Exchange Rate Block
Natural Disaster Shocks:
Natural Disasters and Economic Model
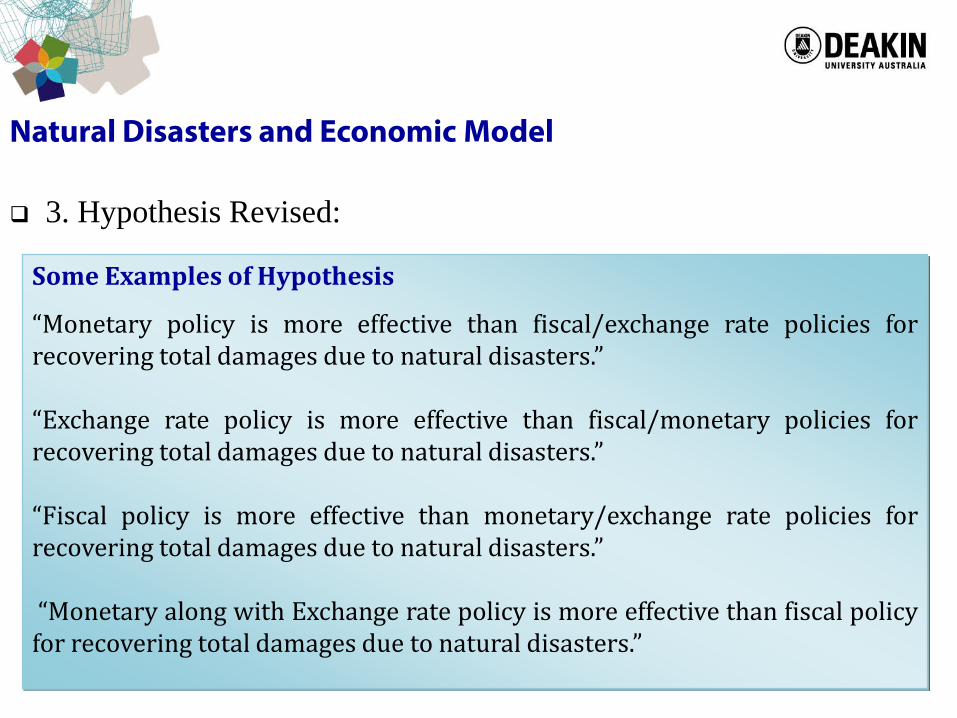
3. Hypothesis Revised:
Some Examples of Hypothesis
“Monetary policy is more effective than fiscal/exchange rate policies forrecovering total damages due to natural disasters.”
“Exchange rate policy is more effective than fiscal/monetary policies forrecovering total damages due to natural disasters.”
“Fiscal policy is more effective than monetary/exchange rate policies forrecovering total damages due to natural disasters.”
“Monetary along with Exchange rate policy is more effective than fiscal policyfor recovering total damages due to natural disasters.”
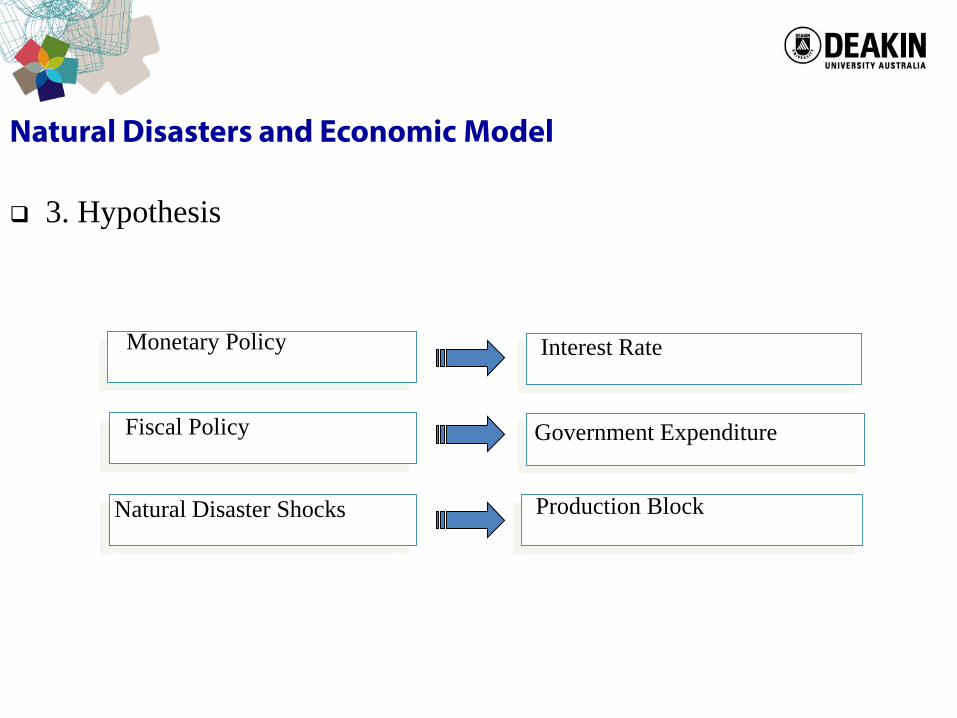
Natural Disasters and Economic Model
3. Hypothesis
Monetary Policy Interest Rate
Fiscal Policy Government Expenditure
Natural Disaster Shocks Production Block
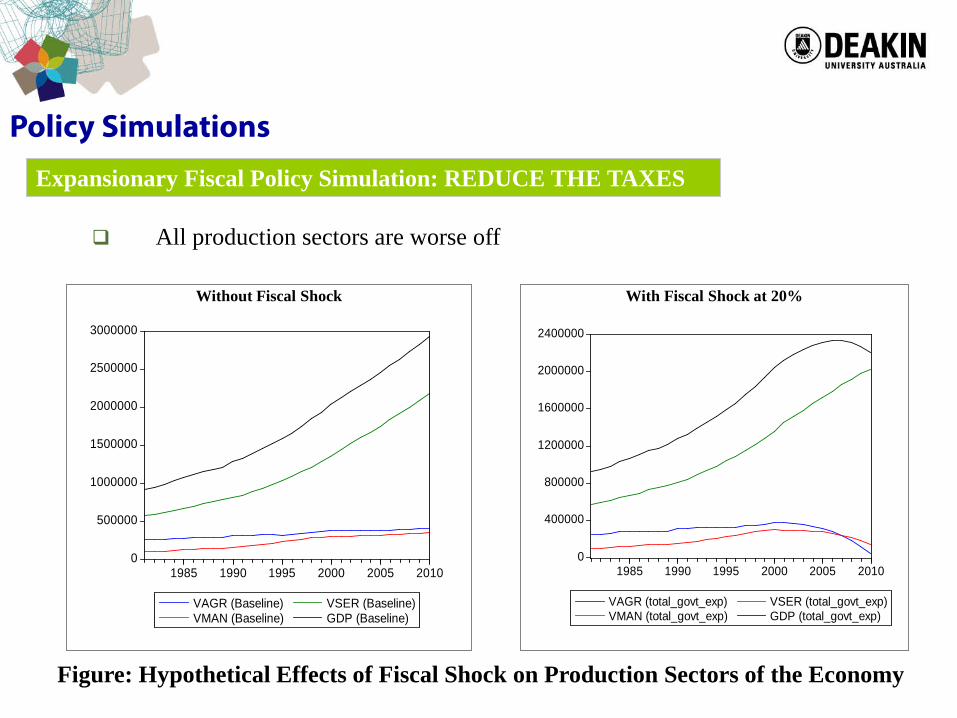
Policy Simulations
All production sectors are worse off
Figure: Hypothetical Effects of Fiscal Shock on Production Sectors of the Economy
With Fiscal Shock at 20%Without Fiscal Shock
0
500000
1000000
1500000
2000000
2500000
3000000
1985 1990 1995 2000 2005 2010
VAGR (Baseline)VMAN (Baseline)
VSER (Baseline)GDP (Baseline)
0
400000
800000
1200000
1600000
2000000
2400000
1985 1990 1995 2000 2005 2010
VAGR (total_govt_exp)VMAN (total_govt_exp)
VSER (total_govt_exp)GDP (total_govt_exp)
Expansionary Fiscal Policy Simulation: REDUCE THE TAXES
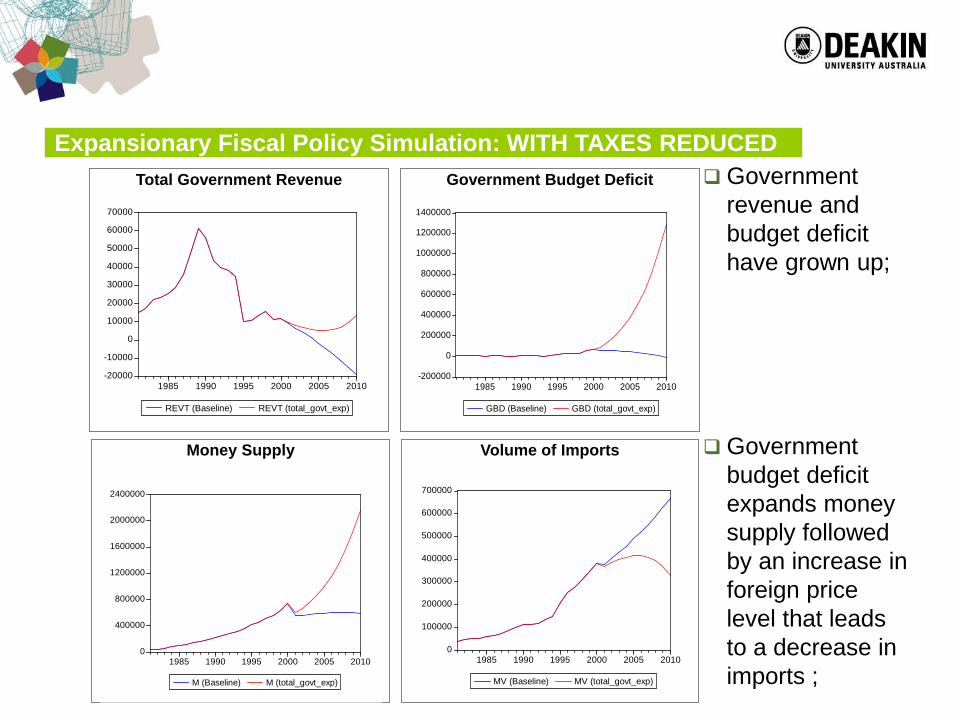
Government budget deficit expands money supply followed by an increase in foreign price level that leads to a decrease in imports ;
Government revenue and budget deficit have grown up;
Total Government Revenue Government Budget Deficit
-200000
0
200000
400000
600000
800000
1000000
1200000
1400000
1985 1990 1995 2000 2005 2010
GBD (Baseline) GBD (total_govt_exp)
-20000
-10000
0
10000
20000
30000
40000
50000
60000
70000
1985 1990 1995 2000 2005 2010
REVT (Baseline) REVT (total_govt_exp)
Money Supply Volume of Imports
0
400000
800000
1200000
1600000
2000000
2400000
1985 1990 1995 2000 2005 2010
M (Baseline) M (total_govt_exp)
0
100000
200000
300000
400000
500000
600000
700000
1985 1990 1995 2000 2005 2010
MV (Baseline) MV (total_govt_exp)
Expansionary Fiscal Policy Simulation: WITH TAXES REDUCED
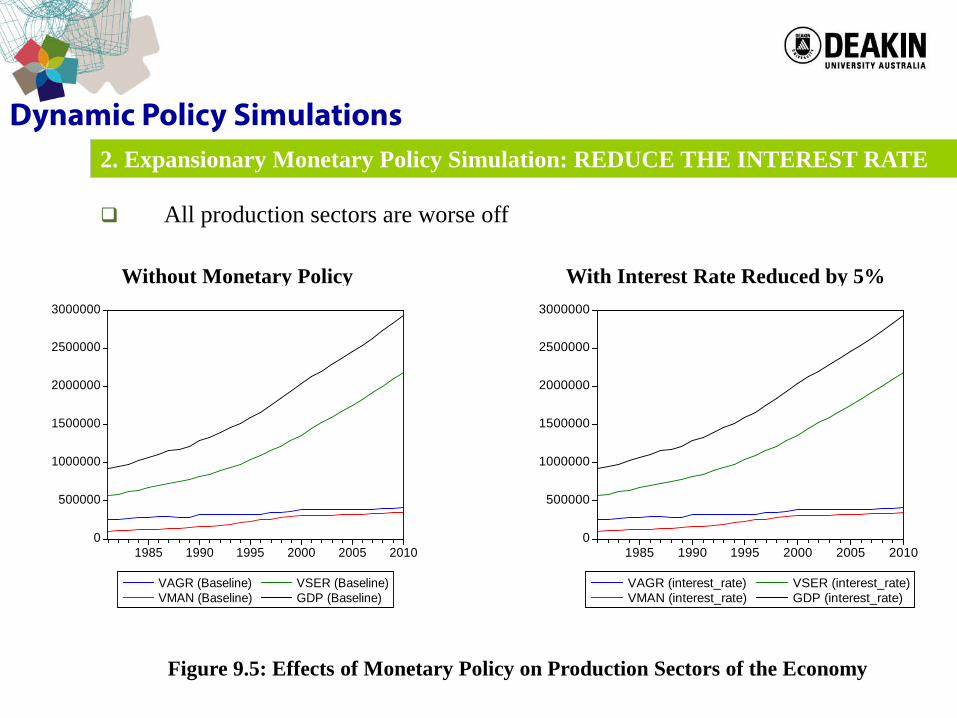
Dynamic Policy Simulations2. Expansionary Monetary Policy Simulation: REDUCE THE INTEREST RATE
All production sectors are worse off
Figure 9.5: Effects of Monetary Policy on Production Sectors of the Economy
With Interest Rate Reduced by 5%Without Monetary Policy
0
500000
1000000
1500000
2000000
2500000
3000000
1985 1990 1995 2000 2005 2010
VAGR (Baseline)VMAN (Baseline)
VSER (Baseline)GDP (Baseline)
0
500000
1000000
1500000
2000000
2500000
3000000
1985 1990 1995 2000 2005 2010
VAGR (interest_rate)VMAN (interest_rate)
VSER (interest_rate)GDP (interest_rate)
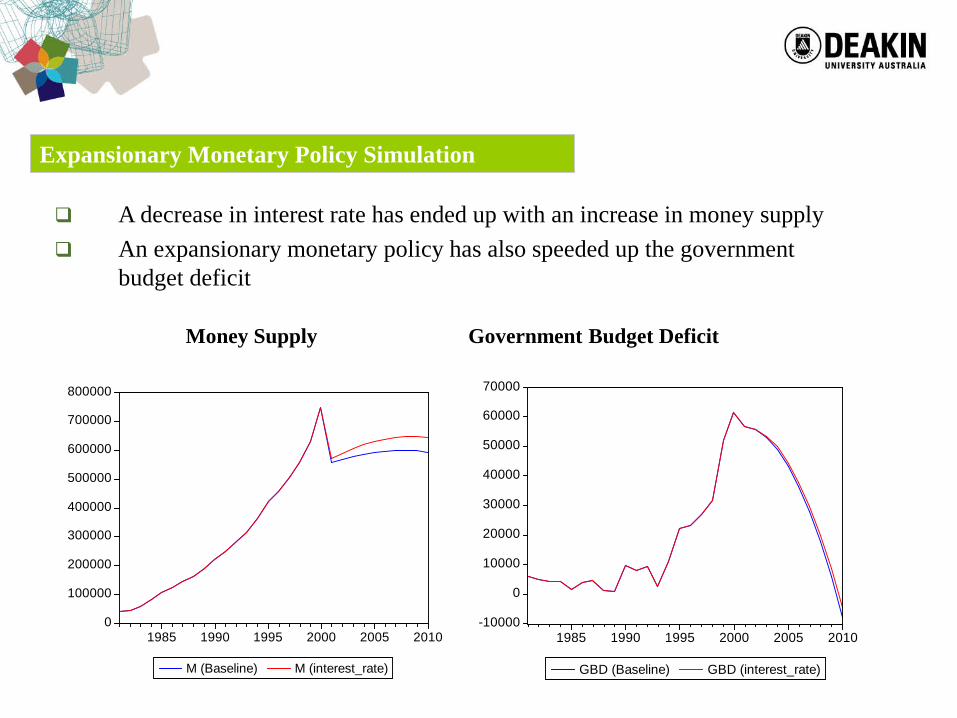
Expansionary Monetary Policy Simulation
A decrease in interest rate has ended up with an increase in money supply An expansionary monetary policy has also speeded up the government
budget deficit
Money Supply Government Budget Deficit
0
100000
200000
300000
400000
500000
600000
700000
800000
1985 1990 1995 2000 2005 2010
M (Baseline) M (interest_rate)
-10000
0
10000
20000
30000
40000
50000
60000
70000
1985 1990 1995 2000 2005 2010
GBD (Baseline) GBD (interest_rate)
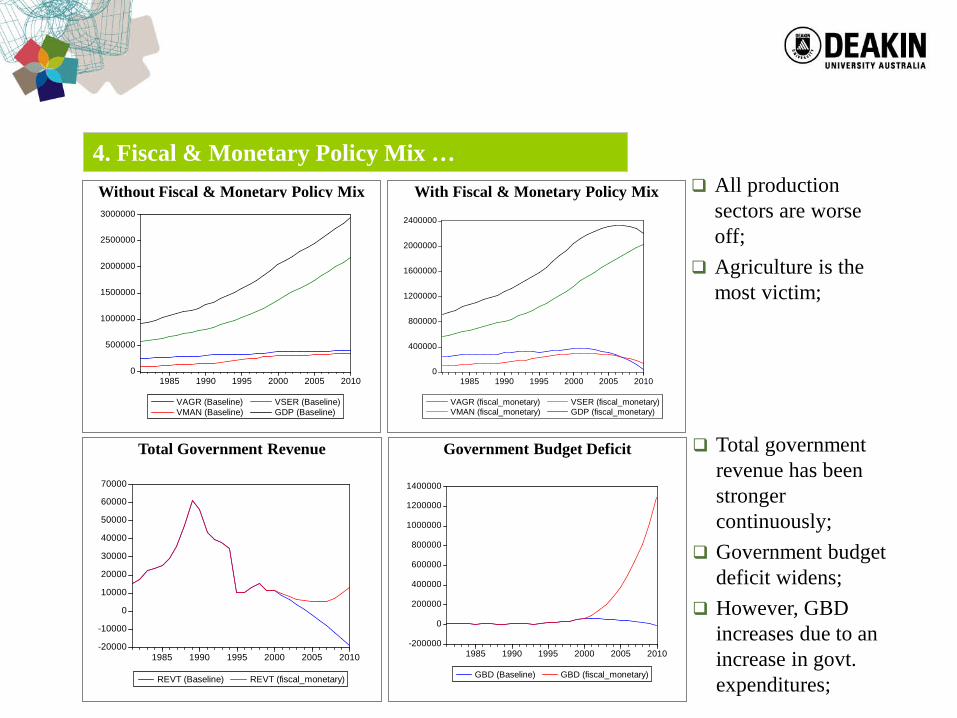
Total government revenue has been stronger continuously;
Government budget deficit widens;
However, GBD increases due to an increase in govt. expenditures;
All production sectors are worse off;
Agriculture is the most victim;
4. Fiscal & Monetary Policy Mix …With Fiscal & Monetary Policy MixWithout Fiscal & Monetary Policy Mix
0
500000
1000000
1500000
2000000
2500000
3000000
1985 1990 1995 2000 2005 2010
VAGR (Baseline)VMAN (Baseline)
VSER (Baseline)GDP (Baseline)
0
400000
800000
1200000
1600000
2000000
2400000
1985 1990 1995 2000 2005 2010
VAGR (fiscal_monetary)VMAN (fiscal_monetary)
VSER (fiscal_monetary)GDP (fiscal_monetary)
Total Government Revenue Government Budget Deficit
-20000
-10000
0
10000
20000
30000
40000
50000
60000
70000
1985 1990 1995 2000 2005 2010
REVT (Baseline) REVT (fiscal_monetary)
-200000
0
200000
400000
600000
800000
1000000
1200000
1400000
1985 1990 1995 2000 2005 2010
GBD (Baseline) GBD (fiscal_monetary)
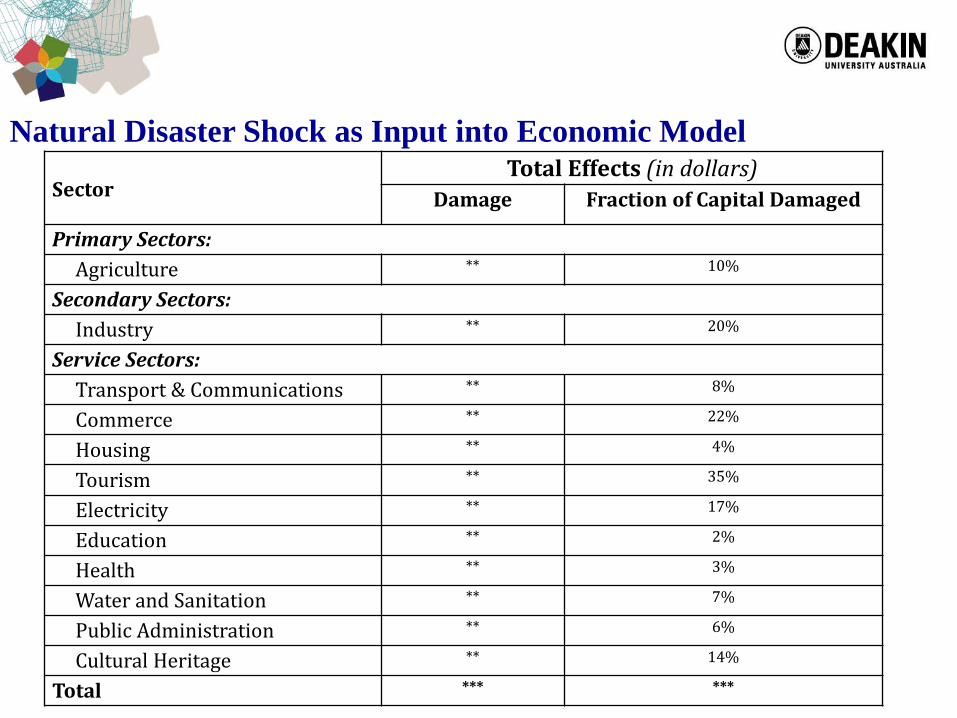
Natural Disaster Shock as Input into Economic Model
SectorTotal Effects (in dollars)
Damage Fraction of Capital Damaged
Primary Sectors:Agriculture ** 10%
Secondary Sectors:Industry ** 20%
Service Sectors:Transport & Communications ** 8%
Commerce ** 22%
Housing ** 4%
Tourism ** 35%
Electricity ** 17%
Education ** 2%
Health ** 3%
Water and Sanitation ** 7%
Public Administration ** 6%
Cultural Heritage ** 14%
Total *** ***
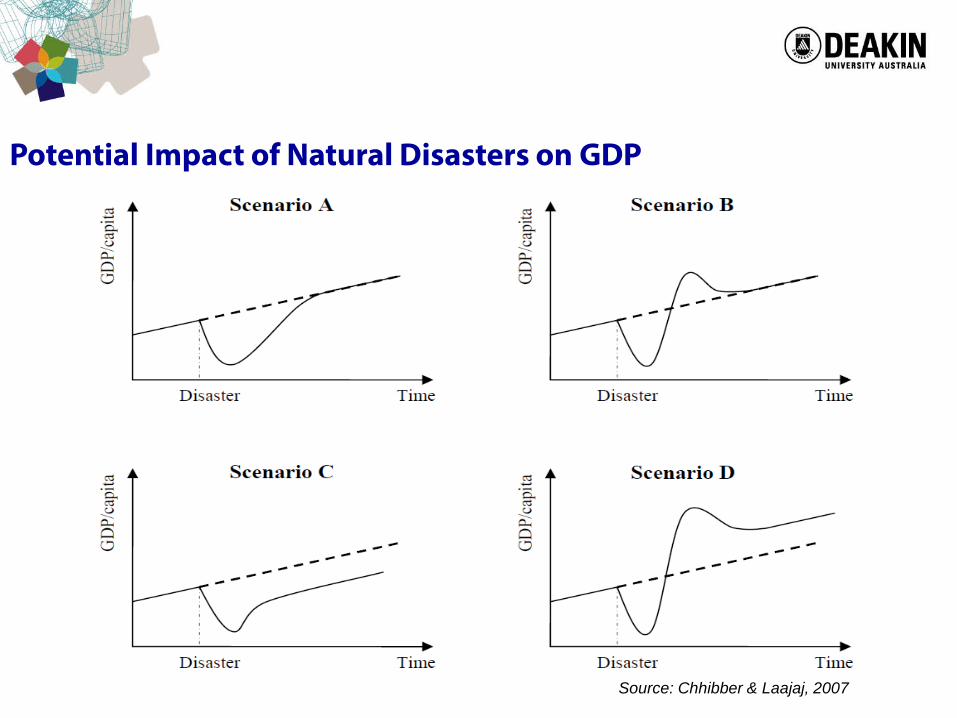
Potential Impact of Natural Disasters on GDP
Source: Chhibber & Laajaj, 2007
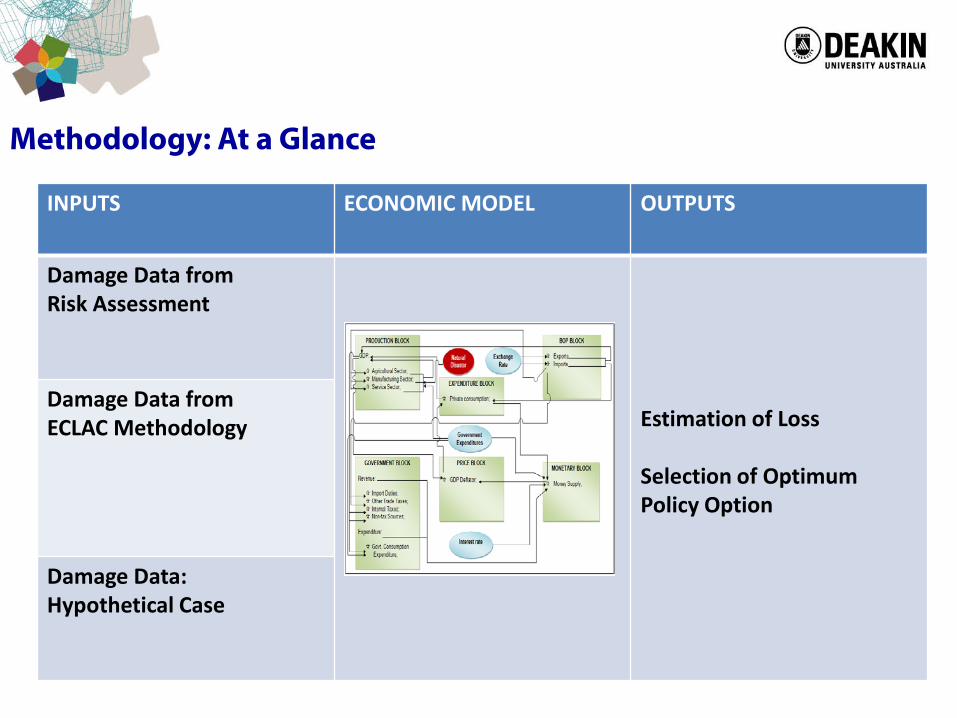
Methodology: At a Glance
INPUTS ECONOMIC MODEL OUTPUTS
Damage Data from Risk Assessment
Estimation of Loss
Selection of OptimumPolicy Option
Damage Data from ECLAC Methodology
Damage Data:Hypothetical Case

Q & A Session

Thank You