Embed Size (px)
Citation preview

Economic OutlookKevin Duncan, Ph.D.
Professor and Senior Economist,Healy Center for Business and Economic Studies
• Economic data tells a story of two influences on local economy:– Growth in the national economy…
• Growth in Pueblo’s manufacturing industries.
– Poor performance of the Colorado economy…• Loss of jobs in Pueblo retail and service industries.
• “Muted recovery” from financial crisis.
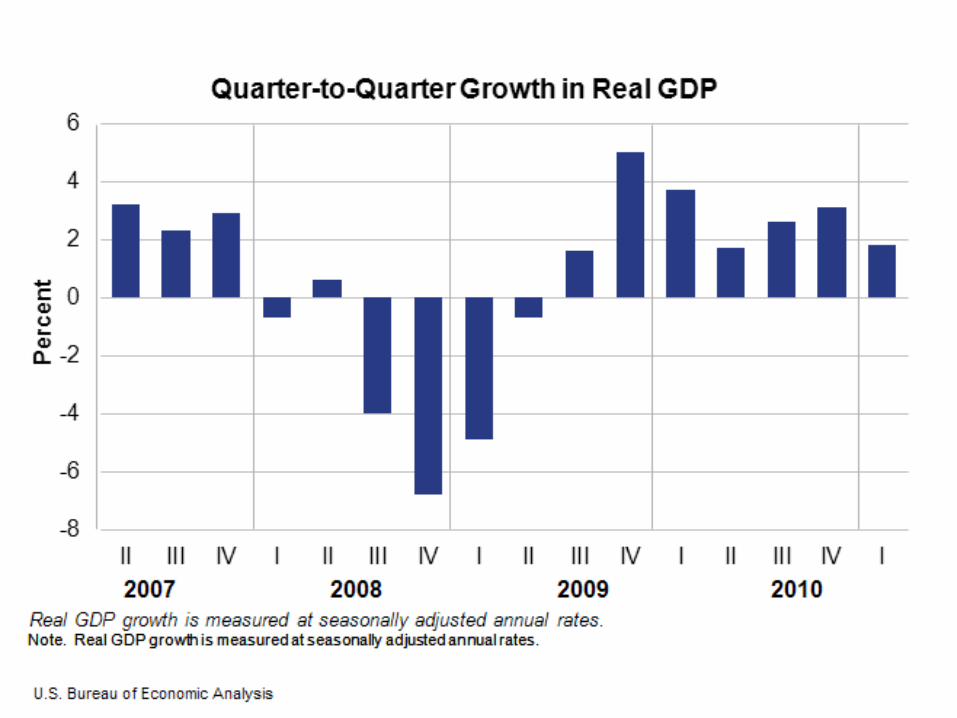
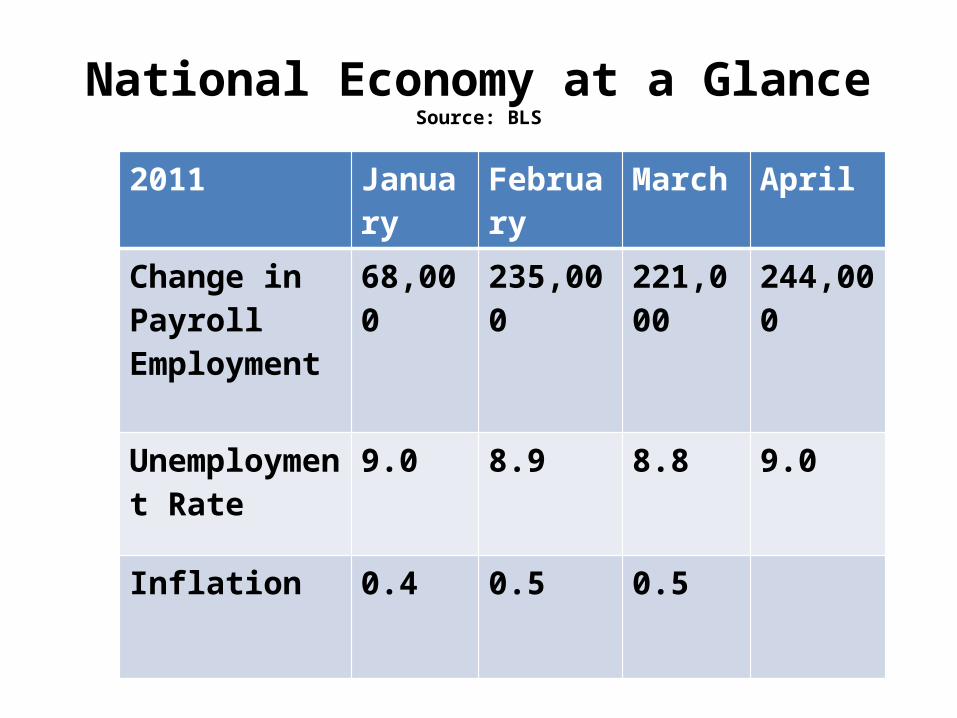
National Economy at a GlanceSource: BLS
2011 January February March April
Change in Payroll Employment
68,000 235,000 221,000 244,000
Unemployment Rate
9.0 8.9 8.8 9.0
Inflation 0.4 0.5 0.5
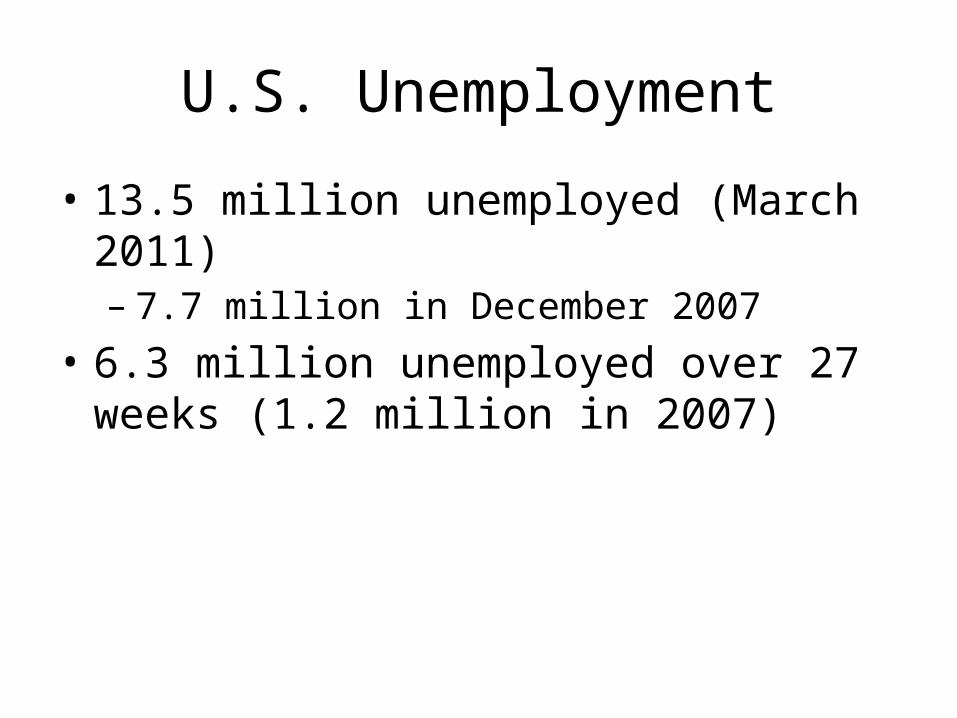
U.S. Unemployment
• 13.5 million unemployed (March 2011)– 7.7 million in December 2007
• 6.3 million unemployed over 27 weeks (1.2 million in 2007)
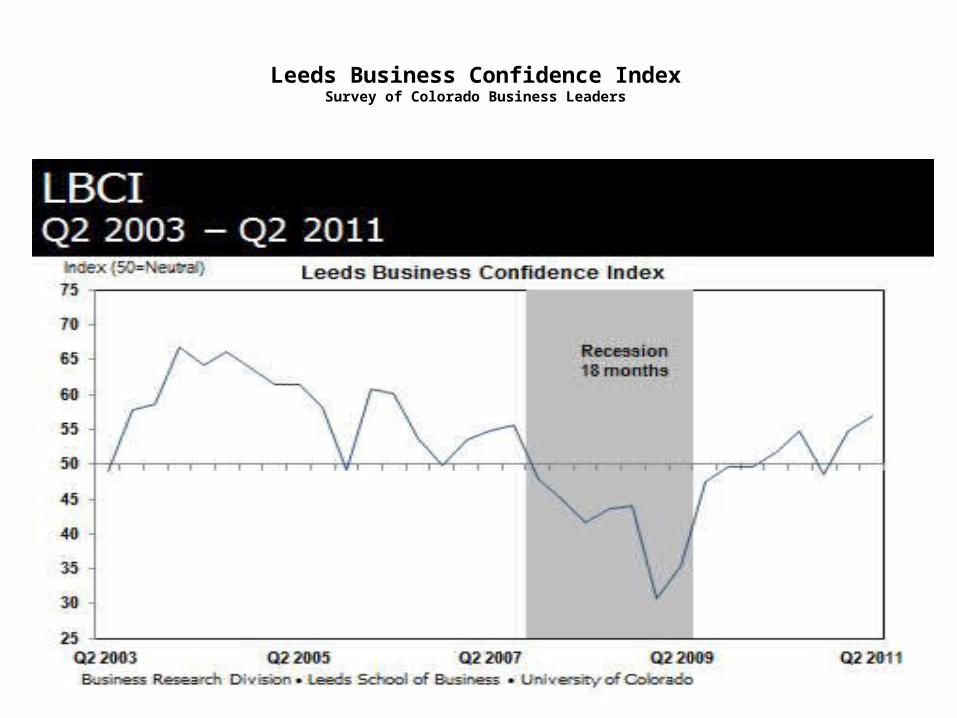
Leeds Business Confidence IndexSurvey of Colorado Business Leaders
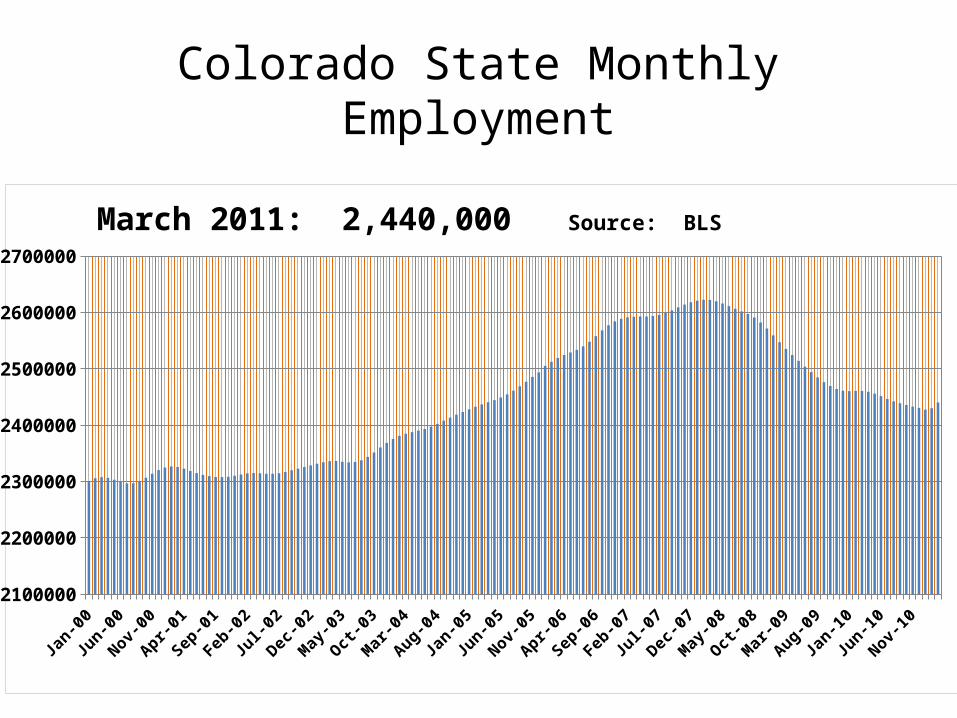
Colorado State Monthly Employment
Jan-00
May-00
Sep-00
Jan-01
May-01
Sep-01
Jan-02
May-02
Sep-02
Jan-03
May-03
Sep-03
Jan-04
May-04
Sep-04
Jan-05
May-05
Sep-05
Jan-06
May-06
Sep-06
Jan-07
May-07
Sep-07
Jan-08
May-08
Sep-08
Jan-09
May-09
Sep-09
Jan-10
May-10
Sep-10
Jan-112100000
2200000
2300000
2400000
2500000
2600000
2700000
March 2011: 2,440,000 Source: BLS
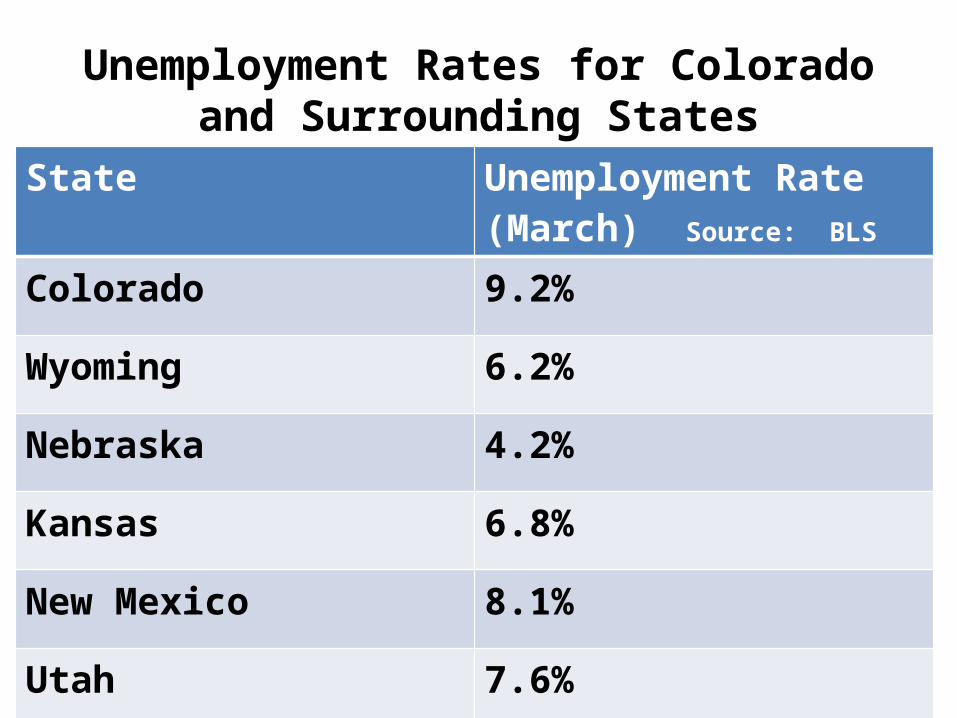
Unemployment Rates for Colorado and Surrounding States
State Unemployment Rate (March) Source: BLS
Colorado 9.2%
Wyoming 6.2%
Nebraska 4.2%
Kansas 6.8%
New Mexico 8.1%
Utah 7.6%
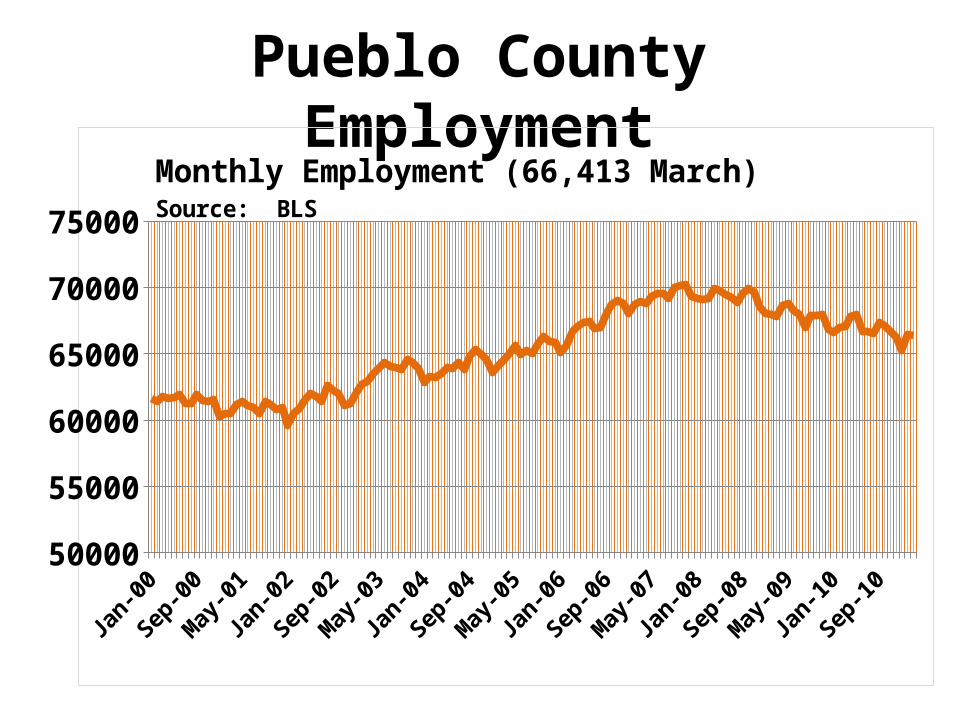
Pueblo County Employment
54000560005800060000620006400066000680007000072000
Monthly Employment (66,413 March) Source: BLS
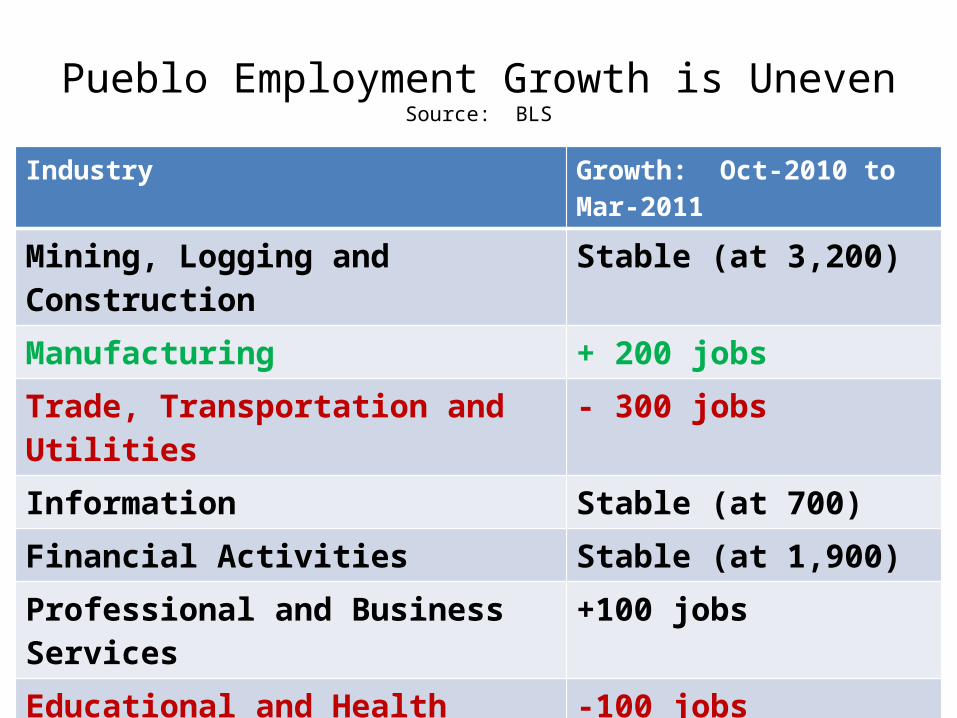
Pueblo Employment Growth is UnevenSource: BLS
Industry Growth: Oct-2010 to Mar-2011
Mining, Logging and Construction Stable (at 3,200)
Manufacturing + 200 jobs
Trade, Transportation and Utilities - 300 jobs
Information Stable (at 700)
Financial Activities Stable (at 1,900)
Professional and Business Services +100 jobs
Educational and Health Services -100 jobs
Leisure and Hospitality -100 jobs
Other Services -100 jobs
Government +200 jobs
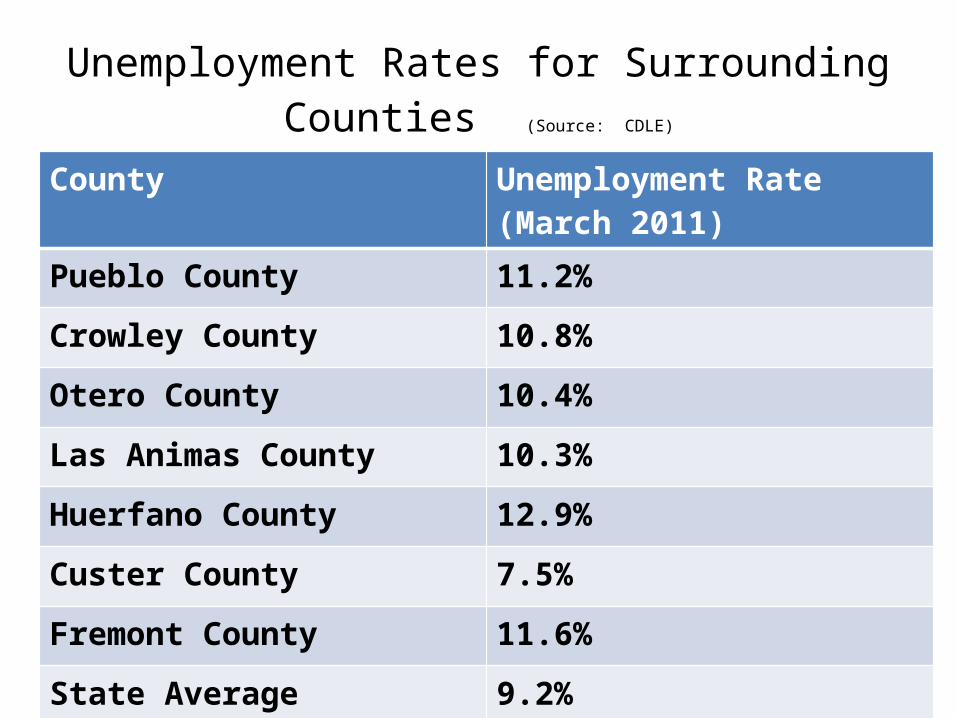
Unemployment Rates for Surrounding Counties (Source: CDLE)
County Unemployment Rate (March 2011)
Pueblo County 11.2%
Crowley County 10.8%
Otero County 10.4%
Las Animas County 10.3%
Huerfano County 12.9%
Custer County 7.5%
Fremont County 11.6%
State Average 9.2%
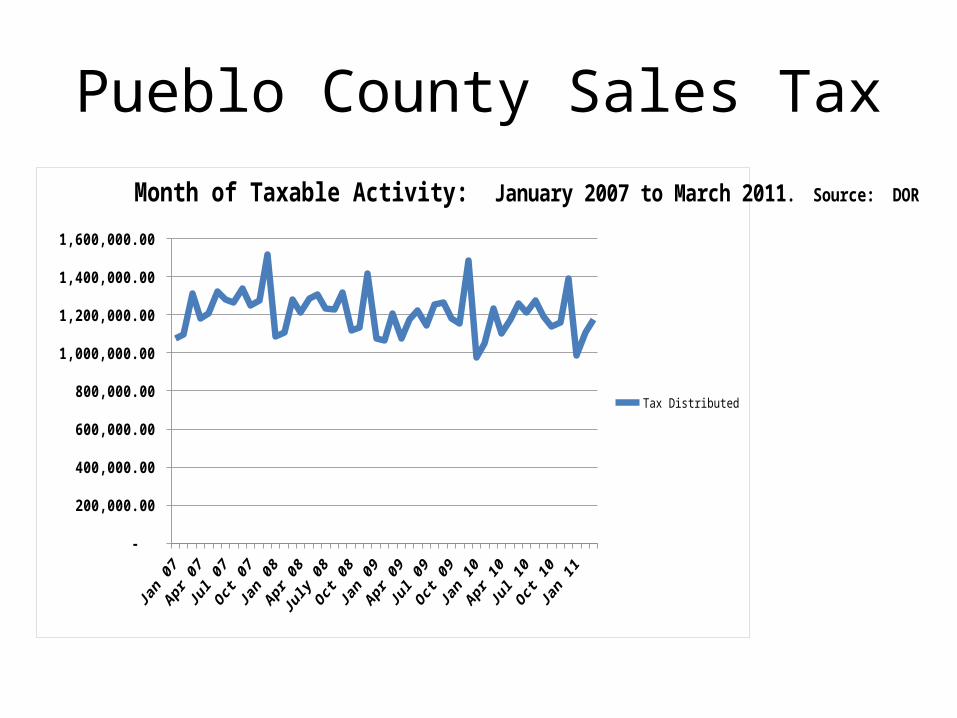
Pueblo County Sales Tax
Jan 07
Mar 0
7
May 07
Jul 0
7
Sep 07
Nov 07Jan 08
Mar 0
8
May 08
July 08
Sept 08
Nov 08Jan 09
Mar 0
9
May 09
Jul 0
9
Sept 09
Nov 09Jan 10
Mar 1
0
May 10
Jul 1
0
Sept 10
Nov 10Jan 11
Mar 1
1 -
200,000.00
400,000.00
600,000.00
800,000.00
1,000,000.00
1,200,000.00
1,400,000.00
1,600,000.00
Tax Distributed
Month of Taxable Activity: January 2007 to March 2011. Source: DOR
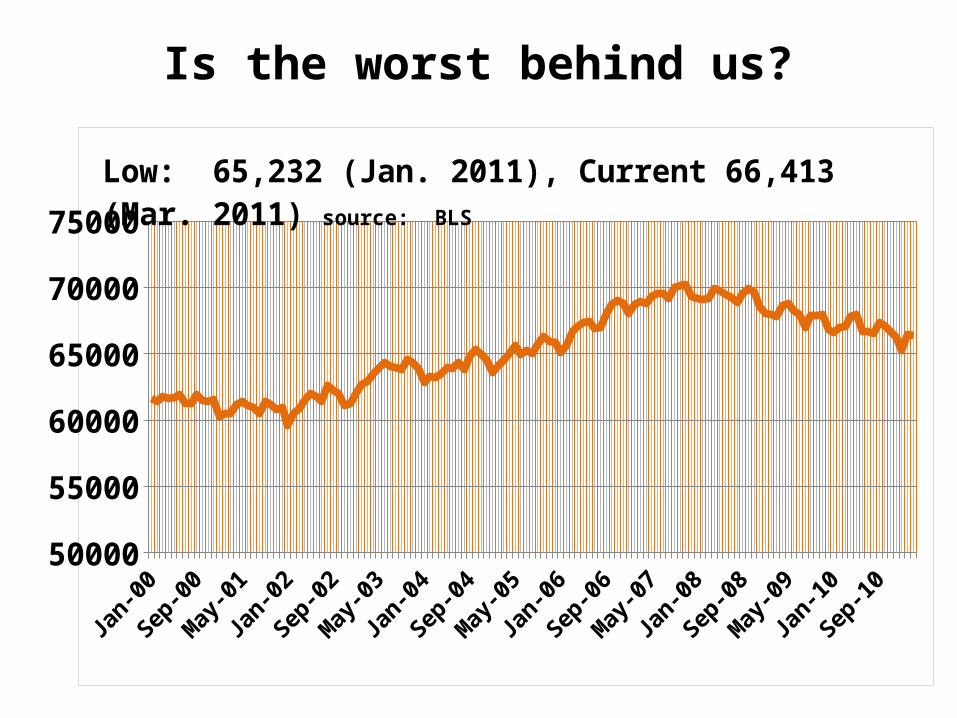
Is the worst behind us?
54000560005800060000620006400066000680007000072000
Low: 65,232 (Jan. 2011), Current 66,413 (Mar. 2011) source: BLS
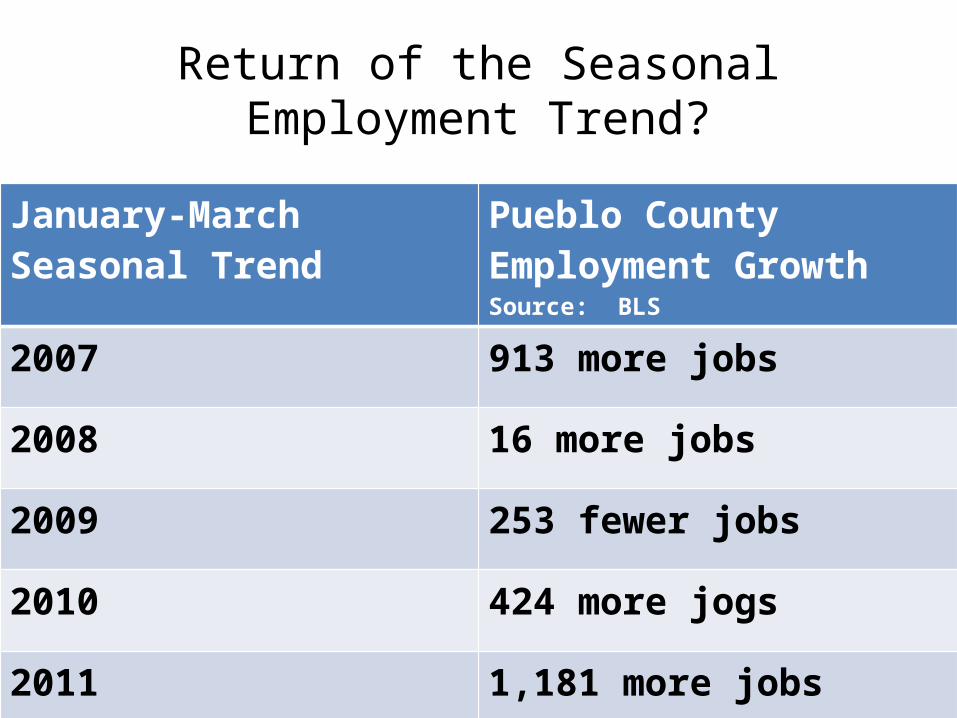
Return of the Seasonal Employment Trend?
January-March Seasonal Trend
Pueblo County Employment Growth Source: BLS
2007 913 more jobs
2008 16 more jobs
2009 253 fewer jobs
2010 424 more jogs
2011 1,181 more jobs
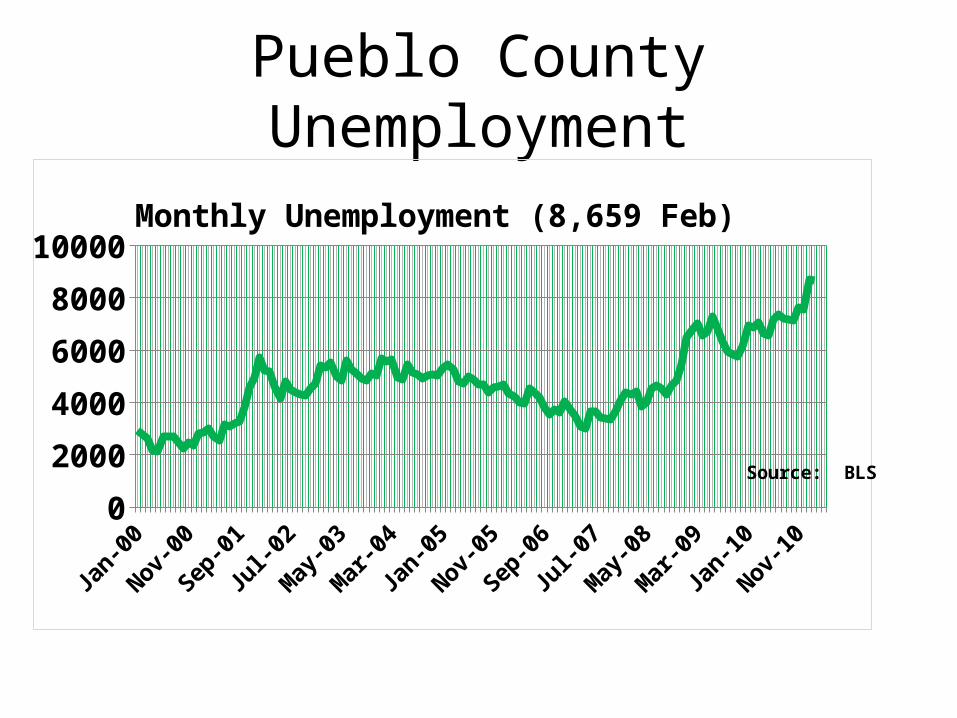
Pueblo County Unemployment
Jan-00
Aug-00
Mar-0
1
Oct-01
May-0
2
Dec-02Ju
l-03
Feb-04
Sep-04
Apr-05
Nov-05
Jun-06
Jan-07
Aug-07
Mar-0
8
Oct-08
May-0
9
Dec-09Ju
l-10
Feb-11
0
2000
4000
6000
8000
10000Monthly Unemployment (8,659 Feb)
Source: BLS
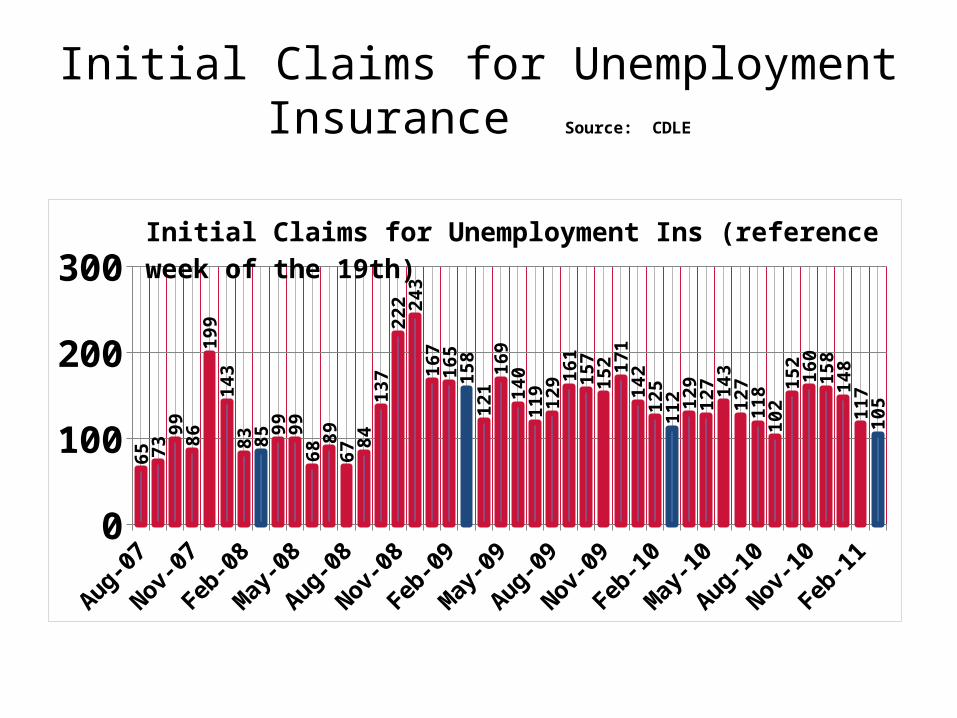
Initial Claims for UnemploymentInsurance Source: CDLE
Aug-07
Oct-07
Dec-07
Feb-08
Apr-08
Jun-08
Aug-08
Oct-08
Dec-08
Feb-09
Apr-09
Jun-09
Aug-09
Oct-09
Dec-09
Feb-10
Apr-10
Jun-10
Aug-10
Oct-10
Dec-10
Feb-11
050
100150200250300
65 7399 86
199
143
83 8599 99
6889
6784
137
222 24
316
716
515
812
116
914
011
9 129 16
115
715
2 171
142
125
112 12
912
7 143
127
118
102
152
160
158
148
117
105
Initial Claims for Unemployment Ins (reference week of the 19th)
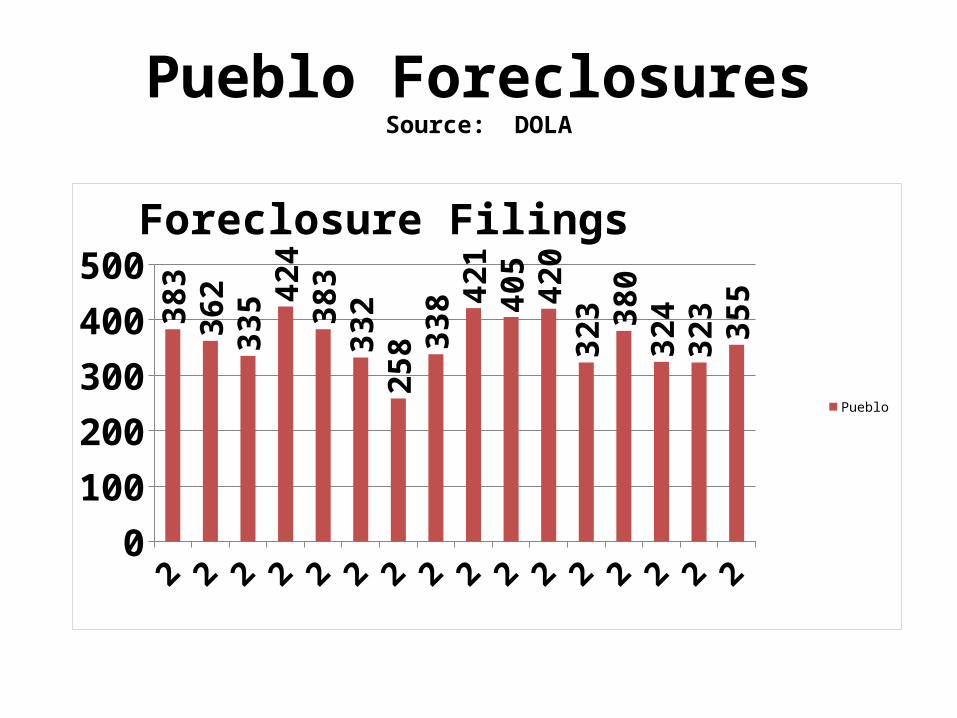
Pueblo ForeclosuresSource: DOLA
20 20 20 20 20 20 20 200
100200300400500
383
362
335 42
438
333
225
8 338 42
140
542
032
3 380
324
323 35
5
Pueblo
Foreclosure Filings
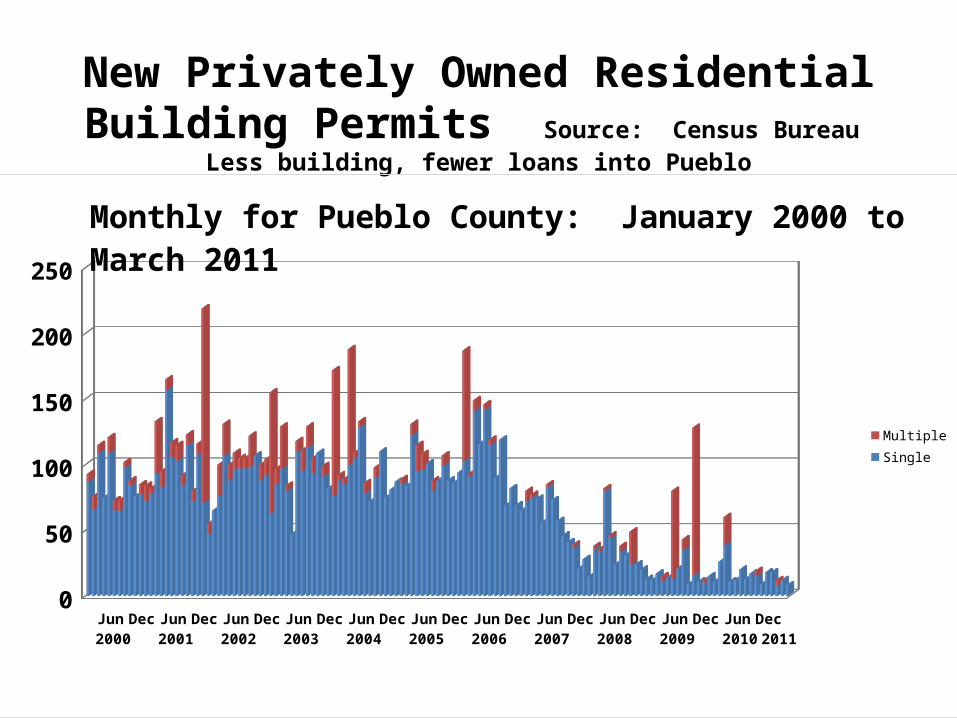
New Privately Owned Residential Building Permits Source: Census Bureau Less building, fewer loans into Pueblo
May Oct MarAug Jan Jun Nov Apr Sep Feb Jul DecMay Oct MarAug Jan Jun Nov Apr Sep Feb Jul DecMay Oct Mar2000 2001 2002 2003 2004 2005 2006 2007 2008 2009 2010 2011
0
50
100
150
200
250
MultipleSingle
Monthly for Pueblo County: January 2000 to March 2011
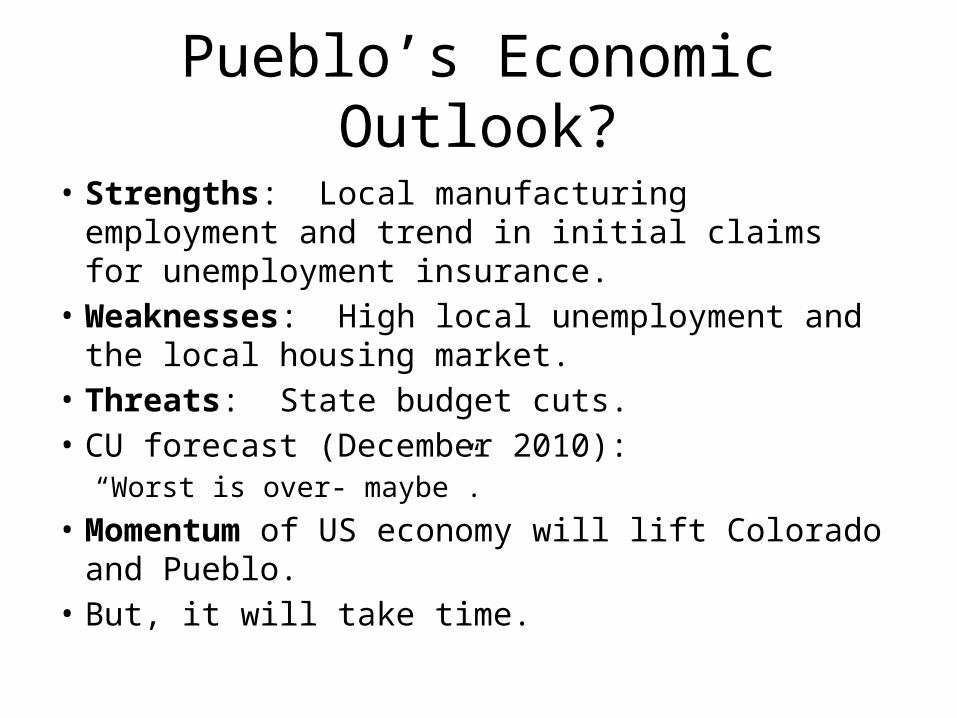
Pueblo’s Economic Outlook?
• Strengths: Local manufacturing employment and trend in initial claims for unemployment insurance.
• Weaknesses: High local unemployment and the local housing market.
• Threats: State budget cuts.• CU forecast (December 2010):
“Worst is over- maybe”.• Momentum of US economy will lift Colorado and
Pueblo.• But, it will take time.
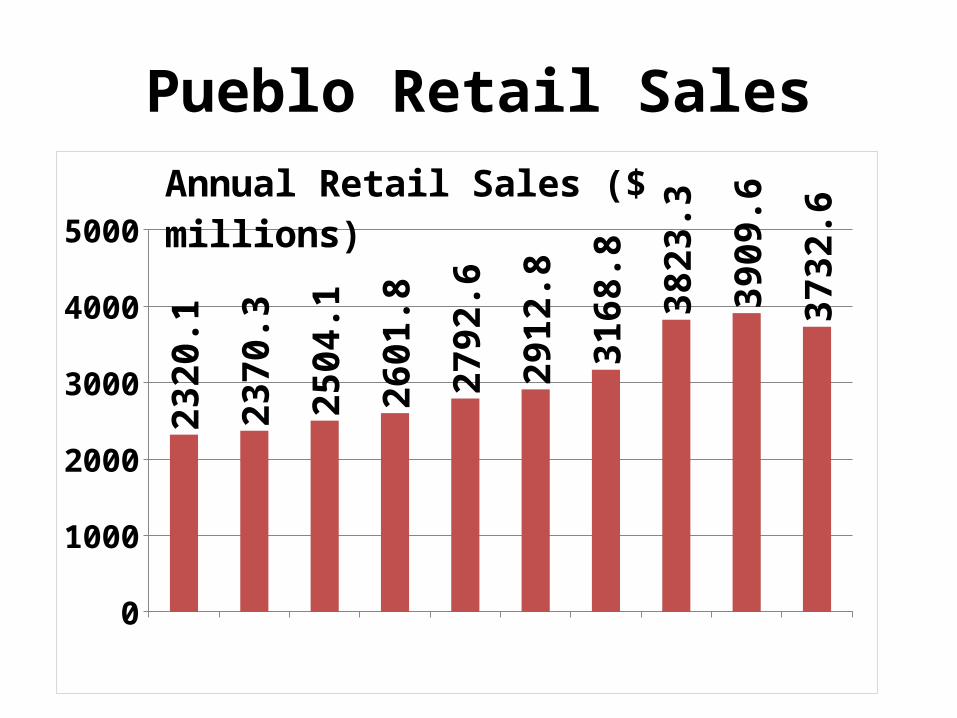
Pueblo Retail Sales
0500
10001500200025003000350040004500
2320
.1
2370
.3
2504
.1
2601
.8
2792
.6
2912
.8
3168
.8 3823
.3
3909
.6
3732
.6
Annual Retail Sales ($ millions)
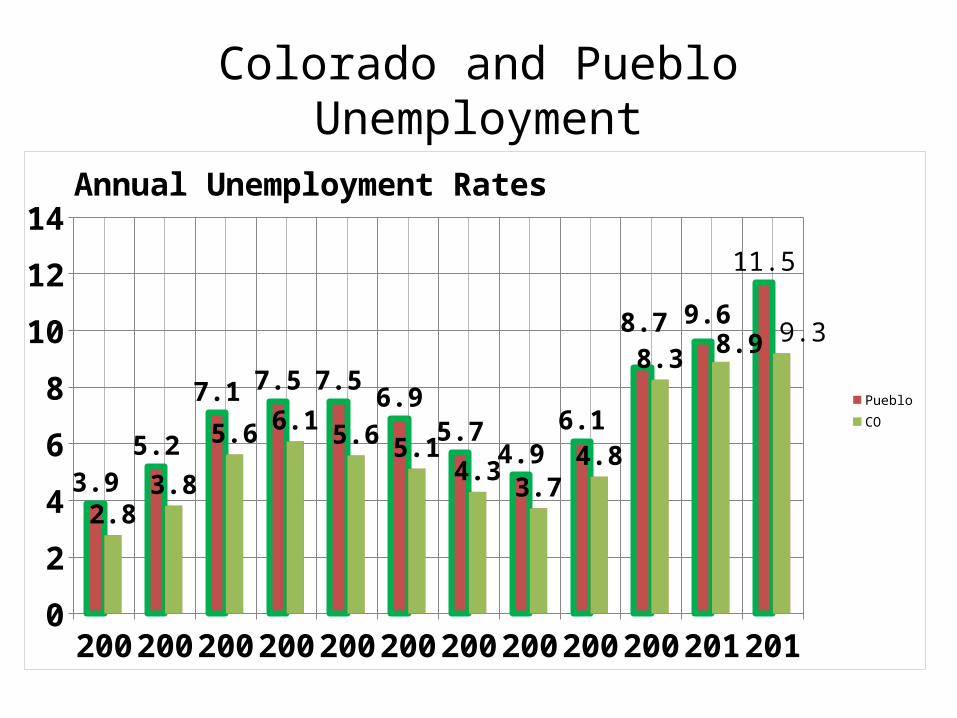
Colorado and Pueblo Unemployment
20
2
4
6
8
10
12
14
3.95.2
7.1 7.5 7.56.9
5.74.9
6.1
8.7 9.6
11.5
2.83.8
5.6 6.1 5.6 5.14.3
3.74.8
8.3 8.9 9.3
PuebloCO
Annual Unemployment Rates

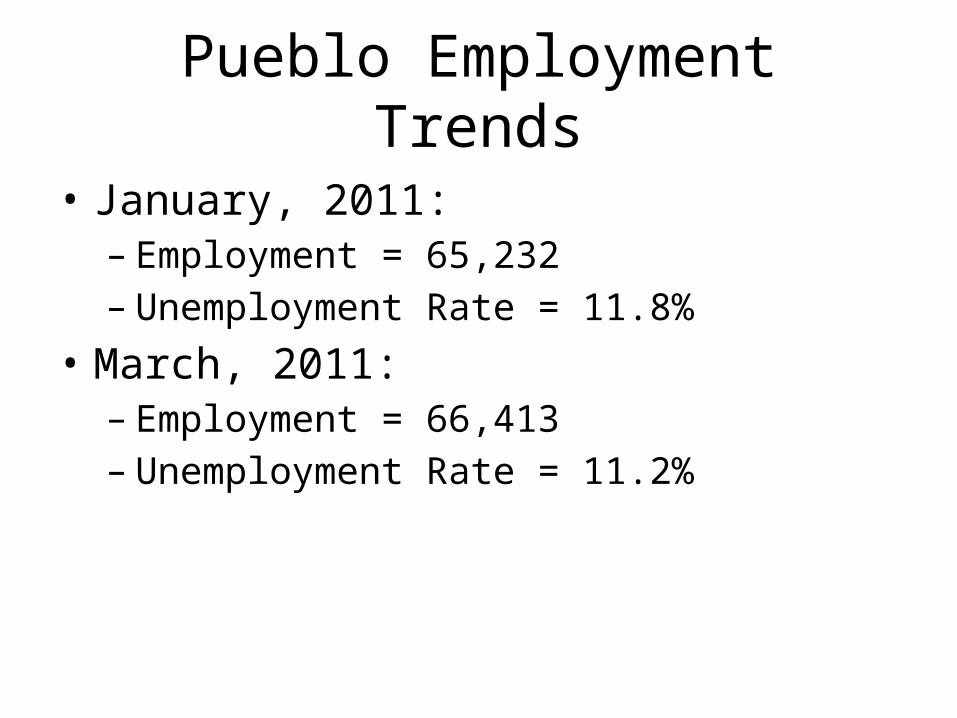
Pueblo Employment Trends
• January, 2011:– Employment = 65,232– Unemployment Rate = 11.8%
• March, 2011:– Employment = 66,413– Unemployment Rate = 11.2%