Embed Size (px)
Citation preview
ECONOMIC OUTLOOK AND EMERGING MARKETS TOP PICKS: 3Q18
DR. WALTER MOLANO, PhD
CHIEF ECONOMIST
BEN HOUGH
DIRECTOR OF CORPORATE RESEARCH
JULIA BRETZ
CORPORATE RESEARCH
MATIAS CASTAGNINO
CORPORATE RESEARCH
ARTURO GALINDO
CORPORATE RESEARCH
JULY 6, 2018
CYDSA 27
TZA 24
ALPEKA 23
CHUBUT 26
ARCOR 23
BRFSBZ 24
JBSSBZ 24
ODEBRE 21
AZULBZ 24 -> GOLLBZ 25
MRFGBZ 23
ODEBRE 22
OUTPERFORM
UNDERPERFORM
SWAP
METINV 26
Brazil: Não é Diferente Dr. Walter Molano, Ph.D. EM Corporate Highlights Corporate ResearchTop Picks for 3Q18 Corporate Research
1
BC
P T
op P
icks/
07
/06
/20
18
AJECBV 22
TPZMAR 22
ANTOIL 20
AESGEN 29
CENSUD 23
ECUA 27
DARALA 23
GJTLIJ 22
SEPLLN 23
For decades, Brazilians have argued that the laws of economics do not apply to their country. They would always insist that Brazil, somehow, was different. This wasthe justification they used to apply heterodox policies. However, for the last four years the Brazilian economy has undergone a brutal recession, resulting in one ofthe most orthodox realignments ever recorded. As a result, Brazil has become one of the healthiest economies in Latin America, with a very low inflation rate and ontrack towards a positive current account balance. Thanks to a classical adjustment, Brazil transformed itself from the sick man of Latin America to the picture ofgood health. As a result, it confirmed to the world that its economy was no different from the rest of the planet.
That is not to say that everything in Brazil is perfect. The large fiscal deficit, mainly driven by public sector pension obligations, continues to push the debtto GDP ratio higher. This has been the main reason why the international rating agencies have repeatedly downgraded the credit score. Yet, the situation isnot as dire as they make it seem. The increase in the debt load, which is expected to finish the year at 80% of GDP, is mainly in local currency. Theexternal debt component is in the low double digits. Given that the Brazilian government has an infinite capacity to refinance its local currency obligations; it is notsuch a pressing issue. This does not mean that the government can ignore the problem. The next administration will need to address the issue as soon as it takesoffice. Otherwise, it will eventually manifest itself into inflationary pressures.
The other challenge that the country faces is the upcoming presidential elections. The good news is that former President Luiz Inácio Lula da Silva is in jail andseems that he run for office. Still, the electoral field is full of (mostly) independent candidates, and there is no front runner. Moreover, there is a mix bag ofideologies that are competing. The pole position on the left of the political spectrum is anchored by Joaquim Barboso, the former Chief Justice of the SupremeCourt. He is polling at 10% of the intended vote. Although he was appointed by Lula to the Supreme Court in 2003, he became reknowned by leading theinvestigations into the so-called mensalão corruption scandal. Several senior PT officials were implicated and jailed for providing kickbacks in return forcongressional votes. Born into a poor black family, he worked as a janitor before putting himself through law school and moving up the judiciary. A member of thePSB, the small socialist party, it would be natural for Barboso to align himself with the PT. However, there is a lot of bad blood in the party about the party memberswho were jailed during the mensalão investigations. One of the problems in Brazil is that there are many candidates without parties, and many parties withoutcandidates. With Lula in jail, the PT, which has a formidable organizational apparatus, is in desperate need of a candidate. Another person on the left is Ciro Gomes.A former Finance Minister under Itamar Franco and Governor for the state of Ceara, he is well known. Gomes was a founding member of the PSDB, but ran forpresident twice on the Socialist People Party (PPS) ticket. He is a lone wolf, and would probably be willing to run on the PT ticket. Many Brazilians consider him tobe most radical candidate of the pack. While he has 6% of the intended vote, this could improve if he moves into the PT camp. The center is anchored by MarinaSilva Vaz de Lima. She served as Minister of the Environment during the Lula Administration and gained a good reputation among environmentalists. She also had astrong following from the evangelical crowd. This allowed her to place third during the 2014 presidential elections, even though she came across as being very timidduring the televised presidential debates. Her economic policies are center-right, and would probably support implementing the much-needed pension reforms.However, many people question whether she has the leadership skills needed to negotiate such a difficult process. She has 14 to 15% of the intended vote.
2
BC
P T
op P
icks/
05
/07
/20
18
BRAZIL: NÃO É DIFERENTE
3
BRAZIL: NÃO É DIFERENTENext along the political spectrum is Gerardo Alckmin, the former Governor of Sao Paulo. He is the favorite. A member of the PSDB, he is the only politicianwho is running under the banner of a major political party. He is polling with 6% of the intended vote, but many analysts believe his numbers will improve when weget closer to the elections and the party begins to open up its war chest to spend on television advertising. The pole position on the far right is anchored by JairBolsonaro, the congressman from the State of Rio de Janeiro. A former military officer, he is often compared to U.S. President Donald Trump for his outlandishmisogynist outbursts. Nevertheless, he is being advised by Paulo Guedes, a well-known Brazilian economist who graduated from University of Chicago and foundedBR Investments, a highly successful hedge fund. Some people believe that Guedes would be instrumental in pushing through the necessary pension reforms.Bolsonaro is the front runner, polling at 16 to 17%. He is running on a law and order platform, which resonates well among the electorate. He has strong supportfrom millennials, mainly due to his social media campaign and their disullionment with the traditional political parties. However, he also has the highest rejectionrate of any of the frontline candidates. Therefore, while Brazilians may think that their economy is different from everyone else, it seems that the laws of economicsare alive and well in the tropics, and will continue to be so.
Dr. Walter Molano, Ph.D.May 7, 2018
BC
P T
op P
icks/
05
/07
/20
18
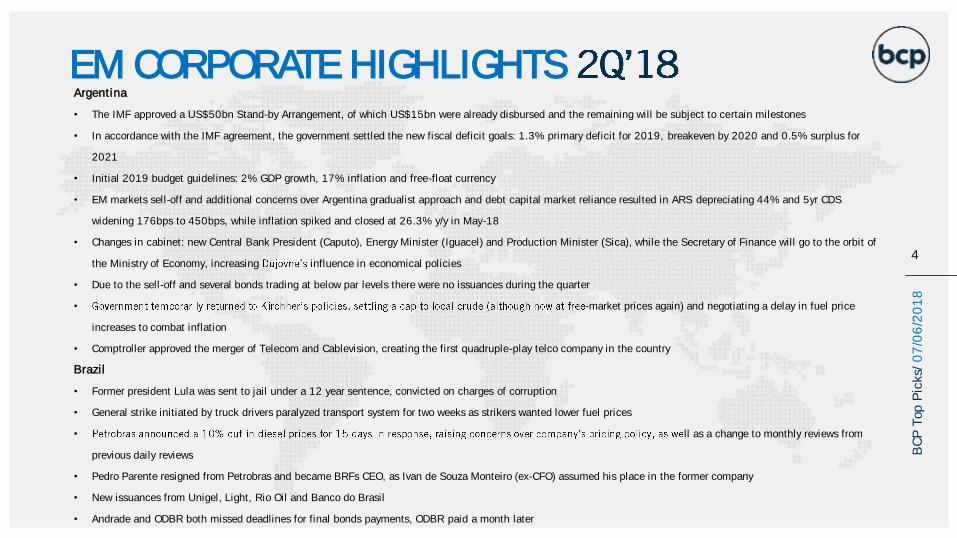
Argentina
• The IMF approved a US$50bn Stand-by Arrangement, of which US$15bn were already disbursed and the remaining will be subject to certain milestones
• In accordance with the IMF agreement, the government settled the new fiscal deficit goals: 1.3% primary deficit for 2019, breakeven by 2020 and 0.5% surplus for
2021
• Initial 2019 budget guidelines: 2% GDP growth, 17% inflation and free-float currency
• EM markets sell-off and additional concerns over Argentina gradualist approach and debt capital market reliance resulted in ARS depreciating 44% and 5yr CDS
widening 176bps to 450bps, while inflation spiked and closed at 26.3% y/y in May-18
• Changes in cabinet: new Central Bank President (Caputo), Energy Minister (Iguacel) and Production Minister (Sica), while the Secretary of Finance will go to the orbit of
the Ministry of Economy, increasing influence in economical policies
• Due to the sell-off and several bonds trading at below par levels there were no issuances during the quarter
• -market prices again) and negotiating a delay in fuel price
increases to combat inflation
• Comptroller approved the merger of Telecom and Cablevision, creating the first quadruple-play telco company in the country
Brazil
• Former president Lula was sent to jail under a 12 year sentence, convicted on charges of corruption
• General strike initiated by truck drivers paralyzed transport system for two weeks as strikers wanted lower fuel prices
• ll as a change to monthly reviews from
previous daily reviews
• Pedro Parente resigned from Petrobras and became BRFs CEO, as Ivan de Souza Monteiro (ex-CFO) assumed his place in the former company
• New issuances from Unigel, Light, Rio Oil and Banco do Brasil
• Andrade and ODBR both missed deadlines for final bonds payments, ODBR paid a month later
EM CORPORATE HIGHLIGHTS
4
BC
P T
op P
icks/
07
/06
/20
18
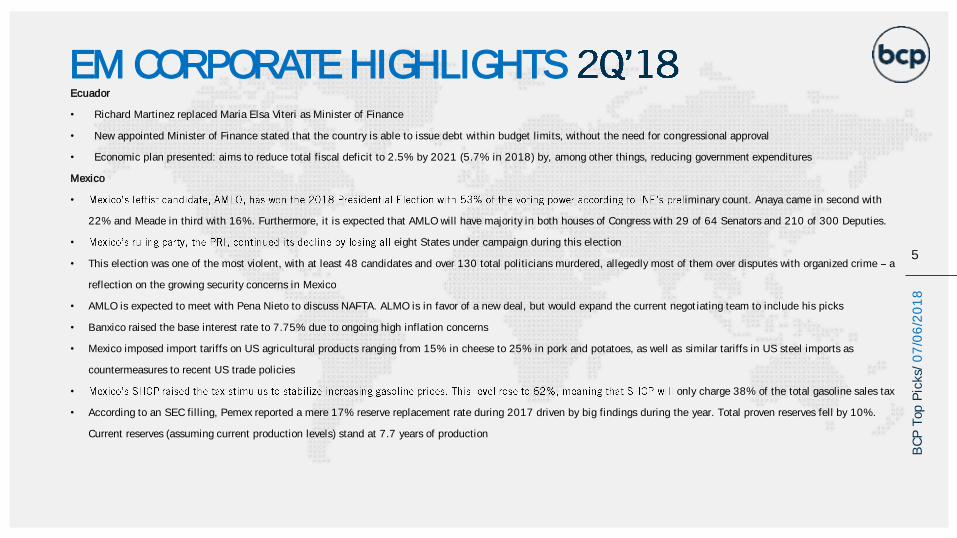
Ecuador
• Richard Martinez replaced Maria Elsa Viteri as Minister of Finance
• New appointed Minister of Finance stated that the country is able to issue debt within budget limits, without the need for congressional approval
• Economic plan presented: aims to reduce total fiscal deficit to 2.5% by 2021 (5.7% in 2018) by, among other things, reducing government expenditures
Mexico
• iminary count. Anaya came in second with
22% and Meade in third with 16%. Furthermore, it is expected that AMLO will have majority in both houses of Congress with 29 of 64 Senators and 210 of 300 Deputies.
• eight States under campaign during this election
• This election was one of the most violent, with at least 48 candidates and over 130 total politicians murdered, allegedly most of them over disputes with organized crime a
reflection on the growing security concerns in Mexico
• AMLO is expected to meet with Pena Nieto to discuss NAFTA. ALMO is in favor of a new deal, but would expand the current negotiating team to include his picks
• Banxico raised the base interest rate to 7.75% due to ongoing high inflation concerns
• Mexico imposed import tariffs on US agricultural products ranging from 15% in cheese to 25% in pork and potatoes, as well as similar tariffs in US steel imports as
countermeasures to recent US trade policies
• only charge 38% of the total gasoline sales tax
• According to an SEC filling, Pemex reported a mere 17% reserve replacement rate during 2017 driven by big findings during the year. Total proven reserves fell by 10%.
Current reserves (assuming current production levels) stand at 7.7 years of production
EM CORPORATE HIGHLIGHTS
5
BC
P T
op P
icks/
07
/06
/20
18
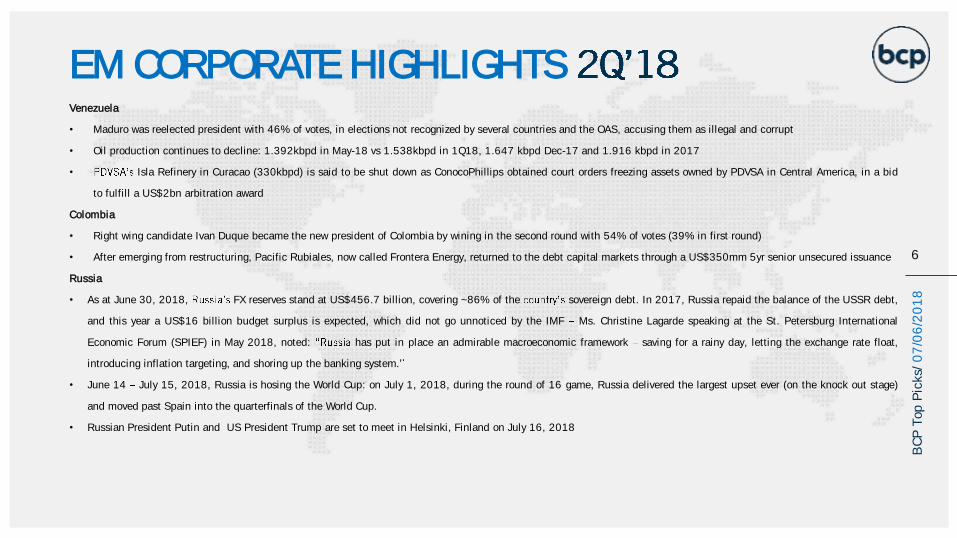
Venezuela
• Maduro was reelected president with 46% of votes, in elections not recognized by several countries and the OAS, accusing them as illegal and corrupt
• Oil production continues to decline: 1.392kbpd in May-18 vs 1.538kbpd in 1Q18, 1.647 kbpd Dec-17 and 1.916 kbpd in 2017
• Isla Refinery in Curacao (330kbpd) is said to be shut down as ConocoPhillips obtained court orders freezing assets owned by PDVSA in Central America, in a bid
to fulfill a US$2bn arbitration award
Colombia
• Right wing candidate Ivan Duque became the new president of Colombia by wining in the second round with 54% of votes (39% in first round)
• After emerging from restructuring, Pacific Rubiales, now called Frontera Energy, returned to the debt capital markets through a US$350mm 5yr senior unsecured issuance
Russia
• As at June 30, 2018, FX reserves stand at US$456.7 billion, covering ~86% of the sovereign debt. In 2017, Russia repaid the balance of the USSR debt,
and this year a US$16 billion budget surplus is expected, which did not go unnoticed by the IMF Ms. Christine Lagarde speaking at the St. Petersburg International
Economic Forum (SPIEF) in May 2018, noted: has put in place an admirable macroeconomic framework saving for a rainy day, letting the exchange rate float,
introducing inflation targeting, and shoring up the banking system.
• June 14 July 15, 2018, Russia is hosing the World Cup: on July 1, 2018, during the round of 16 game, Russia delivered the largest upset ever (on the knock out stage)
and moved past Spain into the quarterfinals of the World Cup.
• Russian President Putin and US President Trump are set to meet in Helsinki, Finland on July 16, 2018
EM CORPORATE HIGHLIGHTS
6
BC
P T
op P
icks/
07
/06
/20
18
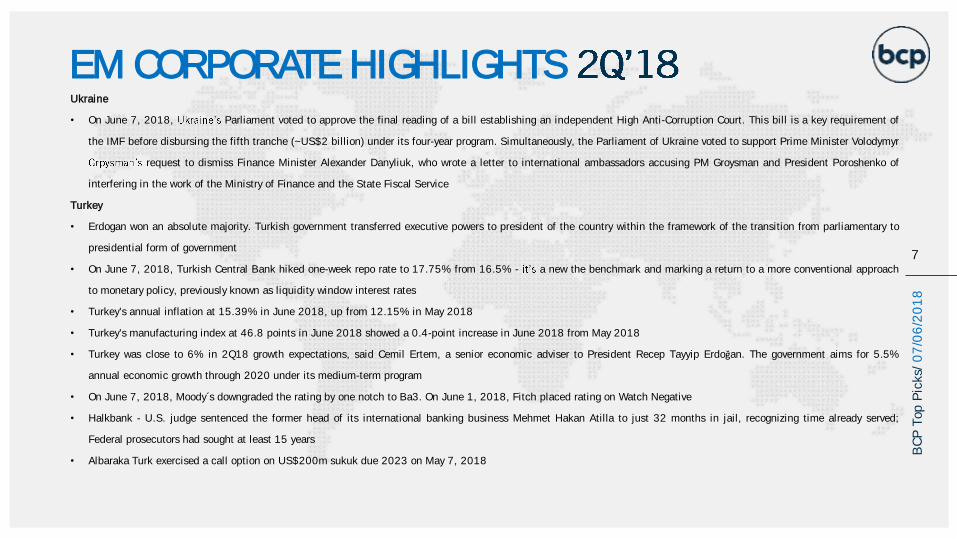
Ukraine
• On June 7, 2018, Parliament voted to approve the final reading of a bill establishing an independent High Anti-Corruption Court. This bill is a key requirement of
the IMF before disbursing the fifth tranche (~US$2 billion) under its four-year program. Simultaneously, the Parliament of Ukraine voted to support Prime Minister Volodymyr
request to dismiss Finance Minister Alexander Danyliuk, who wrote a letter to international ambassadors accusing PM Groysman and President Poroshenko of
interfering in the work of the Ministry of Finance and the State Fiscal Service
Turkey
• Erdogan won an absolute majority. Turkish government transferred executive powers to president of the country within the framework of the transition from parliamentary to
presidential form of government
• On June 7, 2018, Turkish Central Bank hiked one-week repo rate to 17.75% from 16.5% - a new the benchmark and marking a return to a more conventional approach
to monetary policy, previously known as liquidity window interest rates
• Turkey's annual inflation at 15.39% in June 2018, up from 12.15% in May 2018
• Turkey's manufacturing index at 46.8 points in June 2018 showed a 0.4-point increase in June 2018 from May 2018
• Turkey was close to 6% in 2Q18 growth expectations, said Cemil Ertem, a senior economic adviser to President Recep Tayyip Erdoğan. The government aims for 5.5%
annual economic growth through 2020 under its medium-term program
• On June 7, 2018, Moody´s downgraded the rating by one notch to Ba3. On June 1, 2018, Fitch placed rating on Watch Negative
• Halkbank - U.S. judge sentenced the former head of its international banking business Mehmet Hakan Atilla to just 32 months in jail, recognizing time already served;
Federal prosecutors had sought at least 15 years
• Albaraka Turk exercised a call option on US$200m sukuk due 2023 on May 7, 2018
EM CORPORATE HIGHLIGHTS
7
BC
P T
op P
icks/
07
/06
/20
18
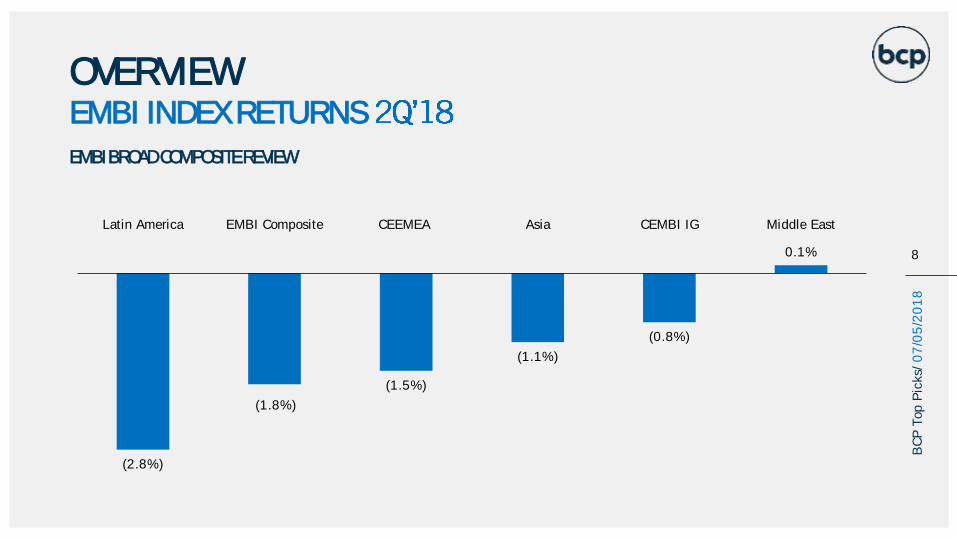
OVERVIEW EMBI INDEX RETURNS
EMBI BROAD COMPOSITE REVIEW
8
BC
P T
op P
icks/
07
/05
/20
18
(2.8%)
(1.8%)
(1.5%)
(1.1%)
(0.8%)
0.1%
Latin America EMBI Composite CEEMEA Asia CEMBI IG Middle East
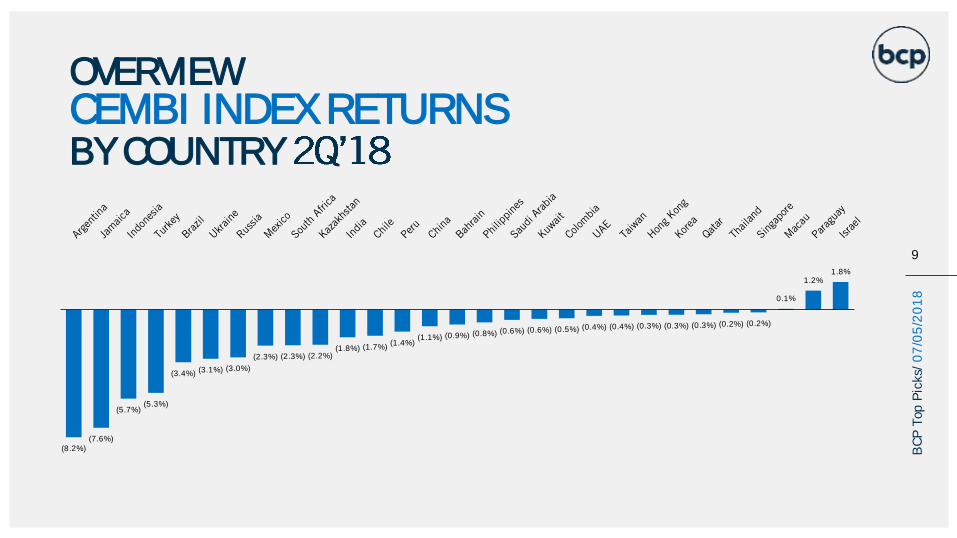
OVERVIEW CEMBI INDEX RETURNSBY COUNTRY
9
BC
P T
op P
icks/
07
/05
/20
18
(8.2%)(7.6%)
(5.7%)(5.3%)
(3.4%) (3.1%) (3.0%)
(2.3%) (2.3%) (2.2%)(1.8%) (1.7%)
(1.4%)(1.1%) (0.9%) (0.8%) (0.6%) (0.6%) (0.5%) (0.4%) (0.4%) (0.3%) (0.3%) (0.3%) (0.2%) (0.2%)
0.1%
1.2%1.8%
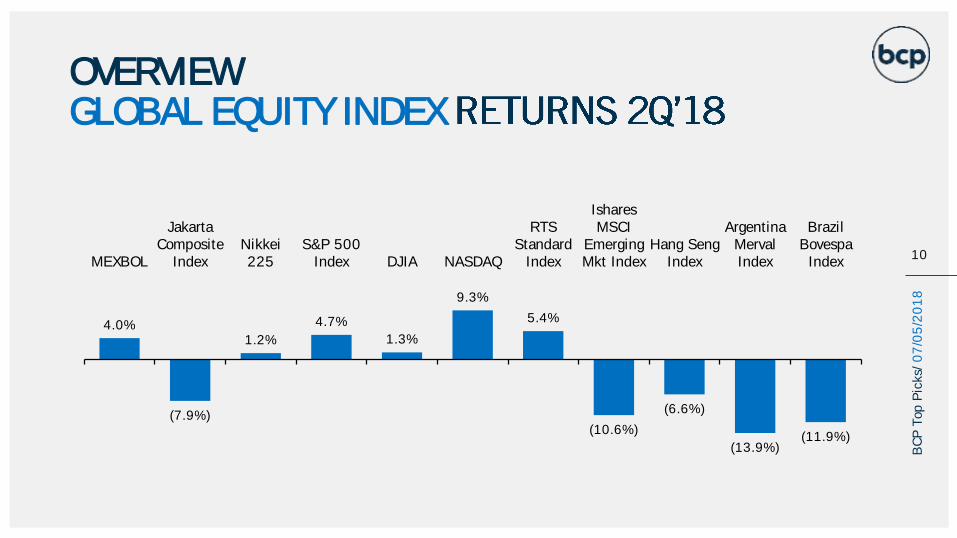
OVERVIEW GLOBAL EQUITY INDEX
10
BC
P T
op P
icks/
07
/05
/20
18
4.0%
(7.9%)
1.2%
4.7%
1.3%
9.3%
5.4%
(10.6%)
(6.6%)
(13.9%)(11.9%)
MEXBOL
JakartaComposite
IndexNikkei225
S&P 500Index DJIA NASDAQ
RTSStandard
Index
IsharesMSCI
EmergingMkt Index
Hang SengIndex
ArgentinaMervalIndex
BrazilBovespaIndex
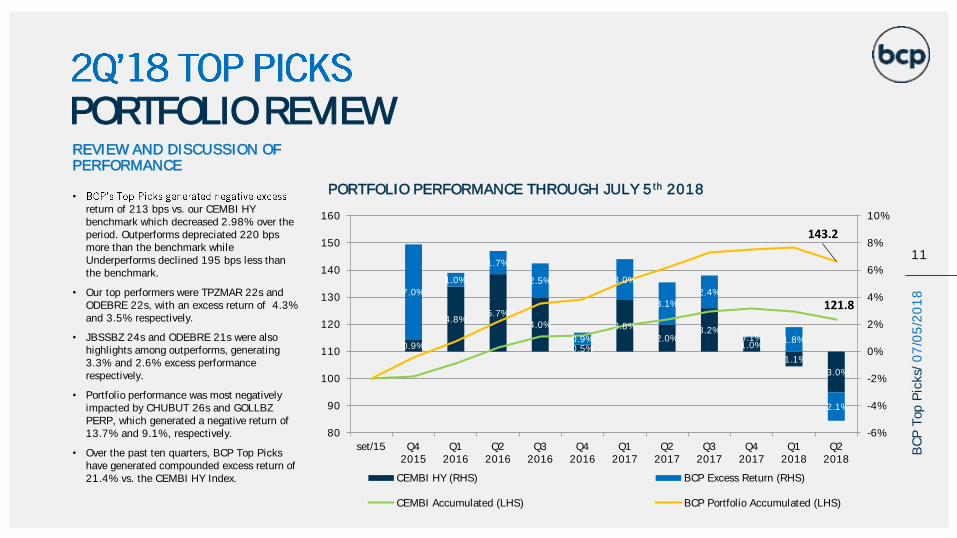
REVIEW AND DISCUSSION OF PERFORMANCE
•
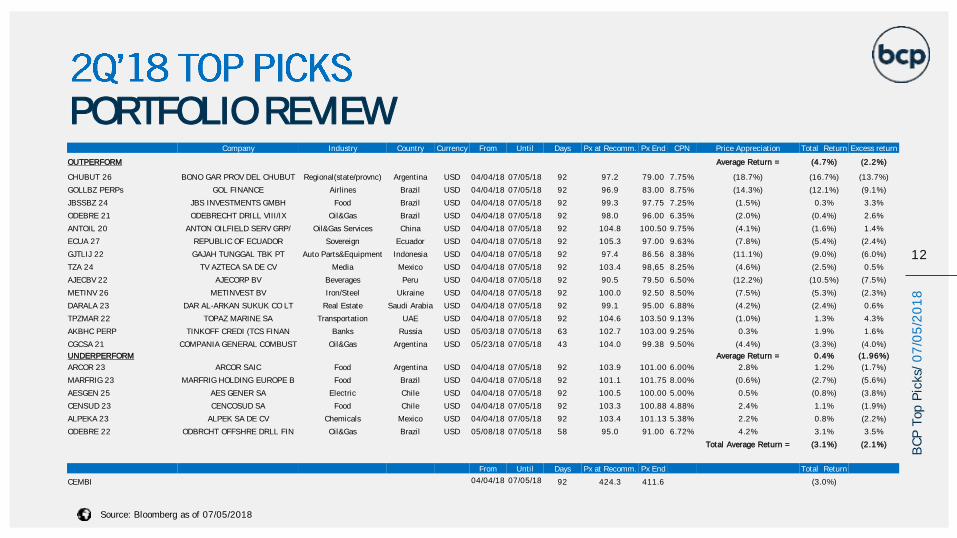
return of 213 bps vs. our CEMBI HY benchmark which decreased 2.98% over the period. Outperforms depreciated 220 bps more than the benchmark while Underperforms declined 195 bps less than the benchmark.
• Our top performers were TPZMAR 22s and ODEBRE 22s, with an excess return of 4.3% and 3.5% respectively.
• JBSSBZ 24s and ODEBRE 21s were also highlights among outperforms, generating 3.3% and 2.6% excess performance respectively.
• Portfolio performance was most negatively impacted by CHUBUT 26s and GOLLBZ PERP, which generated a negative return of 13.7% and 9.1%, respectively.
• Over the past ten quarters, BCP Top Picks have generated compounded excess return of 21.4% vs. the CEMBI HY Index.
PORTFOLIO PERFORMANCE THROUGH JULY 5th 2018
PORTFOLIO REVIEW
11
BC
P T
op P
icks/
07
/05
/20
18
0.9%
4.8%5.7%
4.0%
0.5%
3.8%
2.0%3.2%
1.0%
-1.1%
-3.0%
7.0%
1.0%
1.7%
2.5%
0.9%
3.0%
3.1%2.4%
0.1% 1.8%
-2.1%
121.8
143.2
-6%
-4%
-2%
0%
2%
4%
6%
8%
10%
80
90
100
110
120
130
140
150
160
set/15 Q42015
Q12016
Q22016
Q32016
Q42016
Q12017
Q22017
Q32017
Q42017
Q12018
Q22018
CEMBI HY (RHS) BCP Excess Return (RHS)
CEMBI Accumulated (LHS) BCP Portfolio Accumulated (LHS)
PORTFOLIO REVIEW
Source: Bloomberg as of 07/05/2018
12
BC
P T
op P
icks/
07
/05
/20
18
Company Industry Country Currency From Until Days Px at Recomm. Px End CPN Price Appreciation Total Return Excess return
OUTPERFORM Average Return = (4.7%) (2.2%)
CHUBUT 26 BONO GAR PROV DEL CHUBUT Regional(state/provnc) Argentina USD 04/04/18 07/05/18 92 97.2 79.00 7.75% (18.7%) (16.7%) (13.7%)
GOLLBZ PERPs GOL FINANCE Airlines Brazil USD 04/04/18 07/05/18 92 96.9 83.00 8.75% (14.3%) (12.1%) (9.1%)
JBSSBZ 24 JBS INVESTMENTS GMBH Food Brazil USD 04/04/18 07/05/18 92 99.3 97.75 7.25% (1.5%) 0.3% 3.3%
ODEBRE 21 ODEBRECHT DRILL VIII/IX Oil&Gas Brazil USD 04/04/18 07/05/18 92 98.0 96.00 6.35% (2.0%) (0.4%) 2.6%
ANTOIL 20 ANTON OILFIELD SERV GRP/ Oil&Gas Services China USD 04/04/18 07/05/18 92 104.8 100.50 9.75% (4.1%) (1.6%) 1.4%
ECUA 27 REPUBLIC OF ECUADOR Sovereign Ecuador USD 04/04/18 07/05/18 92 105.3 97.00 9.63% (7.8%) (5.4%) (2.4%)
GJTLIJ 22 GAJAH TUNGGAL TBK PT Auto Parts&Equipment Indonesia USD 04/04/18 07/05/18 92 97.4 86.56 8.38% (11.1%) (9.0%) (6.0%)
TZA 24 TV AZTECA SA DE CV Media Mexico USD 04/04/18 07/05/18 92 103.4 98,65 8.25% (4.6%) (2.5%) 0.5%
AJECBV 22 AJECORP BV Beverages Peru USD 04/04/18 07/05/18 92 90.5 79.50 6.50% (12.2%) (10.5%) (7.5%)
METINV 26 METINVEST BV Iron/Steel Ukraine USD 04/04/18 07/05/18 92 100.0 92.50 8.50% (7.5%) (5.3%) (2.3%)
DARALA 23 DAR AL-ARKAN SUKUK CO LT Real Estate Saudi Arabia USD 04/04/18 07/05/18 92 99.1 95.00 6.88% (4.2%) (2.4%) 0.6%
TPZMAR 22 TOPAZ MARINE SA Transportation UAE USD 04/04/18 07/05/18 92 104.6 103.50 9.13% (1.0%) 1.3% 4.3%
AKBHC PERP TINKOFF CREDI (TCS FINAN Banks Russia USD 05/03/18 07/05/18 63 102.7 103.00 9.25% 0.3% 1.9% 1.6%
CGCSA 21 COMPANIA GENERAL COMBUST Oil&Gas Argentina USD 05/23/18 07/05/18 43 104.0 99.38 9.50% (4.4%) (3.3%) (4.0%)
UNDERPERFORM Average Return = 0.4% (1.96%)
ARCOR 23 ARCOR SAIC Food Argentina USD 04/04/18 07/05/18 92 103.9 101.00 6.00% 2.8% 1.2% (1.7%)
MARFRIG 23 MARFRIG HOLDING EUROPE B Food Brazil USD 04/04/18 07/05/18 92 101.1 101.75 8.00% (0.6%) (2.7%) (5.6%)
AESGEN 25 AES GENER SA Electric Chile USD 04/04/18 07/05/18 92 100.5 100.00 5.00% 0.5% (0.8%) (3.8%)
CENSUD 23 CENCOSUD SA Food Chile USD 04/04/18 07/05/18 92 103.3 100.88 4.88% 2.4% 1.1% (1.9%)
ALPEKA 23 ALPEK SA DE CV Chemicals Mexico USD 04/04/18 07/05/18 92 103.4 101.13 5.38% 2.2% 0.8% (2.2%)
ODEBRE 22 ODBRCHT OFFSHRE DRLL FIN Oil&Gas Brazil USD 05/08/18 07/05/18 58 95.0 91.00 6.72% 4.2% 3.1% 3.5%
Total Average Return = (3.1%) (2.1%)
From Until Days Px at Recomm. Px End Total Return
CEMBI 04/04/18 07/05/18 92 424.3 411.6 (3.0%)
PORTFOLIO SUMMARY
13
BC
P T
op P
icks/
07
/05
/20
18
Source: Bloomberg as of 07/05/2018
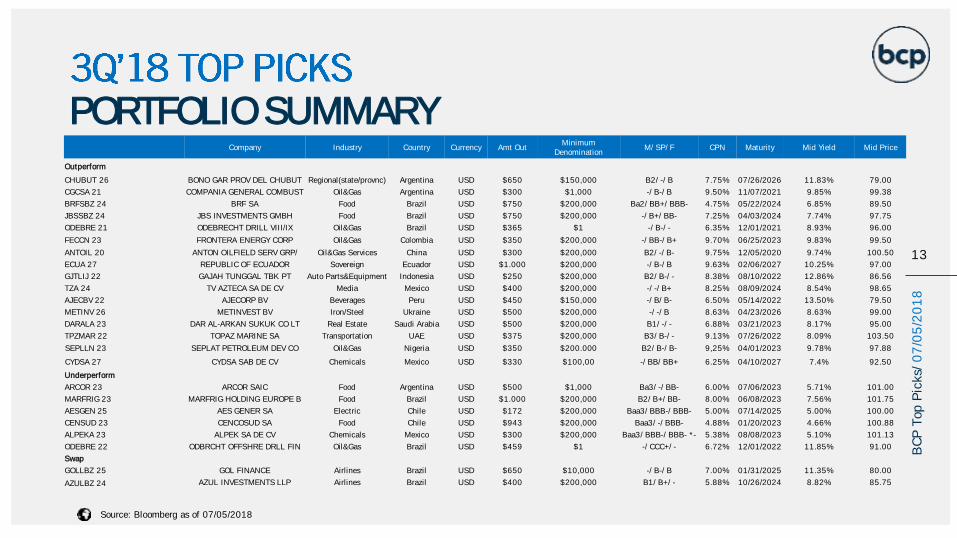
Company Industry Country Currency Amt OutMinimum
DenominationM/ SP/ F CPN Maturity Mid Yield Mid Price
Outperform
CHUBUT 26 BONO GAR PROV DEL CHUBUT Regional(state/provnc) Argentina USD $650 $150,000 B2/ -/ B 7.75% 07/26/2026 11.83% 79.00
CGCSA 21 COMPANIA GENERAL COMBUST Oil&Gas Argentina USD $300 $1,000 -/ B-/ B 9.50% 11/07/2021 9.85% 99.38
BRFSBZ 24 BRF SA Food Brazil USD $750 $200,000 Ba2/ BB+/ BBB- 4.75% 05/22/2024 6.85% 89.50
JBSSBZ 24 JBS INVESTMENTS GMBH Food Brazil USD $750 $200,000 -/ B+/ BB- 7.25% 04/03/2024 7.74% 97.75
ODEBRE 21 ODEBRECHT DRILL VIII/IX Oil&Gas Brazil USD $365 $1 -/ B-/ - 6.35% 12/01/2021 8.93% 96.00
FECCN 23 FRONTERA ENERGY CORP Oil&Gas Colombia USD $350 $200,000 -/ BB-/ B+ 9.70% 06/25/2023 9.83% 99.50
ANTOIL 20 ANTON OILFIELD SERV GRP/ Oil&Gas Services China USD $300 $200,000 B2/ -/ B- 9.75% 12/05/2020 9.74% 100.50
ECUA 27 REPUBLIC OF ECUADOR Sovereign Ecuador USD $1.000 $200,000 -/ B-/ B 9.63% 02/06/2027 10.25% 97.00
GJTLIJ 22 GAJAH TUNGGAL TBK PT Auto Parts&Equipment Indonesia USD $250 $200,000 B2/ B-/ - 8.38% 08/10/2022 12.86% 86.56
TZA 24 TV AZTECA SA DE CV Media Mexico USD $400 $200,000 -/ -/ B+ 8.25% 08/09/2024 8.54% 98.65
AJECBV 22 AJECORP BV Beverages Peru USD $450 $150,000 -/ B/ B- 6.50% 05/14/2022 13.50% 79.50
METINV 26 METINVEST BV Iron/Steel Ukraine USD $500 $200,000 -/ -/ B 8.63% 04/23/2026 8.63% 99.00
DARALA 23 DAR AL-ARKAN SUKUK CO LT Real Estate Saudi Arabia USD $500 $200,000 B1/ -/ - 6.88% 03/21/2023 8.17% 95.00
TPZMAR 22 TOPAZ MARINE SA Transportation UAE USD $375 $200,000 B3/ B-/ - 9.13% 07/26/2022 8.09% 103.50
SEPLLN 23 SEPLAT PETROLEUM DEV CO Oil&Gas Nigeria USD $350 $200.000 B2/ B-/ B- 9,25% 04/01/2023 9.78% 97.88
CYDSA 27 CYDSA SAB DE CV Chemicals Mexico USD $330 $100,00 -/ BB/ BB+ 6.25% 04/10/2027 7.4% 92.50
Underperform
ARCOR 23 ARCOR SAIC Food Argentina USD $500 $1,000 Ba3/ -/ BB- 6.00% 07/06/2023 5.71% 101.00
MARFRIG 23 MARFRIG HOLDING EUROPE B Food Brazil USD $1.000 $200,000 B2/ B+/ BB- 8.00% 06/08/2023 7.56% 101.75
AESGEN 25 AES GENER SA Electric Chile USD $172 $200,000 Baa3/ BBB-/ BBB- 5.00% 07/14/2025 5.00% 100.00
CENSUD 23 CENCOSUD SA Food Chile USD $943 $200,000 Baa3/ -/ BBB- 4.88% 01/20/2023 4.66% 100.88
ALPEKA 23 ALPEK SA DE CV Chemicals Mexico USD $300 $200,000 Baa3/ BBB-/ BBB- *- 5.38% 08/08/2023 5.10% 101.13
ODEBRE 22 ODBRCHT OFFSHRE DRLL FIN Oil&Gas Brazil USD $459 $1 -/ CCC+/ - 6.72% 12/01/2022 11.85% 91.00
Swap
GOLLBZ 25 GOL FINANCE Airlines Brazil USD $650 $10,000 -/ B-/ B 7.00% 01/31/2025 11.35% 80.00
AZULBZ 24 AZUL INVESTMENTS LLP Airlines Brazil USD $400 $200,000 B1/ B+/ - 5.88% 10/26/2024 8.82% 85.75
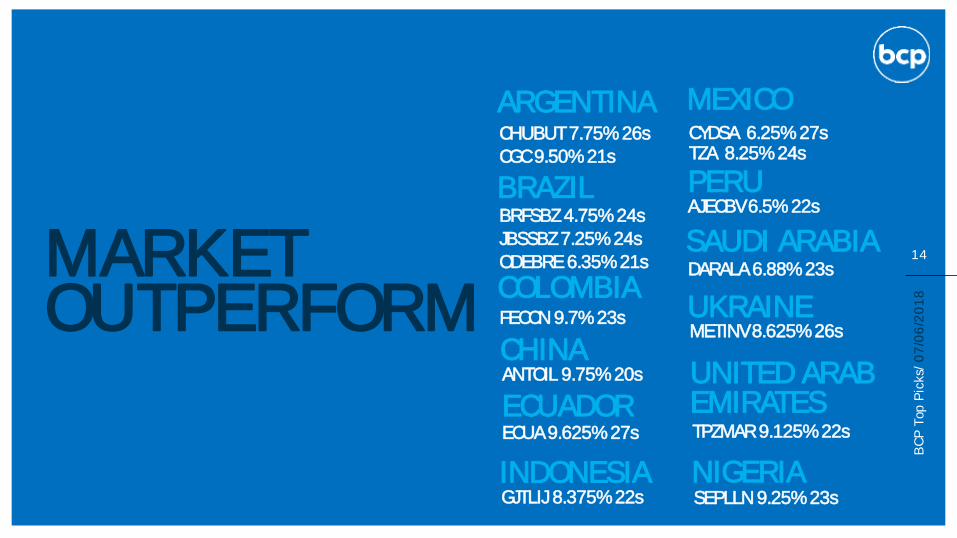
MARKET OUTPERFORM
CHUBUT 7.75% 26s CGC 9.50% 21s
ARGENTINA
BRFSBZ 4.75% 24sJBSSBZ 7.25% 24sODEBRE 6.35% 21s
BRAZILAJECBV 6.5% 22sPERU
DARALA 6.88% 23s
SAUDI ARABIA14
BC
P T
op P
icks/
07
/06
/20
18
ANTOIL 9.75% 20sCHINA
TPZMAR 9.125% 22s
UNITED ARAB EMIRATES
CYDSA 6.25% 27sTZA 8.25% 24s
MEXICO
ECUA9.625% 27sECUADOR
INDONESIAGJTLIJ 8.375% 22s
METINV 8.625% 26sUKRAINE
SEPLLN 9.25% 23sNIGERIA
FECCN 9.7% 23s
COLOMBIA

ARGENTINA
15
BC
P T
op P
icks/
07
/06
/20
18
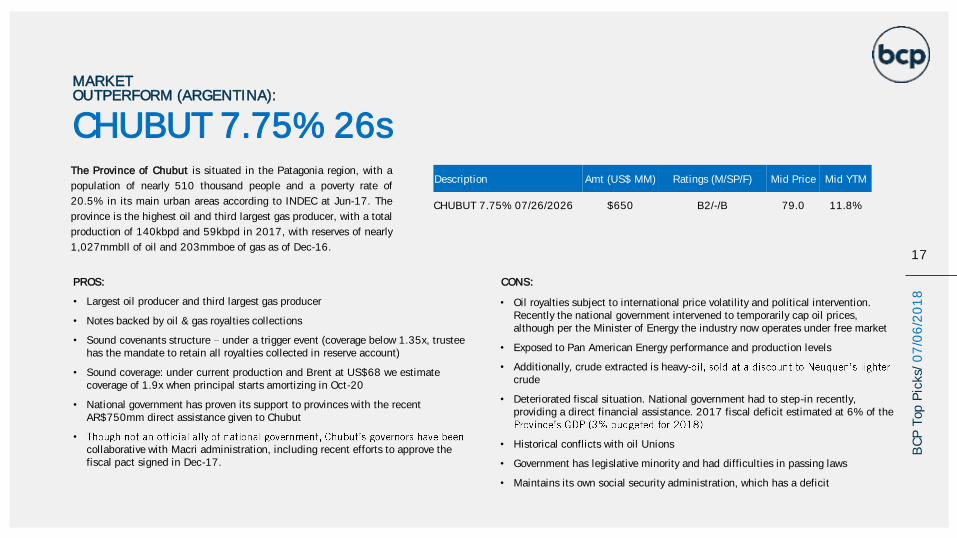
CHUBUT 7.75% 26sThe Province of Chubut is situated in the Patagonia region, with a
population of nearly 510 thousand people and a poverty rate of
20.5% in its main urban areas according to INDEC at Jun-17. The
province is the highest oil and third largest gas producer, with a total
production of 140kbpd and 59kbpd in 2017, with reserves of nearly
1,027mmbll of oil and 203mmboe of gas as of Dec-16.
PROS:
• Largest oil producer and third largest gas producer
• Notes backed by oil & gas royalties collections
• Sound covenants structure under a trigger event (coverage below 1.35x, trustee has the mandate to retain all royalties collected in reserve account)
• Sound coverage: under current production and Brent at US$68 we estimate coverage of 1.9x when principal starts amortizing in Oct-20
• National government has proven its support to provinces with the recent AR$750mm direct assistance given to Chubut
•
collaborative with Macri administration, including recent efforts to approve the fiscal pact signed in Dec-17.
CONS:
• Oil royalties subject to international price volatility and political intervention. Recently the national government intervened to temporarily cap oil prices, although per the Minister of Energy the industry now operates under free market
• Exposed to Pan American Energy performance and production levels
• Additionally, crude extracted is heavy-crude
• Deteriorated fiscal situation. National government had to step-in recently, providing a direct financial assistance. 2017 fiscal deficit estimated at 6% of the
• Historical conflicts with oil Unions
• Government has legislative minority and had difficulties in passing laws
• Maintains its own social security administration, which has a deficit
MARKET OUTPERFORM (ARGENTINA):
Description Amt (US$ MM) Ratings (M/SP/F) Mid Price Mid YTM
CHUBUT 7.75% 07/26/2026 $650 B2/-/B 79.0 11.8%
17
BC
P T
op P
icks/
07
/06
/20
18
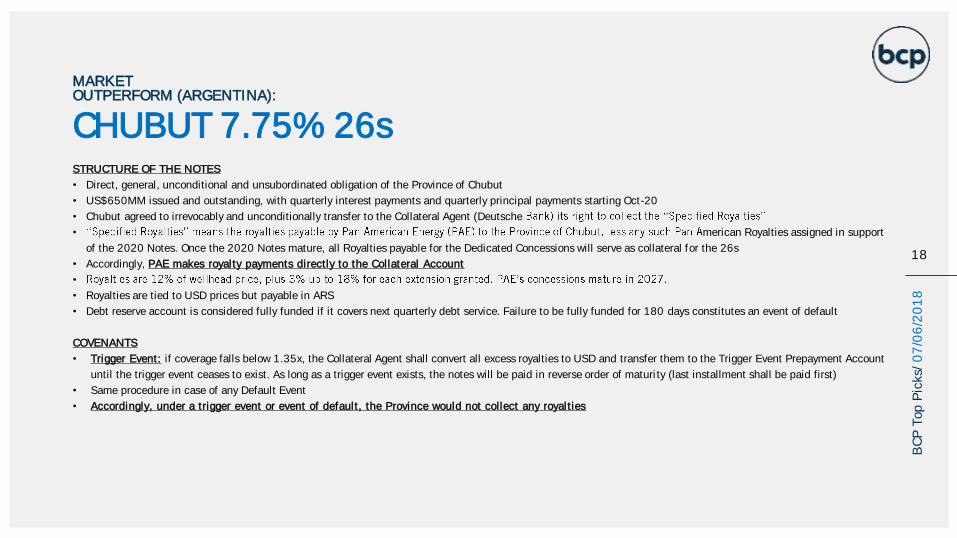
STRUCTURE OF THE NOTES
• Direct, general, unconditional and unsubordinated obligation of the Province of Chubut
• US$650MM issued and outstanding, with quarterly interest payments and quarterly principal payments starting Oct-20
• Chubut agreed to irrevocably and unconditionally transfer to the Collateral Agent (Deutsche
• merican Royalties assigned in support
of the 2020 Notes. Once the 2020 Notes mature, all Royalties payable for the Dedicated Concessions will serve as collateral for the 26s
• Accordingly, PAE makes royalty payments directly to the Collateral Account
•
• Royalties are tied to USD prices but payable in ARS
• Debt reserve account is considered fully funded if it covers next quarterly debt service. Failure to be fully funded for 180 days constitutes an event of default
COVENANTS
• Trigger Event: if coverage falls below 1.35x, the Collateral Agent shall convert all excess royalties to USD and transfer them to the Trigger Event Prepayment Account
until the trigger event ceases to exist. As long as a trigger event exists, the notes will be paid in reverse order of maturity (last installment shall be paid first)
• Same procedure in case of any Default Event
• Accordingly, under a trigger event or event of default, the Province would not collect any royalties
CHUBUT 7.75% 26s
MARKET OUTPERFORM (ARGENTINA):
18
BC
P T
op P
icks/
07
/06
/20
18
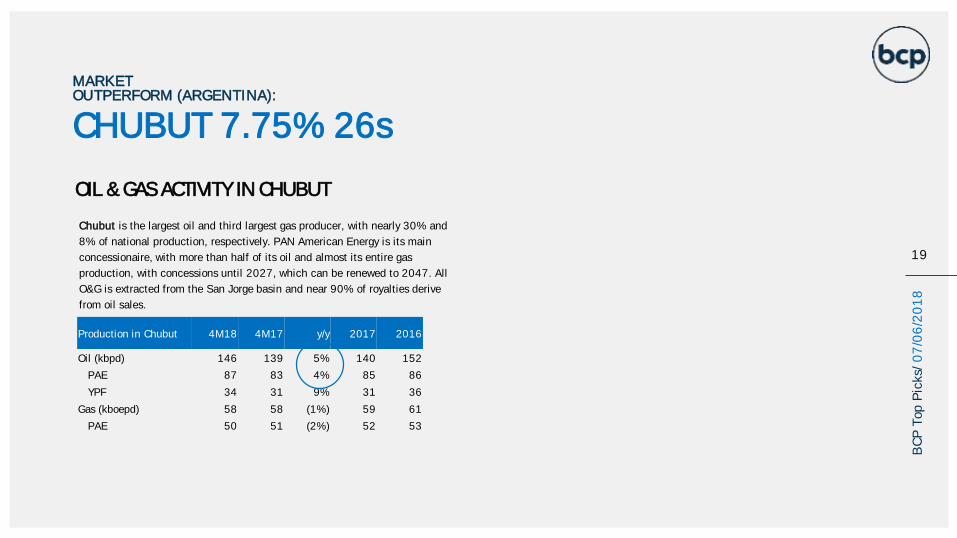
Chubut is the largest oil and third largest gas producer, with nearly 30% and
8% of national production, respectively. PAN American Energy is its main
concessionaire, with more than half of its oil and almost its entire gas
production, with concessions until 2027, which can be renewed to 2047. All
O&G is extracted from the San Jorge basin and near 90% of royalties derive
from oil sales.
Production in Chubut 4M18 4M17 y/y 2017 2016
Oil (kbpd) 146 139 5% 140 152
PAE 87 83 4% 85 86
YPF 34 31 9% 31 36
Gas (kboepd) 58 58 (1%) 59 61
PAE 50 51 (2%) 52 53
CHUBUT 7.75% 26s
MARKET OUTPERFORM (ARGENTINA):
OIL & GAS ACTIVITY IN CHUBUT
19
BC
P T
op P
icks/
07
/06
/20
18
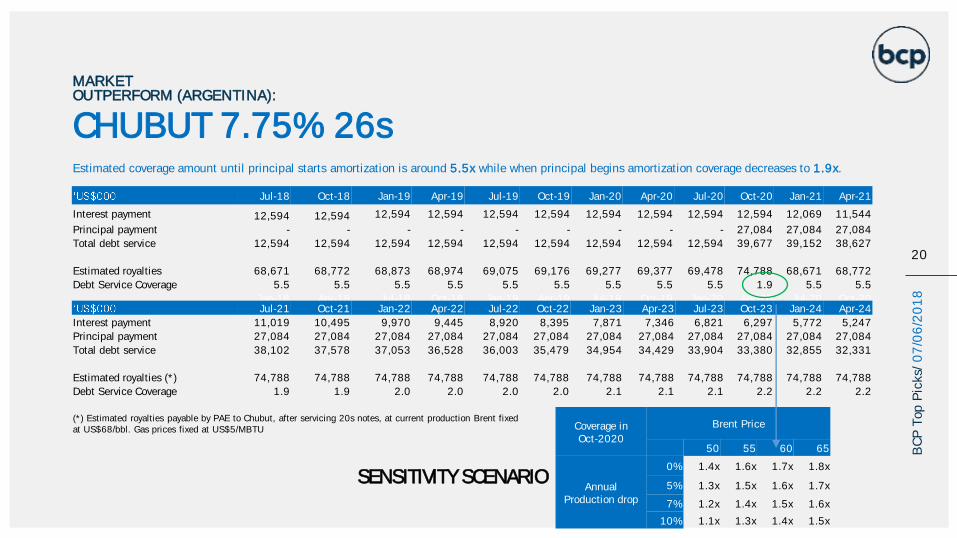
Estimated coverage amount until principal starts amortization is around 5.5x while when principal begins amortization coverage decreases to 1.9x.
CHUBUT 7.75% 26s
MARKET OUTPERFORM (ARGENTINA):
Coverage in Oct-2020
Brent Price
50 55 60 65
AnnualProduction drop
0% 1.4x 1.6x 1.7x 1.8x
5% 1.3x 1.5x 1.6x 1.7x
7% 1.2x 1.4x 1.5x 1.6x
10% 1.1x 1.3x 1.4x 1.5x
Jul-18 Oct-18 Jan-19 Apr-19 Jul-19 Oct-19 Jan-20 Apr-20 Jul-20 Oct-20 Jan-21 Apr-21
Interest payment 12,594 12,594 12,594 12,594 12,594 12,594 12,594 12,594 12,594 12,594 12,069 11,544
Principal payment - - - - - - - - - 27,084 27,084 27,084
Total debt service 12,594 12,594 12,594 12,594 12,594 12,594 12,594 12,594 12,594 39,677 39,152 38,627
Estimated royalties 68,671 68,772 68,873 68,974 69,075 69,176 69,277 69,377 69,478 74,788 68,671 68,772
Debt Service Coverage 5.5 5.5 5.5 5.5 5.5 5.5 5.5 5.5 5.5 1.9 5.5 5.5
Jan-18 Apr-18 Jul-18 Oct-18 Jan-19 Apr-19 Jul-19 Oct-19 Jan-20 Apr-20 Jul-20 Oct-20Jul-21 Oct-21 Jan-22 Apr-22 Jul-22 Oct-22 Jan-23 Apr-23 Jul-23 Oct-23 Jan-24 Apr-24
Interest payment 11,019 10,495 9,970 9,445 8,920 8,395 7,871 7,346 6,821 6,297 5,772 5,247
Principal payment 27,084 27,084 27,084 27,084 27,084 27,084 27,084 27,084 27,084 27,084 27,084 27,084
Total debt service 38,102 37,578 37,053 36,528 36,003 35,479 34,954 34,429 33,904 33,380 32,855 32,331
Estimated royalties (*) 74,788 74,788 74,788 74,788 74,788 74,788 74,788 74,788 74,788 74,788 74,788 74,788
Debt Service Coverage 1.9 1.9 2.0 2.0 2.0 2.0 2.1 2.1 2.1 2.2 2.2 2.2
(*) Estimated royalties payable by PAE to Chubut, after servicing 20s notes, at current production Brent fixed at US$68/bbl. Gas prices fixed at US$5/MBTU
SENSITIVITY SCENARIO
20
BC
P T
op P
icks/
07
/06
/20
18
CHUBUT 7.75% 26s
MARKET OUTPERFORM (ARGENTINA):
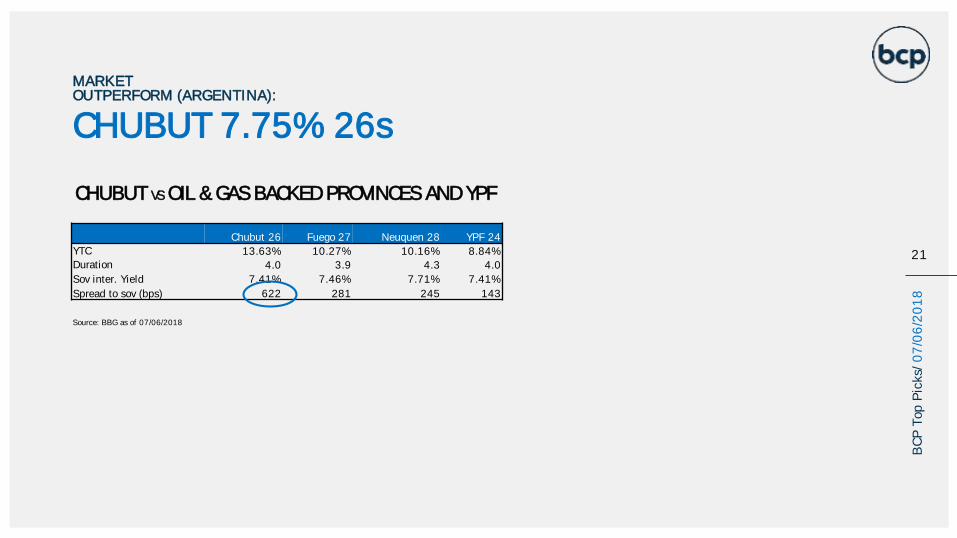
CHUBUT VS OIL & GAS BACKED PROVINCES AND YPF
Chubut 26 Fuego 27 Neuquen 28 YPF 24
YTC 13.63% 10.27% 10.16% 8.84%
Duration 4.0 3.9 4.3 4.0
Sov inter. Yield 7.41% 7.46% 7.71% 7.41%
Spread to sov (bps) 622 281 245 143
Source: BBG as of 07/06/2018
21
BC
P T
op P
icks/
07
/06
/20
18
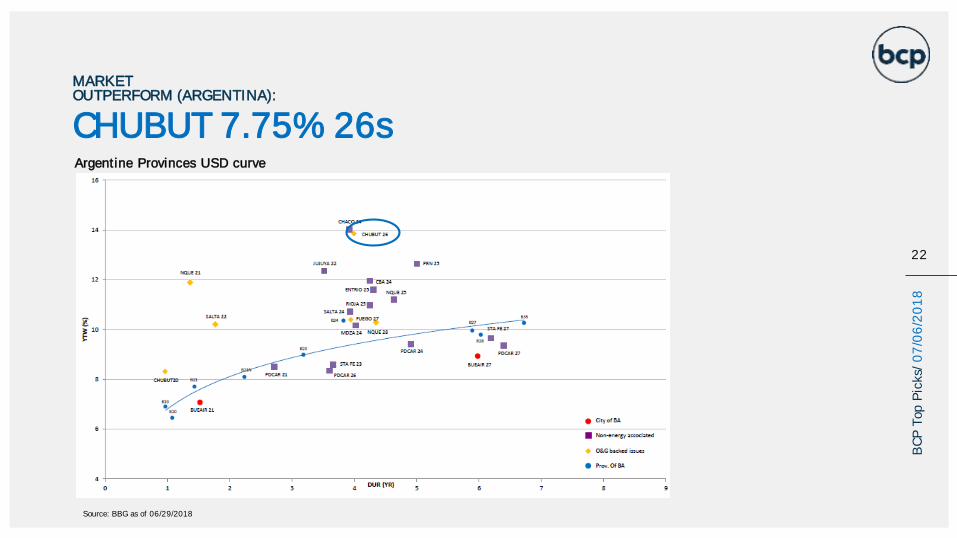
Argentine Provinces USD curve
MARKET OUTPERFORM (ARGENTINA):
CHUBUT 7.75% 26s
Source: BBG as of 06/29/2018
22
BC
P T
op P
icks/
07
/06
/20
18
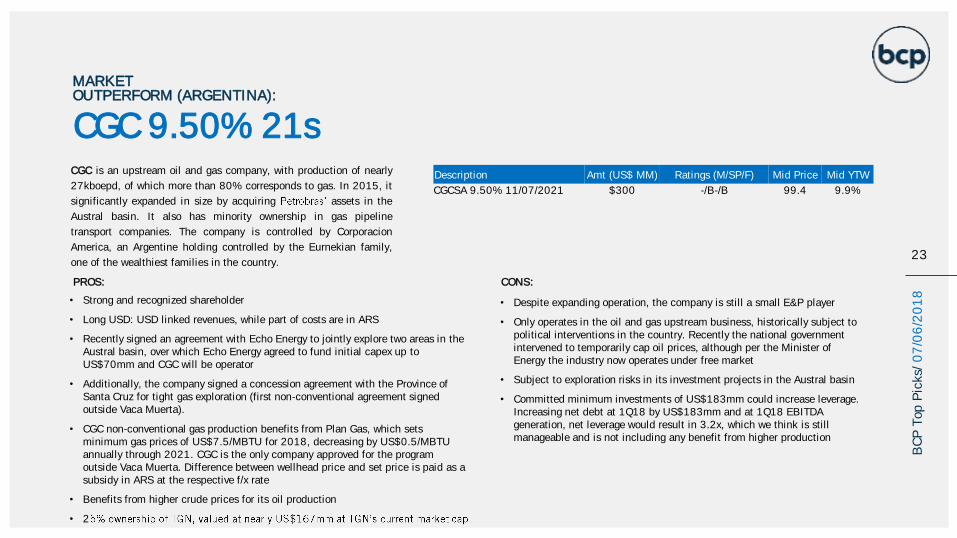
CGC is an upstream oil and gas company, with production of nearly
27kboepd, of which more than 80% corresponds to gas. In 2015, it
significantly expanded in size by acquiring assets in the
Austral basin. It also has minority ownership in gas pipeline
transport companies. The company is controlled by Corporacion
America, an Argentine holding controlled by the Eurnekian family,
one of the wealthiest families in the country.
PROS:
• Strong and recognized shareholder
• Long USD: USD linked revenues, while part of costs are in ARS
• Recently signed an agreement with Echo Energy to jointly explore two areas in the Austral basin, over which Echo Energy agreed to fund initial capex up to US$70mm and CGC will be operator
• Additionally, the company signed a concession agreement with the Province of Santa Cruz for tight gas exploration (first non-conventional agreement signed outside Vaca Muerta).
• CGC non-conventional gas production benefits from Plan Gas, which sets minimum gas prices of US$7.5/MBTU for 2018, decreasing by US$0.5/MBTU annually through 2021. CGC is the only company approved for the program outside Vaca Muerta. Difference between wellhead price and set price is paid as a subsidy in ARS at the respective f/x rate
• Benefits from higher crude prices for its oil production
• 2
CONS:
• Despite expanding operation, the company is still a small E&P player
• Only operates in the oil and gas upstream business, historically subject to political interventions in the country. Recently the national government intervened to temporarily cap oil prices, although per the Minister of Energy the industry now operates under free market
• Subject to exploration risks in its investment projects in the Austral basin
• Committed minimum investments of US$183mm could increase leverage. Increasing net debt at 1Q18 by US$183mm and at 1Q18 EBITDA generation, net leverage would result in 3.2x, which we think is still manageable and is not including any benefit from higher production
Description Amt (US$ MM) Ratings (M/SP/F) Mid Price Mid YTW
CGCSA 9.50% 11/07/2021 $300 -/B-/B 99.4 9.9%
CGC 9.50% 21s
MARKET OUTPERFORM (ARGENTINA):
23
BC
P T
op P
icks/
07
/06
/20
18
CGC 9.50% 21s
MARKET OUTPERFORM (ARGENTINA):
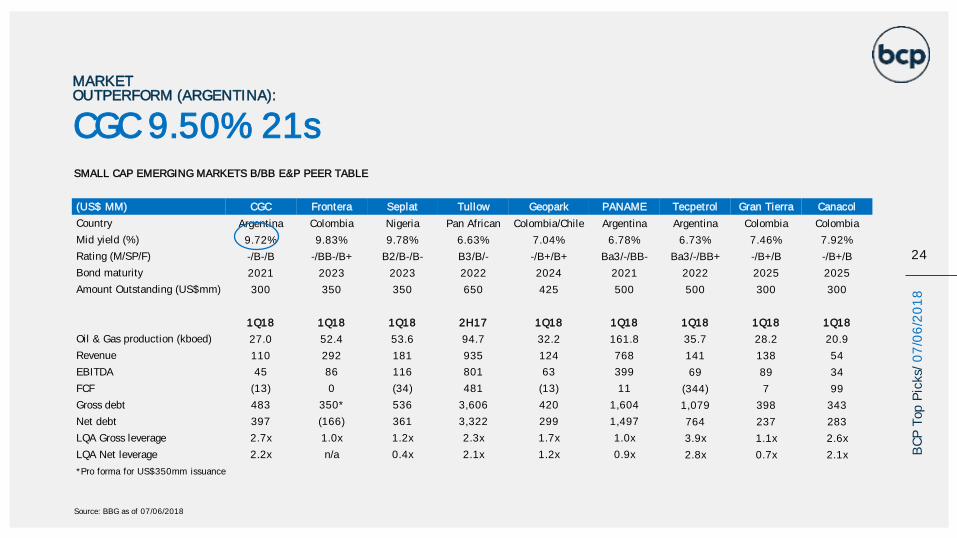
SMALL CAP EMERGING MARKETS B/BB E&P PEER TABLE
(US$ MM) CGC Frontera Seplat Tullow Geopark PANAME Tecpetrol Gran Tierra Canacol
Country Argentina Colombia Nigeria Pan African Colombia/Chile Argentina Argentina Colombia Colombia
Mid yield (%) 9.72% 9.83% 9.78% 6.63% 7.04% 6.78% 6.73% 7.46% 7.92%
Rating (M/SP/F) -/B-/B -/BB-/B+ B2/B-/B- B3/B/- -/B+/B+ Ba3/-/BB- Ba3/-/BB+ -/B+/B -/B+/B
Bond maturity 2021 2023 2023 2022 2024 2021 2022 2025 2025
Amount Outstanding (US$mm) 300 350 350 650 425 500 500 300 300
1Q18 1Q18 1Q18 2H17 1Q18 1Q18 1Q18 1Q18 1Q18
Oil & Gas production (kboed) 27.0 52.4 53.6 94.7 32.2 161.8 35.7 28.2 20.9
Revenue 110 292 181 935 124 768 141 138 54
EBITDA 45 86 116 801 63 399 69 89 34
FCF (13) 0 (34) 481 (13) 11 (344) 7 99
Gross debt 483 350* 536 3,606 420 1,604 1,079 398 343
Net debt 397 (166) 361 3,322 299 1,497 764 237 283
LQA Gross leverage 2.7x 1.0x 1.2x 2.3x 1.7x 1.0x 3.9x 1.1x 2.6x
LQA Net leverage 2.2x n/a 0.4x 2.1x 1.2x 0.9x 2.8x 0.7x 2.1x
*Pro forma for US$350mm issuance
24
BC
P T
op P
icks/
07
/06
/20
18
Source: BBG as of 07/06/2018
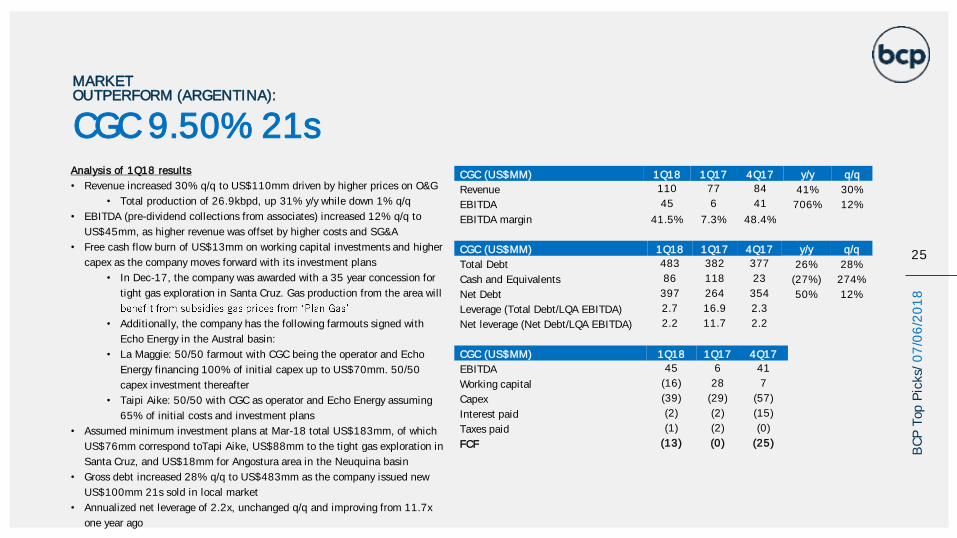
Analysis of 1Q18 results
• Revenue increased 30% q/q to US$110mm driven by higher prices on O&G
• Total production of 26.9kbpd, up 31% y/y while down 1% q/q
• EBITDA (pre-dividend collections from associates) increased 12% q/q to
US$45mm, as higher revenue was offset by higher costs and SG&A
• Free cash flow burn of US$13mm on working capital investments and higher
capex as the company moves forward with its investment plans
• In Dec-17, the company was awarded with a 35 year concession for
tight gas exploration in Santa Cruz. Gas production from the area will
• Additionally, the company has the following farmouts signed with
Echo Energy in the Austral basin:
• La Maggie: 50/50 farmout with CGC being the operator and Echo
Energy financing 100% of initial capex up to US$70mm. 50/50
capex investment thereafter
• Taipi Aike: 50/50 with CGC as operator and Echo Energy assuming
65% of initial costs and investment plans
• Assumed minimum investment plans at Mar-18 total US$183mm, of which
US$76mm correspond toTapi Aike, US$88mm to the tight gas exploration in
Santa Cruz, and US$18mm for Angostura area in the Neuquina basin
• Gross debt increased 28% q/q to US$483mm as the company issued new
US$100mm 21s sold in local market
• Annualized net leverage of 2.2x, unchanged q/q and improving from 11.7x
one year ago
CGC (US$MM) 1Q18 1Q17 4Q17 y/y q/q
Revenue 110 77 84 41% 30%
EBITDA 45 6 41 706% 12%
EBITDA margin 41.5% 7.3% 48.4%
CGC (US$MM) 1Q18 1Q17 4Q17 y/y q/q
Total Debt 483 382 377 26% 28%
Cash and Equivalents 86 118 23 (27%) 274%
Net Debt 397 264 354 50% 12%
Leverage (Total Debt/LQA EBITDA) 2.7 16.9 2.3
Net leverage (Net Debt/LQA EBITDA) 2.2 11.7 2.2
CGC (US$MM) 1Q18 1Q17 4Q17
EBITDA 45 6 41
Working capital (16) 28 7
Capex (39) (29) (57)
Interest paid (2) (2) (15)
Taxes paid (1) (2) (0)
FCF (13) (0) (25)
CGC 9.50% 21s
MARKET OUTPERFORM (ARGENTINA):
25
BC
P T
op P
icks/
07
/06
/20
18
BRAZIL
25
BC
P T
op P
icks/
07
/06
/20
18
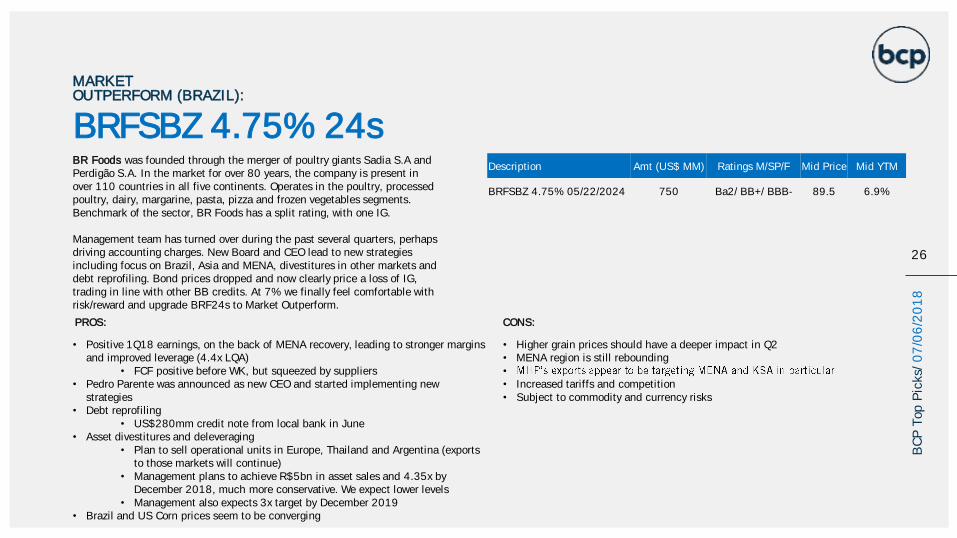
BR Foods was founded through the merger of poultry giants Sadia S.A and Perdigão S.A. In the market for over 80 years, the company is present in over 110 countries in all five continents. Operates in the poultry, processed poultry, dairy, margarine, pasta, pizza and frozen vegetables segments. Benchmark of the sector, BR Foods has a split rating, with one IG.
Management team has turned over during the past several quarters, perhaps driving accounting charges. New Board and CEO lead to new strategies including focus on Brazil, Asia and MENA, divestitures in other markets and debt reprofiling. Bond prices dropped and now clearly price a loss of IG, trading in line with other BB credits. At 7% we finally feel comfortable with risk/reward and upgrade BRF24s to Market Outperform.
• Higher grain prices should have a deeper impact in Q2• MENA region is still rebounding•
• Increased tariffs and competition• Subject to commodity and currency risks
MARKET OUTPERFORM (BRAZIL):
BRFSBZ 4.75% 24sDescription Amt (US$ MM) Ratings M/SP/F Mid Price Mid YTM
BRFSBZ 4.75% 05/22/2024 750 Ba2/ BB+/ BBB- 89.5 6.9%
26
BC
P T
op P
icks/
07
/06
/20
18
PROS: CONS:
• Positive 1Q18 earnings, on the back of MENA recovery, leading to stronger margins and improved leverage (4.4x LQA)
• FCF positive before WK, but squeezed by suppliers• Pedro Parente was announced as new CEO and started implementing new
strategies• Debt reprofiling
• US$280mm credit note from local bank in June • Asset divestitures and deleveraging
• Plan to sell operational units in Europe, Thailand and Argentina (exports to those markets will continue)
• Management plans to achieve R$5bn in asset sales and 4.35x by December 2018, much more conservative. We expect lower levels
• Management also expects 3x target by December 2019• Brazil and US Corn prices seem to be converging
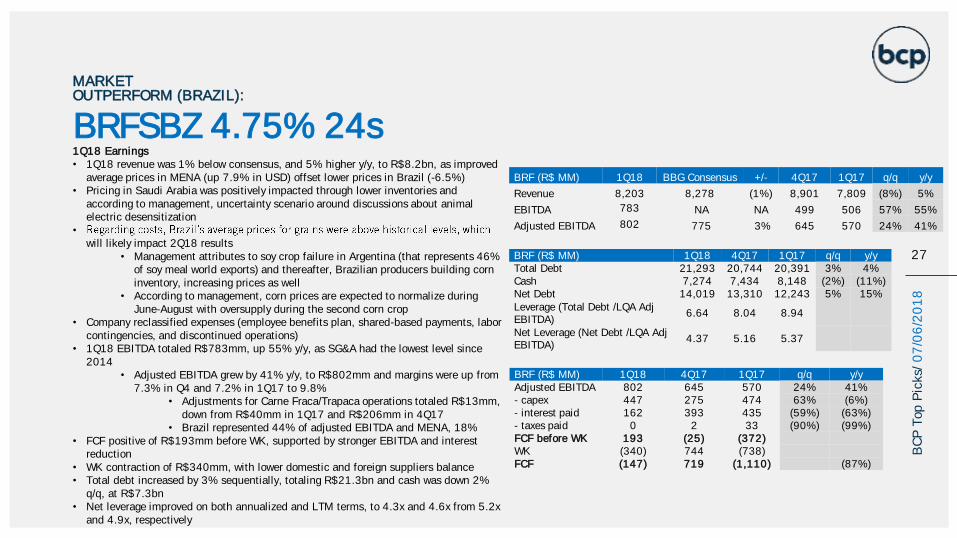
1Q18 Earnings• 1Q18 revenue was 1% below consensus, and 5% higher y/y, to R$8.2bn, as improved
average prices in MENA (up 7.9% in USD) offset lower prices in Brazil (-6.5%)• Pricing in Saudi Arabia was positively impacted through lower inventories and
according to management, uncertainty scenario around discussions about animal electric desensitization
•
will likely impact 2Q18 results • Management attributes to soy crop failure in Argentina (that represents 46%
of soy meal world exports) and thereafter, Brazilian producers building corn inventory, increasing prices as well
• According to management, corn prices are expected to normalize during June-August with oversupply during the second corn crop
• Company reclassified expenses (employee benefits plan, shared-based payments, labor contingencies, and discontinued operations)
• 1Q18 EBITDA totaled R$783mm, up 55% y/y, as SG&A had the lowest level since 2014
• Adjusted EBITDA grew by 41% y/y, to R$802mm and margins were up from 7.3% in Q4 and 7.2% in 1Q17 to 9.8%
• Adjustments for Carne Fraca/Trapaca operations totaled R$13mm, down from R$40mm in 1Q17 and R$206mm in 4Q17
• Brazil represented 44% of adjusted EBITDA and MENA, 18%• FCF positive of R$193mm before WK, supported by stronger EBITDA and interest
reduction• WK contraction of R$340mm, with lower domestic and foreign suppliers balance• Total debt increased by 3% sequentially, totaling R$21.3bn and cash was down 2%
q/q, at R$7.3bn• Net leverage improved on both annualized and LTM terms, to 4.3x and 4.6x from 5.2x
and 4.9x, respectively
MARKET OUTPERFORM (BRAZIL):
BRFSBZ 4.75% 24s
27
BRF (R$ MM) 1Q18 BBG Consensus +/- 4Q17 1Q17 q/q y/y
Revenue 8,203 8,278 (1%) 8,901 7,809 (8%) 5%
EBITDA 783 NA NA 499 506 57% 55%
Adjusted EBITDA 802 775 3% 645 570 24% 41%
BRF (R$ MM) 1Q18 4Q17 1Q17 q/q y/yTotal Debt 21,293 20,744 20,391 3% 4%Cash 7,274 7,434 8,148 (2%) (11%)Net Debt 14,019 13,310 12,243 5% 15%Leverage (Total Debt /LQA Adj EBITDA)
6.64 8.04 8.94
Net Leverage (Net Debt /LQA Adj EBITDA)
4.37 5.16 5.37
BRF (R$ MM) 1Q18 4Q17 1Q17 q/q y/yAdjusted EBITDA 802 645 570 24% 41%- capex 447 275 474 63% (6%)- interest paid 162 393 435 (59%) (63%)- taxes paid 0 2 33 (90%) (99%)FCF before WK 193 (25) (372)WK (340) 744 (738)FCF (147) 719 (1,110) (87%)
BC
P T
op P
icks/
07
/06
/20
18
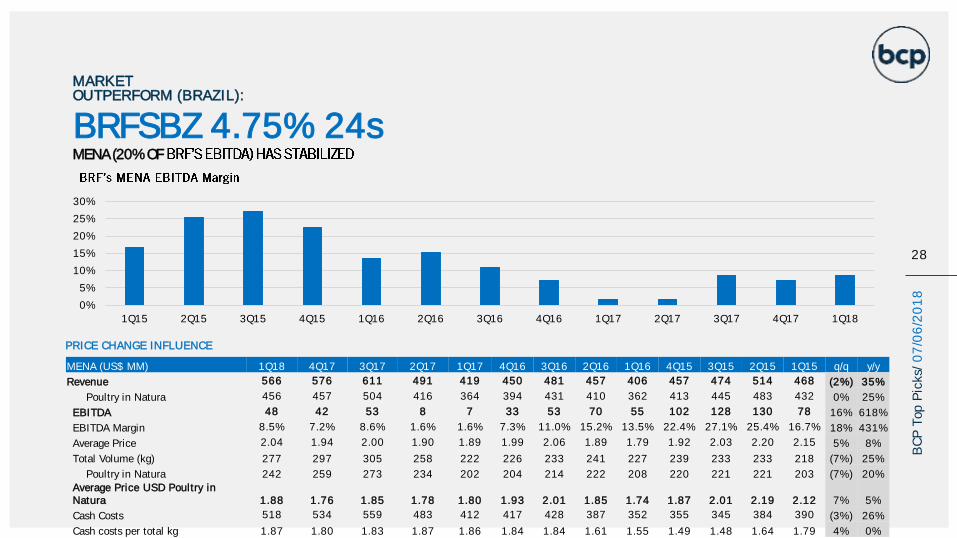
PRICE CHANGE INFLUENCE
MENA (US$ MM) 1Q18 4Q17 3Q17 2Q17 1Q17 4Q16 3Q16 2Q16 1Q16 4Q15 3Q15 2Q15 1Q15 q/q y/y
Revenue 566 576 611 491 419 450 481 457 406 457 474 514 468 (2%) 35%
Poultry in Natura 456 457 504 416 364 394 431 410 362 413 445 483 432 0% 25%
EBITDA 48 42 53 8 7 33 53 70 55 102 128 130 78 16% 618%
EBITDA Margin 8.5% 7.2% 8.6% 1.6% 1.6% 7.3% 11.0% 15.2% 13.5% 22.4% 27.1% 25.4% 16.7% 18% 431%
Average Price 2.04 1.94 2.00 1.90 1.89 1.99 2.06 1.89 1.79 1.92 2.03 2.20 2.15 5% 8%
Total Volume (kg) 277 297 305 258 222 226 233 241 227 239 233 233 218 (7%) 25%
Poultry in Natura 242 259 273 234 202 204 214 222 208 220 221 221 203 (7%) 20%
Average Price USD Poultry in Natura 1.88 1.76 1.85 1.78 1.80 1.93 2.01 1.85 1.74 1.87 2.01 2.19 2.12 7% 5%
Cash Costs 518 534 559 483 412 417 428 387 352 355 345 384 390 (3%) 26%
Cash costs per total kg 1.87 1.80 1.83 1.87 1.86 1.84 1.84 1.61 1.55 1.49 1.48 1.64 1.79 4% 0%
MENA (20% OF
MARKET OUTPERFORM (BRAZIL):
BRFSBZ 4.75% 24s
28
0%
5%
10%
15%
20%
25%
30%
1Q15 2Q15 3Q15 4Q15 1Q16 2Q16 3Q16 4Q16 1Q17 2Q17 3Q17 4Q17 1Q18
BC
P T
op P
icks/
07
/06
/20
18
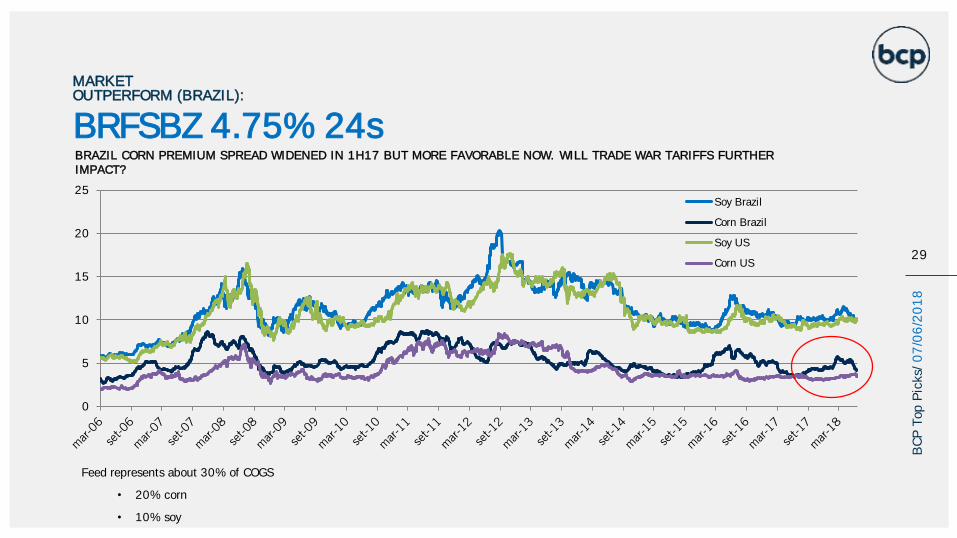
Feed represents about 30% of COGS
• 20% corn
• 10% soy
MARKET OUTPERFORM (BRAZIL):
BRFSBZ 4.75% 24s
29
BRAZIL CORN PREMIUM SPREAD WIDENED IN 1H17 BUT MORE FAVORABLE NOW. WILL TRADE WAR TARIFFS FURTHER IMPACT?
0
5
10
15
20
25Soy Brazil
Corn Brazil
Soy US
Corn US
BC
P T
op P
icks/
07
/06
/20
18
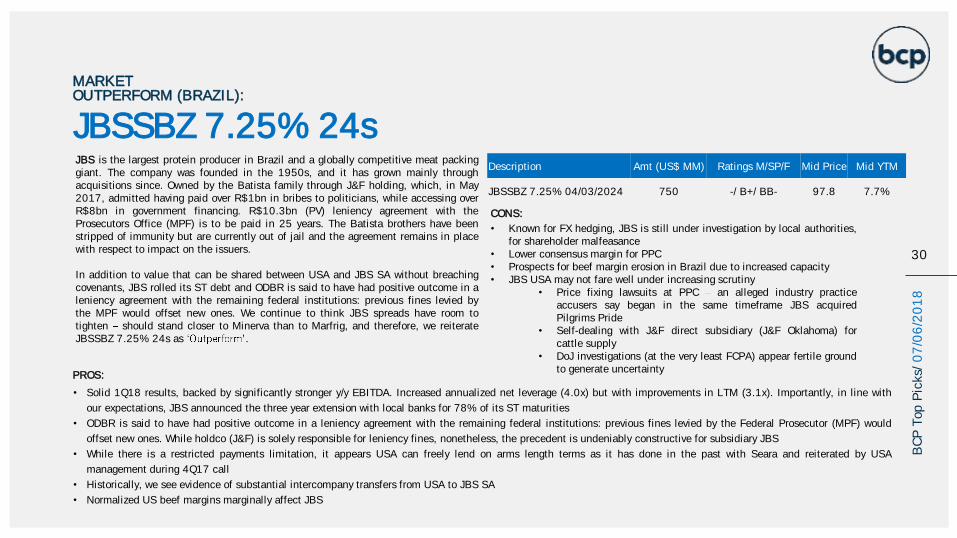
PROS:
• Solid 1Q18 results, backed by significantly stronger y/y EBITDA. Increased annualized net leverage (4.0x) but with improvements in LTM (3.1x). Importantly, in line with
our expectations, JBS announced the three year extension with local banks for 78% of its ST maturities
• ODBR is said to have had positive outcome in a leniency agreement with the remaining federal institutions: previous fines levied by the Federal Prosecutor (MPF) would
offset new ones. While holdco (J&F) is solely responsible for leniency fines, nonetheless, the precedent is undeniably constructive for subsidiary JBS
• While there is a restricted payments limitation, it appears USA can freely lend on arms length terms as it has done in the past with Seara and reiterated by USA
management during 4Q17 call
• Historically, we see evidence of substantial intercompany transfers from USA to JBS SA
• Normalized US beef margins marginally affect JBS
CONS:
• Known for FX hedging, JBS is still under investigation by local authorities,for shareholder malfeasance
• Lower consensus margin for PPC• Prospects for beef margin erosion in Brazil due to increased capacity• JBS USA may not fare well under increasing scrutiny
• Price fixing lawsuits at PPC an alleged industry practiceaccusers say began in the same timeframe JBS acquiredPilgrims Pride
• Self-dealing with J&F direct subsidiary (J&F Oklahoma) forcattle supply
• DoJ investigations (at the very least FCPA) appear fertile groundto generate uncertainty
MARKET OUTPERFORM (BRAZIL):
JBSSBZ 7.25% 24s
30
BC
P T
op P
icks/
07
/06
/20
18
Description Amt (US$ MM) Ratings M/SP/F Mid Price Mid YTM
JBSSBZ 7.25% 04/03/2024 750 -/ B+/ BB- 97.8 7.7%
JBS is the largest protein producer in Brazil and a globally competitive meat packinggiant. The company was founded in the 1950s, and it has grown mainly throughacquisitions since. Owned by the Batista family through J&F holding, which, in May2017, admitted having paid over R$1bn in bribes to politicians, while accessing overR$8bn in government financing. R$10.3bn (PV) leniency agreement with theProsecutors Office (MPF) is to be paid in 25 years. The Batista brothers have beenstripped of immunity but are currently out of jail and the agreement remains in placewith respect to impact on the issuers.
In addition to value that can be shared between USA and JBS SA without breachingcovenants, JBS rolled its ST debt and ODBR is said to have had positive outcome in aleniency agreement with the remaining federal institutions: previous fines levied bythe MPF would offset new ones. We continue to think JBS spreads have room totighten should stand closer to Minerva than to Marfrig, and therefore, we reiterateJBSSBZ 7.25% 24s as .
MARKET OUTPERFORM (BRAZIL):
JBSSBZ 7.25% 24s
31
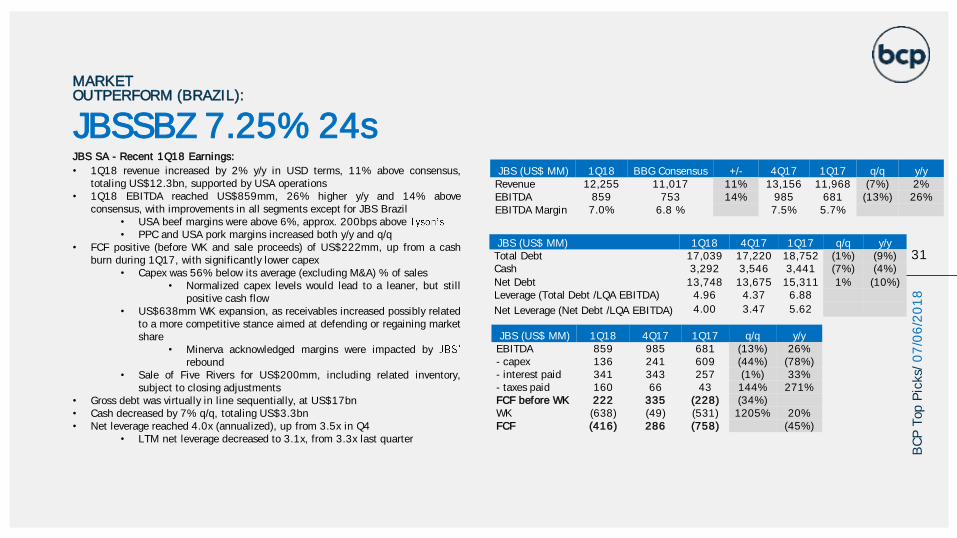
JBS SA - Recent 1Q18 Earnings:
• 1Q18 revenue increased by 2% y/y in USD terms, 11% above consensus,totaling US$12.3bn, supported by USA operations
• 1Q18 EBITDA reached US$859mm, 26% higher y/y and 14% aboveconsensus, with improvements in all segments except for JBS Brazil
• USA beef margins were above 6%, approx. 200bps above• PPC and USA pork margins increased both y/y and q/q
• FCF positive (before WK and sale proceeds) of US$222mm, up from a cashburn during 1Q17, with significantly lower capex
• Capex was 56% below its average (excluding M&A) % of sales• Normalized capex levels would lead to a leaner, but still
positive cash flow• US$638mm WK expansion, as receivables increased possibly related
to a more competitive stance aimed at defending or regaining marketshare
• Minerva acknowledged margins were impacted byrebound
• Sale of Five Rivers for US$200mm, including related inventory,subject to closing adjustments
• Gross debt was virtually in line sequentially, at US$17bn• Cash decreased by 7% q/q, totaling US$3.3bn• Net leverage reached 4.0x (annualized), up from 3.5x in Q4
• LTM net leverage decreased to 3.1x, from 3.3x last quarter
JBS (US$ MM) 1Q18 BBG Consensus +/- 4Q17 1Q17 q/q y/yRevenue 12,255 11,017 11% 13,156 11,968 (7%) 2%EBITDA 859 753 14% 985 681 (13%) 26%EBITDA Margin 7.0% 6.8 % 7.5% 5.7%
JBS (US$ MM) 1Q18 4Q17 1Q17 q/q y/yTotal Debt 17,039 17,220 18,752 (1%) (9%)Cash 3,292 3,546 3,441 (7%) (4%)
Net Debt 13,748 13,675 15,311 1% (10%)Leverage (Total Debt /LQA EBITDA) 4.96 4.37 6.88
Net Leverage (Net Debt /LQA EBITDA) 4.00 3.47 5.62
JBS (US$ MM) 1Q18 4Q17 1Q17 q/q y/yEBITDA 859 985 681 (13%) 26%- capex 136 241 609 (44%) (78%)- interest paid 341 343 257 (1%) 33%- taxes paid 160 66 43 144% 271%FCF before WK 222 335 (228) (34%)WK (638) (49) (531) 1205% 20%FCF (416) 286 (758) (45%)
BC
P T
op P
icks/
07
/06
/20
18
MARKET OUTPERFORM (BRAZIL):
JBSSBZ 7.25% 24s
32
BC
P T
op P
icks/
07
/06
/20
18
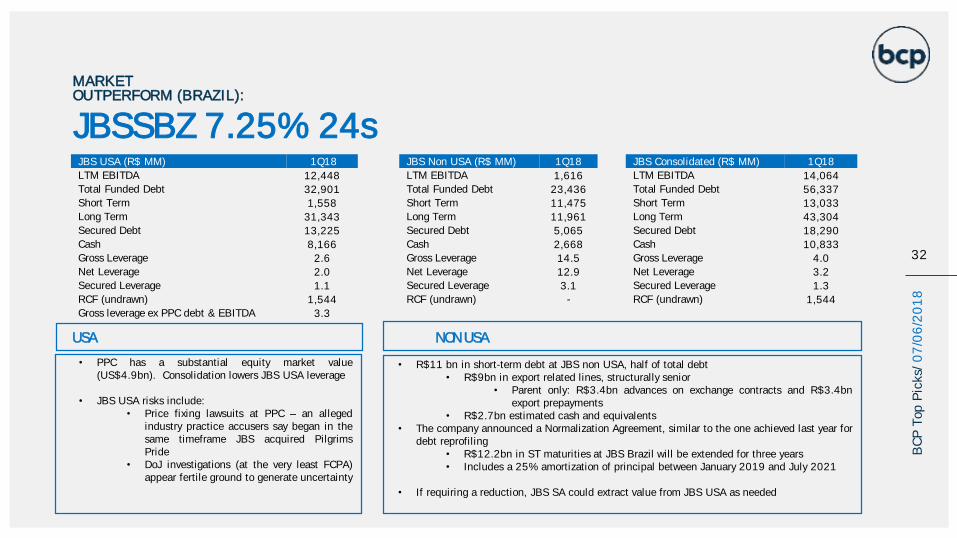
JBS USA (R$ MM) 1Q18 JBS Non USA (R$ MM) 1Q18 JBS Consolidated (R$ MM) 1Q18
LTM EBITDA 12,448 LTM EBITDA 1,616 LTM EBITDA 14,064
Total Funded Debt 32,901 Total Funded Debt 23,436 Total Funded Debt 56,337
Short Term 1,558 Short Term 11,475 Short Term 13,033
Long Term 31,343 Long Term 11,961 Long Term 43,304
Secured Debt 13,225 Secured Debt 5,065 Secured Debt 18,290
Cash 8,166 Cash 2,668 Cash 10,833
Gross Leverage 2.6 Gross Leverage 14.5 Gross Leverage 4.0
Net Leverage 2.0 Net Leverage 12.9 Net Leverage 3.2
Secured Leverage 1.1 Secured Leverage 3.1 Secured Leverage 1.3
RCF (undrawn) 1,544 RCF (undrawn) - RCF (undrawn) 1,544
Gross leverage ex PPC debt & EBITDA 3.3
USA NON USA
• R$11 bn in short-term debt at JBS non USA, half of total debt• R$9bn in export related lines, structurally senior
• Parent only: R$3.4bn advances on exchange contracts and R$3.4bnexport prepayments
• R$2.7bn estimated cash and equivalents• The company announced a Normalization Agreement, similar to the one achieved last year for
debt reprofiling• R$12.2bn in ST maturities at JBS Brazil will be extended for three years• Includes a 25% amortization of principal between January 2019 and July 2021
• If requiring a reduction, JBS SA could extract value from JBS USA as needed
• PPC has a substantial equity market value(US$4.9bn). Consolidation lowers JBS USA leverage
• JBS USA risks include:• Price fixing lawsuits at PPC an alleged
industry practice accusers say began in thesame timeframe JBS acquired PilgrimsPride
• DoJ investigations (at the very least FCPA)appear fertile ground to generate uncertainty
MARKET OUTPERFORM (BRAZIL):
JBSSBZ 7.25% 24s
33
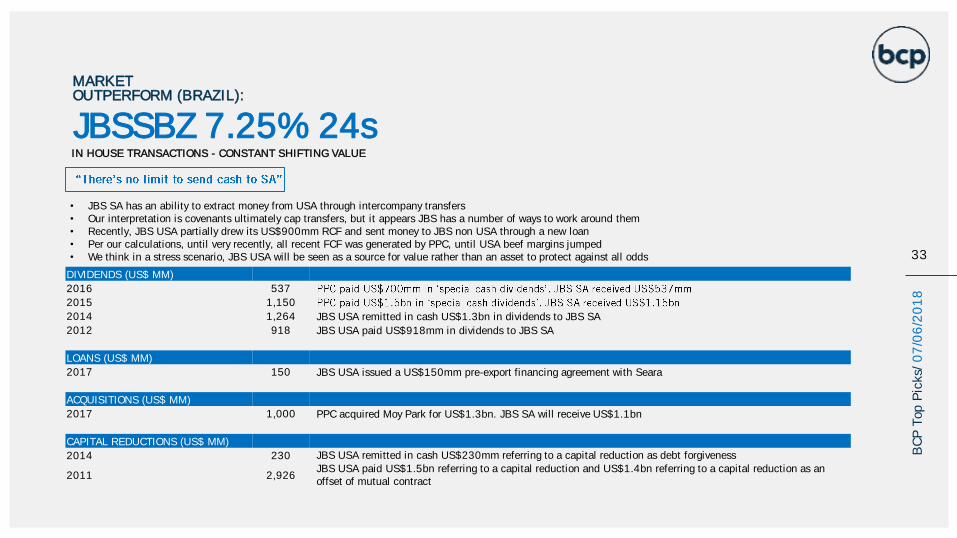
DIVIDENDS (US$ MM)
2016 537
2015 1,150
2014 1,264 JBS USA remitted in cash US$1.3bn in dividends to JBS SA
2012 918 JBS USA paid US$918mm in dividends to JBS SA
LOANS (US$ MM)
2017 150 JBS USA issued a US$150mm pre-export financing agreement with Seara
ACQUISITIONS (US$ MM)
2017 1,000 PPC acquired Moy Park for US$1.3bn. JBS SA will receive US$1.1bn
CAPITAL REDUCTIONS (US$ MM)
2014 230 JBS USA remitted in cash US$230mm referring to a capital reduction as debt forgiveness
2011 2,926JBS USA paid US$1.5bn referring to a capital reduction and US$1.4bn referring to a capital reduction as an offset of mutual contract
• JBS SA has an ability to extract money from USA through intercompany transfers• Our interpretation is covenants ultimately cap transfers, but it appears JBS has a number of ways to work around them• Recently, JBS USA partially drew its US$900mm RCF and sent money to JBS non USA through a new loan• Per our calculations, until very recently, all recent FCF was generated by PPC, until USA beef margins jumped• We think in a stress scenario, JBS USA will be seen as a source for value rather than an asset to protect against all odds
IN HOUSE TRANSACTIONS - CONSTANT SHIFTING VALUE
BC
P T
op P
icks/
07
/06
/20
18
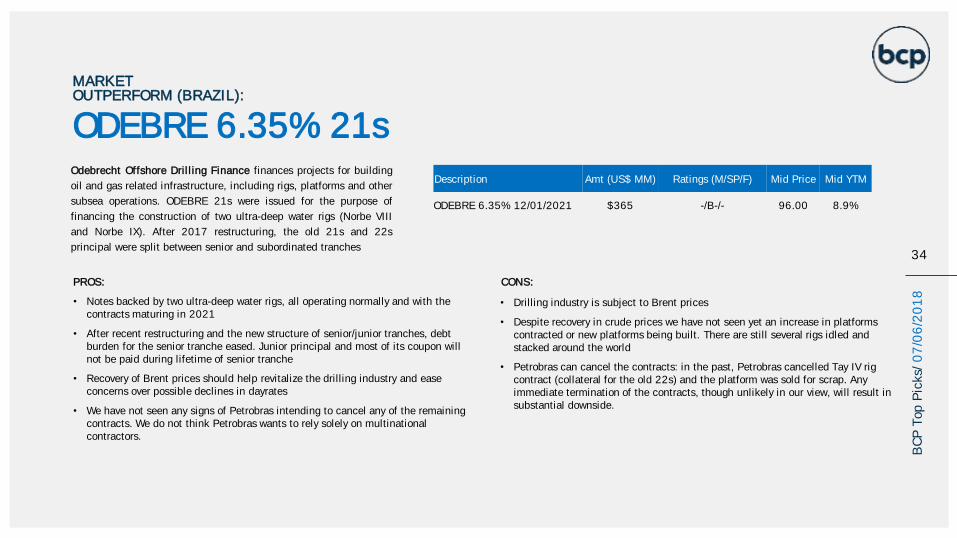
ODEBRE 6.35% 21sOdebrecht Offshore Drilling Finance finances projects for building
oil and gas related infrastructure, including rigs, platforms and other
subsea operations. ODEBRE 21s were issued for the purpose of
financing the construction of two ultra-deep water rigs (Norbe VIII
and Norbe IX). After 2017 restructuring, the old 21s and 22s
principal were split between senior and subordinated tranches
PROS:
• Notes backed by two ultra-deep water rigs, all operating normally and with the contracts maturing in 2021
• After recent restructuring and the new structure of senior/junior tranches, debt burden for the senior tranche eased. Junior principal and most of its coupon will not be paid during lifetime of senior tranche
• Recovery of Brent prices should help revitalize the drilling industry and ease concerns over possible declines in dayrates
• We have not seen any signs of Petrobras intending to cancel any of the remaining contracts. We do not think Petrobras wants to rely solely on multinational contractors.
CONS:
• Drilling industry is subject to Brent prices
• Despite recovery in crude prices we have not seen yet an increase in platforms contracted or new platforms being built. There are still several rigs idled and stacked around the world
• Petrobras can cancel the contracts: in the past, Petrobras cancelled Tay IV rig contract (collateral for the old 22s) and the platform was sold for scrap. Any immediate termination of the contracts, though unlikely in our view, will result in substantial downside.
MARKET OUTPERFORM (BRAZIL):
34
Description Amt (US$ MM) Ratings (M/SP/F) Mid Price Mid YTM
ODEBRE 6.35% 12/01/2021 $365 -/B-/- 96.00 8.9%
BC
P T
op P
icks/
07
/06
/20
18
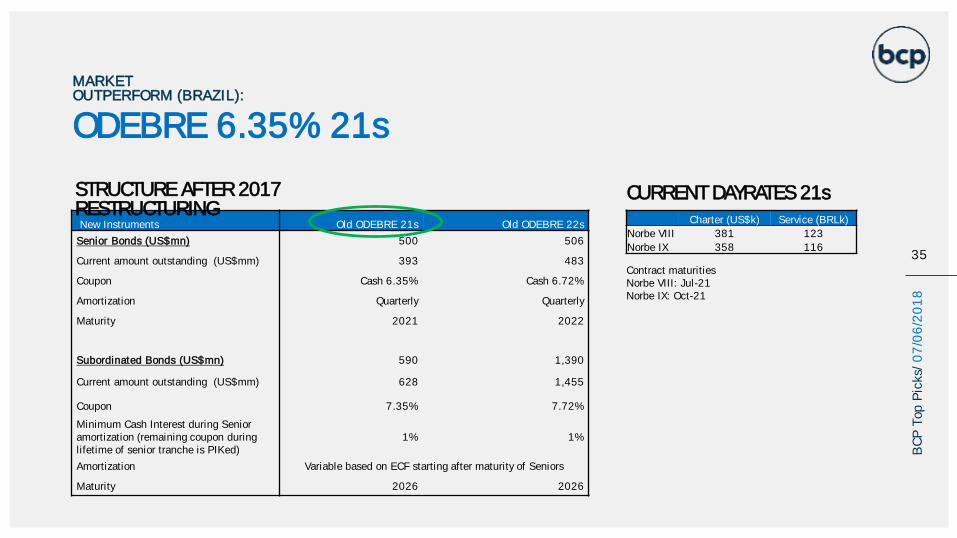
New Instruments Old ODEBRE 21s Old ODEBRE 22s
Senior Bonds (US$mn) 500 506
Current amount outstanding (US$mm) 393 483
Coupon Cash 6.35% Cash 6.72%
Amortization Quarterly Quarterly
Maturity 2021 2022
Subordinated Bonds (US$mn) 590 1,390
Current amount outstanding (US$mm) 628 1,455
Coupon 7.35% 7.72%
Minimum Cash Interest during Senior amortization (remaining coupon during lifetime of senior tranche is PIKed)
1% 1%
Amortization Variable based on ECF starting after maturity of Seniors
Maturity 2026 2026
MARKET OUTPERFORM (BRAZIL):
35
STRUCTURE AFTER 2017 RESTRUCTURING
ODEBRE 6.35% 21s
Charter (US$k) Service (BRLk)
Norbe VIII 381 123
Norbe IX 358 116
CURRENT DAYRATES 21s
Contract maturitiesNorbe VIII: Jul-21Norbe IX: Oct-21
BC
P T
op P
icks/
07
/06
/20
18
MARKET OUTPERFORM (BRAZIL):
36
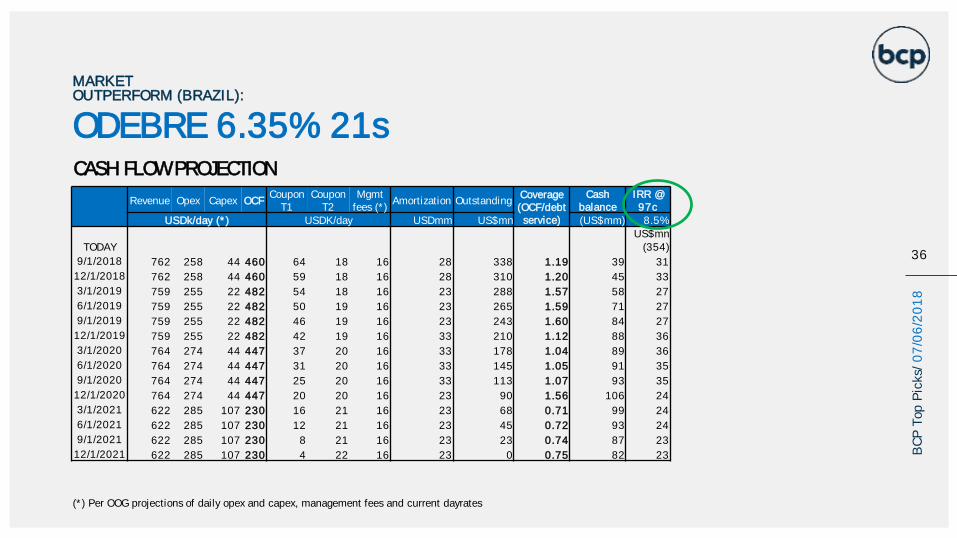
Revenue Opex Capex OCFCoupon
T1Coupon
T2Mgmt
fees (*)Amortization Outstanding
Coverage (OCF/debt service)
Cash balance
IRR @ 97c
USDk/day (*) USDK/day USDmm US$mn (US$mm) 8.5%US$mn
TODAY (354)
9/1/2018 762 258 44 460 64 18 16 28 338 1.19 39 31
12/1/2018 762 258 44 460 59 18 16 28 310 1.20 45 33
3/1/2019 759 255 22 482 54 18 16 23 288 1.57 58 27
6/1/2019 759 255 22 482 50 19 16 23 265 1.59 71 27
9/1/2019 759 255 22 482 46 19 16 23 243 1.60 84 27
12/1/2019 759 255 22 482 42 19 16 33 210 1.12 88 36
3/1/2020 764 274 44 447 37 20 16 33 178 1.04 89 36
6/1/2020 764 274 44 447 31 20 16 33 145 1.05 91 35
9/1/2020 764 274 44 447 25 20 16 33 113 1.07 93 35
12/1/2020 764 274 44 447 20 20 16 23 90 1.56 106 24
3/1/2021 622 285 107 230 16 21 16 23 68 0.71 99 24
6/1/2021 622 285 107 230 12 21 16 23 45 0.72 93 24
9/1/2021 622 285 107 230 8 21 16 23 23 0.74 87 23
12/1/2021 622 285 107 230 4 22 16 23 0 0.75 82 23
ODEBRE 6.35% 21s
(*) Per OOG projections of daily opex and capex, management fees and current dayrates
CASH FLOW PROJECTION
BC
P T
op P
icks/
07
/06
/20
18
CHINA
37
BC
P T
op P
icks/
07
/06
/20
18
38
BC
P T
op P
icks/
07
/06
/20
18
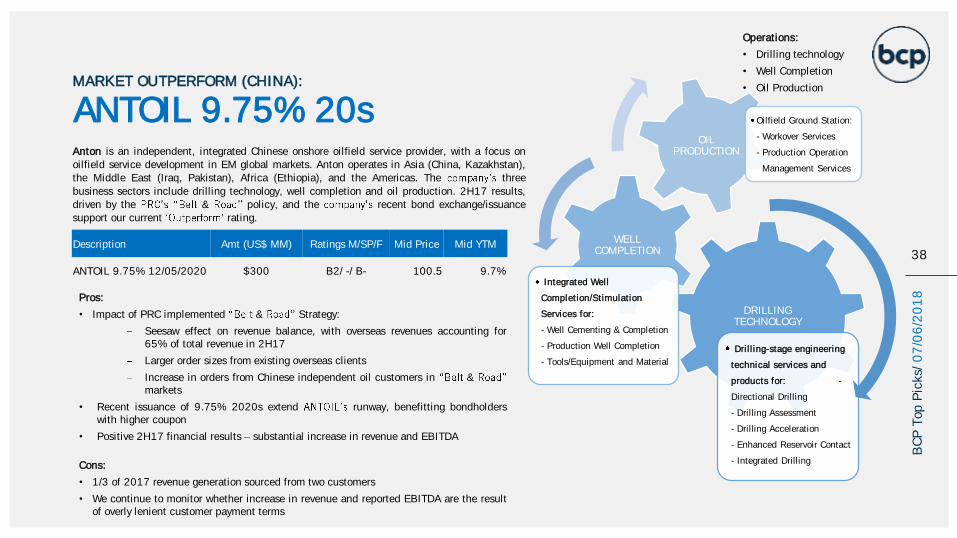
Operations:
• Drilling technology
• Well Completion
• Oil Production
Anton is an independent, integrated Chinese onshore oilfield service provider, with a focus onoilfield service development in EM global markets. Anton operates in Asia (China, Kazakhstan),the Middle East (Iraq, Pakistan), Africa (Ethiopia), and the Americas. The three
business sectors include drilling technology, well completion and oil production. 2H17 results,driven by the & policy, and the recent bond exchange/issuancesupport our current rating.
DRILLING TECHNOLOGY
Drilling-stage engineering
technical services and
products for: -
Directional Drilling
- Drilling Assessment
- Drilling Acceleration
- Enhanced Reservoir Contact
- Integrated Drilling
WELL COMPLETION
Integrated Well
Completion/Stimulation
Services for:
- Well Cementing & Completion
- Production Well Completion
- Tools/Equipment and Material
OIL PRODUCTION
Oilfield Ground Station:
- Workover Services
- Production Operation
Management Services
ANTOIL 9.75% 20sMARKET OUTPERFORM (CHINA):
Description Amt (US$ MM) Ratings M/SP/F Mid Price Mid YTM
ANTOIL 9.75% 12/05/2020 $300 B2/ -/ B- 100.5 9.7%
Pros:
• Impact of PRC implemented & Strategy:
Seesaw effect on revenue balance, with overseas revenues accounting for65% of total revenue in 2H17
Larger order sizes from existing overseas clients
Increase in orders from Chinese independent oil customers in &markets
• Recent issuance of 9.75% 2020s extend runway, benefitting bondholderswith higher coupon
• Positive 2H17 financial results substantial increase in revenue and EBITDA
Cons:
• 1/3 of 2017 revenue generation sourced from two customers
• We continue to monitor whether increase in revenue and reported EBITDA are the resultof overly lenient customer payment terms
39
BC
P T
op P
icks/
07
/06
/20
18
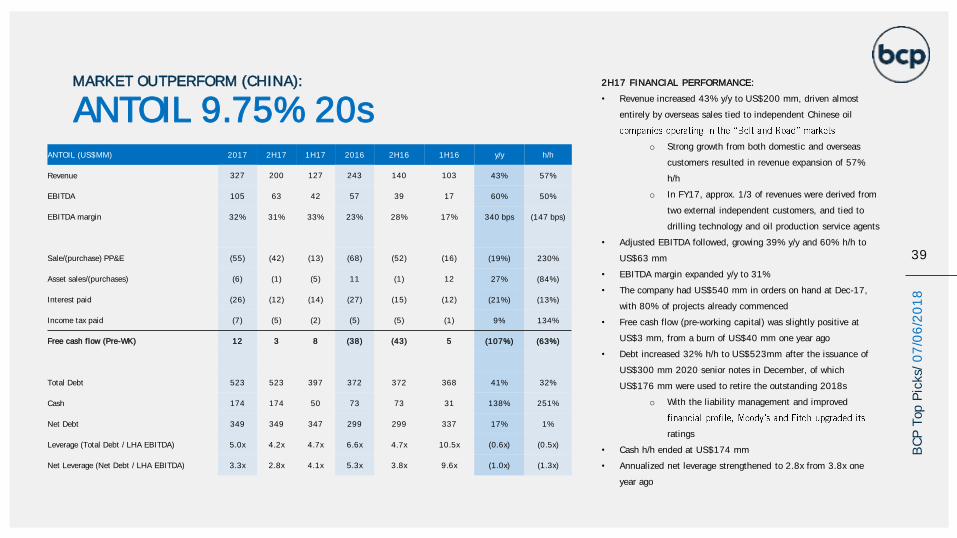
ANTOIL 9.75% 20sMARKET OUTPERFORM (CHINA): 2H17 FINANCIAL PERFORMANCE:
• Revenue increased 43% y/y to US$200 mm, driven almost
entirely by overseas sales tied to independent Chinese oil
o Strong growth from both domestic and overseas
customers resulted in revenue expansion of 57%
h/h
o In FY17, approx. 1/3 of revenues were derived from
two external independent customers, and tied to
drilling technology and oil production service agents
• Adjusted EBITDA followed, growing 39% y/y and 60% h/h to
US$63 mm
• EBITDA margin expanded y/y to 31%
• The company had US$540 mm in orders on hand at Dec-17,
with 80% of projects already commenced
• Free cash flow (pre-working capital) was slightly positive at
US$3 mm, from a burn of US$40 mm one year ago
• Debt increased 32% h/h to US$523mm after the issuance of
US$300 mm 2020 senior notes in December, of which
US$176 mm were used to retire the outstanding 2018s
o With the liability management and improved
ratings
• Cash h/h ended at US$174 mm
• Annualized net leverage strengthened to 2.8x from 3.8x one
year ago
ANTOIL (US$MM) 2017 2H17 1H17 2016 2H16 1H16 y/y h/h
Revenue 327 200 127 243 140 103 43% 57%
EBITDA 105 63 42 57 39 17 60% 50%
EBITDA margin 32% 31% 33% 23% 28% 17% 340 bps (147 bps)
Sale/(purchase) PP&E (55) (42) (13) (68) (52) (16) (19%) 230%
Asset sales/(purchases) (6) (1) (5) 11 (1) 12 27% (84%)
Interest paid (26) (12) (14) (27) (15) (12) (21%) (13%)
Income tax paid (7) (5) (2) (5) (5) (1) 9% 134%
Free cash flow (Pre-WK) 12 3 8 (38) (43) 5 (107%) (63%)
Total Debt 523 523 397 372 372 368 41% 32%
Cash 174 174 50 73 73 31 138% 251%
Net Debt 349 349 347 299 299 337 17% 1%
Leverage (Total Debt / LHA EBITDA) 5.0x 4.2x 4.7x 6.6x 4.7x 10.5x (0.6x) (0.5x)
Net Leverage (Net Debt / LHA EBITDA) 3.3x 2.8x 4.1x 5.3x 3.8x 9.6x (1.0x) (1.3x)
40
BC
P T
op P
icks/
07
/06
/20
18
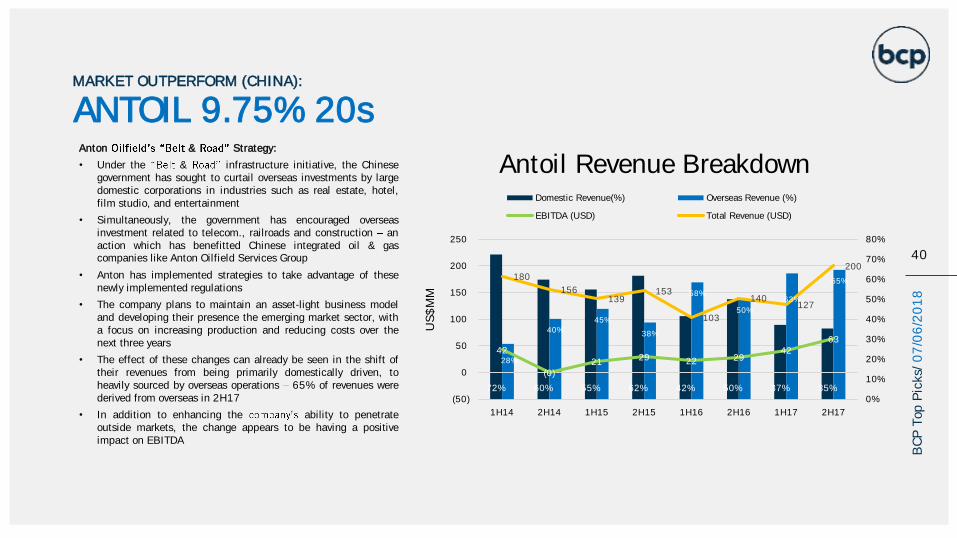
ANTOIL 9.75% 20sMARKET OUTPERFORM (CHINA):
Anton & Strategy:
• Under the & infrastructure initiative, the Chinesegovernment has sought to curtail overseas investments by largedomestic corporations in industries such as real estate, hotel,film studio, and entertainment
• Simultaneously, the government has encouraged overseasinvestment related to telecom., railroads and construction anaction which has benefitted Chinese integrated oil & gascompanies like Anton Oilfield Services Group
• Anton has implemented strategies to take advantage of thesenewly implemented regulations
• The company plans to maintain an asset-light business modeland developing their presence the emerging market sector, witha focus on increasing production and reducing costs over thenext three years
• The effect of these changes can already be seen in the shift oftheir revenues from being primarily domestically driven, toheavily sourced by overseas operations 65% of revenues werederived from overseas in 2H17
• In addition to enhancing the ability to penetrateoutside markets, the change appears to be having a positiveimpact on EBITDA
72% 60% 55% 62% 42% 50% 37% 35%
28%
40%45%
38%
58%
50%
63%
65%
42
(0)21 29 22 29
42 63
180
156 139
153
103
140 127
200
0%
10%
20%
30%
40%
50%
60%
70%
80%
(50)
0
50
100
150
200
250
1H14 2H14 1H15 2H15 1H16 2H16 1H17 2H17
US
$M
M
Antoil Revenue BreakdownDomestic Revenue(%) Overseas Revenue (%)
EBITDA (USD) Total Revenue (USD)
COLOMBIA
41
BC
P T
op P
icks/
07
/06
/20
18
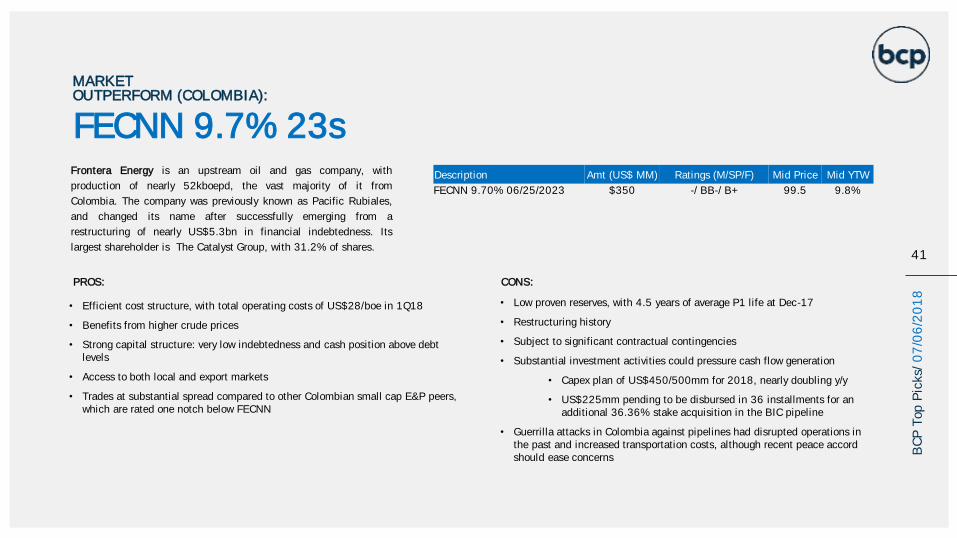
Frontera Energy is an upstream oil and gas company, with
production of nearly 52kboepd, the vast majority of it from
Colombia. The company was previously known as Pacific Rubiales,
and changed its name after successfully emerging from a
restructuring of nearly US$5.3bn in financial indebtedness. Its
largest shareholder is The Catalyst Group, with 31.2% of shares.
PROS:
• Efficient cost structure, with total operating costs of US$28/boe in 1Q18
• Benefits from higher crude prices
• Strong capital structure: very low indebtedness and cash position above debt levels
• Access to both local and export markets
• Trades at substantial spread compared to other Colombian small cap E&P peers, which are rated one notch below FECNN
CONS:
• Low proven reserves, with 4.5 years of average P1 life at Dec-17
• Restructuring history
• Subject to significant contractual contingencies
• Substantial investment activities could pressure cash flow generation
• Capex plan of US$450/500mm for 2018, nearly doubling y/y
• US$225mm pending to be disbursed in 36 installments for an additional 36.36% stake acquisition in the BIC pipeline
• Guerrilla attacks in Colombia against pipelines had disrupted operations in the past and increased transportation costs, although recent peace accord should ease concerns
Description Amt (US$ MM) Ratings (M/SP/F) Mid Price Mid YTW
FECNN 9.70% 06/25/2023 $350 -/ BB-/ B+ 99.5 9.8%
FECNN 9.7% 23s
MARKET OUTPERFORM (COLOMBIA):
41
BC
P T
op P
icks/
07
/06
/20
18
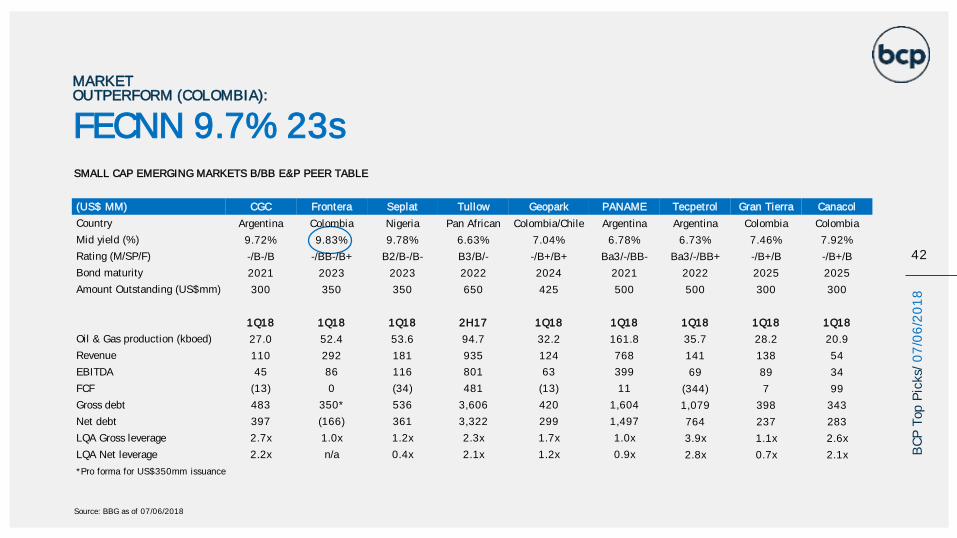
MARKET OUTPERFORM (COLOMBIA):
SMALL CAP EMERGING MARKETS B/BB E&P PEER TABLE
FECNN 9.7% 23s
42
BC
P T
op P
icks/
07
/06
/20
18
(US$ MM) CGC Frontera Seplat Tullow Geopark PANAME Tecpetrol Gran Tierra Canacol
Country Argentina Colombia Nigeria Pan African Colombia/Chile Argentina Argentina Colombia Colombia
Mid yield (%) 9.72% 9.83% 9.78% 6.63% 7.04% 6.78% 6.73% 7.46% 7.92%
Rating (M/SP/F) -/B-/B -/BB-/B+ B2/B-/B- B3/B/- -/B+/B+ Ba3/-/BB- Ba3/-/BB+ -/B+/B -/B+/B
Bond maturity 2021 2023 2023 2022 2024 2021 2022 2025 2025
Amount Outstanding (US$mm) 300 350 350 650 425 500 500 300 300
1Q18 1Q18 1Q18 2H17 1Q18 1Q18 1Q18 1Q18 1Q18
Oil & Gas production (kboed) 27.0 52.4 53.6 94.7 32.2 161.8 35.7 28.2 20.9
Revenue 110 292 181 935 124 768 141 138 54
EBITDA 45 86 116 801 63 399 69 89 34
FCF (13) 0 (34) 481 (13) 11 (344) 7 99
Gross debt 483 350* 536 3,606 420 1,604 1,079 398 343
Net debt 397 (166) 361 3,322 299 1,497 764 237 283
LQA Gross leverage 2.7x 1.0x 1.2x 2.3x 1.7x 1.0x 3.9x 1.1x 2.6x
LQA Net leverage 2.2x n/a 0.4x 2.1x 1.2x 0.9x 2.8x 0.7x 2.1x
*Pro forma for US$350mm issuance
Source: BBG as of 07/06/2018
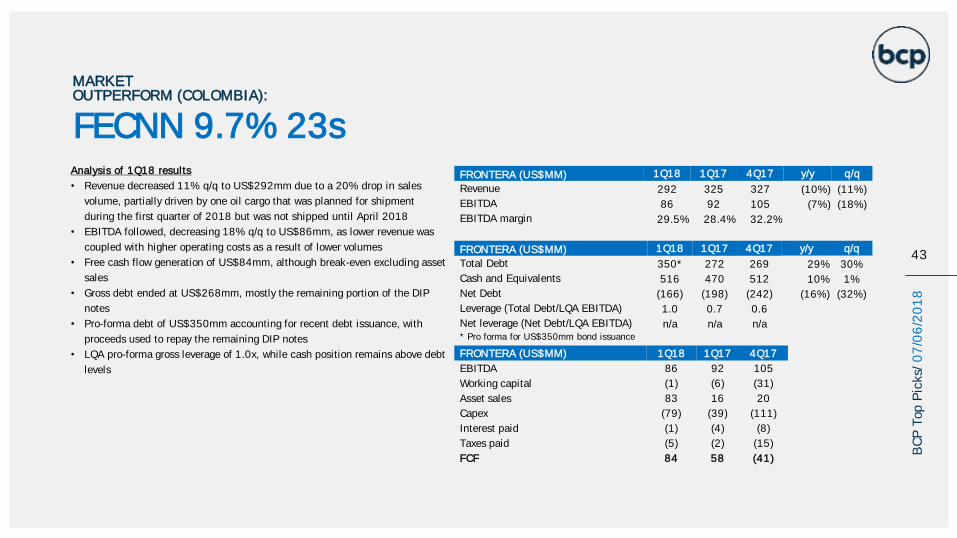
Analysis of 1Q18 results
• Revenue decreased 11% q/q to US$292mm due to a 20% drop in sales
volume, partially driven by one oil cargo that was planned for shipment
during the first quarter of 2018 but was not shipped until April 2018
• EBITDA followed, decreasing 18% q/q to US$86mm, as lower revenue was
coupled with higher operating costs as a result of lower volumes
• Free cash flow generation of US$84mm, although break-even excluding asset
sales
• Gross debt ended at US$268mm, mostly the remaining portion of the DIP
notes
• Pro-forma debt of US$350mm accounting for recent debt issuance, with
proceeds used to repay the remaining DIP notes
• LQA pro-forma gross leverage of 1.0x, while cash position remains above debt
levels
FRONTERA (US$MM) 1Q18 1Q17 4Q17 y/y q/q
Revenue 292 325 327 (10%) (11%)
EBITDA 86 92 105 (7%) (18%)
EBITDA margin 29.5% 28.4% 32.2%
FRONTERA (US$MM) 1Q18 1Q17 4Q17 y/y q/q
Total Debt 350* 272 269 29% 30%
Cash and Equivalents 516 470 512 10% 1%
Net Debt (166) (198) (242) (16%) (32%)
Leverage (Total Debt/LQA EBITDA) 1.0 0.7 0.6
Net leverage (Net Debt/LQA EBITDA) n/a n/a n/a* Pro forma for US$350mm bond issuance
FRONTERA (US$MM) 1Q18 1Q17 4Q17
EBITDA 86 92 105
Working capital (1) (6) (31)
Asset sales 83 16 20
Capex (79) (39) (111)
Interest paid (1) (4) (8)
Taxes paid (5) (2) (15)
FCF 84 58 (41)
MARKET OUTPERFORM (COLOMBIA):
FECNN 9.7% 23s
43
BC
P T
op P
icks/
07
/06
/20
18
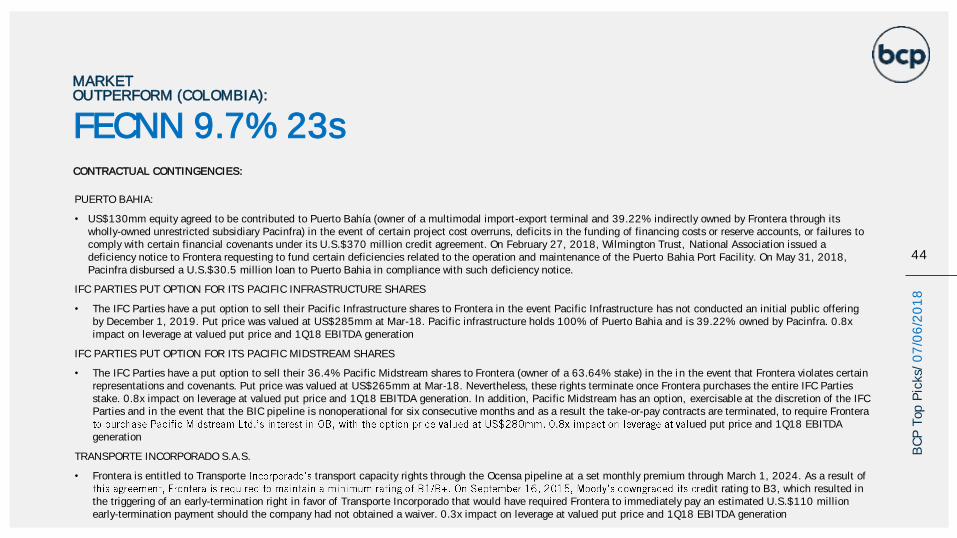
CONTRACTUAL CONTINGENCIES:
PUERTO BAHIA:
• US$130mm equity agreed to be contributed to Puerto Bahía (owner of a multimodal import-export terminal and 39.22% indirectly owned by Frontera through its wholly-owned unrestricted subsidiary Pacinfra) in the event of certain project cost overruns, deficits in the funding of financing costs or reserve accounts, or failures to comply with certain financial covenants under its U.S.$370 million credit agreement. On February 27, 2018, Wilmington Trust, National Association issued a deficiency notice to Frontera requesting to fund certain deficiencies related to the operation and maintenance of the Puerto Bahia Port Facility. On May 31, 2018, Pacinfra disbursed a U.S.$30.5 million loan to Puerto Bahia in compliance with such deficiency notice.
IFC PARTIES PUT OPTION FOR ITS PACIFIC INFRASTRUCTURE SHARES
• The IFC Parties have a put option to sell their Pacific Infrastructure shares to Frontera in the event Pacific Infrastructure has not conducted an initial public offering by December 1, 2019. Put price was valued at US$285mm at Mar-18. Pacific infrastructure holds 100% of Puerto Bahia and is 39.22% owned by Pacinfra. 0.8x impact on leverage at valued put price and 1Q18 EBITDA generation
IFC PARTIES PUT OPTION FOR ITS PACIFIC MIDSTREAM SHARES
• The IFC Parties have a put option to sell their 36.4% Pacific Midstream shares to Frontera (owner of a 63.64% stake) in the in the event that Frontera violates certain representations and covenants. Put price was valued at US$265mm at Mar-18. Nevertheless, these rights terminate once Frontera purchases the entire IFC Parties stake. 0.8x impact on leverage at valued put price and 1Q18 EBITDA generation. In addition, Pacific Midstream has an option, exercisable at the discretion of the IFC Parties and in the event that the BIC pipeline is nonoperational for six consecutive months and as a result the take-or-pay contracts are terminated, to require Frontera
ued put price and 1Q18 EBITDA generation
TRANSPORTE INCORPORADO S.A.S.
• Frontera is entitled to Transporte transport capacity rights through the Ocensa pipeline at a set monthly premium through March 1, 2024. As a result of dit rating to B3, which resulted in
the triggering of an early-termination right in favor of Transporte Incorporado that would have required Frontera to immediately pay an estimated U.S.$110 million early-termination payment should the company had not obtained a waiver. 0.3x impact on leverage at valued put price and 1Q18 EBITDA generation
MARKET OUTPERFORM (COLOMBIA):
FECNN 9.7% 23s
44
BC
P T
op P
icks/
07
/06
/20
18
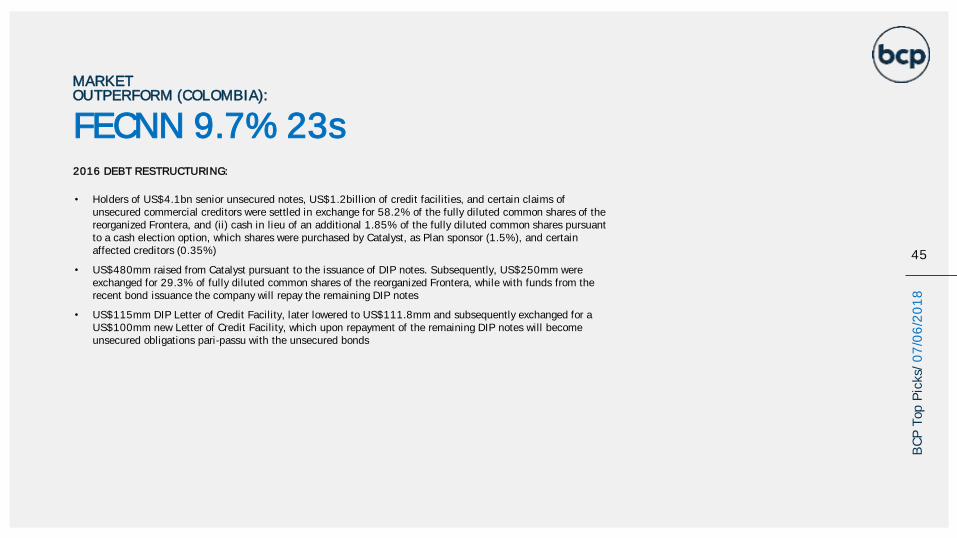
2016 DEBT RESTRUCTURING:
• Holders of US$4.1bn senior unsecured notes, US$1.2billion of credit facilities, and certain claims of unsecured commercial creditors were settled in exchange for 58.2% of the fully diluted common shares of the reorganized Frontera, and (ii) cash in lieu of an additional 1.85% of the fully diluted common shares pursuant to a cash election option, which shares were purchased by Catalyst, as Plan sponsor (1.5%), and certain affected creditors (0.35%)
• US$480mm raised from Catalyst pursuant to the issuance of DIP notes. Subsequently, US$250mm were exchanged for 29.3% of fully diluted common shares of the reorganized Frontera, while with funds from the recent bond issuance the company will repay the remaining DIP notes
• US$115mm DIP Letter of Credit Facility, later lowered to US$111.8mm and subsequently exchanged for a US$100mm new Letter of Credit Facility, which upon repayment of the remaining DIP notes will become unsecured obligations pari-passu with the unsecured bonds
MARKET OUTPERFORM (COLOMBIA):
FECNN 9.7% 23s
45
BC
P T
op P
icks/
07
/06
/20
18
ECUADOR
47
BC
P T
op P
icks/
07
/06
/20
18
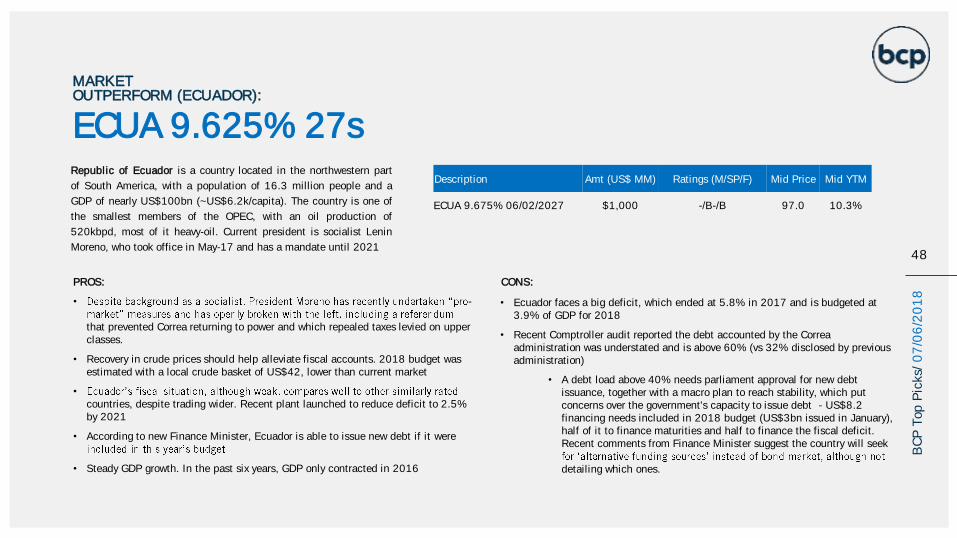
ECUA 9.625% 27sRepublic of Ecuador is a country located in the northwestern part
of South America, with a population of 16.3 million people and a
GDP of nearly US$100bn (~US$6.2k/capita). The country is one of
the smallest members of the OPEC, with an oil production of
520kbpd, most of it heavy-oil. Current president is socialist Lenin
Moreno, who took office in May-17 and has a mandate until 2021
PROS:
• -
that prevented Correa returning to power and which repealed taxes levied on upper classes.
• Recovery in crude prices should help alleviate fiscal accounts. 2018 budget was estimated with a local crude basket of US$42, lower than current market
•
countries, despite trading wider. Recent plant launched to reduce deficit to 2.5% by 2021
• According to new Finance Minister, Ecuador is able to issue new debt if it were
• Steady GDP growth. In the past six years, GDP only contracted in 2016
CONS:
• Ecuador faces a big deficit, which ended at 5.8% in 2017 and is budgeted at 3.9% of GDP for 2018
• Recent Comptroller audit reported the debt accounted by the Correa administration was understated and is above 60% (vs 32% disclosed by previous administration)
• A debt load above 40% needs parliament approval for new debt issuance, together with a macro plan to reach stability, which put concerns over the government's capacity to issue debt - US$8.2 financing needs included in 2018 budget (US$3bn issued in January), half of it to finance maturities and half to finance the fiscal deficit. Recent comments from Finance Minister suggest the country will seek
detailing which ones.
MARKET OUTPERFORM (ECUADOR):
48
BC
P T
op P
icks/
07
/06
/20
18
Description Amt (US$ MM) Ratings (M/SP/F) Mid Price Mid YTM
ECUA 9.675% 06/02/2027 $1,000 -/B-/B 97.0 10.3%
ECUA 9.625% 27s
MARKET OUTPERFORM (ECUADOR):
49
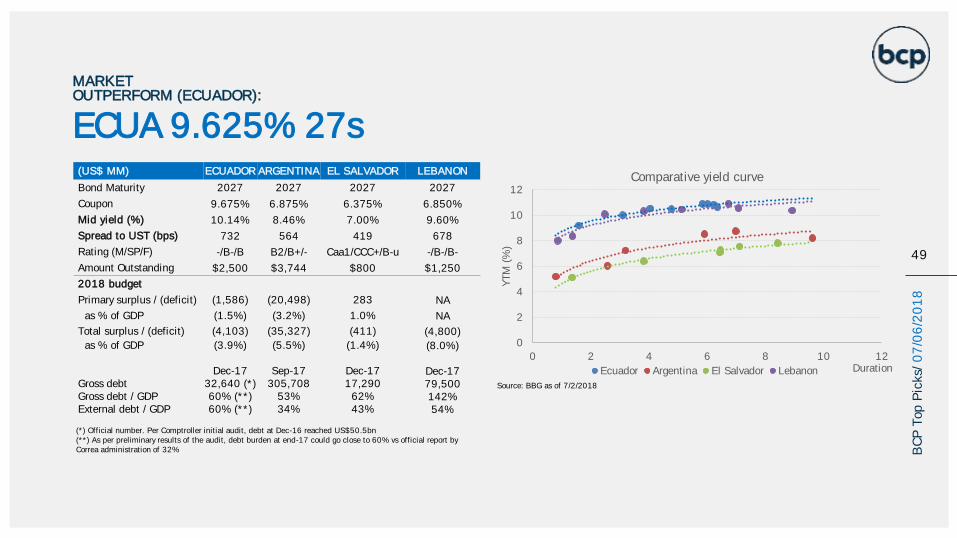
(US$ MM) ECUADOR ARGENTINA EL SALVADOR LEBANON
Bond Maturity 2027 2027 2027 2027
Coupon 9.675% 6.875% 6.375% 6.850%
Mid yield (%) 10.14% 8.46% 7.00% 9.60%
Spread to UST (bps) 732 564 419 678
Rating (M/SP/F) -/B-/B B2/B+/- Caa1/CCC+/B-u -/B-/B-
Amount Outstanding $2,500 $3,744 $800 $1,250
2018 budget
Primary surplus / (deficit) (1,586) (20,498) 283 NA
as % of GDP (1.5%) (3.2%) 1.0% NA
Total surplus / (deficit) (4,103) (35,327) (411) (4,800)
as % of GDP (3.9%) (5.5%) (1.4%) (8.0%)
Dec-17 Sep-17 Dec-17 Dec-17Gross debt 32,640 (*) 305,708 17,290 79,500Gross debt / GDP 60% (**) 53% 62% 142%External debt / GDP 60% (**) 34% 43% 54%
Source: BBG as of 7/2/2018
(*) Official number. Per Comptroller initial audit, debt at Dec-16 reached US$50.5bn(**) As per preliminary results of the audit, debt burden at end-17 could go close to 60% vs official report by Correa administration of 32% B
CP
Top P
icks/
07
/06
/20
18
0
2
4
6
8
10
12
0 2 4 6 8 10 12
YTM
(%
)
Duration
Comparative yield curve
Ecuador Argentina El Salvador Lebanon
ECUA 9.625% 27s
MARKET OUTPERFORM (ECUADOR):
50
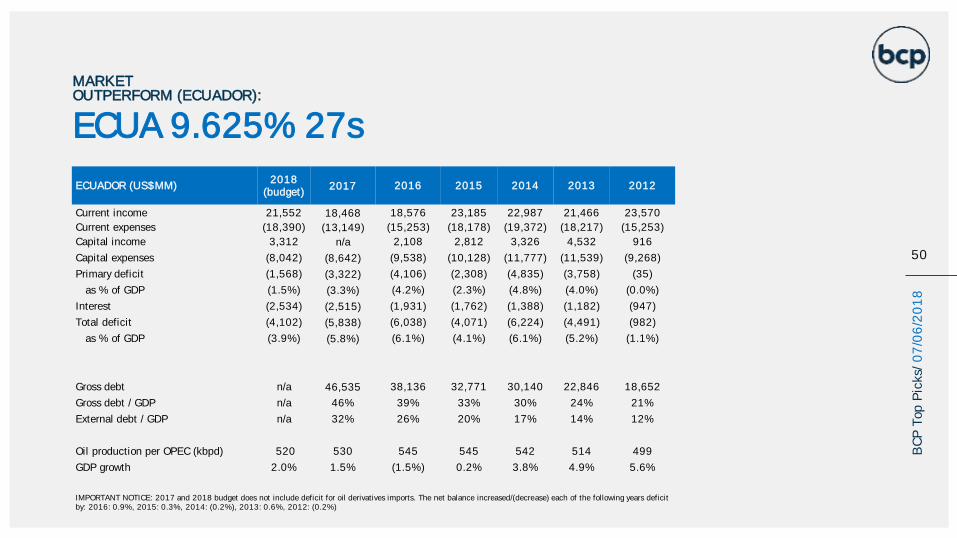
ECUADOR (US$MM)2018
(budget)2017 2016 2015 2014 2013 2012
Current income 21,552 18,468 18,576 23,185 22,987 21,466 23,570
Current expenses (18,390) (13,149) (15,253) (18,178) (19,372) (18,217) (15,253)
Capital income 3,312 n/a 2,108 2,812 3,326 4,532 916
Capital expenses (8,042) (8,642) (9,538) (10,128) (11,777) (11,539) (9,268)
Primary deficit (1,568) (3,322) (4,106) (2,308) (4,835) (3,758) (35)
as % of GDP (1.5%) (3.3%) (4.2%) (2.3%) (4.8%) (4.0%) (0.0%)
Interest (2,534) (2,515) (1,931) (1,762) (1,388) (1,182) (947)
Total deficit (4,102) (5,838) (6,038) (4,071) (6,224) (4,491) (982)
as % of GDP (3.9%) (5.8%) (6.1%) (4.1%) (6.1%) (5.2%) (1.1%)
Gross debt n/a 46,535 38,136 32,771 30,140 22,846 18,652
Gross debt / GDP n/a 46% 39% 33% 30% 24% 21%
External debt / GDP n/a 32% 26% 20% 17% 14% 12%
Oil production per OPEC (kbpd) 520 530 545 545 542 514 499
GDP growth 2.0% 1.5% (1.5%) 0.2% 3.8% 4.9% 5.6%
IMPORTANT NOTICE: 2017 and 2018 budget does not include deficit for oil derivatives imports. The net balance increased/(decrease) each of the following years deficit by: 2016: 0.9%, 2015: 0.3%, 2014: (0.2%), 2013: 0.6%, 2012: (0.2%)
BC
P T
op P
icks/
07
/06
/20
18
NIGERIA
51
BC
P T
op P
icks/
07
/06
/20
18
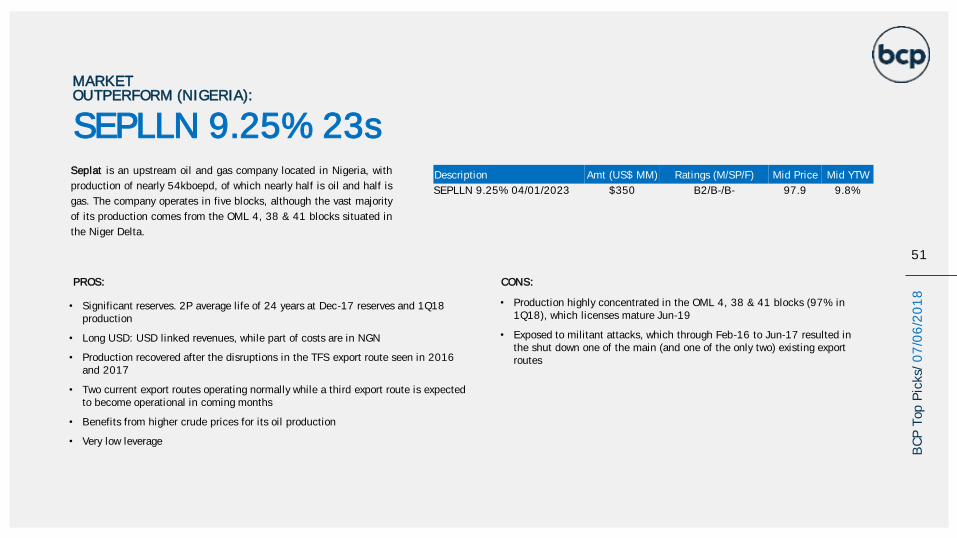
Seplat is an upstream oil and gas company located in Nigeria, with
production of nearly 54kboepd, of which nearly half is oil and half is
gas. The company operates in five blocks, although the vast majority
of its production comes from the OML 4, 38 & 41 blocks situated in
the Niger Delta.
PROS:
• Significant reserves. 2P average life of 24 years at Dec-17 reserves and 1Q18 production
• Long USD: USD linked revenues, while part of costs are in NGN
• Production recovered after the disruptions in the TFS export route seen in 2016 and 2017
• Two current export routes operating normally while a third export route is expected to become operational in coming months
• Benefits from higher crude prices for its oil production
• Very low leverage
CONS:
• Production highly concentrated in the OML 4, 38 & 41 blocks (97% in 1Q18), which licenses mature Jun-19
• Exposed to militant attacks, which through Feb-16 to Jun-17 resulted in the shut down one of the main (and one of the only two) existing export routes
Description Amt (US$ MM) Ratings (M/SP/F) Mid Price Mid YTW
SEPLLN 9.25% 04/01/2023 $350 B2/B-/B- 97.9 9.8%
SEPLLN 9.25% 23s
MARKET OUTPERFORM (NIGERIA):
51
BC
P T
op P
icks/
07
/06
/20
18

SMALL CAP EMERGING MARKETS B/BB E&P PEER TABLE
SEPLLN 9.25% 23s
MARKET OUTPERFORM (NIGERIA):
52
BC
P T
op P
icks/
07
/06
/20
18
(US$ MM) CGC Frontera Seplat Tullow Geopark PANAME Tecpetrol Gran Tierra Canacol
Country Argentina Colombia Nigeria Pan African Colombia/Chile Argentina Argentina Colombia Colombia
Mid yield (%) 9.72% 9.83% 9.78% 6.63% 7.04% 6.78% 6.73% 7.46% 7.92%
Rating (M/SP/F) -/B-/B -/BB-/B+ B2/B-/B- B3/B/- -/B+/B+ Ba3/-/BB- Ba3/-/BB+ -/B+/B -/B+/B
Bond maturity 2021 2023 2023 2022 2024 2021 2022 2025 2025
Amount Outstanding (US$mm) 300 350 350 650 425 500 500 300 300
1Q18 1Q18 1Q18 2H17 1Q18 1Q18 1Q18 1Q18 1Q18
Oil & Gas production (kboed) 27.0 52.4 53.6 94.7 32.2 161.8 35.7 28.2 20.9
Revenue 110 292 181 935 124 768 141 138 54
EBITDA 45 86 116 801 63 399 69 89 34
FCF (13) 0 (34) 481 (13) 11 (344) 7 99
Gross debt 483 350* 536 3,606 420 1,604 1,079 398 343
Net debt 397 (166) 361 3,322 299 1,497 764 237 283
LQA Gross leverage 2.7x 1.0x 1.2x 2.3x 1.7x 1.0x 3.9x 1.1x 2.6x
LQA Net leverage 2.2x n/a 0.4x 2.1x 1.2x 0.9x 2.8x 0.7x 2.1x
*Pro forma for US$350mm issuance
Source: BBG as of 07/06/2018
Analysis of 1Q18 results
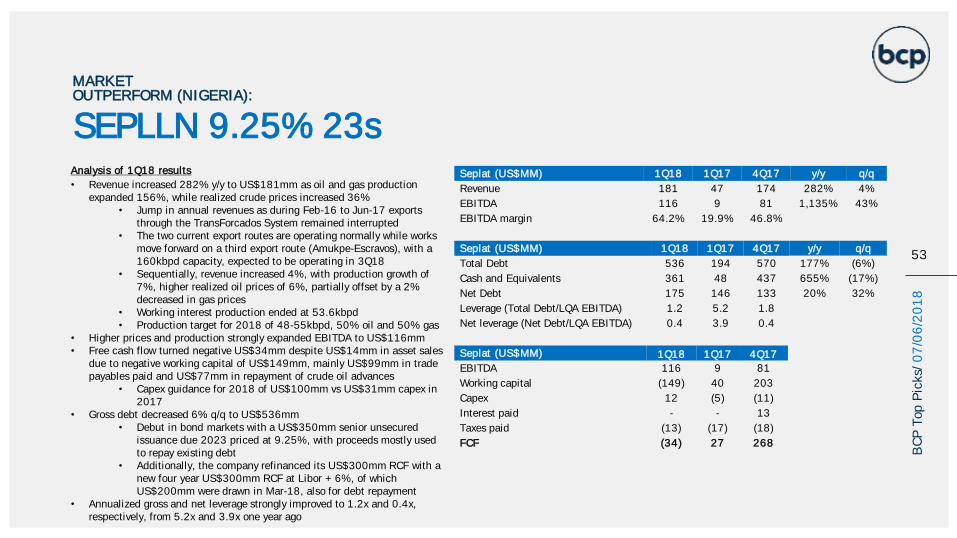
• Revenue increased 282% y/y to US$181mm as oil and gas production expanded 156%, while realized crude prices increased 36%
• Jump in annual revenues as during Feb-16 to Jun-17 exports through the TransForcados System remained interrupted
• The two current export routes are operating normally while works move forward on a third export route (Amukpe-Escravos), with a 160kbpd capacity, expected to be operating in 3Q18
• Sequentially, revenue increased 4%, with production growth of 7%, higher realized oil prices of 6%, partially offset by a 2% decreased in gas prices
• Working interest production ended at 53.6kbpd• Production target for 2018 of 48-55kbpd, 50% oil and 50% gas
• Higher prices and production strongly expanded EBITDA to US$116mm• Free cash flow turned negative US$34mm despite US$14mm in asset sales
due to negative working capital of US$149mm, mainly US$99mm in trade payables paid and US$77mm in repayment of crude oil advances
• Capex guidance for 2018 of US$100mm vs US$31mm capex in 2017
• Gross debt decreased 6% q/q to US$536mm • Debut in bond markets with a US$350mm senior unsecured
issuance due 2023 priced at 9.25%, with proceeds mostly used to repay existing debt
• Additionally, the company refinanced its US$300mm RCF with a new four year US$300mm RCF at Libor + 6%, of which US$200mm were drawn in Mar-18, also for debt repayment
• Annualized gross and net leverage strongly improved to 1.2x and 0.4x, respectively, from 5.2x and 3.9x one year ago
Seplat (US$MM) 1Q18 1Q17 4Q17 y/y q/q
Revenue 181 47 174 282% 4%
EBITDA 116 9 81 1,135% 43%
EBITDA margin 64.2% 19.9% 46.8%
Seplat (US$MM) 1Q18 1Q17 4Q17 y/y q/q
Total Debt 536 194 570 177% (6%)
Cash and Equivalents 361 48 437 655% (17%)
Net Debt 175 146 133 20% 32%
Leverage (Total Debt/LQA EBITDA) 1.2 5.2 1.8
Net leverage (Net Debt/LQA EBITDA) 0.4 3.9 0.4
Seplat (US$MM) 1Q18 1Q17 4Q17
EBITDA 116 9 81
Working capital (149) 40 203
Capex 12 (5) (11)
Interest paid - - 13
Taxes paid (13) (17) (18)
FCF (34) 27 268
SEPLLN 9.25% 23s
MARKET OUTPERFORM (NIGERIA):
53
BC
P T
op P
icks/
07
/06
/20
18
INDONESIA
55
BC
P T
op P
icks/
07
/06
/20
18
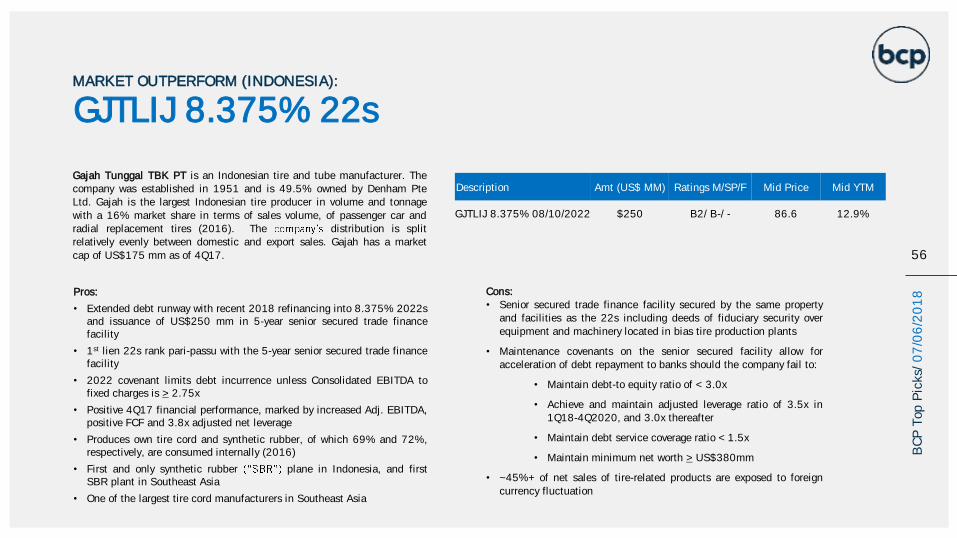
Cons:• Senior secured trade finance facility secured by the same property
and facilities as the 22s including deeds of fiduciary security over
equipment and machinery located in bias tire production plants
• Maintenance covenants on the senior secured facility allow foracceleration of debt repayment to banks should the company fail to:
• Maintain debt-to equity ratio of < 3.0x
• Achieve and maintain adjusted leverage ratio of 3.5x in1Q18-4Q2020, and 3.0x thereafter
• Maintain debt service coverage ratio < 1.5x
• Maintain minimum net worth > US$380mm
• ~45%+ of net sales of tire-related products are exposed to foreign
currency fluctuation
GJTLIJ 8.375% 22sMARKET OUTPERFORM (INDONESIA):
Gajah Tunggal TBK PT is an Indonesian tire and tube manufacturer. Thecompany was established in 1951 and is 49.5% owned by Denham PteLtd. Gajah is the largest Indonesian tire producer in volume and tonnage
with a 16% market share in terms of sales volume, of passenger car andradial replacement tires (2016). The distribution is splitrelatively evenly between domestic and export sales. Gajah has a market
cap of US$175 mm as of 4Q17.
Pros:
• Extended debt runway with recent 2018 refinancing into 8.375% 2022sand issuance of US$250 mm in 5-year senior secured trade financefacility
• 1st lien 22s rank pari-passu with the 5-year senior secured trade financefacility
• 2022 covenant limits debt incurrence unless Consolidated EBITDA tofixed charges is > 2.75x
• Positive 4Q17 financial performance, marked by increased Adj. EBITDA,positive FCF and 3.8x adjusted net leverage
• Produces own tire cord and synthetic rubber, of which 69% and 72%,respectively, are consumed internally (2016)
• First and only synthetic rubber plane in Indonesia, and firstSBR plant in Southeast Asia
• One of the largest tire cord manufacturers in Southeast Asia
Description Amt (US$ MM) Ratings M/SP/F Mid Price Mid YTM
GJTLIJ 8.375% 08/10/2022 $250 B2/ B-/ - 86.6 12.9%
56
BC
P T
op P
icks/
07
/06
/20
18
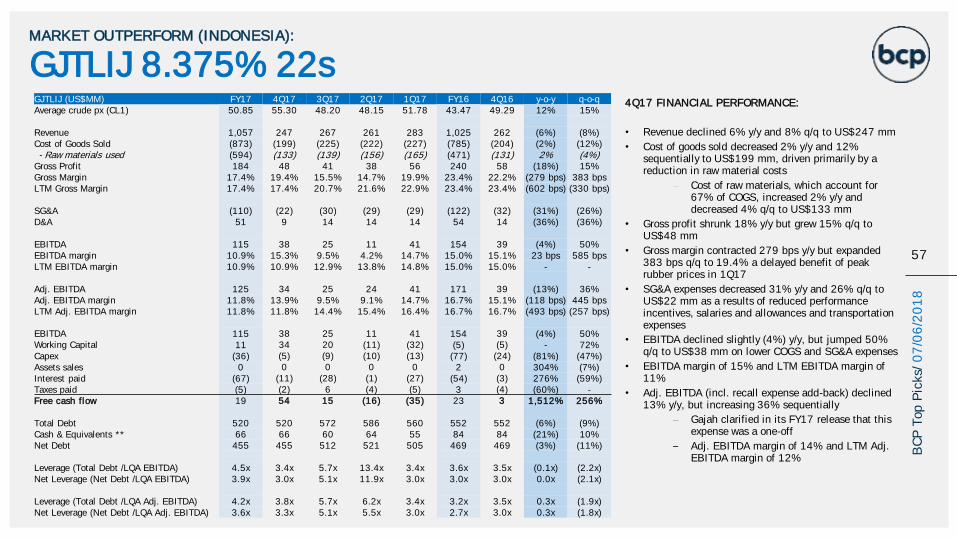
GJTLIJ 8.375% 22sMARKET OUTPERFORM (INDONESIA):
57
BC
P T
op P
icks/
07
/06
/20
18
4Q17 FINANCIAL PERFORMANCE:
• Revenue declined 6% y/y and 8% q/q to US$247 mm
• Cost of goods sold decreased 2% y/y and 12% sequentially to US$199 mm, driven primarily by a reduction in raw material costs
Cost of raw materials, which account for 67% of COGS, increased 2% y/y and decreased 4% q/q to US$133 mm
• Gross profit shrunk 18% y/y but grew 15% q/q to US$48 mm
• Gross margin contracted 279 bps y/y but expanded 383 bps q/q to 19.4% a delayed benefit of peak rubber prices in 1Q17
• SG&A expenses decreased 31% y/y and 26% q/q to US$22 mm as a results of reduced performance incentives, salaries and allowances and transportation expenses
• EBITDA declined slightly (4%) y/y, but jumped 50% q/q to US$38 mm on lower COGS and SG&A expenses
• EBITDA margin of 15% and LTM EBITDA margin of 11%
• Adj. EBITDA (incl. recall expense add-back) declined 13% y/y, but increasing 36% sequentially
Gajah clarified in its FY17 release that this expense was a one-off
Adj. EBITDA margin of 14% and LTM Adj. EBITDA margin of 12%
GJTLIJ (US$MM) FY17 4Q17 3Q17 2Q17 1Q17 FY16 4Q16 y-o-y q-o-qAverage crude px (CL1) 50.85 55.30 48.20 48.15 51.78 43.47 49.29 12% 15%
Revenue 1,057 247 267 261 283 1,025 262 (6%) (8%)Cost of Goods Sold (873) (199) (225) (222) (227) (785) (204) (2%) (12%)- Raw materials used (594) (133) (139) (156) (165) (471) (131) 2% (4%)
Gross Profit 184 48 41 38 56 240 58 (18%) 15%Gross Margin 17.4% 19.4% 15.5% 14.7% 19.9% 23.4% 22.2% (279 bps) 383 bpsLTM Gross Margin 17.4% 17.4% 20.7% 21.6% 22.9% 23.4% 23.4% (602 bps) (330 bps)
SG&A (110) (22) (30) (29) (29) (122) (32) (31%) (26%)D&A 51 9 14 14 14 54 14 (36%) (36%)
EBITDA 115 38 25 11 41 154 39 (4%) 50%EBITDA margin 10.9% 15.3% 9.5% 4.2% 14.7% 15.0% 15.1% 23 bps 585 bpsLTM EBITDA margin 10.9% 10.9% 12.9% 13.8% 14.8% 15.0% 15.0% - -
Adj. EBITDA 125 34 25 24 41 171 39 (13%) 36%Adj. EBITDA margin 11.8% 13.9% 9.5% 9.1% 14.7% 16.7% 15.1% (118 bps) 445 bpsLTM Adj. EBITDA margin 11.8% 11.8% 14.4% 15.4% 16.4% 16.7% 16.7% (493 bps) (257 bps)
EBITDA 115 38 25 11 41 154 39 (4%) 50%Working Capital 11 34 20 (11) (32) (5) (5) - 72%Capex (36) (5) (9) (10) (13) (77) (24) (81%) (47%)Assets sales 0 0 0 0 0 2 0 304% (7%)Interest paid (67) (11) (28) (1) (27) (54) (3) 276% (59%)Taxes paid (5) (2) 6 (4) (5) 3 (4) (60%) -Free cash flow 19 54 15 (16) (35) 23 3 1,512% 256%
Total Debt 520 520 572 586 560 552 552 (6%) (9%)Cash & Equivalents ** 66 66 60 64 55 84 84 (21%) 10%Net Debt 455 455 512 521 505 469 469 (3%) (11%)
Leverage (Total Debt /LQA EBITDA) 4.5x 3.4x 5.7x 13.4x 3.4x 3.6x 3.5x (0.1x) (2.2x)Net Leverage (Net Debt /LQA EBITDA) 3.9x 3.0x 5.1x 11.9x 3.0x 3.0x 3.0x 0.0x (2.1x)
Leverage (Total Debt /LQA Adj. EBITDA) 4.2x 3.8x 5.7x 6.2x 3.4x 3.2x 3.5x 0.3x (1.9x)Net Leverage (Net Debt /LQA Adj. EBITDA) 3.6x 3.3x 5.1x 5.5x 3.0x 2.7x 3.0x 0.3x (1.8x)
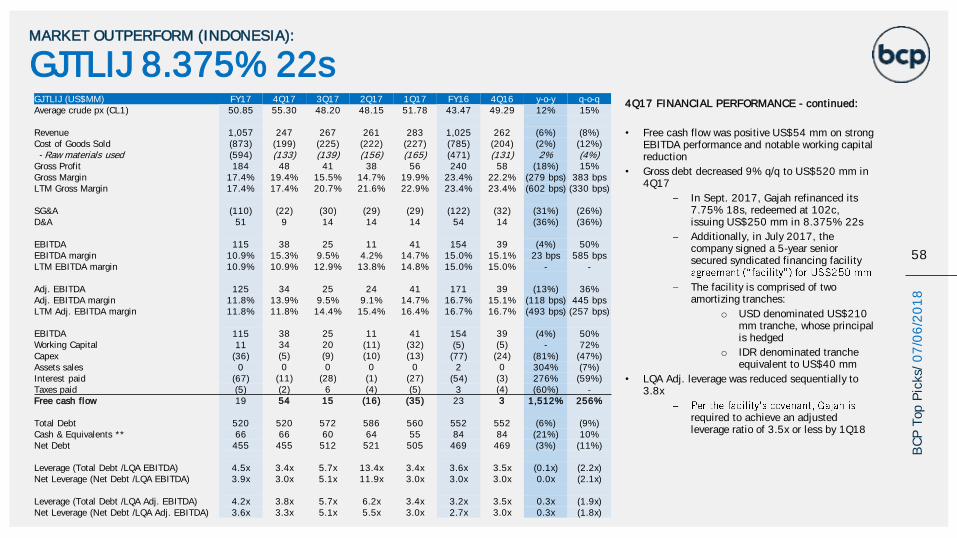
58
BC
P T
op P
icks/
07
/06
/20
18
4Q17 FINANCIAL PERFORMANCE - continued:
• Free cash flow was positive US$54 mm on strong EBITDA performance and notable working capital reduction
• Gross debt decreased 9% q/q to US$520 mm in 4Q17
In Sept. 2017, Gajah refinanced its 7.75% 18s, redeemed at 102c, issuing US$250 mm in 8.375% 22s
Additionally, in July 2017, the company signed a 5-year senior secured syndicated financing facility
The facility is comprised of two amortizing tranches:
o USD denominated US$210 mm tranche, whose principal is hedged
o IDR denominated tranche equivalent to US$40 mm
• LQA Adj. leverage was reduced sequentially to 3.8x
required to achieve an adjusted leverage ratio of 3.5x or less by 1Q18
GJTLIJ (US$MM) FY17 4Q17 3Q17 2Q17 1Q17 FY16 4Q16 y-o-y q-o-qAverage crude px (CL1) 50.85 55.30 48.20 48.15 51.78 43.47 49.29 12% 15%
Revenue 1,057 247 267 261 283 1,025 262 (6%) (8%)Cost of Goods Sold (873) (199) (225) (222) (227) (785) (204) (2%) (12%)- Raw materials used (594) (133) (139) (156) (165) (471) (131) 2% (4%)
Gross Profit 184 48 41 38 56 240 58 (18%) 15%Gross Margin 17.4% 19.4% 15.5% 14.7% 19.9% 23.4% 22.2% (279 bps) 383 bpsLTM Gross Margin 17.4% 17.4% 20.7% 21.6% 22.9% 23.4% 23.4% (602 bps) (330 bps)
SG&A (110) (22) (30) (29) (29) (122) (32) (31%) (26%)D&A 51 9 14 14 14 54 14 (36%) (36%)
EBITDA 115 38 25 11 41 154 39 (4%) 50%EBITDA margin 10.9% 15.3% 9.5% 4.2% 14.7% 15.0% 15.1% 23 bps 585 bpsLTM EBITDA margin 10.9% 10.9% 12.9% 13.8% 14.8% 15.0% 15.0% - -
Adj. EBITDA 125 34 25 24 41 171 39 (13%) 36%Adj. EBITDA margin 11.8% 13.9% 9.5% 9.1% 14.7% 16.7% 15.1% (118 bps) 445 bpsLTM Adj. EBITDA margin 11.8% 11.8% 14.4% 15.4% 16.4% 16.7% 16.7% (493 bps) (257 bps)
EBITDA 115 38 25 11 41 154 39 (4%) 50%Working Capital 11 34 20 (11) (32) (5) (5) - 72%Capex (36) (5) (9) (10) (13) (77) (24) (81%) (47%)Assets sales 0 0 0 0 0 2 0 304% (7%)Interest paid (67) (11) (28) (1) (27) (54) (3) 276% (59%)Taxes paid (5) (2) 6 (4) (5) 3 (4) (60%) -Free cash flow 19 54 15 (16) (35) 23 3 1,512% 256%
Total Debt 520 520 572 586 560 552 552 (6%) (9%)Cash & Equivalents ** 66 66 60 64 55 84 84 (21%) 10%Net Debt 455 455 512 521 505 469 469 (3%) (11%)
Leverage (Total Debt /LQA EBITDA) 4.5x 3.4x 5.7x 13.4x 3.4x 3.6x 3.5x (0.1x) (2.2x)Net Leverage (Net Debt /LQA EBITDA) 3.9x 3.0x 5.1x 11.9x 3.0x 3.0x 3.0x 0.0x (2.1x)
Leverage (Total Debt /LQA Adj. EBITDA) 4.2x 3.8x 5.7x 6.2x 3.4x 3.2x 3.5x 0.3x (1.9x)Net Leverage (Net Debt /LQA Adj. EBITDA) 3.6x 3.3x 5.1x 5.5x 3.0x 2.7x 3.0x 0.3x (1.8x)
GJTLIJ 8.375% 22sMARKET OUTPERFORM (INDONESIA):
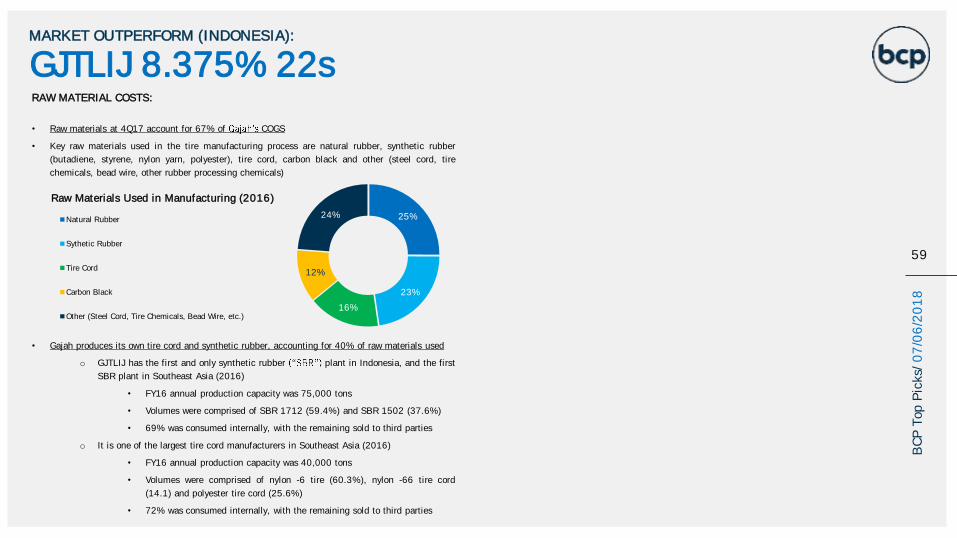
59
BC
P T
op P
icks/
07
/06
/20
18
GJTLIJ 8.375% 22sMARKET OUTPERFORM (INDONESIA):
RAW MATERIAL COSTS:
• Raw materials at 4Q17 account for 67% of COGS
• Key raw materials used in the tire manufacturing process are natural rubber, synthetic rubber
(butadiene, styrene, nylon yarn, polyester), tire cord, carbon black and other (steel cord, tire
chemicals, bead wire, other rubber processing chemicals)
• Gajah produces its own tire cord and synthetic rubber, accounting for 40% of raw materials used
o GJTLIJ has the first and only synthetic rubber plant in Indonesia, and the first
SBR plant in Southeast Asia (2016)
• FY16 annual production capacity was 75,000 tons
• Volumes were comprised of SBR 1712 (59.4%) and SBR 1502 (37.6%)
• 69% was consumed internally, with the remaining sold to third parties
o It is one of the largest tire cord manufacturers in Southeast Asia (2016)
• FY16 annual production capacity was 40,000 tons
• Volumes were comprised of nylon -6 tire (60.3%), nylon -66 tire cord
(14.1) and polyester tire cord (25.6%)
• 72% was consumed internally, with the remaining sold to third parties
25%
23%
16%
12%
24%
Raw Materials Used in Manufacturing (2016)
Natural Rubber
Sythetic Rubber
Tire Cord
Carbon Black
Other (Steel Cord, Tire Chemicals, Bead Wire, etc.)
60
MEXICO
BC
P T
op P
icks/
07
/06
/20
18
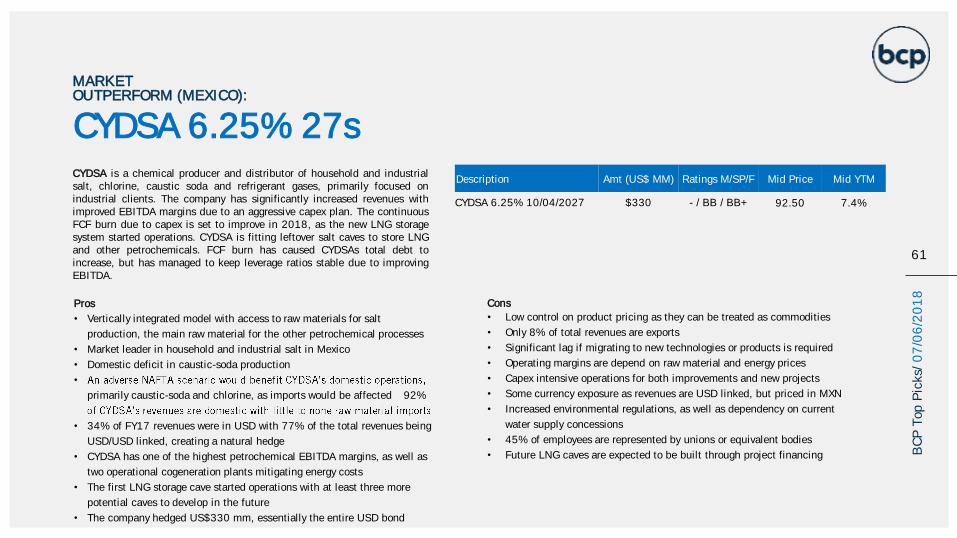
CYDSA 6.25% 27s
MARKET OUTPERFORM (MEXICO):
61
Pros
• Vertically integrated model with access to raw materials for salt
production, the main raw material for the other petrochemical processes
• Market leader in household and industrial salt in Mexico
• Domestic deficit in caustic-soda production
•
primarily caustic-soda and chlorine, as imports would be affected 92%
• 34% of FY17 revenues were in USD with 77% of the total revenues being
USD/USD linked, creating a natural hedge
• CYDSA has one of the highest petrochemical EBITDA margins, as well as
two operational cogeneration plants mitigating energy costs
• The first LNG storage cave started operations with at least three more
potential caves to develop in the future
• The company hedged US$330 mm, essentially the entire USD bond
Cons
• Low control on product pricing as they can be treated as commodities
• Only 8% of total revenues are exports
• Significant lag if migrating to new technologies or products is required
• Operating margins are depend on raw material and energy prices
• Capex intensive operations for both improvements and new projects
• Some currency exposure as revenues are USD linked, but priced in MXN
• Increased environmental regulations, as well as dependency on current
water supply concessions
• 45% of employees are represented by unions or equivalent bodies
• Future LNG caves are expected to be built through project financing
CYDSA is a chemical producer and distributor of household and industrialsalt, chlorine, caustic soda and refrigerant gases, primarily focused onindustrial clients. The company has significantly increased revenues withimproved EBITDA margins due to an aggressive capex plan. The continuousFCF burn due to capex is set to improve in 2018, as the new LNG storagesystem started operations. CYDSA is fitting leftover salt caves to store LNGand other petrochemicals. FCF burn has caused CYDSAs total debt toincrease, but has managed to keep leverage ratios stable due to improvingEBITDA.
Description Amt (US$ MM) Ratings M/SP/F Mid Price Mid YTM
CYDSA 6.25% 10/04/2027 $330 - / BB / BB+ 92.50 7.4%
BC
P T
op P
icks/
07
/06
/20
18
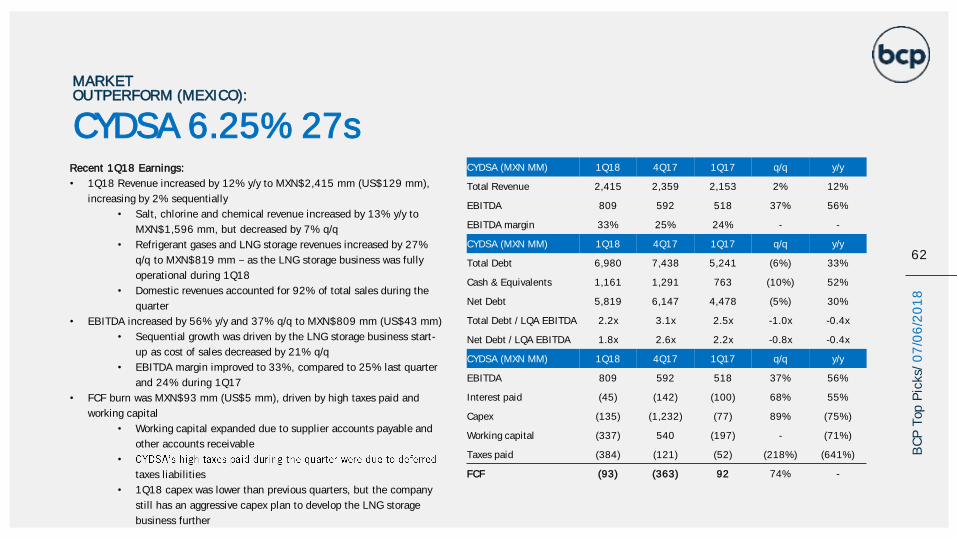
62
MARKET OUTPERFORM (MEXICO):
Recent 1Q18 Earnings:
• 1Q18 Revenue increased by 12% y/y to MXN$2,415 mm (US$129 mm),
increasing by 2% sequentially
• Salt, chlorine and chemical revenue increased by 13% y/y to
MXN$1,596 mm, but decreased by 7% q/q
• Refrigerant gases and LNG storage revenues increased by 27%
q/q to MXN$819 mm as the LNG storage business was fully
operational during 1Q18
• Domestic revenues accounted for 92% of total sales during the
quarter
• EBITDA increased by 56% y/y and 37% q/q to MXN$809 mm (US$43 mm)
• Sequential growth was driven by the LNG storage business start-
up as cost of sales decreased by 21% q/q
• EBITDA margin improved to 33%, compared to 25% last quarter
and 24% during 1Q17
• FCF burn was MXN$93 mm (US$5 mm), driven by high taxes paid and
working capital
• Working capital expanded due to supplier accounts payable and
other accounts receivable
•
taxes liabilities
• 1Q18 capex was lower than previous quarters, but the company
still has an aggressive capex plan to develop the LNG storage
business further
CYDSA 6.25% 27sCYDSA (MXN MM) 1Q18 4Q17 1Q17 q/q y/y
Total Revenue 2,415 2,359 2,153 2% 12%
EBITDA 809 592 518 37% 56%
EBITDA margin 33% 25% 24% - -
CYDSA (MXN MM) 1Q18 4Q17 1Q17 q/q y/y
Total Debt 6,980 7,438 5,241 (6%) 33%
Cash & Equivalents 1,161 1,291 763 (10%) 52%
Net Debt 5,819 6,147 4,478 (5%) 30%
Total Debt / LQA EBITDA 2.2x 3.1x 2.5x -1.0x -0.4x
Net Debt / LQA EBITDA 1.8x 2.6x 2.2x -0.8x -0.4x
CYDSA (MXN MM) 1Q18 4Q17 1Q17 q/q y/y
EBITDA 809 592 518 37% 56%
Interest paid (45) (142) (100) 68% 55%
Capex (135) (1,232) (77) 89% (75%)
Working capital (337) 540 (197) - (71%)
Taxes paid (384) (121) (52) (218%) (641%)
FCF (93) (363) 92 74% -
BC
P T
op P
icks/
07
/06
/20
18
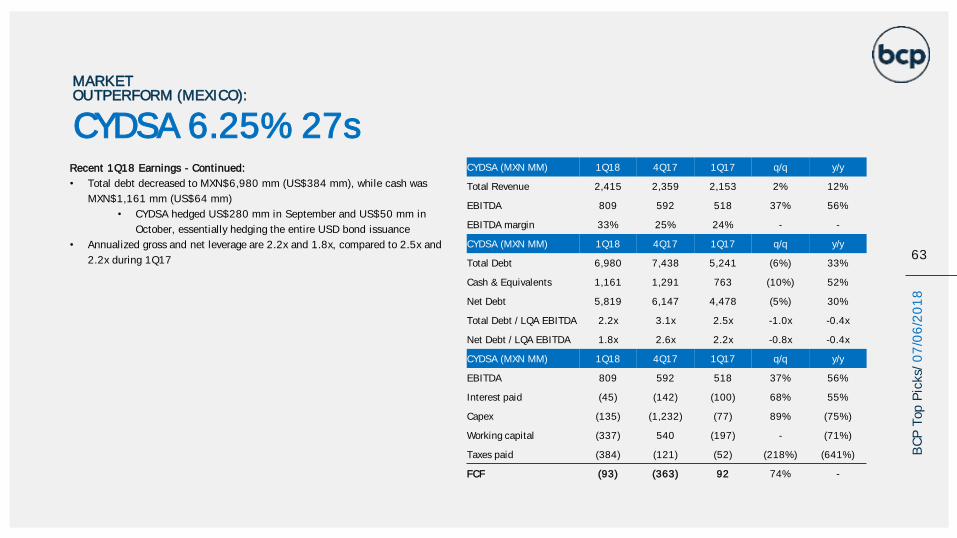
63
MARKET OUTPERFORM (MEXICO):
Recent 1Q18 Earnings - Continued:
• Total debt decreased to MXN$6,980 mm (US$384 mm), while cash was
MXN$1,161 mm (US$64 mm)
• CYDSA hedged US$280 mm in September and US$50 mm in
October, essentially hedging the entire USD bond issuance
• Annualized gross and net leverage are 2.2x and 1.8x, compared to 2.5x and
2.2x during 1Q17
CYDSA 6.25% 27sCYDSA (MXN MM) 1Q18 4Q17 1Q17 q/q y/y
Total Revenue 2,415 2,359 2,153 2% 12%
EBITDA 809 592 518 37% 56%
EBITDA margin 33% 25% 24% - -
CYDSA (MXN MM) 1Q18 4Q17 1Q17 q/q y/y
Total Debt 6,980 7,438 5,241 (6%) 33%
Cash & Equivalents 1,161 1,291 763 (10%) 52%
Net Debt 5,819 6,147 4,478 (5%) 30%
Total Debt / LQA EBITDA 2.2x 3.1x 2.5x -1.0x -0.4x
Net Debt / LQA EBITDA 1.8x 2.6x 2.2x -0.8x -0.4x
CYDSA (MXN MM) 1Q18 4Q17 1Q17 q/q y/y
EBITDA 809 592 518 37% 56%
Interest paid (45) (142) (100) 68% 55%
Capex (135) (1,232) (77) 89% (75%)
Working capital (337) 540 (197) - (71%)
Taxes paid (384) (121) (52) (218%) (641%)
FCF (93) (363) 92 74% -
BC
P T
op P
icks/
07
/06
/20
18
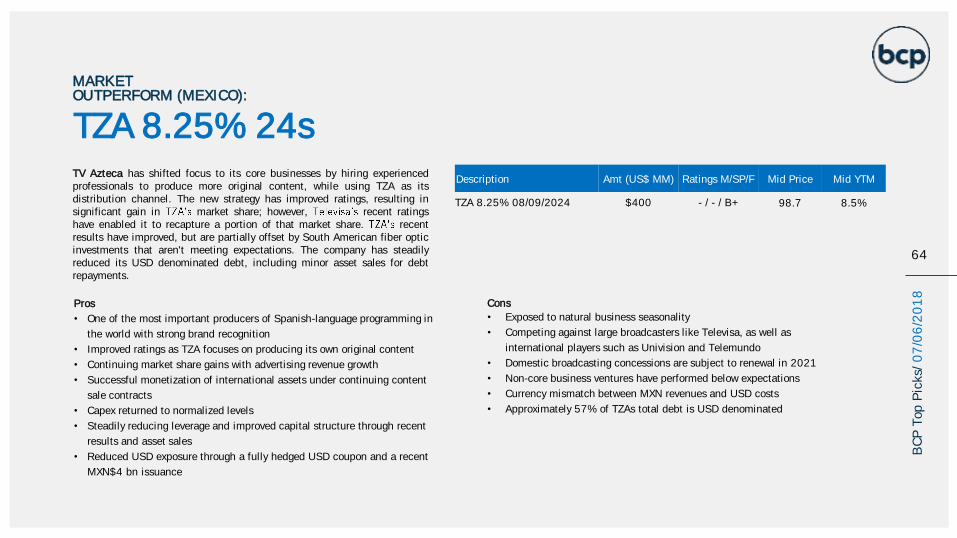
TZA 8.25% 24s
MARKET OUTPERFORM (MEXICO):
64
Pros
• One of the most important producers of Spanish-language programming in
the world with strong brand recognition
• Improved ratings as TZA focuses on producing its own original content
• Continuing market share gains with advertising revenue growth
• Successful monetization of international assets under continuing content
sale contracts
• Capex returned to normalized levels
• Steadily reducing leverage and improved capital structure through recent
results and asset sales
• Reduced USD exposure through a fully hedged USD coupon and a recent
MXN$4 bn issuance
Cons
• Exposed to natural business seasonality
• Competing against large broadcasters like Televisa, as well as
international players such as Univision and Telemundo
• Domestic broadcasting concessions are subject to renewal in 2021
• Non-core business ventures have performed below expectations
• Currency mismatch between MXN revenues and USD costs
• Approximately 57% of TZAs total debt is USD denominated
TV Azteca has shifted focus to its core businesses by hiring experiencedprofessionals to produce more original content, while using TZA as itsdistribution channel. The new strategy has improved ratings, resulting insignificant gain in market share; however, recent ratingshave enabled it to recapture a portion of that market share. recentresults have improved, but are partially offset by South American fiber opticinvestments that aren't meeting expectations. The company has steadilyreduced its USD denominated debt, including minor asset sales for debtrepayments.
Description Amt (US$ MM) Ratings M/SP/F Mid Price Mid YTM
TZA 8.25% 08/09/2024 $400 - / - / B+ 98.7 8.5%
BC
P T
op P
icks/
07
/06
/20
18
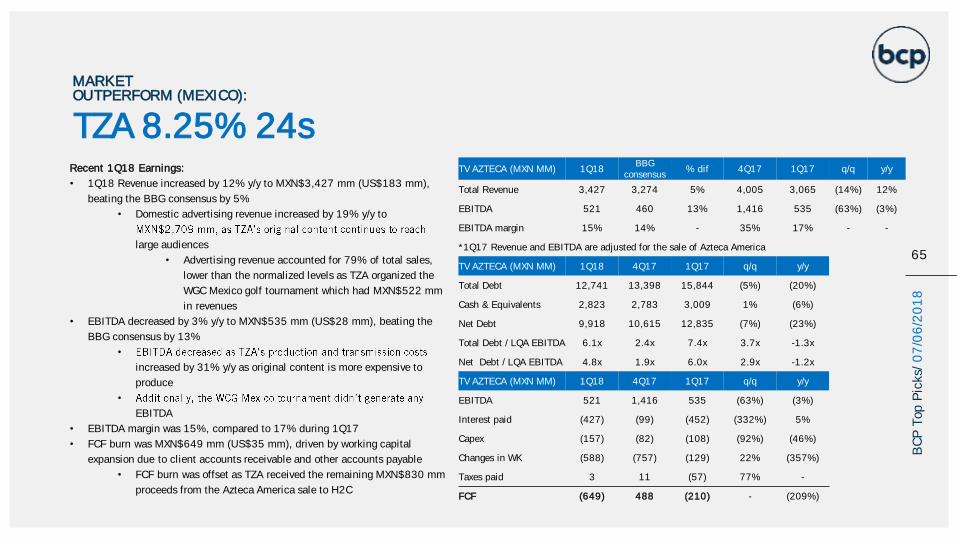
65
MARKET OUTPERFORM (MEXICO):
Recent 1Q18 Earnings:
• 1Q18 Revenue increased by 12% y/y to MXN$3,427 mm (US$183 mm),
beating the BBG consensus by 5%
• Domestic advertising revenue increased by 19% y/y to
large audiences
• Advertising revenue accounted for 79% of total sales,
lower than the normalized levels as TZA organized the
WGC Mexico golf tournament which had MXN$522 mm
in revenues
• EBITDA decreased by 3% y/y to MXN$535 mm (US$28 mm), beating the
BBG consensus by 13%
•
increased by 31% y/y as original content is more expensive to
produce
•
EBITDA
• EBITDA margin was 15%, compared to 17% during 1Q17
• FCF burn was MXN$649 mm (US$35 mm), driven by working capital
expansion due to client accounts receivable and other accounts payable
• FCF burn was offset as TZA received the remaining MXN$830 mm
proceeds from the Azteca America sale to H2C
TZA 8.25% 24sTV AZTECA (MXN MM) 1Q18
BBG consensus
% dif 4Q17 1Q17 q/q y/y
Total Revenue 3,427 3,274 5% 4,005 3,065 (14%) 12%
EBITDA 521 460 13% 1,416 535 (63%) (3%)
EBITDA margin 15% 14% - 35% 17% - -
*1Q17 Revenue and EBITDA are adjusted for the sale of Azteca America
TV AZTECA (MXN MM) 1Q18 4Q17 1Q17 q/q y/y
Total Debt 12,741 13,398 15,844 (5%) (20%)
Cash & Equivalents 2,823 2,783 3,009 1% (6%)
Net Debt 9,918 10,615 12,835 (7%) (23%)
Total Debt / LQA EBITDA 6.1x 2.4x 7.4x 3.7x -1.3x
Net Debt / LQA EBITDA 4.8x 1.9x 6.0x 2.9x -1.2x
TV AZTECA (MXN MM) 1Q18 4Q17 1Q17 q/q y/y
EBITDA 521 1,416 535 (63%) (3%)
Interest paid (427) (99) (452) (332%) 5%
Capex (157) (82) (108) (92%) (46%)
Changes in WK (588) (757) (129) 22% (357%)
Taxes paid 3 11 (57) 77% -
FCF (649) 488 (210) - (209%)
BC
P T
op P
icks/
07
/06
/20
18
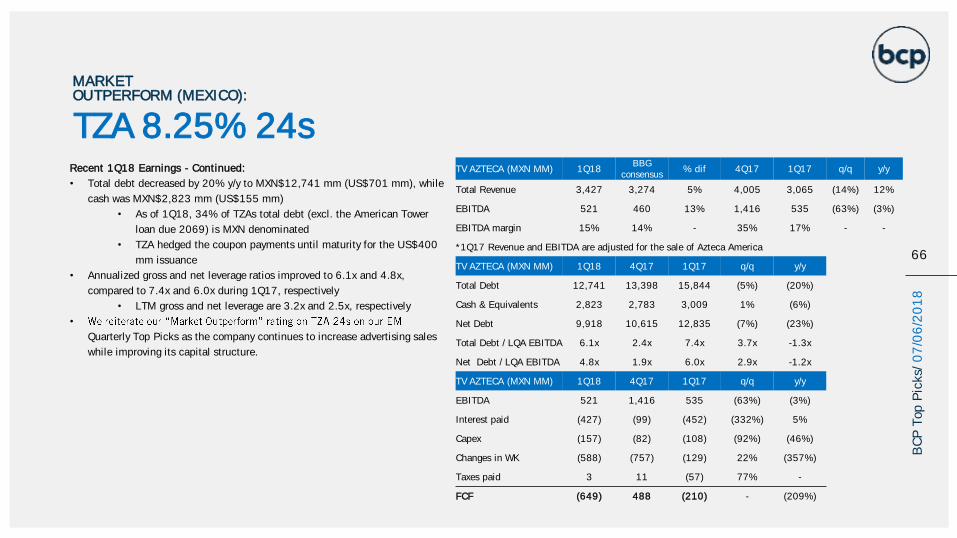
66
MARKET OUTPERFORM (MEXICO):
Recent 1Q18 Earnings - Continued:
• Total debt decreased by 20% y/y to MXN$12,741 mm (US$701 mm), while
cash was MXN$2,823 mm (US$155 mm)
• As of 1Q18, 34% of TZAs total debt (excl. the American Tower
loan due 2069) is MXN denominated
• TZA hedged the coupon payments until maturity for the US$400
mm issuance
• Annualized gross and net leverage ratios improved to 6.1x and 4.8x,
compared to 7.4x and 6.0x during 1Q17, respectively
• LTM gross and net leverage are 3.2x and 2.5x, respectively
•
Quarterly Top Picks as the company continues to increase advertising sales
while improving its capital structure.
TZA 8.25% 24sTV AZTECA (MXN MM) 1Q18
BBG consensus
% dif 4Q17 1Q17 q/q y/y
Total Revenue 3,427 3,274 5% 4,005 3,065 (14%) 12%
EBITDA 521 460 13% 1,416 535 (63%) (3%)
EBITDA margin 15% 14% - 35% 17% - -
*1Q17 Revenue and EBITDA are adjusted for the sale of Azteca America
TV AZTECA (MXN MM) 1Q18 4Q17 1Q17 q/q y/y
Total Debt 12,741 13,398 15,844 (5%) (20%)
Cash & Equivalents 2,823 2,783 3,009 1% (6%)
Net Debt 9,918 10,615 12,835 (7%) (23%)
Total Debt / LQA EBITDA 6.1x 2.4x 7.4x 3.7x -1.3x
Net Debt / LQA EBITDA 4.8x 1.9x 6.0x 2.9x -1.2x
TV AZTECA (MXN MM) 1Q18 4Q17 1Q17 q/q y/y
EBITDA 521 1,416 535 (63%) (3%)
Interest paid (427) (99) (452) (332%) 5%
Capex (157) (82) (108) (92%) (46%)
Changes in WK (588) (757) (129) 22% (357%)
Taxes paid 3 11 (57) 77% -
FCF (649) 488 (210) - (209%)
BC
P T
op P
icks/
07
/06
/20
18
PERU
67
BC
P T
op P
icks/
07
/06
/20
18
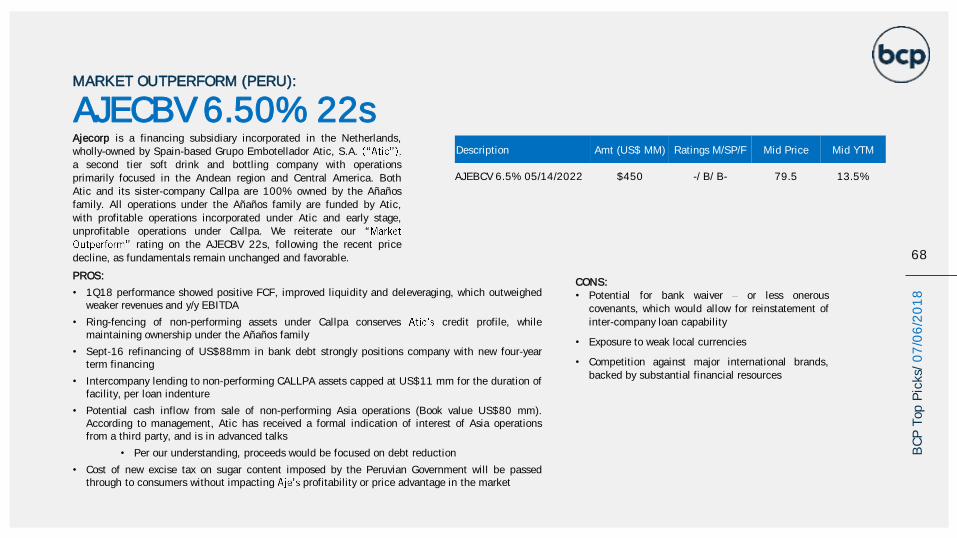
CONS:• Potential for bank waiver or less onerous
covenants, which would allow for reinstatement of
inter-company loan capability
• Exposure to weak local currencies
• Competition against major international brands,backed by substantial financial resources
AJECBV 6.50% 22sMARKET OUTPERFORM (PERU):
Ajecorp is a financing subsidiary incorporated in the Netherlands,wholly-owned by Spain-based Grupo Embotellador Atic, S.A.a second tier soft drink and bottling company with operations
primarily focused in the Andean region and Central America. BothAtic and its sister-company Callpa are 100% owned by the Añañosfamily. All operations under the Añaños family are funded by Atic,
with profitable operations incorporated under Atic and early stage,unprofitable operations under Callpa. We reiterate our
rating on the AJECBV 22s, following the recent price
decline, as fundamentals remain unchanged and favorable.
PROS:
• 1Q18 performance showed positive FCF, improved liquidity and deleveraging, which outweighedweaker revenues and y/y EBITDA
• Ring-fencing of non-performing assets under Callpa conserves credit profile, whilemaintaining ownership under the Añaños family
• Sept-16 refinancing of US$88mm in bank debt strongly positions company with new four-yearterm financing
• Intercompany lending to non-performing CALLPA assets capped at US$11 mm for the duration offacility, per loan indenture
• Potential cash inflow from sale of non-performing Asia operations (Book value US$80 mm).According to management, Atic has received a formal indication of interest of Asia operationsfrom a third party, and is in advanced talks
• Per our understanding, proceeds would be focused on debt reduction
• Cost of new excise tax on sugar content imposed by the Peruvian Government will be passedthrough to consumers without impacting profitability or price advantage in the market
Description Amt (US$ MM) Ratings M/SP/F Mid Price Mid YTM
AJEBCV 6.5% 05/14/2022 $450 -/ B/ B- 79.5 13.5%
68
BC
P T
op P
icks/
07
/06
/20
18
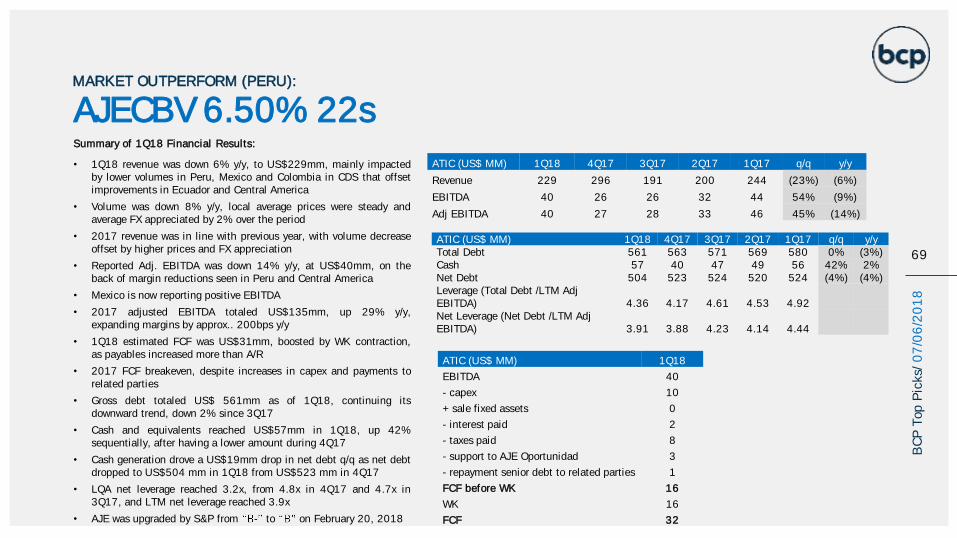
Summary of 1Q18 Financial Results:
• 1Q18 revenue was down 6% y/y, to US$229mm, mainly impactedby lower volumes in Peru, Mexico and Colombia in CDS that offsetimprovements in Ecuador and Central America
• Volume was down 8% y/y, local average prices were steady andaverage FX appreciated by 2% over the period
• 2017 revenue was in line with previous year, with volume decreaseoffset by higher prices and FX appreciation
• Reported Adj. EBITDA was down 14% y/y, at US$40mm, on theback of margin reductions seen in Peru and Central America
• Mexico is now reporting positive EBITDA
• 2017 adjusted EBITDA totaled US$135mm, up 29% y/y,expanding margins by approx.. 200bps y/y
• 1Q18 estimated FCF was US$31mm, boosted by WK contraction,as payables increased more than A/R
• 2017 FCF breakeven, despite increases in capex and payments torelated parties
• Gross debt totaled US$ 561mm as of 1Q18, continuing itsdownward trend, down 2% since 3Q17
• Cash and equivalents reached US$57mm in 1Q18, up 42%sequentially, after having a lower amount during 4Q17
• Cash generation drove a US$19mm drop in net debt q/q as net debtdropped to US$504 mm in 1Q18 from US$523 mm in 4Q17
• LQA net leverage reached 3.2x, from 4.8x in 4Q17 and 4.7x in3Q17, and LTM net leverage reached 3.9x
• AJE was upgraded by S&P from - to on February 20, 2018
AJECBV 6.50% 22sMARKET OUTPERFORM (PERU):
69
BC
P T
op P
icks/
07
/06
/20
18
ATIC (US$ MM) 1Q18 4Q17 3Q17 2Q17 1Q17 q/q y/y
Revenue 229 296 191 200 244 (23%) (6%)
EBITDA 40 26 26 32 44 54% (9%)
Adj EBITDA 40 27 28 33 46 45% (14%)
ATIC (US$ MM) 1Q18 4Q17 3Q17 2Q17 1Q17 q/q y/yTotal Debt 561 563 571 569 580 0% (3%)Cash 57 40 47 49 56 42% 2%Net Debt 504 523 524 520 524 (4%) (4%)Leverage (Total Debt /LTM Adj EBITDA) 4.36 4.17 4.61 4.53 4.92Net Leverage (Net Debt /LTM Adj EBITDA) 3.91 3.88 4.23 4.14 4.44
ATIC (US$ MM) 1Q18
EBITDA 40
- capex 10
+ sale fixed assets 0
- interest paid 2
- taxes paid 8
- support to AJE Oportunidad 3
- repayment senior debt to related parties 1
FCF before WK 16
WK 16
FCF 32
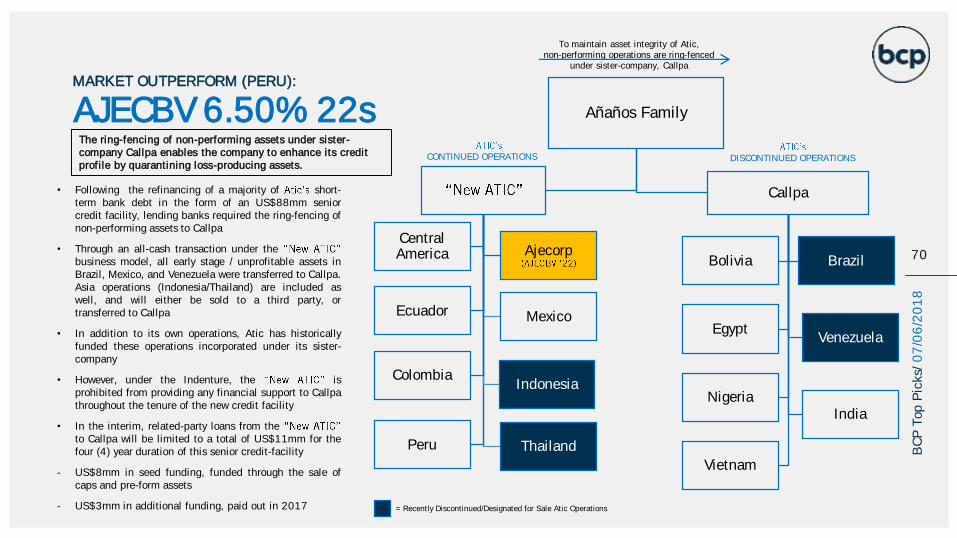
AJECBV 6.50% 22sMARKET OUTPERFORM (PERU):
Añaños Family
Central America
Colombia
Ecuador
Indonesia
Peru
Mexico
Thailand
Ajecorp
Callpa
Bolivia Brazil
Egypt
IndiaNigeria
Venezuela
Vietnam
CONTINUED OPERATIONS
To maintain asset integrity of Atic, non-performing operations are ring-fenced
under sister-company, Callpa
DISCONTINUED OPERATIONS
= Recently Discontinued/Designated for Sale Atic Operations
The ring-fencing of non-performing assets under sister-company Callpa enables the company to enhance its credit profile by quarantining loss-producing assets.
• Following the refinancing of a majority of short-term bank debt in the form of an US$88mm seniorcredit facility, lending banks required the ring-fencing ofnon-performing assets to Callpa
• Through an all-cash transaction under thebusiness model, all early stage / unprofitable assets inBrazil, Mexico, and Venezuela were transferred to Callpa.Asia operations (Indonesia/Thailand) are included aswell, and will either be sold to a third party, ortransferred to Callpa
• In addition to its own operations, Atic has historicallyfunded these operations incorporated under its sister-company
• However, under the Indenture, the isprohibited from providing any financial support to Callpathroughout the tenure of the new credit facility
• In the interim, related-party loans from theto Callpa will be limited to a total of US$11mm for thefour (4) year duration of this senior credit-facility
‐ US$8mm in seed funding, funded through the sale ofcaps and pre-form assets
‐ US$3mm in additional funding, paid out in 2017
70
BC
P T
op P
icks/
07
/06
/20
18
AJECBV 6.50% 22sMARKET OUTPERFORM (PERU):
71
BC
P T
op P
icks/
07
/06
/20
18
Update on Non-Performing Asset Sales to CALLPA:
• As of December 2017, Brazil and Venezuela operations have been effectively ring-fenced under CALLPA• Asian operations have not been sold CALLPA on formal indication of third-party interest (Book value US$80 mm)• Atic is reintegrated Mexico operations following positive financial (EBITDA) performance • Management has affirmed no more payments will be made to CALLPA from ATIC
• Intercompany support has been limited since September 28th, 2019, under the terms of the US$88 mm senior credit facility
• Under the limit, the following payments have been made to CALLPA:• Aje
Oportunidad•
• These proceeds were applied primarily towards WK and administrative expenses
Acquisition of Peruvian Brands
• Additionally, the Anaños family recently purchased Peruvian brands: Vida, Don Isaac Kola and Peru Cola from beverage producer, Embotelladora Don Jorge
• s Adj. EBITDA as of 1Q18
• The purchase was made through Poto Mye• All brands of the asset group are registered at Poto, owned separately by the Anaños family, and licensed to ATIC via
royalty payments
SAUDI ARABIA
72
BC
P T
op P
icks/
07
/06
/20
18
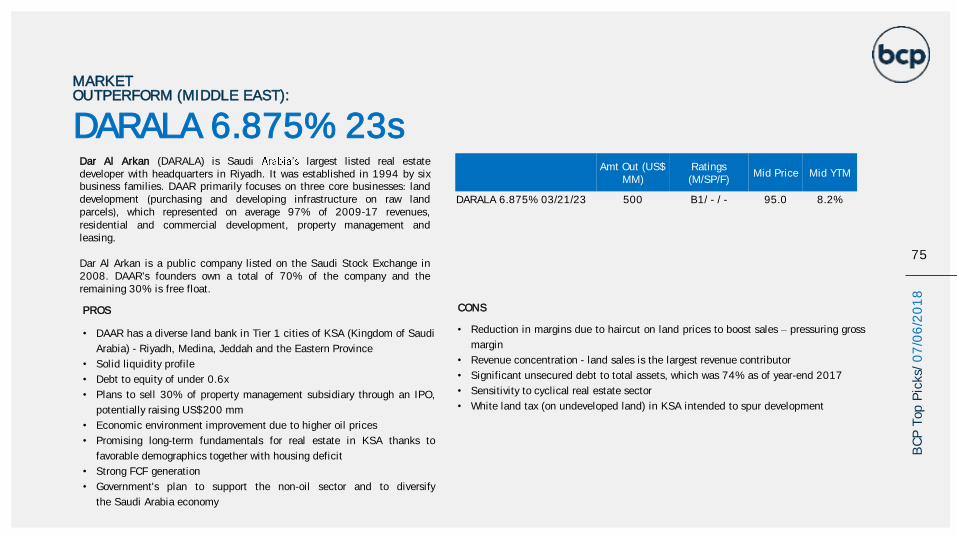
PROS
• DAAR has a diverse land bank in Tier 1 cities of KSA (Kingdom of Saudi
Arabia) - Riyadh, Medina, Jeddah and the Eastern Province
• Solid liquidity profile
• Debt to equity of under 0.6x
• Plans to sell 30% of property management subsidiary through an IPO,
potentially raising US$200 mm
• Economic environment improvement due to higher oil prices
• Promising long-term fundamentals for real estate in KSA thanks to
favorable demographics together with housing deficit
• Strong FCF generation
• Government's plan to support the non-oil sector and to diversify
the Saudi Arabia economy
CONS
• Reduction in margins due to haircut on land prices to boost sales pressuring gross
margin
• Revenue concentration - land sales is the largest revenue contributor
• Significant unsecured debt to total assets, which was 74% as of year-end 2017
• Sensitivity to cyclical real estate sector
• White land tax (on undeveloped land) in KSA intended to spur development
MARKET OUTPERFORM (MIDDLE EAST):
DARALA 6.875% 23sDar Al Arkan (DARALA) is Saudi largest listed real estatedeveloper with headquarters in Riyadh. It was established in 1994 by sixbusiness families. DAAR primarily focuses on three core businesses: landdevelopment (purchasing and developing infrastructure on raw landparcels), which represented on average 97% of 2009-17 revenues,residential and commercial development, property management andleasing.
Dar Al Arkan is a public company listed on the Saudi Stock Exchange in2008. DAAR's founders own a total of 70% of the company and theremaining 30% is free float.
75
BC
P T
op P
icks/
07
/06
/20
18
Amt Out (US$ MM)
Ratings (M/SP/F)
Mid Price Mid YTM
DARALA 6.875% 03/21/23 500 B1/ - / - 95.0 8.2%
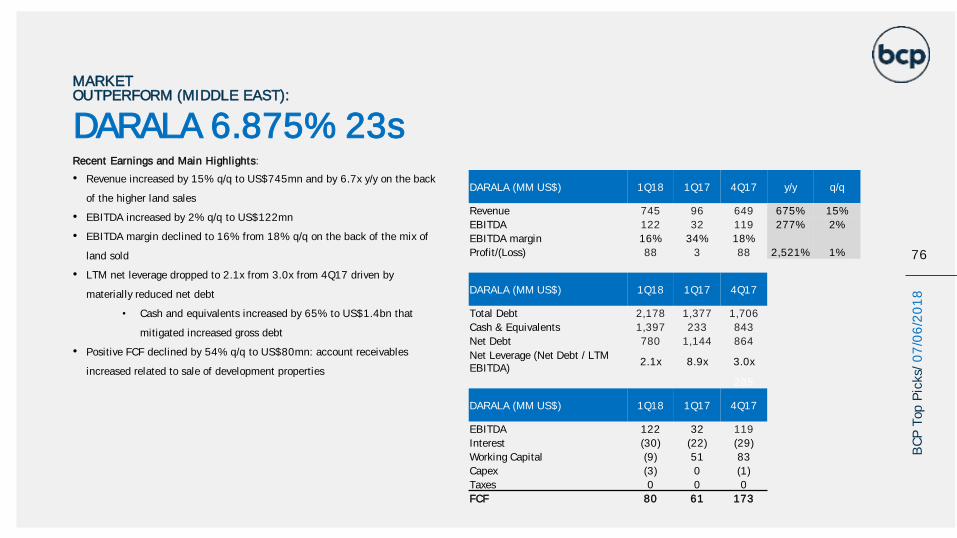
MARKET OUTPERFORM (MIDDLE EAST):
DARALA 6.875% 23sRecent Earnings and Main Highlights:
• Revenue increased by 15% q/q to US$745mn and by 6.7x y/y on the back
of the higher land sales
• EBITDA increased by 2% q/q to US$122mn
• EBITDA margin declined to 16% from 18% q/q on the back of the mix of
land sold
• LTM net leverage dropped to 2.1x from 3.0x from 4Q17 driven by
materially reduced net debt
• Cash and equivalents increased by 65% to US$1.4bn that
mitigated increased gross debt
• Positive FCF declined by 54% q/q to US$80mn: account receivables
increased related to sale of development properties
76
BC
P T
op P
icks/
07
/06
/20
18
DARALA (MM US$) 1Q18 1Q17 4Q17 y/y q/q
Revenue 745 96 649 675% 15%
EBITDA 122 32 119 277% 2%
EBITDA margin 16% 34% 18%
Profit/(Loss) 88 3 88 2,521% 1%
DARALA (MM US$) 1Q18 1Q17 4Q17
Total Debt 2,178 1,377 1,706
Cash & Equivalents 1,397 233 843
Net Debt 780 1,144 864
Net Leverage (Net Debt / LTM EBITDA)
2.1x 8.9x 3.0x
285
DARALA (MM US$) 1Q18 1Q17 4Q17
EBITDA 122 32 119
Interest (30) (22) (29)
Working Capital (9) 51 83
Capex (3) 0 (1)
Taxes 0 0 0
FCF 80 61 173
UKRAINE
75
BC
P T
op P
icks/
07
/06
/20
18
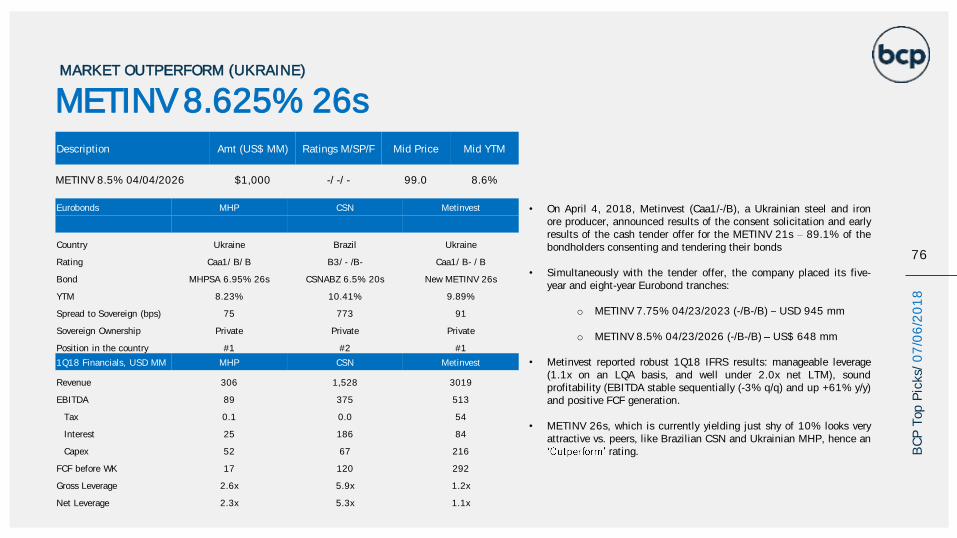
• On April 4, 2018, Metinvest (Caa1/-/B), a Ukrainian steel and ironore producer, announced results of the consent solicitation and earlyresults of the cash tender offer for the METINV 21s 89.1% of thebondholders consenting and tendering their bonds
• Simultaneously with the tender offer, the company placed its five-year and eight-year Eurobond tranches:
o METINV 7.75% 04/23/2023 (-/B-/B) USD 945 mm
o METINV 8.5% 04/23/2026 (-/B-/B) US$ 648 mm
• Metinvest reported robust 1Q18 IFRS results: manageable leverage(1.1x on an LQA basis, and well under 2.0x net LTM), soundprofitability (EBITDA stable sequentially (-3% q/q) and up +61% y/y)and positive FCF generation.
• METINV 26s, which is currently yielding just shy of 10% looks veryattractive vs. peers, like Brazilian CSN and Ukrainian MHP, hence an
rating.
Description Amt (US$ MM) Ratings M/SP/F Mid Price Mid YTM
METINV 8.5% 04/04/2026 $1,000 -/ -/ - 99.0 8.6%
76
BC
P T
op P
icks/
07
/06
/20
18
MARKET OUTPERFORM (UKRAINE)
METINV 8.625% 26s
Eurobonds MHP CSN Metinvest
Country Ukraine Brazil Ukraine
Rating Caa1/ B/ B B3/ - /B- Caa1/ B- / B
Bond MHPSA 6.95% 26s CSNABZ 6.5% 20s New METINV 26s
YTM 8.23% 10.41% 9.89%
Spread to Sovereign (bps) 75 773 91
Sovereign Ownership Private Private Private
Position in the country #1 #2 #1
1Q18 Financials, USD MM MHP CSN Metinvest
Revenue 306 1,528 3019
EBITDA 89 375 513
Tax 0.1 0.0 54
Interest 25 186 84
Capex 52 67 216
FCF before WK 17 120 292
Gross Leverage 2.6x 5.9x 1.2x
Net Leverage 2.3x 5.3x 1.1x
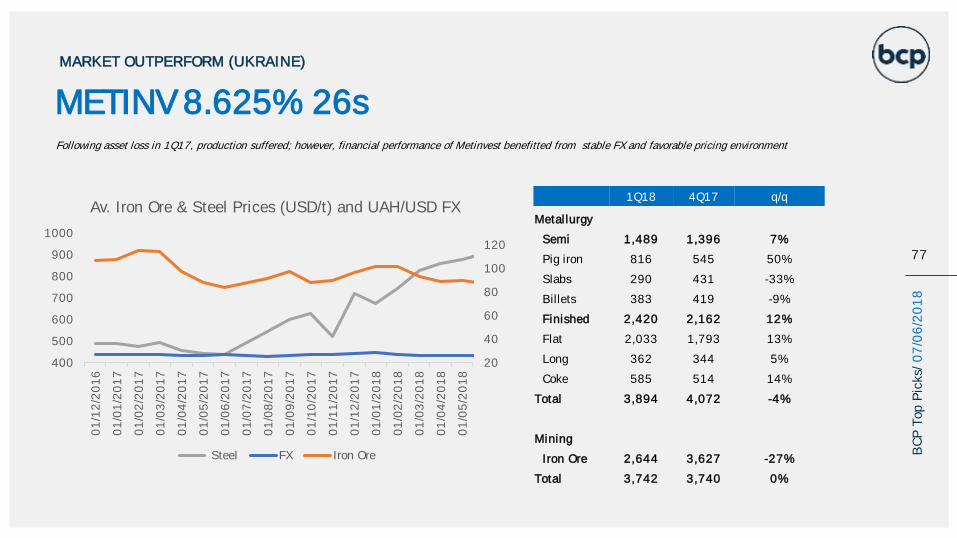
MARKET OUTPERFORM (UKRAINE)
METINV 8.625% 26sFollowing asset loss in 1Q17, production suffered; however, financial performance of Metinvest benefitted from stable FX and favorable pricing environment
77
BC
P T
op P
icks/
07
/06
/20
18
1Q18 4Q17 q/q
Metallurgy
Semi 1,489 1,396 7%
Pig iron 816 545 50%
Slabs 290 431 -33%
Billets 383 419 -9%
Finished 2,420 2,162 12%
Flat 2,033 1,793 13%
Long 362 344 5%
Coke 585 514 14%
Total 3,894 4,072 -4%
Mining
Iron Ore 2,644 3,627 -27%
Total 3,742 3,740 0%
20
40
60
80
100
120
400
500
600
700
800
900
1000
01
/12
/20
16
01
/01
/20
17
01
/02
/20
17
01
/03
/20
17
01
/04
/20
17
01
/05
/20
17
01
/06
/20
17
01
/07
/20
17
01
/08
/20
17
01
/09
/20
17
01
/10
/20
17
01
/11
/20
17
01
/12
/20
17
01
/01
/20
18
01
/02
/20
18
01
/03
/20
18
01
/04
/20
18
01
/05
/20
18
Av. Iron Ore & Steel Prices (USD/t) and UAH/USD FX
Steel FX Iron Ore
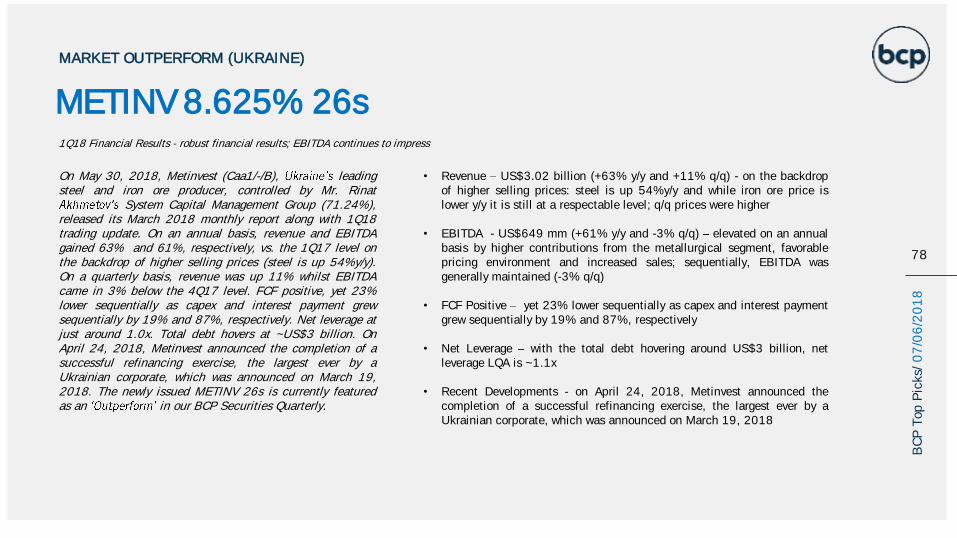
MARKET OUTPERFORM (UKRAINE)
METINV 8.625% 26s1Q18 Financial Results - robust financial results; EBITDA continues to impress
78
BC
P T
op P
icks/
07
/06
/20
18
On May 30, 2018, Metinvest (Caa1/-/B), leadingsteel and iron ore producer, controlled by Mr. Rinat
System Capital Management Group (71.24%),released its March 2018 monthly report along with 1Q18trading update. On an annual basis, revenue and EBITDAgained 63% and 61%, respectively, vs. the 1Q17 level onthe backdrop of higher selling prices (steel is up 54%y/y).On a quarterly basis, revenue was up 11% whilst EBITDAcame in 3% below the 4Q17 level. FCF positive, yet 23%lower sequentially as capex and interest payment grewsequentially by 19% and 87%, respectively. Net leverage atjust around 1.0x. Total debt hovers at ~US$3 billion. OnApril 24, 2018, Metinvest announced the completion of asuccessful refinancing exercise, the largest ever by aUkrainian corporate, which was announced on March 19,2018. The newly issued METINV 26s is currently featuredas an in our BCP Securities Quarterly.
• Revenue US$3.02 billion (+63% y/y and +11% q/q) - on the backdropof higher selling prices: steel is up 54%y/y and while iron ore price islower y/y it is still at a respectable level; q/q prices were higher
• EBITDA - US$649 mm (+61% y/y and -3% q/q) elevated on an annualbasis by higher contributions from the metallurgical segment, favorablepricing environment and increased sales; sequentially, EBITDA wasgenerally maintained (-3% q/q)
• FCF Positive yet 23% lower sequentially as capex and interest paymentgrew sequentially by 19% and 87%, respectively
• Net Leverage with the total debt hovering around US$3 billion, netleverage LQA is ~1.1x
• Recent Developments - on April 24, 2018, Metinvest announced thecompletion of a successful refinancing exercise, the largest ever by aUkrainian corporate, which was announced on March 19, 2018
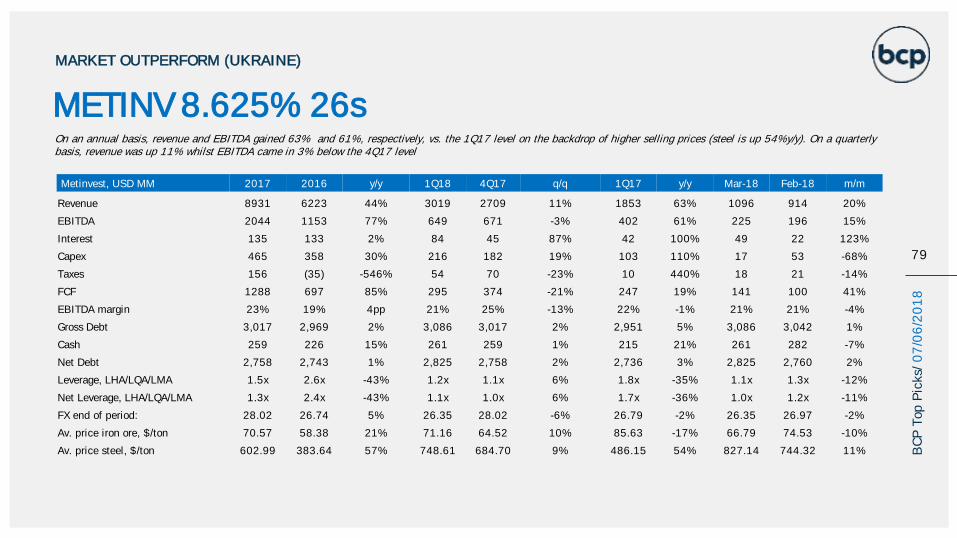
On an annual basis, revenue and EBITDA gained 63% and 61%, respectively, vs. the 1Q17 level on the backdrop of higher selling prices (steel is up 54%y/y). On a quarterlybasis, revenue was up 11% whilst EBITDA came in 3% below the 4Q17 level
79
BC
P T
op P
icks/
07
/06
/20
18
MARKET OUTPERFORM (UKRAINE)
METINV 8.625% 26s
Metinvest, USD MM 2017 2016 y/y 1Q18 4Q17 q/q 1Q17 y/y Mar-18 Feb-18 m/m
Revenue 8931 6223 44% 3019 2709 11% 1853 63% 1096 914 20%
EBITDA 2044 1153 77% 649 671 -3% 402 61% 225 196 15%
Interest 135 133 2% 84 45 87% 42 100% 49 22 123%
Capex 465 358 30% 216 182 19% 103 110% 17 53 -68%
Taxes 156 (35) -546% 54 70 -23% 10 440% 18 21 -14%
FCF 1288 697 85% 295 374 -21% 247 19% 141 100 41%
EBITDA margin 23% 19% 4pp 21% 25% -13% 22% -1% 21% 21% -4%
Gross Debt 3,017 2,969 2% 3,086 3,017 2% 2,951 5% 3,086 3,042 1%
Cash 259 226 15% 261 259 1% 215 21% 261 282 -7%
Net Debt 2,758 2,743 1% 2,825 2,758 2% 2,736 3% 2,825 2,760 2%
Leverage, LHA/LQA/LMA 1.5x 2.6x -43% 1.2x 1.1x 6% 1.8x -35% 1.1x 1.3x -12%
Net Leverage, LHA/LQA/LMA 1.3x 2.4x -43% 1.1x 1.0x 6% 1.7x -36% 1.0x 1.2x -11%
FX end of period: 28.02 26.74 5% 26.35 28.02 -6% 26.79 -2% 26.35 26.97 -2%
Av. price iron ore, $/ton 70.57 58.38 21% 71.16 64.52 10% 85.63 -17% 66.79 74.53 -10%
Av. price steel, $/ton 602.99 383.64 57% 748.61 684.70 9% 486.15 54% 827.14 744.32 11%
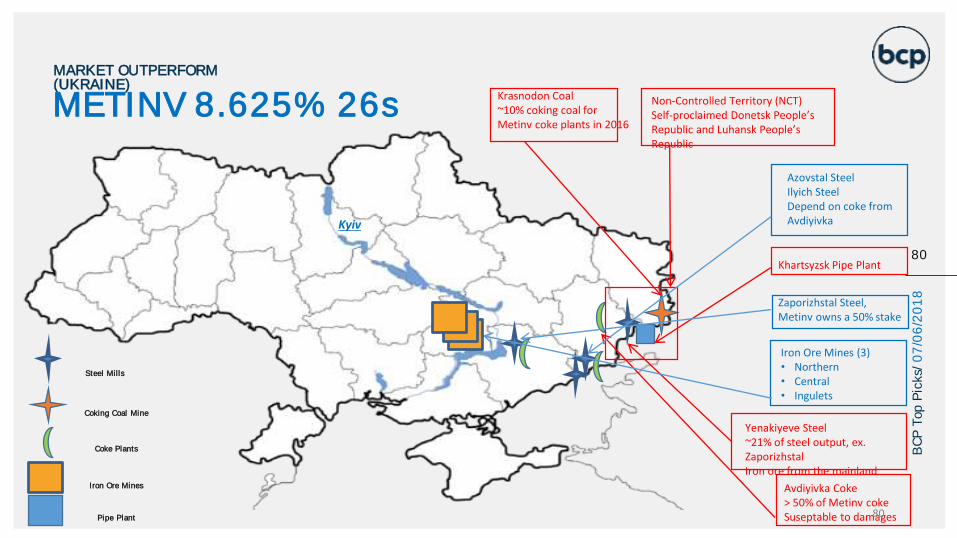
Kyiv
Steel Mills
Coking Coal Mine
Coke Plants
Pipe Plant
Iron Ore Mines
Non-Controlled Territory (NCT)Self-proclaimed Donetsk People’s Republic and Luhansk People’s Republic
Avdiyivka Coke > 50% of Metinv cokeSuseptable to damages
Yenakiyeve Steel~21% of steel output, ex. ZaporizhstalIron ore from the mainland
Krasnodon Coal~10% coking coal forMetinv coke plants in 2016
Azovstal Steel Ilyich SteelDepend on coke from Avdiyivka
Khartsyzsk Pipe Plant
Zaporizhstal Steel,Metinv owns a 50% stake
Iron Ore Mines (3) • Northern• Central• Ingulets
MARKET OUTPERFORM (UKRAINE)
METINV 8.625% 26s
80
80
BC
P T
op P
icks/
07
/06
/20
18
UNITED ARAB EMIRATES
81
BC
P T
op P
icks/
07
/06
/20
18
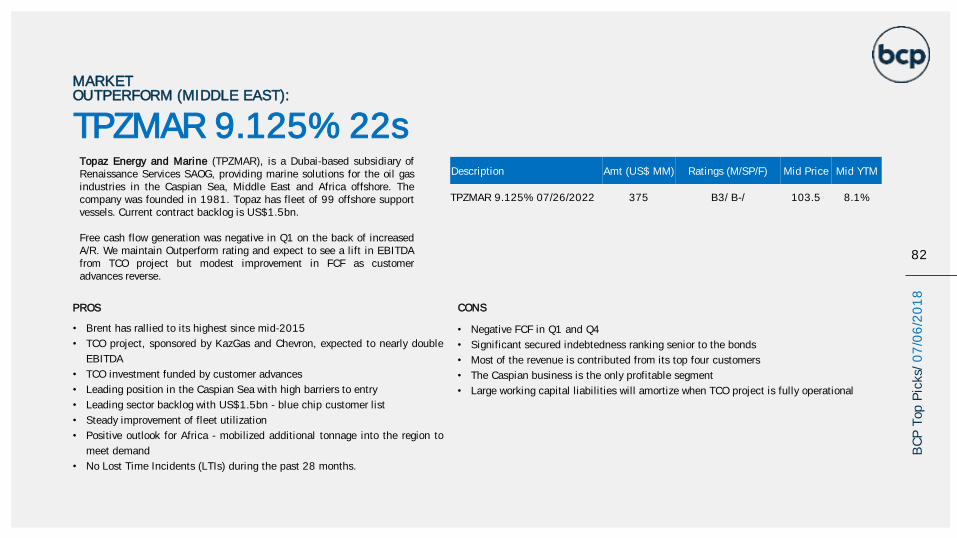
PROS
• Brent has rallied to its highest since mid-2015
• TCO project, sponsored by KazGas and Chevron, expected to nearly double
EBITDA
• TCO investment funded by customer advances
• Leading position in the Caspian Sea with high barriers to entry
• Leading sector backlog with US$1.5bn - blue chip customer list
• Steady improvement of fleet utilization
• Positive outlook for Africa - mobilized additional tonnage into the region to
meet demand
• No Lost Time Incidents (LTIs) during the past 28 months.
CONS
• Negative FCF in Q1 and Q4
• Significant secured indebtedness ranking senior to the bonds
• Most of the revenue is contributed from its top four customers
• The Caspian business is the only profitable segment
• Large working capital liabilities will amortize when TCO project is fully operational
MARKET OUTPERFORM (MIDDLE EAST):
TPZMAR 9.125% 22sDescription Amt (US$ MM) Ratings (M/SP/F) Mid Price Mid YTM
TPZMAR 9.125% 07/26/2022 375 B3/ B-/ 103.5 8.1%
Topaz Energy and Marine (TPZMAR), is a Dubai-based subsidiary ofRenaissance Services SAOG, providing marine solutions for the oil gasindustries in the Caspian Sea, Middle East and Africa offshore. Thecompany was founded in 1981. Topaz has fleet of 99 offshore supportvessels. Current contract backlog is US$1.5bn.
Free cash flow generation was negative in Q1 on the back of increasedA/R. We maintain Outperform rating and expect to see a lift in EBITDAfrom TCO project but modest improvement in FCF as customeradvances reverse.
82
BC
P T
op P
icks/
07
/06
/20
18
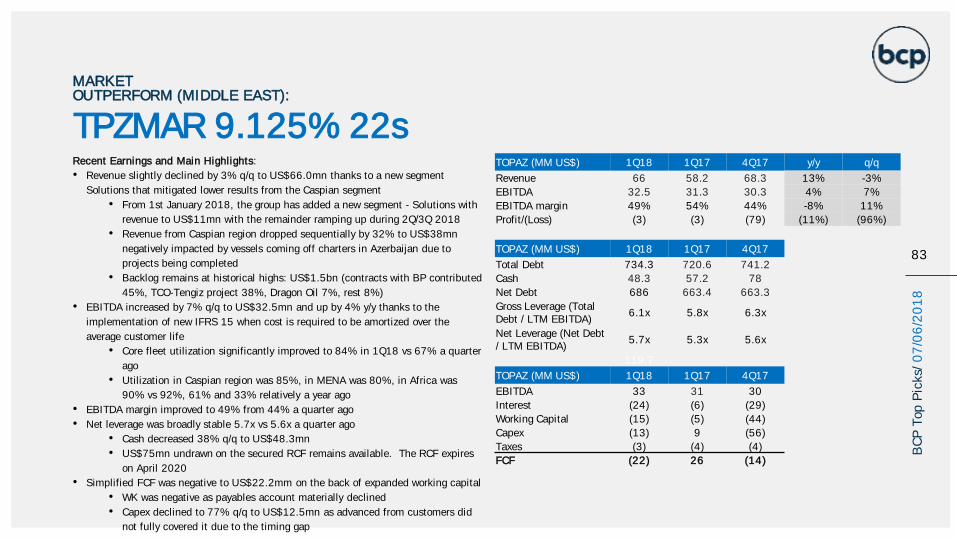
MARKET OUTPERFORM (MIDDLE EAST):
TPZMAR 9.125% 22sRecent Earnings and Main Highlights:
• Revenue slightly declined by 3% q/q to US$66.0mn thanks to a new segment
Solutions that mitigated lower results from the Caspian segment
• From 1st January 2018, the group has added a new segment - Solutions with
revenue to US$11mn with the remainder ramping up during 2Q/3Q 2018
• Revenue from Caspian region dropped sequentially by 32% to US$38mn
negatively impacted by vessels coming off charters in Azerbaijan due to
projects being completed
• Backlog remains at historical highs: US$1.5bn (contracts with BP contributed
45%, TCO-Tengiz project 38%, Dragon Oil 7%, rest 8%)
• EBITDA increased by 7% q/q to US$32.5mn and up by 4% y/y thanks to the
implementation of new IFRS 15 when cost is required to be amortized over the
average customer life
• Core fleet utilization significantly improved to 84% in 1Q18 vs 67% a quarter
ago
• Utilization in Caspian region was 85%, in MENA was 80%, in Africa was
90% vs 92%, 61% and 33% relatively a year ago
• EBITDA margin improved to 49% from 44% a quarter ago
• Net leverage was broadly stable 5.7x vs 5.6x a quarter ago
• Cash decreased 38% q/q to US$48.3mn
• US$75mn undrawn on the secured RCF remains available. The RCF expires
on April 2020
• Simplified FCF was negative to US$22.2mm on the back of expanded working capital
• WK was negative as payables account materially declined
• Capex declined to 77% q/q to US$12.5mn as advanced from customers did
not fully covered it due to the timing gap
83
BC
P T
op P
icks/
07
/06
/20
18
TOPAZ (MM US$) 1Q18 1Q17 4Q17 y/y q/q
Revenue 66 58.2 68.3 13% -3%
EBITDA 32.5 31.3 30.3 4% 7%
EBITDA margin 49% 54% 44% -8% 11%
Profit/(Loss) (3) (3) (79) (11%) (96%)
TOPAZ (MM US$) 1Q18 1Q17 4Q17
Total Debt 734.3 720.6 741.2
Cash 48.3 57.2 78
Net Debt 686 663.4 663.3
Gross Leverage (Total Debt / LTM EBITDA)
6.1x 5.8x 6.3x
Net Leverage (Net Debt / LTM EBITDA)
5.7x 5.3x 5.6x
119.7
TOPAZ (MM US$) 1Q18 1Q17 4Q17
EBITDA 33 31 30
Interest (24) (6) (29)
Working Capital (15) (5) (44)
Capex (13) 9 (56)
Taxes (3) (4) (4)
FCF (22) 26 (14)
SWAP AZULBZ 5.875% 24s GOLLBZ 7.00% 25s
BRAZIL84
BC
P T
op P
icks/
07
/06
/20
18

BRAZIL
85
BC
P T
op P
icks/
07
/06
/20
18
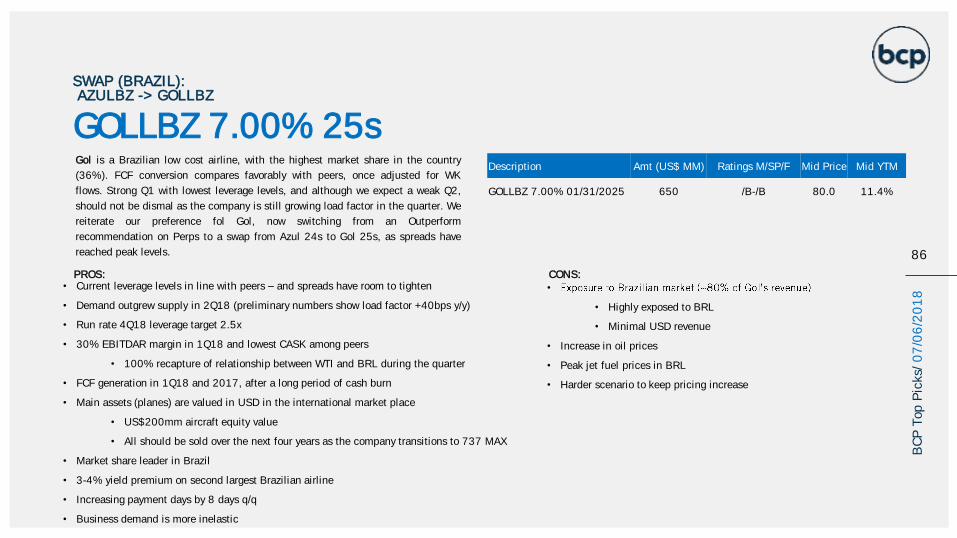
PROS:• Current leverage levels in line with peers and spreads have room to tighten
• Demand outgrew supply in 2Q18 (preliminary numbers show load factor +40bps y/y)
• Run rate 4Q18 leverage target 2.5x
• 30% EBITDAR margin in 1Q18 and lowest CASK among peers
• 100% recapture of relationship between WTI and BRL during the quarter
• FCF generation in 1Q18 and 2017, after a long period of cash burn
• Main assets (planes) are valued in USD in the international market place
• US$200mm aircraft equity value
• All should be sold over the next four years as the company transitions to 737 MAX
• Market share leader in Brazil
• 3-4% yield premium on second largest Brazilian airline
• Increasing payment days by 8 days q/q
• Business demand is more inelastic
CONS:•
• Highly exposed to BRL
• Minimal USD revenue
• Increase in oil prices
• Peak jet fuel prices in BRL
• Harder scenario to keep pricing increase
SWAP (BRAZIL):AZULBZ -> GOLLBZ
GOLLBZ 7.00% 25s
86
BC
P T
op P
icks/
07
/06
/20
18
Gol is a Brazilian low cost airline, with the highest market share in the country
(36%). FCF conversion compares favorably with peers, once adjusted for WK
flows. Strong Q1 with lowest leverage levels, and although we expect a weak Q2,
should not be dismal as the company is still growing load factor in the quarter. We
reiterate our preference fol Gol, now switching from an Outperform
recommendation on Perps to a swap from Azul 24s to Gol 25s, as spreads have
reached peak levels.
Description Amt (US$ MM) Ratings M/SP/F Mid Price Mid YTM
GOLLBZ 7.00% 01/31/2025 650 /B-/B 80.0 11.4%
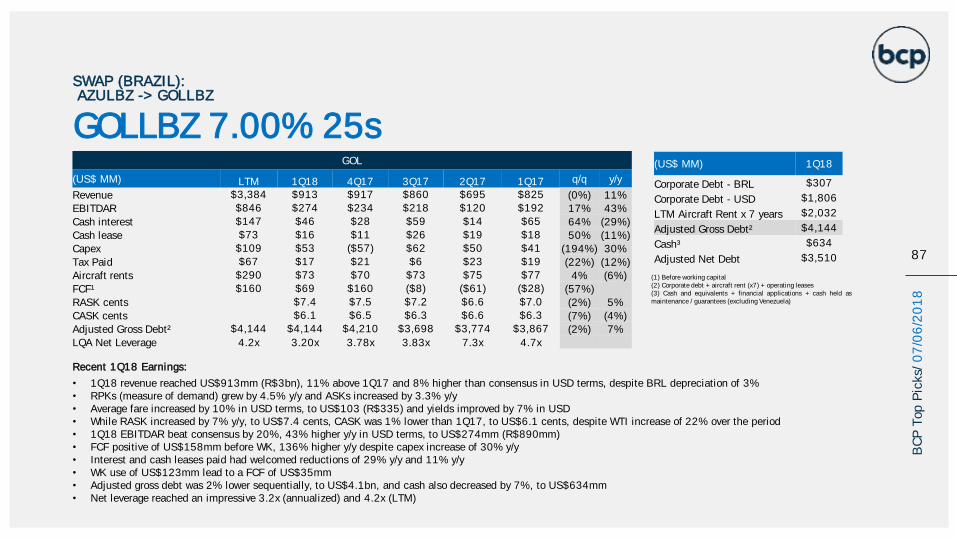
87
BC
P T
op P
icks/
07
/06
/20
18
GOL
(US$ MM) LTM 1Q18 4Q17 3Q17 2Q17 1Q17 q/q y/y
Revenue $3,384 $913 $917 $860 $695 $825 (0%) 11%
EBITDAR $846 $274 $234 $218 $120 $192 17% 43%
Cash interest $147 $46 $28 $59 $14 $65 64% (29%)
Cash lease $73 $16 $11 $26 $19 $18 50% (11%)
Capex $109 $53 ($57) $62 $50 $41 (194%) 30%
Tax Paid $67 $17 $21 $6 $23 $19 (22%) (12%)
Aircraft rents $290 $73 $70 $73 $75 $77 4% (6%)
FCF¹ $160 $69 $160 ($8) ($61) ($28) (57%)
RASK cents $7.4 $7.5 $7.2 $6.6 $7.0 (2%) 5%
CASK cents $6.1 $6.5 $6.3 $6.6 $6.3 (7%) (4%)
Adjusted Gross Debt² $4,144 $4,144 $4,210 $3,698 $3,774 $3,867 (2%) 7%
LQA Net Leverage 4.2x 3.20x 3.78x 3.83x 7.3x 4.7x
(US$ MM) 1Q18
Corporate Debt - BRL $307
Corporate Debt - USD $1,806
LTM Aircraft Rent x 7 years $2,032
Adjusted Gross Debt² $4,144
Cash³ $634
Adjusted Net Debt $3,510
• 1Q18 revenue reached US$913mm (R$3bn), 11% above 1Q17 and 8% higher than consensus in USD terms, despite BRL depreciation of 3%• RPKs (measure of demand) grew by 4.5% y/y and ASKs increased by 3.3% y/y• Average fare increased by 10% in USD terms, to US$103 (R$335) and yields improved by 7% in USD• While RASK increased by 7% y/y, to US$7.4 cents, CASK was 1% lower than 1Q17, to US$6.1 cents, despite WTI increase of 22% over the period• 1Q18 EBITDAR beat consensus by 20%, 43% higher y/y in USD terms, to US$274mm (R$890mm)• FCF positive of US$158mm before WK, 136% higher y/y despite capex increase of 30% y/y• Interest and cash leases paid had welcomed reductions of 29% y/y and 11% y/y• WK use of US$123mm lead to a FCF of US$35mm• Adjusted gross debt was 2% lower sequentially, to US$4.1bn, and cash also decreased by 7%, to US$634mm• Net leverage reached an impressive 3.2x (annualized) and 4.2x (LTM)
Recent 1Q18 Earnings:
(1) Before working capital(2) Corporate debt + aircraft rent (x7) + operating leases(3) Cash and equivalents + financial applications + cash held asmaintenance / guarantees (excluding Venezuela)
SWAP (BRAZIL):AZULBZ -> GOLLBZ
GOLLBZ 7.00% 25s
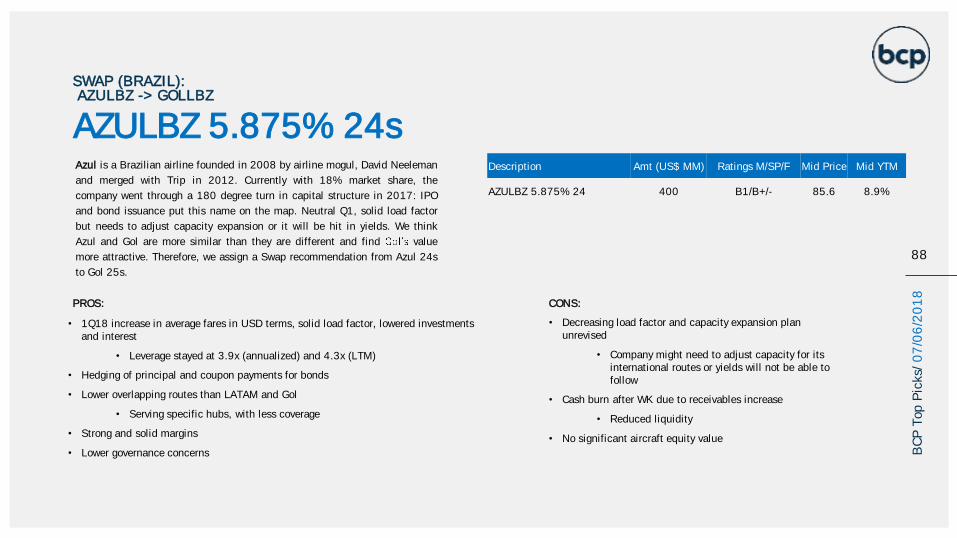
• 1Q18 increase in average fares in USD terms, solid load factor, lowered investments and interest
• Leverage stayed at 3.9x (annualized) and 4.3x (LTM)
• Hedging of principal and coupon payments for bonds
• Lower overlapping routes than LATAM and Gol
• Serving specific hubs, with less coverage
• Strong and solid margins
• Lower governance concerns
• Decreasing load factor and capacity expansion plan unrevised
• Company might need to adjust capacity for its international routes or yields will not be able to follow
• Cash burn after WK due to receivables increase
• Reduced liquidity
• No significant aircraft equity value
SWAP (BRAZIL):AZULBZ -> GOLLBZ
AZULBZ 5.875% 24s
88
BC
P T
op P
icks/
07
/06
/20
18
Azul is a Brazilian airline founded in 2008 by airline mogul, David Neeleman
and merged with Trip in 2012. Currently with 18% market share, the
company went through a 180 degree turn in capital structure in 2017: IPO
and bond issuance put this name on the map. Neutral Q1, solid load factor
but needs to adjust capacity expansion or it will be hit in yields. We think
Azul and Gol are more similar than they are different and find value
more attractive. Therefore, we assign a Swap recommendation from Azul 24s
to Gol 25s.
Description Amt (US$ MM) Ratings M/SP/F Mid Price Mid YTM
AZULBZ 5.875% 24 400 B1/B+/- 85.6 8.9%
PROS: CONS:
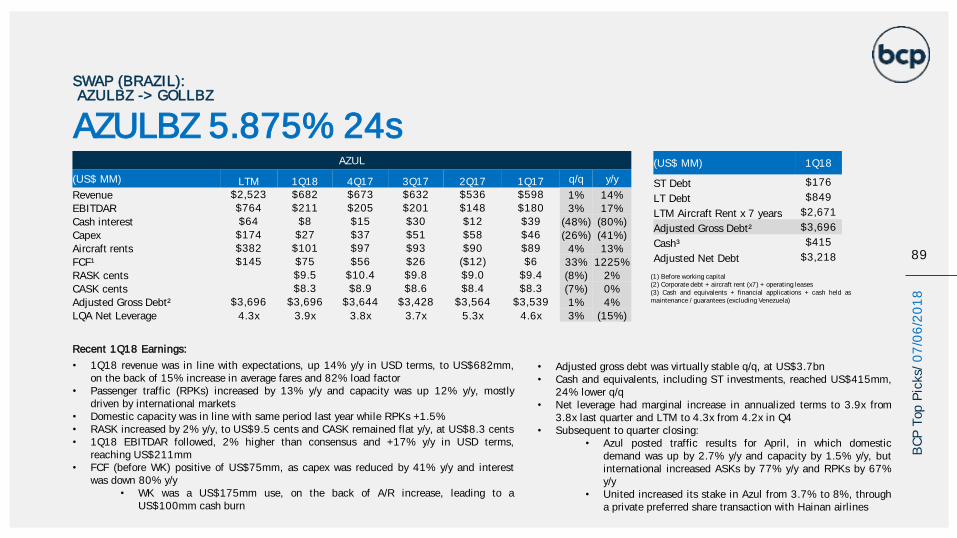
89
BC
P T
op P
icks/
07
/06
/20
18
• 1Q18 revenue was in line with expectations, up 14% y/y in USD terms, to US$682mm,on the back of 15% increase in average fares and 82% load factor
• Passenger traffic (RPKs) increased by 13% y/y and capacity was up 12% y/y, mostlydriven by international markets
• Domestic capacity was in line with same period last year while RPKs +1.5%• RASK increased by 2% y/y, to US$9.5 cents and CASK remained flat y/y, at US$8.3 cents• 1Q18 EBITDAR followed, 2% higher than consensus and +17% y/y in USD terms,
reaching US$211mm• FCF (before WK) positive of US$75mm, as capex was reduced by 41% y/y and interest
was down 80% y/y• WK was a US$175mm use, on the back of A/R increase, leading to a
US$100mm cash burn
Recent 1Q18 Earnings:
• Adjusted gross debt was virtually stable q/q, at US$3.7bn• Cash and equivalents, including ST investments, reached US$415mm,
24% lower q/q• Net leverage had marginal increase in annualized terms to 3.9x from
3.8x last quarter and LTM to 4.3x from 4.2x in Q4• Subsequent to quarter closing:
• Azul posted traffic results for April, in which domesticdemand was up by 2.7% y/y and capacity by 1.5% y/y, butinternational increased ASKs by 77% y/y and RPKs by 67%y/y
• United increased its stake in Azul from 3.7% to 8%, througha private preferred share transaction with Hainan airlines
SWAP (BRAZIL):AZULBZ -> GOLLBZ
AZULBZ 5.875% 24sAZUL
(US$ MM) LTM 1Q18 4Q17 3Q17 2Q17 1Q17 q/q y/y
Revenue $2,523 $682 $673 $632 $536 $598 1% 14%
EBITDAR $764 $211 $205 $201 $148 $180 3% 17%
Cash interest $64 $8 $15 $30 $12 $39 (48%) (80%)
Capex $174 $27 $37 $51 $58 $46 (26%) (41%)
Aircraft rents $382 $101 $97 $93 $90 $89 4% 13%
FCF¹ $145 $75 $56 $26 ($12) $6 33% 1225%
RASK cents $9.5 $10.4 $9.8 $9.0 $9.4 (8%) 2%
CASK cents $8.3 $8.9 $8.6 $8.4 $8.3 (7%) 0%
Adjusted Gross Debt² $3,696 $3,696 $3,644 $3,428 $3,564 $3,539 1% 4%
LQA Net Leverage 4.3x 3.9x 3.8x 3.7x 5.3x 4.6x 3% (15%)
(US$ MM) 1Q18
ST Debt $176
LT Debt $849
LTM Aircraft Rent x 7 years $2,671
Adjusted Gross Debt² $3,696
Cash³ $415
Adjusted Net Debt $3,218
(1) Before working capital(2) Corporate debt + aircraft rent (x7) + operating leases(3) Cash and equivalents + financial applications + cash held asmaintenance / guarantees (excluding Venezuela)
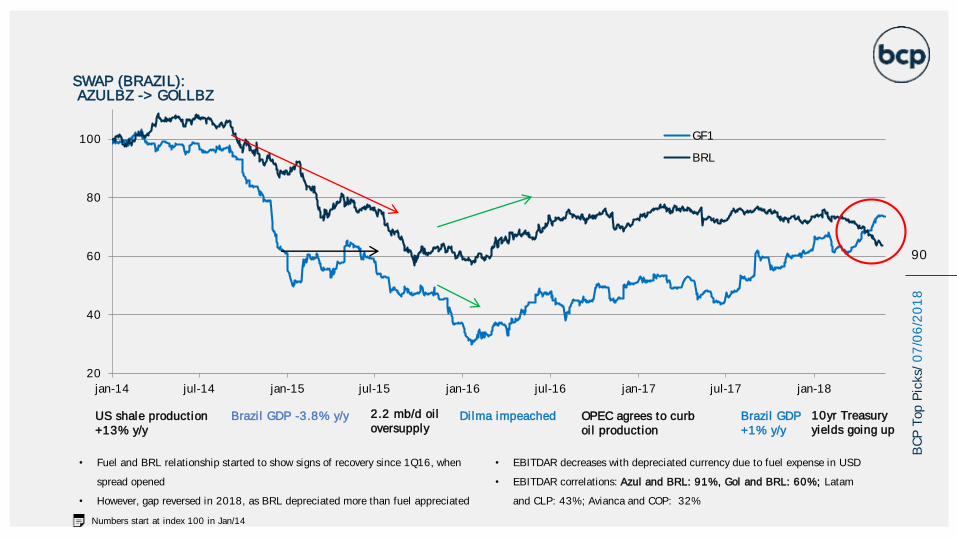
Numbers start at index 100 in Jan/14
90
• Fuel and BRL relationship started to show signs of recovery since 1Q16, when
spread opened
• However, gap reversed in 2018, as BRL depreciated more than fuel appreciated
20
40
60
80
100
jan-14 jul-14 jan-15 jul-15 jan-16 jul-16 jan-17 jul-17 jan-18
GF1
BRL
Dilma impeachedBrazil GDP -3.8% y/y OPEC agrees to curb oil production
US shale production +13% y/y
2.2 mb/d oil oversupply
Brazil GDP +1% y/y
10yr Treasury yields going up
• EBITDAR decreases with depreciated currency due to fuel expense in USD
• EBITDAR correlations: Azul and BRL: 91%, Gol and BRL: 60%; Latam
and CLP: 43%; Avianca and COP: 32%
BC
P T
op P
icks/
07
/06
/20
18
SWAP (BRAZIL):AZULBZ -> GOLLBZ
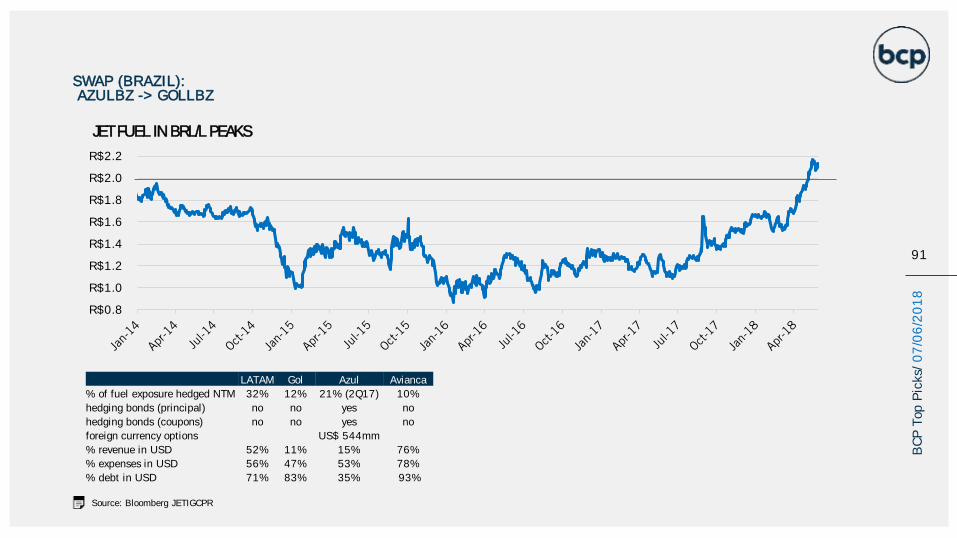
JET FUEL IN BRL/L PEAKS
Source: Bloomberg JETIGCPR
91
R$0.8
R$1.0
R$1.2
R$1.4
R$1.6
R$1.8
R$2.0
R$2.2
BC
P T
op P
icks/
07
/06
/20
18
LATAM Gol Azul Avianca
% of fuel exposure hedged NTM 32% 12% 21% (2Q17) 10%
hedging bonds (principal) no no yes no
hedging bonds (coupons) no no yes no
foreign currency options US$ 544mm
% revenue in USD 52% 11% 15% 76%
% expenses in USD 56% 47% 53% 78%
% debt in USD 71% 83% 35% 93%
SWAP (BRAZIL):AZULBZ -> GOLLBZ
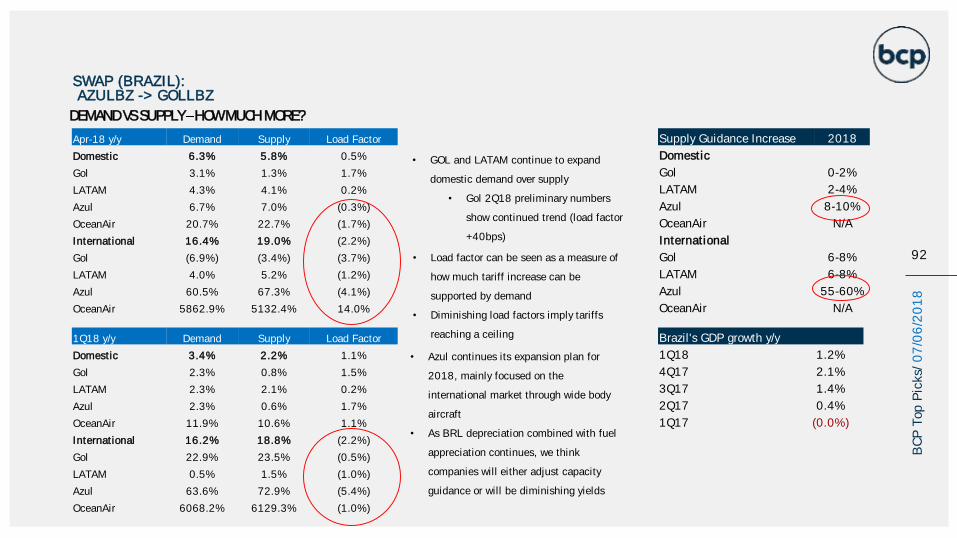
DEMAND VS SUPPLY HOW MUCH MORE?
92
1Q18 y/y Demand Supply Load Factor
Domestic 3.4% 2.2% 1.1%
Gol 2.3% 0.8% 1.5%
LATAM 2.3% 2.1% 0.2%
Azul 2.3% 0.6% 1.7%
OceanAir 11.9% 10.6% 1.1%
International 16.2% 18.8% (2.2%)
Gol 22.9% 23.5% (0.5%)
LATAM 0.5% 1.5% (1.0%)
Azul 63.6% 72.9% (5.4%)
OceanAir 6068.2% 6129.3% (1.0%)
Apr-18 y/y Demand Supply Load Factor
Domestic 6.3% 5.8% 0.5%
Gol 3.1% 1.3% 1.7%
LATAM 4.3% 4.1% 0.2%
Azul 6.7% 7.0% (0.3%)
OceanAir 20.7% 22.7% (1.7%)
International 16.4% 19.0% (2.2%)
Gol (6.9%) (3.4%) (3.7%)
LATAM 4.0% 5.2% (1.2%)
Azul 60.5% 67.3% (4.1%)
OceanAir 5862.9% 5132.4% 14.0%
Supply Guidance Increase 2018
Domestic
Gol 0-2%
LATAM 2-4%
Azul 8-10%
OceanAir N/A
International
Gol 6-8%
LATAM 6-8%
Azul 55-60%
OceanAir N/A
• Azul continues its expansion plan for
2018, mainly focused on the
international market through wide body
aircraft
• As BRL depreciation combined with fuel
appreciation continues, we think
companies will either adjust capacity
guidance or will be diminishing yields
Brazil's GDP growth y/y
1Q18 1.2%
4Q17 2.1%
3Q17 1.4%
2Q17 0.4%
1Q17 (0.0%)
• Load factor can be seen as a measure of
how much tariff increase can be
supported by demand
• Diminishing load factors imply tariffs
reaching a ceiling
• GOL and LATAM continue to expand
domestic demand over supply
• Gol 2Q18 preliminary numbers
show continued trend (load factor
+40bps)
BC
P T
op P
icks/
07
/06
/20
18
SWAP (BRAZIL):AZULBZ -> GOLLBZ
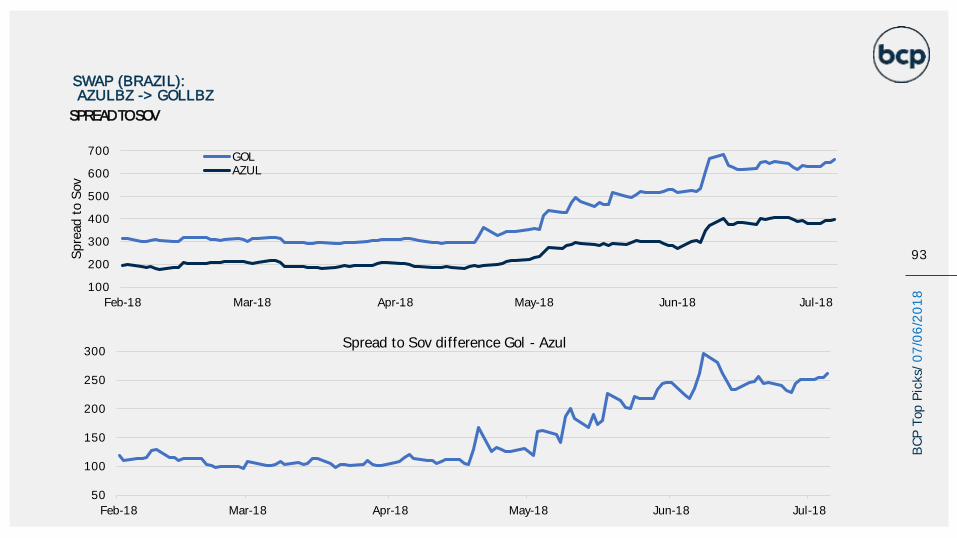
SPREAD TO SOV
93
BC
P T
op P
icks/
07
/06
/20
18
SWAP (BRAZIL):AZULBZ -> GOLLBZ
100
200
300
400
500
600
700
Feb-18 Mar-18 Apr-18 May-18 Jun-18 Jul-18
Spre
ad t
o S
ov
GOLAZUL
50
100
150
200
250
300
Feb-18 Mar-18 Apr-18 May-18 Jun-18 Jul-18
Spread to Sov difference Gol - Azul
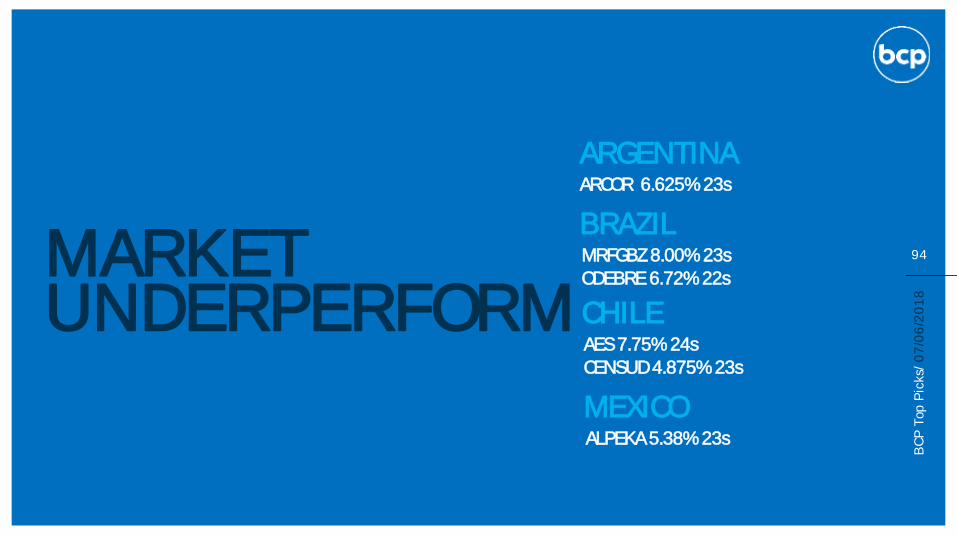
MARKET UNDERPERFORM
ARCOR 6.625% 23s
ARGENTINA
MRFGBZ 8.00% 23sODEBRE 6.72% 22s
BRAZIL94
BC
P T
op P
icks/
07
/06
/20
18
AES 7.75% 24sCENSUD 4.875% 23s
CHILE
ALPEKA 5.38% 23s
MEXICO
ARGENTINA
95
BC
P T
op P
icks/
07
/06
/20
18
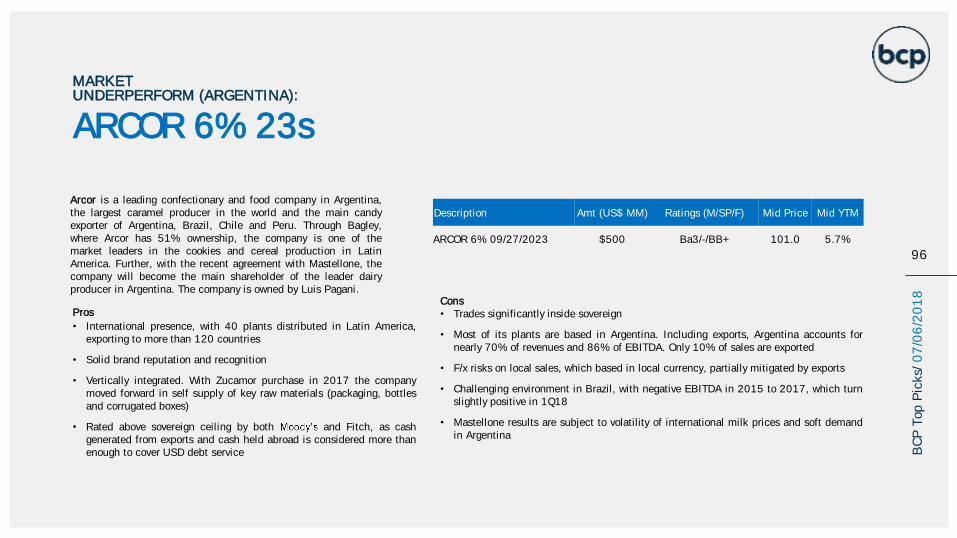
ARCOR 6% 23s
MARKET UNDERPERFORM (ARGENTINA):
Pros
• International presence, with 40 plants distributed in Latin America,exporting to more than 120 countries
• Solid brand reputation and recognition
• Vertically integrated. With Zucamor purchase in 2017 the companymoved forward in self supply of key raw materials (packaging, bottlesand corrugated boxes)
• Rated above sovereign ceiling by both and Fitch, as cashgenerated from exports and cash held abroad is considered more thanenough to cover USD debt service
Cons• Trades significantly inside sovereign
• Most of its plants are based in Argentina. Including exports, Argentina accounts fornearly 70% of revenues and 86% of EBITDA. Only 10% of sales are exported
• F/x risks on local sales, which based in local currency, partially mitigated by exports
• Challenging environment in Brazil, with negative EBITDA in 2015 to 2017, which turnslightly positive in 1Q18
• Mastellone results are subject to volatility of international milk prices and soft demandin Argentina
Arcor is a leading confectionary and food company in Argentina,the largest caramel producer in the world and the main candyexporter of Argentina, Brazil, Chile and Peru. Through Bagley,where Arcor has 51% ownership, the company is one of themarket leaders in the cookies and cereal production in LatinAmerica. Further, with the recent agreement with Mastellone, thecompany will become the main shareholder of the leader dairyproducer in Argentina. The company is owned by Luis Pagani.
Description Amt (US$ MM) Ratings (M/SP/F) Mid Price Mid YTM
ARCOR 6% 09/27/2023 $500 Ba3/-/BB+ 101.0 5.7%
96
BC
P T
op P
icks/
07
/06
/20
18
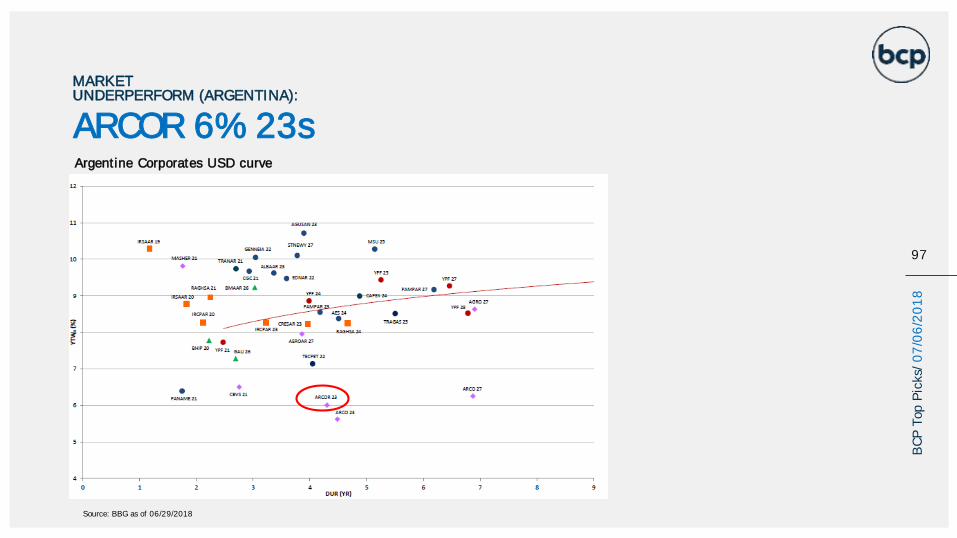
Argentine Corporates USD curve
97
BC
P T
op P
icks/
07
/06
/20
18
ARCOR 6% 23s
MARKET UNDERPERFORM (ARGENTINA):
Source: BBG as of 06/29/2018
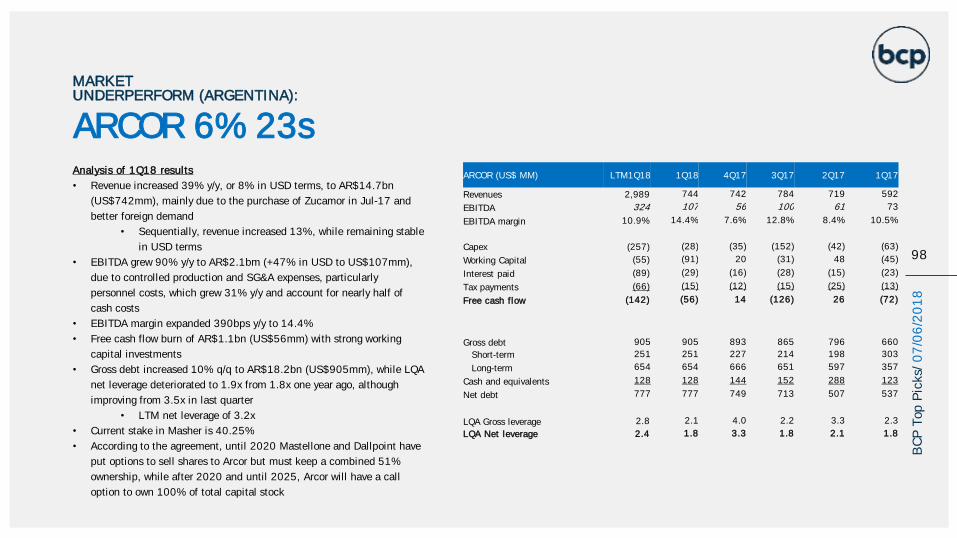
Analysis of 1Q18 results
• Revenue increased 39% y/y, or 8% in USD terms, to AR$14.7bn
(US$742mm), mainly due to the purchase of Zucamor in Jul-17 and
better foreign demand
• Sequentially, revenue increased 13%, while remaining stable
in USD terms
• EBITDA grew 90% y/y to AR$2.1bm (+47% in USD to US$107mm),
due to controlled production and SG&A expenses, particularly
personnel costs, which grew 31% y/y and account for nearly half of
cash costs
• EBITDA margin expanded 390bps y/y to 14.4%
• Free cash flow burn of AR$1.1bn (US$56mm) with strong working
capital investments
• Gross debt increased 10% q/q to AR$18.2bn (US$905mm), while LQA
net leverage deteriorated to 1.9x from 1.8x one year ago, although
improving from 3.5x in last quarter
• LTM net leverage of 3.2x
• Current stake in Masher is 40.25%
• According to the agreement, until 2020 Mastellone and Dallpoint have
put options to sell shares to Arcor but must keep a combined 51%
ownership, while after 2020 and until 2025, Arcor will have a call
option to own 100% of total capital stock
ARCOR (US$ MM) LTM1Q18 1Q18 4Q17 3Q17 2Q17 1Q17
Revenues 2,989 744 742 784 719 592
EBITDA 324 107 56 100 61 73
EBITDA margin 10.9% 14.4% 7.6% 12.8% 8.4% 10.5%
Capex (257) (28) (35) (152) (42) (63)
Working Capital (55) (91) 20 (31) 48 (45)
Interest paid (89) (29) (16) (28) (15) (23)
Tax payments (66) (15) (12) (15) (25) (13)
Free cash flow (142) (56) 14 (126) 26 (72)
Gross debt 905 905 893 865 796 660
Short-term 251 251 227 214 198 303
Long-term 654 654 666 651 597 357
Cash and equivalents 128 128 144 152 288 123
Net debt 777 777 749 713 507 537
LQA Gross leverage 2.8 2.1 4.0 2.2 3.3 2.3
LQA Net leverage 2.4 1.8 3.3 1.8 2.1 1.8
MARKET UNDERPERFORM (ARGENTINA):
ARCOR 6% 23s
BC
P T
op P
icks/
07
/06
/20
18
98
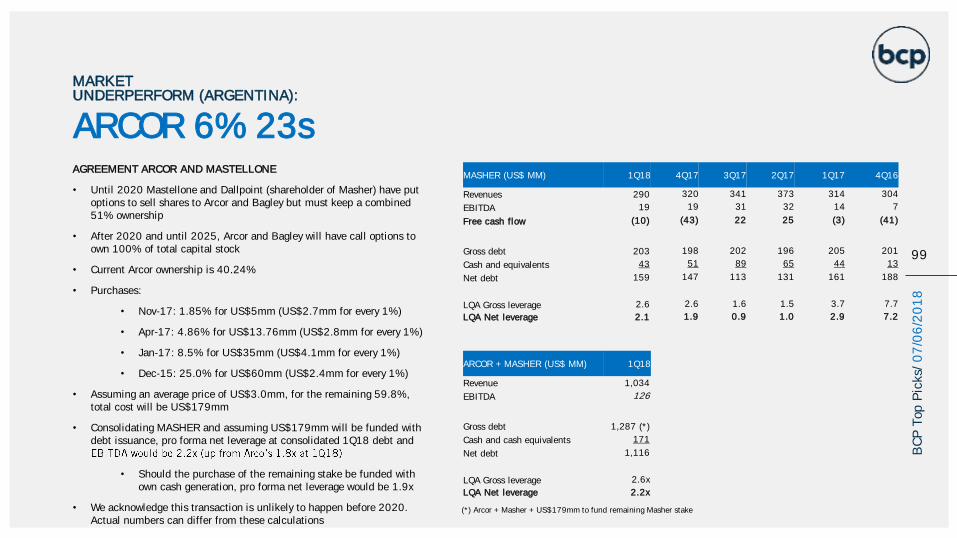
AGREEMENT ARCOR AND MASTELLONE
• Until 2020 Mastellone and Dallpoint (shareholder of Masher) have put options to sell shares to Arcor and Bagley but must keep a combined 51% ownership
• After 2020 and until 2025, Arcor and Bagley will have call options to own 100% of total capital stock
• Current Arcor ownership is 40.24%
• Purchases:
• Nov-17: 1.85% for US$5mm (US$2.7mm for every 1%)
• Apr-17: 4.86% for US$13.76mm (US$2.8mm for every 1%)
• Jan-17: 8.5% for US$35mm (US$4.1mm for every 1%)
• Dec-15: 25.0% for US$60mm (US$2.4mm for every 1%)
• Assuming an average price of US$3.0mm, for the remaining 59.8%, total cost will be US$179mm
• Consolidating MASHER and assuming US$179mm will be funded with debt issuance, pro forma net leverage at consolidated 1Q18 debt and
• Should the purchase of the remaining stake be funded with own cash generation, pro forma net leverage would be 1.9x
• We acknowledge this transaction is unlikely to happen before 2020. Actual numbers can differ from these calculations
MASHER (US$ MM) 1Q18 4Q17 3Q17 2Q17 1Q17 4Q16
Revenues 290 320 341 373 314 304
EBITDA 19 19 31 32 14 7
Free cash flow (10) (43) 22 25 (3) (41)
Gross debt 203 198 202 196 205 201
Cash and equivalents 43 51 89 65 44 13
Net debt 159 147 113 131 161 188
LQA Gross leverage 2.6 2.6 1.6 1.5 3.7 7.7
LQA Net leverage 2.1 1.9 0.9 1.0 2.9 7.2
MARKET UNDERPERFORM (ARGENTINA):
ARCOR 6% 23s
BC
P T
op P
icks/
07
/06
/20
18
99
ARCOR + MASHER (US$ MM) 1Q18
Revenue 1,034
EBITDA 126
Gross debt 1,287 (*)
Cash and cash equivalents 171
Net debt 1,116
LQA Gross leverage 2.6x
LQA Net leverage 2.2x
(*) Arcor + Masher + US$179mm to fund remaining Masher stake
100
BRAZIL
BC
P T
op P
icks/
07
/06
/20
18
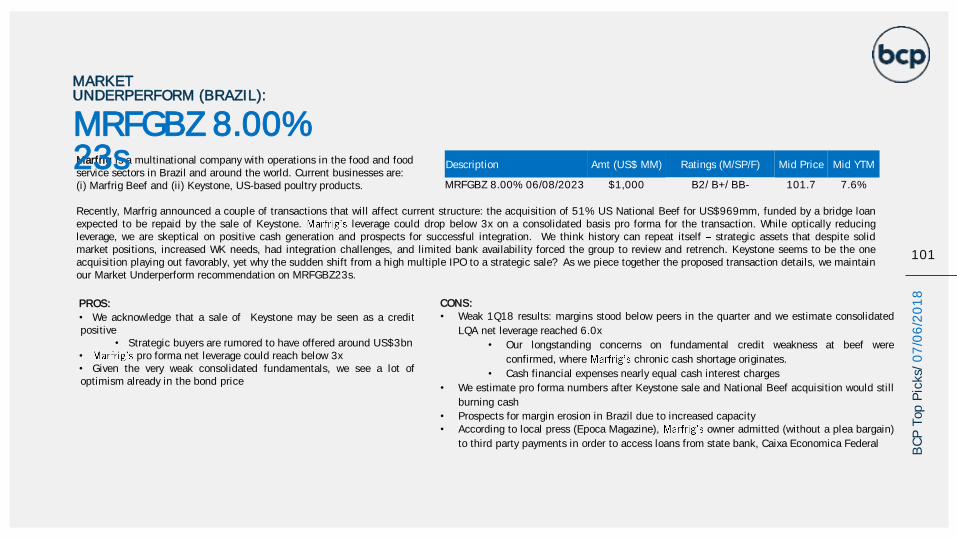
Marfrig is a multinational company with operations in the food and foodservice sectors in Brazil and around the world. Current businesses are:(i) Marfrig Beef and (ii) Keystone, US-based poultry products.
Recently, Marfrig announced a couple of transactions that will affect current structure: the acquisition of 51% US National Beef for US$969mm, funded by a bridge loanexpected to be repaid by the sale of Keystone. leverage could drop below 3x on a consolidated basis pro forma for the transaction. While optically reducingleverage, we are skeptical on positive cash generation and prospects for successful integration. We think history can repeat itself strategic assets that despite solidmarket positions, increased WK needs, had integration challenges, and limited bank availability forced the group to review and retrench. Keystone seems to be the oneacquisition playing out favorably, yet why the sudden shift from a high multiple IPO to a strategic sale? As we piece together the proposed transaction details, we maintainour Market Underperform recommendation on MRFGBZ23s.
MARKET UNDERPERFORM (BRAZIL):
MRFGBZ 8.00% 23s
PROS:
• We acknowledge that a sale of Keystone may be seen as a creditpositive
• Strategic buyers are rumored to have offered around US$3bn• pro forma net leverage could reach below 3x• Given the very weak consolidated fundamentals, we see a lot ofoptimism already in the bond price
CONS:• Weak 1Q18 results: margins stood below peers in the quarter and we estimate consolidated
LQA net leverage reached 6.0x
• Our longstanding concerns on fundamental credit weakness at beef were
confirmed, where chronic cash shortage originates.
• Cash financial expenses nearly equal cash interest charges
• We estimate pro forma numbers after Keystone sale and National Beef acquisition would still
burning cash
• Prospects for margin erosion in Brazil due to increased capacity• According to local press (Epoca Magazine), owner admitted (without a plea bargain)
to third party payments in order to access loans from state bank, Caixa Economica Federal
Description Amt (US$ MM) Ratings (M/SP/F) Mid Price Mid YTM
MRFGBZ 8.00% 06/08/2023 $1,000 B2/ B+/ BB- 101.7 7.6%
101
BC
P T
op P
icks/
07
/06
/20
18
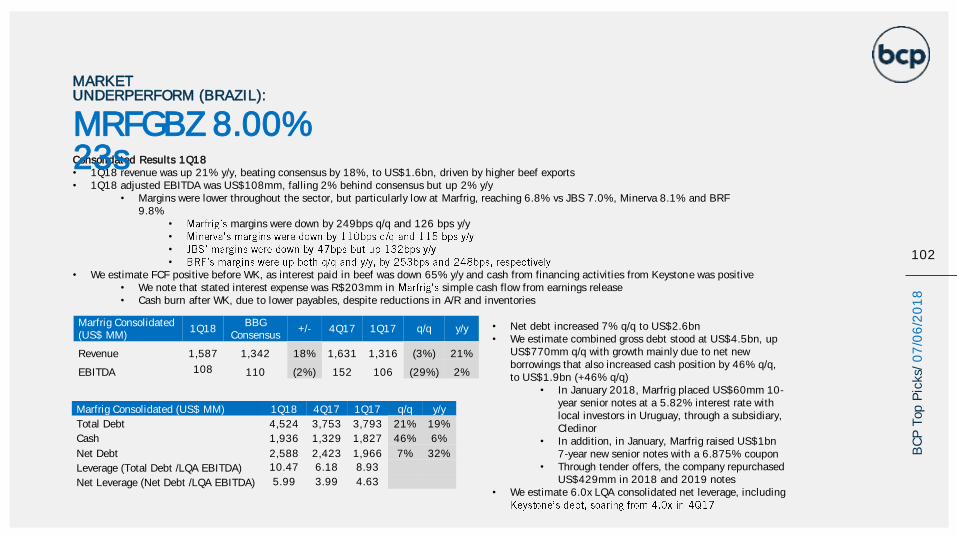
Consolidated Results 1Q18• 1Q18 revenue was up 21% y/y, beating consensus by 18%, to US$1.6bn, driven by higher beef exports • 1Q18 adjusted EBITDA was US$108mm, falling 2% behind consensus but up 2% y/y
• Margins were lower throughout the sector, but particularly low at Marfrig, reaching 6.8% vs JBS 7.0%, Minerva 8.1% and BRF 9.8%
• margins were down by 249bps q/q and 126 bps y/y•
•
•
• We estimate FCF positive before WK, as interest paid in beef was down 65% y/y and cash from financing activities from Keystone was positive• We note that stated interest expense was R$203mm in simple cash flow from earnings release• Cash burn after WK, due to lower payables, despite reductions in A/R and inventories
MARKET UNDERPERFORM (BRAZIL):
MRFGBZ 8.00% 23s
102
BC
P T
op P
icks/
07
/06
/20
18
Marfrig Consolidated (US$ MM)
1Q18BBG
Consensus+/- 4Q17 1Q17 q/q y/y
Revenue 1,587 1,342 18% 1,631 1,316 (3%) 21%
EBITDA 108 110 (2%) 152 106 (29%) 2%
Marfrig Consolidated (US$ MM) 1Q18 4Q17 1Q17 q/q y/y
Total Debt 4,524 3,753 3,793 21% 19%
Cash 1,936 1,329 1,827 46% 6%
Net Debt 2,588 2,423 1,966 7% 32%
Leverage (Total Debt /LQA EBITDA) 10.47 6.18 8.93
Net Leverage (Net Debt /LQA EBITDA) 5.99 3.99 4.63
• Net debt increased 7% q/q to US$2.6bn • We estimate combined gross debt stood at US$4.5bn, up
US$770mm q/q with growth mainly due to net new borrowings that also increased cash position by 46% q/q, to US$1.9bn (+46% q/q)
• In January 2018, Marfrig placed US$60mm 10-year senior notes at a 5.82% interest rate with local investors in Uruguay, through a subsidiary, Cledinor
• In addition, in January, Marfrig raised US$1bn 7-year new senior notes with a 6.875% coupon
• Through tender offers, the company repurchased US$429mm in 2018 and 2019 notes
• We estimate 6.0x LQA consolidated net leverage, including
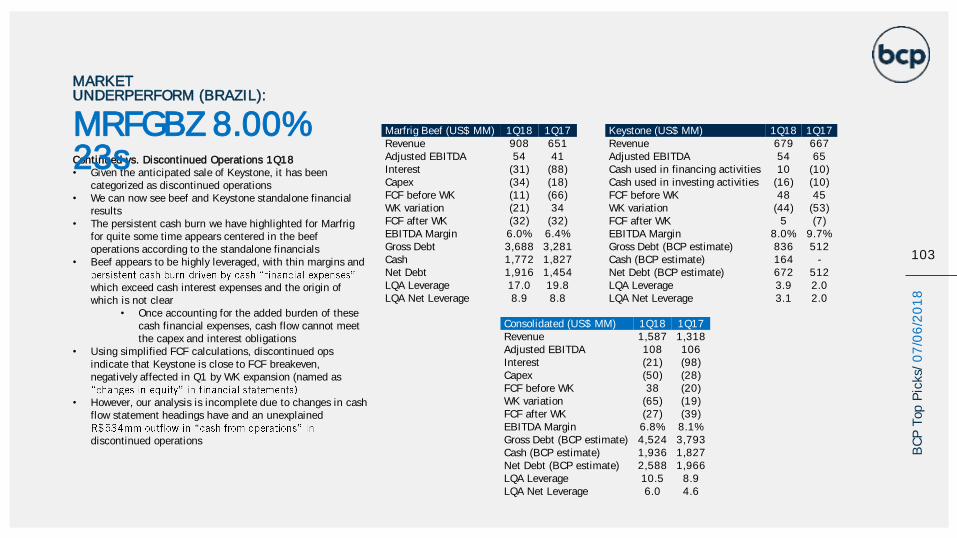
Continued vs. Discontinued Operations 1Q18• Given the anticipated sale of Keystone, it has been
categorized as discontinued operations• We can now see beef and Keystone standalone financial
results• The persistent cash burn we have highlighted for Marfrig
for quite some time appears centered in the beef operations according to the standalone financials
• Beef appears to be highly leveraged, with thin margins and
which exceed cash interest expenses and the origin of which is not clear
• Once accounting for the added burden of these cash financial expenses, cash flow cannot meet the capex and interest obligations
• Using simplified FCF calculations, discontinued ops indicate that Keystone is close to FCF breakeven, negatively affected in Q1 by WK expansion (named as
• However, our analysis is incomplete due to changes in cash flow statement headings have and an unexplained
discontinued operations
MARKET UNDERPERFORM (BRAZIL):
MRFGBZ 8.00% 23s
103
BC
P T
op P
icks/
07
/06
/20
18
Marfrig Beef (US$ MM) 1Q18 1Q17Revenue 908 651Adjusted EBITDA 54 41Interest (31) (88)Capex (34) (18)FCF before WK (11) (66)WK variation (21) 34FCF after WK (32) (32)EBITDA Margin 6.0% 6.4%Gross Debt 3,688 3,281Cash 1,772 1,827Net Debt 1,916 1,454LQA Leverage 17.0 19.8LQA Net Leverage 8.9 8.8
Keystone (US$ MM) 1Q18 1Q17Revenue 679 667Adjusted EBITDA 54 65Cash used in financing activities 10 (10)Cash used in investing activities (16) (10)FCF before WK 48 45WK variation (44) (53)FCF after WK 5 (7)EBITDA Margin 8.0% 9.7%Gross Debt (BCP estimate) 836 512Cash (BCP estimate) 164 -Net Debt (BCP estimate) 672 512LQA Leverage 3.9 2.0LQA Net Leverage 3.1 2.0
Consolidated (US$ MM) 1Q18 1Q17Revenue 1,587 1,318Adjusted EBITDA 108 106Interest (21) (98)Capex (50) (28)FCF before WK 38 (20)WK variation (65) (19)FCF after WK (27) (39)EBITDA Margin 6.8% 8.1%Gross Debt (BCP estimate) 4,524 3,793Cash (BCP estimate) 1,936 1,827Net Debt (BCP estimate) 2,588 1,966LQA Leverage 10.5 8.9LQA Net Leverage 6.0 4.6
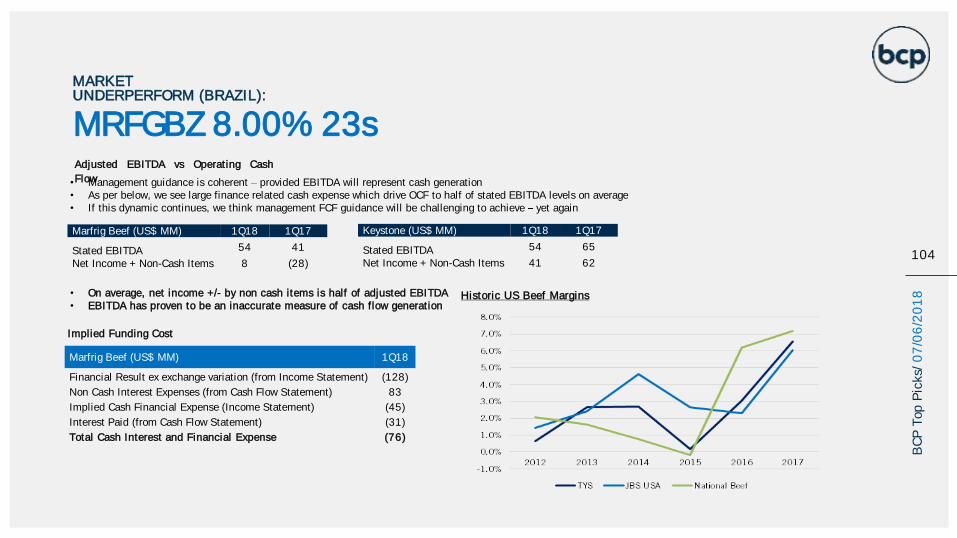
MARKET UNDERPERFORM (BRAZIL):
MRFGBZ 8.00% 23s
104
BC
P T
op P
icks/
07
/06
/20
18
Adjusted EBITDA vs Operating Cash
Flow
• On average, net income +/- by non cash items is half of adjusted EBITDA• EBITDA has proven to be an inaccurate measure of cash flow generation
Marfrig Beef (US$ MM) 1Q18
Financial Result ex exchange variation (from Income Statement) (128)
Non Cash Interest Expenses (from Cash Flow Statement) 83
Implied Cash Financial Expense (Income Statement) (45)
Interest Paid (from Cash Flow Statement) (31)
Total Cash Interest and Financial Expense (76)
• Management guidance is coherent provided EBITDA will represent cash generation• As per below, we see large finance related cash expense which drive OCF to half of stated EBITDA levels on average• If this dynamic continues, we think management FCF guidance will be challenging to achieve yet again
Implied Funding Cost
Marfrig Beef (US$ MM) 1Q18 1Q17
Stated EBITDA 54 41
Net Income + Non-Cash Items 8 (28)
Keystone (US$ MM) 1Q18 1Q17
Stated EBITDA 54 65
Net Income + Non-Cash Items 41 62
Historic US Beef Margins
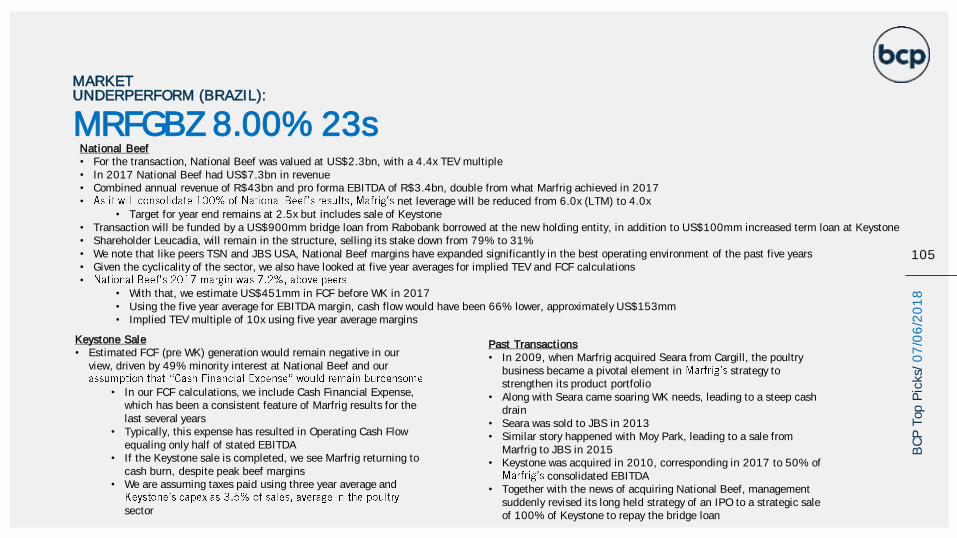
105
National Beef• For the transaction, National Beef was valued at US$2.3bn, with a 4.4x TEV multiple• In 2017 National Beef had US$7.3bn in revenue• Combined annual revenue of R$43bn and pro forma EBITDA of R$3.4bn, double from what Marfrig achieved in 2017• net leverage will be reduced from 6.0x (LTM) to 4.0x
• Target for year end remains at 2.5x but includes sale of Keystone• Transaction will be funded by a US$900mm bridge loan from Rabobank borrowed at the new holding entity, in addition to US$100mm increased term loan at Keystone• Shareholder Leucadia, will remain in the structure, selling its stake down from 79% to 31%• We note that like peers TSN and JBS USA, National Beef margins have expanded significantly in the best operating environment of the past five years• Given the cyclicality of the sector, we also have looked at five year averages for implied TEV and FCF calculations•
• With that, we estimate US$451mm in FCF before WK in 2017• Using the five year average for EBITDA margin, cash flow would have been 66% lower, approximately US$153mm• Implied TEV multiple of 10x using five year average margins
Past Transactions• In 2009, when Marfrig acquired Seara from Cargill, the poultry
business became a pivotal element in strategy to strengthen its product portfolio
• Along with Seara came soaring WK needs, leading to a steep cash drain
• Seara was sold to JBS in 2013• Similar story happened with Moy Park, leading to a sale from
Marfrig to JBS in 2015• Keystone was acquired in 2010, corresponding in 2017 to 50% of
consolidated EBITDA• Together with the news of acquiring National Beef, management
suddenly revised its long held strategy of an IPO to a strategic sale of 100% of Keystone to repay the bridge loan
Keystone Sale• Estimated FCF (pre WK) generation would remain negative in our
view, driven by 49% minority interest at National Beef and our
• In our FCF calculations, we include Cash Financial Expense, which has been a consistent feature of Marfrig results for the last several years
• Typically, this expense has resulted in Operating Cash Flow equaling only half of stated EBITDA
• If the Keystone sale is completed, we see Marfrig returning to cash burn, despite peak beef margins
• We are assuming taxes paid using three year average and
sector
BC
P T
op P
icks/
07
/06
/20
18
MARKET UNDERPERFORM (BRAZIL):
MRFGBZ 8.00% 23s
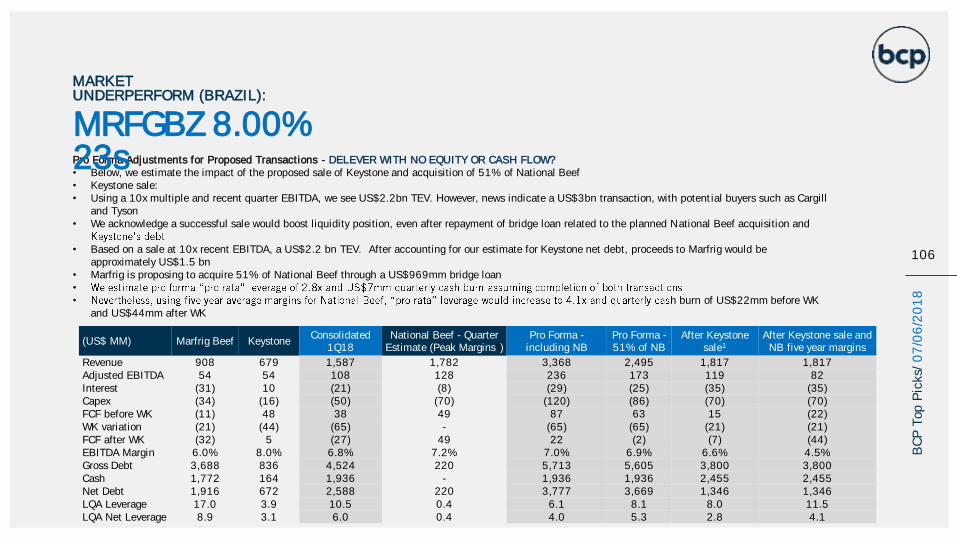
Pro Forma Adjustments for Proposed Transactions - DELEVER WITH NO EQUITY OR CASH FLOW?• Below, we estimate the impact of the proposed sale of Keystone and acquisition of 51% of National Beef• Keystone sale: • Using a 10x multiple and recent quarter EBITDA, we see US$2.2bn TEV. However, news indicate a US$3bn transaction, with potential buyers such as Cargill
and Tyson • We acknowledge a successful sale would boost liquidity position, even after repayment of bridge loan related to the planned National Beef acquisition and
• Based on a sale at 10x recent EBITDA, a US$2.2 bn TEV. After accounting for our estimate for Keystone net debt, proceeds to Marfrig would be approximately US$1.5 bn
• Marfrig is proposing to acquire 51% of National Beef through a US$969mm bridge loan•
• h burn of US$22mm before WK and US$44mm after WK
MARKET UNDERPERFORM (BRAZIL):
MRFGBZ 8.00% 23s
106
BC
P T
op P
icks/
07
/06
/20
18
(US$ MM) Marfrig Beef KeystoneConsolidated
1Q18National Beef - Quarter
Estimate (Peak Margins?)Pro Forma -
including NBPro Forma -51% of NB
After Keystone sale1
After Keystone sale and NB five year margins
Revenue 908 679 1,587 1,782 3,368 2,495 1,817 1,817Adjusted EBITDA 54 54 108 128 236 173 119 82Interest (31) 10 (21) (8) (29) (25) (35) (35)Capex (34) (16) (50) (70) (120) (86) (70) (70)FCF before WK (11) 48 38 49 87 63 15 (22)WK variation (21) (44) (65) - (65) (65) (21) (21)FCF after WK (32) 5 (27) 49 22 (2) (7) (44)EBITDA Margin 6.0% 8.0% 6.8% 7.2% 7.0% 6.9% 6.6% 4.5%Gross Debt 3,688 836 4,524 220 5,713 5,605 3,800 3,800Cash 1,772 164 1,936 - 1,936 1,936 2,455 2,455Net Debt 1,916 672 2,588 220 3,777 3,669 1,346 1,346LQA Leverage 17.0 3.9 10.5 0.4 6.1 8.1 8.0 11.5LQA Net Leverage 8.9 3.1 6.0 0.4 4.0 5.3 2.8 4.1
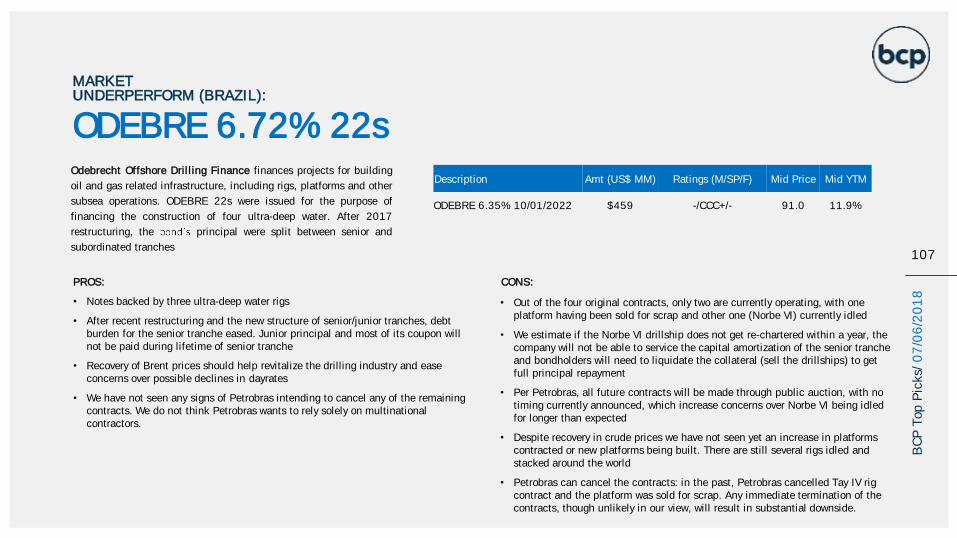
ODEBRE 6.72% 22sOdebrecht Offshore Drilling Finance finances projects for building
oil and gas related infrastructure, including rigs, platforms and other
subsea operations. ODEBRE 22s were issued for the purpose of
financing the construction of four ultra-deep water. After 2017
restructuring, the principal were split between senior and
subordinated tranches
PROS:
• Notes backed by three ultra-deep water rigs
• After recent restructuring and the new structure of senior/junior tranches, debt burden for the senior tranche eased. Junior principal and most of its coupon will not be paid during lifetime of senior tranche
• Recovery of Brent prices should help revitalize the drilling industry and ease concerns over possible declines in dayrates
• We have not seen any signs of Petrobras intending to cancel any of the remaining contracts. We do not think Petrobras wants to rely solely on multinational contractors.
CONS:
• Out of the four original contracts, only two are currently operating, with one platform having been sold for scrap and other one (Norbe VI) currently idled
• We estimate if the Norbe VI drillship does not get re-chartered within a year, the company will not be able to service the capital amortization of the senior tranche and bondholders will need to liquidate the collateral (sell the drillships) to get full principal repayment
• Per Petrobras, all future contracts will be made through public auction, with no timing currently announced, which increase concerns over Norbe VI being idled for longer than expected
• Despite recovery in crude prices we have not seen yet an increase in platforms contracted or new platforms being built. There are still several rigs idled and stacked around the world
• Petrobras can cancel the contracts: in the past, Petrobras cancelled Tay IV rig contract and the platform was sold for scrap. Any immediate termination of the contracts, though unlikely in our view, will result in substantial downside.
MARKET UNDERPERFORM (BRAZIL):
Description Amt (US$ MM) Ratings (M/SP/F) Mid Price Mid YTM
ODEBRE 6.35% 10/01/2022 $459 -/CCC+/- 91.0 11.9%
107
BC
P T
op P
icks/
07
/06
/20
18
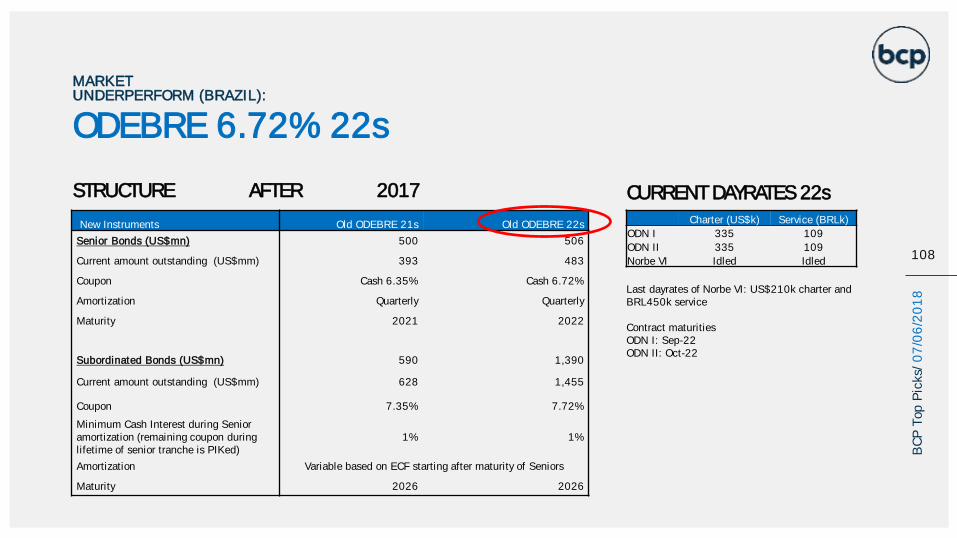
ODEBRE 6.72% 22s
STRUCTURE AFTER 2017
RESTRUCTURING
MARKET UNDERPERFORM (BRAZIL):
108
BC
P T
op P
icks/
07
/06
/20
18
New Instruments Old ODEBRE 21s Old ODEBRE 22s
Senior Bonds (US$mn) 500 506
Current amount outstanding (US$mm) 393 483
Coupon Cash 6.35% Cash 6.72%
Amortization Quarterly Quarterly
Maturity 2021 2022
Subordinated Bonds (US$mn) 590 1,390
Current amount outstanding (US$mm) 628 1,455
Coupon 7.35% 7.72%
Minimum Cash Interest during Senior amortization (remaining coupon during lifetime of senior tranche is PIKed)
1% 1%
Amortization Variable based on ECF starting after maturity of Seniors
Maturity 2026 2026
Charter (US$k) Service (BRLk)
ODN I 335 109
ODN II 335 109
Norbe VI Idled Idled
CURRENT DAYRATES 22s
Last dayrates of Norbe VI: US$210k charter and BRL450k service
Contract maturitiesODN I: Sep-22ODN II: Oct-22
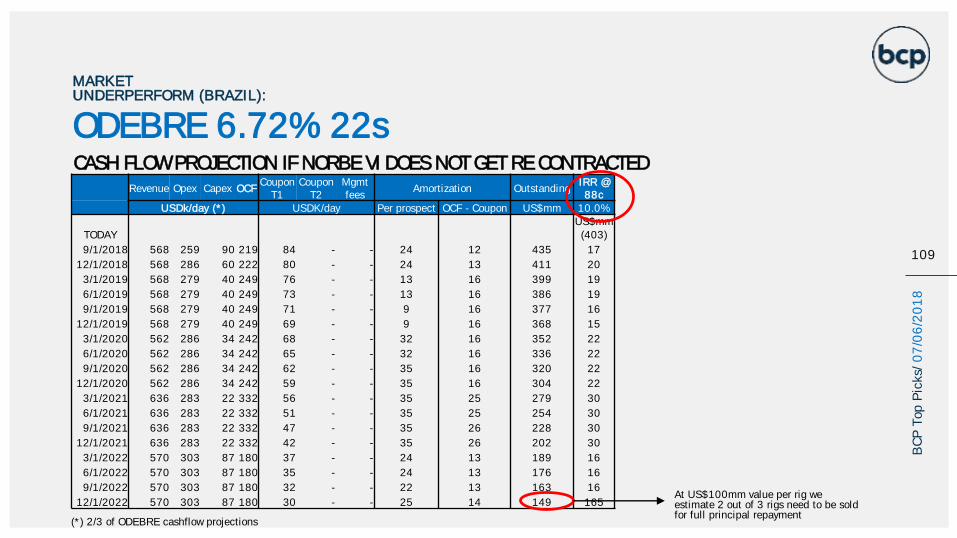
MARKET UNDERPERFORM (BRAZIL):
109
Revenue Opex Capex OCFCoupon
T1Coupon
T2Mgmtfees
Amortization OutstandingIRR @ 88c
USDk/day (*) USDK/day Per prospect OCF - Coupon US$mm 10.0%US$mm
TODAY (403)
9/1/2018 568 259 90 219 84 - - 24 12 435 17
12/1/2018 568 286 60 222 80 - - 24 13 411 20
3/1/2019 568 279 40 249 76 - - 13 16 399 19
6/1/2019 568 279 40 249 73 - - 13 16 386 19
9/1/2019 568 279 40 249 71 - - 9 16 377 16
12/1/2019 568 279 40 249 69 - - 9 16 368 15
3/1/2020 562 286 34 242 68 - - 32 16 352 22
6/1/2020 562 286 34 242 65 - - 32 16 336 22
9/1/2020 562 286 34 242 62 - - 35 16 320 22
12/1/2020 562 286 34 242 59 - - 35 16 304 22
3/1/2021 636 283 22 332 56 - - 35 25 279 30
6/1/2021 636 283 22 332 51 - - 35 25 254 30
9/1/2021 636 283 22 332 47 - - 35 26 228 30
12/1/2021 636 283 22 332 42 - - 35 26 202 30
3/1/2022 570 303 87 180 37 - - 24 13 189 16
6/1/2022 570 303 87 180 35 - - 24 13 176 16
9/1/2022 570 303 87 180 32 - - 22 13 163 16
12/1/2022 570 303 87 180 30 - - 25 14 149 165
ODEBRE 6.72% 22sCASH FLOW PROJECTION IF NORBE VI DOES NOT GET RE CONTRACTED
BC
P T
op P
icks/
07
/06
/20
18
At US$100mm value per rig we estimate 2 out of 3 rigs need to be sold for full principal repayment
(*) 2/3 of ODEBRE cashflow projections
110
CHILE
BC
P T
op P
icks/
07
/06
/20
18
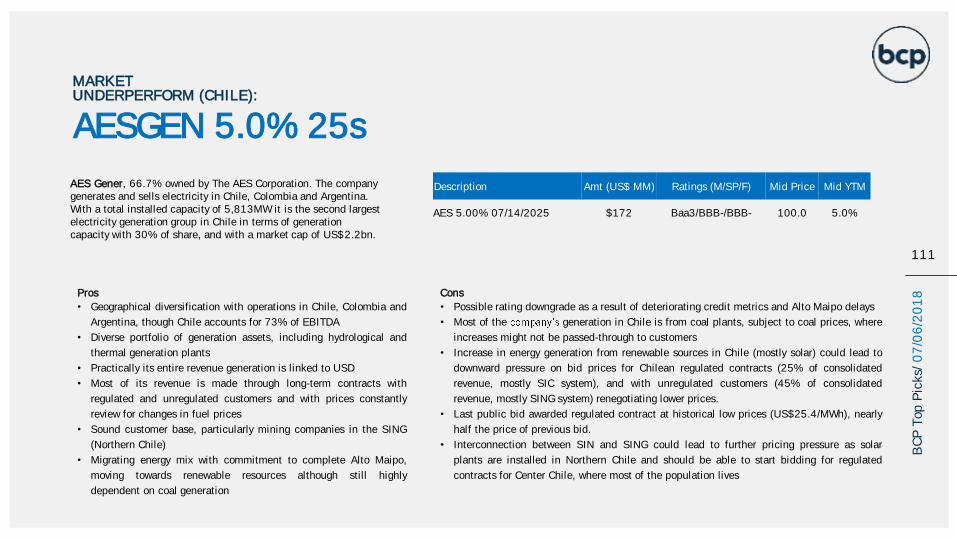
AESGEN 5.0% 25s
MARKET UNDERPERFORM (CHILE):
Pros
• Geographical diversification with operations in Chile, Colombia and
Argentina, though Chile accounts for 73% of EBITDA
• Diverse portfolio of generation assets, including hydrological and
thermal generation plants
• Practically its entire revenue generation is linked to USD
• Most of its revenue is made through long-term contracts with
regulated and unregulated customers and with prices constantly
review for changes in fuel prices
• Sound customer base, particularly mining companies in the SING
(Northern Chile)
• Migrating energy mix with commitment to complete Alto Maipo,
moving towards renewable resources although still highly
dependent on coal generation
Cons
• Possible rating downgrade as a result of deteriorating credit metrics and Alto Maipo delays
• Most of the generation in Chile is from coal plants, subject to coal prices, where
increases might not be passed-through to customers
• Increase in energy generation from renewable sources in Chile (mostly solar) could lead to
downward pressure on bid prices for Chilean regulated contracts (25% of consolidated
revenue, mostly SIC system), and with unregulated customers (45% of consolidated
revenue, mostly SING system) renegotiating lower prices.
• Last public bid awarded regulated contract at historical low prices (US$25.4/MWh), nearly
half the price of previous bid.
• Interconnection between SIN and SING could lead to further pricing pressure as solar
plants are installed in Northern Chile and should be able to start bidding for regulated
contracts for Center Chile, where most of the population lives
AES Gener, 66.7% owned by The AES Corporation. The company generates and sells electricity in Chile, Colombia and Argentina. With a total installed capacity of 5,813MW it is the second largest electricity generation group in Chile in terms of generation capacity with 30% of share, and with a market cap of US$2.2bn.
Description Amt (US$ MM) Ratings (M/SP/F) Mid Price Mid YTM
AES 5.00% 07/14/2025 $172 Baa3/BBB-/BBB- 100.0 5.0%
111
BC
P T
op P
icks/
07
/06
/20
18
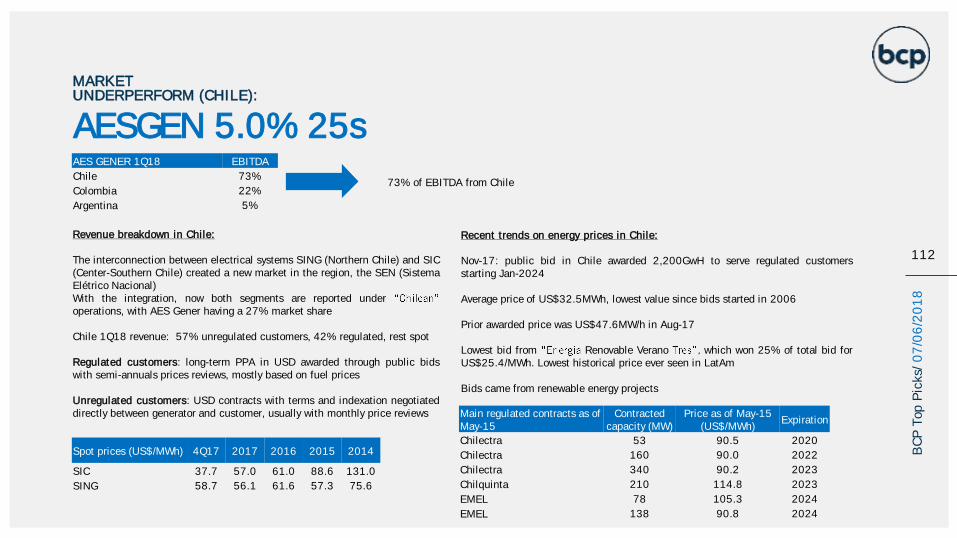
AESGEN 5.0% 25s
MARKET UNDERPERFORM (CHILE):
112
BC
P T
op P
icks/
07
/06
/20
18
AES GENER 1Q18 EBITDA
Chile 73%
Colombia 22%
Argentina 5%
Revenue breakdown in Chile:
The interconnection between electrical systems SING (Northern Chile) and SIC(Center-Southern Chile) created a new market in the region, the SEN (SistemaElétrico Nacional)With the integration, now both segments are reported underoperations, with AES Gener having a 27% market share
Chile 1Q18 revenue: 57% unregulated customers, 42% regulated, rest spot
Regulated customers: long-term PPA in USD awarded through public bidswith semi-annuals prices reviews, mostly based on fuel prices
Unregulated customers: USD contracts with terms and indexation negotiateddirectly between generator and customer, usually with monthly price reviews
Recent trends on energy prices in Chile:
Nov-17: public bid in Chile awarded 2,200GwH to serve regulated customersstarting Jan-2024
Average price of US$32.5MWh, lowest value since bids started in 2006
Prior awarded price was US$47.6MW/h in Aug-17
Lowest bid from Renovable Verano which won 25% of total bid forUS$25.4/MWh. Lowest historical price ever seen in LatAm
Bids came from renewable energy projects
Spot prices (US$/MWh) 4Q17 2017 2016 2015 2014
SIC 37.7 57.0 61.0 88.6 131.0
SING 58.7 56.1 61.6 57.3 75.6
73% of EBITDA from Chile
Main regulated contracts as of May-15
Contracted capacity (MW)
Price as of May-15 (US$/MWh)
Expiration
Chilectra 53 90.5 2020
Chilectra 160 90.0 2022
Chilectra 340 90.2 2023
Chilquinta 210 114.8 2023
EMEL 78 105.3 2024
EMEL 138 90.8 2024
113
ALTO MAIPO PROJECT - UPDATE• Originally budgeted at US$2bn• Project is 64% completed, was in technical default following the contract
termination due to a breach of contract suspended since Jun-17• Alto Maipo subsidiary holds assets of US$1.4mm (book value)
• Alto financial debt, US$613mm, had to be reported as a current liability on the balance sheet as long as the technical default state persisted
• The technical default had no legal implications for holdco as Alto Maipodebt is nonrecourse
• In February 2018, AES Gener signed a fixed-price EPC contract with builder Strabag SpA for the full scope of the project
• Strabag also became a minority shareholder with nearly 7% interest• Geological and construction risks were transferred to Strabug• Contract is guaranteed by Strabag in the form of US$300mm in letters of
credit and a corporate guarantee from Strabag SE (listed in Viena and BBB rated by S&P)
• Company expects project to be fully operational in 2020, with 64% progress reached as of May 2nd 2018
• On May 7, 2018 AES announced that financing partners and herself reached a deal for the financial restructure of the project
• Company announced all documentation has been signed, pending just the completion of closing procedures
• Construction budget will be revised from US$2.5bn to US$3.1bn, plus US$382mm to be paid to Strabag over 20 years upon completion of the project
Lenders will continue to disburse remaining existing commitments of US$688mm plus an additional commitment of US$135mm• Additional expenses for AES includes US$200mm during the construction, based
on progress and debt disbursements and up to US$200mm towards completion, for pending projects costs or to prepay debt
• The first US$200mm will be deployed in a 50/50 basis with debt mostly during 2018 and 2019
• No additional debt to be issued at AES Gener level, increase will be funded from cash from operation
• Upon timely completion of the project Strabag will be entitled to receive payments totaling US$382mm, which will be payable by Alto Maipo over 20-years
• 75% of the remaining project cost will be financed by Strabag and lenders• According to AES Gener, additional contributions are in line with rating agencies
expectations and ensure investment grade rating is not affected• Company expects US$500mm US$600mm of capex to be invested in Alto Maipo
p/ year from now to 2020• Construction continued to move forward, now 65% of project completed• COD Las Lajas and Alfalfal II are expected to be done by 2020
AESGEN 5.0% 25s
MARKET UNDERPERFORM (CHILE):
BC
P T
op P
icks/
07
/06
/20
18
114
ALTO MAIPO RATING AGENCIES ACTIONS
Rating action followed:•
• Fitch Ratings placed AES Gener on Negative Rating Watch• Maintained negative watch Jan-2018
Rating Agencies Timeline:
FITCH AUGUST 2017•
pressured in the short-to-mid-term• Negative watch will be resolved once Alto case has a clear resolution• Debt-to-EBITDA ratio above 4.5x-5x negatively perceived by Fitch• Additional delays on Alto Maipo and significant cost overturns will also be
negatively perceived
• Additional delays on Alto Maipo and significant cost overturns will be negatively perceived
• Gener's rating could be downgraded if debt/EBITDA and FFO/debt remains above 4.0x and below 18%, respectively, after 2018
• Gener's inability to maintain its long-term contracted operations, and/or if it re-contracts at prices significantly below US$60/MWh (2018 real prices) is also likely to trigger downward pressure on the rating
AESGEN 5.0% 25s
MARKET UNDERPERFORM (CHILE):
BC
P T
op P
icks/
07
/06
/20
18
FITCH JANUARY 2018• Fitch maintained negative watch awaiting final decision on Alto Maipo negative
watch won`t be reviewed until a conclusion has been announced• Though, acknowledged agreement with Strabag has been a positive development
for the project
FITCH MAY 2018• Fitch removed negative watch following completion of Alto restructuring
process seeing commitment to complete project with no additional debt at the corporate level as a positive
•
risk associated to the project• Additionally comments on uncertainties in the Chilean power market that could be
a negative for the credit.• Factors that could lead to downgrade:
• Alto Maipo affect credit quality, including additional project cost overruns, construction delays, or a deterioration in Strabag's financial profile that impacts its ability to meet its obligations under the construction contract.
• debt/ EBITDA above 4.0x
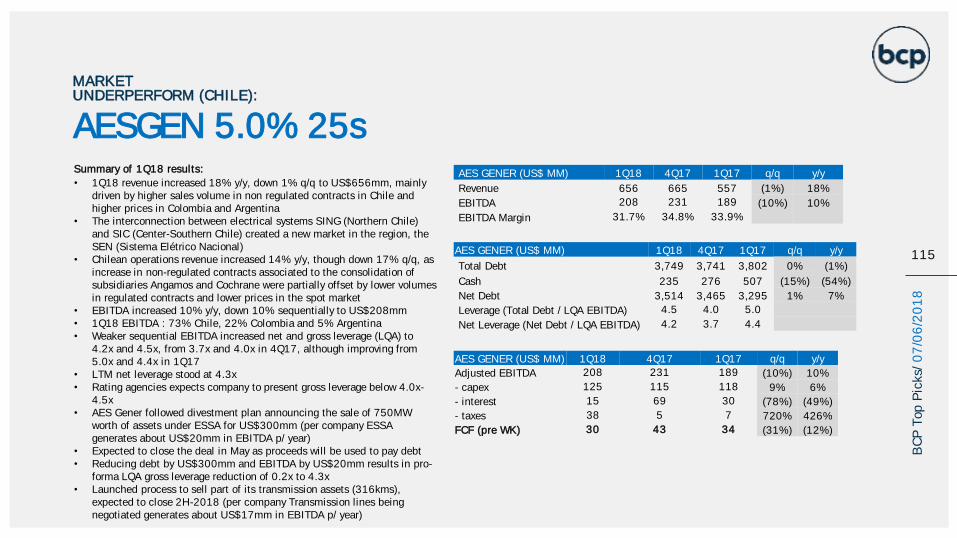
Summary of 1Q18 results:
• 1Q18 revenue increased 18% y/y, down 1% q/q to US$656mm, mainly driven by higher sales volume in non regulated contracts in Chile and higher prices in Colombia and Argentina
• The interconnection between electrical systems SING (Northern Chile) and SIC (Center-Southern Chile) created a new market in the region, the SEN (Sistema Elétrico Nacional)
• Chilean operations revenue increased 14% y/y, though down 17% q/q, as increase in non-regulated contracts associated to the consolidation of subsidiaries Angamos and Cochrane were partially offset by lower volumes in regulated contracts and lower prices in the spot market
• EBITDA increased 10% y/y, down 10% sequentially to US$208mm• 1Q18 EBITDA : 73% Chile, 22% Colombia and 5% Argentina • Weaker sequential EBITDA increased net and gross leverage (LQA) to
4.2x and 4.5x, from 3.7x and 4.0x in 4Q17, although improving from 5.0x and 4.4x in 1Q17
• LTM net leverage stood at 4.3x• Rating agencies expects company to present gross leverage below 4.0x-
4.5x• AES Gener followed divestment plan announcing the sale of 750MW
worth of assets under ESSA for US$300mm (per company ESSA generates about US$20mm in EBITDA p/ year)
• Expected to close the deal in May as proceeds will be used to pay debt• Reducing debt by US$300mm and EBITDA by US$20mm results in pro-
forma LQA gross leverage reduction of 0.2x to 4.3x• Launched process to sell part of its transmission assets (316kms),
expected to close 2H-2018 (per company Transmission lines being negotiated generates about US$17mm in EBITDA p/ year)
AESGEN 5.0% 25s
MARKET UNDERPERFORM (CHILE):
115
AES GENER (US$ MM) 1Q18 4Q17 1Q17 q/q y/y
Revenue 656 665 557 (1%) 18%
EBITDA 208 231 189 (10%) 10%
EBITDA Margin 31.7% 34.8% 33.9%
AES GENER (US$ MM) 1Q18 4Q17 1Q17 q/q y/y
Total Debt 3,749 3,741 3,802 0% (1%)
Cash 235 276 507 (15%) (54%)
Net Debt 3,514 3,465 3,295 1% 7%
Leverage (Total Debt / LQA EBITDA) 4.5 4.0 5.0
Net Leverage (Net Debt / LQA EBITDA) 4.2 3.7 4.4
AES GENER (US$ MM) 1Q18 4Q17 1Q17 q/q y/y
Adjusted EBITDA 208 231 189 (10%) 10%
- capex 125 115 118 9% 6%
- interest 15 69 30 (78%) (49%)
- taxes 38 5 7 720% 426%
FCF (pre WK) 30 43 34 (31%) (12%)
BC
P T
op P
icks/
07
/06
/20
18
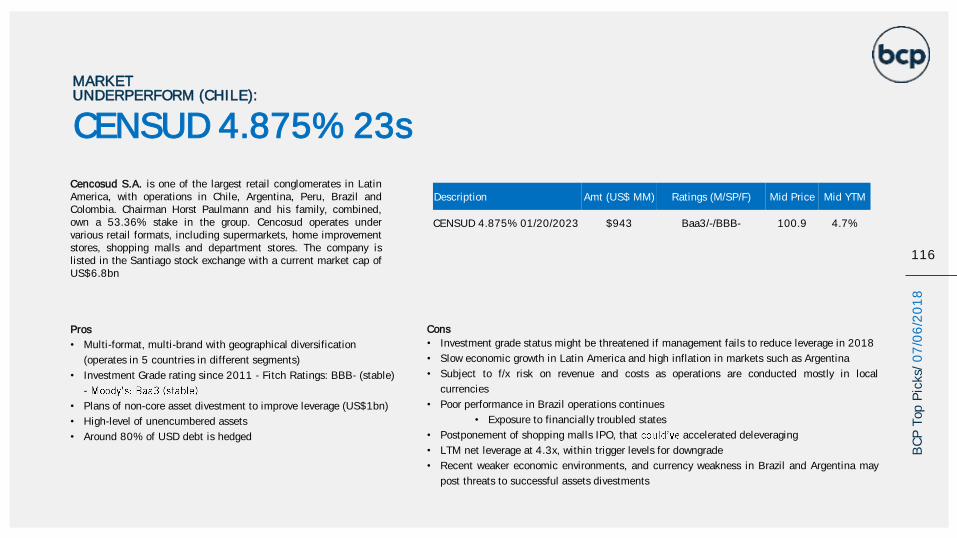
CENSUD 4.875% 23s
MARKET UNDERPERFORM (CHILE):
Pros
• Multi-format, multi-brand with geographical diversification
(operates in 5 countries in different segments)
• Investment Grade rating since 2011 - Fitch Ratings: BBB- (stable)
-
• Plans of non-core asset divestment to improve leverage (US$1bn)
• High-level of unencumbered assets
• Around 80% of USD debt is hedged
Cons
• Investment grade status might be threatened if management fails to reduce leverage in 2018
• Slow economic growth in Latin America and high inflation in markets such as Argentina
• Subject to f/x risk on revenue and costs as operations are conducted mostly in local
currencies
• Poor performance in Brazil operations continues
• Exposure to financially troubled states
• Postponement of shopping malls IPO, that accelerated deleveraging
• LTM net leverage at 4.3x, within trigger levels for downgrade
• Recent weaker economic environments, and currency weakness in Brazil and Argentina may
post threats to successful assets divestments
Cencosud S.A. is one of the largest retail conglomerates in LatinAmerica, with operations in Chile, Argentina, Peru, Brazil andColombia. Chairman Horst Paulmann and his family, combined,own a 53.36% stake in the group. Cencosud operates undervarious retail formats, including supermarkets, home improvementstores, shopping malls and department stores. The company islisted in the Santiago stock exchange with a current market cap ofUS$6.8bn
Description Amt (US$ MM) Ratings (M/SP/F) Mid Price Mid YTM
CENSUD 4.875% 01/20/2023 $943 Baa3/-/BBB- 100.9 4.7%
116
BC
P T
op P
icks/
07
/06
/20
18
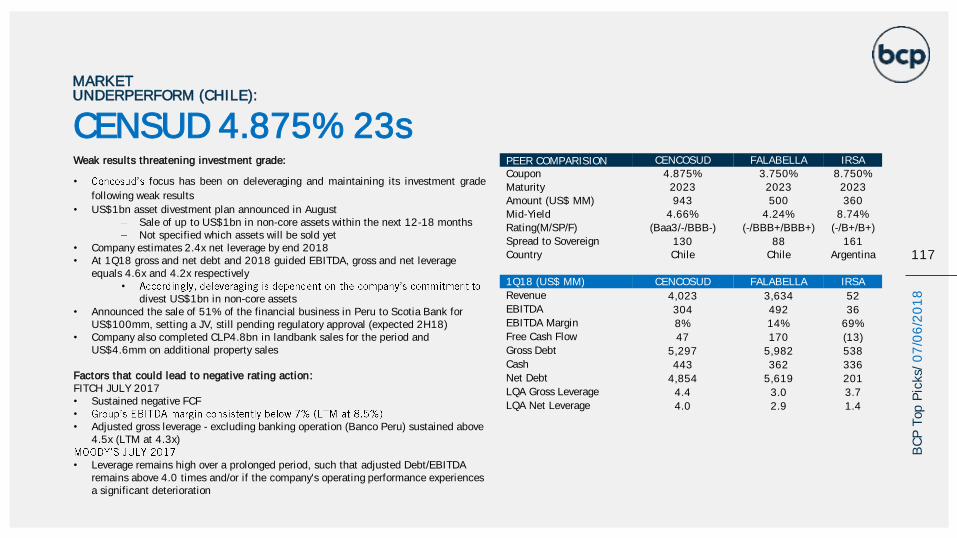
117
Weak results threatening investment grade:
• focus has been on deleveraging and maintaining its investment grade
following weak results
• US$1bn asset divestment plan announced in AugustSale of up to US$1bn in non-core assets within the next 12-18 monthsNot specified which assets will be sold yet
• Company estimates 2.4x net leverage by end 2018• At 1Q18 gross and net debt and 2018 guided EBITDA, gross and net leverage
equals 4.6x and 4.2x respectively•
divest US$1bn in non-core assets• Announced the sale of 51% of the financial business in Peru to Scotia Bank for
US$100mm, setting a JV, still pending regulatory approval (expected 2H18)• Company also completed CLP4.8bn in landbank sales for the period and
US$4.6mm on additional property sales
Factors that could lead to negative rating action:FITCH JULY 2017• Sustained negative FCF•
• Adjusted gross leverage - excluding banking operation (Banco Peru) sustained above 4.5x (LTM at 4.3x)
• Leverage remains high over a prolonged period, such that adjusted Debt/EBITDA remains above 4.0 times and/or if the company's operating performance experiences a significant deterioration
PEER COMPARISION CENCOSUD FALABELLA IRSA
Coupon 4.875% 3.750% 8.750%
Maturity 2023 2023 2023
Amount (US$ MM) 943 500 360
Mid-Yield 4.66% 4.24% 8.74%
Rating(M/SP/F) (Baa3/-/BBB-) (-/BBB+/BBB+) (-/B+/B+)
Spread to Sovereign 130 88 161Country Chile Chile Argentina
1Q18 (US$ MM) CENCOSUD FALABELLA IRSA
Revenue 4,023 3,634 52EBITDA 304 492 36EBITDA Margin 8% 14% 69%Free Cash Flow 47 170 (13)Gross Debt 5,297 5,982 538Cash 443 362 336Net Debt 4,854 5,619 201LQA Gross Leverage 4.4 3.0 3.7LQA Net Leverage 4.0 2.9 1.4
CENSUD 4.875% 23s
MARKET UNDERPERFORM (CHILE):
BC
P T
op P
icks/
07
/06
/20
18
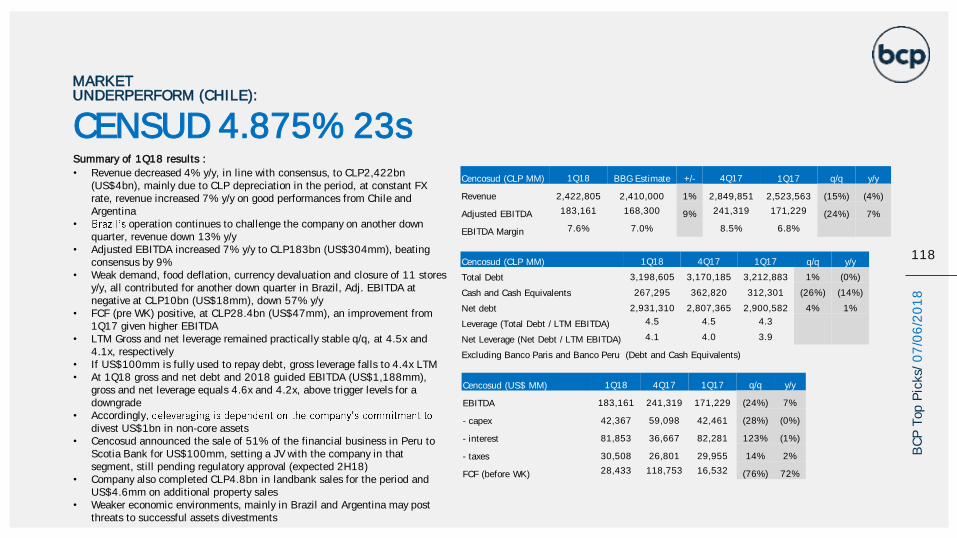
Summary of 1Q18 results :
• Revenue decreased 4% y/y, in line with consensus, to CLP2,422bn (US$4bn), mainly due to CLP depreciation in the period, at constant FX rate, revenue increased 7% y/y on good performances from Chile and Argentina
• operation continues to challenge the company on another down quarter, revenue down 13% y/y
• Adjusted EBITDA increased 7% y/y to CLP183bn (US$304mm), beating consensus by 9%
• Weak demand, food deflation, currency devaluation and closure of 11 stores y/y, all contributed for another down quarter in Brazil, Adj. EBITDA at negative at CLP10bn (US$18mm), down 57% y/y
• FCF (pre WK) positive, at CLP28.4bn (US$47mm), an improvement from 1Q17 given higher EBITDA
• LTM Gross and net leverage remained practically stable q/q, at 4.5x and 4.1x, respectively
• If US$100mm is fully used to repay debt, gross leverage falls to 4.4x LTM• At 1Q18 gross and net debt and 2018 guided EBITDA (US$1,188mm),
gross and net leverage equals 4.6x and 4.2x, above trigger levels for a downgrade
• Accordinglydivest US$1bn in non-core assets
• Cencosud announced the sale of 51% of the financial business in Peru to Scotia Bank for US$100mm, setting a JV with the company in that segment, still pending regulatory approval (expected 2H18)
• Company also completed CLP4.8bn in landbank sales for the period and US$4.6mm on additional property sales
• Weaker economic environments, mainly in Brazil and Argentina may post threats to successful assets divestments
CENSUD 4.875% 23s
MARKET UNDERPERFORM (CHILE):
118
Cencosud (CLP MM) 1Q18 BBG Estimate +/- 4Q17 1Q17 q/q y/y
Revenue 2,422,805 2,410,000 1% 2,849,851 2,523,563 (15%) (4%)
Adjusted EBITDA 183,161 168,300 9% 241,319 171,229 (24%) 7%
EBITDA Margin 7.6% 7.0% 8.5% 6.8%
Cencosud (CLP MM) 1Q18 4Q17 1Q17 q/q y/y
Total Debt 3,198,605 3,170,185 3,212,883 1% (0%)
Cash and Cash Equivalents 267,295 362,820 312,301 (26%) (14%)
Net debt 2,931,310 2,807,365 2,900,582 4% 1%
Leverage (Total Debt / LTM EBITDA) 4.5 4.5 4.3
Net Leverage (Net Debt / LTM EBITDA) 4.1 4.0 3.9
Excluding Banco Paris and Banco Peru (Debt and Cash Equivalents)
Cencosud (US$ MM) 1Q18 4Q17 1Q17 q/q y/y
EBITDA 183,161 241,319 171,229 (24%) 7%
- capex 42,367 59,098 42,461 (28%) (0%)
- interest 81,853 36,667 82,281 123% (1%)
- taxes 30,508 26,801 29,955 14% 2%
FCF (before WK) 28,433 118,753 16,532 (76%) 72%
BC
P T
op P
icks/
07
/06
/20
18

119
MEXICO
BC
P T
op P
icks/
07
/06
/20
18
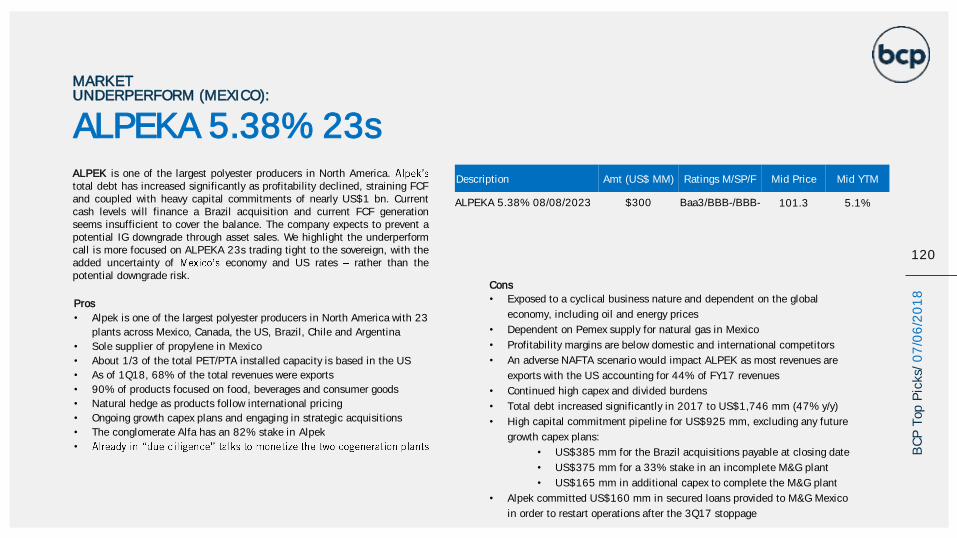
ALPEKA 5.38% 23s
MARKET UNDERPERFORM (MEXICO):
120
Pros
• Alpek is one of the largest polyester producers in North America with 23
plants across Mexico, Canada, the US, Brazil, Chile and Argentina
• Sole supplier of propylene in Mexico
• About 1/3 of the total PET/PTA installed capacity is based in the US
• As of 1Q18, 68% of the total revenues were exports
• 90% of products focused on food, beverages and consumer goods
• Natural hedge as products follow international pricing
• Ongoing growth capex plans and engaging in strategic acquisitions
• The conglomerate Alfa has an 82% stake in Alpek
•
Cons
• Exposed to a cyclical business nature and dependent on the global
economy, including oil and energy prices
• Dependent on Pemex supply for natural gas in Mexico
• Profitability margins are below domestic and international competitors
• An adverse NAFTA scenario would impact ALPEK as most revenues are
exports with the US accounting for 44% of FY17 revenues
• Continued high capex and divided burdens
• Total debt increased significantly in 2017 to US$1,746 mm (47% y/y)
• High capital commitment pipeline for US$925 mm, excluding any future
growth capex plans:
• US$385 mm for the Brazil acquisitions payable at closing date
• US$375 mm for a 33% stake in an incomplete M&G plant
• US$165 mm in additional capex to complete the M&G plant
• Alpek committed US$160 mm in secured loans provided to M&G Mexico
in order to restart operations after the 3Q17 stoppage
ALPEK is one of the largest polyester producers in North America.total debt has increased significantly as profitability declined, straining FCFand coupled with heavy capital commitments of nearly US$1 bn. Currentcash levels will finance a Brazil acquisition and current FCF generationseems insufficient to cover the balance. The company expects to prevent apotential IG downgrade through asset sales. We highlight the underperformcall is more focused on ALPEKA 23s trading tight to the sovereign, with theadded uncertainty of economy and US rates rather than thepotential downgrade risk.
Description Amt (US$ MM) Ratings M/SP/F Mid Price Mid YTM
ALPEKA 5.38% 08/08/2023 $300 Baa3/BBB-/BBB- 101.3 5.1%
BC
P T
op P
icks/
07
/06
/20
18
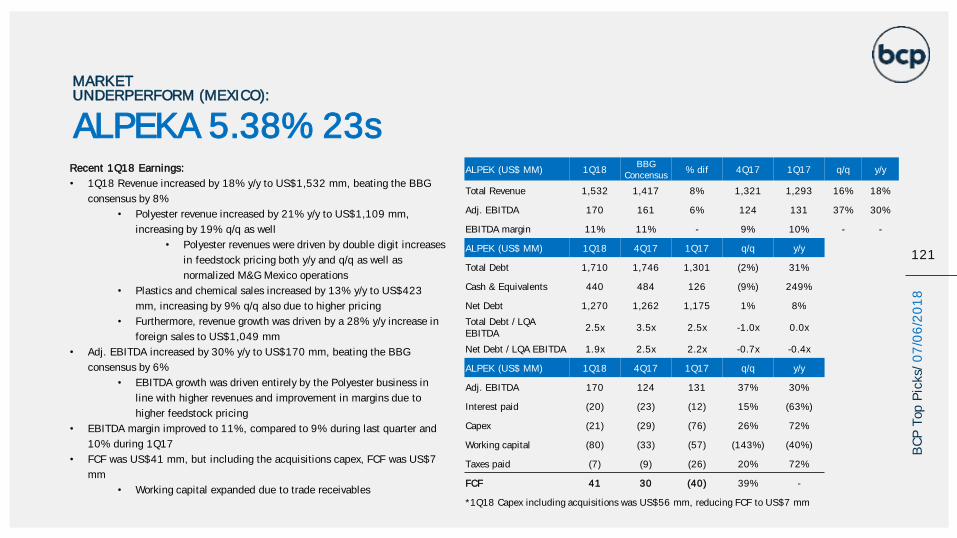
121
MARKET UNDERPERFORM (MEXICO):
Recent 1Q18 Earnings:
• 1Q18 Revenue increased by 18% y/y to US$1,532 mm, beating the BBG
consensus by 8%
• Polyester revenue increased by 21% y/y to US$1,109 mm,
increasing by 19% q/q as well
• Polyester revenues were driven by double digit increases
in feedstock pricing both y/y and q/q as well as
normalized M&G Mexico operations
• Plastics and chemical sales increased by 13% y/y to US$423
mm, increasing by 9% q/q also due to higher pricing
• Furthermore, revenue growth was driven by a 28% y/y increase in
foreign sales to US$1,049 mm
• Adj. EBITDA increased by 30% y/y to US$170 mm, beating the BBG
consensus by 6%
• EBITDA growth was driven entirely by the Polyester business in
line with higher revenues and improvement in margins due to
higher feedstock pricing
• EBITDA margin improved to 11%, compared to 9% during last quarter and
10% during 1Q17
• FCF was US$41 mm, but including the acquisitions capex, FCF was US$7
mm
• Working capital expanded due to trade receivables
ALPEKA 5.38% 23s
BC
P T
op P
icks/
07
/06
/20
18
ALPEK (US$ MM) 1Q18BBG
Concensus% dif 4Q17 1Q17 q/q y/y
Total Revenue 1,532 1,417 8% 1,321 1,293 16% 18%
Adj. EBITDA 170 161 6% 124 131 37% 30%
EBITDA margin 11% 11% - 9% 10% - -
ALPEK (US$ MM) 1Q18 4Q17 1Q17 q/q y/y
Total Debt 1,710 1,746 1,301 (2%) 31%
Cash & Equivalents 440 484 126 (9%) 249%
Net Debt 1,270 1,262 1,175 1% 8%
Total Debt / LQA EBITDA
2.5x 3.5x 2.5x -1.0x 0.0x
Net Debt / LQA EBITDA 1.9x 2.5x 2.2x -0.7x -0.4x
ALPEK (US$ MM) 1Q18 4Q17 1Q17 q/q y/y
Adj. EBITDA 170 124 131 37% 30%
Interest paid (20) (23) (12) 15% (63%)
Capex (21) (29) (76) 26% 72%
Working capital (80) (33) (57) (143%) (40%)
Taxes paid (7) (9) (26) 20% 72%
FCF 41 30 (40) 39% -
*1Q18 Capex including acquisitions was US$56 mm, reducing FCF to US$7 mm
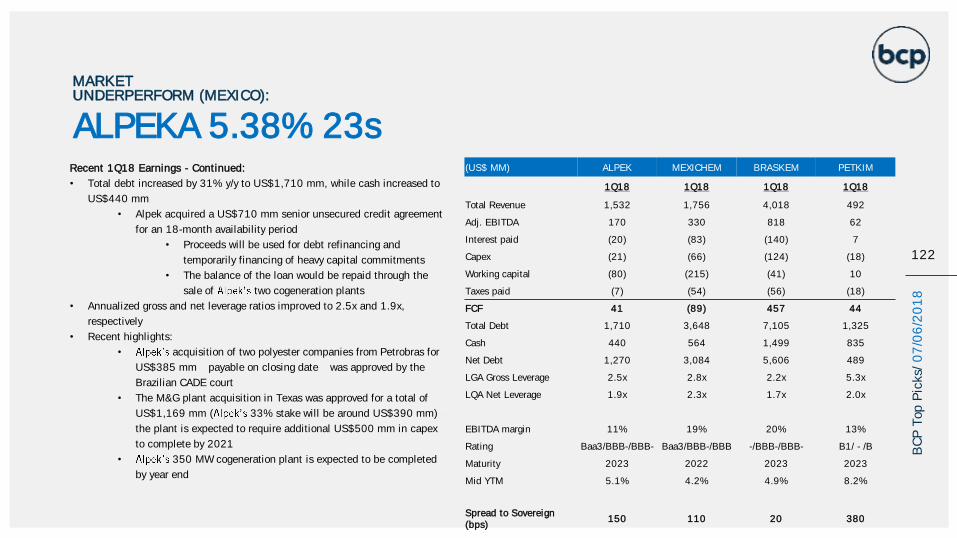
122
MARKET UNDERPERFORM (MEXICO):
Recent 1Q18 Earnings - Continued:
• Total debt increased by 31% y/y to US$1,710 mm, while cash increased to
US$440 mm
• Alpek acquired a US$710 mm senior unsecured credit agreement
for an 18-month availability period
• Proceeds will be used for debt refinancing and
temporarily financing of heavy capital commitments
• The balance of the loan would be repaid through the
sale of two cogeneration plants
• Annualized gross and net leverage ratios improved to 2.5x and 1.9x,
respectively
• Recent highlights:
• acquisition of two polyester companies from Petrobras for
US$385 mm payable on closing date was approved by the
Brazilian CADE court
• The M&G plant acquisition in Texas was approved for a total of
US$1,169 mm ( 33% stake will be around US$390 mm)
the plant is expected to require additional US$500 mm in capex
to complete by 2021
• 350 MW cogeneration plant is expected to be completed
by year end
ALPEKA 5.38% 23s
BC
P T
op P
icks/
07
/06
/20
18
(US$ MM) ALPEK MEXICHEM BRASKEM PETKIM
1Q18 1Q18 1Q18 1Q18
Total Revenue 1,532 1,756 4,018 492
Adj. EBITDA 170 330 818 62
Interest paid (20) (83) (140) 7
Capex (21) (66) (124) (18)
Working capital (80) (215) (41) 10
Taxes paid (7) (54) (56) (18)
FCF 41 (89) 457 44
Total Debt 1,710 3,648 7,105 1,325
Cash 440 564 1,499 835
Net Debt 1,270 3,084 5,606 489
LGA Gross Leverage 2.5x 2.8x 2.2x 5.3x
LQA Net Leverage 1.9x 2.3x 1.7x 2.0x
EBITDA margin 11% 19% 20% 13%
Rating Baa3/BBB-/BBB- Baa3/BBB-/BBB -/BBB-/BBB- B1/ - /B
Maturity 2023 2022 2023 2023
Mid YTM 5.1% 4.2% 4.9% 8.2%
Spread to Sovereign (bps)
150 110 20 380
DISCLAIMERDISCLOSURE APPENDIX
REGULATION AC - ANALYST CERTIFICATION
The following analysts certify that all of the views expressed in this report accurately reflect their respective personal views about the subject securities andissuers. They also certify that no part of their respective compensation was, is, or will be, directly or indirectly, related to the specific recommendations or viewsexpressed by them in this report: Ben Hough, Walter Molano, Julia Bretz, Matias Castagnino & Arturo Galindo.
COMPANY SPECIFIC DISCLOSURES
This report may not be independent of propriety interests. BCP does business, and seeks to do business, with companies covered in BCP research. As a result,investors should be aware that BCP may have a conflict of interest that could affect the objectivity of this report. Further, BCP may trade the securities (or relatedderivatives) that are the subject of this research report for its own account and for certain customers, and may from time to maintain long or short positions in thesecurities (or in related derivatives) of the companies mentioned in this report. Such financial and trading interests may be contrary to any recommendation in the report.
salespeople, traders and other professionals may provide oral or written market commentary or trading strategies to our clients and our proprietary trading desksthat reflect opinions that are contrary to the opinions expressed in this research.
MEANINGS OF RATINGS
The total return is expected to exceed the total return of the J.P. Morgan Corporate Emerging Markets Bond Index series BroadDiversified High-Yield Index over the next 3 6 months.
The total return is expected to be in line with the total return of the CEMBI Broad Diversified High-Yield Index over the next 3 6 months.
The total return is expected to be below the total return of the CEMBI Broad Diversified High-Yield Index over the next 3 6 months.
or no comment Currently, the analyst does not have adequate conviction about the total return relative to the CEMBI Broad Diversified High-YieldIndex over the next 3 6 months.
123
BC
P T
op P
icks/
07
/06
/20
18
GENERAL RESEARCH DISCLOSURES AND DISCLAIMERS
This report is intended only for institutional investors, and should not be redistributed to retail investors. BCP research is not a solicitation or offer to buy or sell anysecurity or financial instrument or to participate in any trading strategy. The products mentioned in this report may not be eligible for sale in some states or countries.
The analysts principally responsible for the preparation of BCP research receive compensation based upon various factors, including quality, accuracy and value ofresearch, firm profitability or revenues (including overall investment banking revenues), client feedback and competitive factors. The compensation of BCP analysts is notlinked to specific investment banking or capital markets transactions by BCP. Analysts employed by non-U.S. affiliates may not be registered with FINRA, may not beassociated persons of BCP, and may not be subject to FINRA regulations regarding research related activities.
BCP research is based on public information. BCP makes every effort to use reliable, comprehensive information, but makes no representation that the information isaccurate or complete. Facts and views presented in BCP research have not been reviewed by, and may not reflect information known to, professionals in other BCPbusiness areas, including investment banking personnel. BCP analysts may interact with sales and trading desk personnel in connection with their research, including toascertain pricing and liquidity in the fixed income markets.
Brazil: This report is distributed in Brazil by BCP Securities Brazil (RJ) in accordance with applicable regulations. No approval is required for publication or distributionof this report in Brazil. The views expressed above accurately reflect personal views of the authors about the subject companies and their securities. The compensation ofthe equity research analyst(s) is indirectly affected by revenues deriving from the business and financial transactions of BCP. Where a Brazil based analyst has taken partin the preparation of this research report, the Brazil based analyst whose name appears first assumes primary responsibility for its content from a Brazilian regulatoryperspective and for its compliance with CVM Instruction 483.
COPYRIGHT AND USER AGREEMENT
Copyright 2018 BCP Securities, LLC. All rights reserved. This research report is prepared for the use of BCP clients and may not be redistributed, retransmittedor disclosed, in whole or in party, or in any form or manner, without the express written consent of BCP. Any unauthorized use or disclosure is prohibited.Receipt and review of this research report constitutes your agreement not to redistribute, retransmit, or disclose to others the contents, opinions, conclusions, orinformation contained in this report (including any investment recommendations, estimates or price targets) without first obtaining expressed permission froman authorized officer of BCP.
DISCLAIMER
124
BC
P T
op P
icks/
07
/06
/20
18

GREENWICH, CT +1 203 629-2181 / MADRID +34 91 310-6980 / MEXICO +52 55 4745-2106 / MIAMI, FL +1 305 358-
6445 RIO DE JANEIRO +55 21 2227-4160 / SINGAPORE +65 6225-3171
125
BC
P T
op P
icks/
07
/06
/20
18


![Pacific Basin 3Q18 Presentation FINAL 20181127 [Read-Only] · Pacific Basin 9 3Q18 Performance and 2018 / 2019 Cover US$/day Handysize Supramax PB daily TCE net rate 3Q18 10,080 12,180](https://img.pdfslide.us/doc/110x75/604f51407d10af639f47c535/pacific-basin-3q18-presentation-final-20181127-read-only-pacific-basin-9-3q18.jpg)