Embed Size (px)
Citation preview

Economic outlookRockhampton
Peter Gooday
25 July 2018
Australian Bureau of Agriculturaland Resource Economics and Sciences

Australian Bureau of Agricultural & Resource Economics and Sciences
(ABARES)
ForecastingStatistics Analysis

Regional growth prospects
Source: ABARES; IMFa ABARES assumption. b excludes China. c excludes Hong Kong.

…and the Australian dollar is assumed to weaken over the outlook period
a ABARES assumption.Note: Historical data based on monthly average.Source: ABARES; Reserve Bank of Australia
US$0.782017-18
US$0.762018-19
US$0.742019-20 to 2022-23

Gross value of agricultural production has increased steadily over recent years
f ABARES forecast. z ABARES projection.Source: ABARES; Australian Bureau of Statistics
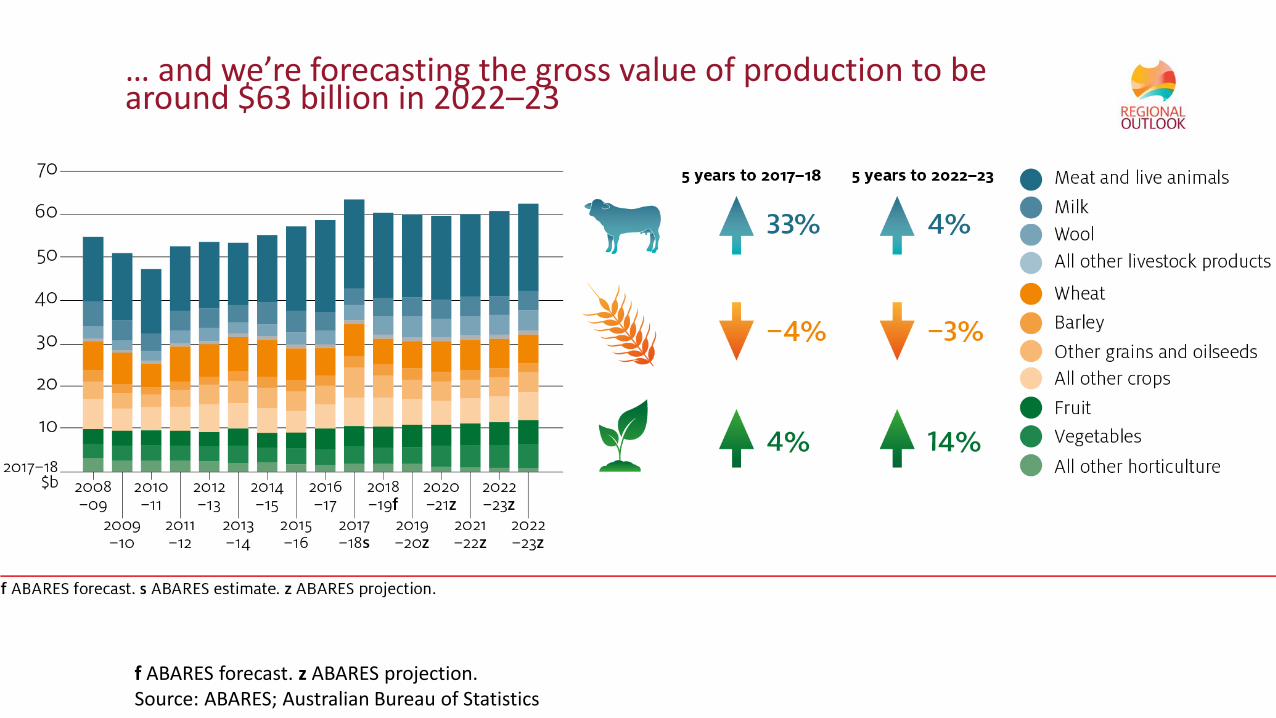
… and we’re forecasting the gross value of production to be around $63 billion in 2022–23
f ABARES forecast. z ABARES projection.Source: ABARES; Australian Bureau of Statistics

The value of agricultural exports has grown by $13 billion over the last 10 years
f ABARES forecast. z ABARES projection.Source: ABARES; Australian Bureau of Statistics

… with the total value of exports forecast to grow to almost $50 billion over the next 5 years
f ABARES forecast. z ABARES projection.Source: ABARES; Australian Bureau of Statistics
• Markets for farm inputs and outputs
• Technology development and uptake
• Structural change
• Climate change
• Society’s expectations of farmers
Long term trends shaping Australian agriculture
Competitiveness: the race for advantage

a Includes Asian nations Japan and South Korea, and non OECD countries Bulgaria, Croatia, Lithuania and Romania. b Emerging and developing Asia. c Brazil, Russia and South Africa. Note: High income threshold US $12,000 GDP per capita (World Bank (2014)Source: Data from Hatfield-Dodds, Schandl et al. 2017
Asian growthWell over 3 billion people in high income nations by 2050, driven by Asia
Distribution of historical and projected real global GDP per capita by countries and regions
0 5 10
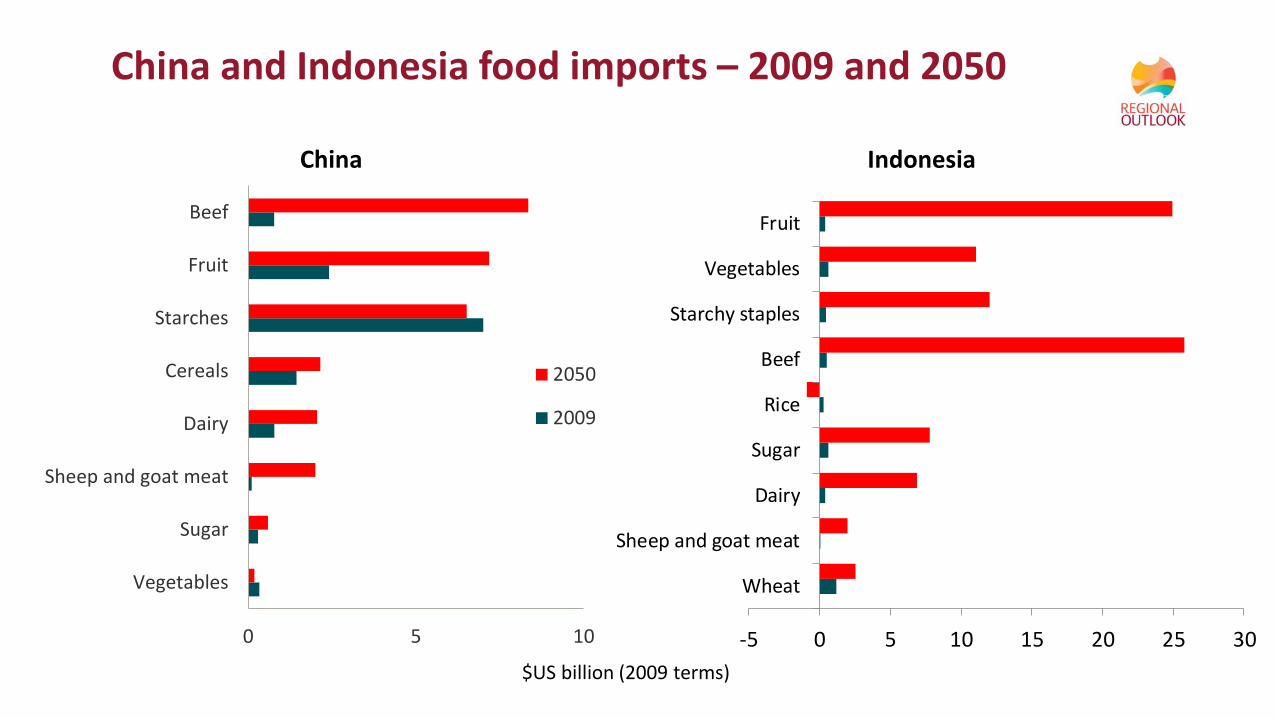
Vegetables
Sugar
Sheep and goat meat
Dairy
Cereals
Starches
Fruit
Beef
2050
2009
China
-5 0 5 10 15 20 25 30
Wheat
Sheep and goat meat
Dairy
Sugar
Rice
Beef
Starchy staples
Vegetables
Fruit
Indonesia
$US billion (2009 terms)
China and Indonesia food imports – 2009 and 2050

• ASEAN-Australia-New Zealand FTA 2010
• Korea-Australia FTA 2014
• Japan-Australia EPA 2015
• China-Australia FTA 2015
FTAs improve access
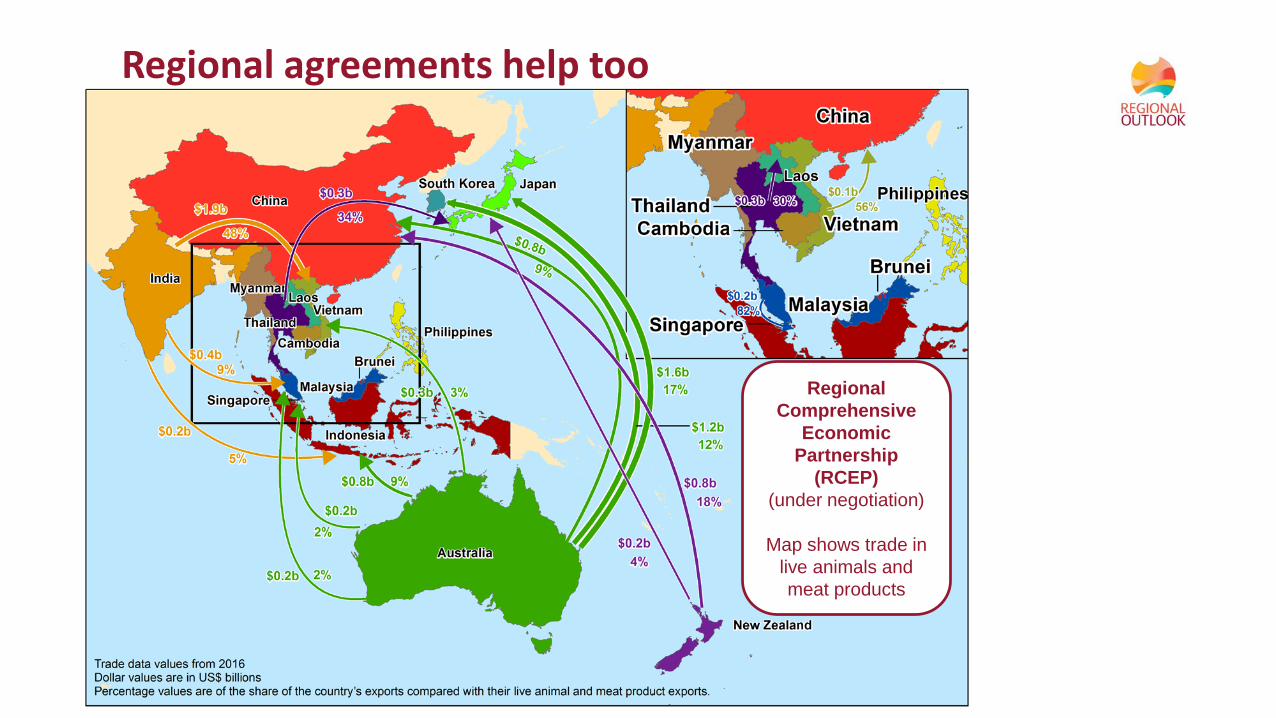
Regional Comprehensive
Economic Partnership
(RCEP)(under negotiation)
Map shows trade in live animals and meat products
Regional agreements help too

Productivity growthAustralian productivity growth is keeping pace with advanced economies, but emerging producers are catching up
(Index of total factor productivity at constant real prices. Average of 1962 to 1967 = 100)Source: US Department of Agriculture Economic Research Service 2017
Change in productivity from base year, selected countries

Technology development and uptake
Value of Australian rural R&D funding
$m
200
400
600
800
1,000
1,200
1,400
1,600
1,800
2005-06 2006-07 2007-08 2008-09 2009-10 2010-11 2011-12 2012-13 2013-14 2014-15
Publicfunding
Privatefunding
Includes agriculture, forestry and fisheries, related inputs and downstream processingSource: ABARES 2017

ICT assets by type and industry, 2016-17average per farm
$000
10
20
30
40
Grains Beef and sheep Dairy Vegetables a
Computers Phones and radios GPS Sensors and devices Other hardware Software
a results for 2015-16
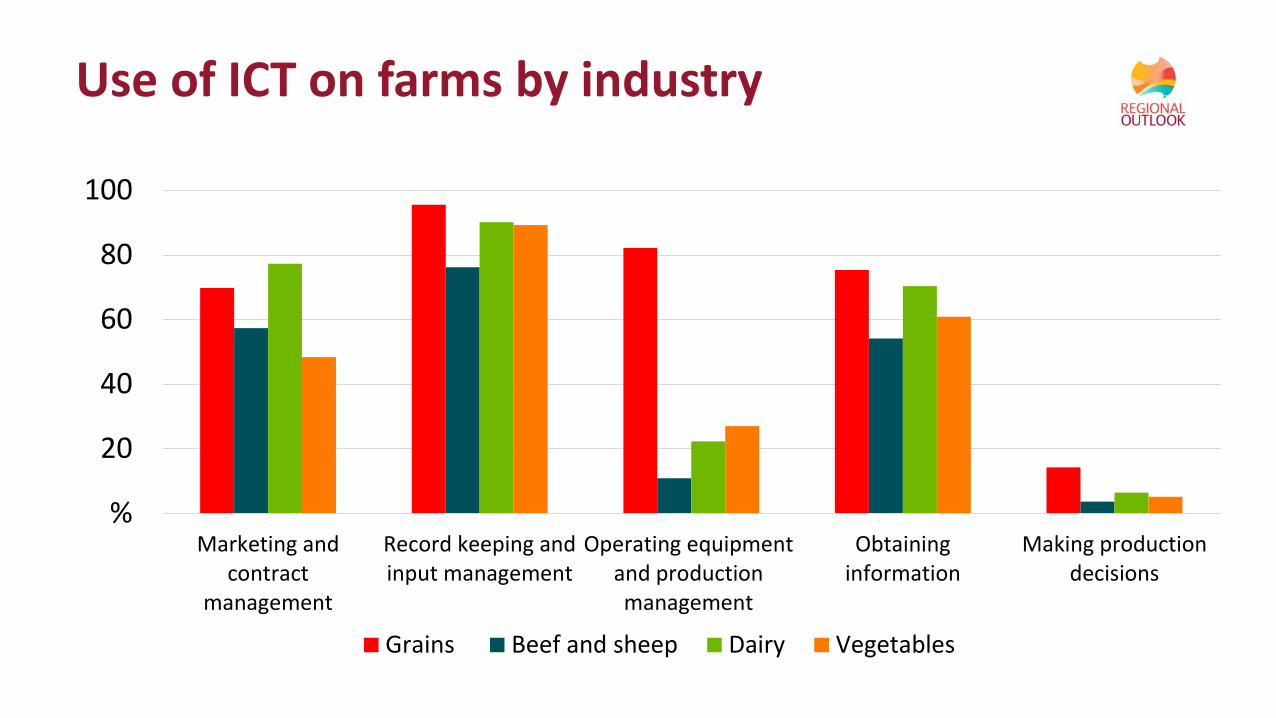
Use of ICT on farms by industry
%
20
40
60
80
100
Marketing andcontract
management
Record keeping andinput management
Operating equipmentand productionmanagement
Obtaininginformation
Making productiondecisions
Grains Beef and sheep Dairy Vegetables

Barriers to adoption of new ICT in 2017proportion of farms
%
10
20
30
40
50
Grains Beef and sheep Dairy Vegetables
Skills Internet access Cost Nothing new Other

Internet access problems by connection typeproportion of farms
%
20
40
60
80
Digital Fixed wireless Mobile wireless Satellite
Speed Cost Reliability

Structural change
0%
20%
40%
60%
80%
100%
Large farms
Medium farms
Small farms
Share of farm numbers Share of output
1978-1980 1978-19802014-2016 2014-2016
Share of farm numbers and output by farm size 1978-1980 and 2014-2016

Adaptation to climate change

Society's expectations of farmers
agriculture.gov.au/abares