Embed Size (px)
Citation preview

1
ECO
NOM
IC O
UTLO
OK,
201
0 HE
ALTH
CAR
E FO
RECA
ST C
ONF
EREN
CE, U
NIVE
RSIT
Y O
F CA
LIFO
RNIA
, IRV
INE,
CA,
FEB
RUAR
Y 25
, 201
0
JAMES GLASSMAN ([email protected], o212–270–0778, o212-834-5093, m609-510-3723 )
“I gotta feeling …”
2
ECO
NOM
IC O
UTLO
OK,
201
0 HE
ALTH
CAR
E FO
RECA
ST C
ONF
EREN
CE, U
NIVE
RSIT
Y O
F CA
LIFO
RNIA
, IRV
INE,
CA,
FEB
RUAR
Y 25
, 201
0
JAMES GLASSMAN ([email protected], o212–270–0778, o212-834-5093, m609-510-3723 )
A good, good day …
3
ECO
NOM
IC O
UTLO
OK,
201
0 HE
ALTH
CAR
E FO
RECA
ST C
ONF
EREN
CE, U
NIVE
RSIT
Y O
F CA
LIFO
RNIA
, IRV
INE,
CA,
FEB
RUAR
Y 25
, 201
0
JAMES GLASSMAN ([email protected], o212–270–0778, o212-834-5093, m609-510-3723 )
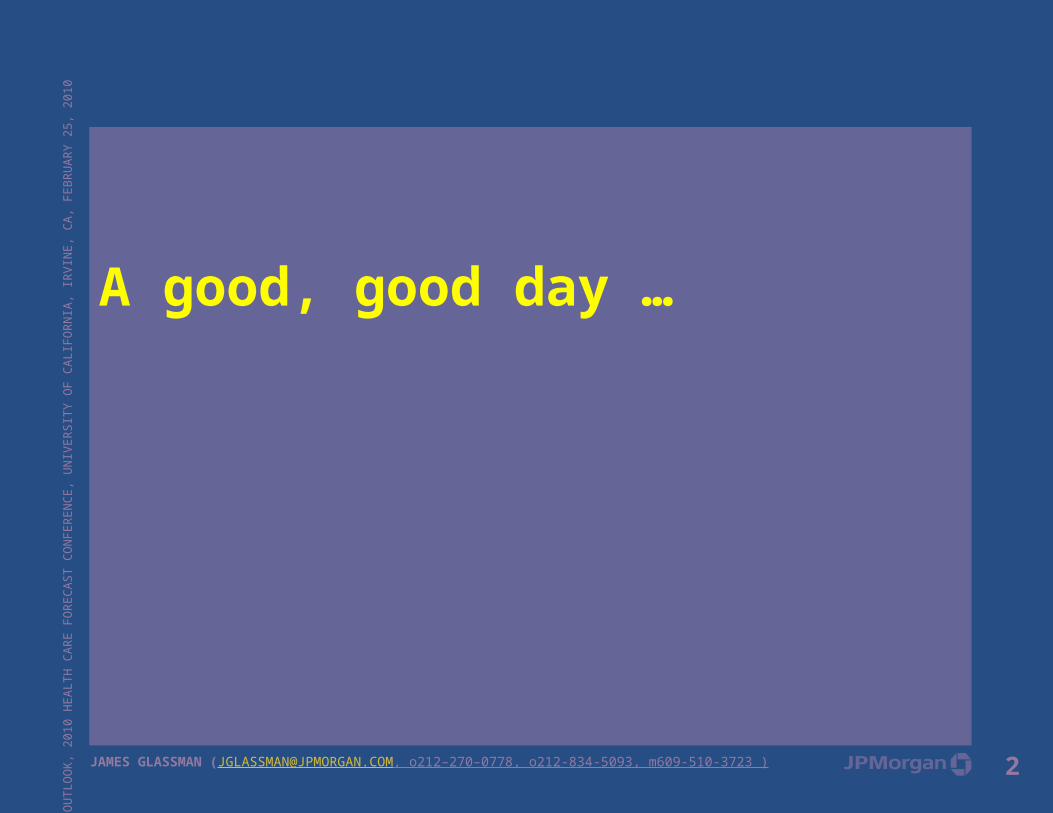
We began to recover early last summer …US real GDP (annualized percent change from the previous quarter)
Source: US Department of Commerce
-7
-6
-5
-4
-3
-2
-1
0
1
2
3
4
5
6
7
8
2000 2001 2002 2003 2004 2005 2006 2007 2008 2009 2010 2011 2012
-7
-6
-5
-4
-3
-2
-1
0
1
2
3
4
5
6
7
8
Forecast
4
ECO
NOM
IC O
UTLO
OK,
201
0 HE
ALTH
CAR
E FO
RECA
ST C
ONF
EREN
CE, U
NIVE
RSIT
Y O
F CA
LIFO
RNIA
, IRV
INE,
CA,
FEB
RUAR
Y 25
, 201
0
JAMES GLASSMAN ([email protected], o212–270–0778, o212-834-5093, m609-510-3723 )
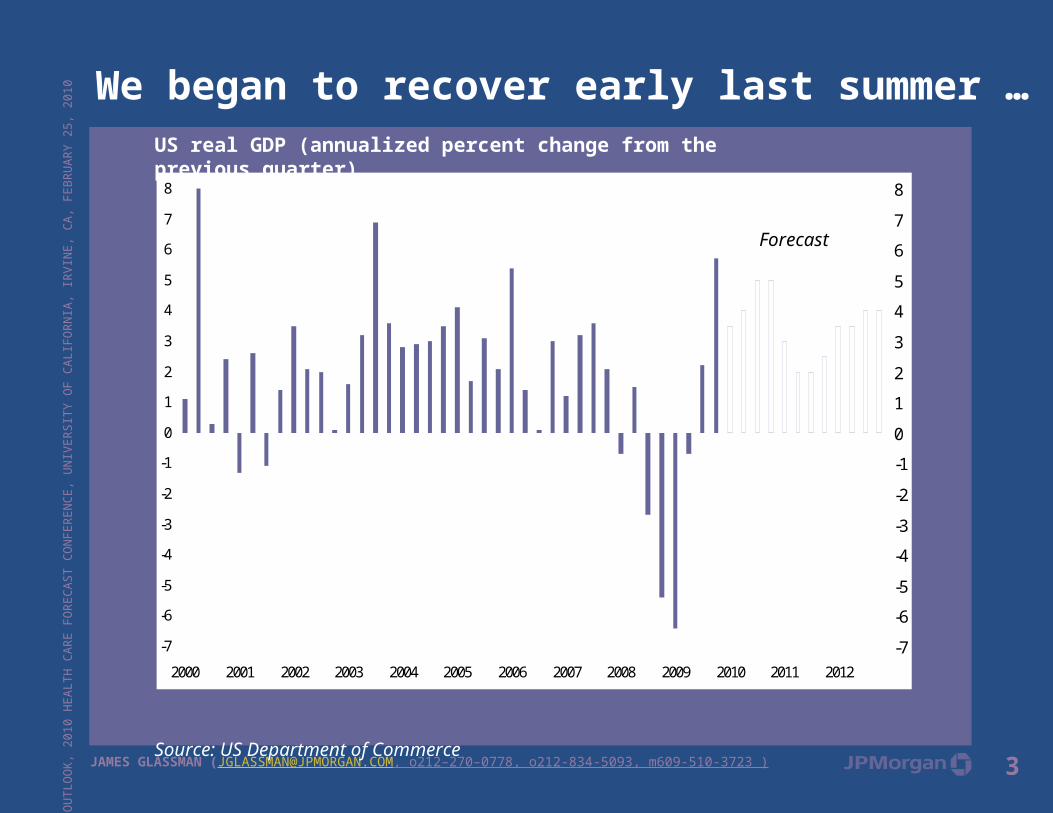
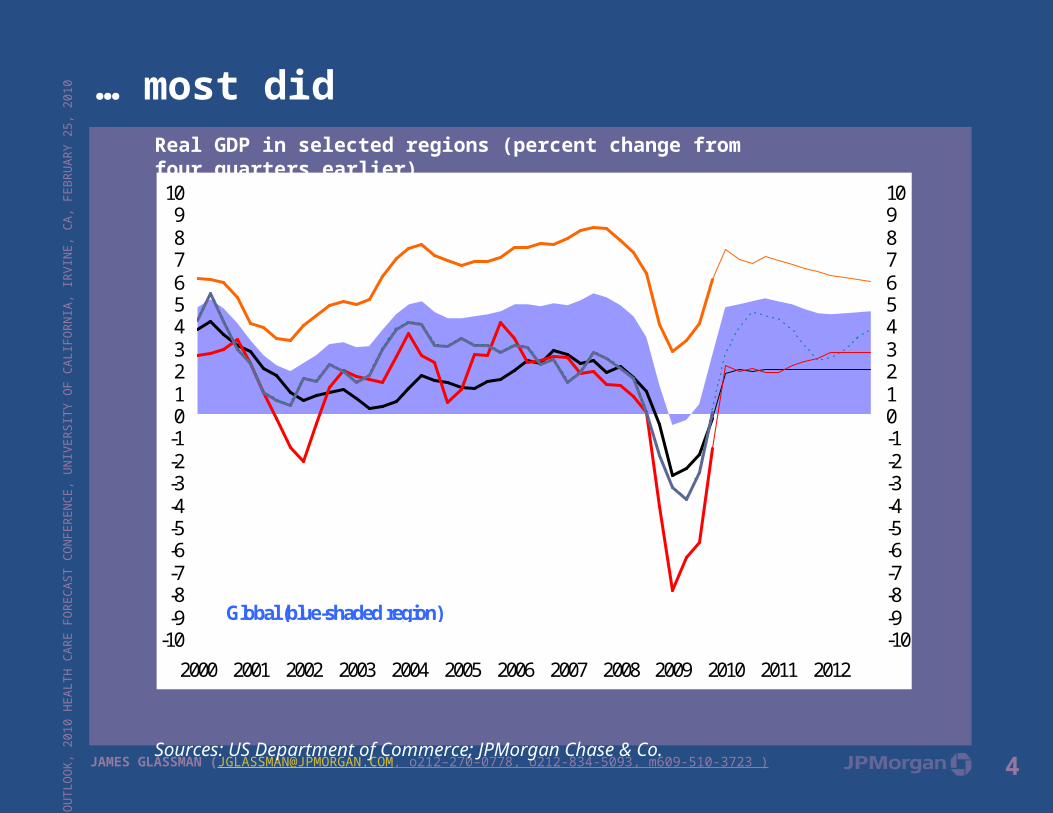
… most didReal GDP in selected regions (percent change from four quarters earlier)
Sources: US Department of Commerce; JPMorgan Chase & Co.
-10-9-8-7-6-5-4-3-2-10123456789
10
2000 2001 2002 2003 2004 2005 2006 2007 2008 2009 2010 2011 2012-10-9-8-7-6-5-4-3-2-1012345678910
US (blue-gray, dashed line is forecast)EU-11 (black)Japan (red)
Emerging economies in Asia, Eastern Europe and Latin America (orange)
Global (blue-shaded region)
5
ECO
NOM
IC O
UTLO
OK,
201
0 HE
ALTH
CAR
E FO
RECA
ST C
ONF
EREN
CE, U
NIVE
RSIT
Y O
F CA
LIFO
RNIA
, IRV
INE,
CA,
FEB
RUAR
Y 25
, 201
0
JAMES GLASSMAN ([email protected], o212–270–0778, o212-834-5093, m609-510-3723 )
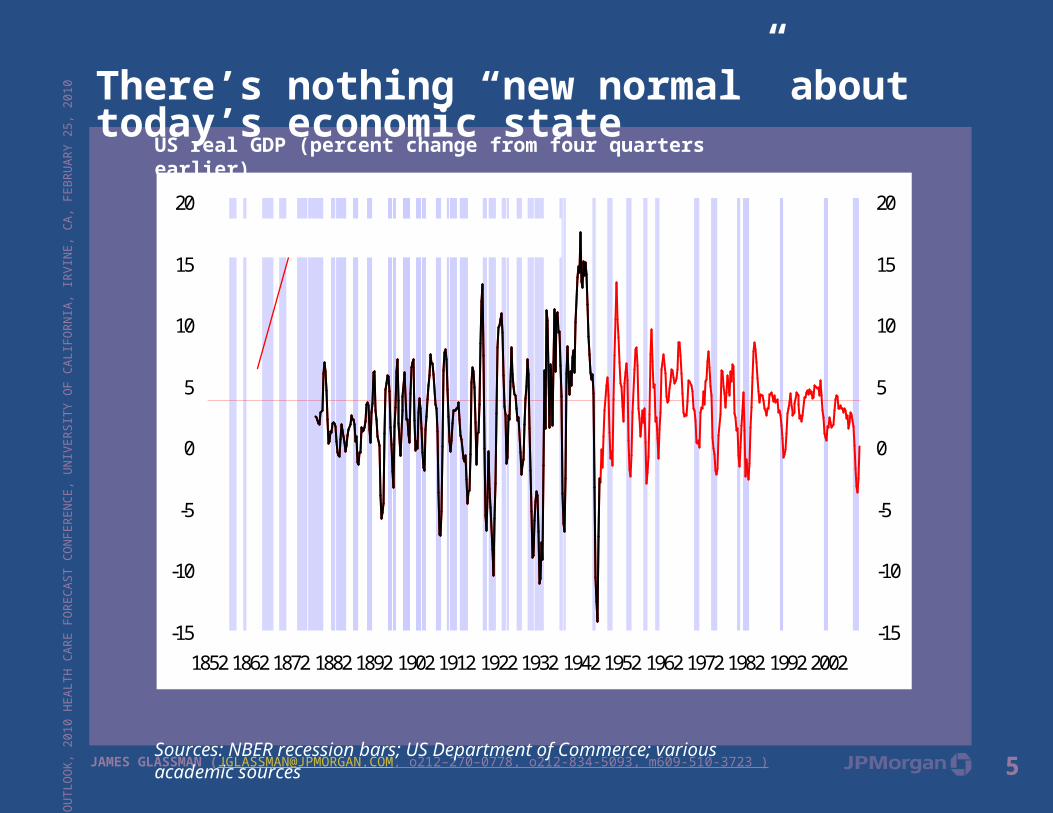
There’s nothing “new normal” about today’s economic stateUS real GDP (percent change from four quarters earlier)
Sources: NBER recession bars; US Department of Commerce; various academic sources
-15
-10
-5
0
5
10
15
20
1852 1862 1872 1882 1892 1902 1912 1922 1932 1942 1952 1962 1972 1982 1992 2002-15
-10
-5
0
5
10
15
20
Average historical growth = 3.75% annually
6
ECO
NOM
IC O
UTLO
OK,
201
0 HE
ALTH
CAR
E FO
RECA
ST C
ONF
EREN
CE, U
NIVE
RSIT
Y O
F CA
LIFO
RNIA
, IRV
INE,
CA,
FEB
RUAR
Y 25
, 201
0
JAMES GLASSMAN ([email protected], o212–270–0778, o212-834-5093, m609-510-3723 )
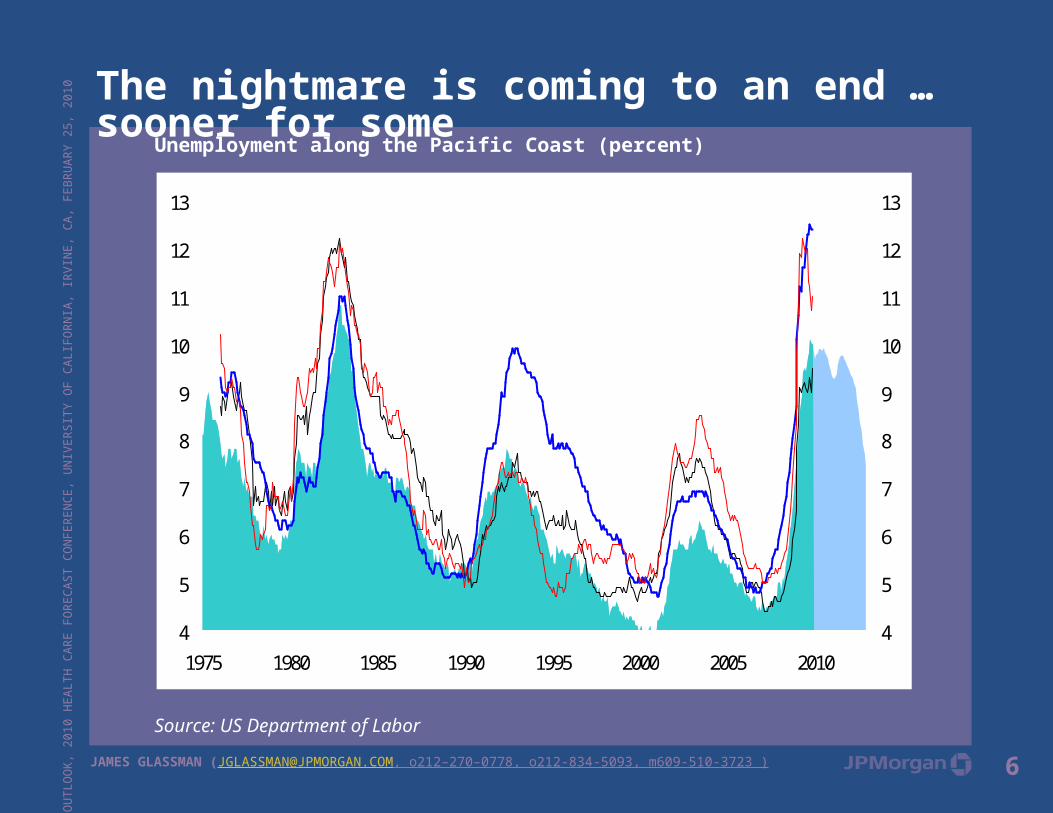
The nightmare is coming to an end … sooner for someUnemployment along the Pacific Coast (percent)
Source: US Department of Labor
4
5
6
7
8
9
10
11
12
13
1975 1980 1985 1990 1995 2000 2005 20104
5
6
7
8
9
10
11
12
13Lines:CaliforniaOregon (dashed red line)Washington
Shaded area:US (shaded region)
7
ECO
NOM
IC O
UTLO
OK,
201
0 HE
ALTH
CAR
E FO
RECA
ST C
ONF
EREN
CE, U
NIVE
RSIT
Y O
F CA
LIFO
RNIA
, IRV
INE,
CA,
FEB
RUAR
Y 25
, 201
0
JAMES GLASSMAN ([email protected], o212–270–0778, o212-834-5093, m609-510-3723 )
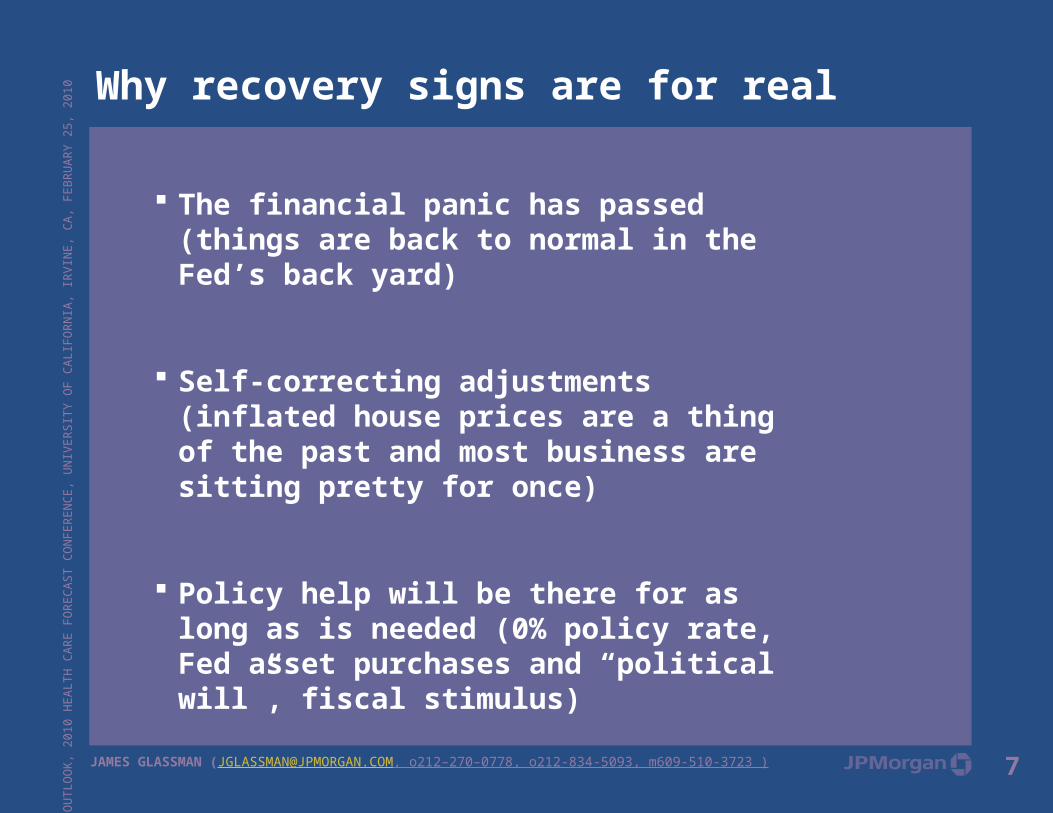
Why recovery signs are for real
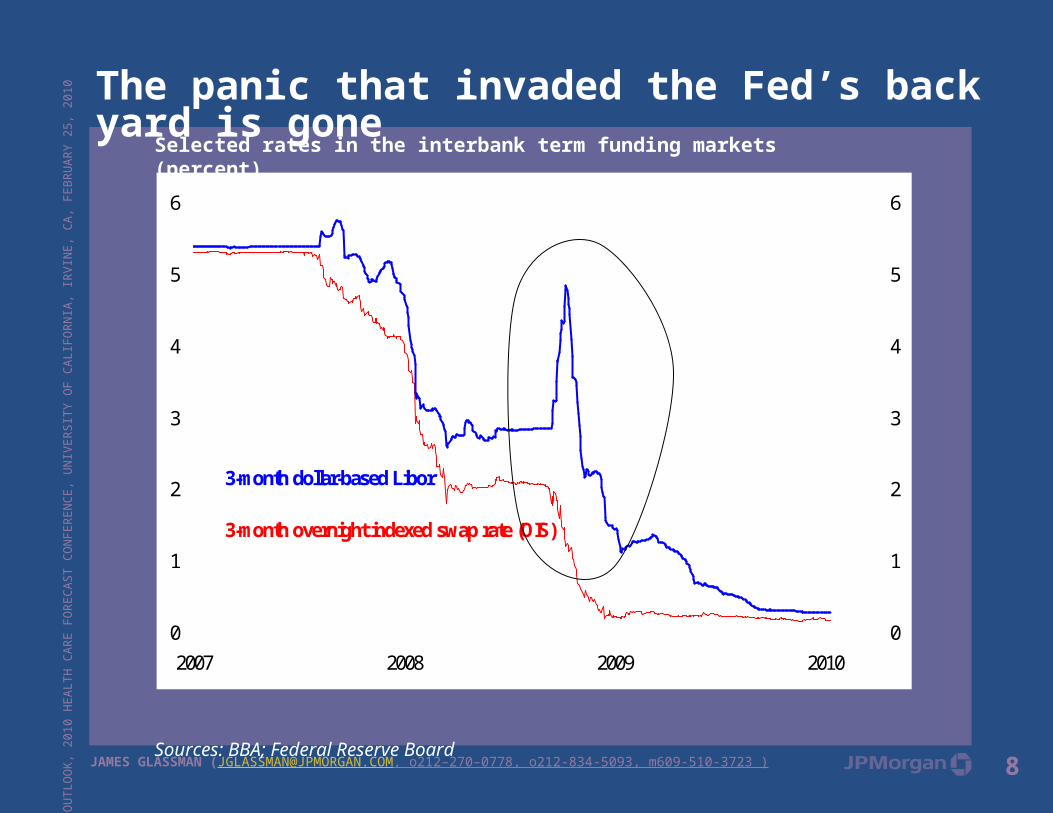
The financial panic has passed (things are back to normal in the Fed’s back yard)
Self-correcting adjustments (inflated house prices are a thing of the past and most business are sitting pretty for once)
Policy help will be there for as long as is needed (0% policy rate, Fed asset purchases and “political will”, fiscal stimulus)
8
ECO
NOM
IC O
UTLO
OK,
201
0 HE
ALTH
CAR
E FO
RECA
ST C
ONF
EREN
CE, U
NIVE
RSIT
Y O
F CA
LIFO
RNIA
, IRV
INE,
CA,
FEB
RUAR
Y 25
, 201
0
JAMES GLASSMAN ([email protected], o212–270–0778, o212-834-5093, m609-510-3723 )
0
1
2
3
4
5
6
2007 2008 2009 20100
1
2
3
4
5
6
3-month dollar-based Libor
3-month overnight indexed swap rate (OIS)
The panic that invaded the Fed’s back yard is goneSelected rates in the interbank term funding markets (percent)
Sources: BBA; Federal Reserve Board
9
ECO
NOM
IC O
UTLO
OK,
201
0 HE
ALTH
CAR
E FO
RECA
ST C
ONF
EREN
CE, U
NIVE
RSIT
Y O
F CA
LIFO
RNIA
, IRV
INE,
CA,
FEB
RUAR
Y 25
, 201
0
JAMES GLASSMAN ([email protected], o212–270–0778, o212-834-5093, m609-510-3723 )
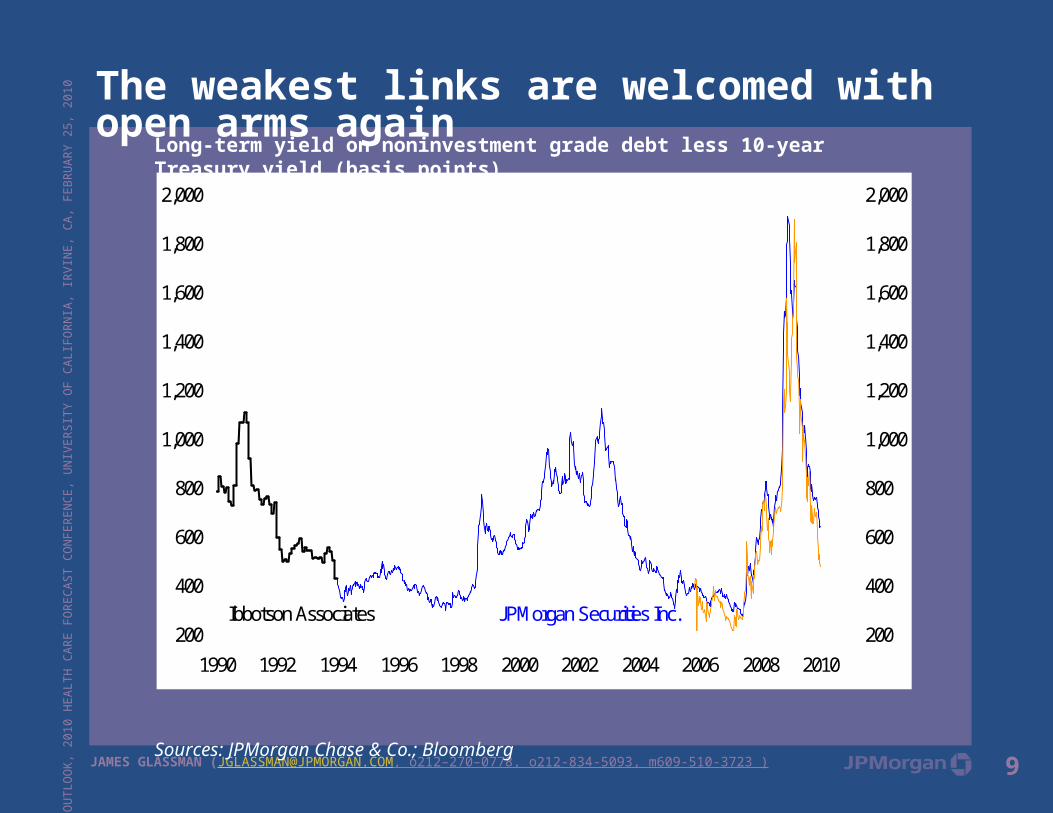
The weakest links are welcomed with open arms againLong-term yield on noninvestment grade debt less 10-year Treasury yield (basis points)
Sources: JPMorgan Chase & Co.; Bloomberg
200
400
600
800
1,000
1,200
1,400
1,600
1,800
2,000
1990 1992 1994 1996 1998 2000 2002 2004 2006 2008 2010200
400
600
800
1,000
1,200
1,400
1,600
1,800
2,000
Ibbotson Associates JPMorgan Securities Inc.
CDX.HY
10
ECO
NOM
IC O
UTLO
OK,
201
0 HE
ALTH
CAR
E FO
RECA
ST C
ONF
EREN
CE, U
NIVE
RSIT
Y O
F CA
LIFO
RNIA
, IRV
INE,
CA,
FEB
RUAR
Y 25
, 201
0
JAMES GLASSMAN ([email protected], o212–270–0778, o212-834-5093, m609-510-3723 )
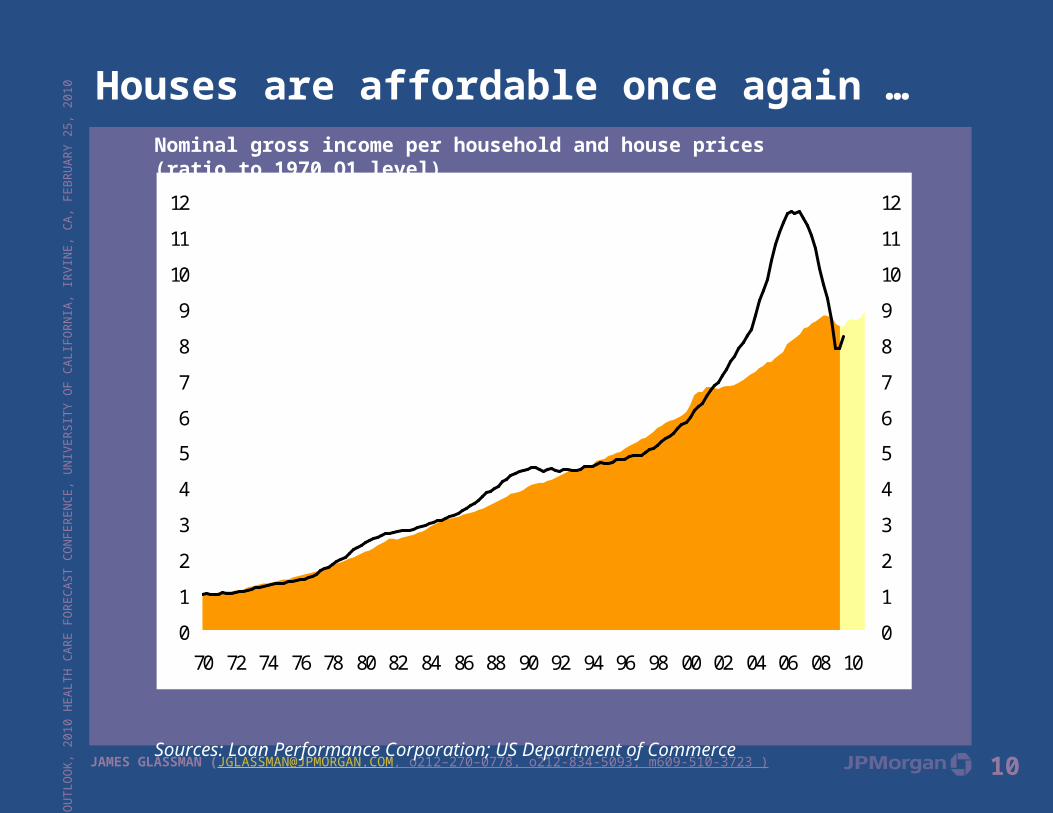
Houses are affordable once again …Nominal gross income per household and house prices (ratio to 1970 Q1 level)
Sources: Loan Performance Corporation; US Department of Commerce
0
1
2
3
4
5
6
7
8
9
10
11
12
70 72 74 76 78 80 82 84 86 88 90 92 94 96 98 00 02 04 06 08 100
1
2
3
4
5
6
7
8
9
10
11
12Loan Performance Corporation
Gross nominal income per household
11
ECO
NOM
IC O
UTLO
OK,
201
0 HE
ALTH
CAR
E FO
RECA
ST C
ONF
EREN
CE, U
NIVE
RSIT
Y O
F CA
LIFO
RNIA
, IRV
INE,
CA,
FEB
RUAR
Y 25
, 201
0
JAMES GLASSMAN ([email protected], o212–270–0778, o212-834-5093, m609-510-3723 )
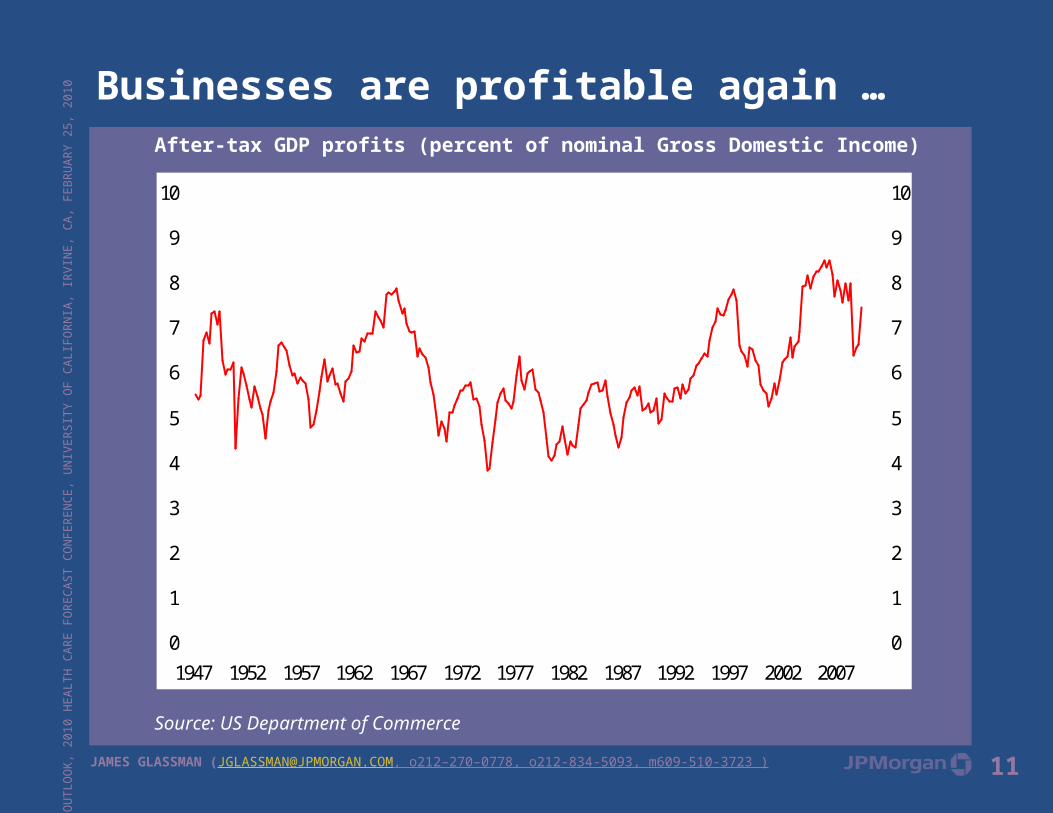
Businesses are profitable again …After-tax GDP profits (percent of nominal Gross Domestic Income)
Source: US Department of Commerce
0
1
2
3
4
5
6
7
8
9
10
1947 1952 1957 1962 1967 1972 1977 1982 1987 1992 1997 2002 20070
1
2
3
4
5
6
7
8
9
10
After-tax GDP profits from current production
12
ECO
NOM
IC O
UTLO
OK,
201
0 HE
ALTH
CAR
E FO
RECA
ST C
ONF
EREN
CE, U
NIVE
RSIT
Y O
F CA
LIFO
RNIA
, IRV
INE,
CA,
FEB
RUAR
Y 25
, 201
0
JAMES GLASSMAN ([email protected], o212–270–0778, o212-834-5093, m609-510-3723 )
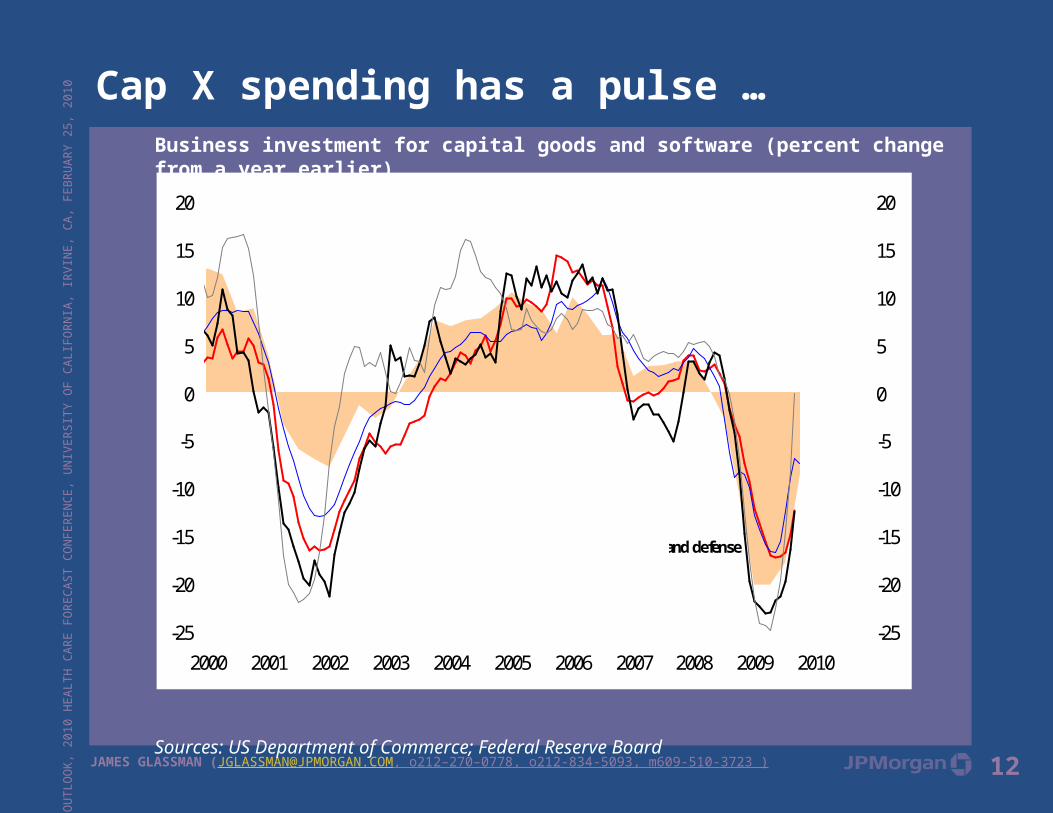
Cap X spending has a pulse …Business investment for capital goods and software (percent change from a year earlier)
Sources: US Department of Commerce; Federal Reserve Board
-25
-20
-15
-10
-5
0
5
10
15
20
2000 2001 2002 2003 2004 2005 2006 2007 2008 2009 2010-25
-20
-15
-10
-5
0
5
10
15
20Shaded area denotes real business spending for equipment & software
Industrial output of business equipmentOrders for capital goods excluding civilian aircraft and defenseNonauto capital goods importsShipments of nondefense capital goods
13
ECO
NOM
IC O
UTLO
OK,
201
0 HE
ALTH
CAR
E FO
RECA
ST C
ONF
EREN
CE, U
NIVE
RSIT
Y O
F CA
LIFO
RNIA
, IRV
INE,
CA,
FEB
RUAR
Y 25
, 201
0
JAMES GLASSMAN ([email protected], o212–270–0778, o212-834-5093, m609-510-3723 )
So, where are the jobs? Four realities …
GDP surging
Payrolls are still shrinking (survey of businesses, including guesses about small businesses)
Unemployment is falling, employment’s rising (survey of households)
Layoffs are tumbling (unemployment insurance)
14
ECO
NOM
IC O
UTLO
OK,
201
0 HE
ALTH
CAR
E FO
RECA
ST C
ONF
EREN
CE, U
NIVE
RSIT
Y O
F CA
LIFO
RNIA
, IRV
INE,
CA,
FEB
RUAR
Y 25
, 201
0
JAMES GLASSMAN ([email protected], o212–270–0778, o212-834-5093, m609-510-3723 )
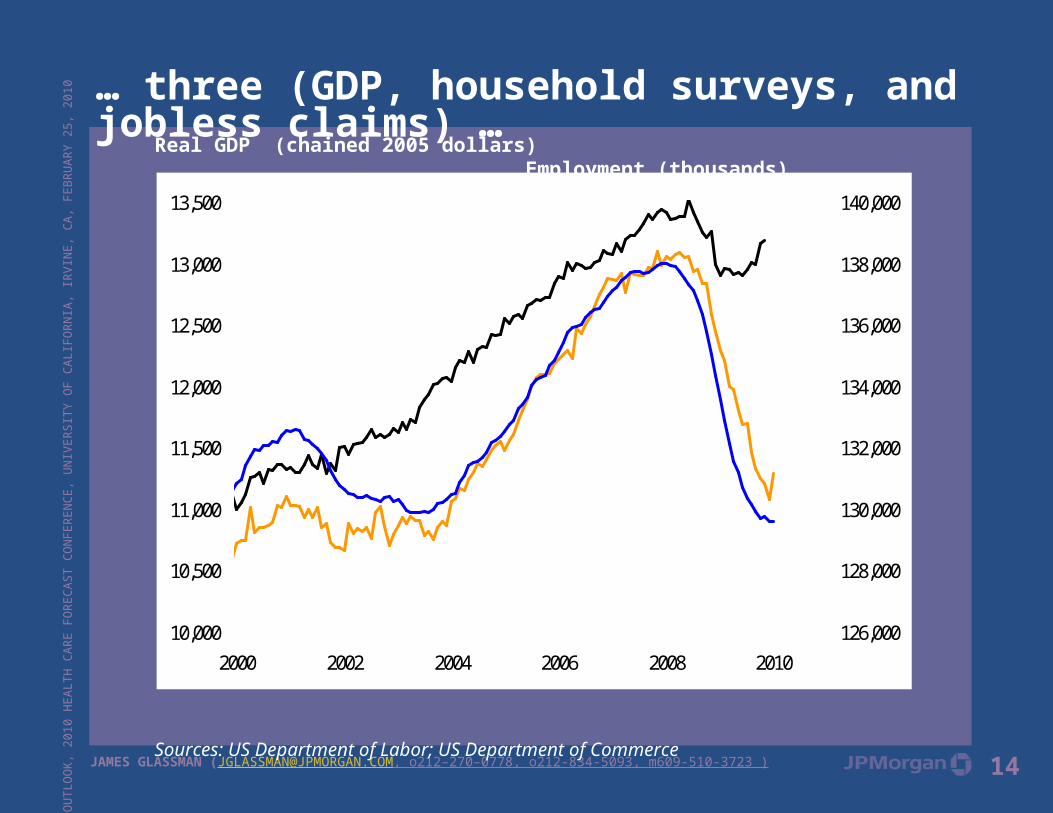
… three (GDP, household surveys, and jobless claims) …Real GDP (chained 2005 dollars) Employment (thousands)
Sources: US Department of Labor; US Department of Commerce
10,000
10,500
11,000
11,500
12,000
12,500
13,000
13,500
2000 2002 2004 2006 2008 2010126,000
128,000
130,000
132,000
134,000
136,000
138,000
140,000
GDP (left)
Employment, payroll concept based on the Household Survey (right)Nonfarm payrolls (right)
15
ECO
NOM
IC O
UTLO
OK,
201
0 HE
ALTH
CAR
E FO
RECA
ST C
ONF
EREN
CE, U
NIVE
RSIT
Y O
F CA
LIFO
RNIA
, IRV
INE,
CA,
FEB
RUAR
Y 25
, 201
0
JAMES GLASSMAN ([email protected], o212–270–0778, o212-834-5093, m609-510-3723 )
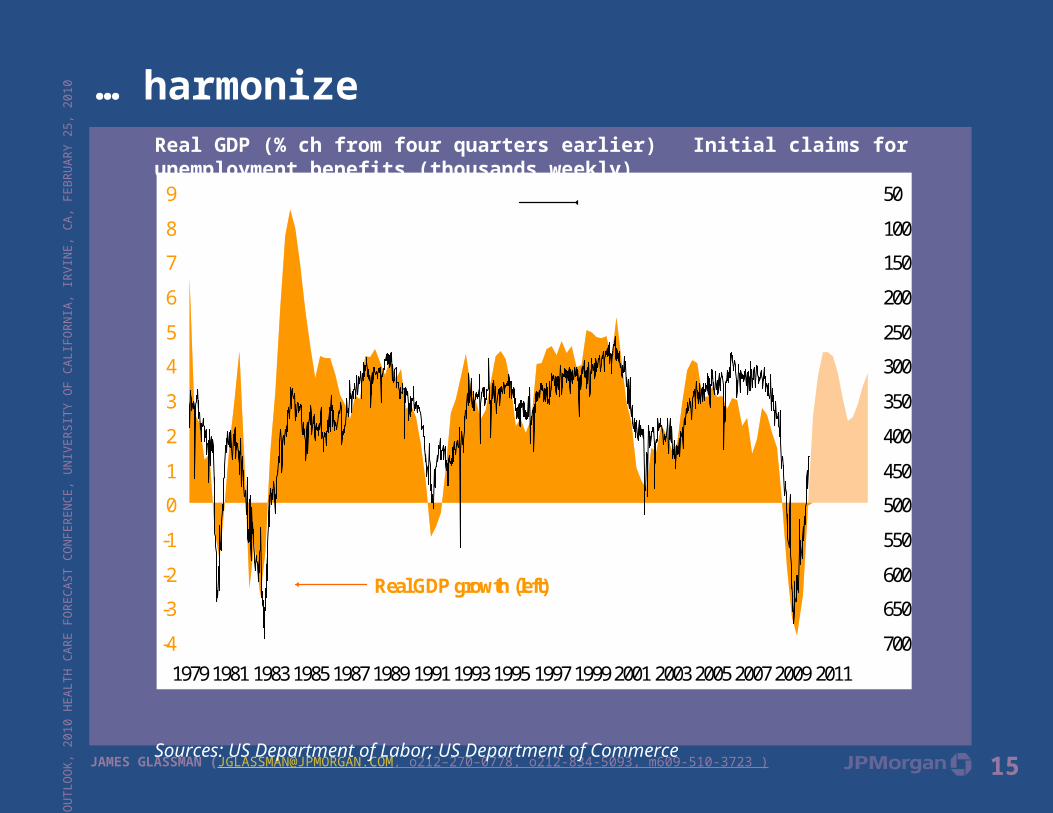
… harmonizeReal GDP (% ch from four quarters earlier) Initial claims for unemployment benefits (thousands weekly)
Sources: US Department of Labor; US Department of Commerce
-4
-3
-2
-1
0
1
2
3
4
5
6
7
8
9
1979 1981 1983 1985 1987 1989 1991 1993 1995 1997 1999 2001 2003 2005 2007 2009 2011
50
100
150
200
250
300
350
400
450
500
550
600
650
700
Real GDP growth (left)
Jobless claims (right, scale is reversed)
Forecast
16
ECO
NOM
IC O
UTLO
OK,
201
0 HE
ALTH
CAR
E FO
RECA
ST C
ONF
EREN
CE, U
NIVE
RSIT
Y O
F CA
LIFO
RNIA
, IRV
INE,
CA,
FEB
RUAR
Y 25
, 201
0
JAMES GLASSMAN ([email protected], o212–270–0778, o212-834-5093, m609-510-3723 )
Inflation … R.I.P.
17
ECO
NOM
IC O
UTLO
OK,
201
0 HE
ALTH
CAR
E FO
RECA
ST C
ONF
EREN
CE, U
NIVE
RSIT
Y O
F CA
LIFO
RNIA
, IRV
INE,
CA,
FEB
RUAR
Y 25
, 201
0
JAMES GLASSMAN ([email protected], o212–270–0778, o212-834-5093, m609-510-3723 )
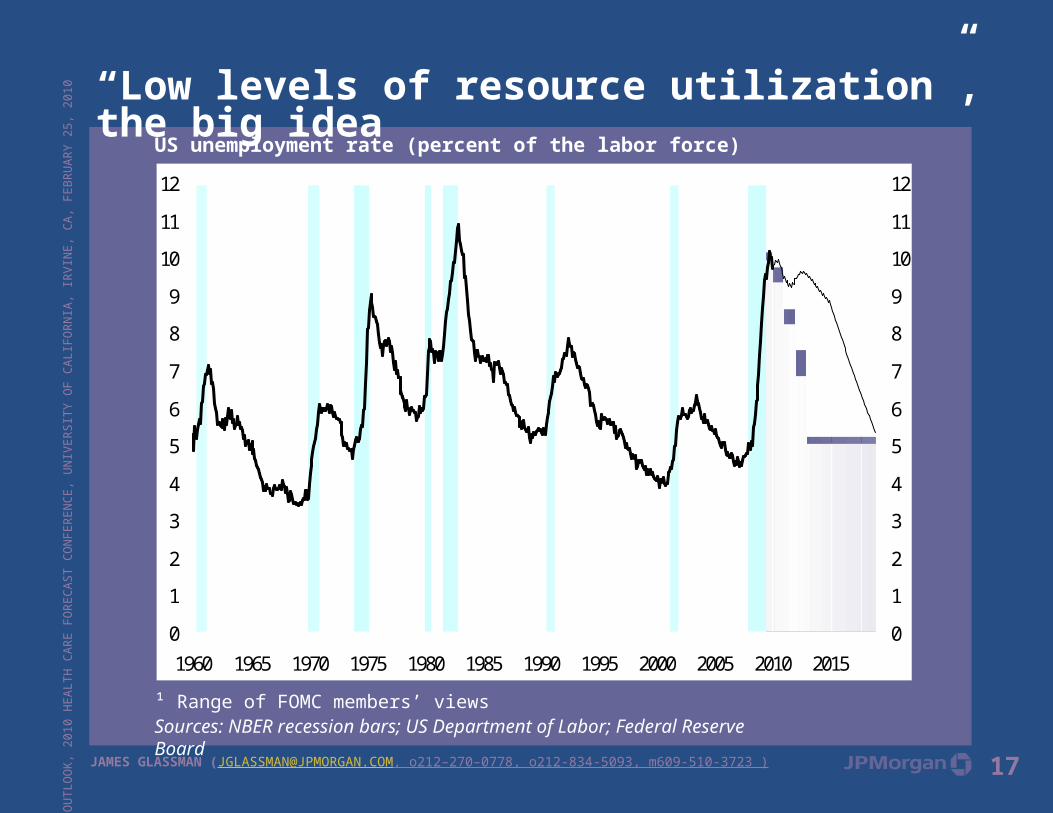
“Low levels of resource utilization”, the big ideaUS unemployment rate (percent of the labor force)
¹ Range of FOMC members’ viewsSources: NBER recession bars; US Department of Labor; Federal Reserve Board
0
1
2
3
4
5
6
7
8
9
10
11
12
1960 1965 1970 1975 1980 1985 1990 1995 2000 2005 2010 20150
1
2
3
4
5
6
7
8
9
10
11
12
The Fed's view about the near-term and sustainable (Nairu) unemployment level¹
Note: thin line represents forecast
18
ECO
NOM
IC O
UTLO
OK,
201
0 HE
ALTH
CAR
E FO
RECA
ST C
ONF
EREN
CE, U
NIVE
RSIT
Y O
F CA
LIFO
RNIA
, IRV
INE,
CA,
FEB
RUAR
Y 25
, 201
0
JAMES GLASSMAN ([email protected], o212–270–0778, o212-834-5093, m609-510-3723 )
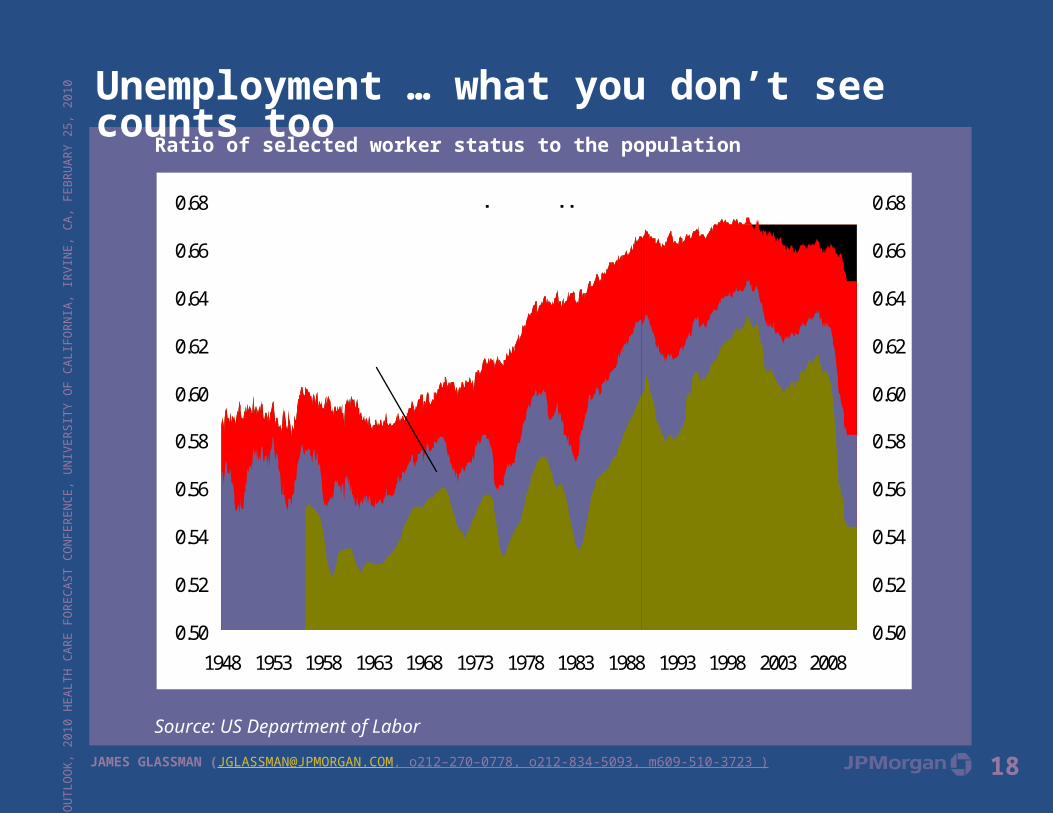
Unemployment … what you don’t see counts tooRatio of selected worker status to the population
Source: US Department of Labor
0.50
0.52
0.54
0.56
0.58
0.60
0.62
0.64
0.66
0.68
1948 1953 1958 1963 1968 1973 1978 1983 1988 1993 1998 2003 20080.50
0.52
0.54
0.56
0.58
0.60
0.62
0.64
0.66
0.68
Working part time because can't find full time work
Actively looking for a job and unemployed
Working full time or by choice, if part time
Gave up and dropped out
19
ECO
NOM
IC O
UTLO
OK,
201
0 HE
ALTH
CAR
E FO
RECA
ST C
ONF
EREN
CE, U
NIVE
RSIT
Y O
F CA
LIFO
RNIA
, IRV
INE,
CA,
FEB
RUAR
Y 25
, 201
0
JAMES GLASSMAN ([email protected], o212–270–0778, o212-834-5093, m609-510-3723 )
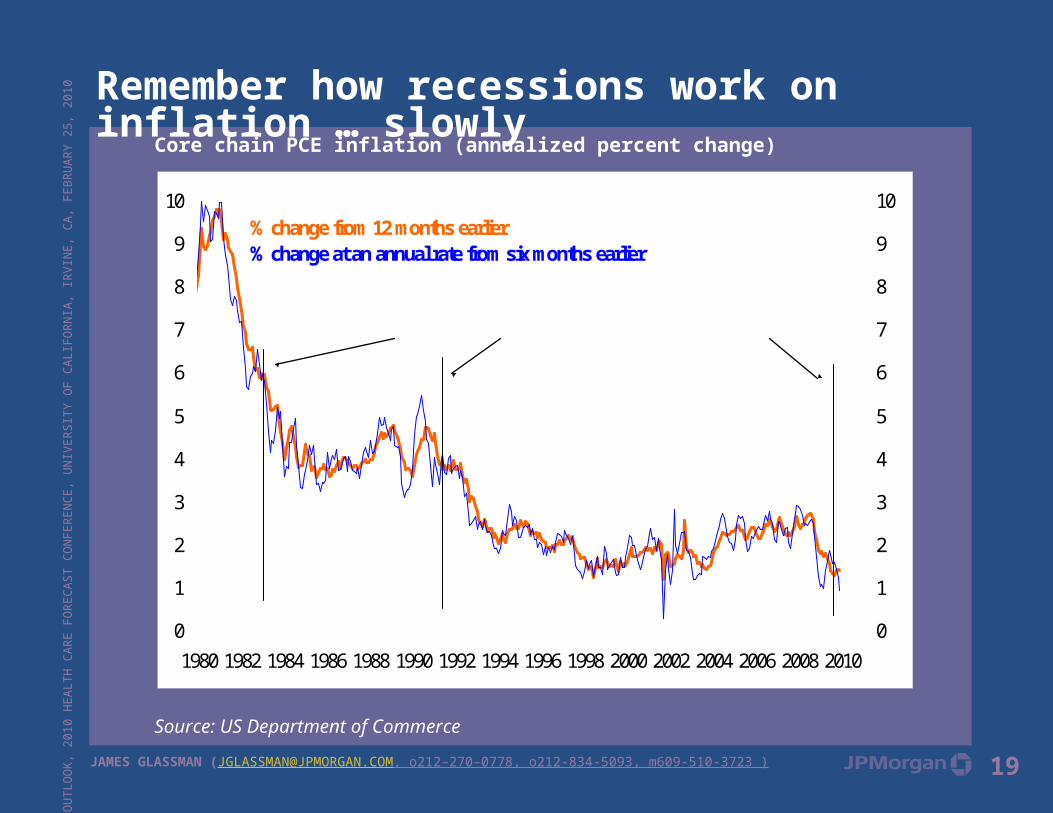
Remember how recessions work on inflation … slowlyCore chain PCE inflation (annualized percent change)
Source: US Department of Commerce
0
1
2
3
4
5
6
7
8
9
10
1980 1982 1984 1986 1988 1990 1992 1994 1996 1998 2000 2002 2004 2006 2008 20100
1
2
3
4
5
6
7
8
9
10% change from 12 months earlier% change at an annual rate from six months earlier
when the recessions are believed to have ended
20
ECO
NOM
IC O
UTLO
OK,
201
0 HE
ALTH
CAR
E FO
RECA
ST C
ONF
EREN
CE, U
NIVE
RSIT
Y O
F CA
LIFO
RNIA
, IRV
INE,
CA,
FEB
RUAR
Y 25
, 201
0
JAMES GLASSMAN ([email protected], o212–270–0778, o212-834-5093, m609-510-3723 )
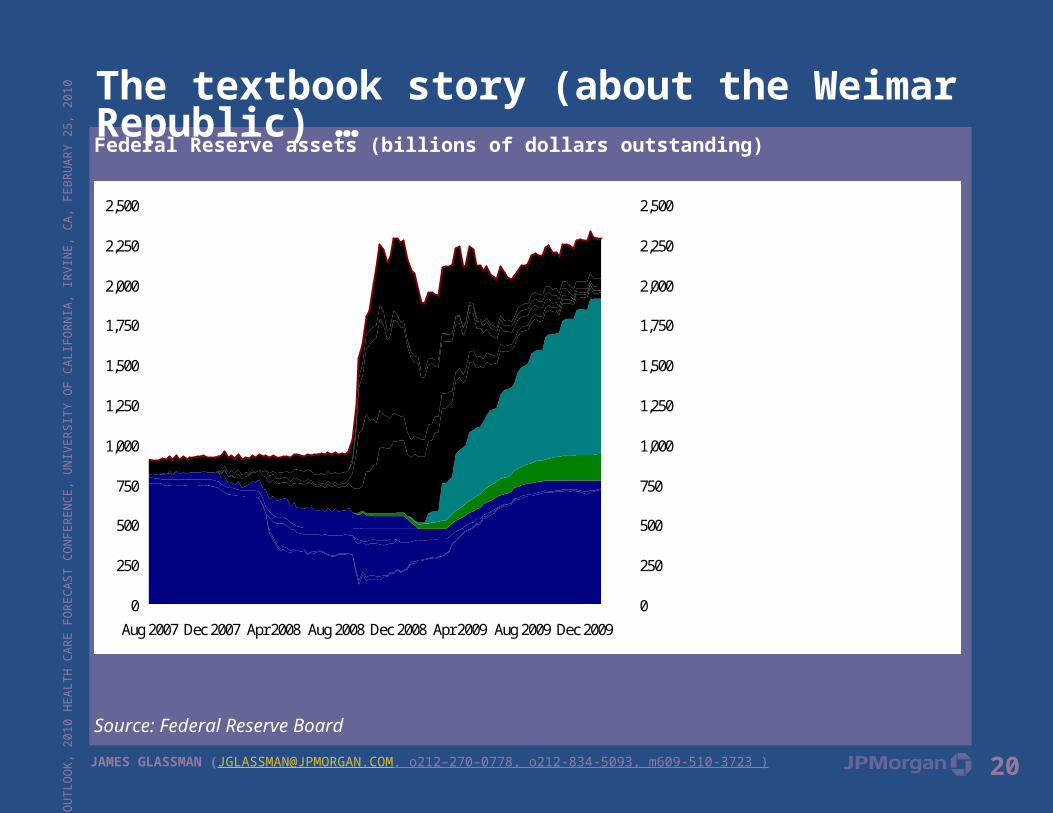
The textbook story (about the Weimar Republic) …Federal Reserve assets (billions of dollars outstanding)
Source: Federal Reserve Board
0
250
500
750
1,000
1,250
1,500
1,750
2,000
2,250
2,500
Aug 2007 Dec 2007 Apr 2008 Aug 2008 Dec 2008 Apr 2009 Aug 2009 Dec 2009
0
250
500
750
1,000
1,250
1,500
1,750
2,000
2,250
2,500
Fed loans
MBS holdings
GSE holdings
Treasuries
21
ECO
NOM
IC O
UTLO
OK,
201
0 HE
ALTH
CAR
E FO
RECA
ST C
ONF
EREN
CE, U
NIVE
RSIT
Y O
F CA
LIFO
RNIA
, IRV
INE,
CA,
FEB
RUAR
Y 25
, 201
0
JAMES GLASSMAN ([email protected], o212–270–0778, o212-834-5093, m609-510-3723 )
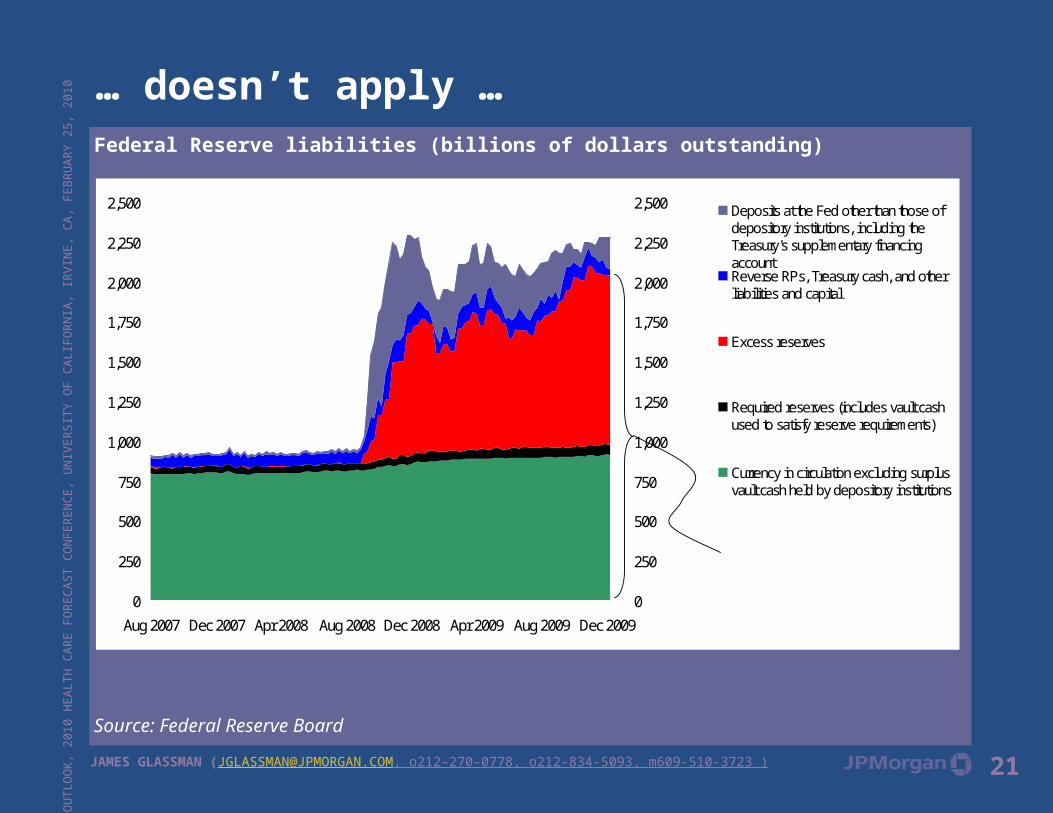
… doesn’t apply …Federal Reserve liabilities (billions of dollars outstanding)
Source: Federal Reserve Board
0
250
500
750
1,000
1,250
1,500
1,750
2,000
2,250
2,500
Aug 2007 Dec 2007 Apr 2008 Aug 2008 Dec 2008 Apr 2009 Aug 2009 Dec 2009
0
250
500
750
1,000
1,250
1,500
1,750
2,000
2,250
2,500 Deposits at the Fed other than those ofdepository institutions, including theTreasury's supplementary financingaccountReverse RPs, Treasury cash, and otherliabilities and capital
Excess reserves
Required reserves (includes vault cashused to satisfy reserve requirements)
Currency in circulation excluding surplusvault cash held by depository institutions
All factors absorbing reserves
monetary base
22
ECO
NOM
IC O
UTLO
OK,
201
0 HE
ALTH
CAR
E FO
RECA
ST C
ONF
EREN
CE, U
NIVE
RSIT
Y O
F CA
LIFO
RNIA
, IRV
INE,
CA,
FEB
RUAR
Y 25
, 201
0
JAMES GLASSMAN ([email protected], o212–270–0778, o212-834-5093, m609-510-3723 )
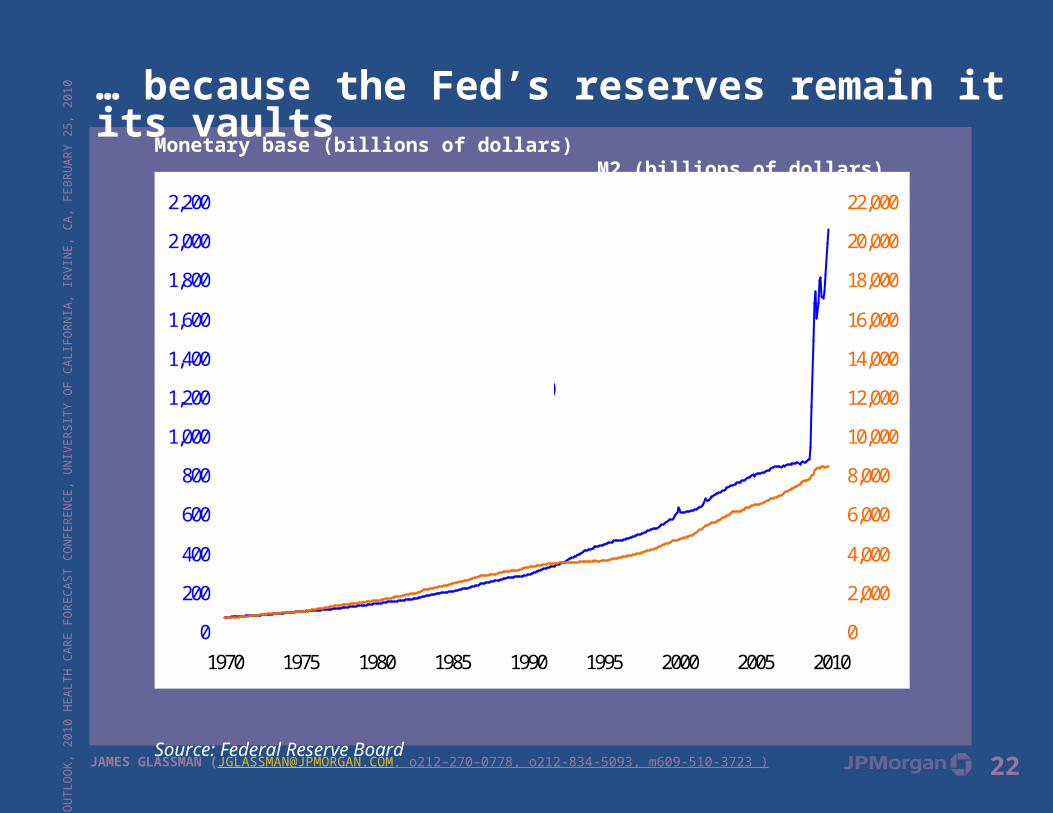
… because the Fed’s reserves remain it its vaultsMonetary base (billions of dollars) M2 (billions of dollars)
Source: Federal Reserve Board
0
200
400
600
800
1,000
1,200
1,400
1,600
1,800
2,000
2,200
1970 1975 1980 1985 1990 1995 2000 2005 20100
2,000
4,000
6,000
8,000
10,000
12,000
14,000
16,000
18,000
20,000
22,000
Monetary base (left scale)M2 (right scale)
23
ECO
NOM
IC O
UTLO
OK,
201
0 HE
ALTH
CAR
E FO
RECA
ST C
ONF
EREN
CE, U
NIVE
RSIT
Y O
F CA
LIFO
RNIA
, IRV
INE,
CA,
FEB
RUAR
Y 25
, 201
0
JAMES GLASSMAN ([email protected], o212–270–0778, o212-834-5093, m609-510-3723 )
Assault on America’s living standard? …
24
ECO
NOM
IC O
UTLO
OK,
201
0 HE
ALTH
CAR
E FO
RECA
ST C
ONF
EREN
CE, U
NIVE
RSIT
Y O
F CA
LIFO
RNIA
, IRV
INE,
CA,
FEB
RUAR
Y 25
, 201
0
JAMES GLASSMAN ([email protected], o212–270–0778, o212-834-5093, m609-510-3723 )
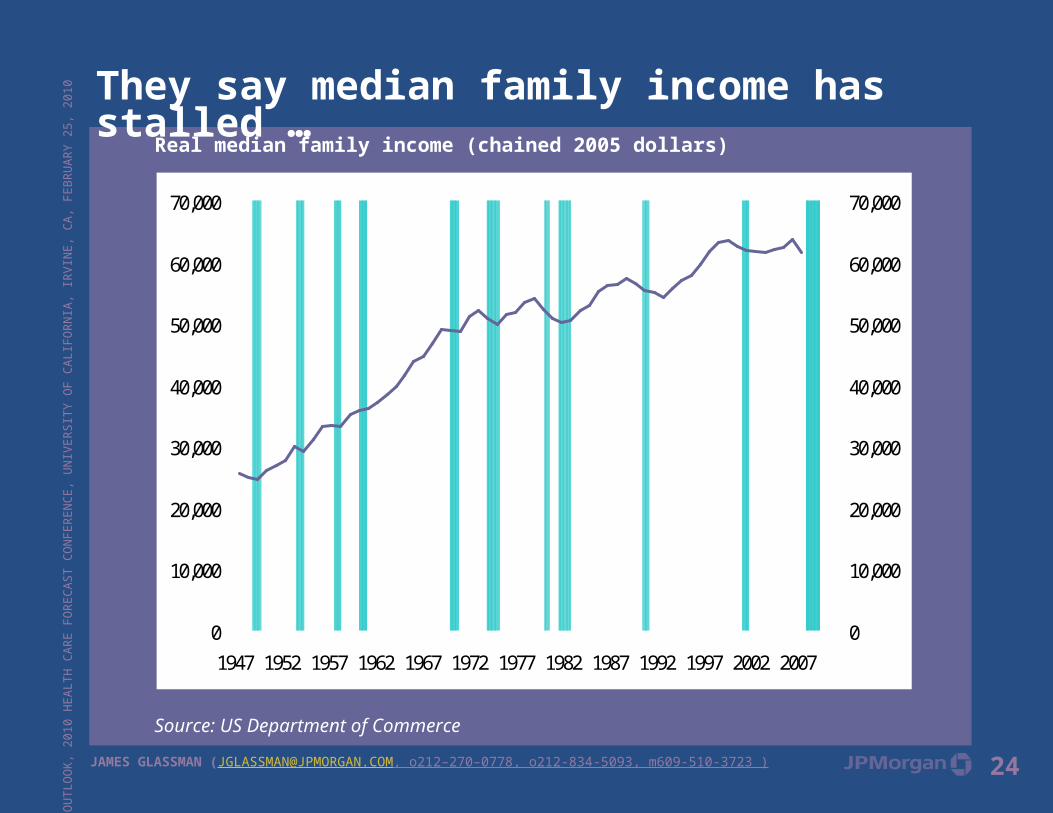
They say median family income has stalled …Real median family income (chained 2005 dollars)
Source: US Department of Commerce
0
10,000
20,000
30,000
40,000
50,000
60,000
70,000
1947 1952 1957 1962 1967 1972 1977 1982 1987 1992 1997 2002 20070
10,000
20,000
30,000
40,000
50,000
60,000
70,000
25
ECO
NOM
IC O
UTLO
OK,
201
0 HE
ALTH
CAR
E FO
RECA
ST C
ONF
EREN
CE, U
NIVE
RSIT
Y O
F CA
LIFO
RNIA
, IRV
INE,
CA,
FEB
RUAR
Y 25
, 201
0
JAMES GLASSMAN ([email protected], o212–270–0778, o212-834-5093, m609-510-3723 )
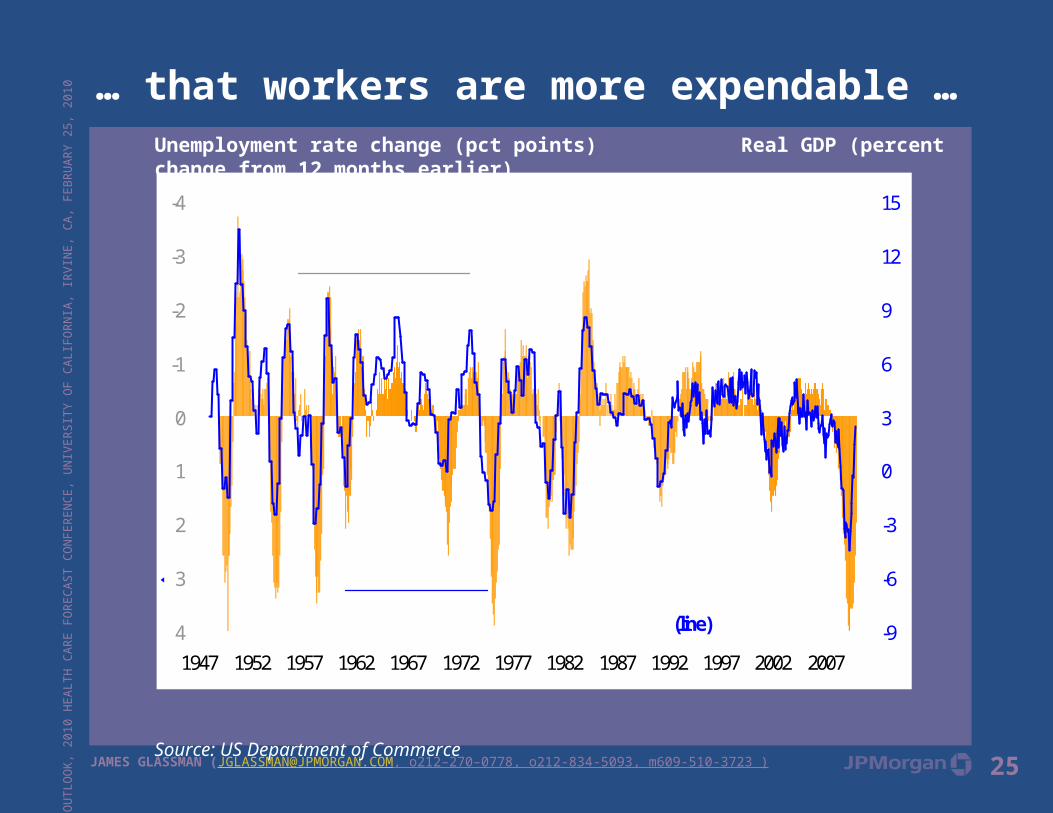
… that workers are more expendable …Unemployment rate change (pct points) Real GDP (percent change from 12 months earlier)
Source: US Department of Commerce
-4
-3
-2
-1
0
1
2
3
41947 1952 1957 1962 1967 1972 1977 1982 1987 1992 1997 2002 2007
-9
-6
-3
0
3
6
9
12
15Change (percentage points) in the unemployment rate over the past 12 months (solid area)
Percent change in real GDP over the past 12 months (line)
26
ECO
NOM
IC O
UTLO
OK,
201
0 HE
ALTH
CAR
E FO
RECA
ST C
ONF
EREN
CE, U
NIVE
RSIT
Y O
F CA
LIFO
RNIA
, IRV
INE,
CA,
FEB
RUAR
Y 25
, 201
0
JAMES GLASSMAN ([email protected], o212–270–0778, o212-834-5093, m609-510-3723 )
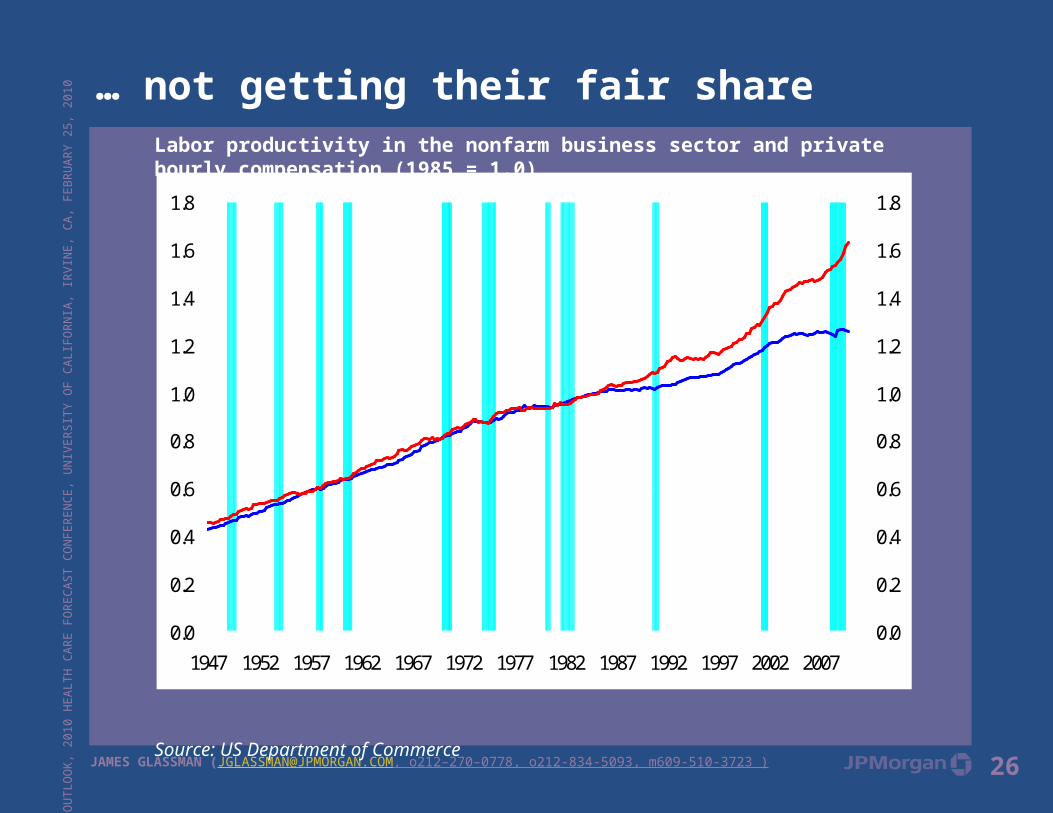
… not getting their fair shareLabor productivity in the nonfarm business sector and private hourly compensation (1985 = 1.0)
Source: US Department of Commerce
0.0
0.2
0.4
0.6
0.8
1.0
1.2
1.4
1.6
1.8
1947 1952 1957 1962 1967 1972 1977 1982 1987 1992 1997 2002 20070.0
0.2
0.4
0.6
0.8
1.0
1.2
1.4
1.6
1.8
Labor productivity
Real private sector hourly compensation
27
ECO
NOM
IC O
UTLO
OK,
201
0 HE
ALTH
CAR
E FO
RECA
ST C
ONF
EREN
CE, U
NIVE
RSIT
Y O
F CA
LIFO
RNIA
, IRV
INE,
CA,
FEB
RUAR
Y 25
, 201
0
JAMES GLASSMAN ([email protected], o212–270–0778, o212-834-5093, m609-510-3723 )
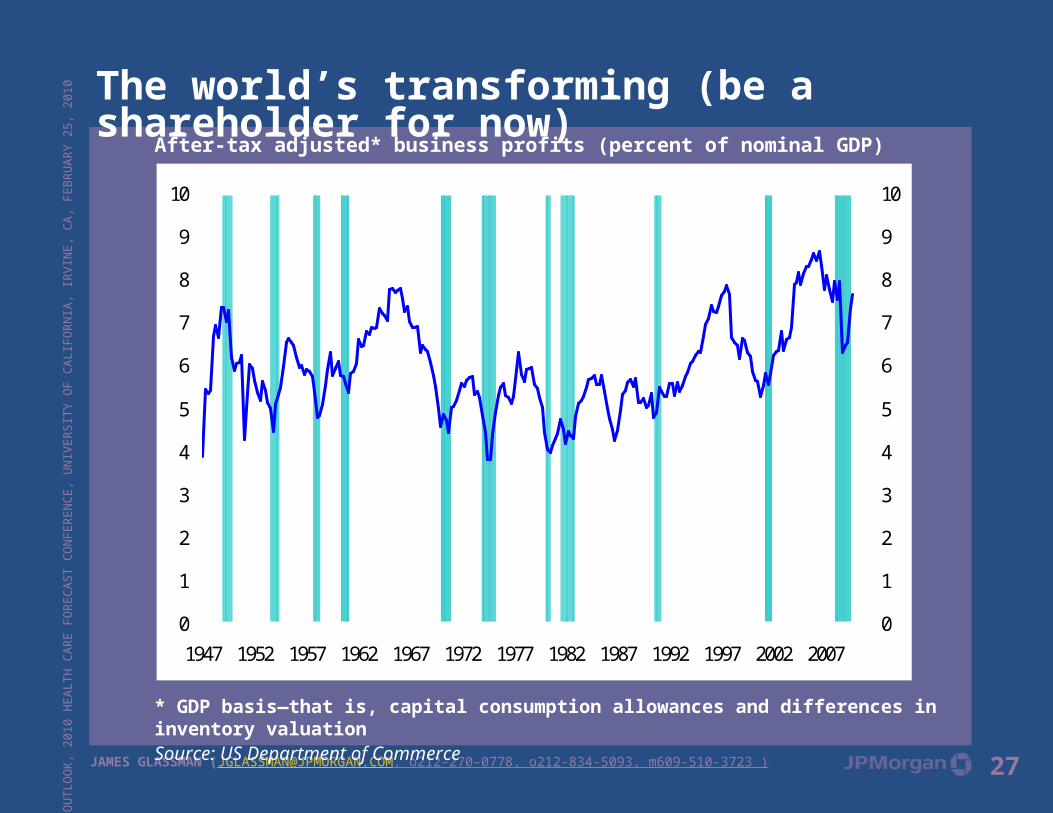
The world’s transforming (be a shareholder for now)After-tax adjusted* business profits (percent of nominal GDP)
* GDP basis—that is, capital consumption allowances and differences in inventory valuationSource: US Department of Commerce
0
1
2
3
4
5
6
7
8
9
10
1947 1952 1957 1962 1967 1972 1977 1982 1987 1992 1997 2002 20070
1
2
3
4
5
6
7
8
9
10
28
ECO
NOM
IC O
UTLO
OK,
201
0 HE
ALTH
CAR
E FO
RECA
ST C
ONF
EREN
CE, U
NIVE
RSIT
Y O
F CA
LIFO
RNIA
, IRV
INE,
CA,
FEB
RUAR
Y 25
, 201
0
JAMES GLASSMAN ([email protected], o212–270–0778, o212-834-5093, m609-510-3723 )
Conclusion … use your imagination
29
ECO
NOM
IC O
UTLO
OK,
201
0 HE
ALTH
CAR
E FO
RECA
ST C
ONF
EREN
CE, U
NIVE
RSIT
Y O
F CA
LIFO
RNIA
, IRV
INE,
CA,
FEB
RUAR
Y 25
, 201
0
JAMES GLASSMAN ([email protected], o212–270–0778, o212-834-5093, m609-510-3723 )
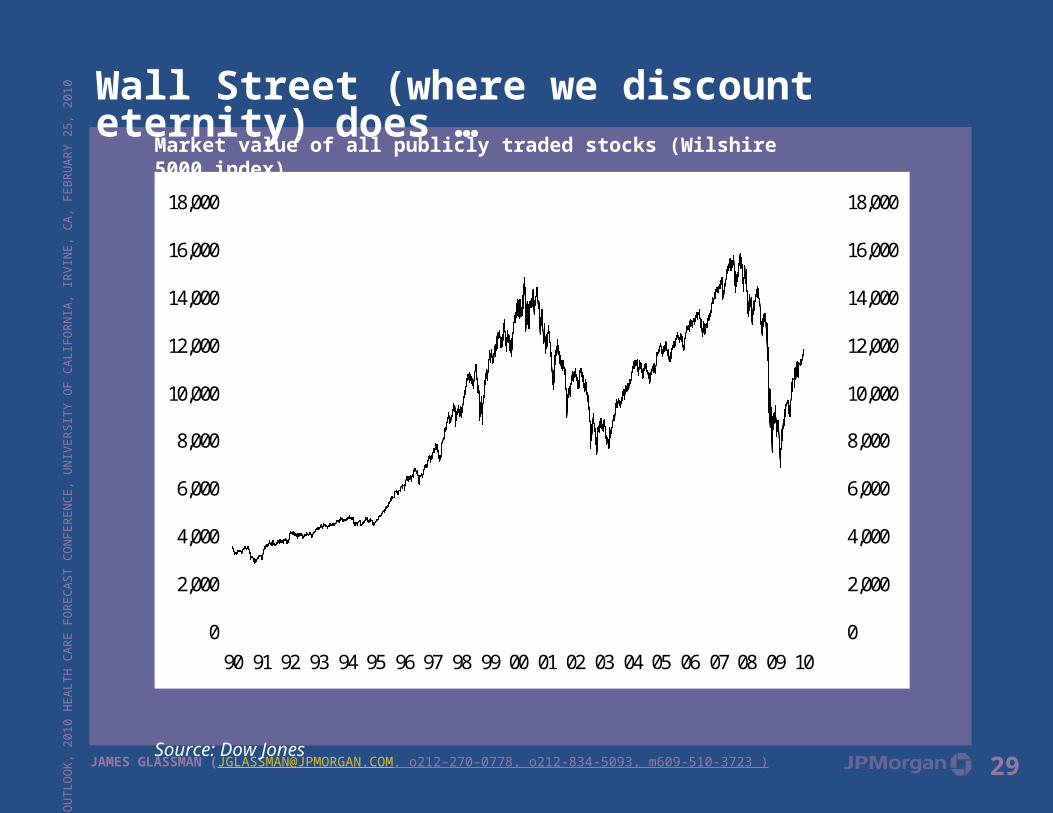
Wall Street (where we discount eternity) does …Market value of all publicly traded stocks (Wilshire 5000 index)
Source: Dow Jones
0
2,000
4,000
6,000
8,000
10,000
12,000
14,000
16,000
18,000
90 91 92 93 94 95 96 97 98 99 00 01 02 03 04 05 06 07 08 09 100
2,000
4,000
6,000
8,000
10,000
12,000
14,000
16,000
18,000
30
ECO
NOM
IC O
UTLO
OK,
201
0 HE
ALTH
CAR
E FO
RECA
ST C
ONF
EREN
CE, U
NIVE
RSIT
Y O
F CA
LIFO
RNIA
, IRV
INE,
CA,
FEB
RUAR
Y 25
, 201
0
JAMES GLASSMAN ([email protected], o212–270–0778, o212-834-5093, m609-510-3723 )
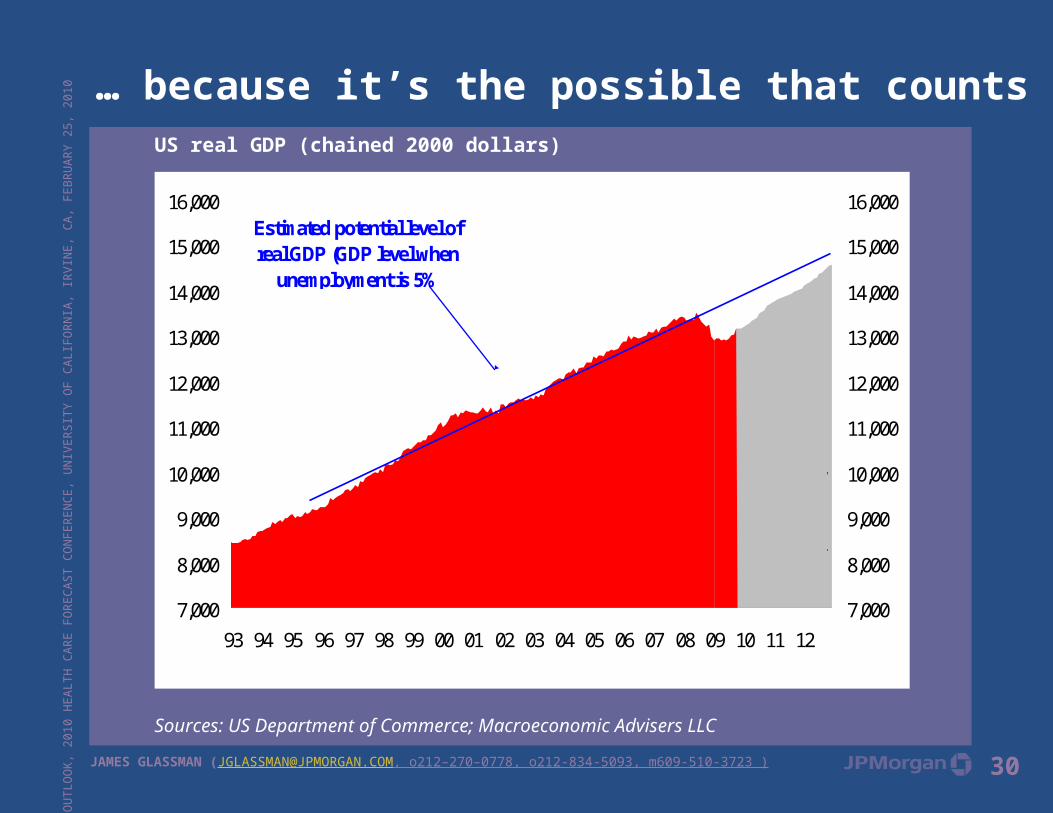
… because it’s the possible that countsUS real GDP (chained 2000 dollars)
Sources: US Department of Commerce; Macroeconomic Advisers LLC
7,000
8,000
9,000
10,000
11,000
12,000
13,000
14,000
15,000
16,000
93 94 95 96 97 98 99 00 01 02 03 04 05 06 07 08 09 10 11 127,000
8,000
9,000
10,000
11,000
12,000
13,000
14,000
15,000
16,000Estimated potential level of real GDP (GDP level when
unemployment is 5%
If the economy
grows 4.4%, 2.4%, and
3.7% in 2010, 2011, and
2012, respectively, and 4% after
that
31
ECO
NOM
IC O
UTLO
OK,
201
0 HE
ALTH
CAR
E FO
RECA
ST C
ONF
EREN
CE, U
NIVE
RSIT
Y O
F CA
LIFO
RNIA
, IRV
INE,
CA,
FEB
RUAR
Y 25
, 201
0
JAMES GLASSMAN ([email protected], o212–270–0778, o212-834-5093, m609-510-3723 )
Appendix 1. Fiscal foxes and red herrings
32
ECO
NOM
IC O
UTLO
OK,
201
0 HE
ALTH
CAR
E FO
RECA
ST C
ONF
EREN
CE, U
NIVE
RSIT
Y O
F CA
LIFO
RNIA
, IRV
INE,
CA,
FEB
RUAR
Y 25
, 201
0
JAMES GLASSMAN ([email protected], o212–270–0778, o212-834-5093, m609-510-3723 )
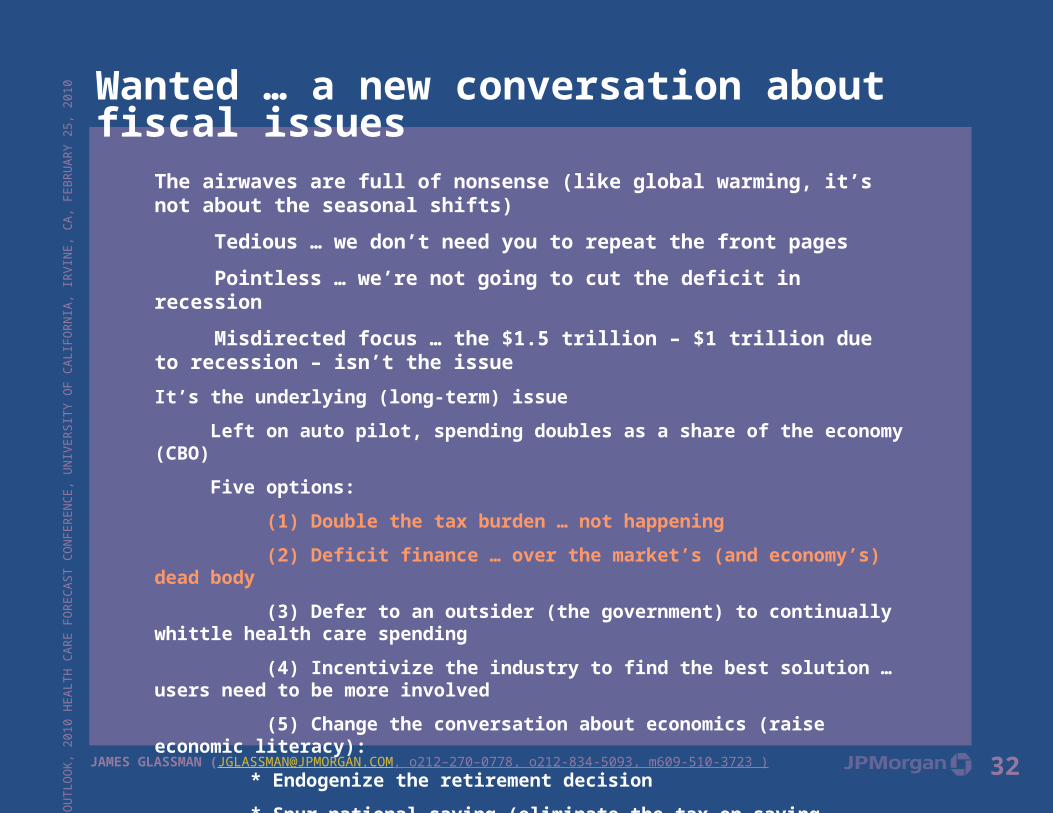
Wanted … a new conversation about fiscal issues
The airwaves are full of nonsense (like global warming, it’s not about the seasonal shifts)
Tedious … we don’t need you to repeat the front pages
Pointless … we’re not going to cut the deficit in recession
Misdirected focus … the $1.5 trillion – $1 trillion due to recession – isn’t the issue
It’s the underlying (long-term) issue
Left on auto pilot, spending doubles as a share of the economy (CBO)
Five options:
(1) Double the tax burden … not happening
(2) Deficit finance … over the market’s (and economy’s) dead body
(3) Defer to an outsider (the government) to continually whittle health care spending
(4) Incentivize the industry to find the best solution … users need to be more involved
(5) Change the conversation about economics (raise economic literacy):
* Endogenize the retirement decision
* Spur national saving (eliminate the tax on saving, consumption-based income tax)
* Eliminate the corporate income tax (people pay taxes)
* Eliminate the employer deductibility of health care expenses
* Tort reform
33
ECO
NOM
IC O
UTLO
OK,
201
0 HE
ALTH
CAR
E FO
RECA
ST C
ONF
EREN
CE, U
NIVE
RSIT
Y O
F CA
LIFO
RNIA
, IRV
INE,
CA,
FEB
RUAR
Y 25
, 201
0
JAMES GLASSMAN ([email protected], o212–270–0778, o212-834-5093, m609-510-3723 )
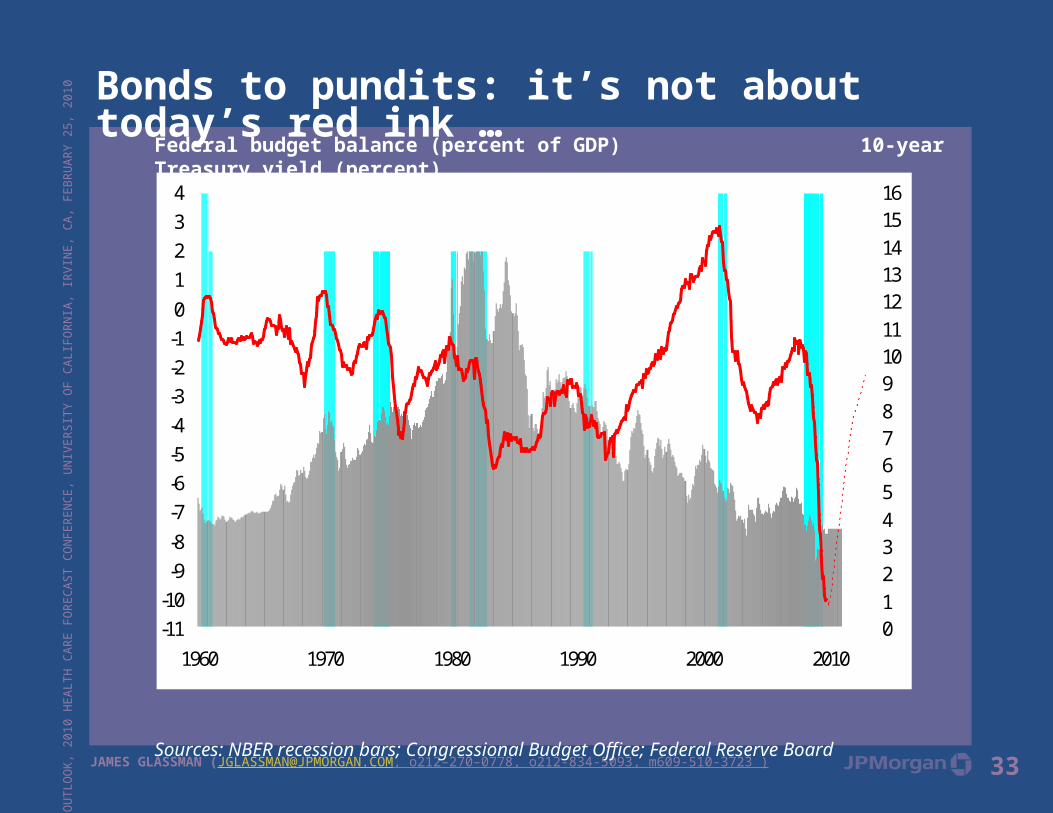
Bonds to pundits: it’s not about today’s red ink …Federal budget balance (percent of GDP) 10-year Treasury yield (percent)
Sources: NBER recession bars; Congressional Budget Office; Federal Reserve Board
-11-10-9-8-7-6-5-4-3-2-101234
1960 1970 1980 1990 2000 2010012345678910111213141516
Actual federal budget balance (% of GDP) on the left scale10-year Treasury yield on the right scale
34
ECO
NOM
IC O
UTLO
OK,
201
0 HE
ALTH
CAR
E FO
RECA
ST C
ONF
EREN
CE, U
NIVE
RSIT
Y O
F CA
LIFO
RNIA
, IRV
INE,
CA,
FEB
RUAR
Y 25
, 201
0
JAMES GLASSMAN ([email protected], o212–270–0778, o212-834-5093, m609-510-3723 )
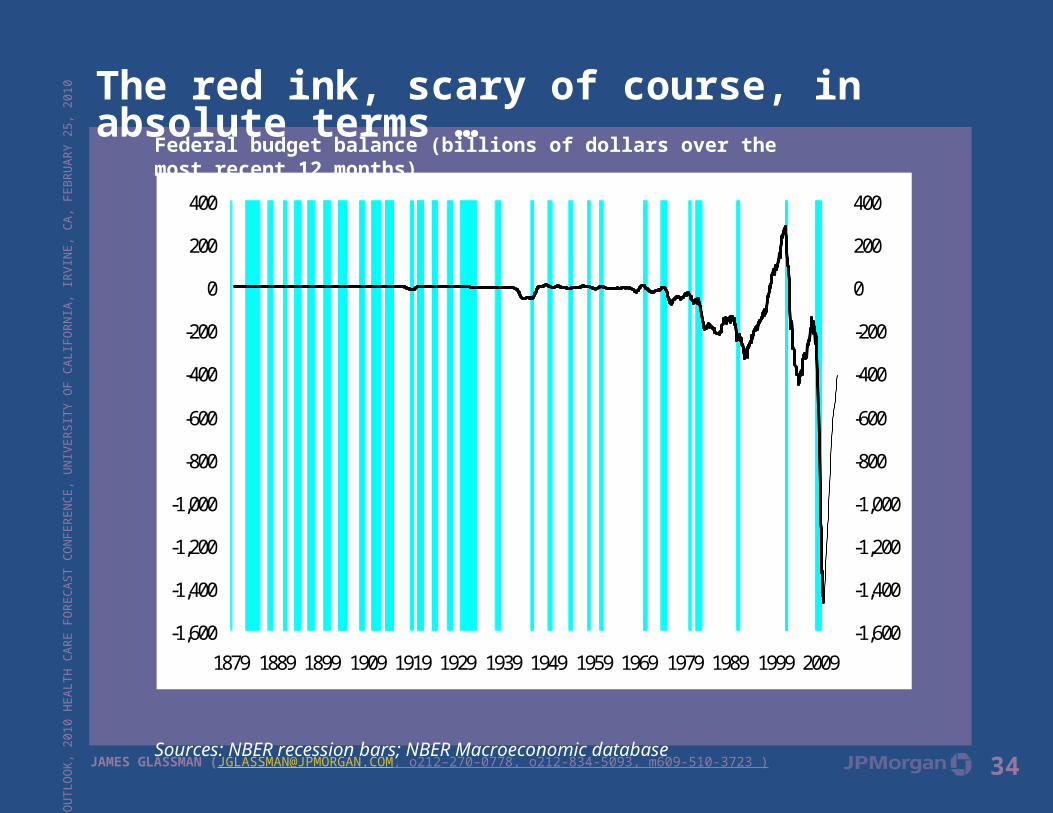
The red ink, scary of course, in absolute terms …Federal budget balance (billions of dollars over the most recent 12 months)
Sources: NBER recession bars; NBER Macroeconomic database
-1,600
-1,400
-1,200
-1,000
-800
-600
-400
-200
0
200
400
1879 1889 1899 1909 1919 1929 1939 1949 1959 1969 1979 1989 1999 2009-1,600
-1,400
-1,200
-1,000
-800
-600
-400
-200
0
200
400
35
ECO
NOM
IC O
UTLO
OK,
201
0 HE
ALTH
CAR
E FO
RECA
ST C
ONF
EREN
CE, U
NIVE
RSIT
Y O
F CA
LIFO
RNIA
, IRV
INE,
CA,
FEB
RUAR
Y 25
, 201
0
JAMES GLASSMAN ([email protected], o212–270–0778, o212-834-5093, m609-510-3723 )
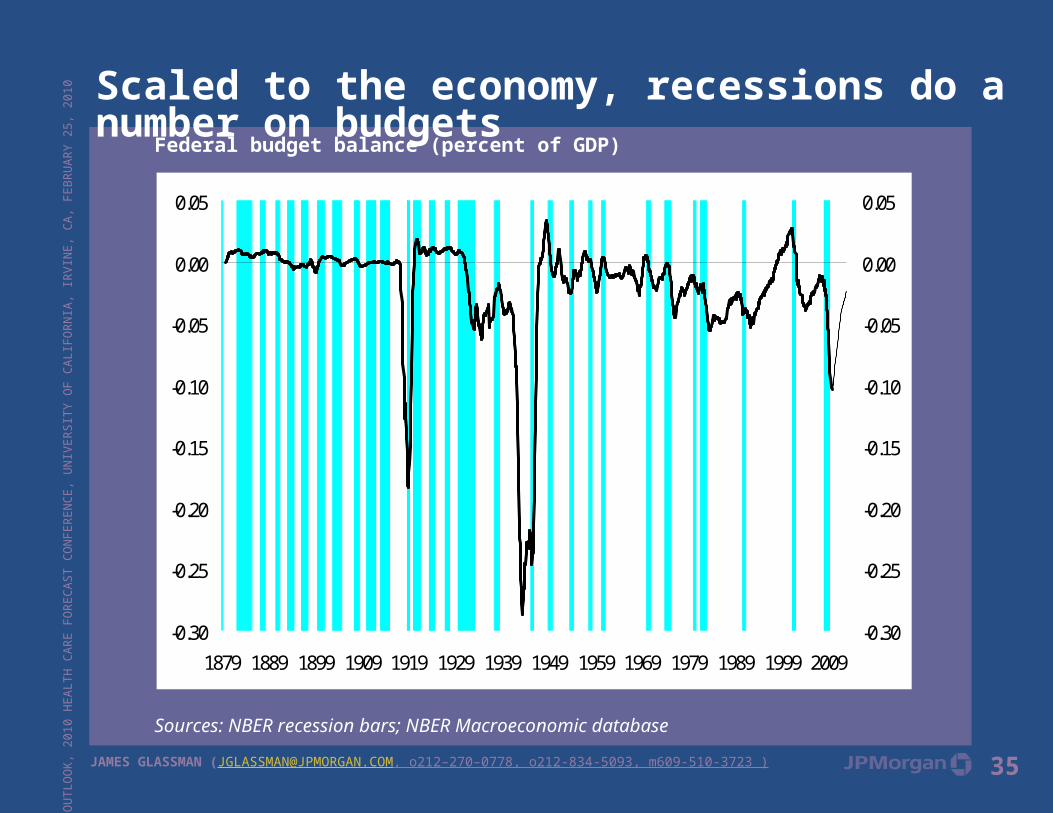
Scaled to the economy, recessions do a number on budgetsFederal budget balance (percent of GDP)
Sources: NBER recession bars; NBER Macroeconomic database
-0.30
-0.25
-0.20
-0.15
-0.10
-0.05
0.00
0.05
1879 1889 1899 1909 1919 1929 1939 1949 1959 1969 1979 1989 1999 2009-0.30
-0.25
-0.20
-0.15
-0.10
-0.05
0.00
0.05
36
ECO
NOM
IC O
UTLO
OK,
201
0 HE
ALTH
CAR
E FO
RECA
ST C
ONF
EREN
CE, U
NIVE
RSIT
Y O
F CA
LIFO
RNIA
, IRV
INE,
CA,
FEB
RUAR
Y 25
, 201
0
JAMES GLASSMAN ([email protected], o212–270–0778, o212-834-5093, m609-510-3723 )
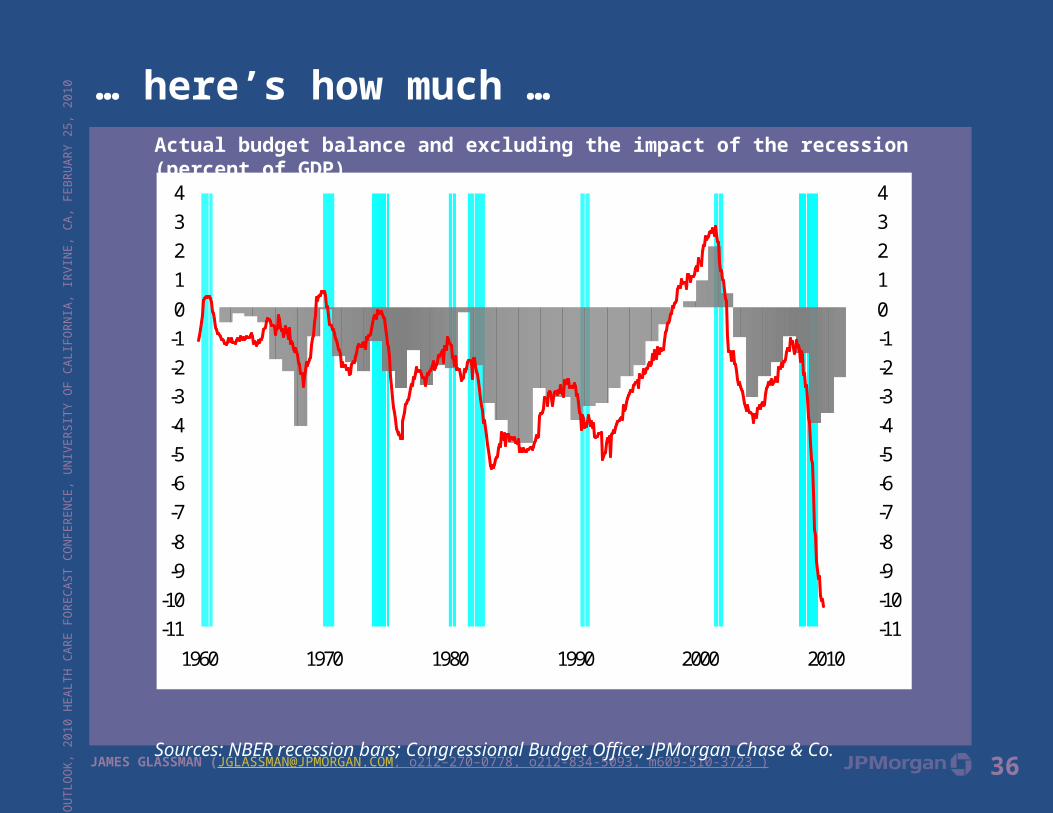
… here’s how much …Actual budget balance and excluding the impact of the recession (percent of GDP)
Sources: NBER recession bars; Congressional Budget Office; JPMorgan Chase & Co.
-11-10-9-8-7-6-5-4-3-2-101234
1960 1970 1980 1990 2000 2010-11-10-9-8-7-6-5-4-3-2-101234
Actual federal deficit (% of potential GDP)Cyclically-adjusted federal deficit (% of potential GDP)
37
ECO
NOM
IC O
UTLO
OK,
201
0 HE
ALTH
CAR
E FO
RECA
ST C
ONF
EREN
CE, U
NIVE
RSIT
Y O
F CA
LIFO
RNIA
, IRV
INE,
CA,
FEB
RUAR
Y 25
, 201
0
JAMES GLASSMAN ([email protected], o212–270–0778, o212-834-5093, m609-510-3723 )
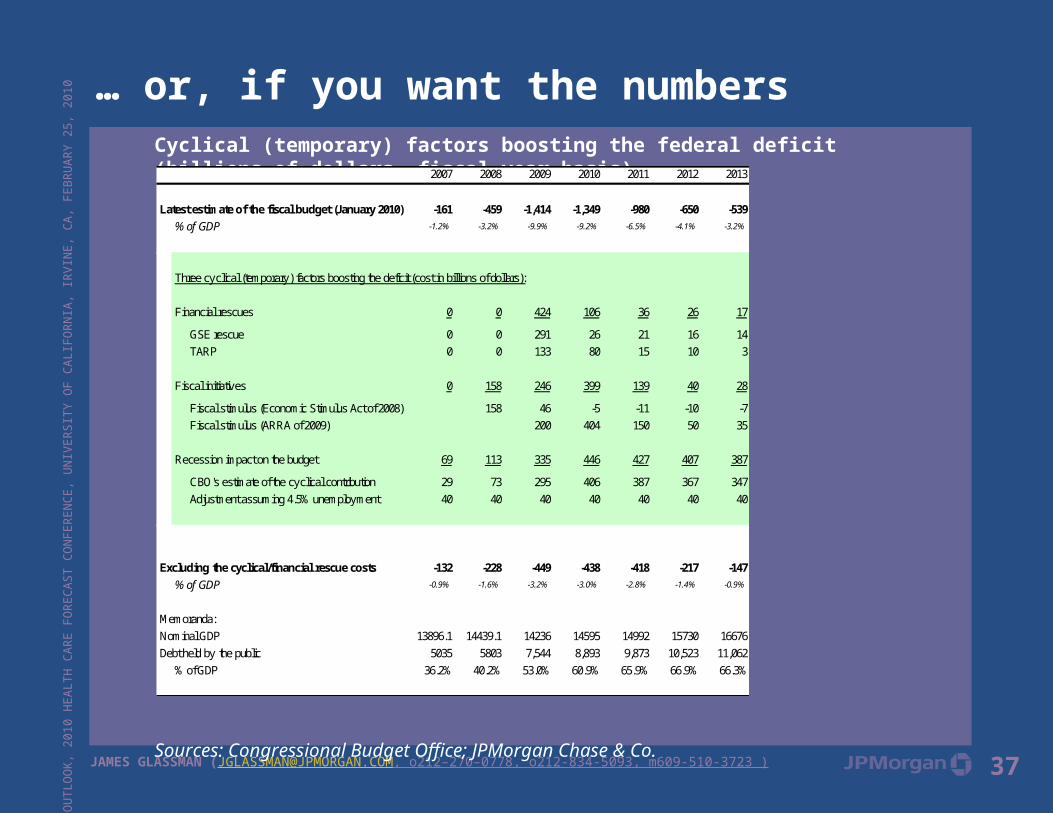
… or, if you want the numbersCyclical (temporary) factors boosting the federal deficit (billions of dollars, fiscal year basis)
Sources: Congressional Budget Office; JPMorgan Chase & Co.
2007 2008 2009 2010 2011 2012 2013
Latest estimate of the fiscal budget (January 2010) -161 -459 -1,414 -1,349 -980 -650 -539
% of GDP -1.2% -3.2% -9.9% -9.2% -6.5% -4.1% -3.2%
Three cy clical (temporary ) factors boosting the deficit (cost in billions of dollars):
Financial rescues 0 0 424 106 36 26 17
GSE rescue 0 0 291 26 21 16 14TARP 0 0 133 80 15 10 3
Fiscal initiativ es 0 158 246 399 139 40 28
Fiscal stimulus (Economic Stimulus Act of 2008) 158 46 -5 -11 -10 -7Fiscal stimulus (ARRA of 2009) 200 404 150 50 35
Recession impact on the budget 69 113 335 446 427 407 387
CBO's estimate of the cy clical contribution 29 73 295 406 387 367 347Adjustment assuming 4.5% unemploy ment 40 40 40 40 40 40 40
Excluding the cyclical/financial rescue costs -132 -228 -449 -438 -418 -217 -147
% of GDP -0.9% -1.6% -3.2% -3.0% -2.8% -1.4% -0.9%
Memoranda:Nominal GDP 13896.1 14439.1 14236 14595 14992 15730 16676Debt held by the public 5035 5803 7,544 8,893 9,873 10,523 11,062
% of GDP 36.2% 40.2% 53.0% 60.9% 65.9% 66.9% 66.3%
38
ECO
NOM
IC O
UTLO
OK,
201
0 HE
ALTH
CAR
E FO
RECA
ST C
ONF
EREN
CE, U
NIVE
RSIT
Y O
F CA
LIFO
RNIA
, IRV
INE,
CA,
FEB
RUAR
Y 25
, 201
0
JAMES GLASSMAN ([email protected], o212–270–0778, o212-834-5093, m609-510-3723 )
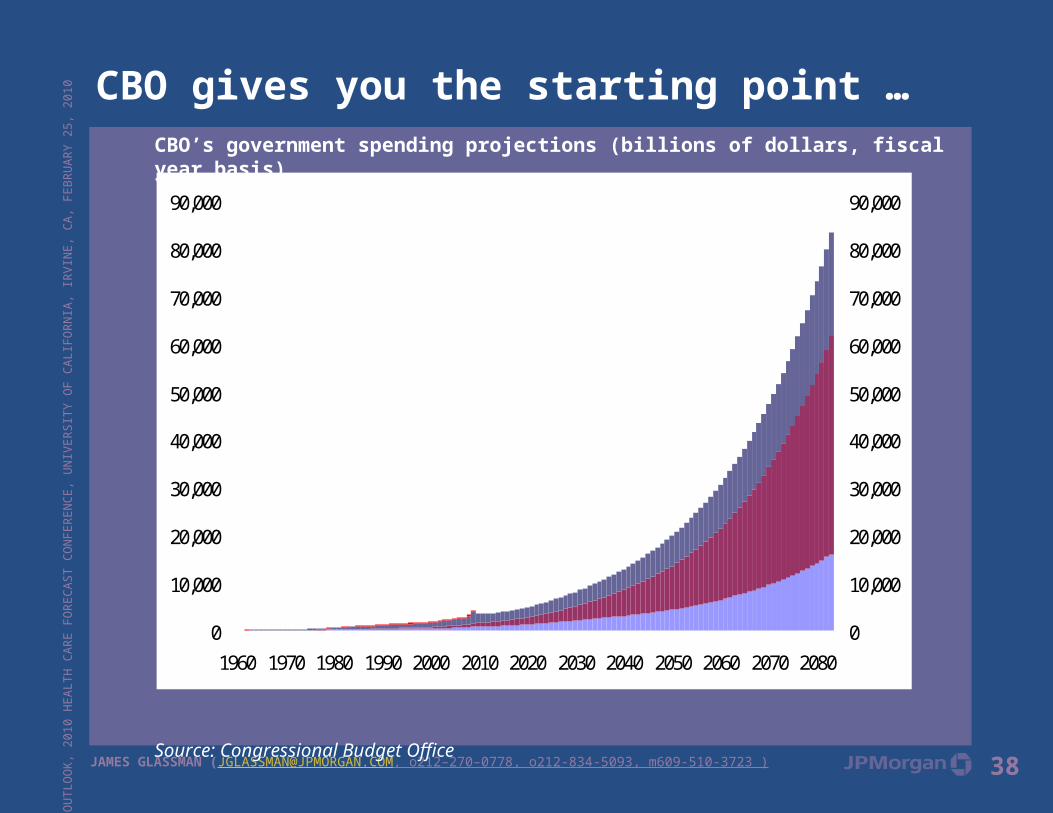
CBO gives you the starting point …CBO’s government spending projections (billions of dollars, fiscal year basis)
Source: Congressional Budget Office
0
10,000
20,000
30,000
40,000
50,000
60,000
70,000
80,000
90,000
1960 1970 1980 1990 2000 2010 2020 2030 2040 2050 2060 2070 20800
10,000
20,000
30,000
40,000
50,000
60,000
70,000
80,000
90,000
Debt service
Other
Medicare and Medicaid
Social Security
39
ECO
NOM
IC O
UTLO
OK,
201
0 HE
ALTH
CAR
E FO
RECA
ST C
ONF
EREN
CE, U
NIVE
RSIT
Y O
F CA
LIFO
RNIA
, IRV
INE,
CA,
FEB
RUAR
Y 25
, 201
0
JAMES GLASSMAN ([email protected], o212–270–0778, o212-834-5093, m609-510-3723 )
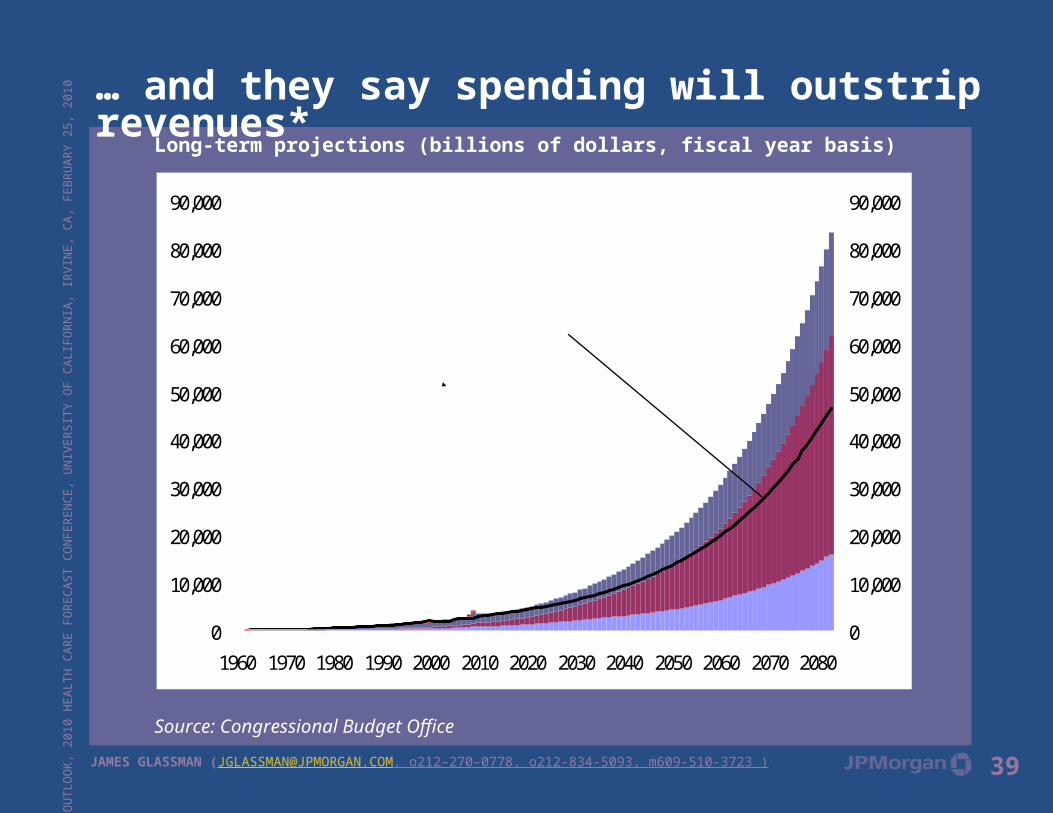
… and they say spending will outstrip revenues*Long-term projections (billions of dollars, fiscal year basis)
Source: Congressional Budget Office
0
10,000
20,000
30,000
40,000
50,000
60,000
70,000
80,000
90,000
1960 1970 1980 1990 2000 2010 2020 2030 2040 2050 2060 2070 20800
10,000
20,000
30,000
40,000
50,000
60,000
70,000
80,000
90,000
Debt service
Other
Medicare and Medicaid
Social Security
Revenues (historical average of 18.1% of GDP
and assuming CBO's GDP assumption)
40
ECO
NOM
IC O
UTLO
OK,
201
0 HE
ALTH
CAR
E FO
RECA
ST C
ONF
EREN
CE, U
NIVE
RSIT
Y O
F CA
LIFO
RNIA
, IRV
INE,
CA,
FEB
RUAR
Y 25
, 201
0
JAMES GLASSMAN ([email protected], o212–270–0778, o212-834-5093, m609-510-3723 )
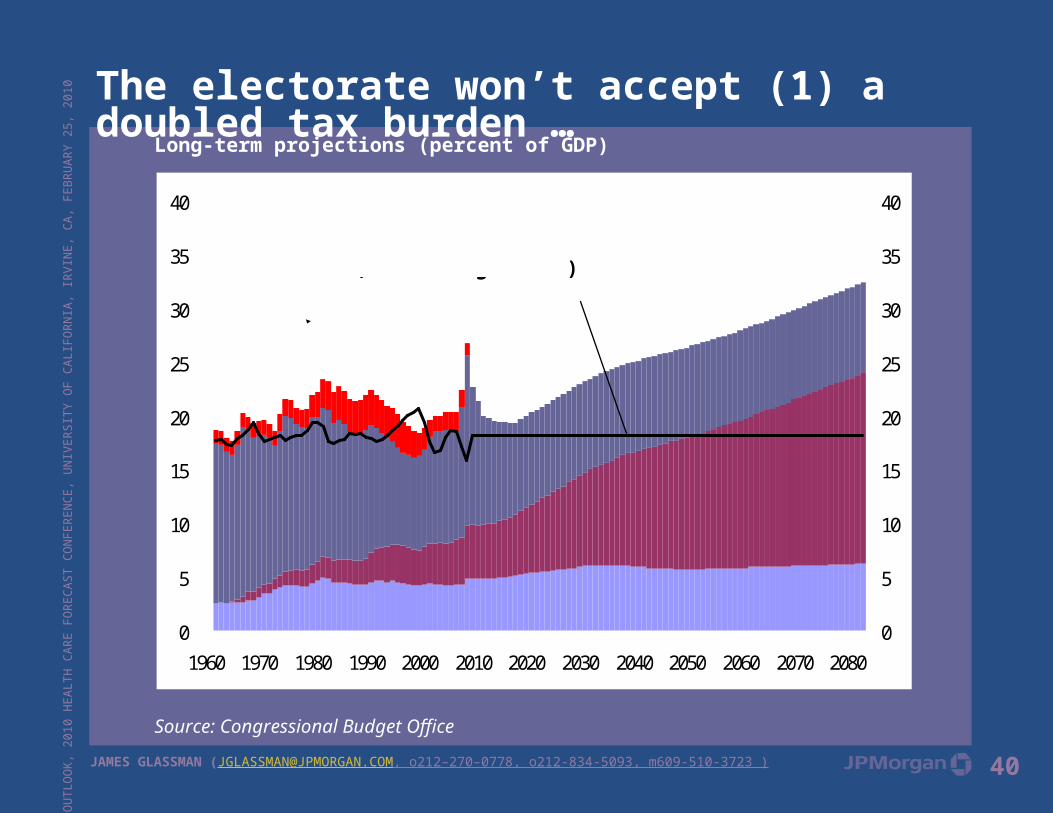
The electorate won’t accept (1) a doubled tax burden …Long-term projections (percent of GDP)
Source: Congressional Budget Office
0
5
10
15
20
25
30
35
40
1960 1970 1980 1990 2000 2010 2020 2030 2040 2050 2060 2070 20800
5
10
15
20
25
30
35
40
Debt service
Other
Medicare and Medicaid
Social Security
Revenues (historical average of 18.1%)
41
ECO
NOM
IC O
UTLO
OK,
201
0 HE
ALTH
CAR
E FO
RECA
ST C
ONF
EREN
CE, U
NIVE
RSIT
Y O
F CA
LIFO
RNIA
, IRV
INE,
CA,
FEB
RUAR
Y 25
, 201
0
JAMES GLASSMAN ([email protected], o212–270–0778, o212-834-5093, m609-510-3723 )
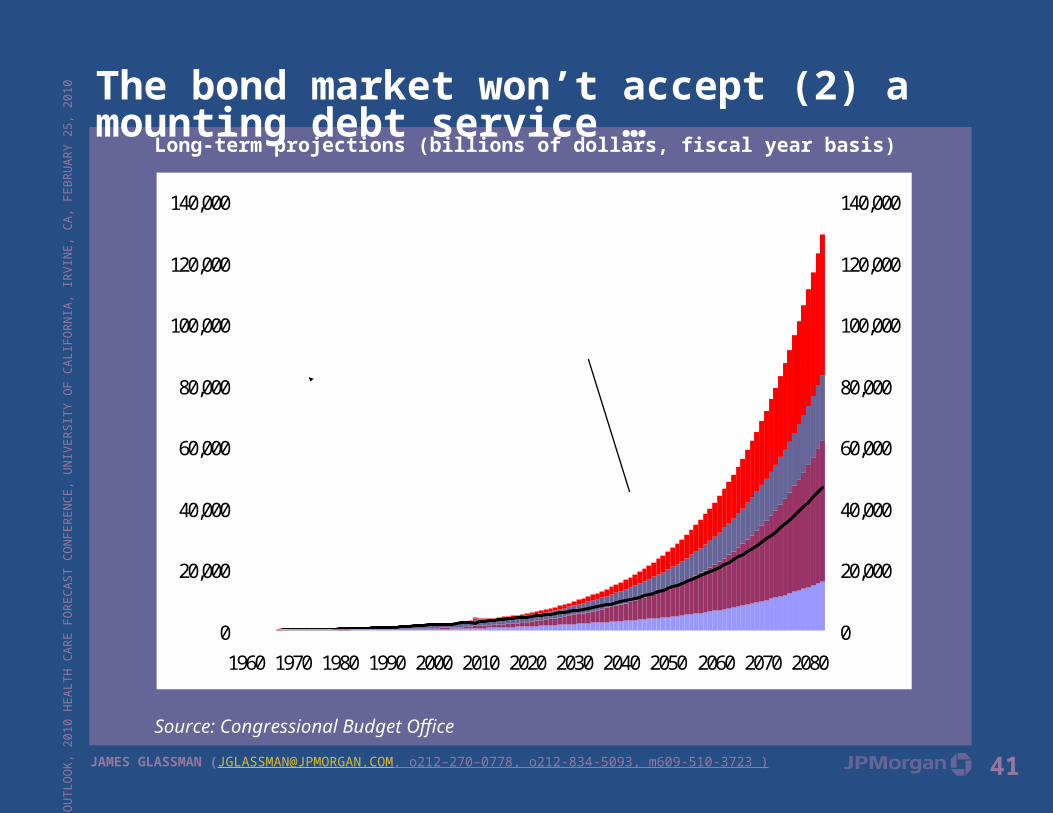
The bond market won’t accept (2) a mounting debt service …Long-term projections (billions of dollars, fiscal year basis)
Source: Congressional Budget Office
0
20,000
40,000
60,000
80,000
100,000
120,000
140,000
1960 1970 1980 1990 2000 2010 2020 2030 2040 2050 2060 2070 20800
20,000
40,000
60,000
80,000
100,000
120,000
140,000
Debt service
Other
Medicare and Medicaid
Social Security
Revenues (historical average of 18.1% of GDP
and assuming CBO's 2.2% long-run GDP growth
assumption)
42
ECO
NOM
IC O
UTLO
OK,
201
0 HE
ALTH
CAR
E FO
RECA
ST C
ONF
EREN
CE, U
NIVE
RSIT
Y O
F CA
LIFO
RNIA
, IRV
INE,
CA,
FEB
RUAR
Y 25
, 201
0
JAMES GLASSMAN ([email protected], o212–270–0778, o212-834-5093, m609-510-3723 )
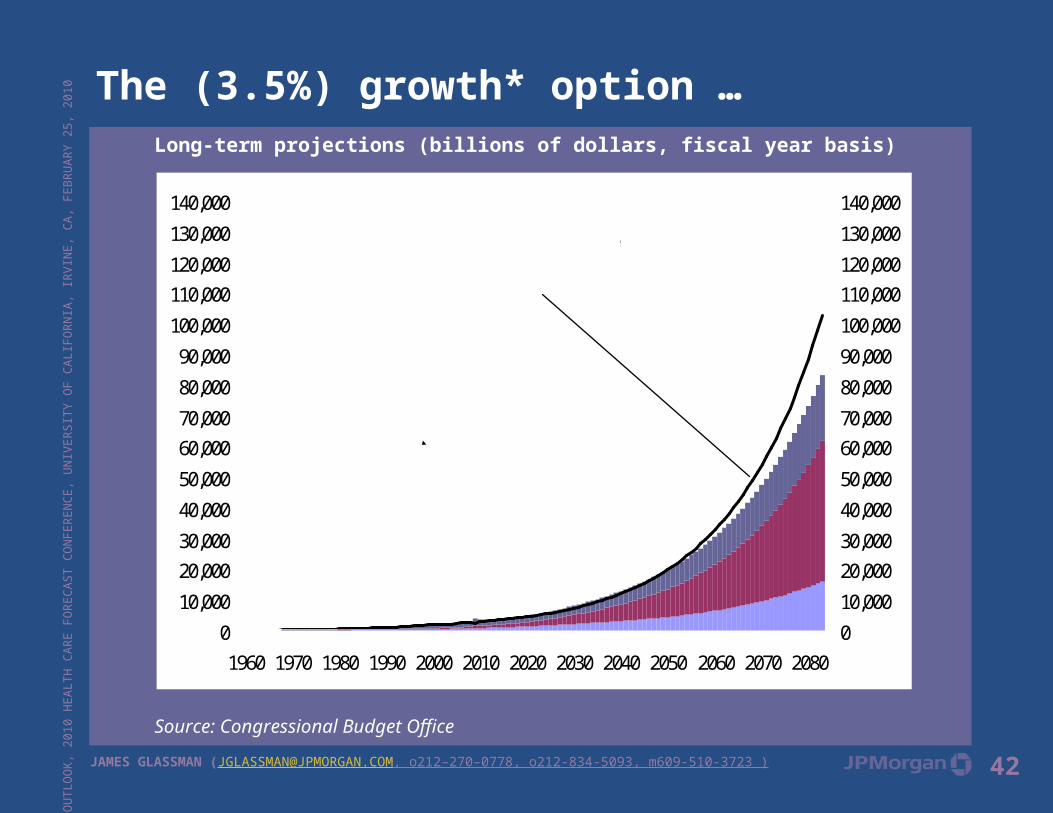
The (3.5%) growth* option …Long-term projections (billions of dollars, fiscal year basis)
Source: Congressional Budget Office
0
10,000
20,00030,000
40,000
50,000
60,00070,000
80,000
90,000
100,000
110,000120,000
130,000
140,000
1960 1970 1980 1990 2000 2010 2020 2030 2040 2050 2060 2070 20800
10,000
20,00030,000
40,000
50,000
60,00070,000
80,000
90,000
100,000
110,000120,000
130,000
140,000Revenues (if the economy grows 3.5%, just below the 3.75% historical average)
Debt service
Other
Medicare and Medicaid
Social Security
43
ECO
NOM
IC O
UTLO
OK,
201
0 HE
ALTH
CAR
E FO
RECA
ST C
ONF
EREN
CE, U
NIVE
RSIT
Y O
F CA
LIFO
RNIA
, IRV
INE,
CA,
FEB
RUAR
Y 25
, 201
0
JAMES GLASSMAN ([email protected], o212–270–0778, o212-834-5093, m609-510-3723 )
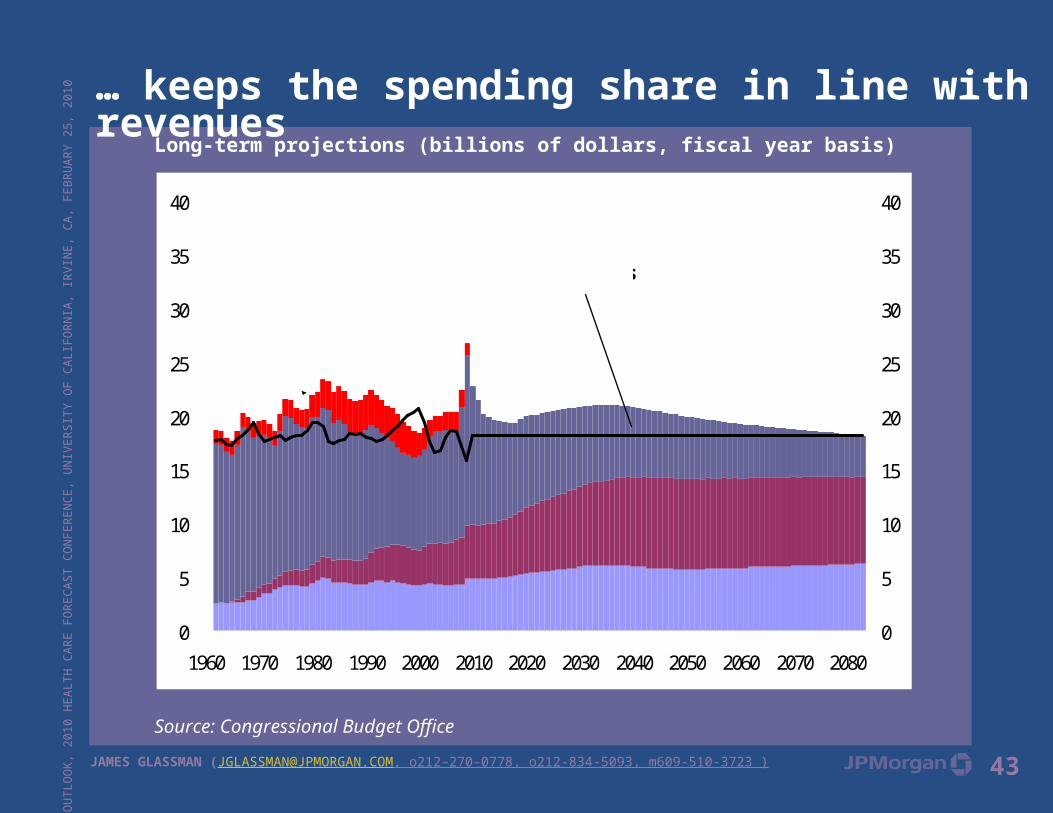
… keeps the spending share in line with revenuesLong-term projections (billions of dollars, fiscal year basis)
Source: Congressional Budget Office
0
5
10
15
20
25
30
35
40
1960 1970 1980 1990 2000 2010 2020 2030 2040 2050 2060 2070 20800
5
10
15
20
25
30
35
40
Revenues
Debt service
Other
Medicare and MedicaidSocial Security
44
ECO
NOM
IC O
UTLO
OK,
201
0 HE
ALTH
CAR
E FO
RECA
ST C
ONF
EREN
CE, U
NIVE
RSIT
Y O
F CA
LIFO
RNIA
, IRV
INE,
CA,
FEB
RUAR
Y 25
, 201
0
JAMES GLASSMAN ([email protected], o212–270–0778, o212-834-5093, m609-510-3723 )
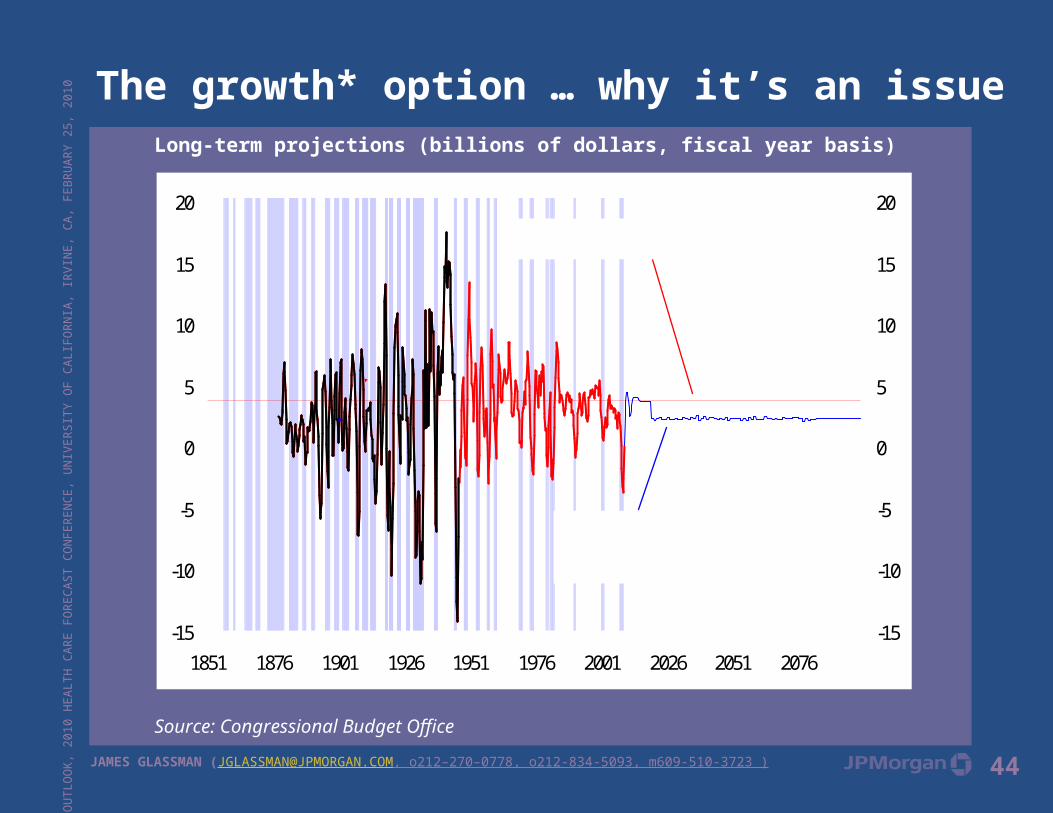
The growth* option … why it’s an issueLong-term projections (billions of dollars, fiscal year basis)
Source: Congressional Budget Office
-15
-10
-5
0
5
10
15
20
1851 1876 1901 1926 1951 1976 2001 2026 2051 2076-15
-10
-5
0
5
10
15
20
Average historical growth = 3.75% annually
CBO assumption
45
ECO
NOM
IC O
UTLO
OK,
201
0 HE
ALTH
CAR
E FO
RECA
ST C
ONF
EREN
CE, U
NIVE
RSIT
Y O
F CA
LIFO
RNIA
, IRV
INE,
CA,
FEB
RUAR
Y 25
, 201
0
JAMES GLASSMAN ([email protected], o212–270–0778, o212-834-5093, m609-510-3723 )
Analysts’ Compensation: The research analysts responsible for the preparation of this report receive compensation based upon various factors, including the quality and accuracy of research, client feedback, competitive factors and overall firm revenues. The firm’s overall revenues include revenues from its investment banking and fixed income business units. Principal Trading: JPMorgan and/or its affiliates normally make a market and trade as principal in the securities discussed in this report.
Legal Entities: JPMorgan is the marketing name for JPMorgan Chase & Co. and its subsidiaries and affiliates worldwide. J.P. Morgan Securities Inc. is a member of NYSE and SIPC. JPMorgan Chase Bank, N.A. is a member of FDIC and is authorized and regulated in the UK by the Financial Services Authority. J.P. Morgan Futures Inc. is a member of the NFA. J.P. Morgan Securities Ltd. (JPMSL) is a member of the London Stock Exchange and is authorized and regulated by the Financial Services Authority. J.P. Morgan Equities Limited is a member of the Johannesburg Securities Exchange and is regulated by the FSB. J.P. Morgan Securities (Asia Pacific) Limited (CE number AAJ321) is regulated by the Hong Kong Monetary Authority. JPMorgan Chase Bank, Singapore branch is regulated by the Monetary Authority of Singapore. J.P. Morgan Securities Asia Private Limited is regulated by the MAS and the Financial Services Agency in Japan. J.P. Morgan Australia Limited (ABN 52 002 888 011/AFS License No: 238188) (JPMSAL) is a licensed securities dealer
General: Information has been obtained from sources believed to be reliable but JPMorgan does not warrant its completeness or accuracy except with respect to any disclosures relative to JPMSI and/or its affiliates and the analyst’s involvement with the issuer. Opinions and estimates constitute our judgment as at the date of this material and are subject to change without notice. Past performance is not indicative of future results. The investments and strategies discussed here may not be suitable for all investors; if you have any doubts you should consult your investment advisor. The investments discussed may fluctuate in price or value. Changes in rates of exchange may have an adverse effect on the value of investments. This material is not intended as an offer or solicitation for the purchase or sale of any financial instrument. JPMorgan and/or its affiliates and employees may act as placement agent, advisor or lender with respect to securities or issuers referenced in this report. Clients should contact analysts at and execute transactions through a JPMorgan entity in their home jurisdiction unless governing law permits otherwise. This report should not be distributed to others or replicated in any form without prior consent of JPMorgan. U.K. and European Economic Area (EEA): Investment research issued by JPMSL has been prepared in accordance with JPMSL’s Policies for Managing Conflicts of Interest in Connection with Investment Research. This report has been issued in the U.K. only to persons of a kind described in Article 19 (5), 38, 47 and 49 of the Financial Services and Markets Act 2000 (Financial Promotion) Order 2001 (all such persons being referred to as “relevant persons”). This document must not be acted on or relied on by persons who are not relevant persons. Any investment or investment activity to which this document relates is only available to relevant persons and will be engaged in only with relevant persons. In other EEA countries, the report has been issued to persons regarded as professional investors (or equivalent) in their home jurisdiction. Australia: This material is issued and distributed by JPMSAL in Australia to “wholesale clients” only. JPMSAL does not issue or distribute this material to “retail clients.” The recipient of this material must not distribute it to any third party or outside Australia without the prior written consent of JPMSAL. For the purposes of this paragraph the terms “wholesale client” and “retail client” have the meanings given to them in section 761G of the Corporations Act 2001. Korea: This report may have been edited or contributed to from time to time by affiliates of J.P. Morgan Securities (Far East) Ltd, Seoul branch.
Copyright 2009 JPMorgan Chase & Co. All rights reserved. Additional information available upon request.