Embed Size (px)
Citation preview

International Journal of Development and Emerging Economics
Vol. 2, No.4, pp.43-59, December 2014
Published by European Centre for Research Training and Development UK (www.eajournals.org)
43
ISSN 2055-608X(Print), ISSN 2055-6098(Online)
ECONOMIC LIBERALIZATION AND INDUSTRIAL SECTOR PERFORMANCE
IN NIGERIA- A MARGINAL IMPACT ANALYSIS
Richardson Kojo Edeme1, Tamarauntari Moses Karimo2 1Department of Economics, University Nigeria, Nsukka
2Department of Economics, Niger Delta University, Wiberforce Island
Bayelsa State-Nigeria
ABSTRACT: Given the impact government policies can have on economic variables and
activities, it is imperative for policy makers to know how such policy action determine the
macroeconomic performance. Applying the marginal impact estimation technique with
standard errors corrected for serial correlation on the dummy variable structural break model,
this paper found that economic liberalization has a significant impact on performance of the
Nigerian manufacturing, mining and quarrying, and power subsectors, respectively and the
aggregate industrial sector. The interaction of the policy with trade openness and financial
deepening dampened the performance of the manufacturing subsector while its interaction with
labour force is growth enhancing. Also the interaction of the policy with energy consumption
was negative but financial deepening and energy consumption has dampening effect on the
performance of the mining and quarrying subsector. While it has enhancing impact on the
aggregate industrial sector and was not significant on mining and quarrying and power
subsectors, economic liberalization decreased the performance of the manufacturing
subsector. Beside, financial deepening has mix impact on the performance of the industrial
sector. While it has increasing impact on the aggregate industrial sector it impact on
manufacturing performance is negative.
KEYWORDS: Economic Liberalization, Industrial sector, Domestic production, Energy
consumption, Financial deepening
JEL Classification: E6, F4, G2
INTRODUCTION
The realization that industrialization is a sine qua non in a nation’s desire to achieve the degree
of self-reliance which can guarantee the stability needed for economic development has
attracted the interest of governments to laying a solid foundation for the development of the
industrial sector. However, to ensure that industrialization leads to beneficial economic and
social development, industrial growth has to be regulated and guided through appropriate
policies. Towards this end, Nigeria since independence has adopted a number of strategies of
industrialization in her development efforts. Some of these strategies include Import
Substitution Strategy, Export Promotion Strategy and Local resource-based Strategy. In
pursuance of these objectives, the government has initiated a number of incentives aimed at
positively influencing the performance and productivity of the industrial sector. Some of these
incentives include tax holidays, tariff protection, import duty relief, total ban on certain foreign
goods, provision of accelerated depreciation allowance, direct government participation, export
incentives, approved user scheme, establishment of special industrial development financial
institutions, building of industrial estates (export processing zones) and Industrial Raw
Material Research and Development Council (IRMRDC) (Egbon 1995, Egwaikhide, 1997;
International Journal of Development and Emerging Economics
Vol. 2, No.4, pp.43-59, December 2014
Published by European Centre for Research Training and Development UK (www.eajournals.org)
44
ISSN 2055-608X(Print), ISSN 2055-6098(Online)
Ayodele, and Falokun, 2003; Udah, 2010). From the above it is glaring that Nigeria’s quest to
become self reliant and an industrialized economy has resulted to the adoption of liberation
policies over the years towards opening it to industrialized world. It is therefore imperative to
examine economic liberalization policy implemented in 1986 through the adoption of the
structural adjustment programme and the successive reforms aimed at further liberalizing the
economy. With the liberalization policy, it is expected that Nigerian economy would be further
open to the rest of the world with the attendant economic growth. But the reverse is the case as
the country is still faced with epileptic power supply, low manufacturing capacity utilisation,
infinitesimal marginal productivity in the agricultural sector and monumental infrastructural
decay. More importantly this precarious situation has been in the face of increasing indexes of
aggregate industrial production, manufacturing production and mining production. For
instance, the index of manufacturing production for the period 1970Q1-1986Q2 increased on
the average by more than double from 42.8 percent to 89.31percent. While the indexes of
mining production and industrial aggregate grew marginally from 102.08 percent and 100.41
percent to 116.36 percent and 107.24 percent respectively, that of electricity grew by more than
double from 49.42 percent to 137.54 percent (CBN 2007;2012). Also, the growth of sectoral
GDP shows that the industrial sector recorded negative growth of -3.4 in 2008 and increased
dramatically to 5.6 percent in 2010. Thereafter, it declined such that by 2012 its growth was
only 1.2 percent in comparism to the agricultural sector which grew at the rate of 6.3 per cent
in 2008 and an average of 5.7 percent between 2009 and 2011 (CBN 2012). The above
developments have been in the presence of liberalized financial sector and external trade;
increased capital accumulation and foreign private investments and importantly, increased
efforts by government to further liberalize the economy thus raising puzzles. Although, several
studies such as Adenikinju and Chete (2002), Udegbunam (2002), Bakare and Fawehinmi
(2011), Tamuno and Edoumiekumo, (2012), among others, have examine the relationship
between economic liberalization and Nigerian industrial sector based on straight line regression
using aggregated variables, none has accounted for the possible structural break that may have
occurred as a result of the policy changes in 1986 and thereafter. This study therefore examines
the impact of economic liberalization on performance of the Nigerian industrial sector as a
whole, and the various subsectors of manufacturing, mining and quarrying, and power with the
aim of accounting for the possible structural break the 1986 policy shift may have caused. This
study provides further insight to how various subsectors of the Nigerian real sector fared before
liberalization and what the situation is with liberalization, thus justifying the need for future
liberalization policy. This study therefore would provide useful information for government
and policy makers especially those involved in formulating policies that will enhance industrial
performance in the country. This study contributes to existing literature by analyzing the impact
and the interaction between economic liberalization and other variables such as foreign direct
investment, financial deepening, degree of openness, gross capital formation, energy
consumption and labour force growth have enhance or dampen the performance of the Nigerian
industrial sector as a whole, and the manufacturing, mining and querying and power subsectors
respectively.
REVIEW OF RELATED LITERATURE
Over the years economists have sought ways to explain how countries could gain from opening
up their economies to external competition and specialization. As a result, a number of trade
theories have evolved. The theory of absolute advantage which is attributed to Adam Smith

International Journal of Development and Emerging Economics
Vol. 2, No.4, pp.43-59, December 2014
Published by European Centre for Research Training and Development UK (www.eajournals.org)
45
ISSN 2055-608X(Print), ISSN 2055-6098(Online)
discusses the benefits a country can achieve by actively participating in the international
division of labour. This theory advocates that a country that trades internationally should
specialize in producing only those goods in which it has absolute advantage. The country can
then export a portion of those goods and, import goods that its trading partners produce more
cheaply. A number of theses were conducted along with this theory, but for some its non
acceptability gave rise to the comparative cost advantage theory, which is credited to David
Ricardo. The theory propound that countries can benefit from each other even though one has
absolute advantage over the other in the production of both goods. The comparative advantage
comes if each trading partner has a product that will bring a better price in another country than
it will at home. If each country specializes in producing the goods in which it has a comparative
advantage, more goods are produced, and the wealth of both countries increases. It is the belief
of many economists that the Heckscher-Ohlin model is an improvement on the Ricardian
theory of comparative advantage. Comparative advantage theory is absorbed in the Heckscher-
Ohlin model in that it began with the comparative advantage and goes beyond it to link the
pattern of international trade to the economic structure of trading nations. Heckscher-Ohlin
model was tested by Leontief through a study on the United State. His view was that a country
that is rich in capital will export capital intensive goods and import labour intensive goods. He
tested his hypothesis using an input-output table for the US in 1947 and concludes that export
industries use relatively more labour than import industries. By his result the US tends to export
more labour intensive goods than capital intensive goods. Several authors reacted to his
conclusion. They argued that the test was done when US trade policy was highly protected and
considered it as quirk in nature. Vernon (1966) put forth the product life cycle hypothesis. The
theory postulates a dynamic comparative advantage because the country’s source of export
shifts through the life cycle of the product. First the innovating country exports the product but
later displaced by another developed country which in turn is ultimately displaced by
developing countries (Egai, 2004). But Haberler’s opportunity cost theory is of the view that if
a country can produce either of commodities X and Y, the opportunity cost of producing
commodity X is the amount of commodity Y that must be given up in order to get one more
unit of commodity X. Thus the exchange ratio between the two commodities is expressed in
terms of their opportunity costs. The theory was further explained by some studies using the
production possibility frontier. They opine that two countries getting involved in trade due to
specialisation, more goods will be available for consumption and more income will be
generated so long as the prices of the respective commodities were not the same in both
countries before trade. The implication is that international trade is able to reduce the loss of
efficiency due to domestic monopoly power and also allow an expansion in the number of
efficient producers in industries with continuing economies of scale. By expanding the total
market therefore, trade is expected to bring about a lower average costs. This is true even in
the case of a domestic monopolist confronted with increasing returns: then it may be profitable
to export even if the net price that exporters receive from the foreign market is below minimum
average cost. By increasing its production, the domestic firm can improve its profits as long as
the reduction in profits via the fall in average revenue is smaller than the increase in profits via
the reduction in average cost (Basevi, 1970; Frenkel, 1971).
An aspect of international trade is globalization. Theoretically, industrialization is an economic
practice that ought to assist developing economics find their feet in the competitive world
economy. But Obaseki (2002) sees globalisation as a web of international relationships
involving trade in goods and services and financial intermediation using the integration of

International Journal of Development and Emerging Economics
Vol. 2, No.4, pp.43-59, December 2014
Published by European Centre for Research Training and Development UK (www.eajournals.org)
46
ISSN 2055-608X(Print), ISSN 2055-6098(Online)
goods and services markets across national boundaries and the integration of financial markets
across the globe. But labour markets across the globe are not as integrated. For this reasons,
some countries like Nigeria has not benefitted from globalisation owing to the undue
dependence on crude oil exports, low manufacturing exports and the under-development of the
domestic, financial markets. This is why Onwuka and Eguavoen (2007) posits that the world
has witnessed increased interdependence in the last two decades, thus subjecting
interdependence subordinates domestic economies to global market conditions and practices.
Yet, developed nations are the greatest beneficiaries of globalization as their share of world
trade and finance has been expanded at the expense of developing countries. This process has
exacerbates inequality between the world’s regions and poverty in the developing world In
examining the relationship between economic liberalization and industrial output, literature
exists in support of the different strands in the theoretical thesis for both developed and
developing countries. For instance, Krueger and Tuncer’s (1982) study for Turkey used sector
level data to support evidence of the efficiency gains. They conclude that periods of greater
liberality have coincided with periods of faster growth in total factor productivity. The same
conclusions have also been reached by Condon, Corbo and de Melo (1985) for Chile, Page
(1984) for India, and Pitt and Lung-Fei (1981) for the Indonesa. On the contrary, Tsao (1985)
shows that for Singapore during the 1970s when rapid growth was experienced, productivity
growth were either negligible or negative in some sectors of manufacturing. After reviewing
studies based on within-country temporal correlations, Havrylyshyn (1990) conclude that there
is no strong evidence linking productivity and openness. In this regard, Pack (1988) puts it
more succulently when he states that “comparison of total factor productivity among countries
pursuing different international trade orientation does not reveal systematic differences in
productivity growth in manufacturing.” In support of the imports restrict market power
hypothesis, Lyons (1979) carried out a survey of 23 cross-sectional studies, which related
prices, profitability or price–cost margins to various measures of foreign competition. One
clear finding was that with importation, a country can no longer restrict its market. But for
Canada, the hypothesis was rejected by Caves, Porter and Spence (1980), “that an interaction
variable between seller concentration and import share had a decreasing effect on industry
profits”. Implied here is that concentration accentuates profits significantly only when import
competition is low. This is while Pugel (1980) suggest that the influence of import competition
should be entered interactively with seller concentration and entry barriers to explain price–
cost margins. The influence of exports on domestic competition is much less straightforward.
\Due to different sets of theoretical alternatives, empirical research did not arrive at the same
conclusion. For instance, studies such as Pagoulatos and Sorensen (1976), Neumann, Bobel
and Haid, (1979) asserts that exports reduce industrial profitability while others like Geroski
(1982) adopted a non-linear specification to show a very significant positive effect of the rate
of exports on the profit margin and a negative effect from the rate of imports. More recently, a
number of studies have investigated the impact of trade liberalization and market structure on
productivity. One such study by Haddad (1993) for Morocco found a strong positive correlation
between trade liberalization and productivity. This suggests that an increase in productivity is
generated not only through export promotion but by import liberalization as well. In all, trade
liberalization seems to have improved productivity in the manufacturing sector. On the one
hand, firms with a higher level of exports by facing more competition from abroad have been
become more productive. On the other hand, import penetration also put pressure on domestic
firms, driving them to increase their efficiency or exit the industry. Harrison (1990) also

International Journal of Development and Emerging Economics
Vol. 2, No.4, pp.43-59, December 2014
Published by European Centre for Research Training and Development UK (www.eajournals.org)
47
ISSN 2055-608X(Print), ISSN 2055-6098(Online)
analyze changes in firm behaviour and productivity during trade liberalization in Côte d’Ivoire
using a panel of 287 firms to estimate market for two periods and found that price–cost margins
fell in a number of sectors following the reform and that when productivity estimates are
modified to account for changes in price–cost margin over the period, the positive correlation
between trade reform and productivity is strengthened in some sectors and reversed in others.
Similarly, Forountan’s (1991) study for Turkey found that greater exposure to international
competition generally had a beneficial effect on the Turkish industry during the 1980s. The
effect of international competition, however, appears to be significant mainly in the private
sector, especially in tradable industries. International competition decreased the price–cost
margin and increased the rate of growth of productivity in the private sector. In the public
sector, higher trade penetration lowered the price-cost margin in the public enterprises that had
a higher than average capital intensity but did not affect the productivity performance of the
sector. Other studies such as Ajayi (2003) and Mougani (2012) examined the impact of
international financial integration on economic activity and macro-economic volatility in
African countries and submit that the impact of external capital flows on growth depends
mainly on the initial conditions and policies implemented to stabilize foreign investment,
increase domestic investment and productivity. A major conclusion arrived at is that although
globalization has brought quantum leap in trade, capital flows and income in some regions; it
is an uneven process with unequal distribution of benefits and losses Using the ordinary least
squares (OLS) method, Afaha and Njogo (2012) equally demonstrate the workings of trade
openness on the Nigerian economy over the period 1970-2010 and conclude that economies
grow faster when they are open to international competition. Osabuohien (2006) examined the
impact of trade openness on the performance of ECOWAS member countries using data for
Ghana and Nigeria for the period, 1975-2004 employing cointegration and vector error
correction techniques. Although a long-run relationship was established between economic
performance, trade openness, real government expenditure, labour force and real capital stock
for both countries, the impact of trade openness on economic performance differs from country
to country.
To this, Onyeiwu (2009) explains that such difference could be explained by variables such as
economic reform, technological capability, investment in education and training. This implies
that human capital may be an important source of growth of total factor productivity. On the
impact of the neoliberal globalisation on industrial performance in Nigeria, Onyeonoru (2003)
found that contrary to expectation, the manufacturing sector performances during the
globalisation were negatively affected. Thus, not in agreement with noninterventionist
development model of Adams Smith. Udegbunam (2002) examined the implications of trade
openness for industrial growth in Nigeria using data for the period 1970-1997and the study
opines that trade openness and stock market development are among the key determinants of
industrial output growth in Nigeria. Bakare and Fawehinmi (2011) study of the relationship
between trade openness and industrial performance did not only found the formal trade
openness have a sustainable impact on the non-oil industrial sector of the Nigerian economy,
but also that public domestic investment, saving rate, capacity utilization and infrastructure
negatively impacted on Nigeria’s industrial performance. They suggest that more progress
could be achieved if the conditions for a deregulated trade system are properly put in place. In
another strand of literature, Tamuno and Edoumiekumo (2012) study on the impact of
globalization on the Nigerian industrial sector using the Error Correction Mechanism and
Johansen’s co-integration test shows that the Nigerian industrial sector has a weak base and
International Journal of Development and Emerging Economics
Vol. 2, No.4, pp.43-59, December 2014
Published by European Centre for Research Training and Development UK (www.eajournals.org)
48
ISSN 2055-608X(Print), ISSN 2055-6098(Online)
cannot compete favourably with her foreign counterparts. However, they argue that domestic
investment was weak and unreliable, even though a long-run relationship was found between
industrial output and the globalisation proxy variables which are degree of openness, foreign
direct investment, external debt and nominal exchange rate. In a further study, Olotu and Kaine
(2011) show empirically that globalisation does not positively affect demand for labour. Also
the impact of the ratio of total trade to non-oil GDP on aggregate employment was negative.
They concluded that higher propensity towards openness does not have any meaningful impact
on labour absorption contrary to strong theoretical assertion. Mesike, et al (2008) using data
for the period 1960-2004 showed that the liberalization of trade has exposed Nigerian rubber
industry to the fluctuations in global rubber prices and the instability in the natural rubber prices
has been a disincentive for rubber production and exports. Saibu (2011) investigated the
relative effectiveness of trade and policy shocks on sectoral output growth in a small open
Nigerian economy employong A CVAR model. The effects of monetary policy shocks were
positive and significant on manufacturing, service and industrial sector while fiscal policy
shock was only significant and positive on agricultural output growth. The result further
showed that international oil price shock and trade openness had pronounced negative effects
on both sectoral and aggregate outputs. In addition, oil and trade openness’ negative effects
overwhelmed the positive effects of fiscal and monetary policy shocks. In investigating the
relationship between trade liberalization and the market structure and productivity performance
of the Nigerian manufacturing sector, Adenikinju and Chete (2002) use firm-level panel data
for the three years from 1988-1990 to show that the productivity level of Nigerian
manufacturing is generally low. This reflects in part an outcome of years of industrialization
strategy that stressed factor accumulation rather than the efficiency with which factors are
utilized. The finding of the study shows that sectors with a high component of local raw
materials generally performed better than those depending on imported inputs. Beside, foreign
ownership has an important bearing on firm performance and foreign-owned firms generate
positive spill-over effects on the other firms in the industry.
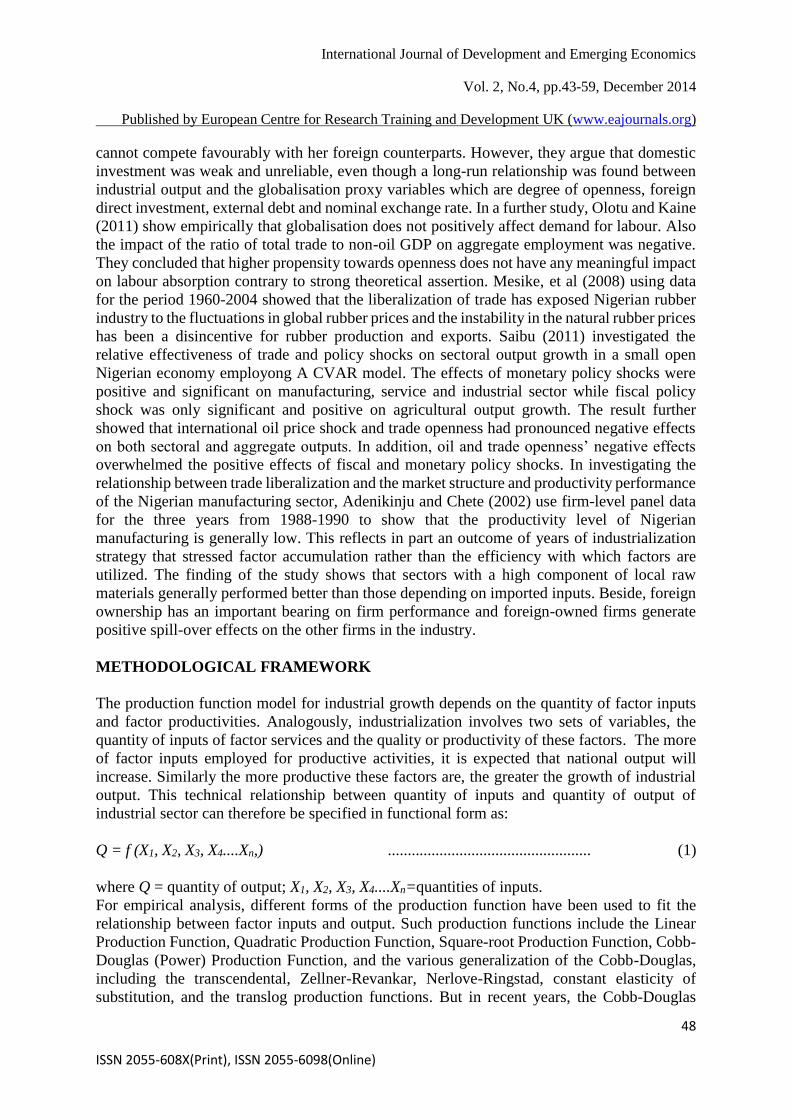
METHODOLOGICAL FRAMEWORK
The production function model for industrial growth depends on the quantity of factor inputs
and factor productivities. Analogously, industrialization involves two sets of variables, the
quantity of inputs of factor services and the quality or productivity of these factors. The more
of factor inputs employed for productive activities, it is expected that national output will
increase. Similarly the more productive these factors are, the greater the growth of industrial
output. This technical relationship between quantity of inputs and quantity of output of
industrial sector can therefore be specified in functional form as:
Q = f (X1, X2, X3, X4....Xn,) ................................................... (1)
where Q = quantity of output; X1, X2, X3, X4....Xn=quantities of inputs.
For empirical analysis, different forms of the production function have been used to fit the
relationship between factor inputs and output. Such production functions include the Linear
Production Function, Quadratic Production Function, Square-root Production Function, Cobb-
Douglas (Power) Production Function, and the various generalization of the Cobb-Douglas,
including the transcendental, Zellner-Revankar, Nerlove-Ringstad, constant elasticity of
substitution, and the translog production functions. But in recent years, the Cobb-Douglas

International Journal of Development and Emerging Economics
Vol. 2, No.4, pp.43-59, December 2014
Published by European Centre for Research Training and Development UK (www.eajournals.org)
49
ISSN 2055-608X(Print), ISSN 2055-6098(Online)
production function has been widely used because of its desirable properties. Due to the
peculiarity of the data for this study, the Cobb-Douglas (power) production or constant
elasticity model is adopted.
The Cobb Douglas power function could be expressed as follows:
Q = b0X1a1X2
a2................ Xnan ........................................................
(2)
The partial derivatives of Q with respect to x1 and x2, keeping other variables constant is
respectively derived as:
𝜕𝑄
𝜕𝑥𝑖 = a1 [b0X1
a1X2 a2Xn
bn] X1-1
........................................................................ (3)
= a1[Q] X1-1
.................................................................................... (4)
= a1Q/X1
......................................................................................... (5)
Also, 𝜕𝑄
𝜕𝑥2 = a2[b0X1
a1X2 a2Xn
bn]X2-1
........................................................................ (6)
= a2[Q] X2-1
.................................................................................... (7)
= a2Q/X2
....................................................................................... (8)
The algebraic form of this function with n input variable(s) gives:
𝑄 = 𝐴𝑥1𝑎1𝑥2
𝑎2 . . . 𝑥𝑛𝑎𝑛 = 𝐴 ∏ 𝑥𝑖
𝑎𝑖𝑒𝑢
𝑛
𝑖=1
, 𝑖 = 1,2, … , 𝑛 … … … … … … … (9)
where Q and xi (i=1,2,…,n) are the levels of output and inputs respectively, and A the
technological efficiency parameter. The constant a0 and ai (i=1,2,…,n) represent the efficiency
parameter and the production elasticities of the respective input variables. For purpose of
estimation we take the logarithmic transformation of the equations to obtain
𝑙𝑜𝑔𝑄 = 𝑎0 + ∑ 𝑎𝑖𝑙𝑜𝑔𝑥𝑖 + 𝑢
𝑛
𝑖=1
… … … … … … … … … …. (10)
where 𝑎0 = 𝑙𝑜𝑔𝐴
For concavity, the second order partial derivatives from equation (10) will be negative as
required if ais are each < l, that is,
𝜕2𝑄
𝜕𝑥𝑖2 = 𝑎𝑖(𝑎𝑖 − 1) ∗
𝑄
𝑥𝑖2 < 0 … … … … … … … … … … … … .. (11)
Applying the marginal analysis, the marginal impact of an input could be derived given specific
levels of other variable inputs as: 𝜕𝑄
𝜕𝑥𝑖= 𝑀𝑃𝑖 = 𝑎𝑖𝑥𝑖
𝑎𝑖−1𝑎0𝑥1
𝑎1𝑥2𝑎2 … 𝑥𝑖−1
𝑎𝑖−1𝑥𝑖+1𝑎𝑖+1 … 𝑥𝑛
𝑎𝑛
= 𝑎𝑖𝑥𝑖−1𝐴𝑥1
𝑎1𝑥2𝑎2 … 𝑥𝑛
𝑎𝑛 = 𝑎𝑖𝑥𝑖−1𝑄 =
𝑎𝑖𝑄
𝑥𝑖 … … … … … … … … … … … (12)
Equation (12) indicates that MPi is a function of xi. For a common case of diminishing returns
to factor input Xi, ∂2Q/∂xi
2 must be negative, implying that 0 < ai < 1. As such, MPi must always

International Journal of Development and Emerging Economics
Vol. 2, No.4, pp.43-59, December 2014
Published by European Centre for Research Training and Development UK (www.eajournals.org)
50
ISSN 2055-608X(Print), ISSN 2055-6098(Online)
be non-negative and decreasing. Consequently, this function allows constant, increasing or
decreasing marginal productivity, and not all the three or even any two at the same time.
The elasticity of production function with respect to any variable input, say, Xi, can be derived
as:
𝐸𝑝𝑖 =𝜕𝑄
𝜕𝑥𝑖∗
𝑥𝑖
𝑦=
𝑎𝑖𝑦
𝑥𝑖∗
𝑥𝑖
𝑦= 𝑎𝑖 … … … … … … … … … … … … … .. (12𝑎)
From equation (12) Epi can also be obtained as:
𝐸𝑝𝑖 =𝑙𝑜𝑔𝑄
𝑙𝑜𝑔𝑥𝑖= 𝑎𝑖 … … … … … … … … … … … … … … … … … … (12𝑏)
Thus it can be observed that the power of the respective variable input directly gives the
elasticity of production with respect to it. The elasticity coefficients in relation to each variable
input are therefore constant irrespective of the input or output levels.
3.2 Model Specification Drawing from Geroski (1982) the relationship between the dependent and independent
variables can be stated in simultaneous equation models as:
IOP = f(GCF, FDI, DOP, FIND,POP, ENC, LIB) . . . (13)
IMP = f(GCF, FDI, DOP, FIND, POP, ENC, LIB) . . . (14)
ELEC = f(GCF, FDI, DOP, FIND, POP, ENC,LIB) . . . (15)
INQ = f(GCF, FDI, DOP, FIND, POP, ENG,LIB) . . . (16)
In line with our methodological framework, equations (13) - (16) respectively can be re-written
in constant elasticity model to give:
𝐼𝑂𝑃 = 𝐴1(𝐺𝐶𝐹)𝛼1(𝐹𝐷𝐼)𝛼2(𝐷𝑂𝑃)𝛼3(𝐹𝐼𝑁𝐷)𝛼4(𝑃𝑂𝑃)𝛼5(𝐸𝑁𝐶)𝛼6(𝐿𝐼𝐵)𝜂0(𝐿𝐼𝐵∗ 𝐺𝐶𝐹)𝜂1(𝐿𝐼𝐵 ∗ 𝐹𝐷𝐼)𝜂2(𝐿𝐼𝐵 ∗ 𝐷𝑂𝑃)𝜂3(𝐿𝐼𝐵 ∗ 𝐹𝐼𝑁𝐷)𝜂4(𝐿𝐼𝐵 ∗ 𝑃𝑂𝑃)𝜂5(𝐿𝐼𝐵∗ 𝐸𝑁𝐶)𝜂6𝑒𝑢1𝑡 (17)
𝐼𝑀𝑃 = 𝐴2(𝐺𝐶𝐹)𝛽1(𝐹𝐷𝐼)𝛽2(𝐷𝑂𝑃)𝛽3(𝐹𝐼𝑁𝐷)𝛽4(𝑃𝑂𝑃)𝛽5(𝐸𝑁𝐶)𝛽6(𝐿𝐼𝐵)𝜑0(𝐿𝐼𝐵∗ 𝐺𝐶𝐹)𝜑1(𝐿𝐼𝐵 ∗ 𝐹𝐷𝐼)𝜑2(𝐿𝐼𝐵 ∗ 𝐷𝑂𝑃)𝜑3(𝐿𝐼𝐵 ∗ 𝐹𝐼𝑁𝐷)𝜑4(𝐿𝐼𝐵 ∗ 𝑃𝑂𝑃)𝜑5(𝐿𝐼𝐵∗ 𝐸𝑁𝐶)𝜑6𝑒𝑢2𝑡 (18)
𝐸𝐿𝐸𝐶 = 𝐴3(𝐺𝐶𝐹)𝛾1(𝐹𝐷𝐼)𝛾2(𝐷𝑂𝑃)𝛾3(𝐹𝐼𝑁𝐷)𝛾4(𝑃𝑂𝑃)𝛾5(𝐸𝑁𝐶)𝛾6(𝐿𝐼𝐵)𝜃0(𝐿𝐼𝐵∗ 𝐶𝐺𝐹)𝜃1(𝐿𝐼𝐵 ∗ 𝐹𝐷𝐼)𝜃2(𝐿𝐼𝐵 ∗ 𝐷𝑂𝑃)𝜃3(𝐿𝐼𝐵 ∗ 𝐹𝐼𝑁𝐷)𝜃4(𝐿𝐼𝐵 ∗ 𝑃𝑂𝑃)𝜃5(𝐿𝐼𝐵∗ 𝐸𝑁𝐶)𝜃6𝑒𝑢3𝑡 (19)
𝐼𝑁𝑄 = 𝐴4(𝐺𝐶𝐹)𝛿1(𝐹𝐷𝐼)𝛿2(𝐷𝑂𝑃)𝛿3(𝐹𝐼𝑁𝐷)𝛿4(𝑃𝑂𝑃)𝛿5(𝐸𝑁𝐶)𝛿6(𝐿𝐼𝐵)𝜋0(𝐿𝐼𝐵∗ 𝐶𝐺𝐹)𝜋1(𝐿𝐼𝐵 ∗ 𝐹𝐷𝐼)𝜋2(𝐿𝐼𝐵 ∗ 𝐷𝑂𝑃)𝜋3(𝐿𝐼𝐵 ∗ 𝐹𝐼𝑁𝐷)𝜋4(𝐿𝐼𝐵 ∗ 𝑃𝑂𝑃)𝜋5(𝐿𝐼𝐵∗ 𝐸𝑁𝐶)𝜋6𝑒𝑢3𝑡 (20)
For purpose of estimation, equations (17) to (20) can be transformed into log-linear models.
Consequently, the equations can be specified as:
log(IOP) = a1 + α1log(GCF) + α2log(FDI) + α3log(DOP)+ α4log(FIND) + α5log( POP)+
α5log(ENC) +η0logLIB + η1log(LIB*GCF)+ η2log(LIB*FDI)+ η3log(LIB*DOP)+
η4log(LIB*FIND) + η5log(LIB*POP) + η6log(LIB*ENC)+ u1t
...................................................................................................................................................... (21)
log(IMP) = a2+ β1log(GCF)+ β2log(FDI)+ β3log(DOP)+ β4log(FIND)+ β5log( POP)+
β6log(ENC)+ φ0logLIB + φ1log(LIB*GCF)+ φ2log(LIB*FDI)+ φ3log(LIB*DOP)+
φ4log(LIB*FIND) + φ5log(LIB*POP)+ φ6log(LIB*ENC)+ u2t
......................................................................................................... (22)
log(ELEC) = a3+γ1log(GCF)+ γ2log(FDI)+ γ3log(DOP)+ γ4log(FIND)+ γ5log( POP)+
γ6log(ENC)+ θ0logLIB + θ1log(LIB*GCF)+ θ2log(LIB*FDI)+ θ3log(LIB*DOP)+
International Journal of Development and Emerging Economics
Vol. 2, No.4, pp.43-59, December 2014
Published by European Centre for Research Training and Development UK (www.eajournals.org)
51
ISSN 2055-608X(Print), ISSN 2055-6098(Online)
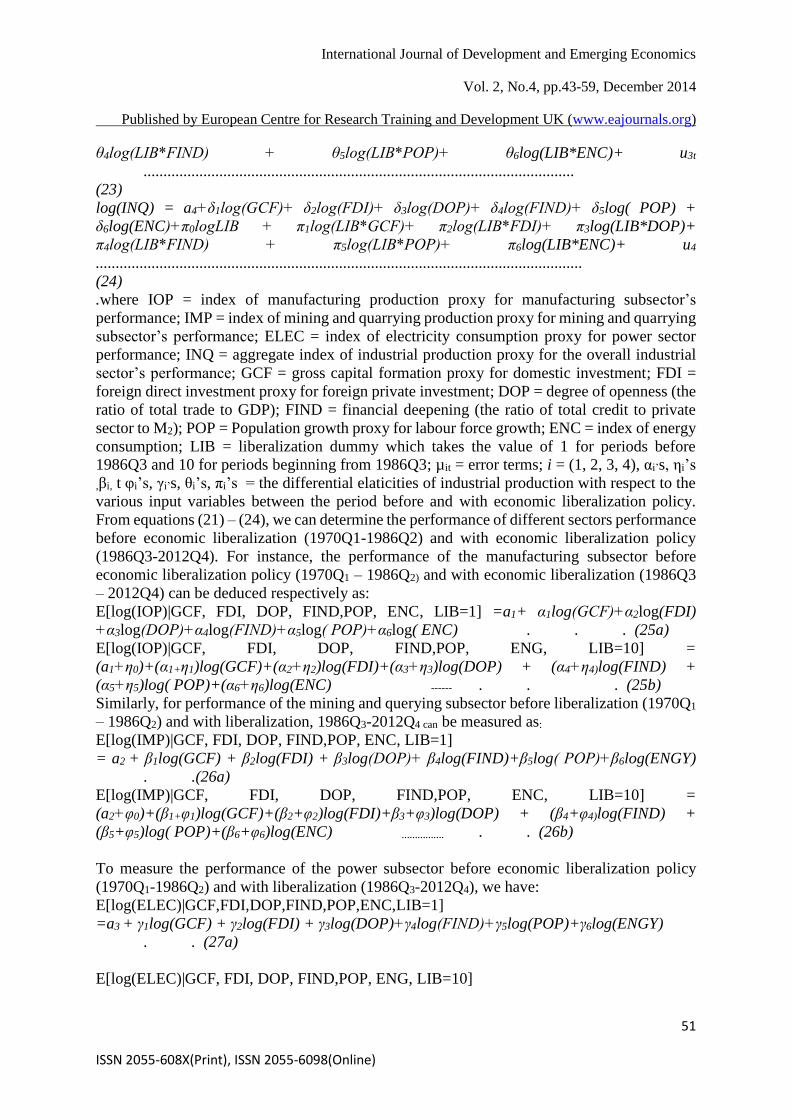
θ4log(LIB*FIND) + θ5log(LIB*POP)+ θ6log(LIB*ENC)+ u3t
............................................................................................................
(23)
log(INQ) = a4+δ1log(GCF)+ δ2log(FDI)+ δ3log(DOP)+ δ4log(FIND)+ δ5log( POP) +
δ6log(ENC)+π0logLIB + π1log(LIB*GCF)+ π2log(LIB*FDI)+ π3log(LIB*DOP)+
π4log(LIB*FIND) + π5log(LIB*POP)+ π6log(LIB*ENC)+ u4
..........................................................................................................................
(24)
.where IOP = index of manufacturing production proxy for manufacturing subsector’s
performance; IMP = index of mining and quarrying production proxy for mining and quarrying
subsector’s performance; ELEC = index of electricity consumption proxy for power sector
performance; INQ = aggregate index of industrial production proxy for the overall industrial
sector’s performance; GCF = gross capital formation proxy for domestic investment; FDI =
foreign direct investment proxy for foreign private investment; DOP = degree of openness (the
ratio of total trade to GDP); FIND = financial deepening (the ratio of total credit to private
sector to M2); POP = Population growth proxy for labour force growth; ENC = index of energy
consumption; LIB = liberalization dummy which takes the value of 1 for periods before
1986Q3 and 10 for periods beginning from 1986Q3; µit = error terms; i = (1, 2, 3, 4), αi’s, ηi’s
,βi, t φi’s, γi’s, θi’s, πi’s = the differential elaticities of industrial production with respect to the
various input variables between the period before and with economic liberalization policy.
From equations (21) – (24), we can determine the performance of different sectors performance
before economic liberalization (1970Q1-1986Q2) and with economic liberalization policy
(1986Q3-2012Q4). For instance, the performance of the manufacturing subsector before
economic liberalization policy (1970Q1 – 1986Q2) and with economic liberalization (1986Q3
– 2012Q4) can be deduced respectively as:
E[log(IOP)|GCF, FDI, DOP, FIND,POP, ENC, LIB=1] =a1+ α1log(GCF)+α2log(FDI)
+α3log(DOP)+α4log(FIND)+α5log( POP)+α6log( ENC) . . . (25a)
E[log(IOP)|GCF, FDI, DOP, FIND,POP, ENG, LIB=10] =
(a1+η0)+(α1+η1)log(GCF)+(α2+η2)log(FDI)+(α3+η3)log(DOP) + (α4+η4)log(FIND) +
(α5+η5)log( POP)+(α6+η6)log(ENC) ------ . . . (25b)
Similarly, for performance of the mining and querying subsector before liberalization (1970Q1
– 1986Q2) and with liberalization, 1986Q3-2012Q4 can be measured as:
E[log(IMP)|GCF, FDI, DOP, FIND,POP, ENC, LIB=1]
= a2 + β1log(GCF) + β2log(FDI) + β3log(DOP)+ β4log(FIND)+β5log( POP)+β6log(ENGY)
. .(26a)
E[log(IMP)|GCF, FDI, DOP, FIND,POP, ENC, LIB=10] =
(a2+φ0)+(β1+φ1)log(GCF)+(β2+φ2)log(FDI)+β3+φ3)log(DOP) + (β4+φ4)log(FIND) +
(β5+φ5)log( POP)+(β6+φ6)log(ENC) ................ . . (26b)
To measure the performance of the power subsector before economic liberalization policy
(1970Q1-1986Q2) and with liberalization (1986Q3-2012Q4), we have:
E[log(ELEC)|GCF,FDI,DOP,FIND,POP,ENC,LIB=1]
=a3 + γ1log(GCF) + γ2log(FDI) + γ3log(DOP)+γ4log(FIND)+γ5log(POP)+γ6log(ENGY)
. . (27a)
E[log(ELEC)|GCF, FDI, DOP, FIND,POP, ENG, LIB=10]

International Journal of Development and Emerging Economics
Vol. 2, No.4, pp.43-59, December 2014
Published by European Centre for Research Training and Development UK (www.eajournals.org)
52
ISSN 2055-608X(Print), ISSN 2055-6098(Online)
= (a3+θ0)+(γ1+θ1)log(GCF)+(γ2+θ2)log(FDI)+(γ3+θ3)log(DOP)+(γ4+θ4)log(FIND)+
(γ5+θ5)log(POP)+(γ6+θ6)log(ENC) ..................................................................... . .
. (27b)
For performance of the aggregate industrial sector before liberalization the two sub periods
(1970Q1 – 1986Q2) and (1986Q3 – 2012Q4):
E[log(INQ)|GCF, FDI, DOP, FIND,POP, ENC, LIB=1]
= a4+δ1log(GCF)+δ2log(FDI)+ δ3log(DOP)+δ4log(FIND)+δ5log(POP)+δ6log(ENC)
. . (28a)
E[log(INQ)|GCF, FDI, DOP, FIND,POP, ENC, lib=10] =
(a4+π0)+(δ1+π1)log(GCF)+(δ2+π2)log(FDI)+(δ3+π3)log(DOP)+(δ4+π4)log(FIND)+
(δ5+π5)log(POP)+(δ6+π6)log( ENC)
.......................................................................................................................................
(28b)
Data Estimation Technique The ordinary least squares (OLS) technique is employed as the estimation technique. The OLS
technique is favoured because it is the Best Linear and Unbiased Estimator (BLUE). However,
to avoid the problem of spurious regression, the estimated model is tested for specification bias
using the Ramsey Regression Specification Error test before employing the Breusch-Godfrey
Langrage Multiplier test for autocorrelation and finally the standard errors corrected for
autocorrelation using robust standard errors.
Data Sources, Nature and Transformation
Data for this study are industrial sector as a whole, the manufacturing subsector, mining and
quarrying subsector and the power subsector respectively by incorporating various components
of investment capital-both domestic (gross capital formation (GCF)) and foreign (foreign direct
investment (FDI)); the degree of openness, DOP (total trade to GDP ratio) and financial
deepening (FIND) to capture the effects of trade openness and the ability of the industrial sector
to absorb new capital respectively. Other variables are population growth rate (POP) and index
of energy consumption (ENC) to capture the effects of labour force growth and energy
consumption respectively. The dataset are annual time series generated from the Central Bank
of Nigeria Statistical Bulletin, and Annual Reports and Statement of Accounts, various years.
The dataset covers the period 1970-2012. However, because the study anticipates degree of
freedom problem that may arise due to the inclusion of dummy variables and their interaction
terms with the explanatory variables in the various models the study interpolates the annual
series to quarterly time series using the moving average. The STATA 11 econometric package
was employed for data estimation
EMPIRICAL RESULTS AND DISCUSSION
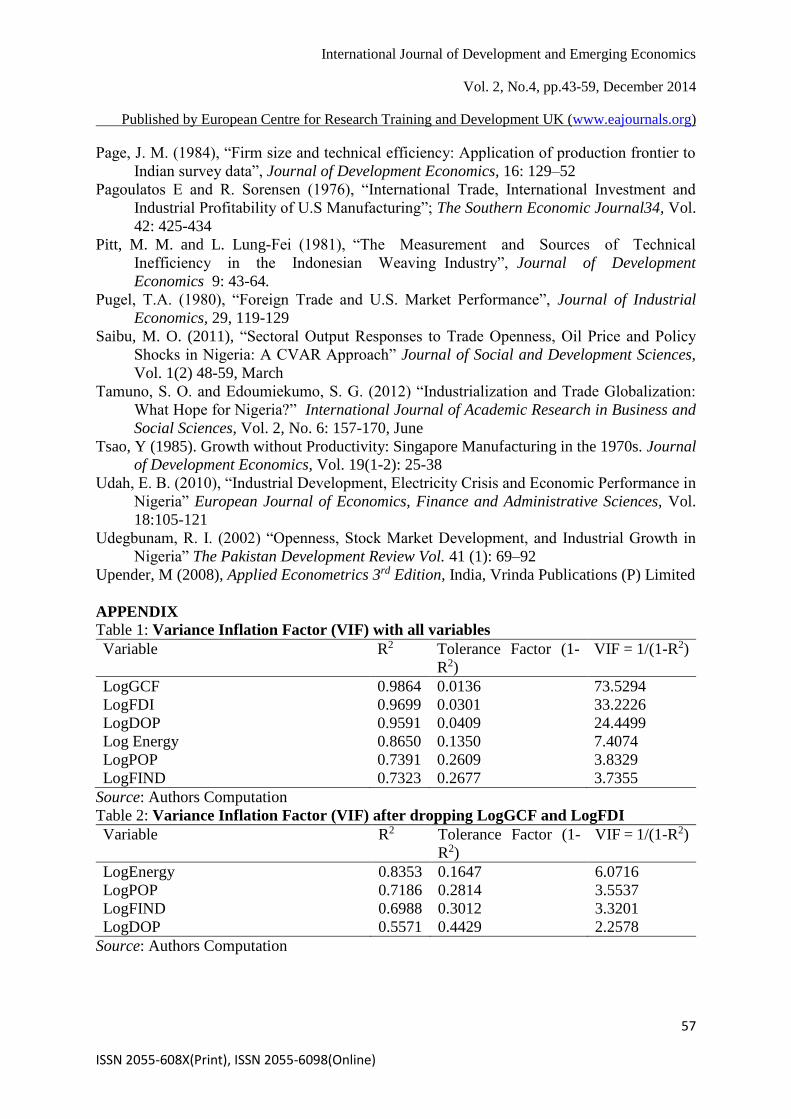
The result of the multicollinearity test in Table 1 shows the variance inflation factor (VIF) of
each of the explanatory variables for the models. The VIFs of logGCF and LogFDI were found
to be 73.5294 and 33.2226, respectively which are very large compared to the benchmark of
10 as recommended in the literature. Therefore logGCF and LogFDI were dropped and the
VIFs re-estimated for the remaining variables for which results are presented in Table 2. The
new VIFs were all less than 10, implying that multicollinearity will not pose serious problem
International Journal of Development and Emerging Economics
Vol. 2, No.4, pp.43-59, December 2014
Published by European Centre for Research Training and Development UK (www.eajournals.org)
53
ISSN 2055-608X(Print), ISSN 2055-6098(Online)
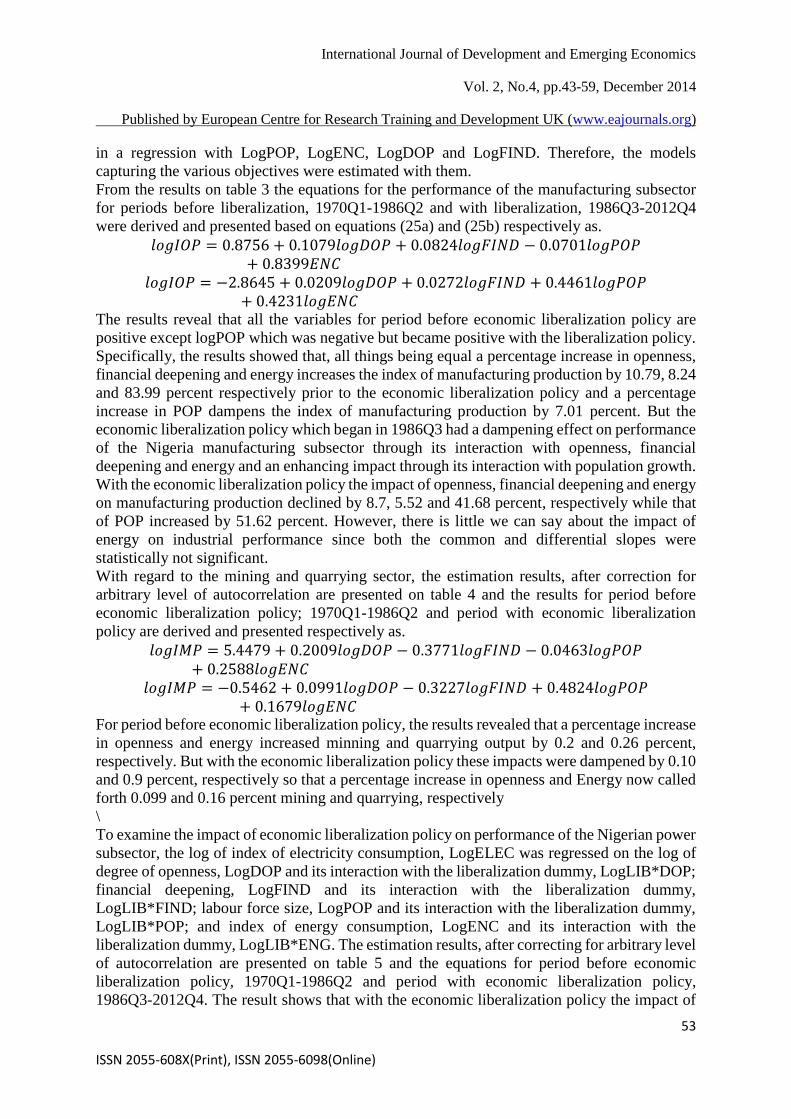
in a regression with LogPOP, LogENC, LogDOP and LogFIND. Therefore, the models
capturing the various objectives were estimated with them.
From the results on table 3 the equations for the performance of the manufacturing subsector
for periods before liberalization, 1970Q1-1986Q2 and with liberalization, 1986Q3-2012Q4
were derived and presented based on equations (25a) and (25b) respectively as.
𝑙𝑜𝑔𝐼𝑂𝑃 = 0.8756 + 0.1079𝑙𝑜𝑔𝐷𝑂𝑃 + 0.0824𝑙𝑜𝑔𝐹𝐼𝑁𝐷 − 0.0701𝑙𝑜𝑔𝑃𝑂𝑃+ 0.8399𝐸𝑁𝐶
𝑙𝑜𝑔𝐼𝑂𝑃 = −2.8645 + 0.0209𝑙𝑜𝑔𝐷𝑂𝑃 + 0.0272𝑙𝑜𝑔𝐹𝐼𝑁𝐷 + 0.4461𝑙𝑜𝑔𝑃𝑂𝑃+ 0.4231𝑙𝑜𝑔𝐸𝑁𝐶
The results reveal that all the variables for period before economic liberalization policy are
positive except logPOP which was negative but became positive with the liberalization policy.
Specifically, the results showed that, all things being equal a percentage increase in openness,
financial deepening and energy increases the index of manufacturing production by 10.79, 8.24
and 83.99 percent respectively prior to the economic liberalization policy and a percentage
increase in POP dampens the index of manufacturing production by 7.01 percent. But the
economic liberalization policy which began in 1986Q3 had a dampening effect on performance
of the Nigeria manufacturing subsector through its interaction with openness, financial
deepening and energy and an enhancing impact through its interaction with population growth.
With the economic liberalization policy the impact of openness, financial deepening and energy
on manufacturing production declined by 8.7, 5.52 and 41.68 percent, respectively while that
of POP increased by 51.62 percent. However, there is little we can say about the impact of
energy on industrial performance since both the common and differential slopes were
statistically not significant.
With regard to the mining and quarrying sector, the estimation results, after correction for
arbitrary level of autocorrelation are presented on table 4 and the results for period before
economic liberalization policy; 1970Q1-1986Q2 and period with economic liberalization
policy are derived and presented respectively as.
𝑙𝑜𝑔𝐼𝑀𝑃 = 5.4479 + 0.2009𝑙𝑜𝑔𝐷𝑂𝑃 − 0.3771𝑙𝑜𝑔𝐹𝐼𝑁𝐷 − 0.0463𝑙𝑜𝑔𝑃𝑂𝑃+ 0.2588𝑙𝑜𝑔𝐸𝑁𝐶
𝑙𝑜𝑔𝐼𝑀𝑃 = −0.5462 + 0.0991𝑙𝑜𝑔𝐷𝑂𝑃 − 0.3227𝑙𝑜𝑔𝐹𝐼𝑁𝐷 + 0.4824𝑙𝑜𝑔𝑃𝑂𝑃+ 0.1679𝑙𝑜𝑔𝐸𝑁𝐶
For period before economic liberalization policy, the results revealed that a percentage increase
in openness and energy increased minning and quarrying output by 0.2 and 0.26 percent,
respectively. But with the economic liberalization policy these impacts were dampened by 0.10
and 0.9 percent, respectively so that a percentage increase in openness and Energy now called
forth 0.099 and 0.16 percent mining and quarrying, respectively
\
To examine the impact of economic liberalization policy on performance of the Nigerian power
subsector, the log of index of electricity consumption, LogELEC was regressed on the log of
degree of openness, LogDOP and its interaction with the liberalization dummy, LogLIB*DOP;
financial deepening, LogFIND and its interaction with the liberalization dummy,
LogLIB*FIND; labour force size, LogPOP and its interaction with the liberalization dummy,
LogLIB*POP; and index of energy consumption, LogENC and its interaction with the
liberalization dummy, LogLIB*ENG. The estimation results, after correcting for arbitrary level
of autocorrelation are presented on table 5 and the equations for period before economic
liberalization policy, 1970Q1-1986Q2 and period with economic liberalization policy,
1986Q3-2012Q4. The result shows that with the economic liberalization policy the impact of

International Journal of Development and Emerging Economics
Vol. 2, No.4, pp.43-59, December 2014
Published by European Centre for Research Training and Development UK (www.eajournals.org)
54
ISSN 2055-608X(Print), ISSN 2055-6098(Online)
openness on electricity consumption increased by 0.022 percent as indicated by the differential
slope coefficient which is significant at the 10 percent level.
𝑙𝑜𝑔𝐸𝐿𝐸𝐶 = 1.0442 − 0.0252𝑙𝑜𝑔𝐷𝑂𝑃 + 0.0529𝑙𝑜𝑔𝐹𝐼𝑁𝐷 − 0.0275𝑙𝑜𝑔𝑃𝑂𝑃+ 0.7049𝑙𝑜𝑔𝐸𝑁𝐶 .
𝑙𝑜𝑔𝐸𝐿𝐸𝐶 = −1.7029 − 0.0028𝑙𝑜𝑔𝐷𝑂𝑃 + 0.0882𝑙𝑜𝑔𝐹𝐼𝑁𝐷 + 0.3257𝑙𝑜𝑔𝑃𝑂𝑃+ 0.4496𝑙𝑜𝑔𝐸𝑁𝐶
However, with the implementation of the policy the impact of POP on performance of the
Nigerian power subsector increased by 0.035 percent as indicated by the differential slope
coefficient which is statistically significant at 1 percent level thus, with the policy a percentage
increase in POP increased ELEC by 0.33 percent.
This study also examined the impact of economic liberalization on performance of the Nigerian
aggregate industrial sector and the results, after correcting for arbitrary level of autocorrelation
are presented as:
𝑙𝑜𝑔𝐼𝑁𝑄 = 3.7023 + 0.1059𝑙𝑜𝑔𝐷𝑂𝑃 − 0.3016𝑙𝑜𝑔𝐹𝐼𝑁𝐷 − 0.1014𝑙𝑜𝑔𝑃𝑂𝑃+ 0.6509𝑙𝑜𝑔𝐸𝑁𝐶
𝑙𝑜𝑔𝐼𝑁𝑄 = −1.0808 + 0.0377𝑙𝑜𝑔𝐷𝑂𝑃 − 0.2116𝑙𝑜𝑔𝐹𝐼𝑁𝐷 + 0.4023𝑙𝑜𝑔𝑃𝑂𝑃+ 0.3659𝑙𝑜𝑔𝐸𝑁𝐶
In specific terms, the results depicts that before economic liberalization a percentage increase
in openness and energy increased the aggregate index of industrial production by 0.106 and
0.651 percent respectively, but a percentage increase in financial deepening and population
growth retarded the aggregate index of industrial production by 0.302 and 0.101 percent
respectively. Economic liberalization which began in 1986Q3 retarded the impact of DOP and
energy on performance of the aggregate industrial sector by 0.068 and 0.285 percent,
respectively. However, the impact of FIND and POP were enhanced by 0.09 and 0.504 percent,
respectively. These results showed that the impact of the economic liberalization policy which
began in 1986Q3 on performance of the aggregate industrial sector is mix, while it interacts to
enhance the impact of the Nigerian financial sector development and labour force productivity
on performance of the aggregate industrial sector, respectively it interacts to retard the impact
of trade openness and energy consumption.
CONCLUSION
This study examined the impact of economic liberalization on industrial performance in
Nigeria with attention on the subsectors of manufacturing, mining and quarrying and power,
and the aggregate industrial sector. Using the dummy variable structural break model the study
found that the economic liberalization has impacted significantly on performance of the
Nigerian industrial sector. Specifically, economic liberalization has a significant impact on
performance of the Nigerian manufacturing, mining and quarrying, and power subsectors,
respectively and the aggregate industrial sector. While the interaction of the policy with trade
openness and financial deepening dampened the performance of the manufacturing subsector
its interaction with labour force is growth enhancing. Also the interaction of the policy with
energy consumption was negative but its interaction with financial deepening and energy
consumption has dampening effect on the performance of the mining and quarrying subsector.
While it has enhancing impact on the aggregate industrial sector and was not significant on
mining and quarrying and power subsectors, economic liberalization decreased the
performance of the manufacturing subsector. Beside, financial deepening has mix impact on

International Journal of Development and Emerging Economics
Vol. 2, No.4, pp.43-59, December 2014
Published by European Centre for Research Training and Development UK (www.eajournals.org)
55
ISSN 2055-608X(Print), ISSN 2055-6098(Online)
the performance of the industrial sector. While it has increasing impact on the aggregate
industrial sector, its impact on manufacturing performance is negative.
On the basis of the above findings, the study recommends that trade openness should be
encouraged but its implementation should be handled in line with the peculiarities of the
country concerned. Arising from the above, attention should be more on increasing and
diversifying the export base of the economy. Government should encourage financial sector
development but with care. For this reason therefore, more credit created should be channelled
to the private sector for they are the drivers of economic development. Beside, efforts toward
further economic liberalization should be one that encourages development and utilization of
the abundant energy resources in the economy.
REFERENCES Adenikinju A.F. and L.N Chete (2002), “Productivity, Market Structure and Trade
Liberalization in Nigeria”. African Economic Research Consortium (AERC) Research
Paper, African Economics Research Center, Nairobi
Afaha, J. S. and B.O Njogo (2012), “Trade Openness and Its Effect on the Nigerian Economy
(1970 -2010)” Arabian Journal of Business and Management Review (OMAN Chapter)
Vol. 2 (1), August
Ajayi, I. (2003) “Globalization and Equity in Sub-Saharan Africa: the Myth and the Reality”
A paper presented at the 4th Annual Global Development Conference on Globalization
and Equity, Cairo, Egypt, January 14-21
Ayodele, A. I. and G. Falokun (2003), The Nigerian Economy: Structure and Pattern of
Development. JODAD Publishers
Bakare, A. S. and F.O Fawehinmi (2011) “Trade Openness and Its Impact on Nigeria’s Non-
Oil Industrial Sector: 1979-2009” Economics and Finance Review, Vol.1 (5): 57- 65,
July
Basevi, G. (1970), “Domestic Demand and the Ability to Export. Journal of Political
Economy”, Vol. 78 (March/April): 330-337
Caves, R.E., M. E Porter and A.M Spence (1980), Industrial Organization in an Open
Economy, Cambridge, Harvard University Press
Central Bank of Nigeria (2012), Annual Report, December
Central Bank of Nigeria (2007), Annual Report and Statement of Accounts, December
Central Bank of Nigeria (2007), Statistical Bulletin, Volume 17
Condon, T, V. Corbo and J. de Melo (1985), “Productivity growth, external shocks and capital
inflow in Chile 1977–81: A general equilibrium analysis”. The Journal of Policy
Modelling, Vol. 8(2): 329-406
Egbon, P.C (1985), “Industrial Policy and Manufacturing Performance in Nigeria”, NCEMA,
Ibadan
Egwaikhide, F (1997), “Import Substitution Industrialisation in Nigeria” The Nigerian Journal
of Economic and Social Studies, Vol.39 (2)
Ekpo, A. H (1995), “Openness and Economic Performance in Nigeria: A Time-Series
Analysis”. Selected Papers for the 1995 Annual Conference
Elijah, O. A. (2007) “Effects of Economic Globalisation on Employment Trend and Wages in
Developing Countries: Lessons from Nigeria experiences” Selected papers of the 22nd
National Conference of Labour Economics organized by the Association of Italian
Economist of Labour (AIEL), September 13-14
International Journal of Development and Emerging Economics
Vol. 2, No.4, pp.43-59, December 2014
Published by European Centre for Research Training and Development UK (www.eajournals.org)
56
ISSN 2055-608X(Print), ISSN 2055-6098(Online)
Forountan, F. (1991), “Foreign trade and its relation to competition and productivityin Turkish
industry”, World Bank, Policy Research and External Affairs Working Papers WPS 604,
February
Frenkil, J (1971), “On Domestic Demand and Ability to Export”; Journal of Political Economy,
Vol. 79, May/June
Geroski, P .A. (1982), “Simultaneous Equations Models of the Structure-Performance
Paradigm”, European Economic Review, 19
Grubel, H.G. and P.J. Lloyd (1975), Intra-Industry Trade, the Theory and Measurement of
International Trade in Differentiated Products. London: MacMillan
Haddad, M. (1993), “How Trade Liberalization Affected Productivity in Morocco”, World
Policy Research Working Paper S1096, February
Harrison, A. (1990), “Productivity, Imperfect Competition and Trade Liberalization in Côte
d’lvoire”, World Bank PRE Working Papers No. 1 WPS 451
Havrylyshyn,O.(1990), “Trade Policy and Productivity Gains in Developing Countries: A
Survey of the Literature”, World Bank Research Observer 5(1):1-24
Krueger, A. O. and B. Tuncer (1982), “An Empirical Test of the Infant Industry Argument”,
The American Economic Review, Vol. 72(5): 1142-1152
Mesike, C. S., D.Y Giroh and 0.E.D Owie (2008), “Analyzing the Effect of Trade
Liberalization Policy in Nigerian Rubber Industry”. Journal of Agriculture and Social
Sciences, Vol. 4: 132–134
Mougani, G. (2012), “An Analysis of the Impact of Financial Integration on Economic Activity
and Macroeconomic Volatility in Africa within the Financial Globalization Context”
African Development Bank Group Working Paper Series No. 144, February
Neumann, M, I. Bobel and A. Haid (1979), “Profitability, Risk and Market Structure in West
German Industries”; Journal of Industrial Economics, Vol. 27 (3)
Obaseki, P. J. (2002), “Globalisation and the Nigerian Economy” Central Bank of Nigeria
Economic and Financial Review, Vol. 38 (2): 17-33
Olotu, McRollins Efe and Kaine, A.I.N (2011) “Globalization and Aggregate Employment
Nexus: A Recent Experience of the Nigerian Industrial Sector” JORIND Vol. (2): 298-
301, December
Onwuka, E. C. and A. Eguavoen (2007) “Globalization and Economic Development: The
Nigerian Experience” Kamla-Raj, Journal of Social Sciences, Vol. 14 (1): 45-51
Onyeiwu, S. (2009) “Determinants of Inter-Country Variations in Industrial Performance in
Africa: Evidence from Cross-Country and Panel Regressions” A Paper Presented at the
African Economic Development Conference Organized by the African Development
Bank (ADB) and the Economic Commission for Africa (ECA), Addis Ababa, November
11-13.
Onyeonoru, I. (2003) “Globalisation and Industrial Performance in Nigeria” Africa
Development, Vol. 28 (3): 36–66
Osabuohien, E. S. C. (2007) “Trade Openness and Economic Performance of ECOWAS
Members - Reflections from Ghana and Nigeria” African Journal of Business and
Economic Research, Vol. 2 No. 2: 57-77, March
Osagie, R. O. (2011), “Globalization and Human Resource Development in Nigeria” American
Journal of Social and Management Sciences, Vol. 2 (2): 217-219
Pack, H (1988), “Industrialization and Trade,” in H. Chenery and T.N. Srinivasan (eds.)
Handbook of Development Economics, Vol. 1, Amsterdam: Elsevier Science Publishers
B.V.
International Journal of Development and Emerging Economics
Vol. 2, No.4, pp.43-59, December 2014
Published by European Centre for Research Training and Development UK (www.eajournals.org)
57
ISSN 2055-608X(Print), ISSN 2055-6098(Online)
Page, J. M. (1984), “Firm size and technical efficiency: Application of production frontier to
Indian survey data”, Journal of Development Economics, 16: 129–52
Pagoulatos E and R. Sorensen (1976), “International Trade, International Investment and
Industrial Profitability of U.S Manufacturing”; The Southern Economic Journal34, Vol.
42: 425-434
Pitt, M. M. and L. Lung-Fei (1981), “The Measurement and Sources of Technical
Inefficiency in the Indonesian Weaving Industry”, Journal of Development
Economics 9: 43-64.
Pugel, T.A. (1980), “Foreign Trade and U.S. Market Performance”, Journal of Industrial
Economics, 29, 119-129
Saibu, M. O. (2011), “Sectoral Output Responses to Trade Openness, Oil Price and Policy
Shocks in Nigeria: A CVAR Approach” Journal of Social and Development Sciences,
Vol. 1(2) 48-59, March
Tamuno, S. O. and Edoumiekumo, S. G. (2012) “Industrialization and Trade Globalization:
What Hope for Nigeria?” International Journal of Academic Research in Business and
Social Sciences, Vol. 2, No. 6: 157-170, June
Tsao, Y (1985). Growth without Productivity: Singapore Manufacturing in the 1970s. Journal
of Development Economics, Vol. 19(1-2): 25-38
Udah, E. B. (2010), “Industrial Development, Electricity Crisis and Economic Performance in
Nigeria” European Journal of Economics, Finance and Administrative Sciences, Vol.
18:105-121
Udegbunam, R. I. (2002) “Openness, Stock Market Development, and Industrial Growth in
Nigeria” The Pakistan Development Review Vol. 41 (1): 69–92
Upender, M (2008), Applied Econometrics 3rd Edition, India, Vrinda Publications (P) Limited
APPENDIX
Table 1: Variance Inflation Factor (VIF) with all variables
Variable R2 Tolerance Factor (1-
R2)
VIF = 1/(1-R2)
LogGCF
LogFDI
LogDOP
Log Energy
LogPOP
LogFIND
0.9864
0.9699
0.9591
0.8650
0.7391
0.7323
0.0136
0.0301
0.0409
0.1350
0.2609
0.2677
73.5294
33.2226
24.4499
7.4074
3.8329
3.7355
Source: Authors Computation
Table 2: Variance Inflation Factor (VIF) after dropping LogGCF and LogFDI
Variable R2 Tolerance Factor (1-
R2)
VIF = 1/(1-R2)
LogEnergy
LogPOP
LogFIND
LogDOP
0.8353
0.7186
0.6988
0.5571
0.1647
0.2814
0.3012
0.4429
6.0716
3.5537
3.3201
2.2578
Source: Authors Computation

International Journal of Development and Emerging Economics
Vol. 2, No.4, pp.43-59, December 2014
Published by European Centre for Research Training and Development UK (www.eajournals.org)
58
ISSN 2055-608X(Print), ISSN 2055-6098(Online)
Table 3: Results for the Manufacturing Sector with Robust Standard Errors
LogIMQ
Coefficient
Robust Stand
Error
t-
stat
p-
value
LogDOP
LogLIB*DOP
LogFIND
LogLIB*FIND
LogPOP
LogLIB*POP
LogEnergy
LogLIB*Energy
LogLIB
Constant
0.1079
-0.0870
0.0824
-0.0552
-0.0701
0.5162
0.8399
-0.4168
-3.7401
0.8756
0.0281
0.0131
0.1501
0.0671
0.0288
0.0341
0.1002
0.0461
0.3450
0.3152
3.84
-6.65
0.55
-0.82
-2.43
15.13
8.38
-9.05
-10.84
2.78
0.000
0.000
0.548
0.412
0.016
0.000
0.000
0.000
0.000
0.006
R2
F-statistic (probability)
Durbin-Watson statistic (10, 172)
Breusch-Godfrey LM Chi-square Statistic
Ramsey RESET F-stat (3, 159)
Variable Deletion F-stat (5, 162)
0.963
949.72 (0.0000)
0.9393
48.36 (0.0000)
0.90 (0.4426)
139.41 (0.0000)
Source: Authors computation
Table 4: Estimation Results for the Mining Sector with Robust Standard Errors
LogINMQ
Coefficient
Robust Std
Error
t-
stat
p-
value
LogDOP
LogLIB*DOP
LogFIND
LogLIB*FIND
LogPOP
LogLIB*POP
LogEnergy
LogLIB*Energy
LogLIB
Constant
0.2009
-0.1018
-0.3771
0.0544
-0.0463
0.5287
0.2588
-0.0909
-5.9941
5.4479
0.0214
0.0094
0.1000
0.0439
0.0290
0.0220
0.0783
0.0352
0.2154
0.2767
9.39
-10.74
-3.77
1.24
-1.60
24.08
3.30
-2.59
-27.82
19.69
0.000
0.000
0.000
0.217
0.112
0.000
0.001
0.011
0.000
0.000
R2
F-statistic (probability)
Durbin-Watson statistic (10, 172)
Breusch-Godfrey LM Chi-square Statistic
Ramsey RESET F-stat (3, 159)
Variable Deletion F-stat (5, 162)
0.8602
286.45 (0.0000)
0.5727
76.518 (0.000)
0.86 (0.1563)
286.88 (0.0000)
Source: Authors Computation

International Journal of Development and Emerging Economics
Vol. 2, No.4, pp.43-59, December 2014
Published by European Centre for Research Training and Development UK (www.eajournals.org)
59
ISSN 2055-608X(Print), ISSN 2055-6098(Online)
Table 5: Results for the Power Sector with Robust Standard Errors
LogELEC
Coefficient
Robust Std
Error
t-
stat
p-
value
LogDOP
LogLIB*DOP
LogFIND
LogLIB*FIND
LogPOP
LogLIB*POP
LogEnergy
LogLIB*Energy
LogLIB
Constant
-0.0252
0.0224
0.0529
0.0353
-0.0275
0.3532
0.7049
-0.2553
-2.7471
1.0442
0.0276
0.0131
0.1699
0.0852
0.0418
0.0481
0.1204
0.0722
0.4736
0.4090
-0.91
1.71
0.31
0.41
-0.66
7.31
5.86
-3.54
-5.80
2.55
0.363
0.089
0.756
0.679
0.511
0.000
0.000
0.001
0.000
0.012
R2
F-statistic (probability)
Durbin-Watson statistic (10, 172)
Breusch-Godfrey LM Chi-square Statistic
Ramsey RESET F-stat (3, 159)
Variable Deletion F-stat (5, 162)
0.9466
593.96 (0.0000)
0.5722
84.336 (0.0000)
0.59 (0.6554)
75.66 (0.0000)
Source: Author’s Computation
Table 6: Results for the Aggregate Industrial Sector with Robust Standard Errors
LogINQ
Coefficient
Robust Std
Error
t-stat p-
value
LogDOP
LogLIB*DOP
LogFIND
LogLIB*FIND
LogPOP
LogLIB*POP
LogEnergy
LogLIB*Energy
LogLIB
Constant
0.1059
-0.0682
-0.3016
0.0900
-0.1014
0.5037
0.6509
-0.2850
-4.7831
3.7023
0.0197
0.0089
0.0814
0.0364
0.0277
0.0220
0.0617
0.0283
0.2238
0.2779
5.37
-7.69
-3.71
2.47
-3.66
22.88
10.55
-10.07
21.37
13.32
0.000
0.000
0.000
0.014
0.000
0.000
0.000
0.000
0.000
0.000
R2
F-statistic (probability)
Durbin-Watson statistic (10, 172)
Breusch-Godfrey LM Chi-square Statistic
Ramsey RESET F-stat (3, 159)
Variable Deletion F-stat (5, 162)
0.9544
445.54 (0.0000)
0.8644
50.642 (0.0000)
0.41 (0.1156)
126.42 (0.0000)
Source: Authors Computation