Embed Size (px)
Citation preview
Economic Justification of Enterprise Development based on Company Value Analysis
Natalia A. Shcherbakova*, and Alexander Shcherbakov
Novosibirsk State Technical University, Novosibirsk, Russia
Abstract. The article considers the use of company value analysis for
economic justification of the choice of directions for business development.
The company value analysis is based on income forecasting. The authors
outline the features of income modelling for these purposes. They consider
various ways of forecasting the income of an enterprise for the purpose of
economic justification of development options based on annual and
quarterly values. The article suggests that the current pandemic situation in
the world has significantly affected the performance and development
prospects of almost every company making it harder to forecast the
performance based on retrospective data due to dramatic changes in income
caused by the socio-economic environment in the world. The authors arrived
at the conclusion that each specific scenario requires the use of a number of
forecast options and selection of the most appropriate forecasting model
with regard to every particular situation. In conclusion, it was pointed out
that the value analysis of the company gives evident results and can be
considered as an effective tool for economic justification of the choice of
directions for business development.
Keywords: company value analysis, value-based management, enterprise
value, enterprise development, economic justification.
1 Introduction
The relevance of the study is determined by the fact that in modern conditions the approaches
to assessing the effectiveness of company performance are being transformed. More and
more researchers are turning from the classical indices of financial and economic analysis to
the issues of business value chain, that is, so-called value analysis. An attempt has been made
within the present study of company’s value analysis to clarify the tools of economic
justification of development options, which seems to be quite relevant.
The growth of business value is considered as the main characteristic of business
management effectiveness and the main indicator of company’s success. The dynamics of
changes in value is an effective tool for making management decisions. The direction called
* Corresponding author: [email protected]
© The Authors, published by EDP Sciences. This is an open access article distributed under the terms of the Creative Commons Attribution License 4.0 (http://creativecommons.org/licenses/by/4.0/).
SHS Web of Conferences 80, 01013 (2020)XVII International Conference of Students and Young Scientists "Prospects of Fundamental Sciences Development"
https://doi.org/10.1051/shsconf/20208001013
value-based management is being actively developed. The article discusses the technology
of applying this methodology for economic justification of a business development options.
2 Progress level in the subject research
Recently, the views about evaluation of a business’s efficiency and its development options
are changing. Many researchers conclude that classically calculated economic indicators,
indicators of financial and economic analysis in particular, do not allow to adequately
assessing the performance of a company. The real effectiveness of activities and the choice
of development directions should lead to the increase in company value. This thesis has been
well documented by scholars from around the world [1-3]. Among the economists who have
contributed to the study of various aspects of value-based management are T. Copeland, A.
Damodaran, T. Koller, N. Antilla and K. Lee [6], V.G. Kogdenko, I.V. Ivashkovskaya, V.A.
Shcherbakov.
The advantages of using the value indicator to assess a company’s performance are the
following: firstly, the company value is measurable; secondly, it reflects the increase in the
well-being of shareholders [4-6]. The last and most important aspect is that it takes into
account not only the current, but also the long-term results of the enterprise, which is crucial
in determining areas of a company’s development. Existing studies are primarily aimed at
assessing the company value and its change as a whole [7-9]. In this article, the authors
examine the applicability of company’s value analysis to a particular aspect - the economic
justification of the choice of directions for company development.
The novelty of the research is the development of economic and mathematical models for
the justification of areas of a company’s development based on the methodology of company
value analysis.
The article presents the results of a study conducted by the authors in the field of clarifying
the concept of value-based management and developing tools for value analysis. The main
objectives of the article can be interpreted as follows:
- present the value analysis as a relevant effective method for assessing the company’s
efficiency and an effective tool for economic justification of areas of a company’s
development;
- clarify the tools for economic justification of directions for business development based
first of all on a precise identification of a comparison base that requires statistical modeling
of a business income.
The theoretical relevance of the work concerns systematization and clarification of
theoretical assumptions in terms of methodological approaches to making calculations for
economic justification of areas of a company’s development. The key hypothesis of the study
is the statement that in the modern economy the company value analysis can provide a correct
and objective way to choose the areas for a company’s development.
The practical relevance is to test the developed economic and mathematical models using
the data from actual Russian companies. In particular, the paper discusses the possibility of
obtaining reasonable sales forecasts and other key indicators of companies' economic
activities. The requirements of accuracy and validity to applying the corresponding
analytical models should, however, be given a priority in these model calculations. The
economic and mathematical models proposed in the article as well as the criteria for
management decisions make it possible to more objectively evaluate selection of the areas
for enterprise development.
Research methodology. The framework of the study included three main stages. The first
stage was made up of selection of the revenue parameter for forecasting. The second stage
consisted of formation of an economic-mathematical model of calculation and its testing on
the data of a real company. The third stage was the adjustment of the trend values if necessary.
2
SHS Web of Conferences 80, 01013 (2020)XVII International Conference of Students and Young Scientists "Prospects of Fundamental Sciences Development"
https://doi.org/10.1051/shsconf/20208001013
The research involved general research methods such as the method of ascending from
the abstract to the concrete, the methods of comparison, observation, and scientific
generalization. The method of ascending from the abstract to the concrete was chosen since
there was needed a transition from theoretical principles to practical aspects, to the study of
specific companies. The comparison method was used as the most important analysis method,
allowing evaluating, in particular, individual aspects of the company’s activities and the
effectiveness of its functioning as a whole based on comparison of absolute and relative
values. The observation method was used because the research provided monitoring real
objects, namely, data from real companies. The method of scientific generalization was
employed, since there is logic in transition from the singular to the general; in this case, to
the specifics of the functioning of individual companies as a whole.
In addition, when carrying out model calculations, special econometric methods were also
used: approximations and extrapolations based on the construction of linear trends, statistical
estimation of reliability of forecast results.
3 Features of income forecasting for the economic justification of the company's development options
For economic justification of decisions about a company’s development options on the basis
of the company value analysis methodology, it is proposed to compare the company value in
the situation ‘as it is’ and in the situation when a company’s development direction changes.
The situation is called ‘as it is’ when a company is functioning without significant changes,
i.e. without shifting to new development options. The calculation of the sought value for
choosing a development option is based on forecasts of its income.
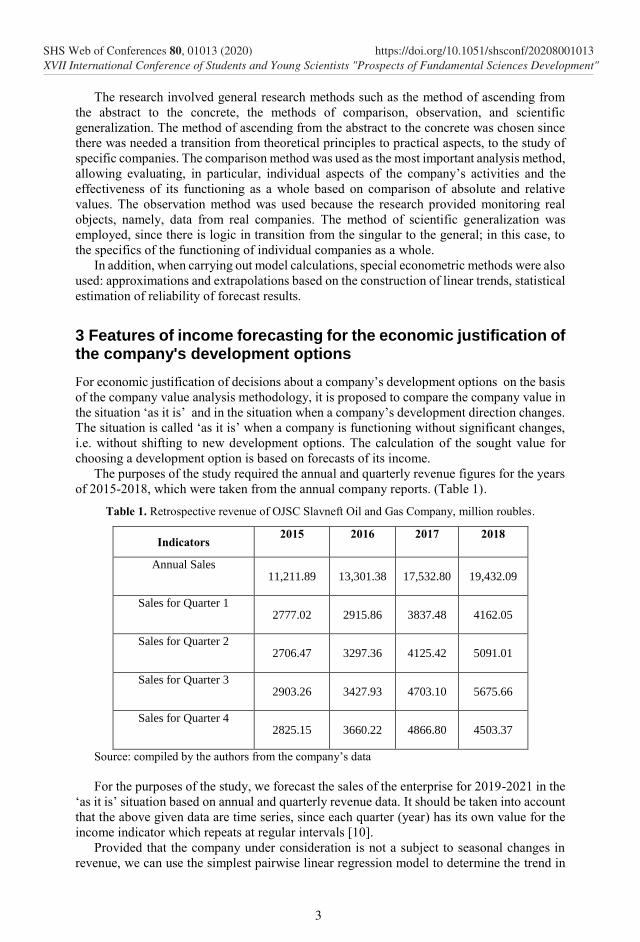
The purposes of the study required the annual and quarterly revenue figures for the years
of 2015-2018, which were taken from the annual company reports. (Table 1).
Table 1. Retrospective revenue of OJSC Slavneft Oil and Gas Company, million roubles.
Indicators 2015 2016 2017 2018
Annual Sales 11,211.89 13,301.38 17,532.80 19,432.09
Sales for Quarter 1 2777.02 2915.86 3837.48 4162.05
Sales for Quarter 2 2706.47 3297.36 4125.42 5091.01
Sales for Quarter 3 2903.26 3427.93 4703.10 5675.66
Sales for Quarter 4 2825.15 3660.22 4866.80 4503.37
Source: compiled by the authors from the company’s data
For the purposes of the study, we forecast the sales of the enterprise for 2019-2021 in the
‘as it is’ situation based on annual and quarterly revenue data. It should be taken into account
that the above given data are time series, since each quarter (year) has its own value for the
income indicator which repeats at regular intervals [10].
Provided that the company under consideration is not a subject to seasonal changes in
revenue, we can use the simplest pairwise linear regression model to determine the trend in
3
SHS Web of Conferences 80, 01013 (2020)XVII International Conference of Students and Young Scientists "Prospects of Fundamental Sciences Development"
https://doi.org/10.1051/shsconf/20208001013
revenue changes. As y in the case of economic justification of the development options for
the company, we can use any indicators that vary depending on the analyzed development
option (sales, profit, others), as x - the numbers of historical periods for the time series.
The pairwise linear regression model is as follows (1):
𝑦 = 𝛽0 + 𝛽1𝑥 + 𝜖, (1)
where 𝛽0, 𝛽1– model parameters, ϵ - random variable indicating error, x –time periods, y –
revenue for the past period of time. An equation that describes how the expected value of y
depends on x is called a regression equation (in this case, the graph of the equation will be a
straight line) and is written as (2):
ŷ = 𝛽0 + 𝛽1𝑥, (2)
where 𝛽0 – regression line bias, 𝛽0 – slope, ŷ – expected (average) value for a given x value.
To determine the coefficients 𝛽0, 𝛽1 of the regression equation, we will use the least squares
method, which consists in minimizing the squared deviations of the observed values from the
expected ones (3):
∑(𝑦𝑖 − ŷ𝑖)2. (3)
The minimization of this function is carried out by the methods of differential calculus using
partial derivatives for each of the variables entering the function. Thus, we obtain the
following formulae for determining the parameters that minimize this function (4) [10]:
𝛽1 = ∑(𝑥𝑖 − 𝑥)(𝑦𝑖−𝑦)
∑(𝑥𝑖−𝑥)2 , 𝛽0 = 𝑦 − 𝛽1𝑥, (4)
where 𝑥𝑖 – independent variable value, 𝑦𝑖 – observed value of the dependent variable, 𝑥 –
mean value of the independent variable, 𝑦 – average value of the dependent variable.
Now, it is necessary to determine the method to evaluate the quality of the constructed
model. The conventional method in economics for determining the quality measure of a
model is the coefficient of determination, 𝑅2.
𝑆𝑆𝐸 = ∑(𝑦𝑖 − ŷ𝑖)2 – measure of error in predicting the values of a dependent variable.
𝑆𝑆𝑇 = ∑(𝑦𝑖 − 𝑦)2 – measure of error when using the average 𝑦 to predict the values of
the dependent variable.
𝑆𝑆𝑅 = ∑(ŷ𝑖 − 𝑦)2 – a measure of the deviation of the expected value ŷ𝑖 from the
average 𝑦. SSE, SST and SSR related as follows: SST = SSR + SSE. Thus, the determination
coefficient 𝑅2 is defined as follows: 𝑅2 = 𝑆𝑆𝑅
𝑆𝑆𝑇 , 𝑅2𝜖 (0, 1).
To identify the trend in revenue changes in the ‘as it is’ situation, we use the described
pairwise linear regression model and the data of Table 1. As y in this case of the economic
justification of a company's development options, we take the revenue by years for model 1
and the quarterly revenue for model 2, respectively, as x are the numbers of years or quarters
of the history. The results are shown in Fig.1-3.
4
SHS Web of Conferences 80, 01013 (2020)XVII International Conference of Students and Young Scientists "Prospects of Fundamental Sciences Development"
https://doi.org/10.1051/shsconf/20208001013
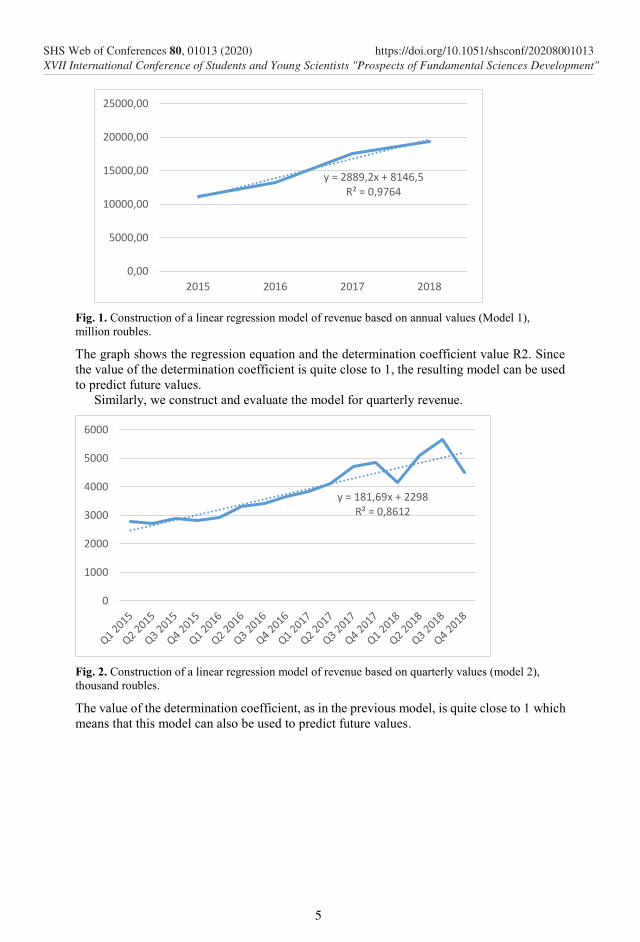
Fig. 1. Construction of a linear regression model of revenue based on annual values (Model 1),
million roubles.
The graph shows the regression equation and the determination coefficient value R2. Since
the value of the determination coefficient is quite close to 1, the resulting model can be used
to predict future values.
Similarly, we construct and evaluate the model for quarterly revenue.
Fig. 2. Construction of a linear regression model of revenue based on quarterly values (model 2),
thousand roubles.
The value of the determination coefficient, as in the previous model, is quite close to 1 which
means that this model can also be used to predict future values.
y = 2889,2x + 8146,5R² = 0,9764
0,00
5000,00
10000,00
15000,00
20000,00
25000,00
2015 2016 2017 2018
y = 181,69x + 2298R² = 0,8612
0
1000
2000
3000
4000
5000
6000
5
SHS Web of Conferences 80, 01013 (2020)XVII International Conference of Students and Young Scientists "Prospects of Fundamental Sciences Development"
https://doi.org/10.1051/shsconf/20208001013
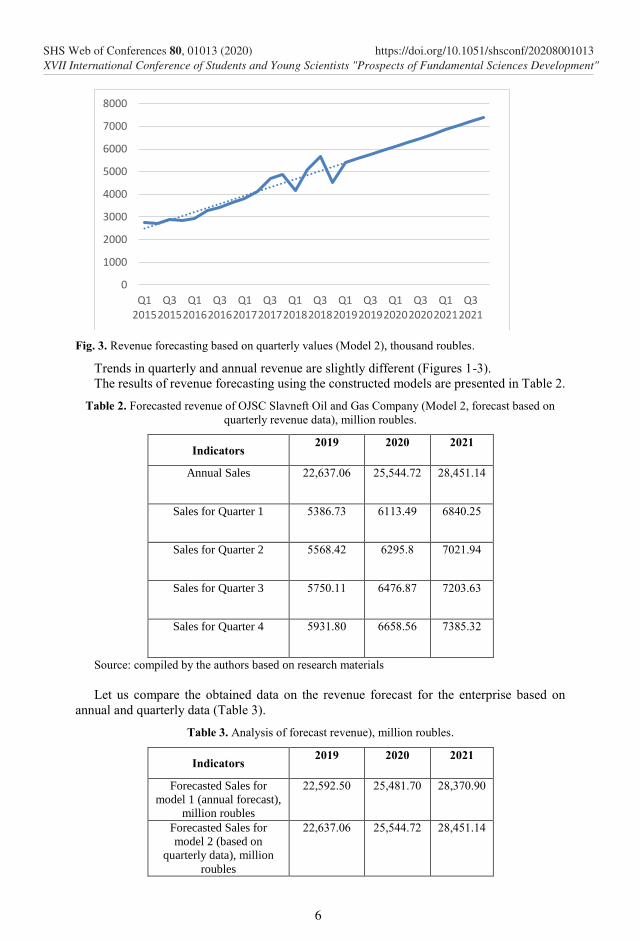
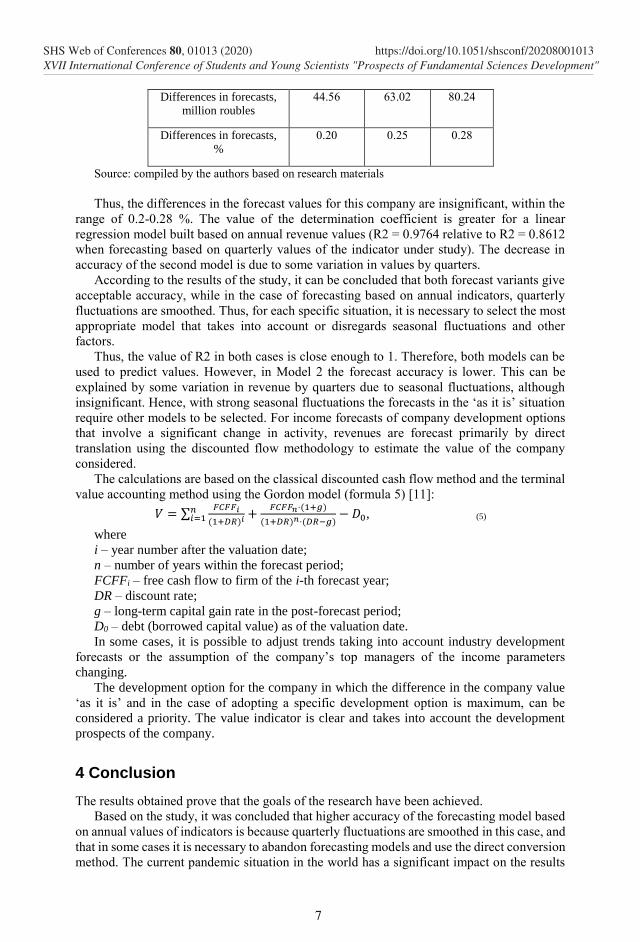
Fig. 3. Revenue forecasting based on quarterly values (Model 2), thousand roubles.
Trends in quarterly and annual revenue are slightly different (Figures 1-3).
The results of revenue forecasting using the constructed models are presented in Table 2.
Table 2. Forecasted revenue of OJSC Slavneft Oil and Gas Company (Model 2, forecast based on
quarterly revenue data), million roubles.
Indicators 2019 2020 2021
Annual Sales 22,637.06 25,544.72 28,451.14
Sales for Quarter 1 5386.73 6113.49 6840.25
Sales for Quarter 2 5568.42 6295.8 7021.94
Sales for Quarter 3 5750.11 6476.87 7203.63
Sales for Quarter 4 5931.80 6658.56 7385.32
Source: compiled by the authors based on research materials
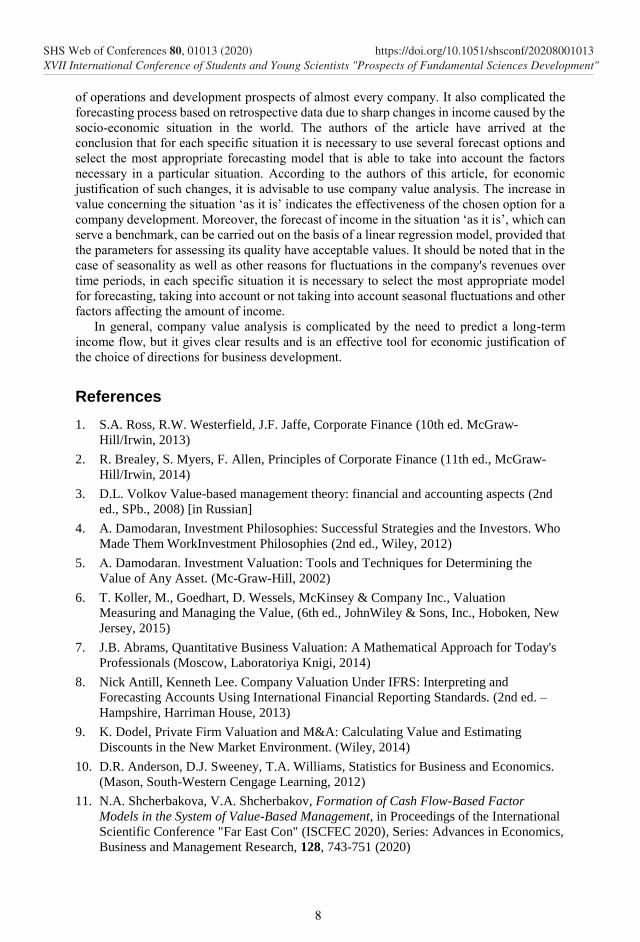
Let us compare the obtained data on the revenue forecast for the enterprise based on
annual and quarterly data (Table 3).
Table 3. Analysis of forecast revenue), million roubles.
Indicators 2019 2020 2021
Forecasted Sales for
model 1 (annual forecast),
million roubles
22,592.50 25,481.70 28,370.90
Forecasted Sales for
model 2 (based on
quarterly data), million
roubles
22,637.06 25,544.72 28,451.14
0
1000
2000
3000
4000
5000
6000
7000
8000
Q12015
Q32015
Q12016
Q32016
Q12017
Q32017
Q12018
Q32018
Q12019
Q32019
Q12020
Q32020
Q12021
Q32021
6
SHS Web of Conferences 80, 01013 (2020)XVII International Conference of Students and Young Scientists "Prospects of Fundamental Sciences Development"
https://doi.org/10.1051/shsconf/20208001013
Differences in forecasts,
million roubles
44.56 63.02 80.24
Differences in forecasts,
%
0.20 0.25 0.28
Source: compiled by the authors based on research materials
Thus, the differences in the forecast values for this company are insignificant, within the
range of 0.2-0.28 %. The value of the determination coefficient is greater for a linear
regression model built based on annual revenue values (R2 = 0.9764 relative to R2 = 0.8612
when forecasting based on quarterly values of the indicator under study). The decrease in
accuracy of the second model is due to some variation in values by quarters.
According to the results of the study, it can be concluded that both forecast variants give
acceptable accuracy, while in the case of forecasting based on annual indicators, quarterly
fluctuations are smoothed. Thus, for each specific situation, it is necessary to select the most
appropriate model that takes into account or disregards seasonal fluctuations and other
factors.
Thus, the value of R2 in both cases is close enough to 1. Therefore, both models can be
used to predict values. However, in Model 2 the forecast accuracy is lower. This can be
explained by some variation in revenue by quarters due to seasonal fluctuations, although
insignificant. Hence, with strong seasonal fluctuations the forecasts in the ‘as it is’ situation
require other models to be selected. For income forecasts of company development options
that involve a significant change in activity, revenues are forecast primarily by direct
translation using the discounted flow methodology to estimate the value of the company
considered.
The calculations are based on the classical discounted cash flow method and the terminal
value accounting method using the Gordon model (formula 5) [11]:
𝑉 = ∑𝐹𝐶𝐹𝐹𝑖
(1+𝐷𝑅)𝑖 +𝐹𝐶𝐹𝐹𝑛⋅(1+𝑔)
(1+𝐷𝑅)𝑛⋅(𝐷𝑅−𝑔)− 𝐷0
𝑛𝑖=1 , (5)
where
i – year number after the valuation date;
n – number of years within the forecast period;
FCFFi – free cash flow to firm of the i-th forecast year;
DR – discount rate;
g – long-term capital gain rate in the post-forecast period;
D0 – debt (borrowed capital value) as of the valuation date.
In some cases, it is possible to adjust trends taking into account industry development
forecasts or the assumption of the company’s top managers of the income parameters
changing.
The development option for the company in which the difference in the company value
‘as it is’ and in the case of adopting a specific development option is maximum, can be
considered a priority. The value indicator is clear and takes into account the development
prospects of the company.
4 Conclusion
The results obtained prove that the goals of the research have been achieved.
Based on the study, it was concluded that higher accuracy of the forecasting model based
on annual values of indicators is because quarterly fluctuations are smoothed in this case, and
that in some cases it is necessary to abandon forecasting models and use the direct conversion
method. The current pandemic situation in the world has a significant impact on the results
7
SHS Web of Conferences 80, 01013 (2020)XVII International Conference of Students and Young Scientists "Prospects of Fundamental Sciences Development"
https://doi.org/10.1051/shsconf/20208001013
of operations and development prospects of almost every company. It also complicated the
forecasting process based on retrospective data due to sharp changes in income caused by the
socio-economic situation in the world. The authors of the article have arrived at the
conclusion that for each specific situation it is necessary to use several forecast options and
select the most appropriate forecasting model that is able to take into account the factors
necessary in a particular situation. According to the authors of this article, for economic
justification of such changes, it is advisable to use company value analysis. The increase in
value concerning the situation ‘as it is’ indicates the effectiveness of the chosen option for a
company development. Moreover, the forecast of income in the situation ‘as it is’, which can
serve a benchmark, can be carried out on the basis of a linear regression model, provided that
the parameters for assessing its quality have acceptable values. It should be noted that in the
case of seasonality as well as other reasons for fluctuations in the company's revenues over
time periods, in each specific situation it is necessary to select the most appropriate model
for forecasting, taking into account or not taking into account seasonal fluctuations and other
factors affecting the amount of income.
In general, company value analysis is complicated by the need to predict a long-term
income flow, but it gives clear results and is an effective tool for economic justification of
the choice of directions for business development.
References
1. S.A. Ross, R.W. Westerfield, J.F. Jaffe, Corporate Finance (10th ed. McGraw-
Hill/Irwin, 2013)
2. R. Brealey, S. Myers, F. Allen, Principles of Corporate Finance (11th ed., McGraw-
Hill/Irwin, 2014)
3. D.L. Volkov Value-based management theory: financial and accounting aspects (2nd
ed., SPb., 2008) [in Russian]
4. A. Damodaran, Investment Philosophies: Successful Strategies and the Investors. Who
Made Them WorkInvestment Philosophies (2nd ed., Wiley, 2012)
5. А. Damodaran. Investment Valuation: Tools and Techniques for Determining the
Value of Any Asset. (Mc-Graw-Hill, 2002)
6. T. Koller, M., Goedhart, D. Wessels, McKinsey & Company Inc., Valuation
Measuring and Managing the Value, (6th ed., JohnWiley & Sons, Inc., Hoboken, New
Jersey, 2015)
7. J.B. Abrams, Quantitative Business Valuation: A Mathematical Approach for Today's
Professionals (Moscow, Laboratoriya Knigi, 2014)
8. Nick Antill, Kenneth Lee. Company Valuation Under IFRS: Interpreting and
Forecasting Accounts Using International Financial Reporting Standards. (2nd ed. –
Hampshire, Harriman House, 2013)
9. K. Dodel, Private Firm Valuation and M&A: Calculating Value and Estimating
Discounts in the New Market Environment. (Wiley, 2014)
10. D.R. Anderson, D.J. Sweeney, T.A. Williams, Statistics for Business and Economics.
(Mason, South-Western Cengage Learning, 2012)
11. N.A. Shcherbakova, V.A. Shcherbakov, Formation of Cash Flow-Based Factor
Models in the System of Value-Based Management, in Proceedings of the International
Scientific Conference "Far East Con" (ISCFEC 2020), Series: Advances in Economics,
Business and Management Research, 128, 743-751 (2020)
8
SHS Web of Conferences 80, 01013 (2020)XVII International Conference of Students and Young Scientists "Prospects of Fundamental Sciences Development"
https://doi.org/10.1051/shsconf/20208001013