Embed Size (px)
Citation preview
Olle Krönby & Nils Brandsma Economic Inequality & Voter Turnout
1
Economic Inequality and Voting Participation
"Well, because poor people don’t vote. I mean, that’s just a fact," - Bernie Sanders. 2016
Authors: Nils Brandsma & Olle Krönby
Supervisor: Stig Blomskog
Södertörns högskola | Institution of Political Economics
Bachelor Thesis: 15 hp
Economics | Fall 2016

Olle Krönby & Nils Brandsma Economic Inequality & Voter Turnout
2
Abstract The following paper assesses a statistical relationship between Economic Inequality and
Voting Participation among a sizable amount of nations across the world representing all
continents. With an deductive approach, three theoretical standpoints of interest are
presented: one that describes a negative, another inconclusive, and one with a positive
relationship between the variables of interest. Through panel data analysis the study finds
support in favour of a negative relationship in that as economic inequality rises, voting
participation in parliamentary elections decreases.

Olle Krönby & Nils Brandsma Economic Inequality & Voter Turnout
3
Table of Contents
ABSTRACT ........................................................................................................................................... 2
1. INTRODUCTION ............................................................................................................................. 4
1.1 RESEARCH QUESTION .................................................................................................................... 4
1.2 PREVIOUS RESEARCH ..................................................................................................................... 5
2. THEORETICAL FRAMEWORK .................................................................................................. 7
2.1 CONFLICT THEORY (MELTZER & RICHARD 1981): ....................................................................... 7
2.2 RELATIVE POWER THEORY (GOODIN & DRYZEK 1980): .............................................................. 8
2.3 RESOURCE THEORY (VERBA, SCHLOZMAN & BRADY 1995) ........................................................ 9
2.4 SUMMARY OF THEORIES .............................................................................................................. 10
4.1 VARIABLES .................................................................................................................................. 15
5. ANALYSIS ....................................................................................................................................... 17
5.1 SUMMARY OF VARIABLES ........................................................................................................... 17
7. CONCLUSIONS .............................................................................................................................. 25
8. TOPICS FOR FUTURE RESEARCH .......................................................................................... 26
REFERENCES .................................................................................................................................... 28
APPENDIX .......................................................................................................................................... 30

Olle Krönby & Nils Brandsma Economic Inequality & Voter Turnout
4
1. Introduction A negative aspect of the modern democracy is the often low rate in participation by its
citizens (Pew Research Center 2016). The 2016 election in the United States drew attention
to a number of facts, one being that the president-elect only received approximately 26% of
the popular vote, and if the candidate “did not vote” would have been a physical person, he or
she would’ve won by a landslide. Why is it the case that people chose to abstain from voting,
even though it is an event only occurring every few years and has massive impact on peoples
lives? Our paper looks into one suggested factor, income inequality, since the increase in
average real income has been largest for the richest quintile and lowest for the poorest
(Bartels 2009 2). As expressed by Robert Dahl in 1961:
“In a political system where nearly every adult may vote but where knowledge,
wealth, social position, access to officials, and other resources are unequally
distributed, who actually governs?” (Dahl 1961 1)
Although the subject has been studied before, most of it has been focused on a select few
countries, often based in Western Europe and North America. Even then, the results has
ranged from finding a positive correlation between voter turnout and income inequality
(Brady 2003), inconclusive results (Geys 2006) and negative correlations (Solt 2008). In
order to avoid drawing conclusions from outdated information, this study will examine data
from the millennia and forward in the sole purpose of generating results at the more present
time of the 21st century. In this paper, we intend to include countries that have previously
been excluded from similar studies, many of them developing countries, in which some are
regarded as partly free by the Freedom House index. Previous research has mostly been
focused on western industrialized democracies, but has suggested a future study with a
broader sample, which is what we aim to do.
1.1 Research Question
This study is of deductive nature and will therefore go about introducing three theories
relating to voting participation and economic inequality, to later test these using panel data
analysis in order to answer our research question. The research question of this paper is as
follows:

Olle Krönby & Nils Brandsma Economic Inequality & Voter Turnout
5
To what extent, and in which direction does economic inequality affect the civil participation
of voters in national elections?
The corresponding equation will be set up as follows:
𝑌!"#$% !"#$%"& = 𝛼 + 𝛽𝑋1!"#" + 𝜀
1.2 Previous research
So far, previous research has been inconclusive regarding the effect of income inequality on
political participation. Frederick Solt (2008) examines three dependent variables, political
interest, participation in political discussion and electoral participation. He finds that income
inequality affects all three negatively. Most notable for us is the finding that higher income
inequality lowers political participation across the board, and that the results show on
average, likelihood for participation is lowered by 12,9 percentage points for the lowest
quintile and slightly less drastic number for each subsequent higher quintile. In other words,
economic inequality depresses voter turnout for all income groups in this study. (Solt 2008)
Benny Geys (2006) provides us with an aggregate-level survey study which uses the results
of 83 studies on turnout, and provides valuable information on variables relating to
population and political institutions. He also briefly mentions income inequality, and finds 13
significant negative results, 6 significant positive and 13 insignificant results (Geys 2006
645).
Geys updated this research in 2016 with João Cancela. It builds on Geys earlier work
previously mentioned, and points us towards a potential risk we face going into this study,
that our results may be inconclusive. Obviously, this is not a unique predicament, but the
study made by Cancela and Geys points to a quite harsh apparent truth. When examining 18
previous studies regarding income inequality over turnout, only 11% were successful
(Cancela & Geys 2016 267). With this in mind they establish that income inequality is a poor
variable for explaining turnout. This means that we should expect a low R2 value, if this
pattern should hold. It also means that we have a low chance of success for the study, and any
result producing statistically significant relationships should be considered a pleasurable
outcome. The tiny light in this darkness is that the interest for studies on income inequality

Olle Krönby & Nils Brandsma Economic Inequality & Voter Turnout
6
has increased, perhaps thanks to thinkers such as Thomas Piketty, and we are likely to see an
increase in research trying to figure out the link between these variables.
Henry E. Brady (2003) performs an analytical study of income inequality and turnout, but
focuses solely on the US. Like others, his study does not find any definitive results. In line
with Solts methodology, he considers other factors than voting turnout, looking at
participation in terms of writing letters or joining protests (Brady 2003 3). The problem with
considering non-electoral factors, both lawful and unlawful, is that they are in general not a
sign of a well performing democracy. The lack of demonstrations can either mean that the
state is very repressive, or that there simply isn’t anything to complain about. Demonstrations
can be targeted towards foreign countries actions (like demonstrations in Europe against the
Vietnam war) or towards their own government, or even as a hail to historical political event,
such as the first of May parade in Sweden. Bluntly put, it often measures the political activity
related to being unsatisfied with political circumstances, and increasing this type of
participation is generally not preferable. Having low voter turnouts are however more
universal as a measure of lack of democratic elements or political apathy.
It seems abundant providing research to a topic already so thoroughly researched, especially
since we are going into a study knowing that the results are likely to be inconclusive. But
from what we have observed from earlier work is that many studies has had a broad scope.
Either it is lumping positive and negative effects before conducting the research, such as
Brady 2003, or it is a study conducted on positive effects but with far too many variables: the
Solt 2008 study uses 28 control variables which inevitably ends up telling us nothing. The use
of a large number of control variables is a debated issue in political economics, the critics has
given it the quite negative sounding name “trashcan regression” or “garbage can regression”.
The method of previous studies is not the only issue we consider troubling, but the selection
as well. First of all, none of the aforementioned studies have represented democracies from
all continents. Solt, who provides the most inclusive research, studies 22 countries, all of
them except five are European states. The five non-European states are Canada, United
States, Australia, Israel and Taiwan. Thus, there is a substantial under representation of states
outside of what is considered the "western civilization". However, this is recognized by Solt
and he has suggested further research with a more inclusive dataset. This is not the only
problem of selection Solt has, he has also included states with compulsory voting laws, which
damages explanatory power of his study which he himself admits to (Solt 2008 57). Our

Olle Krönby & Nils Brandsma Economic Inequality & Voter Turnout
7
study attempts to capture the result of a larger set of states, including countries from
previously missing continents such as South America and Africa. However, it is most likely
the case that Solts selection is a matter of which data he used. Solt relies on the Luxembourg
Income Study to provide him with trustworthy data on income inequality, which in concern
to validity is a good approach since it is a more comprehensive database than the data we are
using, from the world bank.
The purpose of our study is to expand the range of countries in this type of research, as
encouraged by Solt, since he suggests it as a topic for future research in his article (Solt 2008
50). Sadly, due to the available data we can not perform a study showing the difference
among income groups, which we will discuss further later.
2. Theoretical framework
2.1 Conflict Theory (Meltzer & Richard 1981):
Conflict theory presents a classical economical rational choice-type theory to explain voter
turnout over income inequality. They assume that individuals are rational and that the income
dictates political preferences. The way that Meltzer & Richards measure political preferences
is in quite simple terms, basically arguing that the essence is being against or for
redistribution of income and resources within society. With a rational-choice type
perspective, this is simplistic but not necessarily a far-fetched assumption. They divide voters
into three groups, the middle one is called the “decisive voter” and essentially is the median
of the combined voting population, and the other two groups are above and below the
decisive voter respectively. The allocation and size of these groups (the decisive voter being
in theory just one person, but practically probably a large group of people) decide the
outcome of the election. The driving force for turning up to vote is the protecting of income
for the richer group, and for the below-median group the reason to go to vote is the possibility
of redistributing in their favor. In a more unequal society, these forces will be amplified as
there are larger potential gains or losses in play. In a more unequal society, voters with lower
incomes will gain more utility by voting for the candidate arguing for more redistribution.
Conversely, in the same society the richer voters would potentially lose more in the event of
an electoral win by the candidate favoring redistribution. Turnout should then be lower in
very equal societies, where more voters are indifferent about redistribution. (Meltzer &
Richard 1981)
Olle Krönby & Nils Brandsma Economic Inequality & Voter Turnout
8
2.2 Relative Power Theory (Goodin & Dryzek 1980):
An alternative to conflict theory is Relative power theory by Goodin and Dryzek (1980) who
argues that with wealth comes relative power. Goodin and Dryzek draws on earlier work in
social psychology where social efficacy is regarded as subjective and irrational behaviour by
individuals on deciding to participate in politics or not, meaning that depending on their
feeling of capacity in “getting the job done”. Goodin and Dryzek agrees with the basic
thought of subjective efficacy but continues to argue that worse off socio-economic
individuals relinquish participation with rationality. An example of this is that a more wealthy
individual has been rewarded by the system, therefore this particular individual attains trust to
the system and will continue to participate. This leads to a concentration of power to a certain
class of people, who can further decide the agenda of politics. To this class, it becomes more
rational to attain information which they use to form an opinion which they present at the
voting booths. On the flip side, lower socio-economic groups will have a lower probability of
winning due to the fact that their interests may not be represented. Therefore, they are less
likely to participate in the elections. The relative wealth is a deciding factor for turnout,
according to Goodin & Dryzek, as the quote below shows:
“Thus it seems that people are not indifferent to the standing of others, and do not look
exclusively to their own economic position, when deciding whether to vote” (Goodin &
Dryzek 1980 284)
Thereby, worse off citizens will lose their incentive to vote due to the relative position of
power they have compared to their neighbor. Furthermore they argue that rational choice
creates incentives to vote depending on every individuals possible utility from participating.
The higher probability of being successful, the more rational it is for individuals to acquire
information and participate in politics. Another important aspect of this theory is that due to
political power being concentrated, the issues on the political agenda are fewer and more
specific, which should lower voter turnout for high income individuals as well, since politics
will appear to be less meaningful. In conclusion, Goodin and Dryzek argues that with greater
socio-economic inequality, political participation declines, mostly for low income groups, but
also to a lesser extent for high income groups. (Goodin & Dryzek 1980)

Olle Krönby & Nils Brandsma Economic Inequality & Voter Turnout
9
2.3 Resource Theory (Verba, Schlozman & Brady 1995)
Resource theory measures political activity as a result of three resources; civic skills, money
and free time. Civic skills include language proficiency, educational attainment, participation
in higher school governments and activity in adult institutions such as the job, church or
another organization. Resource theory suggests three answers to the question of why people
do not vote: because nobody asked them to, because they don't care, and finally because they
can't. The theory proceeds to research the latter variable, and identifies three factors of
resources to be an essential part of why citizens are unable to vote: time, money and civic
skills. They distinguish between three types of political activity, voting, making campaign
contributions and engaging in time consuming political activity, such as campaigning or
attending meetings. This paper has made the conscious decision to only focus on electoral
participation in the voting booths, so we will mainly focus on the findings related to that.
However, a brief comment on the other two will be made. Verba et al. find that the main
reason to donate money to a campaign is having money, whereas time, civic skills and
political interest only has a marginal effect. For time consuming activities, political interest,
having free time and civic skills are both important factors, but income is not. For voting
however, their findings suggest that political interest is the most important indicator for
turnout, followed by the significant variable of having free time. Education, they find, has
been overestimated in previous work as an indicator for voting, but they still conclude that
education is an important explanatory variable in determining political interest, along with
past participation in high school government and having a good vocabulary (Verba,
Schlozman & Brady 1995 p.283). Income has little impact on voting according to this theory.
Worth noting about this study is that it is a research entirely conducted in the United States of
America, and the correlation between attaining education and having money is high relative
to other states, most likely due to the high cost of private education (OECD 2014). In states
with a lower entry cost of education might have a different correlation. Another point stated
in the Verba et al paper is that family income and civic skills are important determinants to
political interest across a multitude of tested models, that included a multitude of variables
and testing. In no case could the importance of these two variables be evaporated from having
a significant effect on political interest (Verba, Schlozman & Brady 1995 282).

Olle Krönby & Nils Brandsma Economic Inequality & Voter Turnout
10
2.4 Summary of theories
Our three theories expect different outcomes, conflict theory expects inequality to be
positively correlated with turnout, as it creates more incentives for the poor population to
vote for redistributive policies and for the richer population to vote against such policies
(Melzter & Richards 1981). Relative power theory expects the opposite, that with
concentration of wealth, power is also concentrated to a certain socio-economic class. This
leads to political apathy among the poorer citizens and decreases their incentives to vote.
Consequently, the concentration of power will lead to less impactful politics, and therefore
even people with higher incomes will vote less (Goodin & Dryzek 1980). Resource theory is
less certain of which direction voting turnout will go in as a result of increased inequality.
They argue that people vote as a result of three resources, money, free time and civic skills.
When identifying where these resources are concentrated they conclude that high socio-
economic individuals has more money and civic skills, but free time might go either way.
There is a possibility that their high paying job demands a lot of time, and long hours leaves
less free time. However, the opposite can also be true for low paying jobs, such as nursing or
having several jobs. The variables of money and civic skills should however, according to
Verba et al, effect turnout in different ways for different income groups, where high socio-
economic individuals are more likely to vote, and low income individuals are less likely to
vote (Verba, Schlozman & Brady 1995).
Our expectation is that economic inequality will have a negative relationship with voting
participation. However, in our final models we won't be able to tell if this difference is mainly
among lower socio-economic groups or for the entire population. This will provide a
difficulty in determining whether the resource theory or the relative power theory is the more
correct theory, if inequality proves to be negatively correlated with turnout.
4. Data & Method
Instead of hand picking countries as subjects of study, we have used the freedom house
database to exclude non-democratic, excessively corrupt or non-functioning states.
Furthermore we are excluding states who employ any kind of compulsory voting laws. Even
though compulsory voting systems have been proven successful in increasing voter turnout
(Blais 2006), compulsory voting is not of interest since this study is aimed to find a

Olle Krönby & Nils Brandsma Economic Inequality & Voter Turnout
11
correlation between factors without legislation forcing the participation to increase. The data
analyzed is collected from three reputable sources:
● The World Bank
● International Institute for Democracy and Electoral Assistance (IDEA)
● United Nations Development Programme, Human Development Reports (UNDP,
HDR)
The data for freedom house scores is included in the IDEA dataset and provides the score at
the time of the relevant election, which enables us to use it in a more effective manner than
using the scores from the latest edition of the freedom house datasets.
Before describing our method more in depth, a few clarifications and explanations should be
done. Firstly, we have performed separate regressions depending on electoral system,
presidential or parliamentary. Since we are running panel data regressions, it is important not
to have repeated time variables within the data. From our perspective, we could see two
options. Either run two separate regressions for each system, or give them two panel data IDs
for each system and run them together. Either option has it’s pros and cons. The latter
approach, dividing the countries examined with unique panel IDs for each type of election
has the risk of having repeated data for some years. This can occur when countries which has
both parliamentary and presidential elections (which is most presidential systems) have their
elections for president and parliament the same year. This essentially means that the value for
GINI, population and education is repeated for that year but with two potentially different
values for voting turnout, which would give us biased results. Separating the regression
models effectively solves this problem, as no country in our data has had either a
parliamentary or a presidential election twice in one year. Using this method would also
result in more complexly presented data, as the grouping system would be both country and
electoral system to create one group variable, rendering the number of entities to be 177,
which is a confusing number given the fact that we only examine 115 countries. The
drawback of performing regressions on the separated data is that the chapter regarding results
will be quite model heavy. This last point is only amplified by another methodological
choice, that we are examining two dependent variables. The first one is self explanatory,
voting turnout. It is based on officially reported statistics and is the total amount of votes over
the amount of people registered to vote.

Olle Krönby & Nils Brandsma Economic Inequality & Voter Turnout
12
𝑇𝑜𝑡𝑎𝑙 𝑉𝑜𝑡𝑒𝑠𝑅𝑒𝑔𝑖𝑠𝑡𝑒𝑟𝑒𝑑 𝑉𝑜𝑡𝑒𝑟 = 𝑌1!"#$% !"#$%"&
At first glance, this seems like a perfectly decent measure of electoral participation, but the
problem is that it does not consider the people not registered to vote, which intuitively is a
choice made by the most disenfranchised individuals among the voting age population.
International IDEA provides us with a remedy to this; they have made an estimate of how
many voted among the total voting age population, i.e. anyone over the minimum voting age.
𝑇𝑜𝑡𝑎𝑙 𝑉𝑜𝑡𝑒𝑠𝑉𝑜𝑡𝑖𝑛𝑔 𝐴𝑔𝑒 𝑃𝑜𝑝𝑢𝑙𝑎𝑡𝑖𝑜𝑛 = 𝑌2!"#$%& !"# !"#$%&'(") !"#$%"&
This leaves us with three options: either we look at only the officially reported number, which
would result in a potentially less accurate depiction of reality, we look at only the voting age
population or we look at both. In the best of worlds, the voting age population estimates
would be accurate enough to be the only measurement we needed, but sadly we do not live in
such a world. Later, in the chapter where the data is described you may notice why and it will
be explained further there. The short version is that the data has it’s flaws, leaving us with
results that go beyond 100% turnout in a few cases, in other cases the amount of registered
voters is larger than there are people in the voting age population. The third option is to
analyze them both separately, which is what we have chosen to do given these explained
issues.
Random Effect Models:
Equation 1
𝑌1!"#$% !"!"#$% = 𝛼 + 𝛽𝑋1𝐺𝐼𝑁𝐼 + 𝛽𝑋2𝑙𝑛( 𝐺𝐷𝑃
𝐶𝑎𝑝𝑖𝑡𝑎,𝑃𝑃𝑃) + 𝛽𝑋3𝑙𝑛(𝑃𝑜𝑝𝑢𝑙𝑎𝑡𝑖𝑜𝑛) + 𝛽𝑋4𝐹𝑟𝑒𝑒𝑑𝑜𝑚 𝐻𝑜𝑢𝑠𝑒 + 𝛽𝑋5𝐸𝑑𝑢𝑐𝑎𝑡𝑖𝑜𝑛 + (𝜐𝑖𝑡 + 𝑇𝑖 + 𝜀)
Equation 2
𝑌2!"# !"#$%"& = 𝛼 + 𝛽𝑋1𝐺𝐼𝑁𝐼 + 𝛽𝑋2𝑙𝑛(
𝐺𝐷𝑃𝐶𝑎𝑝𝑖𝑡𝑎
,𝑃𝑃𝑃)+ 𝛽𝑋3𝑙𝑛(𝑃𝑜𝑝𝑢𝑙𝑎𝑡𝑖𝑜𝑛) + 𝛽𝑋4𝐹𝑟𝑒𝑒𝑑𝑜𝑚 𝐻𝑜𝑢𝑠𝑒 + 𝛽𝑋5𝐸𝑑𝑢𝑐𝑎𝑡𝑖𝑜𝑛 + (𝜐𝑖𝑡 + 𝑇𝑖 + 𝜀)

Olle Krönby & Nils Brandsma Economic Inequality & Voter Turnout
13
Fixed Effect Models:
Equation 3
𝑌1!"#$% !"#$%"& = 𝛼 + 𝛽𝑋1𝐺𝐼𝑁𝐼 + 𝛽𝑋2𝑙𝑛( 𝐺𝐷𝑃
𝐶𝑎𝑝𝑖𝑡𝑎,𝑃𝑃𝑃) + 𝛽𝑋3𝑙𝑛(𝑃𝑜𝑝𝑢𝑙𝑎𝑡𝑖𝑜𝑛) + 𝛽𝑋4𝐹𝑟𝑒𝑒𝑑𝑜𝑚 𝐻𝑜𝑢𝑠𝑒 + 𝛽𝑋5𝐸𝑑𝑢𝑐𝑎𝑡𝑖𝑜𝑛 + 𝜐𝑖𝑡 + 𝑇𝑖 + 𝜀
Equation 4
𝑌2!"# !"#$%"& = 𝛼 + 𝛽𝑋1𝐺𝐼𝑁𝐼 + 𝛽𝑋2𝑙𝑛(
𝐺𝐷𝑃𝐶𝑎𝑝𝑖𝑡𝑎
,𝑃𝑃𝑃)+ 𝛽𝑋3𝑙𝑛(𝑃𝑜𝑝𝑢𝑙𝑎𝑡𝑖𝑜𝑛) + 𝛽𝑋4𝐹𝑟𝑒𝑒𝑑𝑜𝑚 𝐻𝑜𝑢𝑠𝑒 + 𝛽𝑋5𝐸𝑑𝑢𝑐𝑎𝑡𝑖𝑜𝑛 + 𝜐𝑖𝑡 + 𝑇𝑖 + 𝜀
VAP=Voting age population, α=Intercept, β=Coefficient, υit=Fixed individuality term, Ti=Time, ε=error term
The models that will be analyzed are the random effect models, which are deemed more
appropriate through the Hausman test (appendix 1). In theory, we might suspect an omitted
variable bias when looking at the relation between Freedom House scores and GINI, or
perhaps education and GINI, but a few examples we know of might also offset that
assumption. The most immediate example is the case of the United States, where freedom
levels, GDP per capita and education levels are all quite high, and yet they suffer from a
higher level of inequality than other similar states located in Scandinavia.
Sources: Human Development Reports, The World Bank.
The above graph shows similarities between the Scandinavian countries and the US in
GDP/capita and Education levels, yet the difference in inequality is higher.
The Republic of Korea has also succeeded in creating economic growth, enjoying similarly
high levels of education, GDP per capita and freedom scores but may be considered lacking

Olle Krönby & Nils Brandsma Economic Inequality & Voter Turnout
14
in the equality department (Denney, Steven 2014). Rather than following the assumption that
inequality is reduced by market powers as a result of economic growth, high levels of civil
and political rights and having a highly educated population, we could attribute the
differences to political and social culture. States in Scandinavia has achieved lower inequality
through the means of active government participation, such as progressive taxes, and Japan is
an example of how social culture has worked to prevent high inequality levels (The
Economist 2015). Then again, these are just a handful of states across our dataset, and we
should be careful before assuming that this is all true for the rest of the world. One option
would be to try to capture these individualities within a fixed effect regression, but finding
the necessary data across the world for political and social culture around economic
inequality will prove to be most difficult. The variable that comes closest to capturing these
differences may be our variable for freedom house scores, but since it’s entirely possible to
have political rights and civil liberties without the government pursuing active measures to
redistribute income it is far from capturing all of these effects.
The intuition in this case, is unable to provide us with clear answers, and because of this fact
we have chosen to let the Hausman test decide for us which model should be used. For the
data we are using in this study, the Hausman test does not observe significant bias among the
independent and control variables and therefore the analysis will be performed with the
random effects regression method. However, since the intuition is divided on the issue, we
have chosen to include the results of the fixed effect models in the appendix.
We have also chosen to analyze the population and GDP per capita variables log-transformed
with the natural base e. This is because these variables in their normal state matter differently
across the countries observed. An increase with a thousand people in India has different
implications than an increase by the same amount in Finland. However, if they increase their
population by 1% then that has more similar implications for both, because their institutions
are relatively adapted to their current population. Growth in GDP also makes more sense to
analyze in terms of percent increase or decrease, for a few reasons. The main reason is similar
to the one stated about population, that we are analyzing economies that has different sizes,
and one units increase in GDP matters differently for different economies, whereas a
percentage increase accounts for size in a more adequate manner. The second reason is
because when discussing GDP in general, we usually discuss it in terms of percentage change
and not with absolute numbers.

Olle Krönby & Nils Brandsma Economic Inequality & Voter Turnout
15
4.1 Variables
Voter Turnout
This variable is gathered from the International Institute for democracy and electoral
assistance (IDEA) and consists of officially published voting results, measured by percentage
of votes from registered voters.
Voting age population turnout (VAP)
This second turnout variable measures the turnout of the entire population above the age of
voting. The variable above measures the turnout based on the registered voters. Our research
attempts to measure voter apathy and disenfranchisement based on income inequality, and
not registering to vote should be regarded as non-participation as much as not turning up to
the voting booths. There is a reason we chose to have both voting age population and regular
voter participation, which is because this measure also has its downsides. One problem is that
this measure does not take into account that people might have legal barriers to registering
their vote, and that there are potential problems with the actual data since it is merely an
estimate by IDEA. Measured in percentage points.
GINI-index
The variable GINI refers to the statistical measure of dispersion of income in a nation. This
means that the variable measures income inequality. The GINI coefficient is usually a
number between zero and one, where one is the maximum inequality. Our data uses the
equivalent conversion of numbers between 0 and 100, so instead of a value of 0,47 the
number would be 47. Using the GINI index as our measure for inequality puts us in the
position of having to defend the measure system. The GINI has been criticized for a number
of reasons, and alternative measures have been proposed. The Luxemburg income study is an
alternative index for measuring inequality, which is used by cited professor Frederick Solt,
who we criticized for using too few countries and mostly western ones at that. The problem
however, is not his ambitions, but the data he was using. The Luxemburg income study is a
great database for wealth and income of countries, done through extensive use of different
surveys to produce trustworthy data. The thoroughness of the LIS data is a good thing for
validity, but this data takes time to produce, and since we aim to provide data on more
countries than the LIS can provide we have unfortunately not been able to use this database.
Olle Krönby & Nils Brandsma Economic Inequality & Voter Turnout
16
It should be noted that the LIS bases it’s inequality measure on the GINI coefficient still.
Another alternative is using the Palma index, which calculates inequality a different way than
the GINI, and according to some it provides more telling results. There is a problem here in
that it is a relatively new index, and is ill suited for pre-2015 studies. Using the Palma would
exclude almost all of our available data on turnout results; hence we have chosen to perform
this study with the GINI index. (Cobham 2013)
Gross Domestic Product per capita with Purchasing Power Parity
The variable for GDP per capita with respect to Purchasing Power Parity is measuring the
general wealth of the countries examined. Using the addition of per capita and purchasing
power parity is because this more accurately describes the available resources. We are
interested in the wealth of individuals in the state, and their political behavior, not in the
wealth of a country.
Population
Size of population, gathered from IDEA. There are a few different reasons to include a
measure of population, but the main one is that we want to control for it because it might
have an impact in the sense that a higher population may lead to a lower turnout since each
individual vote matters less, as suggested by Geys (2006 642). There are a few other
population type variables that relates to socio-economic factor we could use, such as the level
of urbanization, rate of population growth or population density that could control for similar
things. The argument for a simple population size is that it this study aims to understand what
makes people vote or not, not what they intend to vote for. Urbanization and population
density might be variables more affecting a left-right decision rather than a vote-abstain
decision, whereas the individual votes carries equal weight in most states. Of course, there
are differences across our countries as well, the most accessible example being the difference
in voting power between American states (FairVote 2016). Population density would also be
an interesting variable, as higher density should in theory lower the cost of gathering
information about options, and therefore increasing turnout. (Geys 2006 642-644).
Education
The variable education refers to mean years of education for men and women aged 25 and
above. The data is collected from the World Bank, and is more incomplete than the rest of the
variables observed, except for GINI. We have chosen to run the variable last in each
regression, to ensure our first four models have the maximum amount of observation.

Olle Krönby & Nils Brandsma Economic Inequality & Voter Turnout
17
Freedom house
Data from international organization Freedom House and their reports on civil and political
liberties. Score ranges between 1 and 5 where the former is the most free and the latter the
least free.
5. Analysis
In this chapter we will firstly present our regression analyses starting with the bivariate model
and then advancing to several multivariate models. After the presentation of the regressions
we will analyse and describe the result to distinguish whether or not we can answer our
research question.
5.1 Summary of Variables N: observations counting each country+year as one n: Number of groups (countries) T: time variable, elections. Period of analysis is 2000-2013 Description 1: Panel data: presidential
Panel variable N n T Min T Max T Median T
Country + year 160 62 13 1 4 3
Variable N n Mean Min Max Std.deviation
Voter Turnout (%)
158 62 64.05 22.36 95.7 14.12
Voting age population turnout (%)
159 62 60.21 18.93 97.85 14.36
GINI 67 36 36.27 8.1 61 9.88
GDP/capita PPP 156 61 10450 530 51433 11644
Education 110 59 7.4 1.3 12.3 3.2
Population 160 62 24,7 (million) 19092 313 (million) 52.6 (million)
Freedom House 160 62 2.6 1 5 1.2

Olle Krönby & Nils Brandsma Economic Inequality & Voter Turnout
18
Description 2: Panel data: parliamentary
Panel variable N n T Min T Max T Median T
Country + year 371 115 13 1 7 3
Variable N n Mean Min Max Std.deviation
Voter Turnout (%)
351 115 65.03 22.77 95.7 13.57
Voting age population turnout (%)
351 114 62.10 12.7 107.56* 17.42
GINI 132 62 35.61 23.7 61 8.28
GDP/capita PPP 356 111 16148 530 88250 16156
Education 241 110 8.6 1.3 12.9 3
Population
371 115 28.8 (million) 10267 1.16 (billion) 93.9 (million)
Freedom House 371 115 2.1 1 5 1.2
The 107% VAP turnout makes our methodological choices more clear, since the estimate is a
more accurate description of reality for countries that require registration before voting. This
might increase the cost of voting, depending on the process for registering to vote. The voter
turnout variable is also only based on amount of voters among those who registered, which in
some cases can be very different from what is actually the number of people eligible to vote.
This is however, still an estimate, and it has more errors than the official statistics. Therefore,
we have chosen both variables for analysis. The second thing that is important to point out is the lack of observations for GINI, which
decreases the amount of observations we eventually end up with. The findings of Geys and
Cancela (2006, 2016) report, that most inequality over turnout studies fail can most likely be * This result requires an explanation. The turnout was not 107.56% in the election, as that is impossible. IDEA explains this phenomenon with several explanations relating to actual estimation of figures but also the process of registration. IDEA firstly points out that the voting age population figures are based on estimates, which might differ from the true values (as with all estimates). Another issue springs from the fact that data used for the variable may be gathered from different sources, one for VAP, and another for registration. With the problem of estimates in mind, the different sources for data may have different estimates, which lead to discrepancies between the two measures. Secondly, the lists presented by governments or organizations may be flawed in the number of registered voters. Examples of this can be individuals listed two or more times, or that no longer eligible voters are not removed from the voting lists. (IDEA 2016)

Olle Krönby & Nils Brandsma Economic Inequality & Voter Turnout
19
traced back to this. The studies of economic inequality has been historically cursed with
obstructions such as lack of data and questionable measuring systems, as Piketty mentions in
the first chapter of The Capital in the 21st Century (Piketty, Thomas 2013). Further back in
time, even less observations for GINI is available, which in the case of adding more length to
the dataset would have caused even more missing observations and on these grounds we have
chosen to not expand the time period of analysis.
To some extent this is also true for the variable regarding education, but as the latter plays the
role of a control variable is easier to work around. As you will notice, it is included after
every other control variable in the regressions to keep the first four models observations at
the highest possible level. Since education is mentioned in all our mentioned previous
studies, as well as being a central part of the theories we have still chosen to include this
variable in our regressions.
The population data ranges between relatively small countries, such as S:t Kitts & Newis, S:t
Vincent and the Grenadines and The Federated States of Micronesia and larger ones such as
India. This might lead to an overestimation in how much population matters for turnout, since
the difference in population can be several million people in some cases. This is also a reason
why we have chosen to log-transform our population and GDP per capita variables.

Olle Krönby & Nils Brandsma Economic Inequality & Voter Turnout
20
Model 1: Presidential voter turnout
Model 1 2 3 4 5
Dependent variable: Voter Turnout
Constant (Standard error)
65.56*** (7.17)
93.56*** (20.53)
97.67*** (29.58)
91.42*** (35.51).
122.14*** (43.68)
GINI -.03 (.18)
-.14 (.20)
-.16 (.16)
-.16 (.21)
-.21 (.21)
ln(GDP/capita, PPP)
-2.62 (1.83)
-2.83 (1.88)
-2.32 (2.48)
-.79 3.43
ln(Population) -.10 (1.34)
-.09 (1.34)
-2.38 (1.62)
Freedom House .66 (2.25)
1.21 (2.48)
Education -1.10 (1.09)
Country + year (Countries)
66 35
66 35
66 35
66 35
43 28
R2 within between overall
0.22 0.0005 0.01
0.22 0.0005 0.01
0.23 0.0005 0.01
0.21 0.002 0.02
0.2 0.14 0.11
Significance level codes: * - 10% level, ** - 5% level, *** - 1% level of significance. For our first model, there is little to be said since almost nothing is statistically significant.
Most likely, there are too few observations and the data is sporadic at best.

Olle Krönby & Nils Brandsma Economic Inequality & Voter Turnout
21
Model 2: Presidential voting age population turnout
Model 1 2 3 4 5
Dependent variable: Voting Age Population Turnout
Constant (Standard error)
68.26*** (6.21)
79.00*** (17.94)
120.73*** (24.77)
100.67*** (29.21).
93.09** (41.73)
GINI -.15 (.16)
-.18 (.17)
-.15 (.21)
-.17 (.16)
-.17 (.19)
ln(GDP/capita, PPP)
-1.03 (1.63)
-1.14 (1.57)
.49 (2.05)
2.62 (3.31)
ln(Population) -2.63** (1.11)
-2.61** (1.09)
-3.03** (1.53)
Freedom House 2.14 (1.84)
3.03 (2.35)
Education -.90 (1.05)
Country + year (Countries)
67 36
67 36
67 36
67 36
44 29
R2 within between overall
0.04 0.001 0.03
0.09 0.0002 0.03
0.17 0.12 0.1
0.08 0.17 0.13
0.06 0.21 0.16
Significance level codes: * - 10% level, ** - 5% level, *** - 1% level of significance. In model two, the only significant relationship observed is from the Population variable.
Since nothing else but the constant is significant, there is little to be said other than that
having a large population tends to depress turnout according to our data.

Olle Krönby & Nils Brandsma Economic Inequality & Voter Turnout
22
Model 3: Parliamentary voter turnout
Model 1 2 3 4 5
Dependent variable: Voter Turnout
Constant (Standard error)
82.96*** (6.15)
103.47*** (15.39)
132.43*** (20.21)
163.34*** (22.74).
175.81*** (27.52)
GINI -.54*** (.16)
-.64*** (.17)
-.61*** (.17)
-.57*** (.16)
-.51** (.20)
ln(GDP/capita, PPP)
-1.85 (1.28)
-1.40 (1.24)
-3.96** (1.55)
-4.61** (2.34)
ln(Population) -2.15** (.94)
-2.14** (.90)
-2.56** (1.02)
Freedom House -3.82** (1.40)
-4.84** (1.67)
Education -.02 (.75)
Country + year (Countries)
130 60
130 60
130 60
130 60
98 52
R2 within between overall
0.06 0.09 0.14
0.14 0.06 0.11
0.13 0.15 0.16
0.15 0.23 0.19
0.15 0.29 0.22
Significance level codes: * - 10% level, ** - 5% level, *** - 1% level of significance. For our first model that analyzes the parliamentary election we see more of significant
relationships. First of all, in this model our variable for inequality is significant and shows a
negative correlation, and for every one unit increase on the GINI scale, voter turnout in the
official statistics is depressed by roughly 0,5-0,6 percentage units. GDP per capita,
Population and Freedom House scores all display a negative significant relation with voter
turnout, which will be subject to further analysis in the results chapter. Our explanatory
power measured in R-squared is 22%, which in the case of voter turnout is not necessarily
bad. Turnout is dependent on a lot of variables, some very specific to the country or time of
election. Some countries has election day as a public holiday to make sure voting does not
mean losing income from work, other do not. There is simply no model big enough to
account for all these specific laws and practices that affect turnout. In these circumstances,
22% explanatory power should not be considered a bad result.

Olle Krönby & Nils Brandsma Economic Inequality & Voter Turnout
23
Model 4 : Parliamentary voting age population turnout
Model 1 2 3 4 5
Dependent variable: Voting Age Population Turnout
Constant (Standard error)
81.84*** (6.08)
73.23*** (15.33)
117.36*** (19.73)
141.37*** (23.04).
153.26*** (26.75)
GINI -.59*** (.16)
-.56*** (.17)
-.55*** (.16)
-.53*** (.16)
-.37** (.18)
ln(GDP/capita, PPP)
.79 (1.29)
1.20 (1.13)
-.81 (1.60)
-2.65 (2.29)
ln(Population) -3.05** (.91)
-3.02*** (.88)
-3.31*** (.97)
Freedom House -2.83** (1.44)
-3.64** (1.62)
Education .76 (.73)
Country + year (Countries)
130 61
130 61
130 61
130 61
98 53
R2 within between overall
0.02 0.15 0.17
0.01 0.17 0.18
0.02 0.32 0.25
0.04 0.36 0.25
0.05 0.35 0.24
Significance level codes: * - 10% level, ** - 5% level, *** - 1% level. Similarly to the model for voting turnout in parliamentary systems, the above model for the
voting age population turnout displays similar characteristics. Perhaps surprisingly, inequality
matters less in all five models in the VAP model than for the model examining official
statistics. This may indicate a few different things. First of all, it could mean that registration
does not increase the the cost of voting. However, since this is in contrast to studies made on
the subject, this is most likely not the case (Rosenstone & Wolfinger 1978). It could also be a
result of turnout being lower overall, and the control variables account for less of a
difference. When measuring voting age population turnout, GDP per capita is no longer
statistically significant, in any of the models. Having a high population still has a negative
effect on voter turnout, and having less political and civil freedoms measured by the freedom

Olle Krönby & Nils Brandsma Economic Inequality & Voter Turnout
24
house index also show a negative correlation. The R-squared values tell us that we can in this
model approximately account for 24% of the effect on turnout.
6. Results
The models 1 & 2 on presidential elections show insignificant results most likely because of
lack in the data. Hence this thesis will continue to focus on models 3 & 4 for parliamentary
elections where we find significant and effectful results. The following chapter will present
the result of the analysis with regard to the earlier stated research question and theory. To
recap, the research question that will be answered in this thesis is as follows:
To what extent does economic inequality affect the civil participation of voters in national
elections?
In models 3 & 4 we find that a one-unit change in the GINI index results in an approximate
decrease in voter turnout by 0.4 to 0.6 percentage points. As seen in the models, the
explanatory power of the regressions increases with the adding of more control variables
except for education. The insignificant result of education can be explained by the drop in
observations when the variable is added; therefore the quality and R2 value of the whole
model decreases. The variable for population size seems to be negatively related to turnout,
which indicates that the idea presented by Geys (2006), that with a higher population the
relative power of the vote decreases, may be true. It could however also be a result of the
inclusion of micro states, as discussed earlier.
In the theory chapter we presented three different views on economic inequality and the
effect on turnout. Firstly, there was Conflict Theory, which argues that in more unequal
societies individuals with lower income will have a higher utility of voting, and thus the
theory predicts turnout to be higher in more unequal nations (Meltzer & Richards 1981).
Secondly, we discussed Relative Power Theory by Goodin & Dryzek (1980), which predicts
that in a more economically unequal society, people will lose their incentive to vote due to
lower relative power and therefore a higher GINI score would decrease turnout. Thirdly, we
had the Resource Theory by Verba, Schlozman & Brady (1995) who argue that political
participation depends on three resources: civic skills, money and free time. The theory finds
three forms of political participation but for the purpose of this study we focus on actual
voting, which is argued not to be affected by income.

Olle Krönby & Nils Brandsma Economic Inequality & Voter Turnout
25
Out of these three theories, only Relative Power Theory by Goodin & Dryzek (1980) is able
to relate to the findings in the models of this paper. Since the variable for GINI (a higher
GINI indicates a more economically unequal society/nation) has a negative relationship with
turnout and voting age population turnout, this paper supports this theory. But this is not to be
mistaken for a causal relationship since turnout is affected by multiple more variables than
the ones included in this paper. Conflict Theory is the only theory fully rejected, because the
relationship seen in every model contradicts the theory of higher inequality leading to higher
voting participation. As for Resource Theory, the variable included in our paper that would
give an indication of this theory being supported is education as a part of its resources that
affect political interest. But the variable for education is not statistically significant and
therefore inconclusive. Unanswered is the question of who deters from voting, whether it is
the richer or poorer population of a nation. But as GINI increases, the resources of a country
are concentrated to a smaller portion of its citizens and thus the number of richer individuals
is smaller. As a result, when the GINI-score is high, the population deterring from voting
should be the ones with less income.
There is a possible point of concern given that we only find significant results for the
parliamentary models, namely that the presidential election may have a larger force of voter
attraction in systems that employ voting for both parliament and president. This could lead to
an overestimation of the effect on voter turnout. However, in theory this election should be as
important to people as the elections for president, and a result showing lower turnout could
still be a result of low access to information or political interest, possibly because of voter
disenfranchisement and economic inequality.
7. Conclusions
Our findings reflect mainly those of Solt (2008) in that inequality is negatively related to
voter turnout. Since this study separates itself from the previous work in the sense that it
includes countries previously excluded from inequality versus political participation, so the
difference in results from earlier work is of interest. Since the Solt study is the most similar in
terms of results to ours the difference here is interesting.
We can conclude that the theory that seems to be most related to our findings is the relative
power theory. We have in this study not made any regressions for different income
Olle Krönby & Nils Brandsma Economic Inequality & Voter Turnout
26
percentiles, where we measure the difference among different income groups for each
country. Neither have we controlled for measures of free time and civic skills, other than
education. Were such data available for our sample, we would have gladly ventured in that
direction, to more clearly distinguish which of relative power and resource theory is more
applicable.
One point of criticism towards the paper, which to some extent can be applied to many other
turnout-studies, is the aspect of a low explanatory capacity. This can be seen throughout all
models of this paper where R2 is closer to zero rather than one. The support that we find in
favour of Solts’ arguing and the relative power theory of lower turnout in more economically
unequal societies is of importance and statistically significant, however the results are only
partially explanatory to voter turnout and there are many more variables that affect turnout
than those included in the models of this paper. But essentially this papers research question
is not what affects voter turnout, it is rather how economic inequality pushes turnout in a
certain direction of increasing or decreasing. Thus, the paper has the capacity of answering
the research question even though its given low values for R2. The result of achieving a
higher value for R in this study would consist of adding more variables to the models, by
doing so the models would have a better explanatory power but would not benefit the
capacity of answering our research question.
For a final conclusion, this study has observed that for parliamentary elections, economic
inequality has a negative effect of participation in democracies.
8. Topics for future research There is still much to be found in the future regarding the effect of inequality over turnout.
First of all, the future looks promising in terms of providing trustworthy and accurate data on
inequality, both with datasets such as the Luxemburg Income Study, and new measuring
systems such as the Palma index.
Future research is encouraged with the same research question and intuition as this but with a
shifted focus of size and geography. Of interest would be similar studies with more detail but
with smaller focus of specific continents or groups of nations, perhaps not with the focus on
western societies to illuminate the difference. The wide focus of this paper allows for a more

Olle Krönby & Nils Brandsma Economic Inequality & Voter Turnout
27
representative study of the whole world compared to earlier research, but in light of
differentiation in demography, culture, political institutions et cetera, the results may differ
among parts of the world.

Olle Krönby & Nils Brandsma Economic Inequality & Voter Turnout
28
References Pew Research Center (2016) “U.S. voter turnout trails most developed countries” Gathered
from:
http://www.pewresearch.org/fact-tank/2016/08/02/u-s-voter-turnout-trails-most-developed-
countries/ 2016-12-18
Bartels, Larry M. (2009) “Economic Inequality and Political Representation” In Jacobs,
Lawrence and King, Desmond “The Unsustainable American State” New York: Oxford
University Press.
Dahl, Robert A. 1961. “Who Governs? Democracy and Power in an American City.” New
Haven, CT: Yale University Press.
Brady, Henry (2003) “An Analytical Perspective on Participatory Inequality and Income
Inequality” University of California, Berkeley
Geys, Benny (2006) “Explaining voter turnout: A review of aggregate-level research”
Electoral Studies 25 2006 Elsevier Ltd
Solt, Frederick (2008) “Economic Inequality and Democratic Political Engagement”
American Journal of Political Science, Vol. 52, No. 1, January 2008 The University of
Chicago Press
Cancela, Joao & Geys, Benny (2016) Explaining voter turnout: A meta-analysis of national
and subnational elections Electoral Studies 42 2016 Elsevier Ltd
Meltzer, Allan H. & Richards, Scott F. (1981) “A Rational Theory of the Size of
Government” Journal of Political Economy, Vol. 89, No. 5 October 1981 Cambridge
University Press
Goodin, Robert & Dryzek, John “Rational Participation: The Politics of Relative Power”
British Journal of Political Science, Vol. 10, No. 3 (Jul., 1980). Cambridge University Press
Verba, Sidney, Schlozman, Kay Lehman & Brady, Henry E.(1995) “Beyond Ses: A Resource
Model of Political Participation” The American Political Science Review, Vol. 89, No. 2
June, 1995. American Political Science Association

Olle Krönby & Nils Brandsma Economic Inequality & Voter Turnout
29
OECD (2014) “Education at glance 2014” OECD Indicators
http://www.oecd.org/edu/Education-at-a-Glance-2014.pdf
Blais, André (2006) “What affects voter turnout?” Annual Review of Political Science volume
9
Denney, Steven (2014) “Piketty in Seoul: Rising Income Inequality in South Korea” The
Diplomat. Gathered from: http://thediplomat.com/2014/11/south-koreas-shocking-inequality/
2017-01-28
The Economist (2015) “Inequality in Japan. The secure v the poor” Printed edition 2015-02-
12. Gathered from: http://www.economist.com/news/finance-and-economics/21643202-
problem-not-super-rich-secure-v-poor (2017-01-28)
International Institute for Democracy and Electoral Assistance [IDEA] (2016) Gathered from:
http://www.idea.int/data-tools/data/voter-turnout 2016-08-29
The World Bank (2016) “GINI index (World Bank estimate)” Gathered from:
http://data.worldbank.org/indicator/SI.POV.GINI 2016-08-29
Piketty, Thomas (2014). “Capital in the 21st Century.” Harvard University Press
Rosenstone, Steven & Wolfinger, Raymond (1978) “The Effect of Registration Laws on
Voter Turnout.” The American Political Science Review
Cobham, Alex (2013) “Palma vs Gini: Measuring post-2015 inequality” Center for Global
Development. Gathered from:
http://www.cgdev.org/blog/palma-vs-gini-measuring-post-2015-inequality 2016-12-11
Fairvote (2016) “Population vs. Electoral Votes”
http://www.fairvote.org/population_vs_electoral_votes
Human Development Reports (2015) “Mean years of schooling (of adults) (years)”
Gathered from:
http://hdr.undp.org/en/content/mean-years-schooling-adults-years 2016-09-13
Olle Krönby & Nils Brandsma Economic Inequality & Voter Turnout
30
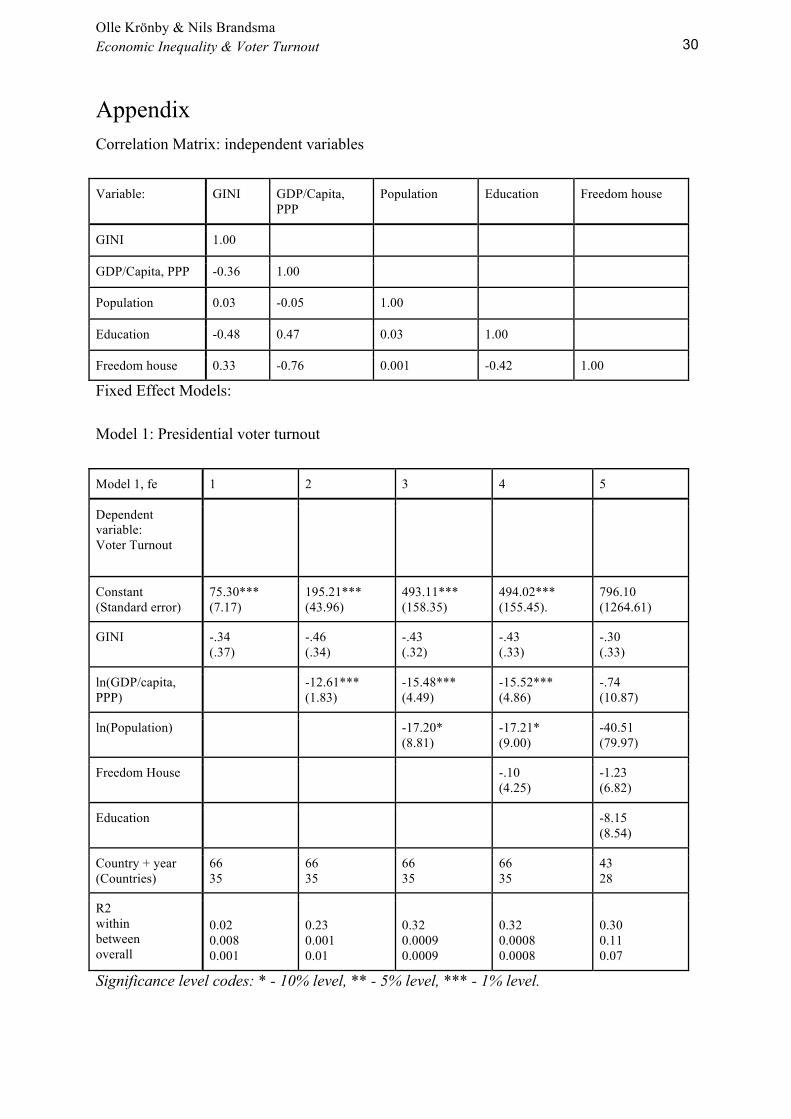
Appendix Correlation Matrix: independent variables
Variable: GINI GDP/Capita, PPP
Population Education Freedom house
GINI 1.00
GDP/Capita, PPP -0.36 1.00
Population 0.03 -0.05 1.00
Education -0.48 0.47 0.03 1.00
Freedom house 0.33 -0.76 0.001 -0.42 1.00
Fixed Effect Models:
Model 1: Presidential voter turnout
Model 1, fe 1 2 3 4 5
Dependent variable: Voter Turnout
Constant (Standard error)
75.30*** (7.17)
195.21*** (43.96)
493.11*** (158.35)
494.02*** (155.45).
796.10 (1264.61)
GINI -.34 (.37)
-.46 (.34)
-.43 (.32)
-.43 (.33)
-.30 (.33)
ln(GDP/capita, PPP)
-12.61*** (1.83)
-15.48*** (4.49)
-15.52*** (4.86)
-.74 (10.87)
ln(Population) -17.20* (8.81)
-17.21* (9.00)
-40.51 (79.97)
Freedom House -.10 (4.25)
-1.23 (6.82)
Education -8.15 (8.54)
Country + year (Countries)
66 35
66 35
66 35
66 35
43 28
R2 within between overall
0.02 0.008 0.001
0.23 0.001 0.01
0.32 0.0009 0.0009
0.32 0.0008 0.0008
0.30 0.11 0.07
Significance level codes: * - 10% level, ** - 5% level, *** - 1% level.

Olle Krönby & Nils Brandsma Economic Inequality & Voter Turnout
31
Model 2: Presidential voting age population turnout
Model 2, fe 1 2 3 4 5
Dependent variable: Voting Age Population Turnout
Constant (Standard error)
73.96*** (11.23)
137.99*** (39.00)
428.55*** (138.15)
420.81*** (144.20).
1731.744 (1211.1)
GINI -.35 (.30)
-.41 (.30)
-.38 (.28)
-.37 (.29)
-.30 (.32)
ln(GDP/capita, PPP)
-6.73* (3.93)
-9.53** (3.92)
-9.19** (4.24)
.99 (10.43)
ln(Population) -16.79** (7.69)
-16.65** (7.85)
-101.64 (76.71)
Freedom House .89 (3.71)
.98 (6.54)
Education -7.98 (8.19)
Country + year (Countries)
67 36
67 36
67 36
67 36
44 29
R2 within between overall
0.04 0.001 0.03
0.12 0.003 0.01
0.25 0.11 0.08
0.25 0.12 0.09
0.35 0.15 0.11
Significance level codes: * - 10% level, ** - 5% level, *** - 1% level.

Olle Krönby & Nils Brandsma Economic Inequality & Voter Turnout
32
Model 3: Parliamentary voter turnout
Model 3, fe 1 2 3 4 5
Dependent variable: Voter Turnout
Constant (Standard error)
90.12*** (12.75)
178.26*** (27.24)
367.27*** (178.75)
393.01** (180.95).
222.44 (383.99)
GINI -.77** (.36)
-.91*** (.33)
-.94*** (.33)
-1.01*** (.34)
-.90* (.46)
ln(GDP/capita, PPP)
-8.87*** (2.47)
-9.19*** (2.48)
-9.85*** (2.58)
-12.90** (5.09)
ln(Population) -11.59 (10.83)
-12.38 (10.87)
-.34 (22.91)
Freedom House -2.17 (2.29)
-2.62 (3.53)
Education -.65 (3.03)
Country + year (Countries)
130 60
130 60
130 60
130 60
98 52
R2 within between overall
0.06 0.09 0.14
0.21 0.002 0.01
0.12 0.07 0.06
0.23 0.10 0.08
0.26 0.02 0.01
Significance level codes: * - 10% level, ** - 5% level, *** - 1% level.

Olle Krönby & Nils Brandsma Economic Inequality & Voter Turnout
33
Model 4 : Parliamentary voting age population turnout
Model 4, fe 1 2 3 4 5
Dependent variable: Voting Age Population Turnout
Constant (Standard error)
79.96*** (14.31)
125.47*** (31.97)
786.89*** (193.82)
811.00*** (23.04).
701.26* (382.653)
GINI -.56 (.40)
-.62 (.17)
-.74** (.37)
-.81** (.38)
-.64 (.48)
ln(GDP/capita, PPP)
-4.59 (2.89)
-5.69** (2.70)
-6.31** (1.60)
-11.56** (5.09)
ln(Population) -40.58*** (11.75)
-41.32*** (11.81)
-33.28 (22.85)
Freedom House -2.04 (2.49)
-3.88** (3.53)
Education 2.94 (3.03)
Country + year (Countries)
130 61
130 61
130 61
130 61
98 53
R2 within between overall
0.02 0.15 0.17
0.06 0.006 0.02
0.20 0.12 0.08
0.21 0.13 0.09
0.14 0.19 0.11
Significance level codes: * - 10% level, ** - 5% level, *** - 1% level.

Olle Krönby & Nils Brandsma Economic Inequality & Voter Turnout
34
Hausman test results Hausman 1: Official Voter Turnout, Presidential Variable Coefficient Fixed
Effect Coefficient Random Effect
Difference Std.error
GINI -0.30 -.21 -.09 .25
ln(GDP/capita, PPP)
-.74 -.79 .04 10.32
ln(Population) -40.515 -2.38 -38.13 79.95
Freedom House -1.23 1.2 -2.44 6.35
Education -8.15 -1.1 -7.05 8.47
Chi2: 2.63 Prob>chi2: 0.7574
Hausman 2: Voting age population turnout, Presidential Variable Coefficient Fixed
Effect Coefficient Random Effect
Difference Std.error
GINI -0.30 -.17 -.12 .25
ln(GDP/capita, PPP)
.99 2.62 -1.63 9.89
ln(Population) -101.6403 -3.03 -98.61 76.69
Freedom House .98 3.03 -2.05 6.11
Education -7.98 -.90 -7.08 8.12
Chi2: 5.06 Prob>chi2: 0.4081
Hausman 3: Official Voter Turnout, Parliamentary Variable Coefficient Fixed
Effect Coefficient Random Effect
Difference Std.error
GINI -0.9 -.51 -.38 .41
ln(GDP/capita, PPP)
-12.90 -4.61 -8.29 4.52
ln(Population) -.34 -2.56 2.21 22.89
Freedom House -2.62 -4.84 2.21 3.1
Education .65 .02 .62 2.93
Chi2: 9.93 Prob>chi2: 0.0833

Olle Krönby & Nils Brandsma Economic Inequality & Voter Turnout
35
Hausman 4: Voting age population turnout, Parliamentary Variable Coefficient Fixed
Effect Coefficient Random Effect
Difference Std.error
GINI -0.64 -.37 -.27 .44
ln(GDP/capita, PPP)
-11.56 -2.65 -8.90 4.54
ln(Population) -33.28 -3.31 -29.96 22.83
Freedom House -3.88 -3.68 -.19 3.14
Education 2.94 .76 2.17 2.94
Chi2: 5.34 Prob>chi2: 0.3756
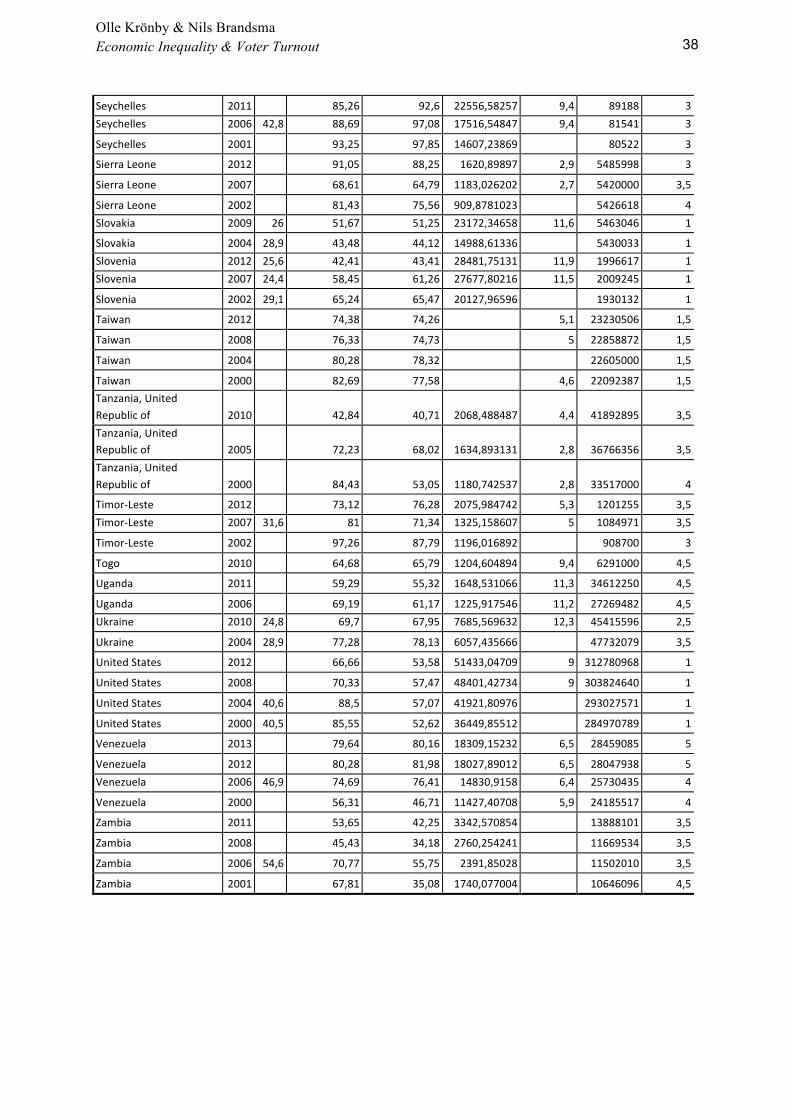
Dataset, Presidential
Country Year GINI VoterTurnout(%)
VAPTurnout(%)
GDP/capita,PPP Education Population
Freedomhouse
Armenia 2013 31,5 60,18 74,21 7734,780167 10,8 3064267 4,5 Armenia 2008 30,7 69,81 77,19 7097,912173 10,8 3229900 4,5 Armenia 2003 33 68,43 78,5 3510,316808 3339099 4 Austria 2010 30,3 53,57 47,84 41892,77585 10,8 8447901 1 Austria 2004 29,9 71,6 66,5 33800,70211 8188207 1 Benin 2011 43,4 84,82 68,39 1761,574331 3,2 9325032 2 Benin 2006 69,54 74,23 1565,55691 3 7862944 2 Benin 2001 54,17 55,35 1361,728492 6395919 2,5 BosniaandHerzegovina 2010 56,46 58,75 8941,522708 8,3 4621598 3,5 BosniaandHerzegovina 2006 50,51 39,32 7330,409433 8,6 4498976 3,5 BosniaandHerzegovina 2002 55,45 40,86 4972,278989 3964388 4 Bulgaria 2011 34,3 48,25 56,14 15603,05166 10,6 7093635 2 Bulgaria 2006 35,7 42,62 46,14 11440,90733 10,1 7385367 1,5 Bulgaria 2001 32,7 54,92 61,78 6895,369912 7932984 2 BurkinaFaso 2010 54,82 23 1393,562721 1,3 16241811 4 BurkinaFaso 2005 57,66 36,4 1096,688868 1,3 13925313 4 CapeVerde 2011 59,9 56,61 6147,974534 3,5 516197 1 CapeVerde 2006 53,1 78,59 4566,166223 3,5 475947 1 CapeVerde 2001 52,5 58,94 71,69 3091,34299 436530 1,5 Chile 2013 41,98 45,74 21443,75036 9,8 17216945 1 Colombia 2010 55,5 44,35 44,86 10680,00208 7,1 44205293 3,5 Colombia 2006 60,1 45,11 44,15 8957,336622 6,7 43593035 3 Colombia 2002 58,3 46,45 44,83 6927,320919 40349388 4 Comoros 2010 52,8 56,13 1318,895891 2,8 773407 3,5 Comoros 2006 57,26 52,14 1291,518663 2,8 690948 4 Comoros 2002 76,28 37,99 1161,508506 596202 5 Croatia 2010 27,4 50,13 65,24 18981,99564 10,8 4486881 1,5 Croatia 2005 51,04 63,44 15535,44071 9,7 4489409 2

Olle Krönby & Nils Brandsma Economic Inequality & Voter Turnout
36
Croatia 2000 31,3 60,88 74,29 11054,42108 9,4 4584831 2,5 CzechRepublic 2013 59,08 59 30043,5678 12,3 10177300 1 ElSalvador 2009 45,9 61,91 72,39 7136,595021 6,3 6030596 2,5 ElSalvador 2004 47,4 66,16 63,13 5896,016066 6470379 2,5 Finland 2012 27,1 68,86 70,91 40437,59387 10,3 5262930 1 Finland 2006 28 74,05 77,56 34502,26656 10,1 5223442 1 Finland 2000 76,8 76,81 26465,7522 8,2 5180030 1 France 2012 33,1 80,35 71,18 37462,32503 11,1 65630692 1 France 2007 31,6 83,97 76,75 34034,38518 10,7 63713926 1 France 2002 79,71 69,92 28503,56674 59551227 1 Georgia 2013 40 46,96 47,34 8543,080411 12,1 4555911 3,5 Georgia 2008 40,6 56,19 55,38 6163,757923 12,1 4646003 3 Georgia 2004 39,8 87,97 56,07 3813,189314 4934413 3,5 Georgia 2000 40,5 75,86 65,25 2590,318568 5030747 4 Ghana 2008 72,91 69,84 2754,883755 6,8 23434573 1,5 Ghana 2004 85,12 79,98 2138,098453 20757032 2 Ghana 2000 61,74 65,13 1801,414609 6,3 20212000 2,5 Guatemala 2011 52,4 60,83 61,36 6798,842734 5,3 13824463 3,5 Guatemala 2007 48,15 45,54 6280,308986 3,9 12728111 3,5 Guatemala 2003 54,1 46,78 42,3 5146,756256 13909384 4 Guinea-Bissau 2009 61,09 44,83 1258,319756 2,3 1533964 4 Guinea-Bissau 2005 87,63 66,84 1122,331789 2,3 1416027 3,5 Haiti 2011 22,36 18,93 1562,304129 4,9 9719932 4,5 Iceland 2012 26,9 69,32 68,91 40278,38704 11,3 313183 1 Iceland 2004 28,1 62,92 63,72 34949,10237 290570 1 Indonesia 2004 68,51 74,77 5655,993914 216948359 3,5 Ireland 2011 32,3 56,11 50,72 45673,5345 7,5 4670976 1 Kenya 2013 85,91 55,6 2843,773361 11,5 43013341 3,5 Kenya 2007 69,09 54,49 2306,86625 11,3 36913721 3 Kenya 2002 57,18 38,51 1761,750776 31138735 4 Kiribati 2012 68 55,33 1705,439184 6,3 101998 1 Kiribati 2007 57,08 45,24 1628,200741 6,1 95479 1 Kiribati 2003 1486,565004 89701 1 Korea,Republicof 2007 63,01 64,17 27872,08837 49044790 1,5 Korea,Republicof 2002 70,83 70,81 20784,9456 48191877 2 Kyrgyzstan 2011 27,8 61,28 52,06 2920,60321 9,3 5587443 5 Kyrgyzstan 2009 29,8 79,2 67,18 2746,102655 9,3 5431747 4,5 Kyrgyzstan 2005 38,3 74,97 65,8 2110,377936 9,2 5146281 4,5 Liberia 2011 38,6 36,31 732,6330069 3,9 3786764 3,5 Liberia 2005 61,04 59,01 530,9610917 3,4 3482211 4 Lithuania 2009 37,3 51,76 48,04 18277,91534 12,3 3555179 1 Lithuania 2004 35,2 52,46 49,24 13251,46264 3607899 2 Lithuania 2003 35,5 52,65 50,95 12315,63479 3620094 1,5 Macedonia 2009 42,63 48,35 11305,33574 8,2 2066718 3 Macedonia 2004 38,8 53,64 61,27 7216,052274 2071210 3 Madagascar 2013 50,72 35,29 1414,496628 5,2 22599098 5 Madagascar 2006 61,93 50,85 1304,444605 5,2 18595469 3,5

Olle Krönby & Nils Brandsma Economic Inequality & Voter Turnout
37
Madagascar 2001 47,4 66,85 56,42 1205,262299 15982563 3 Malawi 2009 78,28 73,93 990,2613624 4 14268711 4 Malawi 2004 39,9 63,59 58,46 737,5883978 11651239 4 Maldives 2013 91,43 83,44 11855,75046 5,8 393988 4,5 Mali 2013 45,78 41,75 2163,055483 2 15968882 2,5 Mali 2007 36,24 41,2 1364,238151 1,8 13309212 2 Mali 2002 38,57 42,44 981,2502162 11446961 2,5 Mongolia 2013 66,79 58,47 11134,04379 8,3 3226516 2 Mongolia 2009 73,59 54,98 7128,216004 8,3 3041142 2 Mongolia 2005 74,98 53,89 5384,32093 8,2 2751314 2 Mongolia 2001 82,94 67,92 3849,422652 2542308 2,5 Montenegro 2013 33,2 63,9 64,36 14623,74484 10,5 653474 2,5 Montenegro 2008 30 68,7 63,46 13919,91698 10,5 684736 3 Mozambique 2009 44,63 42,68 852,8593034 3,1 21921697 3 Mozambique 2004 36,42 35,63 600,5492643 19406703 3,5 Namibia 2009 61 67,62 7849,99947 6,1 2108665 2 Namibia 2004 85,47 80,85 6197,91768 1954033 2,5 Nicaragua 2011 43,1 79,09 71,84 4223,427239 5,8 5666301 4 Nicaragua 2006 61,23 74,16 3951,24718 5,3 5570129 3 Nicaragua 2001 74,91 75,05 2858,455737 4952226 3 Niger 2011 31,5 48,96 45,39 807,1930209 1,4 16468886 4,5 Niger 2004 44,98 43,54 659,9820675 11360538 3 Nigeria 2011 53,68 48,32 5230,598854 5,2 155215573 4 Nigeria 2007 57,49 49,85 4266,961628 5,1 131859731 4 Nigeria 2003 40,1 69,08 65,33 2638,800223 129934911 4 Palau 2012 52,76 54,86 13510,03458 12,2 21032 1 Palau 2008 67,66 67,56 12845,3008 12,2 21093 1 Palau 2004 74,79 68,55 12676,92342 20163 1 Palau 2000 81,15 81,65 10802,46843 11,4 19092 1,5 Philippines 2010 74,98 64,7 5524,15441 8,9 99900177 3,5 Philippines 2004 76,97 68,77 4012,576024 87857473 2,5 Poland 2010 33,2 55,31 54,5 20883,06044 11,7 37798299 1 Poland 2005 35,9 50,99 51,46 13806,82848 11,3 38635144 1 Poland 2000 33 61,12 62,58 10607,89924 11,1 38742748 1,5 Portugal 2011 36,3 46,52 51,87 26932,40813 8 10760305 1 Portugal 2006 8,1 61,53 66,97 23872,20178 7,3 10566212 1 Portugal 2001 50,03 57,19 18588,96494 9963604 1 Romania 2009 28,2 58,02 59,24 15815,27855 10,5 22011818 2 Romania 2004 30 55,21 58,32 8911,807882 22355551 2,5 Romania 2000 29,3 56,62 53,88 5726,307872 9,9 22303305 2 SaoTomeandPrincipe 2011 74,09 71,28 2839,895903 4,7 179591 2 SaoTomeandPrincipe 2006 64,95 69,76 2284,270557 4,3 151912 2 SaoTomeandPrincipe 2001 70,55 70,42 1733,871991 144703 1,5 Senegal 2012 57,12 44,83 2225,296028 4,5 12969606 3 Senegal 2007 70,62 55,11 2028,538474 4,2 12521851 2,5 Serbia 2012 46,26 54,1 13000,07329 9,5 7276604 2 Serbia 2008 28,2 68,12 77,61 11892,78712 9,5 7334935 2,5
Olle Krönby & Nils Brandsma Economic Inequality & Voter Turnout
38
Seychelles 2011 85,26 92,6 22556,58257 9,4 89188 3 Seychelles 2006 42,8 88,69 97,08 17516,54847 9,4 81541 3 Seychelles 2001 93,25 97,85 14607,23869 80522 3 SierraLeone 2012 91,05 88,25 1620,89897 2,9 5485998 3 SierraLeone 2007 68,61 64,79 1183,026202 2,7 5420000 3,5 SierraLeone 2002 81,43 75,56 909,8781023 5426618 4 Slovakia 2009 26 51,67 51,25 23172,34658 11,6 5463046 1 Slovakia 2004 28,9 43,48 44,12 14988,61336 5430033 1 Slovenia 2012 25,6 42,41 43,41 28481,75131 11,9 1996617 1 Slovenia 2007 24,4 58,45 61,26 27677,80216 11,5 2009245 1 Slovenia 2002 29,1 65,24 65,47 20127,96596 1930132 1 Taiwan 2012 74,38 74,26 5,1 23230506 1,5 Taiwan 2008 76,33 74,73 5 22858872 1,5 Taiwan 2004 80,28 78,32 22605000 1,5 Taiwan 2000 82,69 77,58 4,6 22092387 1,5 Tanzania,UnitedRepublicof 2010 42,84 40,71 2068,488487 4,4 41892895 3,5 Tanzania,UnitedRepublicof 2005 72,23 68,02 1634,893131 2,8 36766356 3,5 Tanzania,UnitedRepublicof 2000 84,43 53,05 1180,742537 2,8 33517000 4 Timor-Leste 2012 73,12 76,28 2075,984742 5,3 1201255 3,5 Timor-Leste 2007 31,6 81 71,34 1325,158607 5 1084971 3,5 Timor-Leste 2002 97,26 87,79 1196,016892 908700 3 Togo 2010 64,68 65,79 1204,604894 9,4 6291000 4,5 Uganda 2011 59,29 55,32 1648,531066 11,3 34612250 4,5 Uganda 2006 69,19 61,17 1225,917546 11,2 27269482 4,5 Ukraine 2010 24,8 69,7 67,95 7685,569632 12,3 45415596 2,5 Ukraine 2004 28,9 77,28 78,13 6057,435666 47732079 3,5 UnitedStates 2012 66,66 53,58 51433,04709 9 312780968 1 UnitedStates 2008 70,33 57,47 48401,42734 9 303824640 1 UnitedStates 2004 40,6 88,5 57,07 41921,80976 293027571 1 UnitedStates 2000 40,5 85,55 52,62 36449,85512 284970789 1 Venezuela 2013 79,64 80,16 18309,15232 6,5 28459085 5 Venezuela 2012 80,28 81,98 18027,89012 6,5 28047938 5 Venezuela 2006 46,9 74,69 76,41 14830,9158 6,4 25730435 4 Venezuela 2000 56,31 46,71 11427,40708 5,9 24185517 4 Zambia 2011 53,65 42,25 3342,570854 13888101 3,5 Zambia 2008 45,43 34,18 2760,254241 11669534 3,5 Zambia 2006 54,6 70,77 55,75 2391,85028 11502010 3,5 Zambia 2001 67,81 35,08 1740,077004 10646096 4,5
Olle Krönby & Nils Brandsma Economic Inequality & Voter Turnout
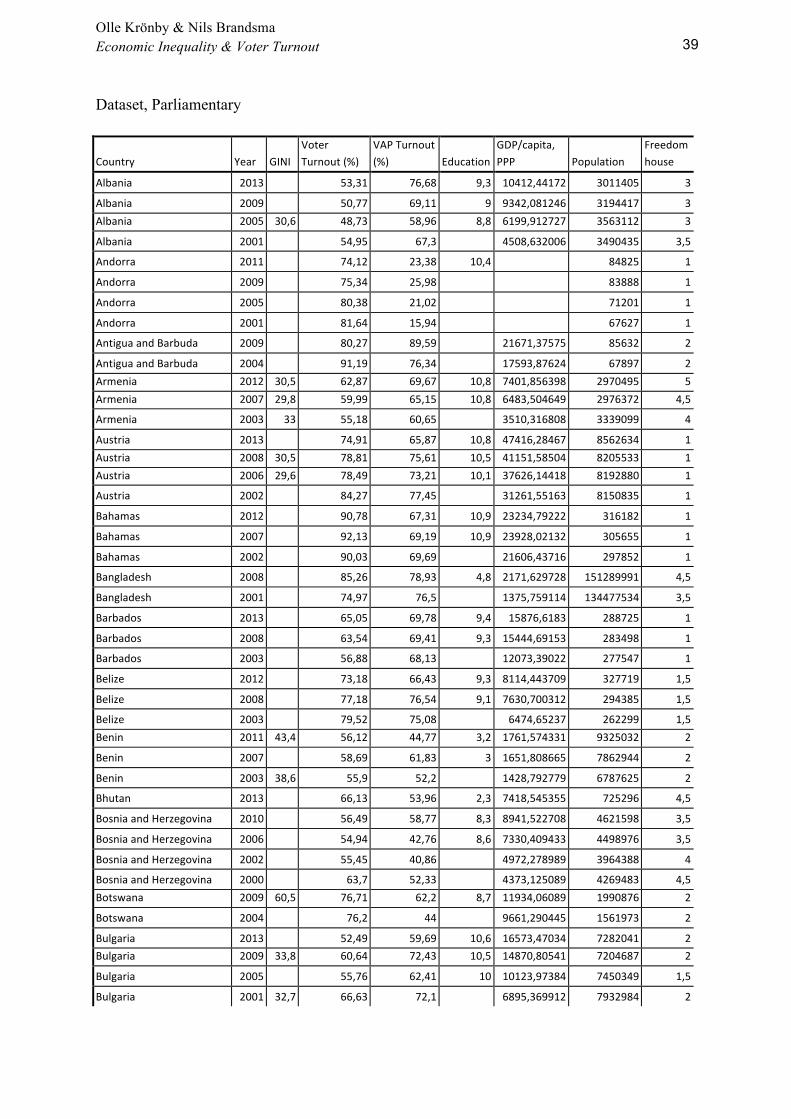
39
Dataset, Parliamentary
Country Year GINI VoterTurnout(%)
VAPTurnout(%) Education
GDP/capita,PPP Population
Freedomhouse
Albania 2013 53,31 76,68 9,3 10412,44172 3011405 3 Albania 2009 50,77 69,11 9 9342,081246 3194417 3 Albania 2005 30,6 48,73 58,96 8,8 6199,912727 3563112 3 Albania 2001 54,95 67,3 4508,632006 3490435 3,5 Andorra 2011 74,12 23,38 10,4 84825 1 Andorra 2009 75,34 25,98 83888 1 Andorra 2005 80,38 21,02 71201 1 Andorra 2001 81,64 15,94 67627 1 AntiguaandBarbuda 2009 80,27 89,59 21671,37575 85632 2 AntiguaandBarbuda 2004 91,19 76,34 17593,87624 67897 2 Armenia 2012 30,5 62,87 69,67 10,8 7401,856398 2970495 5 Armenia 2007 29,8 59,99 65,15 10,8 6483,504649 2976372 4,5 Armenia 2003 33 55,18 60,65 3510,316808 3339099 4 Austria 2013 74,91 65,87 10,8 47416,28467 8562634 1 Austria 2008 30,5 78,81 75,61 10,5 41151,58504 8205533 1 Austria 2006 29,6 78,49 73,21 10,1 37626,14418 8192880 1 Austria 2002 84,27 77,45 31261,55163 8150835 1 Bahamas 2012 90,78 67,31 10,9 23234,79222 316182 1 Bahamas 2007 92,13 69,19 10,9 23928,02132 305655 1 Bahamas 2002 90,03 69,69 21606,43716 297852 1 Bangladesh 2008 85,26 78,93 4,8 2171,629728 151289991 4,5 Bangladesh 2001 74,97 76,5 1375,759114 134477534 3,5 Barbados 2013 65,05 69,78 9,4 15876,6183 288725 1 Barbados 2008 63,54 69,41 9,3 15444,69153 283498 1 Barbados 2003 56,88 68,13 12073,39022 277547 1 Belize 2012 73,18 66,43 9,3 8114,443709 327719 1,5 Belize 2008 77,18 76,54 9,1 7630,700312 294385 1,5 Belize 2003 79,52 75,08 6474,65237 262299 1,5 Benin 2011 43,4 56,12 44,77 3,2 1761,574331 9325032 2 Benin 2007 58,69 61,83 3 1651,808665 7862944 2 Benin 2003 38,6 55,9 52,2 1428,792779 6787625 2 Bhutan 2013 66,13 53,96 2,3 7418,545355 725296 4,5 BosniaandHerzegovina 2010 56,49 58,77 8,3 8941,522708 4621598 3,5 BosniaandHerzegovina 2006 54,94 42,76 8,6 7330,409433 4498976 3,5 BosniaandHerzegovina 2002 55,45 40,86 4972,278989 3964388 4 BosniaandHerzegovina 2000 63,7 52,33 4373,125089 4269483 4,5 Botswana 2009 60,5 76,71 62,2 8,7 11934,06089 1990876 2 Botswana 2004 76,2 44 9661,290445 1561973 2 Bulgaria 2013 52,49 59,69 10,6 16573,47034 7282041 2 Bulgaria 2009 33,8 60,64 72,43 10,5 14870,80541 7204687 2 Bulgaria 2005 55,76 62,41 10 10123,97384 7450349 1,5 Bulgaria 2001 32,7 66,63 72,1 6895,369912 7932984 2

Olle Krönby & Nils Brandsma Economic Inequality & Voter Turnout
40
BurkinaFaso 2012 75,96 39,67 1,3 1547,649372 17275115 4 BurkinaFaso 2007 56,43 37,93 1,3 1225,850888 15264735 4 BurkinaFaso 2002 64,14 33,47 904,6273875 12272289 4 Canada 2011 61,11 54,16 12,3 41565,27122 34030589 1 Canada 2008 59,52 53,59 12,3 40277,61931 33212696 1 Canada 2006 64,67 58,75 12,3 37956,81425 32805041 1 Canada 2004 33,9 60,91 55,28 33752,21339 32207113 1 Canada 2000 33,7 61,18 54,64 11,1 29187,51875 31213580 1 CapeVerde 2011 76,01 86,18 3,5 6147,974534 516100 1 CapeVerde 2006 54,18 79,98 3,5 4566,166223 475947 1 CapeVerde 2001 52,5 54,14 65,85 3091,34299 436530 1,5 Chile 2013 49,25 53,66 9,8 21443,75036 17216945 1 Colombia 2010 55,5 43,75 44,07 7,1 10680,00208 44205293 3,5 Colombia 2006 60,1 40,49 39,42 6,7 8957,336622 43593035 3 Colombia 2002 58,3 42,45 40,62 6927,320919 40349388 4 Comoros 2009 2,8 1306,440009 752438 3,5 Comoros 2004 55,9 1207,055047 671247 4 Croatia 2011 32 54,17 66,09 11 20571,27528 4483804 1,5 Croatia 2007 59,58 70,84 10,1 18921,62474 4493312 2 Croatia 2003 61,65 71,96 13644,6132 4422248 2 Croatia 2000 31,3 76,55 80,95 9,4 11054,42108 4584831 2,5 CzechRepublic 2013 59,48 60,03 12,3 30043,5678 10162921 1 CzechRepublic 2010 26,6 62,6 62,22 12,3 27069,63397 10201707 1 CzechRepublic 2006 26,7 64,47 65,12 12,9 24400,72696 10235455 1 CzechRepublic 2002 57,95 59,03 18318,35495 10264212 1,5 Denmark 2011 29,5 87,74 81,83 12,1 43314,05636 5529888 1 Denmark 2007 26,9 86,59 83,2 11,9 38670,49766 5468120 1 Denmark 2005 25,9 84,54 81,34 11,8 34079,95976 5413392 1 Denmark 2001 87,15 84,34 30247,19638 5352815 1 Dominica 2009 54,87 91,35 7,7 10150,61626 72660 1 Dominica 2005 59,09 82,1 7,7 7899,638192 69278 1 Dominica 2000 60,17 87,73 7,7 6379,557666 74429 1 ElSalvador 2009 45,9 53,58 61,65 6,3 7136,595021 6030596 2,5 ElSalvador 2006 45,4 52,56 52,72 6,2 6702,272962 6822378 2,5 ElSalvador 2003 50,7 28,42 28,58 5657,03907 6353681 2,5 ElSalvador 2000 51,3 38,07 37,95 5,2 5092,548588 6021403 2,5 Estonia 2011 32,7 63,53 55,45 12 23954,86597 1282963 1 Estonia 2007 31,3 61,91 53,44 11,9 21836,41229 1315912 1 Estonia 2003 34,9 58,24 48,12 13237,35675 1415681 1,5 Finland 2011 27,7 67,37 72,77 10,3 40251,37351 5259250 1 Finland 2007 28,3 65,02 68,18 10,2 37505,13094 5231372 1 Finland 2003 66,71 69,96 28816,11926 5183545 1 France 2012 33,1 55,4 46,08 11,1 37462,32503 65630692 1 France 2007 32,6 59,98 43,43 10,7 34034,38518 63713926 1 France 2002 60,32 47,25 28503,56674 59551227 1 Georgia 2012 41,4 59,76 59 12,1 8026,50713 4570934 3,5 Georgia 2008 40,6 53,39 51,7 12,1 6163,757923 4630841 4 Georgia 2004 39,8 63,93 42,77 3813,189314 4934413 3,5

Olle Krönby & Nils Brandsma Economic Inequality & Voter Turnout
41
Georgia 2003 39,5 60,06 54,78 3460,150847 4328900 4 Germany 2013 71,53 66,07 12,9 44184,82304 81147265 1 Germany 2009 31,5 70,78 64,61 12,9 37112,88061 81837700 1 Germany 2005 77,65 71,99 12,4 32184,05523 82431390 1 Germany 2002 79,08 73,46 28435,90138 83029536 1,5 Ghana 2008 69,52 66,59 6,8 2754,883755 23434573 1,5 Ghana 2004 85,12 79,98 2138,098453 20757032 2 Ghana 2000 61,19 64,55 6,3 1801,414609 20212000 2,5 Grenada 2013 87,73 85,02 8,6 11657,90848 109590 1,5 Grenada 2008 80,3 107,56 11640,41651 90343 1,5 Grenada 2003 57,42 98,24 8922,936652 89258 1,5 Guatemala 2011 52,4 69,38 69,99 5,3 6798,842734 13824463 3,5 Guatemala 2007 60,46 57,19 3,9 6280,308986 12728111 3,5 Guatemala 2003 54,1 54,5 49,28 5146,756256 13909384 4 Guinea-Bissau 2008 82 64,25 2,3 1236,286756 1503182 4 Guinea-Bissau 2004 74,37 65,21 1065,417971 1360827 4 Guyana 2011 72,89 75 8,5 6077,186038 752940 2,5 Guyana 2006 68,82 66,44 8,1 4568,370074 767245 3 Guyana 2001 91,73 72,56 3791,759291 867371 2 Haiti 2011 22,77 19,28 4,9 1562,304129 9719932 4,5 Hungary 2010 29,4 64,38 63,67 4,9 21576,70695 9992339 1 Hungary 2006 28,3 67,57 68,84 4,5 18652,60671 10076581 1 Hungary 2002 26,8 70,52 71,55 14918,39832 10174853 1,5 Iceland 2013 81,44 80,01 11,3 42714,60426 321857 1 Iceland 2009 28,7 85,12 84,74 11,3 39912,27121 306694 1 Iceland 2007 29,6 83,6 84,65 11,2 38704,23513 301931 1 Iceland 2003 87,7 89,12 31976,22747 279384 1 India 2009 33,9 58,17 56,45 10,3 3920,160542 1156897766 2,5 India 2004 33,4 58,07 60,91 2576,537621 1049700118 2,5 Indonesia 2009 70,99 74,04 4,3 7815,70713 240271522 2,5 Indonesia 2004 84,09 87,6 5655,993914 216948359 3,5 Ireland 2011 32,3 69,9 63,78 7,5 45673,5345 4670976 1 Ireland 2007 32 67,03 68,89 7 46735,75107 4234925 1 Ireland 2002 62,57 66,98 34440,58422 3840838 1 Israel 2012 67,77 73,19 11,6 31993,62384 7590758 1,5 Israel 2009 64,72 70,24 11,6 27558,18795 7233701 1,5 Israel 2006 63,55 71,16 11,4 25766,9761 7116700 1,5 Israel 2003 67,81 76,11 23794,50309 6748400 2 Israel 2001 39,2 62,29 69,57 24958,17852 6508800 2 Italy 2013 75,19 68,33 12,5 35707,83111 61482297 1 Italy 2008 33,7 80,54 79,13 12,3 35170,89646 58147733 1 Italy 2006 34,3 83,62 82,13 12,3 31953,46035 58103033 1 Italy 2001 81,44 84,92 28246,79832 57684294 1,5 Jamaica 2011 53,17 46,18 10,1 8481,245974 2868380 2,5 Jamaica 2007 60,4 49,56 9,8 8521,989608 2780132 2,5 Jamaica 2002 48,3 59,06 50,89 6852,607695 2680029 2,5

Olle Krönby & Nils Brandsma Economic Inequality & Voter Turnout
42
Japan 2012 59,32 59,67 9,6 35735,61672 127368088 1,5 Japan 2009 69,27 69,34 9,5 31857,37223 127078679 1,5 Japan 2005 67,46 66,62 9 30441,34808 127417244 1,5 Japan 2003 59,8 59,07 27941,17634 127214499 1,5 Japan 2000 60,62 59,02 8,6 25938,19789 126996466 1,5 Kenya 2013 85,91 55,6 11,5 2843,773361 43013341 3,5 Kenya 2007 69,09 54,49 11,3 2306,86625 36913721 3 Kenya 2002 57,18 38,51 1761,750776 31138735 4 Kiribati 2007 67,54 44,8 6,1 1628,200741 95479 1 Kiribati 2003 1486,565004 89701 1 Kiribati 2002 1425,883255 88264 1 Korea,Republicof 2012 54,26 56,29 7,8 32222,59394 48860500 1,5 Korea,Republicof 2008 46,01 46,59 28718,04484 49296708 1,5 Korea,Republicof 2004 59,98 59,46 22967,81286 48289037 1,5 Korea,Republicof 2000 57,21 55,74 18083,08126 47424300 2 Kosovo 2010 33,3 45,62 61,31 11,8 7766,781541 1815048 4,5 Kosovo 2004 49,52 65,28 5467,806966 2041000 5 Kuwait 2013 51,9 12,17 7,2 76779,28856 2695316 5 Kuwait 2012 59,53 12,93 7,2 78492,39685 2646314 4,5 Kuwait 2009 59 6,6 77582,1493 2489004 4 Kuwait 2008 59,41 12,29 6,4 88250,00289 2596799 4 Kuwait 2006 91,92 19,42 6,1 87875,56333 2418393 4 Kuwait 2003 69909,19638 2183161 4,5 Kyrgyzstan 2007 33,4 75,2 63,63 9,2 2448,899199 5284149 4,5 Kyrgyzstan 2005 38,3 59 9,2 2110,377936 5146281 4,5 Latvia 2011 36 59,49 53,02 11,5 19451,03228 2074605 2 Latvia 2010 35,3 64,72 52,46 11,5 17409,90597 2217969 1,5 Latvia 2006 35,6 60,98 50,18 10,6 16604,79701 2274735 1 Latvia 2002 35,1 71,17 55,08 10227,98666 2385231 1,5 Lesotho 2012 50,04 50,32 5,9 2427,432836 2052000 3 Lesotho 2007 49 38,63 5,5 1834,091316 2022331 2,5 Lesotho 2002 51,6 66,69 49,61 1383,217604 2177062 2,5 Liberia 2011 71,64 67,39 3,9 732,6330069 3786764 3,5 Liberia 2005 76,49 70,6 3,4 530,9610917 3482211 4 Lithuania 2012 35,2 52,93 55,86 12,4 24475,05075 2986065 1 Lithuania 2008 37,1 48,59 46,15 12,2 20796,76326 3565205 1 Lithuania 2004 35,2 46,04 43,33 13251,46264 3607899 2 Lithuania 2000 31,7 58,18 50,43 10,9 8695,483487 3672338 1,5 Macedonia 2011 63,48 69,37 8,2 11641,23022 2114550 3 Macedonia 2008 44,1 57,99 67,08 8,2 10791,18159 2061315 3 Macedonia 2006 42,6 55,98 64,5 8,2 9155,141107 2050554 3 Macedonia 2002 38,5 74,6 85,35 6378,553583 2031112 3 Madagascar 2013 50,72 35,29 5,2 1414,496628 22599098 5 Madagascar 2007 5,2 1382,710545 19448815 3,5 Madagascar 2002 67,86 50,87 1036,723372 17117000 3,5 Malawi 2009 53,9 50,9 4 990,2613624 14268771 4

Olle Krönby & Nils Brandsma Economic Inequality & Voter Turnout
43
Malawi 2004 39,9 60,18 55,32 737,5883978 11651239 4 Maldives 2009 36,8 78,87 59,11 5,7 9791,465002 396334 4 Mali 2013 37,24 33,97 2 2163,055483 15968882 2,5 Mali 2007 32,19 33,32 1,8 1364,238151 13309212 2 Mali 2002 26 20,65 981,2502162 11446961 2,5 Malta 2013 92,95 91,72 9,9 29525,70619 409836 1 Malta 2008 93,3 88,88 9,1 25462,01396 401880 1 Malta 2003 95,7 95,35 19723,76295 397499 1 Mauritius 2010 77,82 72,63 8,4 15282,92456 1213000 1,5 Mauritius 2005 81,25 75,34 7,7 11349,03401 1242821 1,5 Mauritius 2000 80,87 79,57 7,1 8994,853322 1174772 1,5 Micronesia,FederatedStatesof 2013 44,68 64,88 8,8 3415,223679 106104 1 Micronesia,FederatedStatesof 2011 8,8 3410,284084 106836 1 Micronesia,FederatedStatesof 2009 55,59 8,8 3140,10039 107434 1 Micronesia,FederatedStatesof 2007 52,58 82,38 8,8 3073,794899 111300 1 Micronesia,FederatedStatesof 2005 8,8 2939,534421 110100 1 Micronesia,FederatedStatesof 2003 2787,440989 108600 1,5 Micronesia,FederatedStatesof 2001 2618,918312 107905 1,5 Moldova,Republicof 2010 32,1 63,37 50,21 9,8 3845,635588 4317483 3,5 Moldova,Republicof 2009 32,9 58,77 46,36 9,7 3544,025744 4320748 4 Moldova,Republicof 2005 36,3 64,84 48,66 9,4 2954,646021 4446455 3,5 Moldova,Republicof 2001 38,2 69,96 63,77 2007,438068 3657498 3 Monaco 2013 74,55 19,88 30510 1,5 Monaco 2008 76,85 18,29 35352 1,5 Monaco 2003 79,73 17,86 32110 1,5 Mongolia 2012 33,8 65,24 56,24 8,3 9990,038049 3179997 2 Mongolia 2008 74,31 60,47 8,3 7274,126952 2996081 2 Mongolia 2004 81,84 64,91 4921,782863 2712315 2 Mongolia 2000 82,42 70,96 8,1 3689,700412 2501041 2,5 Montenegro 2012 32,2 70,56 71,01 10,5 13812,69594 657394 2,5 Montenegro 2009 30,3 66,19 61,15 10,5 13127,68684 672180 3 Montenegro 2006 29,4 72,05 65,84 10,6 10522,58229 620145 3 Morocco 2011 45,4 28,65 4,4 6746,899456 31968361 4,5 Morocco 2007 40,7 37 27,83 4,1 5533,290467 33241259 4,5 Morocco 2002 51,61 39,98 3985,802655 30645305 5 Mozambique 2009 44,44 42,5 3,1 852,8593034 21921697 3 Mozambique 2004 36,34 35,56 600,5492643 19406703 3,5 Namibia 2009 61 67,53 6,1 7849,99947 2108665 2 Namibia 2004 84,81 80,23 6197,91768 1954033 2,5 Nepal 2008 63,29 74,42 3 1787,40582 28901790 4,5 Netherlands 2012 28 74,56 71,02 11,9 46448,8848 16730632 1 Netherlands 2010 28,7 75,4 71,13 11,8 44773,87287 16783092 1

Olle Krönby & Nils Brandsma Economic Inequality & Voter Turnout
44
Netherlands 2006 30,8 80,35 77,48 11,8 40815,45115 16491461 1 Netherlands 2003 80,04 77,54 33739,81975 16607754 1 Netherlands 2002 79,06 76,82 33950,39553 15981472 1 NewZealand 2011 74,21 69,83 12,5 32734,38316 4290347 1 NewZealand 2008 79,46 77,84 12,4 29860,21278 4173460 1 NewZealand 2005 80,29 79,22 12,2 25677,26149 4035461 1 NewZealand 2002 76,98 72,49 23306,45195 3864129 1 Nicaragua 2011 79,09 71,84 5,8 4223,427239 5666301 4 Nicaragua 2006 66,73 80,82 5,3 3951,24718 5570129 3 Nicaragua 2001 75 75,13 2858,455737 4952226 3 Niger 2011 31,5 49,22 45,64 1,4 807,1930209 16468886 4,5 Niger 2004 44,67 43,44 659,9820675 11360538 3 Nigeria 2011 28,66 25,8 5,2 5230,598854 155215573 4 Nigeria 2007 5,1 4266,961628 131859731 4 Nigeria 2003 40,1 49,32 46,63 2638,800223 129934911 4 Norway 2013 78,23 77,93 12,6 66817,17387 4722701 1 Norway 2009 26,4 76,37 74,74 12,6 56167,39604 4660539 1 Norway 2005 32,3 77,44 76,54 12,7 48356,51304 4593041 1 Norway 2001 75,48 73,5 37789,07151 4515195 1 Pakistan 2013 53,62 40,43 4,7 4632,392815 193238868 4,5 Palau 2012 40,63 42,24 12,2 13510,03458 21032 1 Palau 2008 42,66 42,6 12,2 12845,3008 21093 1 Palau 2004 12676,92342 20163 1 Palau 2000 81,15 81,65 11,4 10802,46843 19092 1,5 PapuaNewGuinea 2012 76,89 100,96 3,9 2525,962109 6310129 3,5 PapuaNewGuinea 2007 3,7 1795,976583 5795887 3 PapuaNewGuinea 2002 1449,254175 5049055 2,5 Philippines 2013 77,31 64,42 8,9 6587,916697 105720644 3 Philippines 2010 74,98 64,7 8,9 5524,15441 99900177 3,5 Philippines 2007 63,68 54,87 8,7 4899,392332 91077287 3 Philippines 2004 76,97 68,77 4012,576024 87857473 2,5 Philippines 2001 81,08 64,75 3452,161429 77599533 2,5 Poland 2011 32,8 48,92 48,54 11,8 22520,0128 37748288 1 Poland 2007 33,5 53,88 54,24 11,4 16890,32647 38518241 1 Poland 2005 35,9 40,57 40,87 11,3 13806,82848 38635144 1 Poland 2001 32,9 46,18 47,63 10967,2926 38646023 1,5 Portugal 2011 36,3 58,03 64,49 8 26932,40813 10760305 1 Portugal 2009 34,9 59,68 66,14 7,6 26208,85177 10707924 1 Portugal 2005 38,5 64,26 69,23 7,1 22072,65075 10524145 1 Portugal 2002 62,84 68,62 19331,7294 10066253 1 Romania 2012 27,3 41,76 42,81 10,7 18910,27827 21848504 2 Romania 2008 29,4 39,2 40,48 10,5 15989,64005 22060808 2 Romania 2004 30 58,51 62,26 8911,807882 22355551 2,5 Romania 2000 29,3 65,31 62,16 9,9 5726,307872 22303305 2 SaintKittsandNevis 2010 83,51 76,25 8,4 20064,42589 49898 1 SaintKittsandNevis 2004 58,98 91,42 16876,2792 38836 1,5 SaintKittsandNevis 2000 64,24 84,77 15128,53376 40976 1,5

Olle Krönby & Nils Brandsma Economic Inequality & Voter Turnout
45
SaintLucia 2011 56,84 76,71 8,3 10538,22528 161557 1 SaintLucia 2006 58,46 74,45 10148,48959 168458 1 SaintLucia 2001 31,54 64,42 7777,637467 154400 1,5 SaintVincentandTheGrenadines 2010 62,33 87,26 8,6 9715,329005 104217 1,5 SaintVincentandTheGrenadines 2005 63,68 81,38 8298,060558 117534 1,5 SaintVincentandTheGrenadines 2001 69,2 91,42 6224,93858 114417 1,5 Samoa 2011 10,3 5674,475341 193161 2 Samoa 2006 10,3 4961,204069 177287 2 Samoa 2001 82,54 76,62 3729,844194 182574 2 SanMarino 2012 63,85 82,05 32140 1 SanMarino 2008 68,48 88,48 30749 1 SanMarino 2006 71,84 98,06 29251 1 SanMarino 2001 73,8 102,83 26986 1 SaoTomeandPrincipe 2010 30,8 88,45 81,66 4,7 2712,781694 175808 2 SaoTomeandPrincipe 2006 66,85 62,93 4,3 2284,270557 151912 2 SaoTomeandPrincipe 2002 66,29 54,43 1733,871991 147000 1,5 Senegal 2012 36,67 30,27 4,5 2225,296028 12969606 3 Senegal 2007 34,75 27,59 4,2 2028,538474 12521851 2,5 Senegal 2001 41,2 67,26 40,99 1589,634168 9716196 3,5 Serbia 2012 57,77 67,55 9,5 13000,07329 7276604 2 Serbia 2008 28,2 61,35 70,17 9,5 11892,78712 7334935 2,5 Serbia 2007 29,4 60,57 68,19 9,5 10452,58188 7381579 2,5 Seychelles 2011 74,25 80,65 9,4 22556,58257 89188 3 Seychelles 2007 85,9 93,49 9,4 19755,66719 86000 3 Seychelles 2002 84,52 98,12 14563,34955 80098 3 SierraLeone 2012 79,28 76,84 2,9 1620,89897 5485998 3 SierraLeone 2007 75,8 72,06 2,7 1183,026202 5420000 3,5 SierraLeone 2002 83,26 77,27 909,8781023 5426618 4 Slovakia 2012 26,1 59,11 57,85 11,6 26091,27983 5483088 1 Slovakia 2010 27,3 58,84 58,38 11,6 24515,69235 5470306 1 Slovakia 2006 27,7 54,67 56,4 11,6 18810,72039 5439448 1 Slovakia 2002 70,07 71,63 13136,80796 5379455 1,5 Slovenia 2011 24,9 65,6 66,99 11,9 28513,47483 2000092 1 Slovenia 2008 23,7 63,1 65,04 11,6 29598,13922 2007711 1 Slovenia 2004 31,2 60,64 61,09 22689,43806 2011473 1 Slovenia 2000 70,36 72,33 11,6 17877,60796 1987985 1,5 SolomonIslands 2010 52,36 75,73 4,5 1752,11988 559198 3,5 SolomonIslands 2006 56,95 70,37 4,5 1534,731167 483800 3,5 SolomonIslands 2001 61,88 77,16 1256,852442 445906 4 SouthAfrica 2009 77,3 56,57 9,5 11529,36941 49052489 2 SouthAfrica 2004 76,73 56,77 9260,60182 42768678 1,5 Spain 2011 36,1 68,94 63,26 9,5 32530,09314 47021031 1 Spain 2008 34,8 75,32 69,94 9,3 33729,51679 45283259 1 Spain 2004 33,4 75,66 76,25 26437,85409 42345342 1

Olle Krönby & Nils Brandsma Economic Inequality & Voter Turnout
46
Spain 2000 68,71 73,79 8,4 21869,54874 39394773 1,5 Suriname 2010 73,21 65,61 7,7 14216,54879 545859 2 Suriname 2005 46,68 52,99 7,7 11049,55551 436935 2 Suriname 2000 69,85 72,34 7621,723237 416901 1,5 Sweden 2010 26,8 84,63 82,63 11,7 41755,98017 9074055 1 Sweden 2006 26,5 81,99 80,6 11,6 37571,1263 9082995 1 Sweden 2002 80,11 78,04 30790,50518 8876744 1 Switzerland 2011 31,8 49,1 40,04 12,2 54550,68937 7639961 1 Switzerland 2007 34,5 48,28 39,79 12,1 47404,66762 7554661 1 Switzerland 2003 45,22 37,27 36419,37836 7318638 1 Taiwan 2012 74,7 74,22 5,1 23230506 1,5 Taiwan 2008 58,5 56,8 5 22858872 1,5 Taiwan 2004 59,16 57,9 22605000 1,5 Taiwan 2001 66,16 63,14 22335805 1,5 Tanzania,UnitedRepublicof 2010 39,49 37,53 4,4 2068,488487 41892895 3,5 Tanzania,UnitedRepublicof 2005 69,64 65,51 2,8 1634,893131 36766356 3,5 Tanzania,UnitedRepublicof 2000 37,3 72,77 45,72 2,8 1180,742537 33517000 4 Timor-Leste 2007 31,6 80,54 71,63 5 1325,158607 1084971 3,5 Timor-Leste 2001 37,6 86,03 84,57 1304,039134 737811 4 Togo 2013 66,06 57,72 9,4 1341,614534 7154237 4,5 Tonga 2010 90,85 72,49 10,8 4852,021362 105632 4 Tonga 2008 46,69 47,8 10,8 4567,116508 119009 4 Tonga 2005 50,52 55 10,3 4461,563064 110237 4 TrinidadandTobago 2010 69,45 77,16 29307,87116 1228691 2 TrinidadandTobago 2007 66,03 72,52 28947,79744 1056608 2 TrinidadandTobago 2002 69,64 71,91 16653,0008 1163724 3 TrinidadandTobago 2001 66,13 64,98 15260,39035 1249053 3 TrinidadandTobago 2000 63,05 69,99 14373,03668 1289594 2 Tuvalu 2010 5,4 3156,748086 10472 1 Tuvalu 2006 5 2796,861693 11636 1 Tuvalu 2002 79,99 63,15 2733,428397 10267 1 Uganda 2011 59,29 55,32 11,3 1648,531066 34612250 4,5 Uganda 2006 68 60,12 11,2 1225,917546 27269482 4,5 Ukraine 2012 24,7 57,4 55,94 12,3 8472,201129 44854065 3,5 Ukraine 2007 28,6 62,03 62,73 12,2 8025,898666 46299862 2,5 Ukraine 2006 29,8 67,19 67,2 12,2 7202,3367 46929500 2,5 Ukraine 2002 29,1 69,24 69,57 4639,718772 48760474 4 UnitedKingdom 2010 34,8 65,77 61,06 12,9 35879,79939 62348447 1 UnitedKingdom 2005 34,6 61,36 58,32 12,8 34623,20514 60270708 1 UnitedKingdom 2001 59,38 57,56 28821,50555 59434645 1,5 UnitedStates 2012 64,44 51,8 9 51433,04709 312780968 1 UnitedStates 2010 40,5 48,59 38,51 9 48374,08679 308282053 1 UnitedStates 2008 64,36 52,59 9 48401,42734 303824640 1 UnitedStates 2006 47,52 37,32 46437,06712 298444215 1

Olle Krönby & Nils Brandsma Economic Inequality & Voter Turnout
47
UnitedStates 2004 40,6 68,75 55,31 41921,80976 293027571 1 UnitedStates 2002 45,31 35,09 38166,03784 278058881 1 UnitedStates 2000 40,5 63,76 47,35 36449,85512 284970789 1 Vanuatu 2012 63,22 85 8,6 2952,413431 256155 2 Vanuatu 2008 70,38 82,78 8,3 2828,478687 230820 2 Vanuatu 2004 68,58 79,3 2192,447393 205754 2 Vanuatu 2002 63,47 74,18 2030,384081 192910 2 Venezuela 2010 66,42 66,6 6,5 16228,34081 27223228 4,5 Venezuela 2005 52,4 25,26 23,88 6,4 13317,17856 25375281 4 Venezuela 2000 56,55 46,52 5,9 11427,40708 24185517 4 Zambia 2006 54,6 70,74 55,74 2391,85028 11502010 3,5 Zambia 2001 68,55 35,46 1740,077004 10646096 4,5