Embed Size (px)
Citation preview
Economic Inequality and the Rise in U.S. Imprisonment
Bruce Western1
Meredith Kleykamp
Jake Rosenfeld
Princeton University
April 2004
1Department of Sociology, Princeton University, Princeton, NJ 08544. E-mail:[email protected]. This research was supported by the Russell Sage Foun-dation. We thank Mike Dove and MSG Pam Bridges-Lewis (U.S. Army) for datafrom the Defence Manpower Data Center.
Abstract
This paper relates the growth in men’s prison admission rates to increas-ing economic inequality through the 1980s and 1990s. Previous research onincarceration examined national or state-level data, but this analysis con-structs detailed annual prison admission rates for age-education-race sub-groups. Analysis indicates a significant increase in educational inequality inincarceration; nearly all the growth in the risk of imprisonment between 1983and 1999 was confined to noncollege men. Regressions of admission rates onmen’s labor market outcomes indicates the negative effects of wages and em-ployment on black men’s incarceration, and the negative effects hourly wagesfor white men. If 1980s wage and employment levels persisted through thelate 1990s, estimate suggest that prison admission rates would be be 15 to20 percent lower for men at all levels of education.
Two major social trends reduced the living standards of young low-
education American men over the last thirty years. The earnings of men with
just a high school education were eroded by the tide of rising U.S. income
inequality. While wages fell, growth in the American penal system turned
prison and jail time into common life events for low-skill and minority men.
The new inequality and the prison boom both date from the mid-1970s, and
both trends continued through the end of 1990s. Has the growth in economci
inequality contributed to the growth in American imprisonment?
Incarceration might be connected to economic inequality in two main
ways. Rising inequality may increase crime at the bottom of the social hi-
erarchy, generating more arrests, convictions, and prison admissions. Thus
Richard Freeman (1996) argued that young black men turned to crime in
response declining job opportunities through the 1980s and 1990s. Troy
Duster (1997), similarly claims that the collapse of legitimate employment
in poor urban neighborhoods drew young black men into the illegal drug
trade, steeply increasing their risks of arrest and incarceration. For sociol-
ogists of punishment, criminal law functions not just to control crime, but
also to contain marginal populations that are perceived as threatening by
elites and voters. The direct link between contemporary economic inequality
and punishment was forcefully claimed by Loıc Wacquant. Like Freeman and
Duster, Wacquant (2000) sees recent growth in the penal system as closely
connected to the decline of urban labor markets in the later postwar period.
In Wacquant’s analysis, the “prisonization of the ghetto” represents just the
latest form of institutionalized white supremacy—a social response to the
demise of the ghetto as an economically viable, yet controlling, institution in
the lives of African Americans.
We examine the relationship between economic inequality and the grow-
1
ing risk of men’s prison admission between 1983 and 1999. Previous re-
search associated aggregate measures of inequality with aggregate incarcera-
tion rates, either in samples of U.S. states or national time series (e.g., Jacobs
and Helms 1996, 2001; Greenberg and West 2001). This approach misses a
central implication of inequality theories of incarceration: that economic in-
equality expands criminal punishment among the disadvantaged, increasing
inequality in incarceration. We adopt a novel approach in this paper by cal-
culating the risk of imprisonment for white and black men at different ages
and levels of education. We then relate these disaggregated risks to disaggre-
gated measures of economic status. In contrast to previous aggregate-level
research, our design produces a tighter link between the economic status of
the disadvantaged and their involvement in the criminal justice system.
The Prison Boom
Growth in the American penal system involved a spectacular change in the
functions of state government and dramatic shifts in the life course of low-
education men. About two-thirds of the American correctional population
are housed in state or federal prisons serving sentences for felony convictions
of a year or longer. Between 1920 and 1970, the prison incarceration rate
hovered around 100 per 100,000 of the U.S. population. In 1970, the im-
prisonment rate at 96 per 100,000, stood near its historic average. By 2001
the rate of prison incarceration had increased to 470 per 100,000. Growth
in the prison population was driven by an increase in prison admissions and
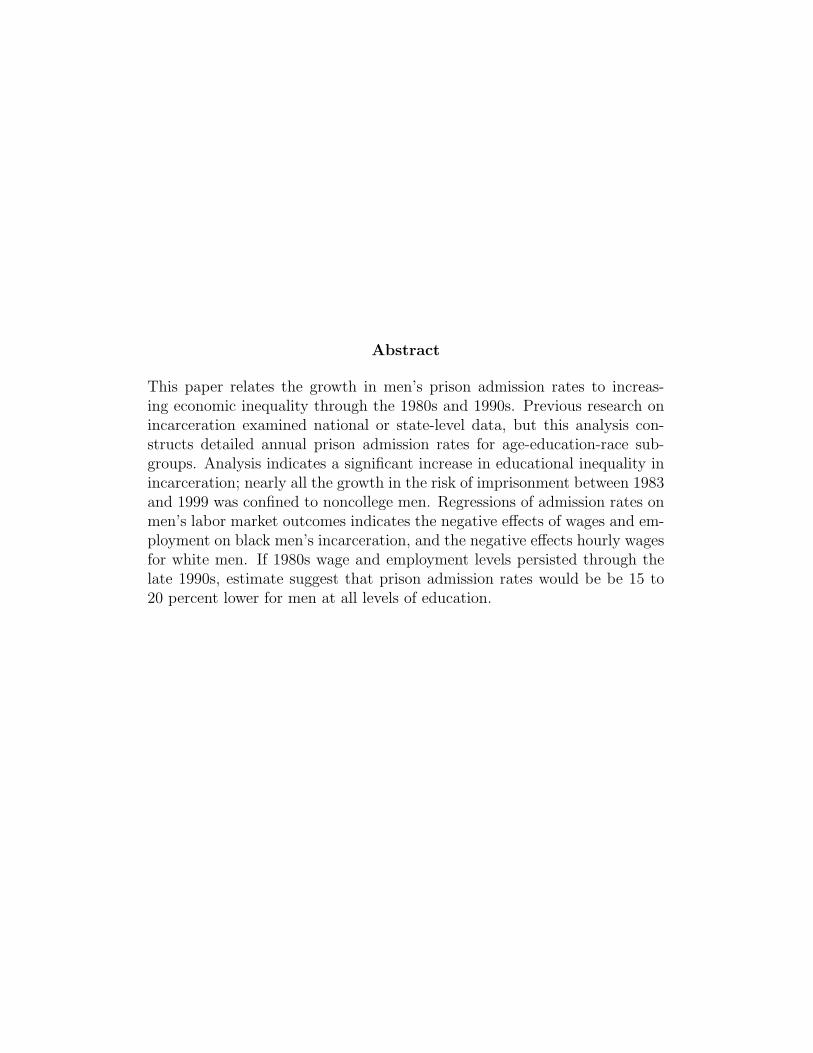
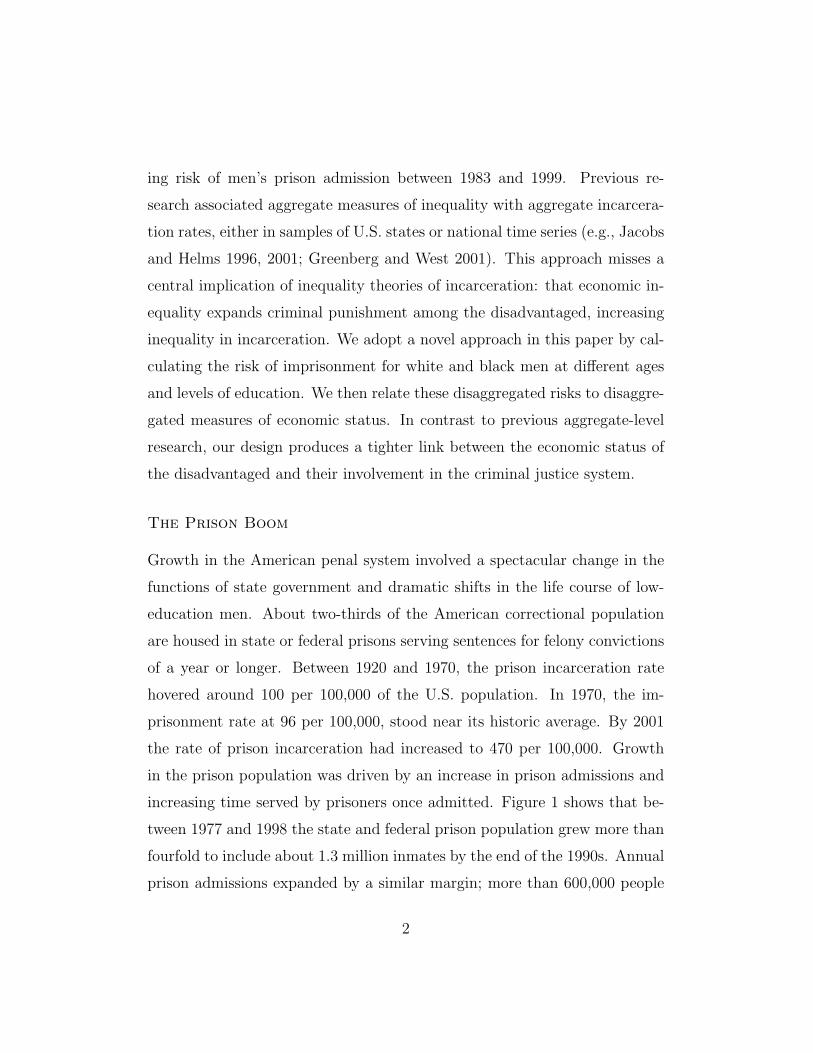
increasing time served by prisoners once admitted. Figure 1 shows that be-
tween 1977 and 1998 the state and federal prison population grew more than
fourfold to include about 1.3 million inmates by the end of the 1990s. Annual
prison admissions expanded by a similar margin; more than 600,000 people
2
Pris
on A
dmis
sion
s (1
000s
)
1980 1985 1990 1995
200
300
400
500
600
Prison AdmissionsPrison Population
200
400
600
800
1000
1200
1400
Pris
on P
opul
atio
n (1
000s
)
Figure 1. Numbers of prisoners admitted to state of federal jurisdiction, 1977–1998(left-hand axis); number of prisoners under state or federal jurisdiction, 1977–1998(right-hand axis). Source: Bureau of Justice Statistics, National Prisoner Statisticsdata series (NPS-1).
are now annually sentenced to a year or more in state or federal custody.
Our analysis examines prison admission rates because they are likely to
have the most immediate relationship to economic inequality. A rising gap
between rich and poor may affect admissions by increasing crime rates among
low income men, or increasing the rates of arrest and court commitment to
prison. Contrast time served that is only observed at release. In this case,
the effects of inequality will only be seen with a long and indeterminate
lag. We might also follow other research in analyzing incarceration rates
(e.g., Jacobs and Helms 1996; Greenberg and West 2001), but this bundles
3
together the immediate effect of inequality on admissions and the lagged
effect of inequality on time served.
Aggregate figures on imprisonment conceal large educational and racial
disparities. According to the 1997 Survey of Inmates of State Prisons, prison-
ers average less than 11 years of schooling compared to more than 13 years
of schooling among men under age 40 in the noninstitutional population
(Western and Pettit 1999). Censuses of correctional facilities find that the
imprisonment rate of African Americans is about 7 times higher than that
of whites. Disaggregated prison admission rates that capture these inequal-
ities can be calculated using data from the National Corrections Reporting
Program (NCRP). The NCRP data provide an annual census of all prison ad-
missions and releases in 38 reporting states, covering 80 to 90 percent of the
total prison population. The NCRP data record a prisoner’s age, race and
ethnicity, education, and offense. Combining the NCRP data with aggregate
figures on total male prison admissions yields estimates of the proportion of
the population annually entering prison for white and black men at different
ages and levels of education.
Table 1 reports prison admission rates for young black and white men
from 1983 and 1999. Unlike most studies of imprisonment, we distinguish
admission rates for those without high school diplomas or GEDs, high school
graduates, and those with at least some college. For blacks and whites, high
school dropouts are about 5 times more likely to go to prison in a given year
than men who have completed high school. The prison admission rate rose
sharply for low-education men but little among the college-educated. Racial
disparities are also pronounced. In line with aggregate statistics on incar-
ceration rates, the NCRP data indicate that rates of prison admission for
African Americans are 5 to 10 times higher than for whites. The combina-
4
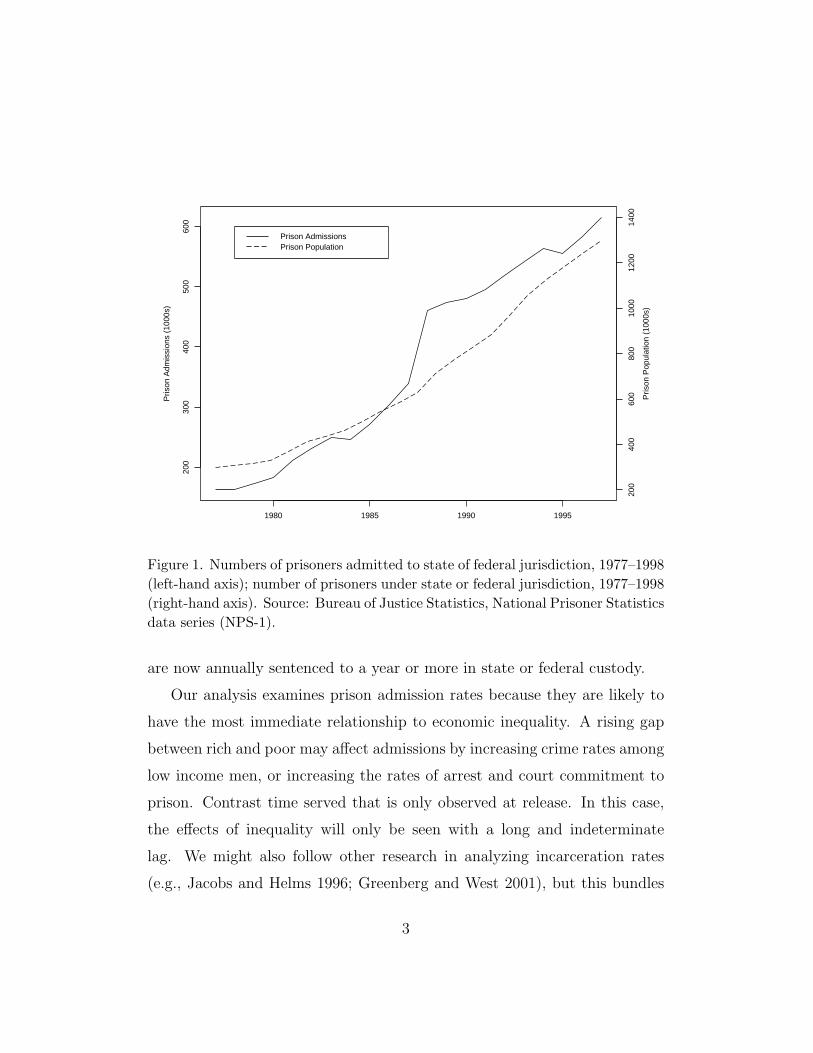
Table 1. Percent of noninstitutional men, aged 20–39, annually entering prison,by education and race, 1983–1999.
1983–88 1989–94 1995–99Whites
Less than H.S. 1.71 2.58 3.21High School or GED .30 .41 .57Some College .05 .06 .06
BlacksLess than H.S. 7.82 15.31 16.90High School or GED 1.59 2.71 3.16Some College .48 .78 .60
tion of racial and educational inequality strikingly affect young black male
dropouts. The NCRP data indicate that 1 in 6 black male dropouts annually
went to prison in the late 1990s. The protective effects of college education
are also shown, as fewer than one percent of college-educated black men were
admitted to prison in 1999.
Inequality and the Prison Boom
The link between rising inequality and growth in the penal population might
be traced to criminal offending or the social control efforts of criminal justice
authorities. If increasing inequality raises crime rates at the bottom of the
stratification hierarchy, more offenders will be supplied to the penal system.
Increased disadvantage may cause some social groups to be viewed as more
dangerous and threatening to social order, attracting punitive treatment by
lawmakers and criminal justice officials.
5
Inequality and Crime
Lower class criminality is typically explained by a strain theory in which
the goal of material success is widely held in society, but opportunities to
legitimately attain that goal are unequally distributed. In Merton’s (1968,
223) seminal argument “the moral mandate to achieve success . . . exerts
pressure to succeed by fair means if possible and by foul means if necessary.”
Frustration at blocked opportunities drives the poor to crime so they might
access the material success enjoyed legally by the middle class. Blau and Blau
(1982) go further, arguing that ascriptive inequality (like racial inequality),
more than inequality based on achievement, appears particularly illegitimate.
High levels of racial inequality, rather than economic disadvantage, may fan
the frustrations that trigger crime.
In contrast to strain theory that suggests how economic conditions can
push people into crime, social control theories emphasize constraints that
prevent offending. The routines of steady employment, independent of its
economic attractions, reduce opportunities for offending. Adopting the lan-
guage of segmented labor markets, researchers find that men in primary sec-
tor jobs—where work is consistent, routinized and monitored—commit less
crime than men in the secondary labor market where employment is irreg-
ular (Sullivan 1989; Crutchfield and Pitchford 1997). Research on criminal
desistance similarly shows that continuity of employment provides a pathway
out of crime for men with criminal histories (Sampson and Laub 1993; Uggen
1999).
Economic disadvantage may also erode informal social control indirectly,
through its association with family disruption and neighborhood poverty
(Shihadeh and Steffensmeier 1994). Stable two-parent families can monitor
children’s activities and divert them from the peer networks that provide a
6
familiar context for delinquency (Sampson 1987). Poor families—that are
more likely to be headed by a single parent—have fewer resources to restrain
delinquency (Hagan 1993). Although juvenile crime is often the focus of re-
search on the effects of family disruption, stable marriages, like steady jobs,
are found to be a key source of criminal desistance among adult men with
a history of offending (Sampson and Laub 1993; Laub, Nagin, and Sampson
1998). Given that marriage rates are lower among poor (particularly minor-
ity) men (Ellwood and Jencks 2001), economic disadvantage may also work
indirectly to foster crime among adults.
The crime-inequality connection is empirically supported by evidence of
high crime rates at the bottom of the social ladder. Braithwaite’s (1979)
expansive review of research before 1980 describes two sorts of effects. First,
official records from police and courts indicate lower class men and male
youth are more involved in crime and delinquency than those with middle
class backgrounds. Second, there is also support for an ecological effect
in which individuals in poor and minority neighborhoods commit crime at
relatively high rates, regardless of their social class. More recent literature
reviews have examined other economic conditions. Time series and panel
studies of states and counties often report that crime rates are positively
related to unemployment and other measures of joblessness (see the reviews
of Chiricos 1987; Freeman 1995).
Has research on class and crime examined the historical context of ris-
ing U.S. income inequality? Several quantitative studies estimate the ef-
fects of the new American inequality, and ethnographic research sees urban
drug dealing as a response to the decline of urban labor markets. Analyzing
city and state level data from three census years, Land, McCall, and Cohen
(1990) estimate the effects of an omnibus measure of economic deprivation—
7
a weighted sum of the poverty rate, a Gini index of family income inequality,
and median family income. The estimated effect of economic deprivation on
homicide rates increases at the city and state levels between 1950 and 1980
(Liska and Bellair 1995 report similar results). LaFree and Drass (1997) find
that race-specific arrest rates increased during periods of rising intra-racial
income inequality. These findings capitalize on the sharp increase in crime
rates between the mid-1960s and mid-1970s. Richard Freeman (1996) con-
siders the new inequality of the late twentieth century, arguing that “the
depressed labor market for less skilled men in the 1980s and 1990s has con-
tributed to the rise in criminal activity by less skilled men.” Despite this
claim, no consistent relationship between income inequality and aggregate
crime rates has been found for the two decades from 1980. Fowles and Merva
(1996) analyze 28 metropolitan areas between 1975 and 1990 and find a sta-
ble association between household income inequality for several categories
of violent crime. Doyle and his colleagues (1999) could not reproduce this
result in their study of crime rates in 48 states from 1984 to 1993. Analysis
of national youth homicide arrests, 1967–1998, also failed to find a robust
effect for income inequality (Messner et al. 2001). Quantitative analyses of
the 1980s and 1990s, when inequality increased sharply, offer little sustained
support for the inequality-crime relationship.
A key limitation of the quantitative research is that crime among the poor
is inferred from aggregate crime rates for the whole population. Ethnographic
research helps fill the gap by studying crime in poor urban neighborhoods.
Urban ethnographers have identified entrepreneurial gangs as a key source
of economic opportunity for young men in urban communities characterized
by high and persistent rates of joblessness. Bourgois’s (1996) ethnographic
research on Hispanic drug gangs views the sale and distribution of crack co-
8
caine as a response to depleted economic opportunities in inner cities. Sudhir
Venkatesh and Steven Levitt (2000) find that drug gangs have become impor-
tant economic organizations in poor urban areas. Their research on Chicago’s
“outlaw capitalism” shows that drug gangs have a well-defined organizational
hierarchy in which incomes are steeply graduated from the street sellers at
the bottom to the managers at the top. Other researchers more generlly
claim that drug dealing in inner cities proliferated as legitimate employment
opportunities for low-skill men diminished in the 1980s and 1990s (Duster
1997; Tonry 1995; Anderson 1999).
Theories of strain and informal social control suggest why crime rates, and
consequently incarceration rates, might be high among the disadvantaged.
Research indicates that growth in crime in the decade from 1965 is related
to rising income inequality. Evidence for the crime-inequality relationship is
weaker for the 1980s and 1990s. Still, ethnographers report that drug dealing
became more common among poor young men in response to the collapse of
low-skill urban labor markets in the 1980s.
Inequality and Social Control
In the sociology of punishment, criminal behavior in the population is only
weakly related to the scale of imprisonment (Garland 1991). Instead crim-
inal punishment expresses authorities’ reaction to the perceived menace of
marginal populations. Inspiration for this argument is often traced to Georg
Rusche (1978 [1933]; Rusche and Kirchheimer 1939) who viewed historic vari-
ation in forms of punishment—fines, torture, imprisonment—as products of
the economic situation of the dispossessed. The unemployed, representing
the most desperate and crime-prone workers, occupy a special place in this
theory. Elites would stem the threat of rising crime by intensifying pun-
9
ishment as the surplus population expanded; the level of punishment would
then contract under conditions of labor scarcity.
For the contemporary descendants of Georg Rusche, the criminal justice
system embodies a social conflict between authorities and marginal popu-
lations. While Rusche viewed punishment chiefly as means to deter crime,
modern proponents see punishment as controlling a broad array of threats to
social order posed by troublesome populations. The level of punishment is
expected to vary with the size of the troublesome group. Empirical studies
defined threatening populations in terms of their employment status, (e.g.,
Box and Hale 1982), race or ethnicity (Hall 1978), or some combination of the
two (Melossi 1989; Spohn and Halleran 2000). If not through crime, how do
marginal populations endanger social order? Some claim that troublesome
populations are viewed by authorities as jeopardizing not just public safety,
but the economic order in general (Quinney 1974; Spitzer 1975). The able-
bodied poor may refuse to work, steal from the rich, reject the dominant
values of hard work and achievement, and advocate revolutionary change
(Spitzer 1975). The destabilizing potential of low-income young men at the
bottom of the social structure is well-captured by Spitzer’s (1975, 645) term,
“social dynamite,” evoking volatility more than chronic disadvantage.
In the abstract, social threat accounts of punishment sound conspirato-
rial. By what concrete process do dominant groups actively use the state’s
legitimate violence against those who are relatively powerless? Three spe-
cific mechanisms connect social and economic disadvantage to criminal justice
supervision. First, legislators perceiving poor and marginal populations as
dangerous or unruly may write criminal law to contain the threat. In the
course of the prison boom, trends in drug sentencing were thus widely asso-
ciated with intensified criminalization of poor urban minorities (Tonry 1995;
10
Dubber 2001). Over the past three decades, Congress and state legislatures
adopted mandatory prison sentences for drug possession or trafficking (Bu-
reau of Justice Assistance 1998, 7). Consequently, the risks of imprisonment
given arrest and the proportion of drug offenders in state prison increased
sharply between 1980 and 1996 (Blumstein and Beck 1999). Second, police
may surveil and arrest the poor more frequently than the affluent. Police
partly focus their efforts in poor urban communities because more of daily
life, and illegal activity, transpires in public space. Ethnographers suggest
that the purchase and consumption of drugs, drunkenness, and domestic dis-
turbances are more likely to take place in public in urban areas, but in private
homes in the suburbs. Consequently, poor urban residents are more exposed
to police scrutiny and risk arrest more than their suburban counterparts.
(e.g., Duneier 2000; Anderson 1999; Bourgois 1996). Police also tend to view
poor minorities as more involved in crime, treating them with greater sus-
picion (Wilson 1968, ch. 2; Chambliss 2000). Third, judges may treat poor
defendants harshly once in court. Judges can view poor defendants as more
culpable with less potential for rehabilitation (Kluegel 1990; Steffensmeier,
Ulmer, and Kramer 1998, 770; Greenberg 1977; Albonetti 1991). Thus, con-
trolling for offense characteristics and criminal history, sentencing research
finds the highest probability of incarceration among low-status unemployed
defendants—either minorities or those living in high unemployment areas
(Spohn and Holleran 2000; D’Alessio and Stolzenberg 2002).
Social threat accounts of punishment suggest that rising inequality may
increase incarceration among the disadvantaged. Most research on the eco-
nomic determinants of incarceration follow Rusche and Kirchheimer, by study-
ing the effects of unemployment and other measures of surplus population.
Chiricos and Delone (1992) report that national time series analyses consis-
11
tently show a positive effect of unemployment on prison admissions. However,
this pattern does not hold in the 1990s when historically low unemployment
rates were associated with high levels of incarceration (Michalowski and Carl-
son 1999).
Although economic analysis of criminal punishment focuses on unem-
ployment effects, several studies examine the impact of economic inequality.
Strongest results are reported by Jacobs and Helms (1996; 2001) who find
several positive and significant effects of income inequality on imprisonment
rates (1953–1998) and prison admission rates (1950–1990). Inequality effects
are much weaker in samples of states or counties where cross-sectional varia-
tion predominates. Panel studies of states show that Gini indexes on family
incomes are only weakly related to prison incarceration rates, once crime
rates and the racial composition of the population are controlled (Greenberg
and West 2001). Jacobs and Carmichael (2001) fit a fixed effect model to
panel data, showing that states with the largest increases in inequality, did
not experience the largest increases in incarceration rates.
Previous research unevenly supports the inequality-incarceration relation-
ship, but aggregated measurement and inefficient research designs may have
prevented strong findings. Theories linking inequality to imprisonment claim
that a growing gap between rich and poor results in increasing social control
of the disadvantaged. Still, nearly all studies of the effects of inequality an-
alyze aggregate crime and incarceration rates. These rates may be defined
on the whole U.S. population, or for states or metropolitan areas. A few
studies separate the involvement of blacks and whites in the criminal justice
system (LaFree and Drass 1996; Bridges and Crutchfield 1988), but even here
race is used as a proxy for economic status and the possibility that affluent
blacks are treated differently from poor blacks is obscured by the aggregated
12
research design. A strong test of the effects of inequality on incarceration
requires a more disaggregated analysis where incarceration risks are observed
for different segments of the population.
Incarceration research on economic effects also apply inefficient designs
that use relatively little information in statistical analysis. Time series stud-
ies, which offer the strongest support for inequality effects on incarceration,
rely on data sets of 30 or 40 time points. In these anlayses there are frequently
a wide range of plausible models and long lists of correlated covariates. Re-
sults are thus highly sensitive to the choice of model. Panel studies of states
use more information, but time series tend to be sparse consisting of just
two or three time points (Jacobs and Carmichael 2001; Greenberg and West
2001; Beckett and Western 2001). Growth in inequality has been uneven,
accelerating in the early 1980s and flattening out at a high level through the
1990s. This variation is missed in panel studies. A stronger design would
examine annual variation in a cross-section of the population, capturing the
ebb and flow of the widening gap between rich and poor households.
A Disaggregated Analysis of Imprisonment
To address the limits of previous research we develop a disaggregated ap-
proach to estimating the effects of economic inequality on incarceration. Us-
ing annual data for 1983 to 1999, men’s probability of going to prison is
calculated for age-race-education groups by combining data from the NCRP
and data on the noninstitutional population. These admission rates are esti-
mated for four age groups, (1) 20–24, (2) 25–29, (3) 30–34, (4) 35–39; three
levels of schooling, (1) high school dropouts, (2) those with high school diplo-
mas or equivalency but no college, and (3) those with at least some college;
and two race groups, (1) non-Hispanic whites, and (2) non-Hispanic blacks.
13
This coding scheme provides a 4 × 3 × 2 table for each of 17 years, yield-
ing a sample of 408 admission rates for analysis. Admission rates calculated
from the NCRP are largely consistent with those from other data sources
(see Appendix), and the large samples of the NCRP allow sharp estimates
of admission rates for specific subgroups.
Our key predictors of prison admission are disaggregated measures of
employment and weekly earnings, calculated from the merged outgoing rota-
tion group files of the Current Population Survey. Like the prison admission
rates, annual earnings and employment figures are calculated for men’s age-
race-education subgroups. Median weekly earnings data indicate a clear race
gap that has persisted among young men through the 1980s and 1990s (Ta-
ble 2). Between 1983 and 1999, the weekly earnings of young white men
exceeded those of young blacks at the same level of education by 25 to 30
percent. The table also indicates increasing inequality by education among
white men that is well-documented in other research (e.g., Bernhadt et al.
2002). In the 1980s, young white men with at least some college education
earned 48 percent more than young white male dropouts. By the late 1990s,
this earnings gap had grown to 62 percent. The growth in inequality was not
mirrored among black men because of the large decline in weekly earnings
for the college-educated. The earnings of black male high school dropouts
were also more robust than the earnings of their white counterparts. This
may reflect an improvement in the relative market position of black male
dropouts during the low-unemployment period of the 1990s (Freeman and
Rodgers 2001). The growth in earnings may also be an artifact of the high
incarceration rate in this group, in which 30 percent of low-earnings men are
in prison or jail (Western and Pettit 1999).
Table 3 reports trends in employment by education for young black and
14
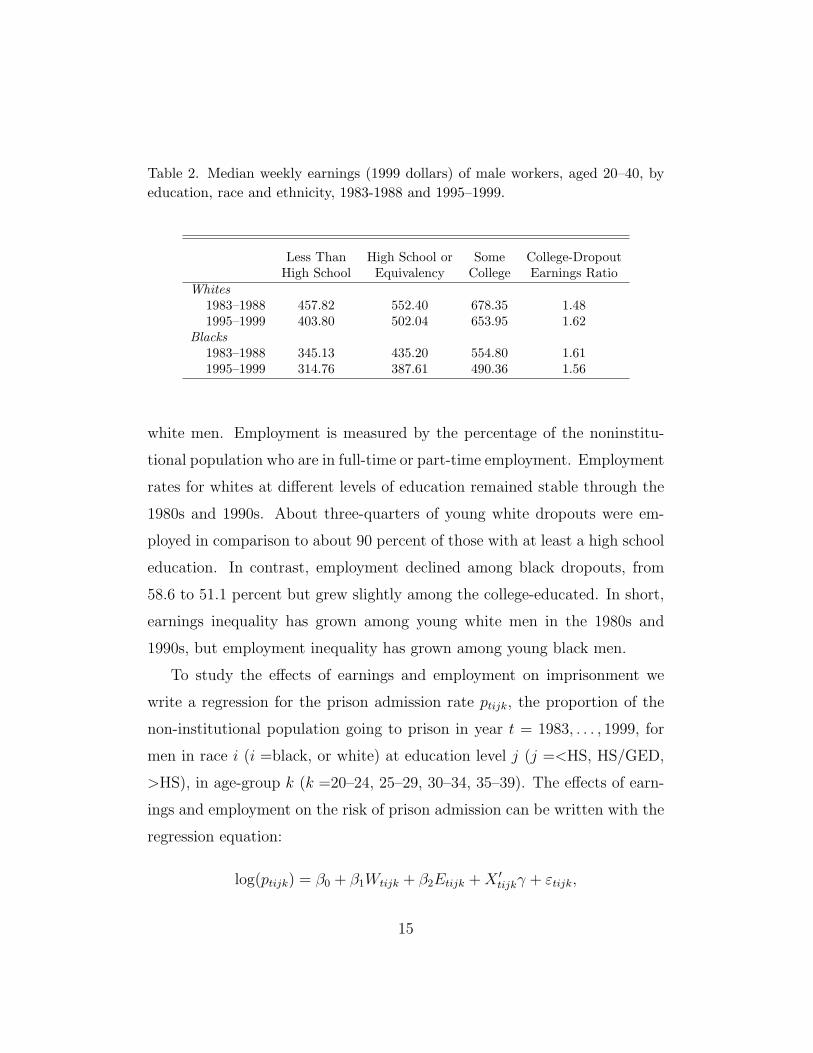
Table 2. Median weekly earnings (1999 dollars) of male workers, aged 20–40, byeducation, race and ethnicity, 1983-1988 and 1995–1999.
Less Than High School or Some College-DropoutHigh School Equivalency College Earnings Ratio
Whites1983–1988 457.82 552.40 678.35 1.481995–1999 403.80 502.04 653.95 1.62
Blacks1983–1988 345.13 435.20 554.80 1.611995–1999 314.76 387.61 490.36 1.56
white men. Employment is measured by the percentage of the noninstitu-
tional population who are in full-time or part-time employment. Employment
rates for whites at different levels of education remained stable through the
1980s and 1990s. About three-quarters of young white dropouts were em-
ployed in comparison to about 90 percent of those with at least a high school
education. In contrast, employment declined among black dropouts, from
58.6 to 51.1 percent but grew slightly among the college-educated. In short,
earnings inequality has grown among young white men in the 1980s and
1990s, but employment inequality has grown among young black men.
To study the effects of earnings and employment on imprisonment we
write a regression for the prison admission rate ptijk, the proportion of the
non-institutional population going to prison in year t = 1983, . . . , 1999, for
men in race i (i =black, or white) at education level j (j =<HS, HS/GED,
>HS), in age-group k (k =20–24, 25–29, 30–34, 35–39). The effects of earn-
ings and employment on the risk of prison admission can be written with the
regression equation:
log(ptijk) = β0 + β1Wtijk + β2Etijk + X ′tijkγ + εtijk,
15
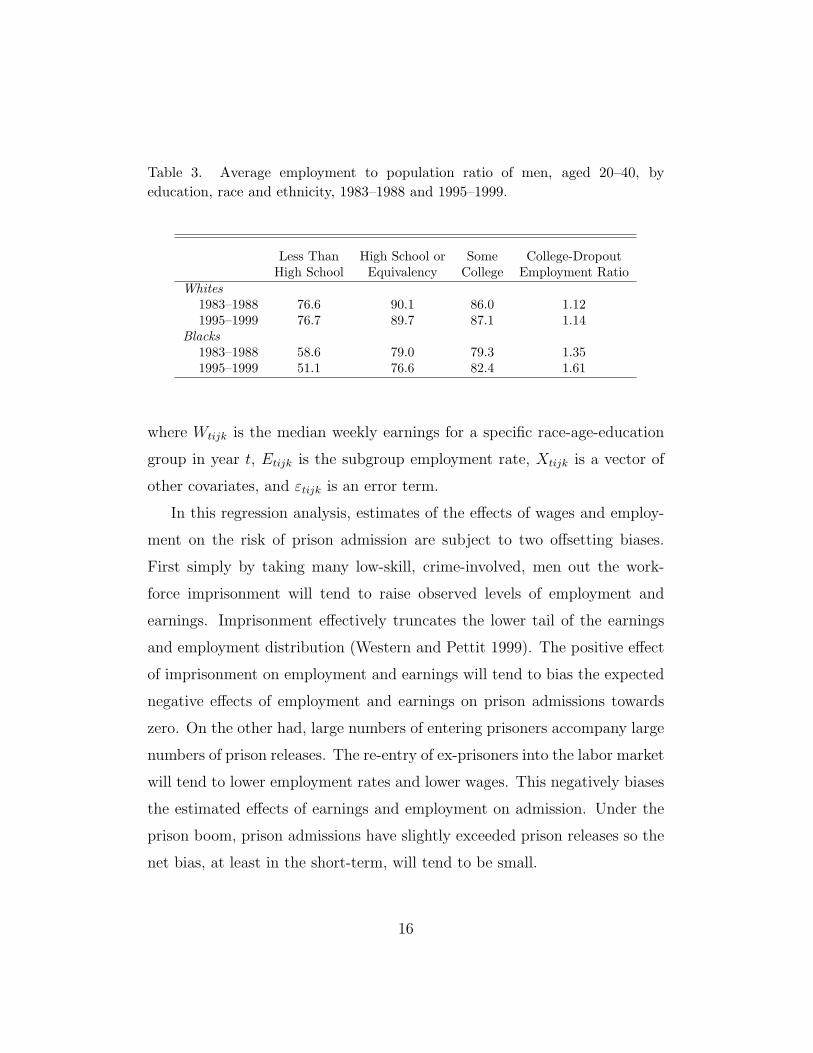
Table 3. Average employment to population ratio of men, aged 20–40, byeducation, race and ethnicity, 1983–1988 and 1995–1999.
Less Than High School or Some College-DropoutHigh School Equivalency College Employment Ratio
Whites1983–1988 76.6 90.1 86.0 1.121995–1999 76.7 89.7 87.1 1.14
Blacks1983–1988 58.6 79.0 79.3 1.351995–1999 51.1 76.6 82.4 1.61
where Wtijk is the median weekly earnings for a specific race-age-education
group in year t, Etijk is the subgroup employment rate, Xtijk is a vector of
other covariates, and εtijk is an error term.
In this regression analysis, estimates of the effects of wages and employ-
ment on the risk of prison admission are subject to two offsetting biases.
First simply by taking many low-skill, crime-involved, men out the work-
force imprisonment will tend to raise observed levels of employment and
earnings. Imprisonment effectively truncates the lower tail of the earnings
and employment distribution (Western and Pettit 1999). The positive effect
of imprisonment on employment and earnings will tend to bias the expected
negative effects of employment and earnings on prison admissions towards
zero. On the other had, large numbers of entering prisoners accompany large
numbers of prison releases. The re-entry of ex-prisoners into the labor market
will tend to lower employment rates and lower wages. This negatively biases
the estimated effects of earnings and employment on admission. Under the
prison boom, prison admissions have slightly exceeded prison releases so the
net bias, at least in the short-term, will tend to be small.
16
Distinguishing Inequality Effects on Crime and Social Control
Economic inequality may affect prison admissions through the criminal be-
havior of the disadvantaged or the social control efforts directed at them
by criminal justice authorities. In studies of national time series or panels
of states, researchers try to isolate the social control effect by statistically
adjusting for crime rates (e.g., Jacobs and Helms 1996; see the review of
Chiricos and Delone 1992). We extend this approach in several ways. First,
national time series and state-level analysis use aggregated measurements of
crime. In our analysis, we control for criminal behavior using disaggregated
data on race-education groups. Because violent crime usually involves victims
and perpetrators with similar social status, we tap crime among blacks and
whites at different levels of education with victimization data from the Na-
tional Crime Victimization Survey (NCVS). The NCVS is an annual survey
that asks people about their experiences with criminal victimization over the
past year. The data can be used to construct victimization rates—the num-
ber of victimizations divided by the population—for different offenses and
for different subgroups. (We do not disaggregate victimization rates by age
because cell counts are too small to provide accurate estimates.) Although
disaggregated victimization rates provide an indicator of crime for specific
race-education groups, they obviously do not directly measure crime by per-
petrators or homicide victimization. Direct measures of crime that include
homicide are usually taken from the aggregate crime statistics compiled by
the FBI in the Uniform Crime Reports (UCR). We also analyzed prison ad-
mission, controlling for UCR crime rates and obtained results substantively
identical to those below.
Second, research also indicates that increased imprisonment reduces crime
rates (Levitt 1996; Rosenfeld 2000). The dependence of crime rates on im-
17
prisonment may be a significant source of bias in the 1990s as crime fell
while incarceration rates increased. Past analyses of crime rates used instru-
mental variables to identify exogenous variation in imprisonment that does
not depend on the level of crime (Levitt 1996). Instead of trying to identify
exogenous variation in crime that might drive imprisonment, we fit fixed ef-
fects that capture unmeasured variables that place people at risk of criminal
behavior or incarceration. In the most detailed specifications below, we intro-
duce fixed effects for every race-age-year cell in our tabular data. Variation in
criminal offending by race, age, and year is well-established in studies of offi-
cial statistics and victimization data (e.g., Hindelang 1978, 1981; Gottfredson
and Hirschi 1990; Land, McCall, and Cohen 1990). Fixed effects—estimated
with dummy variables for all race-age-year subroups—account for all vari-
ables that vary by race, age, or year and the interactions among them. For
example, the effects of UCR homicide rates which are available annually for
blacks and whites above and below age 24 are accounted for by the fixed
effects model. We can also think of the fixed effects as tapping the crimi-
nal propensity of the population that is not fully reflected in observed crime
rates. In the early 1990s, imprisonment rates increased but crime rates held
steady leading some to argue that the population’s propensity to commit
crime had increased (Freeman 1996). We can treat this propensity as an
unobserved variable absorbed by the fixed effects.
Although the current modeling strategy tries to distinguish the effects
of crime from social control, there are certainly limitations. Treating fixed
effects as capturing only the propensity to commit crime neglects social con-
trol processes that mostly affect certain race-age groups, particularly young
black men. If drug-war policing and criminal sentencing largely affected
young black men across the educational distribution, the social control effect
18
will be captured by the fixed effects. Criminal sentencing also became more
punitive in the 1980s and 1990s and this trend will be captured by yearly
fixed effects. On the other hand, the social control component of the eco-
nomic effects is over-estimated if educational stratification in crime is not
fully controlled by the victimization data.
Despite these limitations, the current analysis introduces far more de-
tailed information about the risks of incarceration than prior research. The
utility of estimates for the effects of earnings and employment can be exam-
ined by studying their robustness to the introduction of age-race fixed effects
and victimization rates which are known to be correlated with criminal of-
fending.
Results
Before examining how labor market inequality is related to the risks of prison
admission, we use a regression analysis to describe inequality in prison admis-
sion by education (Table 4). Controlling for race, the level of violent crime,
age, and the upward linear trend in imprisonment rates, the risk of impris-
onment among the college educated is only 3% (e−3.41 ≈ .03) as high as the
the imprisonment risk among high school dropout. High school education is
also associated with a reduced risk of incarceration; as high school graduates
are only 20% (e−1.70 ≈ .18) as likely to be sent to prison as dropouts.
The remaining models in Table 4 examine whether education and racial
inequality in imprisonment changed over time. Changes in the race and edu-
cation effects is modeled with interactions with the linear time trend (Year).
The interaction effect indicates that educational inequality in incarceration
steadily increased. In 1983, prison admission rates among the college edu-
cated were only 3 percent high as those for high school dropouts. By 1999,
19
this relative risk had shrunk to just 1.8 percent. the likelihood of imprison-
ment among high school graduates relative to dropouts remained stable. In
contrast to the increase in educational inequality in imprisonment, there is
no evidence of deepening racial inequality. The race-year interaction effect is
negligibly small, showing that blacks relative risk of incarceration remained
about 7 times higher than that for whites (e1.93 ≈ 6.9), throughout the 1980s
and 1990s.
The final two columns of Table reports results separately for black and
white men. The large intercept for black men, indicates they are generally
at greater risk of imprisonment than white men. The smaller education coef-
ficients men suggests that the risk of imprisonment is less class-stratified for
blacks than white. Both groups experience increasing educational inequality
in imprisonment, as college graduates of all races were largely shielded from
the increase in incarceration risks associated with the prison boom.
Table 5 reports estimates of the effects of earnings and employment on
prison admission among young black and white and men. Column (1) of
Table 5 shows the earnings and employment effects in a model controlling
for violent crime and year-race-age fixed effects. With these fixed effects only
variation in admission rates across levels of education contributes to the esti-
mates. In this model, a hundred dollar increase in average weekly earnings—
roughly the earnings gap between dropouts and high school graduates—is
estimated to halve the risk of prison admission. A ten percent gap in employ-
ment rates—roughly equal to the dropout-graduate employment gap among
whites—is associated with a 40 percent reduction in the risk of imprisonment.
An alternative model fits fixed effects to every education-race-age cell.
This specification is similar to fixed effects effects models for panel data
(Hsiao 1985, ch. 3) in which only longitudinal variation contributes to the
20
analysis. In this model, only the earnings effect is significant. The estimates
indicates that a one hundred dollar increase in weekly earnings between 1983
and 199 was associated with a 30 percent reduction in the risk of imprison-
ment. The earnings of black high school graduates declined by about fifteen
dollars between 1983 to 1999, increasing the risk of prison admission by an
estimated 5 percent.
The regression analysis can be extended by studying how the effects of
employment and earnings on imprisonment might differ for blacks and whites,
and over time (Table 5). A test for racial heterogeneity is motivated by claims
that the period of mass incarceration had unusually severe effects on young
low-skill black men (Tonry 1995; Duster 1997; Wacquant 2000). Regres-
sion analysis for whites indicates that the risk of imprisonment is associated
only with earnings, not employment. Because employment among whites is
not steeply stratified by education, nearly all the variation in prison admis-
sions is accounted for by variation in earnings. The risk of prison admission
among blacks, however, is sensitive to both employment and earnings. This
suggests that the growth in incarceration is tied as closely to declining em-
ployment among non-college black men through the 1980s and 1990s as it is
to the growth in U.S. income inequality. This result is consistent with other
research suggesting that the idleness of low-skill black men in poor urban
neighborhoods exposes them to greater scrutiny from police and heightens
perceptions of dangerousness in the courts (Chambliss 2000; Steffensmeier
et al. 1998). The estimated employment effect for black men suggests that
the 3 percent decline in employment among black dropouts between 1983
and 1999 was associated with a 4 percent drop in the risk of imprisonment.
The fifteen dollar fall in earnings among black high school graduates over the
same period is estimated to increase prison admission by a similar amount.
21
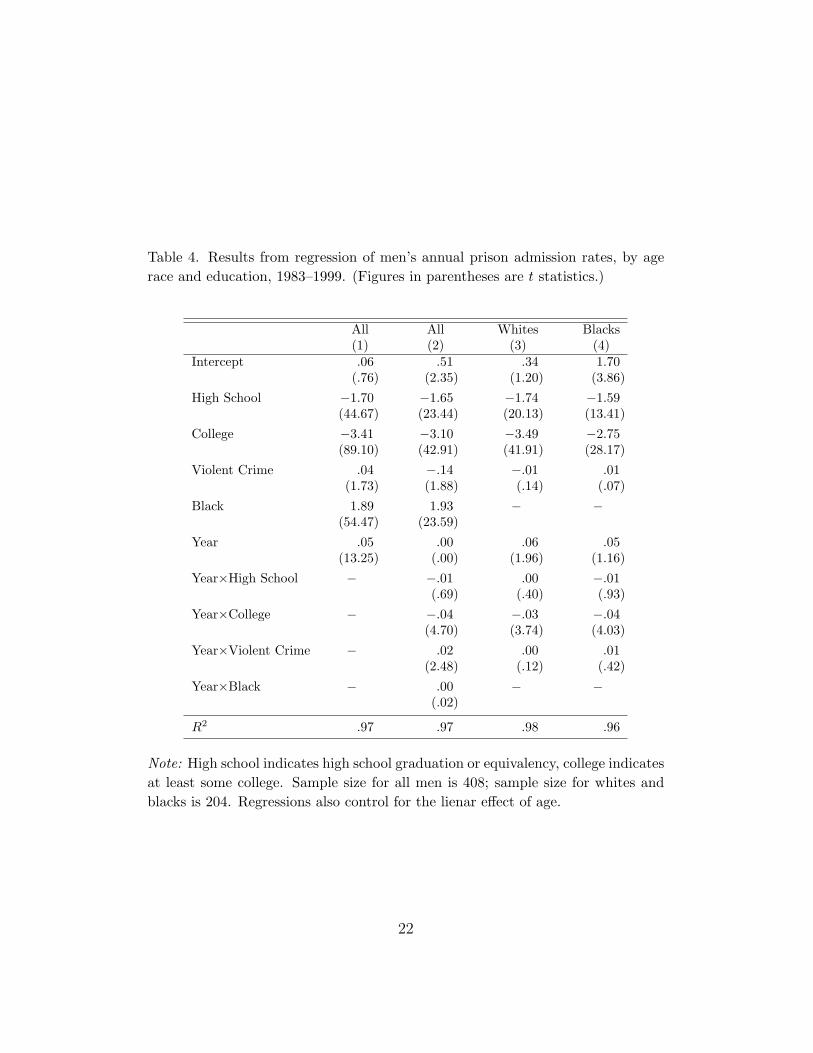
Table 4. Results from regression of men’s annual prison admission rates, by agerace and education, 1983–1999. (Figures in parentheses are t statistics.)
All All Whites Blacks(1) (2) (3) (4)
Intercept .06 .51 .34 1.70(.76) (2.35) (1.20) (3.86)
High School −1.70 −1.65 −1.74 −1.59(44.67) (23.44) (20.13) (13.41)
College −3.41 −3.10 −3.49 −2.75(89.10) (42.91) (41.91) (28.17)
Violent Crime .04 −.14 −.01 .01(1.73) (1.88) (.14) (.07)
Black 1.89 1.93 − −(54.47) (23.59)
Year .05 .00 .06 .05(13.25) (.00) (1.96) (1.16)
Year×High School − −.01 .00 −.01(.69) (.40) (.93)
Year×College − −.04 −.03 −.04(4.70) (3.74) (4.03)
Year×Violent Crime − .02 .00 .01(2.48) (.12) (.42)
Year×Black − .00 − −(.02)
R2 .97 .97 .98 .96
Note: High school indicates high school graduation or equivalency, college indicatesat least some college. Sample size for all men is 408; sample size for whites andblacks is 204. Regressions also control for the lienar effect of age.
22
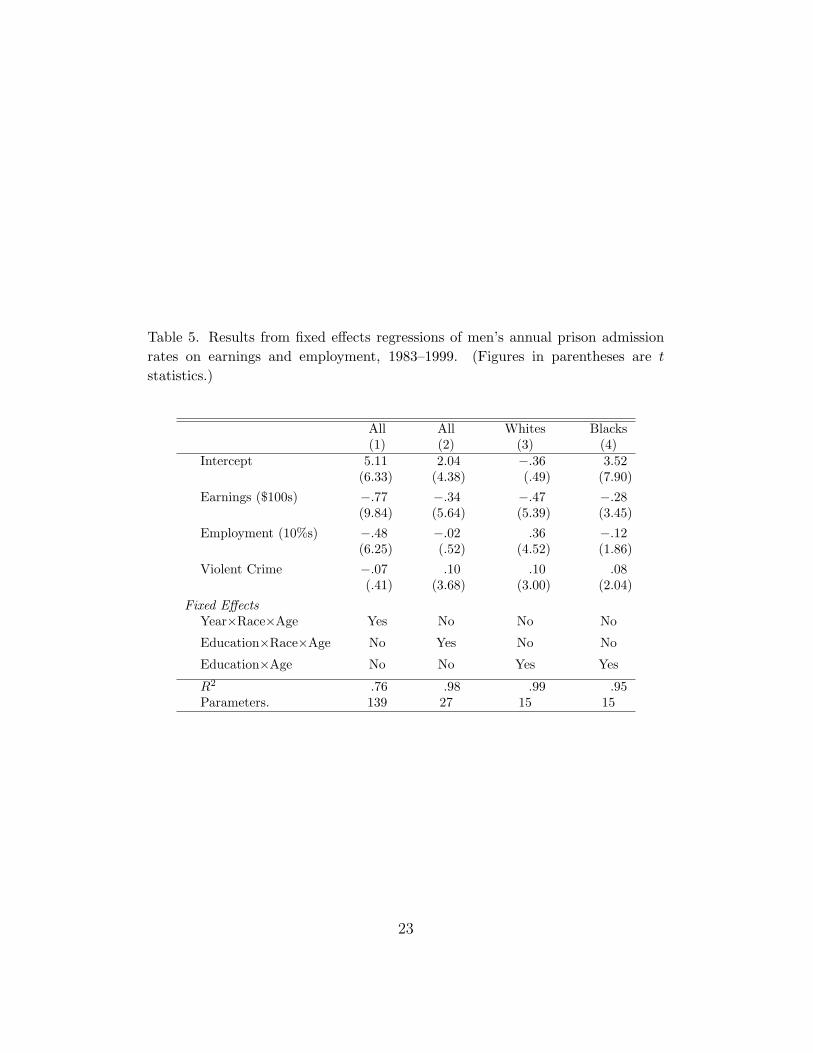
Table 5. Results from fixed effects regressions of men’s annual prison admissionrates on earnings and employment, 1983–1999. (Figures in parentheses are t
statistics.)
All All Whites Blacks(1) (2) (3) (4)
Intercept 5.11 2.04 −.36 3.52(6.33) (4.38) (.49) (7.90)
Earnings ($100s) −.77 −.34 −.47 −.28(9.84) (5.64) (5.39) (3.45)
Employment (10%s) −.48 −.02 .36 −.12(6.25) (.52) (4.52) (1.86)
Violent Crime −.07 .10 .10 .08(.41) (3.68) (3.00) (2.04)
Fixed EffectsYear×Race×Age Yes No No No
Education×Race×Age No Yes No No
Education×Age No No Yes Yes
R2 .76 .98 .99 .95Parameters. 139 27 15 15
23
How might trends in prison admission be changed if inequality in earnings
and employment had not increased? We address this question by comparing
predicted levels of prison admissions for the period 1995 to 1999 under two
scenarios. In the first, we predict admissions using the observed levels of
employment and earnings. In the second, we fix employment and earnings at
the average level for the 1983 to 1987 period. To predict prison admissions
under our two scenarios we use estimates from the fixed effects models (3)
and (4), for whites and blacks, in Table 5. Because earnings and employment
inequality increased from the 1980s to the 1990s, and earnings and employ-
ment deteriorated for low-skill men, we expect that imprisonment rates would
be significantly lower in 1980s labor market conditions persisted through the
1990s.
The observed levels of employment and earnings reproduce the observed
patterns of educational and racial inequality in imprisonment. Among blacks
and whites, high school dropouts are more than 10 times as likely to go to
prison than men with some college education. Black men are 7 to 8 times
more likely to go the prison than white men. If earnings and employment were
fixed at their 1980s level, the estimates indicate that prison admission rates
would be between 10 and 20 percent lower by the late 1990s. The estimated
reduction in admision rates is largest among low-education whites. These
results are driven largely by the decline in real earnings among non-college
white men. If weekly earnings among young white high school dropouts
had retained their value, prison admission rates by the end of the 1990s are
estimated to be 23 percent than the observed levels. The effects of wage and
employment trends are estimated to be smaller non-college black men. If
earnings and employment levels for young black dropouts remained at 1980s
levels through the 1990s, the model estimates indicate that prison admission
24
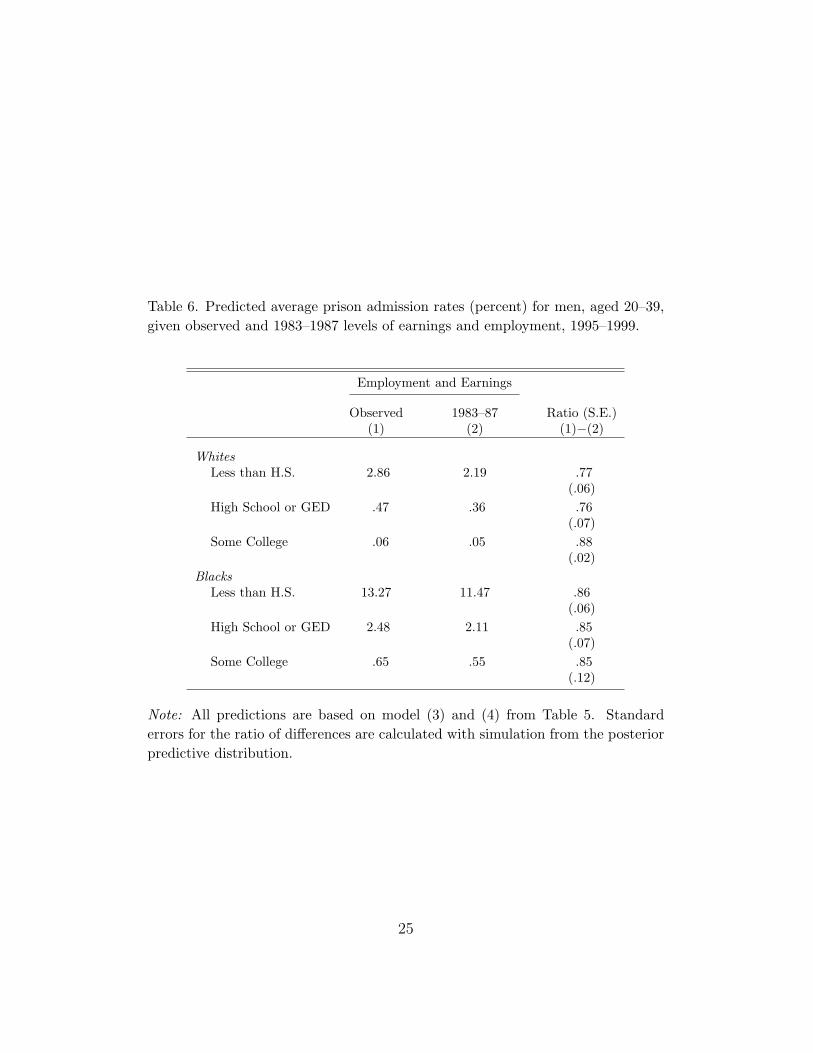
Table 6. Predicted average prison admission rates (percent) for men, aged 20–39,given observed and 1983–1987 levels of earnings and employment, 1995–1999.
Employment and Earnings
Observed 1983–87 Ratio (S.E.)(1) (2) (1)−(2)
WhitesLess than H.S. 2.86 2.19 .77
(.06)High School or GED .47 .36 .76
(.07)Some College .06 .05 .88
(.02)Blacks
Less than H.S. 13.27 11.47 .86(.06)
High School or GED 2.48 2.11 .85(.07)
Some College .65 .55 .85(.12)
Note: All predictions are based on model (3) and (4) from Table 5. Standarderrors for the ratio of differences are calculated with simulation from the posteriorpredictive distribution.
25
rates would have fallen from their observed level of 13.3 to 11.5 percent. The
change in admission rates is estimated to be nearly identical for black high
school graduates.
Discussion
A large research literature claims that high levels of economic inequality
intensify criminal justice punishment. In some accounts, the rising poverty
that accompanies growing inequality raises crime rates and, ultimately, the
scale of imprisonment. An alternative theory links the growing income gap
to increasing anxiety among the rich about threats to social order posed by
the poor. A punitive trend in criminal justice policy results and those at the
bottom of the social ladder are drawn into the penal system as a consequence.
Despite these claims, empirical research unevenly supported a link between
economic inequality and imprisonment. We trace weak empirical support for
the inequality hypothesis to weaknesses in research design. Although theory
expects rising economic disadvantage among low-education men to increase
imprisonment rates, previous research focused on the association between
aggregate inequality statistics and incarceration rates.
Our analysis presented a disaggregated analysis in which the earnings
and employment of men at different ages, races, and levels of education were
linked to their risk of imprisonment. These detailed admission rates showed
that incarceration had become extremely common at the end of the 1990s
among men with little schooling. About 16 percent of black male dropouts,
aged 20 to 40, were estimated to enter prison each year by 1999. Regression
analysis of detailed admission rates found that imprisonment risks shifted
across levels of education, not across age or race groups. Most of the growth
in the risks of incarceration were concentrated among men, particularly black
26
men, with less than college education. These men suffered the largest losses
in earnings and employment and experienced the largest growth in imprison-
ment rates. We thus found that weekly earnings and employment rates were
srongly negatively related to prison admission for young black men. The
empirical analysis suggests that if levels of economic inequality that were ob-
served in the mid-1980s prevailed through the 1990s, prison admission rates
among non-college black and white men would be reduced by between 10
and 20 percent.
Was the growth in incarceration due chiefly to changes in the criminal
justice regime, or to increasing crime among low-education men? Supporting
the social control account of imprisonment, these results were robust to fixed
effects and victimization rates intended to control for variation in criminal-
ity across the population. The economic effects were largely unchanged by
the inclusion of these crime effects. Of course, crime rates may vary across
levels of education in ways not captured by our models. Still, the race and
year effects also tap social control processes that are correlated with earn-
ings and employment. Social control efforts fluctuate with cyclical shifts
in unemployment (Chiricos and Delone 1982) and criminal sentencing in-
creasingly resorted to imprisonment as real wages fell through the 1980s and
1990s. African Americans are at relatively high risk of incarceration even
controlling for criminal offending (Blumstein 1993). Over-estimates of the
social-control component of economic effects are offset to some degree by bi-
ases in the model for crime in the population. Given these offsetting biases,
social control efforts thus seem the likely source for the economic effects.
Controlling for crime across levels of education, also helps counter the con-
cern that these results reflect the changing effects of selection as educational
attainment increases. With increased levels of schooling in the population,
27
dropouts in the late 1990s may be more crime prone than dropouts in early
1980s. If changes in selectivity contributes to educational inequality in im-
prisonment we would also expect to observe increasing imprisonment rates
among the college-educated who account for a larger proportion of the pop-
ulation in the late 1990s than the early 1980s. There is no evidence for this
effect, however. Indeed a striking feature of the prison admission trends is
the stability of imprisonment rates among the college-educated.
Finally, this analysis has shown that rising economic inequality is not
only associated with higher rates of imprisonment, it is also associated with
increasing inequality in imprisonment. The growth in economic inequality
was accompanied by the emergence of two kinds of collective experience: one
among college-educated whites who were largely unaffected by the prison
boom, the other among non-college blacks, for whom imprisonment became
a common life event. Because the official status of criminality imparted by a
prison record affects a variety of life chances and citizenship rights, and im-
prisonment is increasingly concentrated at the margins of economic life, the
prison boom reinforces lines of social disadvantage. More than just a social
control institution, the prison contributes to the formation of low-education
black men as a discrete social group, with a distinctive life experience that
is different from the mainstream. From this perspective, the progressive nor-
malization of incarceration among poor black men represents an expansion,
rather than just a by-product, of the new American inequality.
28
Appendix: Constructing the Data.
Prison Admission Rates The prison admission rate is defined as the num-ber of people annually entering the custody of state or federal prison as apercentage of the noninstitutional civilian and military population. AnnualAge-race-education cell proportions were calculated from the NCRP. Thesecell proportions were then multiplied by aggregate counts of male admissionsobtained from the National Prisoner Statistics Series (NPS-1) of the Bureauof Justice Statistics. The NCRP data yield similar age-race distributions tothe Survey of Inmates of State and Federal Correctional Facilities. However,levels of schooling in the NCRP tended to be lower than in the inmate survey.The denominator of the admission rate—the population at risk of going toprison—was calculated from the Outgoing Rotation Groups files of the CPS,and counts of military personnel obtained from the Department of Defense.
Earnings Earnings is measured annually by the median weekly earningsof each age-race-education cell for all male workers, deflated by the CPI-U.Earnings are earnings-weighted figures from the Outgoing Rotation Groupfiles of the CPS. Additional analysis examined earnings for full-time full-yearworkers, and measures of earnings relative to different percentiles of the earn-ings distribution, but these alternative specifications yield results identicalto those reported in the paper.
Employment Employment is measured by the employment to populationratio of each age-race-education cell for the male noninstitutional and civil-ian and military population. Employment rates are calculated from survey-weighted data in the Outgoing Rotation Group files of the CPS and countsof military personnel from the Department of Defense.
Violent Crime Violent crime is measured by the total number of personalcrimes suffered as a proportion of the civilian noninstitutional population.The number of criminal victimizations is given by the incident-based files ofNational Crime Victimization Survey (1983–1999). Victimizations are cal-culated separately for blacks and whites, aged 20–50, at different levels ofeducation. Denominators for the victimization rates were taken from theOutgoing Rotation Groups files of the CPS.
29
References
Albonetti Celesta A. 1991. “An Integration of Theories to Explain JudicialDiscretion.” Social Problems 38::247–66.
Anderson, Elijah. 1999. Code of the street: Decency, Violence, and the MoralLife of the Inner City. New York: W.W Norton.
Beckett, Katherine and Bruce Western. 2001. “Governing Social Marginal-ity: Welfare, Incarceration and the Transformation of State Policy.”Pp. 35–50 in Mass Imprisonment: Social Causes and Consequences,edited by David Garland. London: Sage Publications.
Bernhardt, Annette, Mark Handcock, Martina Morris and Mark Scott. 2001.Divergent Paths. New York: Russell Sage Foundation.
Blumstein, Alfred. 1993. “Racial Disproportionality in the U.S. Prison Pop-ulation Revisited.” University of Colorado Law Review 64:743-60.
Blumstein, Alfred and Allen J. Beck. 1999. “Population Growth in U.S.Prisons, 1980-1996.” Pp. 17-62 in Crime and Justice: Prisons vol. 26,edited by Michael Tonry and Joan Petersilia. Chicago: University ofChicago Press.
Box, Steven and Chris Hale. 1982. “Economic Crisis and the Rising PrisonPopulation in England and Wales.” Crime and Social Justice 17:20–35.
Bourgois, Philipe. 1995. In Search of Respect: Selling Crack in El Barrio.New York: Cambridge University Press.
Braithwaite, John. 1979. Inequality, Crime and Public Policy. London:Routledge.
Bridges, George S. and Robert D. Crutchfield. 1988. “Law, Social Standing,and Racial Disparities in Imprisonment.” Social Forces 66:699–724.
Chambliss, William. 2000. Power, Politics, and Crime. Bopulder, CO:Westview.
30
Chiricos, Theodore G. 1987. “Rates of Crime and Unemployment: An anal-ysis of Aggregate Research Evidence.” Social Problems 34:187–212.
Chiricos, Theodore G. and Miriam A. Delone. 1992. “Labor Surplus andPunishment: A Review and Assessment of Theory and Evidence.” So-cial Problems 39:421–46.
Crutchfield, Robert D. and Susan R. Pitchford. 1997. “Work and Crime:The Effects of Labor Stratification.” Social Forces 76:93–118.
D’Alessio Stewart. J, Lisa A. Stolzenberg. 2002. “A Multilevel Analysis ofthe Relationship Between Labor Surplus and Pretrial Incarceration.”Social Problems 49:178–93.
Dubber, Markus Dirk. 2001. “Policing Possession: The War on Crime andthe End of Criminal Law.” Journal of Criminal Law and Criminology91: 829–996.
Duneier, Mitchell. 1999. Sidewalk. New York: Farrar, Strauss, Giroux.
Duster, Troy. 1997. “Pattern, Purpose and Race in the Drug War: The Crisisof Credibility in Criminal Justice.” Pp. 260–87 in Crack in America:Demon Drugs and Social Justice edited by Craig Reinarman and HarryG. Levine. Berkeley: University of California Press.
Ellwood, David T. and Christopher Jencks. 2001. “The Growing Differencein Family Structure: What Do We Know? Where Do We Look forAnswers?” Unpublished manuscript. Cambridge, MA: Harvard Uni-versity.
Fowles, Richard and Mary Merva. 1996. “Wage Inequality and CriminalActivity: An Extreme Bounds Analysis for the United States, 1975–1990.” Criminology 34:163–82.
Freeman, Richard B. 1996. “Why Do So Many Young American Men Com-mit Crimes and What Might We Do About it?” Journal of EconomicPerspectives 10:22–45.
31
Garland, David. 1991. “Sociological Perspectives on Punishment.” Crimeand Justice: A Review of Research 14d:115-165.
Greenberg, David. 1977. “The Dynamics of Oscillatory Punishment Pro-cesses.” Journal of Criminal Law and Criminology 68:643–51.
Greenberg, David F. and Valerie West. 2001. “State Prison Populations andTheir Growth, 1971–1991.” Criminology 39:615–54.
Hagan, John. 1993. “The Social Embeddedness of Crime and Unemploy-ment.” Criminology 31:465–91.
Hall, Stuart. 1978. Policing the crisis: mugging, the state, and law andorder. London: Macmillan
Hindelang, Michael J. 1978. “Race and Involvement in Common Law Per-sonal Crimes.” American Sociological Review 43:93–109.
Hindelang, Michael J. 1981. “Variation in Sex-Race-Age-Specific IncidenceRates of Offending.” American Sociological Review 46:461–74.
Hsiao, Cheng. 1985. Analysis of Panel Data. New York: Cambridge.
Jacobs, David and Jason T. Carmichael. 2001. “The Politics of PunishmentAcross time and Space: A Pooled time-Series Analysis of ImprisonmentRates.” Social Forces 80:61–91.
Jacobs, David and Ronald E. Helms. 1996. “Toward a Political Model ofIncarceration: A Time-Series Examination of Multiple Explanations forPrison Admission Rates.” American Journal of Sociology 102:323–57.
Jacobs, David, and Ronald Helms. 2001. “Toward a Political Sociology ofPunishment: Politics and Changes in the Incarcerated Population.”Social-Science-Research 30:171–194.
Kluegel, James R. 1990. “Trends in Whites’ Explanations of the Black WhiteGap in SES.” American Sociological Review 55:512–25.
LaFree, Gary and Kriss A. Drass. “The Effect of Changes in IntraracialIncome Inequality and Educational Attainment on Changes in Arrest
32
Rates for African Americans and Whites, 1957 to 1990.” AmericanSociological Review 61:614–34.
Land, Kenneth C., Patricia McCall, and Lawrence E. Cohen. 1990. “Struc-tural Covariates of Homicide Rates: Are There Any Invariances AcrossTime and Space?” American Journal of Sociology 95:922–63.
Laub, John H., Daniel S. Nagin, and Robert J. Sampson. 1998. “Trajecto-ries of Change in Criminal Offending: Good Marriages and DesistanceProcess.” American Sociological Review 63:225–38.
Levitt, Steven D. 1996. “The Effect of Prison Population Size on CrimeRates: Evidence from Prison Overcrowding Litigation.” QuarterlyJournal of Economics 111:319–51.
Levitt, Steven D. 1997. “Using Electoral Cycles in Police Hiring to Estimatethe Effect of Police on Crime.” American Economic Review 87:270-90.
Liska, Allen and Paul Bellair. 1995. “Racial Composition and Crime: Con-vergence over Time.” American Journal of Sociology 101:578–610.
Melossi, Dario. 1989. “An Introduction: Fifty Years Later, Punishmentand Social Structure in Contemporary Analysis.” Contemporary Crises13:311–26.
Messner, Steven F., Lawrence Raffolovich, and Richard McMillan. 2001.“Economic Deprivation and Changes in Homicide Arrest Rates forWhite and Black Youths, 1967–1998.” Criminology 39:591–613.
Merton, Robert K. 1968. Social Structure and Social Action. Enlarged Edi-tion. New York: Free Press.
Michalowski, Raymond J. and Susan M. Carlson. 1999. “Unemployment,Imprisonment, and Social Structures of Accumulation: Historical Con-tingency in the Rusche-Kirchheimer Hypothesis.” Criminology 37:217–249.
Quinney, Richard. 1974. Criminal Justice in America: A Critical Under-standing. Boston, Little, Brown.
33
Rosenfeld, Richard. 2000. “Patterns in Adult Homicide, 1980–1995.” Pp.130–63 in The Crime Drop in America, edited by Alfred Blumstein andJoel Wallman. New York: Cambridge University Press.
Rusche, Georg. 1978 [1933]. “Labor Market and Penal Sanction.” Crimeand Justice 10:2–8.
Rusche and Kirchheimer. 2003 [1939]. Punishment and Social Structure.New Brunswick, NJ: Transaction Books.
Sampson, Robert. 1987. “Urban Black Violence: The Effect of Male Jobless-ness and Family Disruption.” American Journal of Sociology 93:348–82.
Sampson, Robert J. and John H. Laub. 1993. Crime in the Making: Path-ways and Turning Points through Life. Cambridge, MA: Harvard Uni-versity Press.
Spitzer, Steven. 1975. “Toward a Marxian Theory of Deviance.” SocialProblems 22:638–51.
Spohn, Cassia and David. Holleran. 2000. “The Imprisonment Penalty Paidby Young, Unemployed Black and Hispanic Male Offenders.” Crimi-nology 38:281-306.
Steffensmeier, Darrell, Jeffery Ulmer, and Kramer-John. 1998. “The Interac-tion of Race, Gender, and Age in Criminal Sentencing: the PunishmentCost of Being Young, Black, and Male.” Criminology 36:763-797.
Sullivan, Mercer. 1989. “Getting Paid:” Youth Crime and Work in the InnerCity. Ithaca, NY: Cornell University Press.
Tonry, Michael. 1995. Malign Neglect. New York: Oxford University Press.
Uggen, Christopher. 2000. “Work as a Turning Point in the Life Course ofCriminals: A Duration Model of Age, Employment and Recidivism.”American Sociological Review 65:529–46. Uggen, Christopher. 1999.
Venkatesh, Sudhir A. and Steven D. Levitt. 2000. “ ‘Are We a Family ora Business?’ History and Disjuncture in the Urban American Street
34
Gang.” Theory and Society 29:427–62.
Wacquant, Loıc. 2000. “The New ‘Peculiar Institution:’ On the Prison asSurrogate Ghetto.” Theoretical Criminology 4:377–89.
Western, Bruce and Becky Pettit. 1999. “Incarceration, Employment Ratesand Black-White Earnings Inequality.” Russell Sage Foundation Work-ing Paper #150.
Wilson, James Q. 1968. Varieties of Police Behavior; The Managementof Law and Order in Eight Communities. Cambridge, MA: HarvardUniversity Press, 1968.
35


![Alternative to Imprisonment- Mashhood11[1]](https://img.pdfslide.us/doc/110x75/577d296d1a28ab4e1ea6c400/alternative-to-imprisonment-mashhood111.jpg)