Embed Size (px)
Citation preview
ECONOMIC INDICATORS REPORT: POPULATION & DEMOGRAPHICS
UPDATED ANNUALLY
Current as at 30.06.2020
Presented by ECONOMY & PROSPERITY
Page 2 of 18
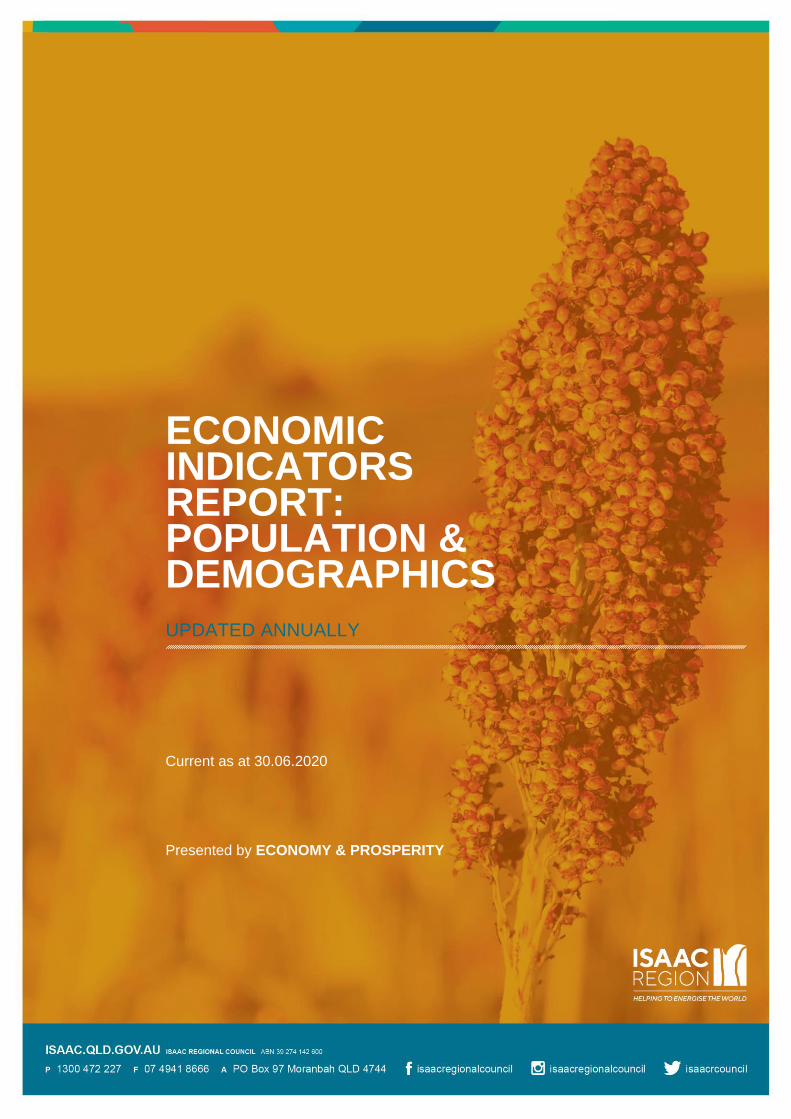
POPULATION
FIGURE 1. FTE POPULATION ESTIMATES, BOWEN BASIN LGAS AND SELECTED UCLS, JUNE 2019
Full-time equivalent population
The FTE population measure is the sum of the resident population (people who live in the area permanently) and the non-resident population (i.e. the number of non-resident workers on-shift).
The FTE population measure provides a more complete estimate of total demand for certain services and infrastructure in regions with a high incidence of FIFO/DIDO workers.
LGA/Location(s) Resident population
Non-resident population
FTE population
Banana (S)
Baralaba 245 125 370
Biloela 5,760 165 5,920
Moura 1,515 285 1,795
Other towns(c) 1,220 0 1,220
Rural areas 5,555 670 6,225
Banana (S) total 14,295 1,240 15,535
Central Highlands (R)
Blackwater 4,840 1,765 6,605
Bluff 270 265 535
Capella 980 45 1,030
Emerald 14,125 550 14,675
Springsure 845 20 870
Tieri 1.095 300 1,395
Other towns(c) 1,495 20 1,515
Rural areas 5,050 1,405 6,455
Central Highlands (R) total 28,700 4,375 33,075
Isaac (R)
Clermont 2,070 85 2,155
Dysart 2,335 1,840 4,175
Glenden 585 415 1,000
Middlemount 1,715 1,130 2,850
Moranbah 8,675 2,820 11,495
Nebo 490 325 820
Rural areas 5,065 5,510 10,575
Isaac (R) total 20,935 12,130 33,065
Whitsunday (R) (Bowen only)
Bowen 9,040 50 9,090
Collinsville 1,050 440 1,485
Other towns(c) 450 20 470
Rural areas 2,025 150 2,175
Whitsunday (R) (Bowen only) total 12,565 660 13,225
BOWEN BASIN TOTAL 76,49 18,410 94,900
Source: QGSO Bowen Basin Population Reports 2019
Page 3 of 18
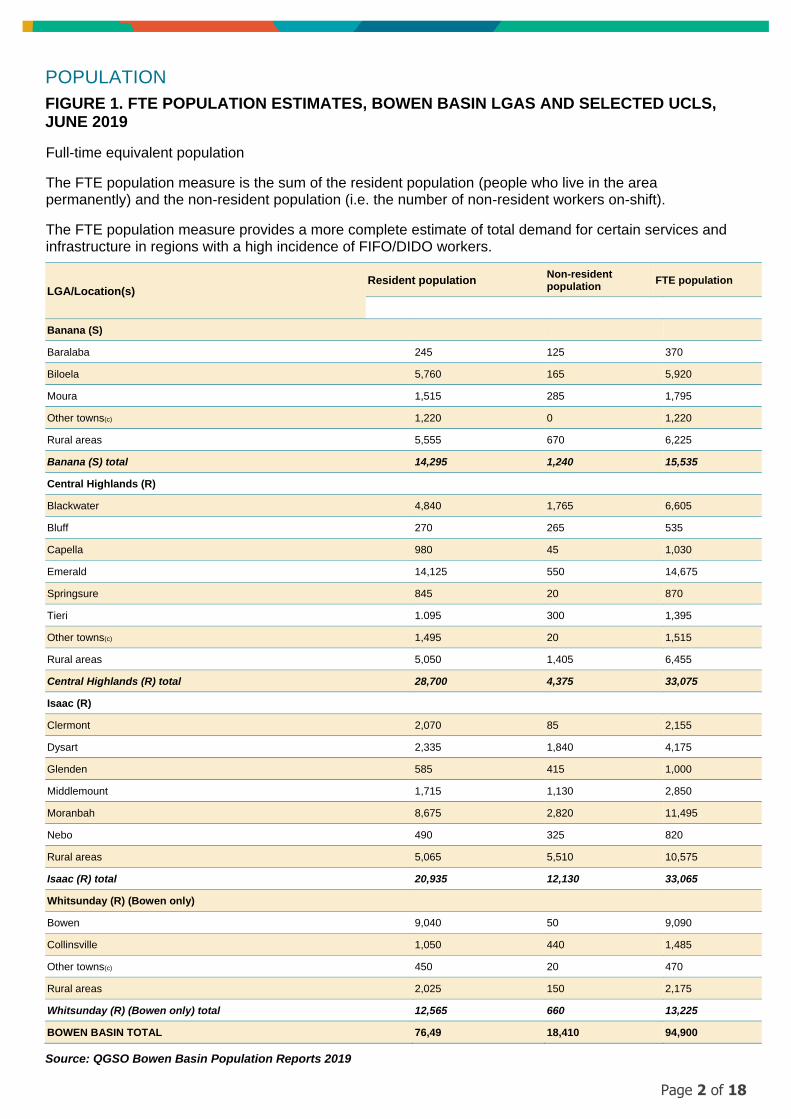
FIGURE 2. ISAAC TOTAL FTE POPULATION
The following graph depicts the total full time equivalent population for the Isaac Region from 2009-2019
IRC
Estimated Resident Population
Total Non-Resident Workers
FTE Population Estimate
2009 22,186 8,568 30,754
2010 22,590 9,900 32,490
2011 22,960 13,590 36,540
2012 23,720 17,125 40,850
2013 24,215 14,950 39,165
2014 24,755 11,085 35,845
2015 24,670 10,400 35,070
2016 24,795 9,445 34,240
2017 21,250 10,580 31,835
2018 20,990 12,075 33,070
2019 20,935 12,130 33,065
Source: QGSO Bowen Basin Population Reports 2009-2019
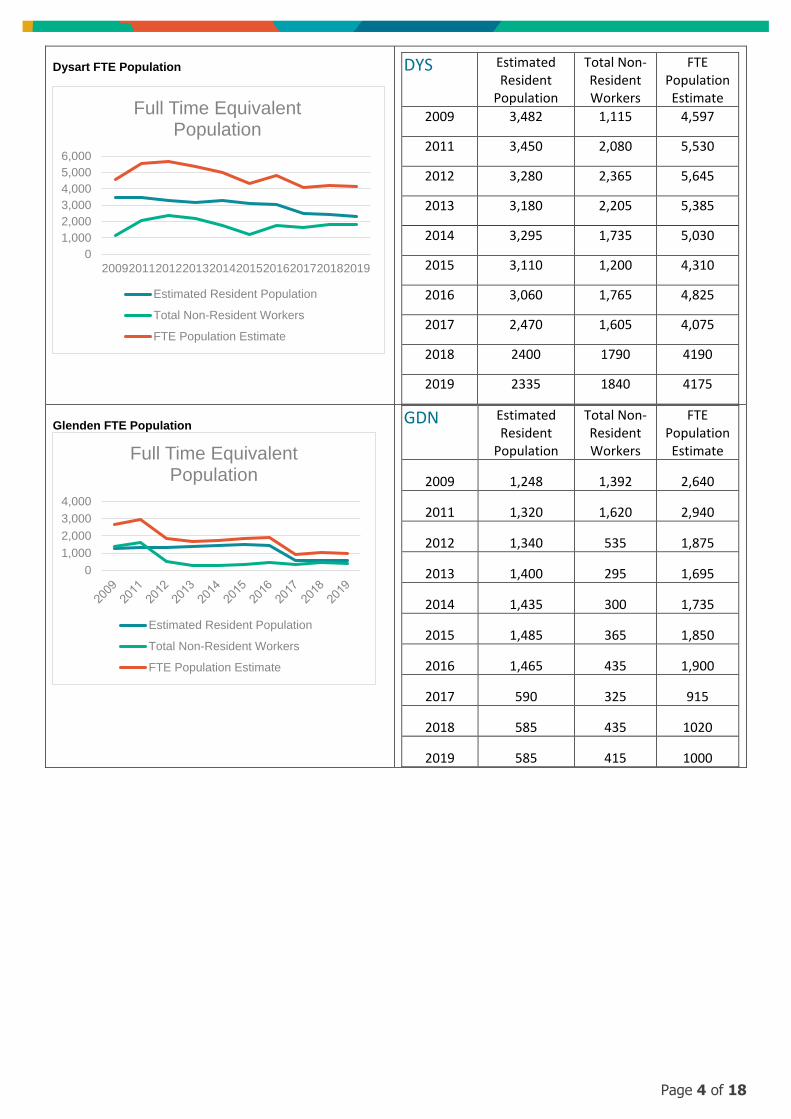
FIGURE 3. TOWN-SPECIFIC FTE POPULATION
Clermont FTE Population
CMT Estimated Resident
Population
Total Non-Resident Workers
FTE Population Estimate
2009 1953 417 2370
2011 2,000 510 2,510
2012 2,260 130 2,390
2013 2,415 60 2,470
2017 2,080 45 2,120
2018 2035 90 2125
2019 2070 85 2155
0
5,000
10,000
15,000
20,000
25,000
30,000
35,000
40,000
45,000
2009 2010 2011 2012 2013 2014 2015 2016 2017 2018 2019
Full Time Equivalent Population
Estimated Resident Population Total Non-Resident Workers
FTE Population Estimate
0
500
1000
1500
2000
2500
3000
2009 2011 2012 2013 2017 2018 2019
Full Time Equivalent Population
Estimated Resident Population
Total Non-Resident Workers
FTE Population Estimate
Page 4 of 18
Dysart FTE Population
DYS Estimated Resident
Population
Total Non-Resident Workers
FTE Population Estimate
2009 3,482 1,115 4,597
2011 3,450 2,080 5,530
2012 3,280 2,365 5,645
2013 3,180 2,205 5,385
2014 3,295 1,735 5,030
2015 3,110 1,200 4,310
2016 3,060 1,765 4,825
2017 2,470 1,605 4,075
2018 2400 1790 4190
2019 2335 1840 4175
Glenden FTE Population
GDN Estimated Resident
Population
Total Non-Resident Workers
FTE Population Estimate
2009 1,248 1,392 2,640
2011 1,320 1,620 2,940
2012 1,340 535 1,875
2013 1,400 295 1,695
2014 1,435 300 1,735
2015 1,485 365 1,850
2016 1,465 435 1,900
2017 590 325 915
2018 585 435 1020
2019 585 415 1000
0
1,000
2,000
3,000
4,000
5,000
6,000
2009201120122013201420152016201720182019
Full Time Equivalent Population
Estimated Resident Population
Total Non-Resident Workers
FTE Population Estimate
0
1,000
2,000
3,000
4,000
Full Time Equivalent Population
Estimated Resident Population
Total Non-Resident Workers
FTE Population Estimate
Page 5 of 18
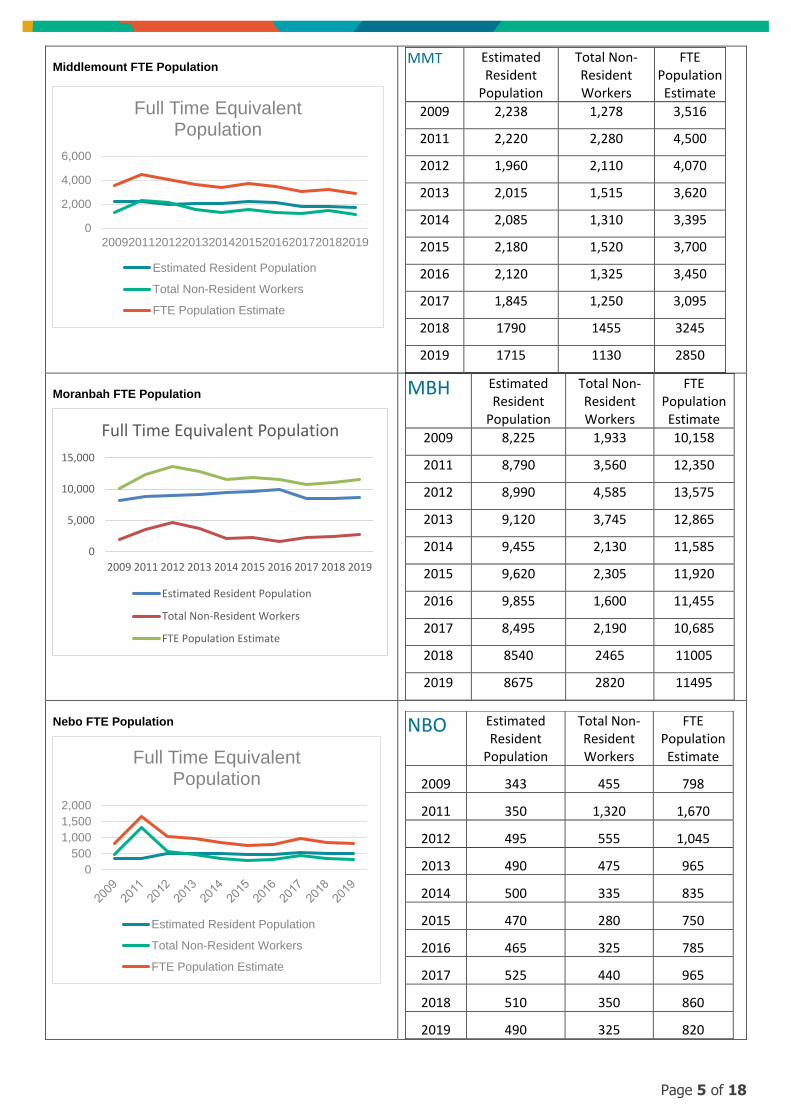
Middlemount FTE Population
MMT Estimated Resident
Population
Total Non-Resident Workers
FTE Population Estimate
2009 2,238 1,278 3,516
2011 2,220 2,280 4,500
2012 1,960 2,110 4,070
2013 2,015 1,515 3,620
2014 2,085 1,310 3,395
2015 2,180 1,520 3,700
2016 2,120 1,325 3,450
2017 1,845 1,250 3,095
2018 1790 1455 3245
2019 1715 1130 2850
Moranbah FTE Population
MBH Estimated Resident
Population
Total Non-Resident Workers
FTE Population Estimate
2009 8,225 1,933 10,158
2011 8,790 3,560 12,350
2012 8,990 4,585 13,575
2013 9,120 3,745 12,865
2014 9,455 2,130 11,585
2015 9,620 2,305 11,920
2016 9,855 1,600 11,455
2017 8,495 2,190 10,685
2018 8540 2465 11005
2019 8675 2820 11495
Nebo FTE Population
NBO Estimated Resident
Population
Total Non-Resident Workers
FTE Population Estimate
2009 343 455 798
2011 350 1,320 1,670
2012 495 555 1,045
2013 490 475 965
2014 500 335 835
2015 470 280 750
2016 465 325 785
2017 525 440 965
2018 510 350 860
2019 490 325 820
0
2,000
4,000
6,000
2009201120122013201420152016201720182019
Full Time Equivalent Population
Estimated Resident Population
Total Non-Resident Workers
FTE Population Estimate
0
5,000
10,000
15,000
2009 2011 2012 2013 2014 2015 2016 2017 2018 2019
Full Time Equivalent Population
Estimated Resident Population
Total Non-Resident Workers
FTE Population Estimate
0
500
1,000
1,500
2,000
Full Time Equivalent Population
Estimated Resident Population
Total Non-Resident Workers
FTE Population Estimate
Page 6 of 18
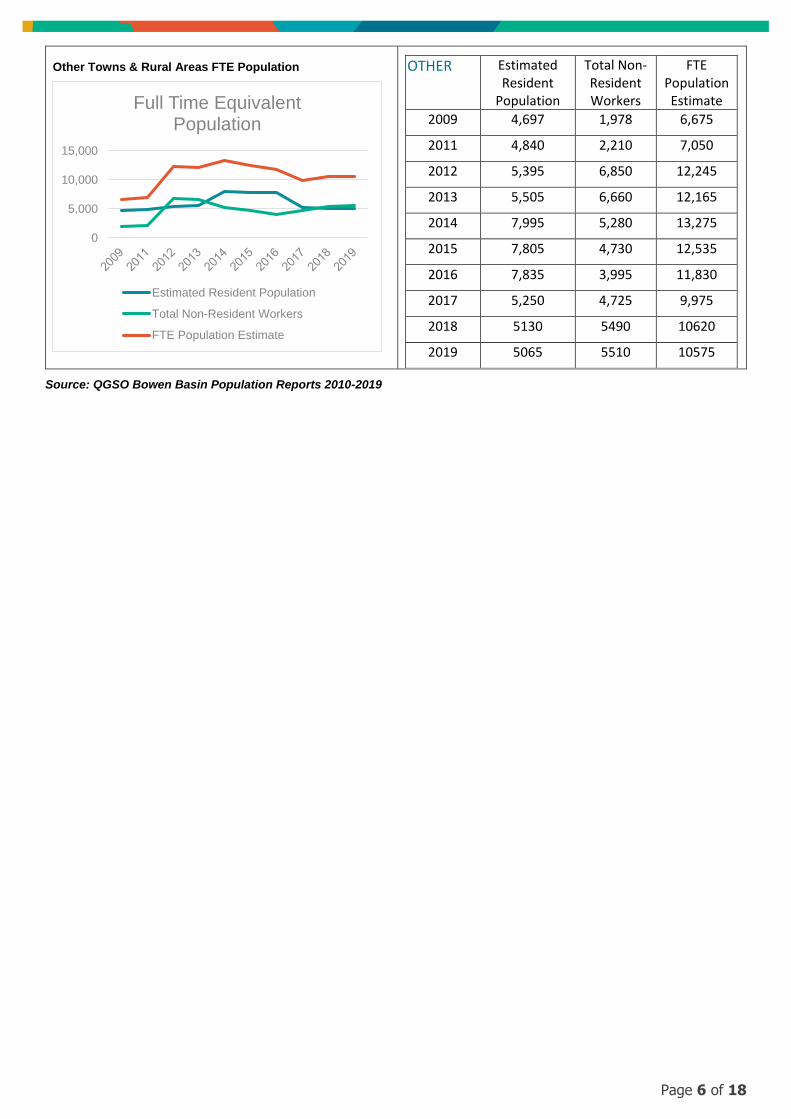
Other Towns & Rural Areas FTE Population
OTHER Estimated Resident
Population
Total Non-Resident Workers
FTE Population Estimate
2009 4,697 1,978 6,675
2011 4,840 2,210 7,050
2012 5,395 6,850 12,245
2013 5,505 6,660 12,165
2014 7,995 5,280 13,275
2015 7,805 4,730 12,535
2016 7,835 3,995 11,830
2017 5,250 4,725 9,975
2018 5130 5490 10620
2019 5065 5510 10575
Source: QGSO Bowen Basin Population Reports 2010-2019
0
5,000
10,000
15,000
Full Time Equivalent Population
Estimated Resident Population
Total Non-Resident Workers
FTE Population Estimate

Page 7 of 18
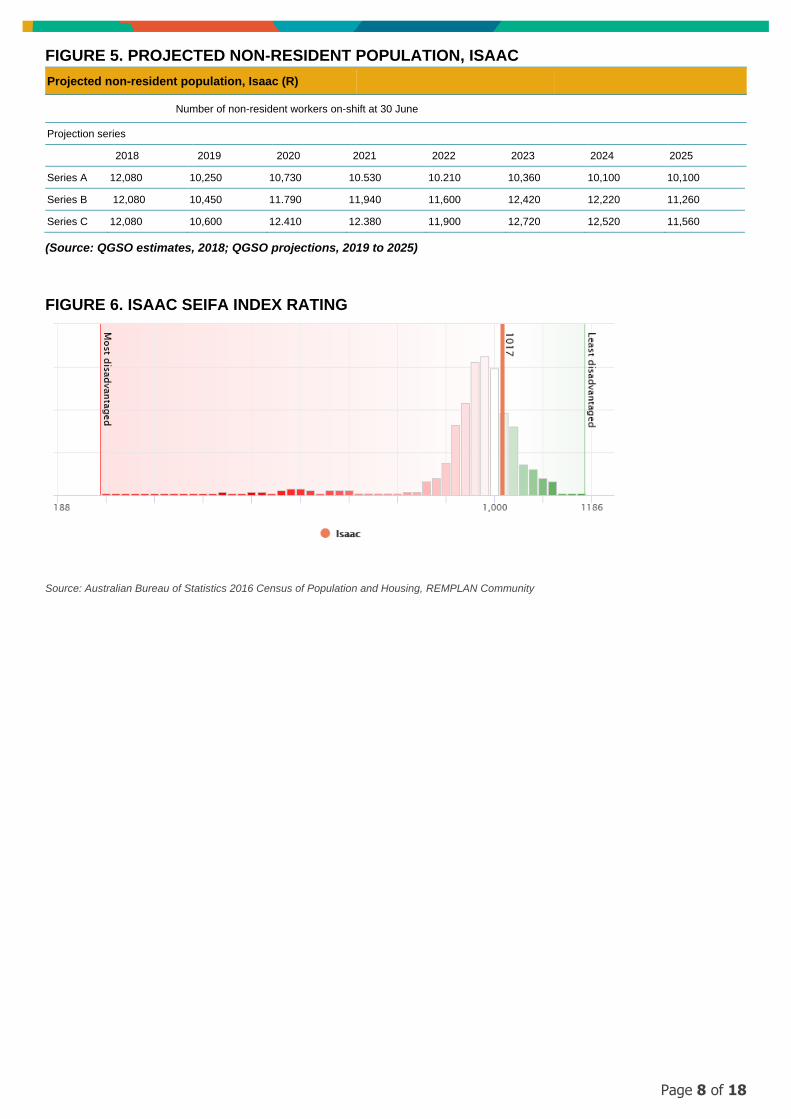
ISAAC POPULATION PROJECTION
The following projection series are presented the Isaac Region.
As at December 2018, 26 of the 43 active coal operations in the Bowen Basin were located in Isaac (R), along with four other resource operations. Isaac (R) had a non-resident population of 12,080 persons in June 2018, up from 10,580 persons in June 2017. This growth was influenced by expanded production and scheduled maintenance activities at existing mines, activity at one new mine and one reopened mine, and three projects that were under construction (QGSO, 2018).
Three projection series are presented for Isaac (R). Series A expects the non-resident population will decrease to 10,250 persons in 2019, before increasing to 10,730 persons in 2020, then declining to 10,100 persons by 2024. This series takes into account the non-resident workforces of all active resource operations, as well as workforces for the Carmichael Coal Project and Carmichael Rail Network, which have reached financial close but have yet to begin construction.
Series B projects the non-resident population of Isaac (R) will decline to 10,450 persons in 2019. It is expected to peak at 12,420 persons in 2023 before decreasing to 11,260 persons by 2025. This series factors in the construction and production workforces of two rail projects and nine coal projects, including China Stone, Ironbark No.1 and Red Hill Mining Lease Project, which have been approved but are yet to reach financial close.
The Series C projection takes account of the additional impacts of two coal projects, Moorlands and Olive Downs, that have lodged an EIS but have yet to receive approval. Under this scenario, the non-resident population of Isaac (R) will follow a similar trajectory to Series B, peaking at 12,720 persons in 2023 before falling to 11,560 persons by 2025.
FIGURE 4. PAST AND PROJECTED NON-RESIDENT POPULATION, ISAAC
Page 8 of 18
FIGURE 5. PROJECTED NON-RESIDENT POPULATION, ISAAC
Projected non-resident population, Isaac (R)
Number of non-resident workers on-shift at 30 June
Projection series
2018 2019 2020 2021 2022 2023 2024 2025
Series A 12,080 10,250 10,730 10.530 10.210 10,360 10,100 10,100
Series B 12,080 10,450 11.790 11,940 11,600 12,420 12,220 11,260
Series C 12,080 10,600 12.410 12.380 11,900 12,720 12,520 11,560
(Source: QGSO estimates, 2018; QGSO projections, 2019 to 2025)
FIGURE 6. ISAAC SEIFA INDEX RATING
Source: Australian Bureau of Statistics 2016 Census of Population and Housing, REMPLAN Community
Page 9 of 18
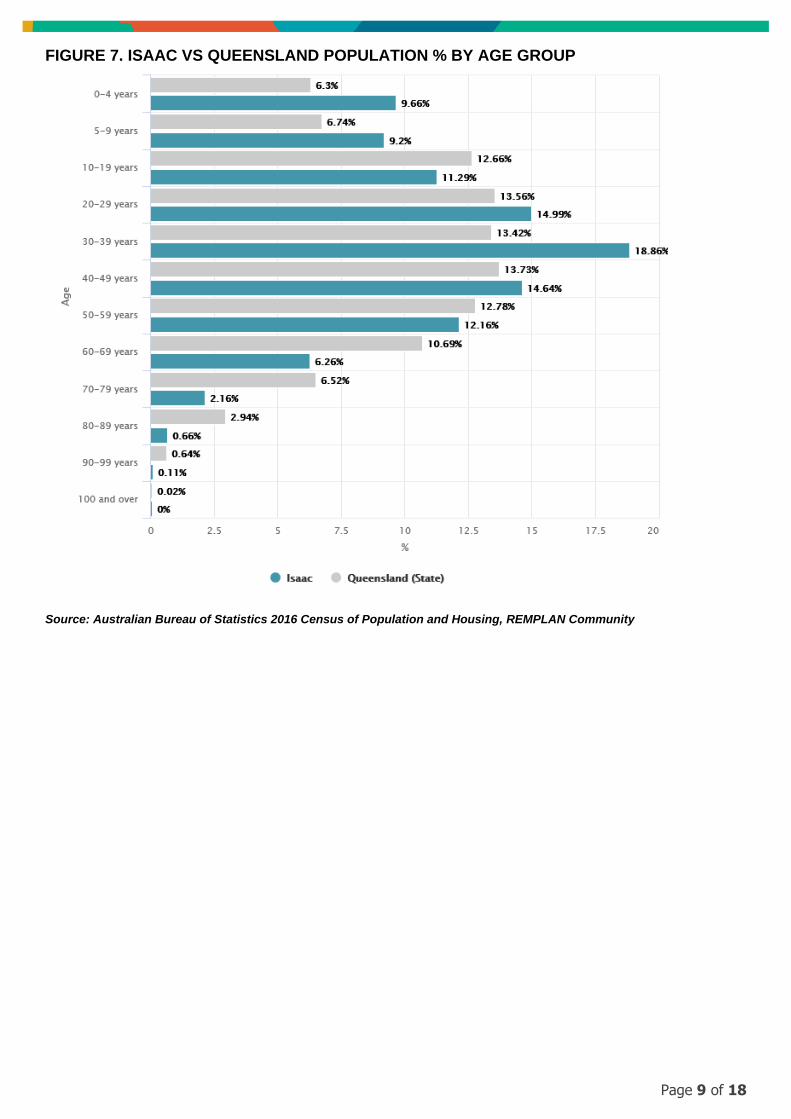
FIGURE 7. ISAAC VS QUEENSLAND POPULATION % BY AGE GROUP
Source: Australian Bureau of Statistics 2016 Census of Population and Housing, REMPLAN Community
Page 10 of 18
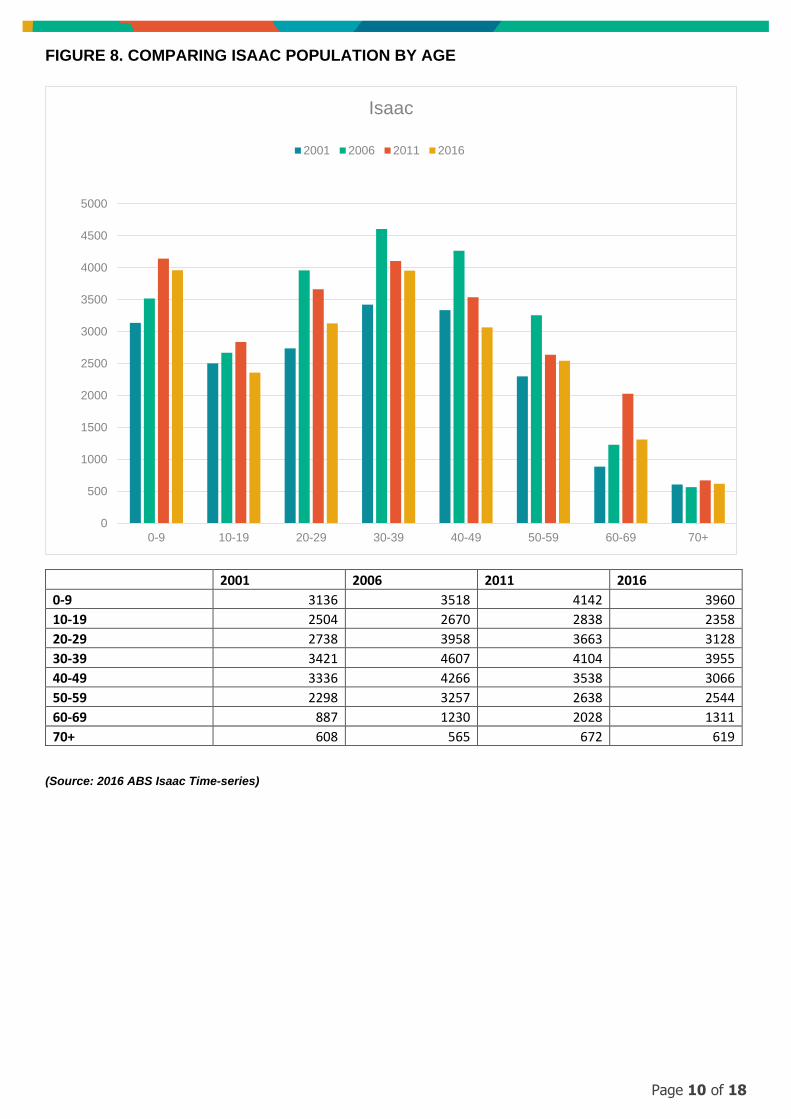
FIGURE 8. COMPARING ISAAC POPULATION BY AGE
(Source: 2016 ABS Isaac Time-series)
0
500
1000
1500
2000
2500
3000
3500
4000
4500
5000
0-9 10-19 20-29 30-39 40-49 50-59 60-69 70+
Isaac
2001 2006 2011 2016
2001 2006 2011 2016
0-9 3136 3518 4142 3960
10-19 2504 2670 2838 2358
20-29 2738 3958 3663 3128
30-39 3421 4607 4104 3955
40-49 3336 4266 3538 3066
50-59 2298 3257 2638 2544
60-69 887 1230 2028 1311
70+ 608 565 672 619
Page 11 of 18
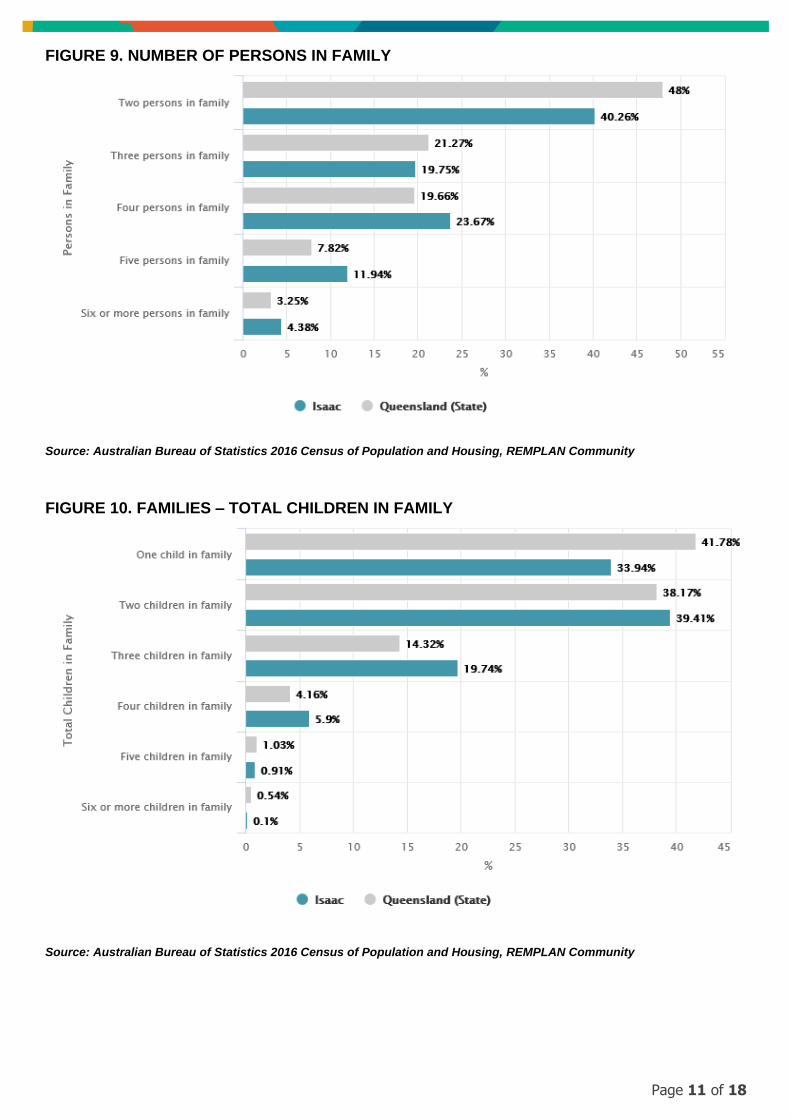
FIGURE 9. NUMBER OF PERSONS IN FAMILY
Source: Australian Bureau of Statistics 2016 Census of Population and Housing, REMPLAN Community
FIGURE 10. FAMILIES – TOTAL CHILDREN IN FAMILY
Source: Australian Bureau of Statistics 2016 Census of Population and Housing, REMPLAN Community
Page 12 of 18
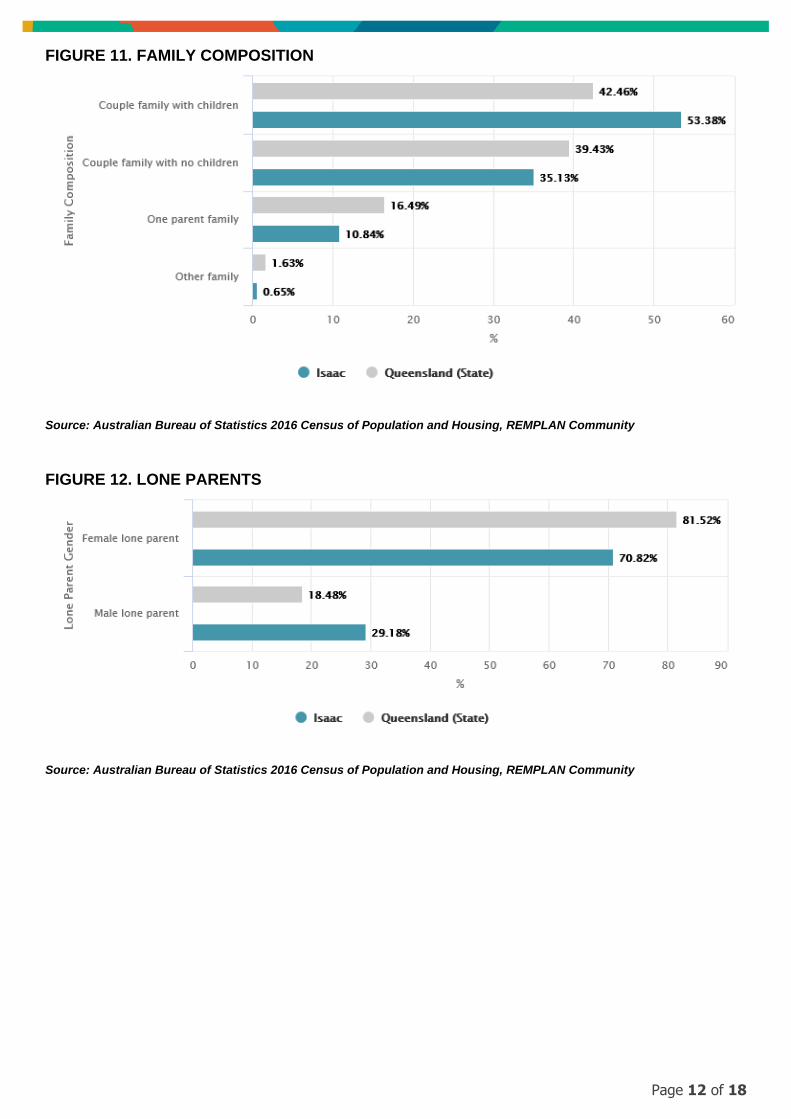
FIGURE 11. FAMILY COMPOSITION
Source: Australian Bureau of Statistics 2016 Census of Population and Housing, REMPLAN Community
FIGURE 12. LONE PARENTS
Source: Australian Bureau of Statistics 2016 Census of Population and Housing, REMPLAN Community
Page 13 of 18
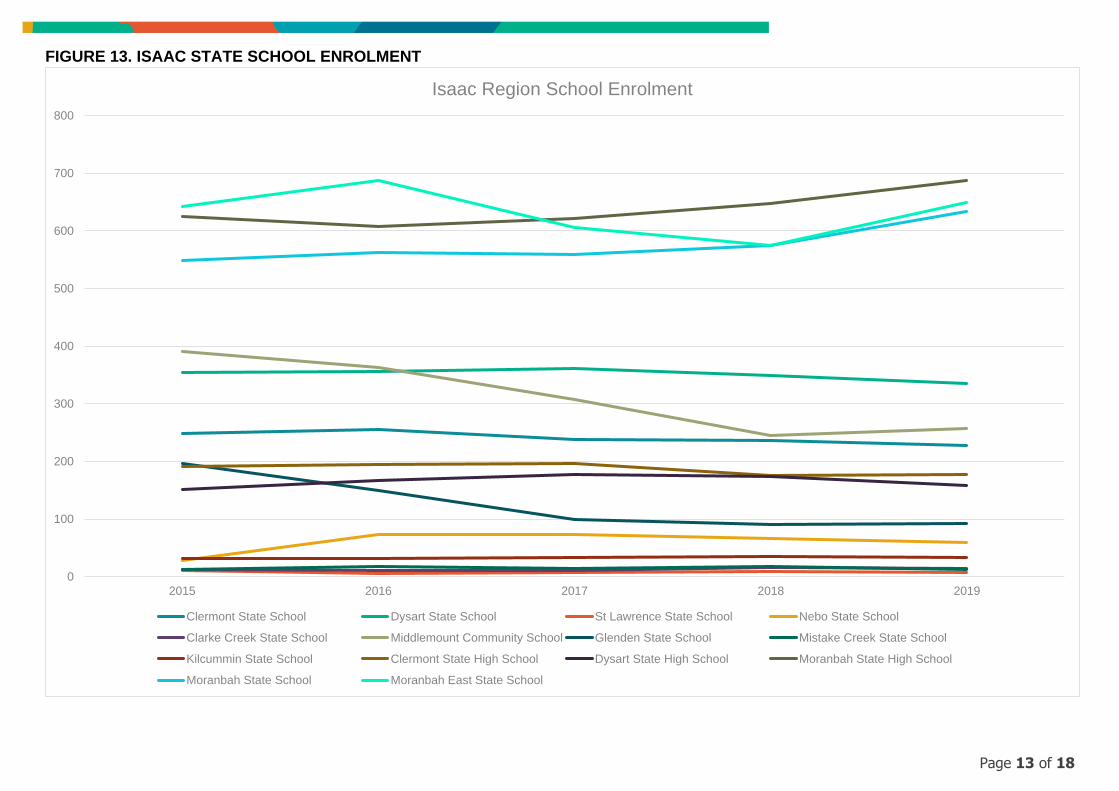
FIGURE 13. ISAAC STATE SCHOOL ENROLMENT
0
100
200
300
400
500
600
700
800
2015 2016 2017 2018 2019
Isaac Region School Enrolment
Clermont State School Dysart State School St Lawrence State School Nebo State School
Clarke Creek State School Middlemount Community School Glenden State School Mistake Creek State School
Kilcummin State School Clermont State High School Dysart State High School Moranbah State High School
Moranbah State School Moranbah East State School
Page 14 of 18
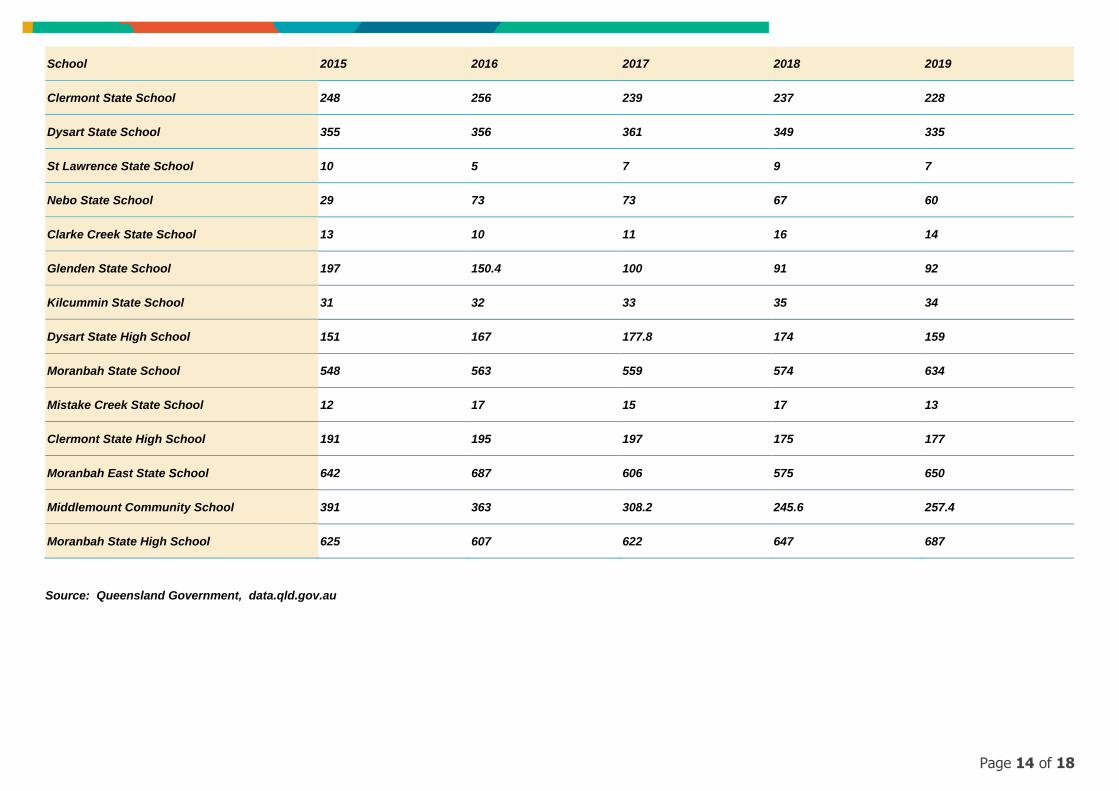
School 2015 2016 2017 2018 2019
Clermont State School 248 256 239 237 228
Dysart State School 355 356 361 349 335
St Lawrence State School 10 5 7 9 7
Nebo State School 29 73 73 67 60
Clarke Creek State School 13 10 11 16 14
Glenden State School 197 150.4 100 91 92
Kilcummin State School 31 32 33 35 34
Dysart State High School 151 167 177.8 174 159
Moranbah State School 548 563 559 574 634
Mistake Creek State School 12 17 15 17 13
Clermont State High School 191 195 197 175 177
Moranbah East State School 642 687 606 575 650
Middlemount Community School 391 363 308.2 245.6 257.4
Moranbah State High School 625 607 622 647 687
Source: Queensland Government, data.qld.gov.au

Page 15 of 18
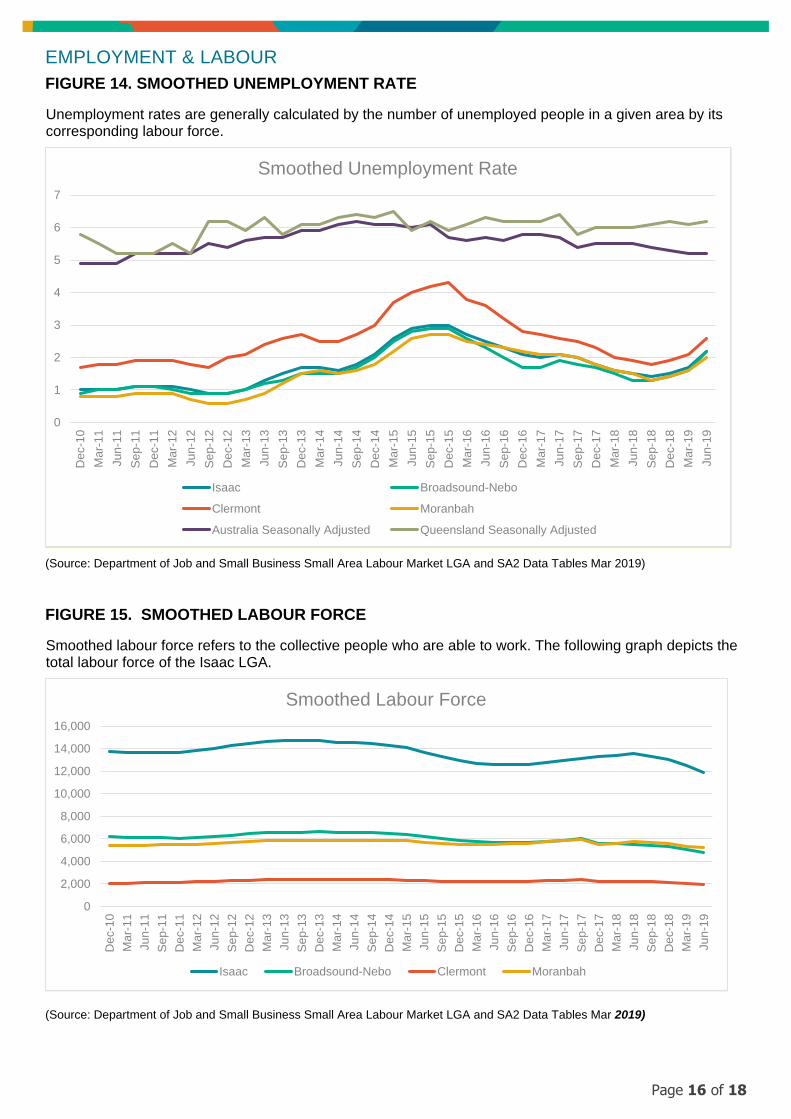
EMPLOYMENT & LABOUR
Page 16 of 18
EMPLOYMENT & LABOUR
FIGURE 14. SMOOTHED UNEMPLOYMENT RATE
Unemployment rates are generally calculated by the number of unemployed people in a given area by its corresponding labour force.
(Source: Department of Job and Small Business Small Area Labour Market LGA and SA2 Data Tables Mar 2019)
FIGURE 15. SMOOTHED LABOUR FORCE
Smoothed labour force refers to the collective people who are able to work. The following graph depicts the total labour force of the Isaac LGA.
(Source: Department of Job and Small Business Small Area Labour Market LGA and SA2 Data Tables Mar 2019)
0
1
2
3
4
5
6
7
Dec-1
0
Mar-
11
Jun-1
1
Se
p-1
1
Dec-1
1
Mar-
12
Jun-1
2
Se
p-1
2
Dec-1
2
Mar-
13
Jun-1
3
Se
p-1
3
Dec-1
3
Mar-
14
Jun-1
4
Se
p-1
4
Dec-1
4
Mar-
15
Jun-1
5
Se
p-1
5
Dec-1
5
Mar-
16
Jun-1
6
Se
p-1
6
Dec-1
6
Mar-
17
Jun-1
7
Se
p-1
7
Dec-1
7
Mar-
18
Jun-1
8
Se
p-1
8
Dec-1
8
Mar-
19
Jun-1
9
Smoothed Unemployment Rate
Isaac Broadsound-Nebo
Clermont Moranbah
Australia Seasonally Adjusted Queensland Seasonally Adjusted
0
2,000
4,000
6,000
8,000
10,000
12,000
14,000
16,000
Dec-1
0
Mar-
11
Jun-1
1
Se
p-1
1
Dec-1
1
Mar-
12
Jun-1
2
Se
p-1
2
Dec-1
2
Mar-
13
Jun-1
3
Se
p-1
3
Dec-1
3
Mar-
14
Jun-1
4
Se
p-1
4
Dec-1
4
Mar-
15
Jun-1
5
Se
p-1
5
Dec-1
5
Mar-
16
Jun-1
6
Se
p-1
6
Dec-1
6
Mar-
17
Jun-1
7
Se
p-1
7
Dec-1
7
Mar-
18
Jun-1
8
Se
p-1
8
Dec-1
8
Mar-
19
Jun-1
9Smoothed Labour Force
Isaac Broadsound-Nebo Clermont Moranbah
Page 17 of 18
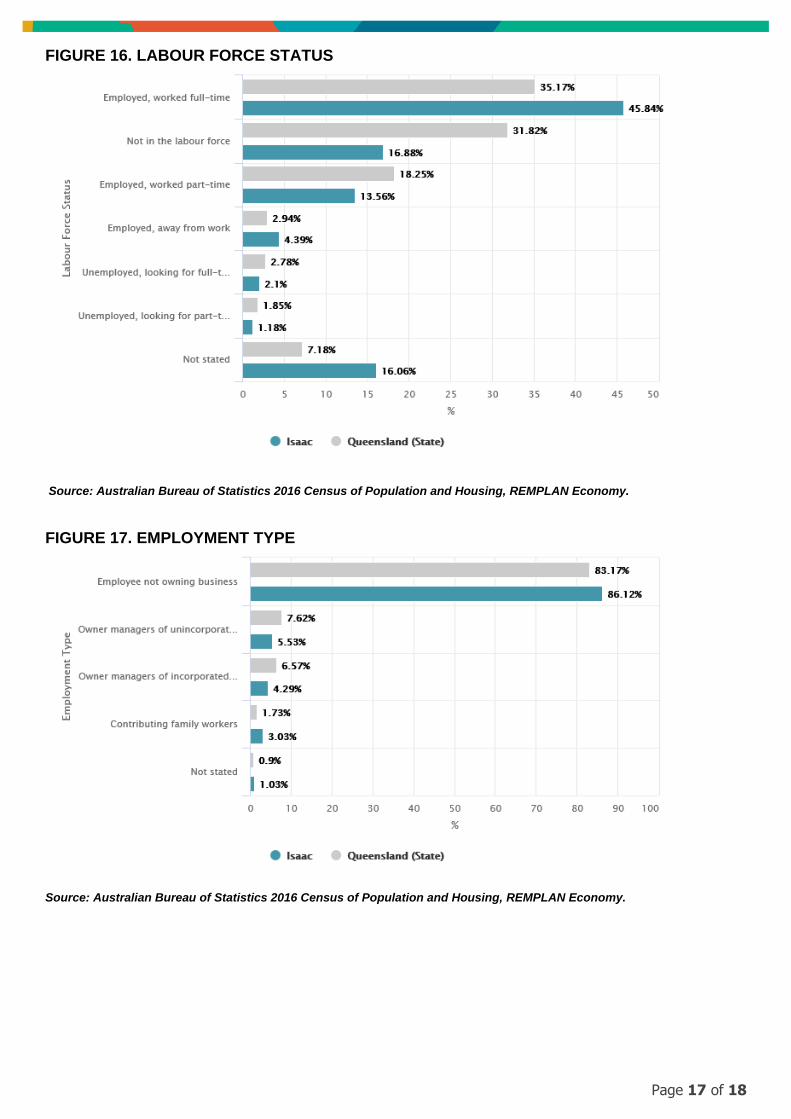
FIGURE 16. LABOUR FORCE STATUS
Source: Australian Bureau of Statistics 2016 Census of Population and Housing, REMPLAN Economy.
FIGURE 17. EMPLOYMENT TYPE
Source: Australian Bureau of Statistics 2016 Census of Population and Housing, REMPLAN Economy.
Page 18 of 18
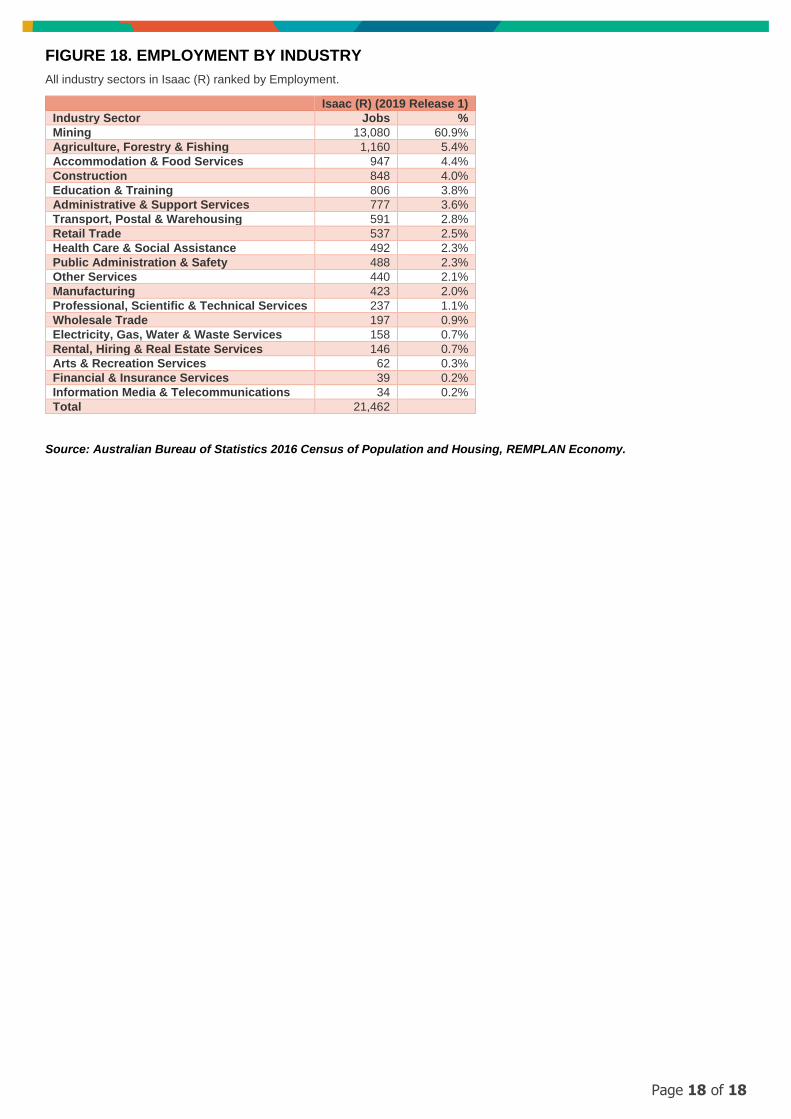
FIGURE 18. EMPLOYMENT BY INDUSTRY
All industry sectors in Isaac (R) ranked by Employment.
Isaac (R) (2019 Release 1)
Industry Sector Jobs %
Mining 13,080 60.9%
Agriculture, Forestry & Fishing 1,160 5.4%
Accommodation & Food Services 947 4.4%
Construction 848 4.0%
Education & Training 806 3.8%
Administrative & Support Services 777 3.6%
Transport, Postal & Warehousing 591 2.8%
Retail Trade 537 2.5%
Health Care & Social Assistance 492 2.3%
Public Administration & Safety 488 2.3%
Other Services 440 2.1%
Manufacturing 423 2.0%
Professional, Scientific & Technical Services 237 1.1%
Wholesale Trade 197 0.9%
Electricity, Gas, Water & Waste Services 158 0.7%
Rental, Hiring & Real Estate Services 146 0.7%
Arts & Recreation Services 62 0.3%
Financial & Insurance Services 39 0.2%
Information Media & Telecommunications 34 0.2%
Total 21,462
Source: Australian Bureau of Statistics 2016 Census of Population and Housing, REMPLAN Economy.