Embed Size (px)
Citation preview

973
Original scientific paper Economics of Agriculture 3/2017UDC: 338.3:634.1/.7(497.113)
EP 2017 (64) 3 (973-985)
ECONOMIC INDICATORS OF THE PRODUCTION OF IMPORTANT FRUIT-SPECIFIC SPECIES IN VOJVODINA
ECONOMIC INDICATORS OF THE PRODUCTION OF IMPORTANT FRUIT-SPECIFIC SPECIES IN VOJVODINA1
Mirjana Lukač Bulatović2, Veljko Vukoje3, Dušan Milić4
Summary
The paper discusses the basic economic and production results of important fruit species (apple, pear, peach, sour cherry and plum) on agricultural farms of Vojvodina. The aim of the research is to evaluate the most important parameters of cost-effectiveness of these productions, and propose measures to improve the existing situation. Comparative analysis clearly shows that the most cost-effective is pears production, followed by apple, cherry, peach and plum. Pear production gives the largest coverage margin per unit capacity (1,261,786 din /ha), which is 16.5% better than in apple production (1,083,160 din /ha), or about 7.8 times better in relation to plums production (161,796 din /ha). The highest coefficient of economy (3.19) is, also, recorded in the production of pear (for apples 2.94, cherry 2.27, peach 2.17 and plum 1.44). Further development of fruit production in Vojvodina involves raising intensive farms with quality fruit varieties, firmer vertical linking of producers and processors, ensurement of economic safety of producers in the long run, making of fruit producing regions, etc.
Key words: fruit production, success indicators, profitability, Vojvodina.
JEL: Q19
1 The work is the result of research in the framework of the project “Analysis of production and economic results of business entities in the field of agriculture and food industry of AP Vojvodina”, financed by the Provincial Secretariat for Science and Technological Development, and the research within the project TR31058, 2011-2014, supported by the Ministry of Education, Science and Technology, Republic of Serbia.
2 Mirjana Lukač Bulatović Ph.D., Associate Professor, University of Novi Sad, Faculty of Agriculture, Trg Dositeja Obradovića no. 8, 21000 Novi Sad, Serbia, Phone: +381 63 892 97 21, E-mail: [email protected]; [email protected]
3 Veljko Vukoje Ph.D., Full Professor, University of Novi Sad, Faculty of Agriculture, Trg Dositeja Obradovića no. 8, 21000 Novi Sad, Serbia, Phone: +381 63 836 77 18, E-mail: [email protected]
4 Dušan Milić Ph.D., Full Professor, University of Novi Sad, Faculty of Agriculture, Trg Dositeja Obradovića no. 8, 21000 Novi Sad, Serbia, Phone: +381 63 557 582, E-mail: [email protected]

974 EP 2017 (64) 3 (973-985)
Mirjana Lukač Bulatović, Veljko Vukoje, Dušan Milić
Introduction
The Autonomous Province of Vojvodina (APV) has favorable natural conditions for agricultural production in general, and for the fruit production as a part of it. It is a highly agricultural region of the Republic of Serbia (RS) with very important natural, human and technical and technological resources for further development of agricultural production. The important asset is about 1.65 million hectares of cultivable, high quality land, or about 0.8 ha per capita, which is significantly more than most EU countries. This land by size, structure and basic qualitative properties provides very favorable conditions for development and further improvement of the volume, structure and quality of fruit production.
However, the available potentials for agricultural production in APV have not been sufficiently exploited. The causes are related to the macroeconomic environment that can generally be assessed as being rather unfavorable for the agricultural entities in the last decades. Lack of long-term agricultural and rural development strategies, inadequate measures of protection and stimulation of agricultural production, bad credit and investment policy, lack of own working capital, limited possibilities for obtaining favorable bank loans, difficult access to foreign markets, etc., are just some of the factors that contributed to insufficiently rapid development of agricultural production.
Macroeconomic measures are key in creating preconditions for competitive fruit production. Subsidies have a positive short-term effect, especially in the first years of fruit-growing when the costs are highest and subsidies partially compensate for these costs, so that the producer, besides financial assistance, has some psychological safety in terms of production (Ćejvanović et al., 2005). Subsidies and customs rates are basic macroeconomic measures of incentives and protection of domestic production.
Fruit production can be highly profitable only if the quality of products and fruit growing technologies are in line with market demands. Plantations should be raised with high-quality and productive varieties of those fruit species, which, within the available agroecological conditions of the environment, can achieve optimum production and economic results (Vukoje, Milić, 2009, 2011). According to Keserović (2004), fruit growing is one of the most productive agricultural branches, which exceeds the productivity of others in many ways. Fruit production produces 10-15 times higher production value per hectare than in wheat or corn production. Fruit production per unit area employs about 20 times more labor than wheat production.
However, fruit production requires a much higher investment of all factors of production, especially human labor, the availability of which may appear as a limiting factor. Additionally, plantation raising takes years and requires significant financial resources, so the risks are much higher.
Apple and pear are very intensive from the point of the investment of labor and materials per unit of capacity. According to Mišić (2003), the total costs of raising one hectare of apple trees are as follows: for an extensive planting around 5,000 €; semi-intensive

975EP 2017 (64) 3 (973-985)
ECONOMIC INDICATORS OF THE PRODUCTION OF IMPORTANT FRUIT-SPECIFIC SPECIES IN VOJVODINA
planting for 8,000 € and for modern day planting, with irrigation and drainage, about 15,000 €. Milić et al. (2006) analyze the economic feasibility of investments in raising apple and pear, and find that the investment return period is about 4.4 years in apples and 3.2 years in pear production.
Milić et al. (2001) point out that in the intensive production of plums, walnuts and hazelnuts, very good economic results are achieved, with walnut and lye being more cost-effective compared to plums.
In regular plum production, at an average selling price of 30.50 din/kg and an average production of 20,000 kg/ha, the production value is 610,000 din/ha, or 5,978 €/ha. In the production of plums the total annual costs are 405,684 din/ha (3,976 €/ha). The realized profit calculated as the difference between the value of production and the total costs is 204,316 din/ha (2,002 €/ha). However, it should be noted that the purchase price of plums is very unstable, even very low in some years, which significantly reduces the realized economic effects in this production (Lukač Bulatović, 2014).
Cherry is a promising fruit species whose production is growing in the world and in Serbia also. The area of distribution of sour cherry is broad, because this fruit species does not set specific requirements in terms of ecological conditions. However, in spite of the modest requirements in terms of natural conditions, the production of cherries in Europe, even in the world, is deficient in the market (Milić et al., 2009). Among other things, the issue of harvesting and securing a significant number of workers for harvesting is continually raised.
In order to raise 1 hectare of sour cherries (land preparation costs, planting costs, care costs in the first, second and third year and the costs of raising the fence), it is necessary to invest 507,380 dinars. In the structure of the total costs of raising the sour cherry plant the highest share is the costs of land preparation with the amount of 155,700 din/ha, and a share of 30,7% in total planting costs. After comes the costs of raising the fence with the amount of 123,345 din/ha, the costs of plant care range from 47,760 to 53,440 din/ha (Milić et al., 2009).
Vukoje, Milić (2009) conducted a comparative analysis of the profitability of apple, pear and plum production. According to the same authors, the highest production value (818,250 din/ha) and the highest profit (557,194 din/ha) is realized in pear production, followed by apple, while the least profitable is production of plums. The pears production bears the highest coefficient of economy of production (3.13) and the highest profit rate (68.1%).
Material and Method
The paper discusses the basic production and economic results of important fruit production in the area of AP Vojvodina. The research includes the most common fruit varieties in Vojvodina: apple, pear, peach, cherry and plum. The main aim of the research is to provide reliable estimates of the most important parameters of profitability
976 EP 2017 (64) 3 (973-985)
Mirjana Lukač Bulatović, Veljko Vukoje, Dušan Milić
recorded in these productions, and propose certain measures to improve the existing situation.
Achievement of the set aim requires a comparative analysis of the most important parameters of success in the production of apples, pears, peaches, cherries and plums. The analysis was carried out on the basis of average analytical calculations of these productions, made on the basis of data collected from individual (family) agricultural holdings (AH) for 2015/16. The sample included eight family farms, with representative producers, mostly small and medium-sized households, with an average level of intensity of production selected. The data were collected directly on site with significant assistance from the Advisory Service of AP Vojvodina.
The average analytical calculations are primarily based on the calculation of direct variable costs, output values and coverage margins as the basic result. The coverage margin (gross margin, contribution margin, marginal outcome, net income) is the most significant indicator of business performance, primarily from the aspect of short-term decision-making process (a one-year period or one reproduction cycle in agriculture). In order to fully understand profitability additional success indicators (total costs, profit, full cost price, cost-effectiveness and profitability rate) have been identified.
The method of sensitive analysis analyzes the movement of the achieved result in relation to the change of yield and/or market prices of products by +/- 20%.
In addition, official data from the Statistical Office of the Republic of Serbia (RZS), primarily on the production area, yields and production volume of observed fruit species in the period 2014-2016, were used.
Results
Agricultural holdings (AHs) represent the dominant part of domestic agriculture, both in terms of the basic capacities they have and the value of production they generate. On the territory of APV, there are about 147,500 agricultural farms and in the whole RS about 631,000 thousand AH. Agricultural holdings generate around 77.7% of the total agricultural land of AP Vojvodina, with a pronounced tendency to increase in the last decades.
Difficulties in providing reliable data represent a very serious limiting factor in the implementation of comprehensive agroeconomic analyzes on AH. In Serbia there is no legal obligation for bookkeeping on AH, with the exception of those that are in the VAT system, which is a relatively small number of farms for now. Companies with an annual income of over 8,000,000 dinars become VAT payers and are obliged to keep accounting. In practice, this is mainly reduced to so-called “simple bookkeeping” that is primarily tailored to the needs of tax authorities for monitoring while benefits for AHs are minimal.
The problem is somewhat mitigated by the establishment of the Farm Accounting Data Network system in Serbia. In the Republic of Serbia, the FADN system is operational it

977EP 2017 (64) 3 (973-985)
ECONOMIC INDICATORS OF THE PRODUCTION OF IMPORTANT FRUIT-SPECIFIC SPECIES IN VOJVODINA
functions in practice, but is still in the introduction and learning process so that the data that this system is currently producing is preliminary or unofficial. FADN is a macro system for collecting accounting data from a representative sample of AH, which is primarily directed towards the creation of measures of agrarian policy at the EU and/or Member State level. This system primarily considers AH as a whole, while it is insufficiently engaged in individual production, which is one of its main deficiencies. As a result, FADN does not produce analytical production calculations, which are crucial for the management of AH (Vukoje et al., 2017). However, advisers who are the operational bearers of the FADN system on the field make additional efforts to compile analytical calculations for the needs of the AH that have entered the FADN research sample. It is precisely these calculations of advisers, with the direct collection of data by the authors, which are essential for the compilation of the average analytical calculations of the observed production.
Production area, yield and fruit production
Observed fruit species with average areas (in the fruitfulness) of 13,485 hectares in the period 2014-2016, participate with 83.9% in the total area under fruit in Vojvodina. Apples are in the first place, with an average area of 6,347 ha, ie an average share of 39.5% in the total productive area of APV (table 1). After apples plums occupies (18.5%), peach (9.5%) and sour cherries (9.1%), while the pear occupies an average area of 1.178 ha, or an average share of 7.3% in the total productive areas of APV.
Table 1. Capacities of important fruit species in Vojvodina on average for the period 2014 - 2016
Fruit species
Average production area
(ha) (2014-2016)
Average participation in production
area (%)
Average yields (t/ha) (2014-2016)
Average volume production (t)
(2014-2016)
Average participation
in volume production
(%) Apple 6,347 39.5 25.5 161,993 60.5Pear 1,178 7.3 13.4 15,831 5.9Cherry 1,465 9.1 10.0 14,626 5.4Plum 2,974 18.5 12.8 38,022 14.2Peach 1,521 9.5 14.4 21,857 8.2Total 13,485 83.9 / 252,329 94.2Other fruit species 1 2,579 16.1 / 15,416 5.8
TOTAL 16,064 100 / 267,745 100
Source: Author’s calculation based on official data of the Statistical Office of the Republic of Serbia (2014-2016)
In the past period fruit production in Serbia was characterized by an outdated assortment and semi-intensive and extensive plantings, low level of applied agro-technical measures, unregular and low yields, poor and uneven quality of fruits. In recent years

978 EP 2017 (64) 3 (973-985)
Mirjana Lukač Bulatović, Veljko Vukoje, Dušan Milić
intensive plantations have grown, with modern assortment and high level of production technology. Quality planting material is also produced in domestic nurseries (Nikolić et al., 2012). The number of modern refrigerators for the storage of fruits and new processing plants is continually growing (Keserović, Magazin, 2014).
The biggest changes are introduced into apple cultivation technology. The standard in apple production is rising of highly intensive plantations in a thick assembly with antifactal nets and irrigation systems, with the high quality standard production (Keserović et al., 2007). Such plantings should also be followed by a variety dictated by the market (varieties such as Golden Delicious, Red Delicious and Granny Smith). The yield per hectare in these varieties ranges from 50 to 70 tons, on average, with high investments per unit area (Milić et al., 2009).
For the period 2014-2016 in Vojvodina average yields of analyzed fruit species amounted to: 10.0 t/ha in sour cherry production, 12.8 t/ha in plum production; 13.4 t/ha in pear production, 14.4 t/ha in pear production and 25.5 t/ha in apple production.
Observed fruit species with an average annual production of 252,329 tons (2014-2016) gave 94.2% of the total fruit production in Vojvodina (table 1). The highest volume of production was generated in apples (161.993 t) and plum (38.022 t) which was 74.7% of total fruit production in APV. According to the representation in the total production they are followed by peach (8.2%), pear (5.9%) and cherry (5.4%).
Analysis of economic results
Within the cooperation between the Faculty of Agriculture in Novi Sad - Department of Economics in Agriculture and Agricultural Advisory Service of AP Vojvodina, methodology was defined and software for collecting “production and economic indicators on AH” was developed (Vukoje, Koči, 2007). The model has been actively used within the APV Advisory Service for nearly a decade for the purpose of calculating and analyzing costs and results. The calculations on which the analyzes in this paper are based have been made according to this methodology. On the basis of collected data from AH average calculations were made for the production of apples, pears, peaches, cherries and plums (table 2).
A comparative analysis of the structure of total costs shows the dominant share of labor costs, which is logical and expected in fruit production. The share of labor costs in total variable costs ranges from 22.3% in apple production to 42.7% in the production of plums. Given that these are AH that do not have permanent employees, labor costs are calculated in the net amount, which is, based on the average daily allowance for a particular type of work. Plant protection is also a very important item in the cost structure of all fruit production, and ranges from 13.9% in sour cherries to 29.5% in apples. A significant share of the costs of other materials is evident (from 8.9% in sour cherry production to 15.9% in pear production), which mainly refers to packaging. Mineral fertilizer costs account for 8.9% (pear) to 14.0% (peach) of total costs, while fuel costs ranges from 6.3% to 10.3% of total costs.
979EP 2017 (64) 3 (973-985)
ECONOMIC INDICATORS OF THE PRODUCTION OF IMPORTANT FRUIT-SPECIFIC SPECIES IN VOJVODINA
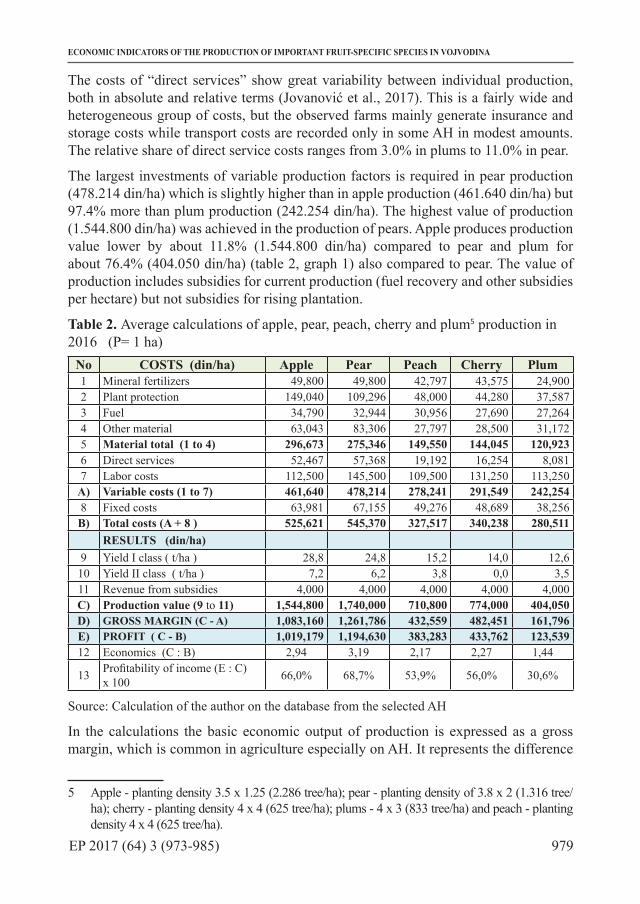
The costs of “direct services” show great variability between individual production, both in absolute and relative terms (Jovanović et al., 2017). This is a fairly wide and heterogeneous group of costs, but the observed farms mainly generate insurance and storage costs while transport costs are recorded only in some AH in modest amounts. The relative share of direct service costs ranges from 3.0% in plums to 11.0% in pear.
The largest investments of variable production factors is required in pear production (478.214 din/ha) which is slightly higher than in apple production (461.640 din/ha) but 97.4% more than plum production (242.254 din/ha). The highest value of production (1.544.800 din/ha) was achieved in the production of pears. Apple produces production value lower by about 11.8% (1.544.800 din/ha) compared to pear and plum for about 76.4% (404.050 din/ha) (table 2, graph 1) also compared to pear. The value of production includes subsidies for current production (fuel recovery and other subsidies per hectare) but not subsidies for rising plantation.
Table 2. Average calculations of apple, pear, peach, cherry and plum5 production in 2016 (P= 1 ha)
No COSTS (din/ha) Apple Pear Peach Cherry Plum1 Mineral fertilizers 49,800 49,800 42,797 43,575 24,9002 Plant protection 149,040 109,296 48,000 44,280 37,5873 Fuel 34,790 32,944 30,956 27,690 27,2644 Other material 63,043 83,306 27,797 28,500 31,1725 Material total (1 to 4) 296,673 275,346 149,550 144,045 120,9236 Direct services 52,467 57,368 19,192 16,254 8,0817 Labor costs 112,500 145,500 109,500 131,250 113,250
A) Variable costs (1 to 7) 461,640 478,214 278,241 291,549 242,2548 Fixed costs 63,981 67,155 49,276 48,689 38,256B) Total costs (A + 8 ) 525,621 545,370 327,517 340,238 280,511
RESULTS (din/ha) 9 Yield I class ( t/ha ) 28,8 24,8 15,2 14,0 12,610 Yield II class ( t/ha ) 7,2 6,2 3,8 0,0 3,511 Revenue from subsidies 4,000 4,000 4,000 4,000 4,000C) Production value (9 to 11) 1,544,800 1,740,000 710,800 774,000 404,050D) GROSS MARGIN (C - A) 1,083,160 1,261,786 432,559 482,451 161,796E) PROFIT ( C - B) 1,019,179 1,194,630 383,283 433,762 123,53912 Economics (C : B) 2,94 3,19 2,17 2,27 1,44
13 Profitability of income (E : C) x 100 66,0% 68,7% 53,9% 56,0% 30,6%
Source: Calculation of the author on the database from the selected AH
In the calculations the basic economic output of production is expressed as a gross margin, which is common in agriculture especially on AH. It represents the difference
5 Apple - planting density 3.5 x 1.25 (2.286 tree/ha); pear - planting density of 3.8 x 2 (1.316 tree/ha); cherry - planting density 4 x 4 (625 tree/ha); plums - 4 x 3 (833 tree/ha) and peach - planting density 4 x 4 (625 tree/ha).
980 EP 2017 (64) 3 (973-985)
Mirjana Lukač Bulatović, Veljko Vukoje, Dušan Milić
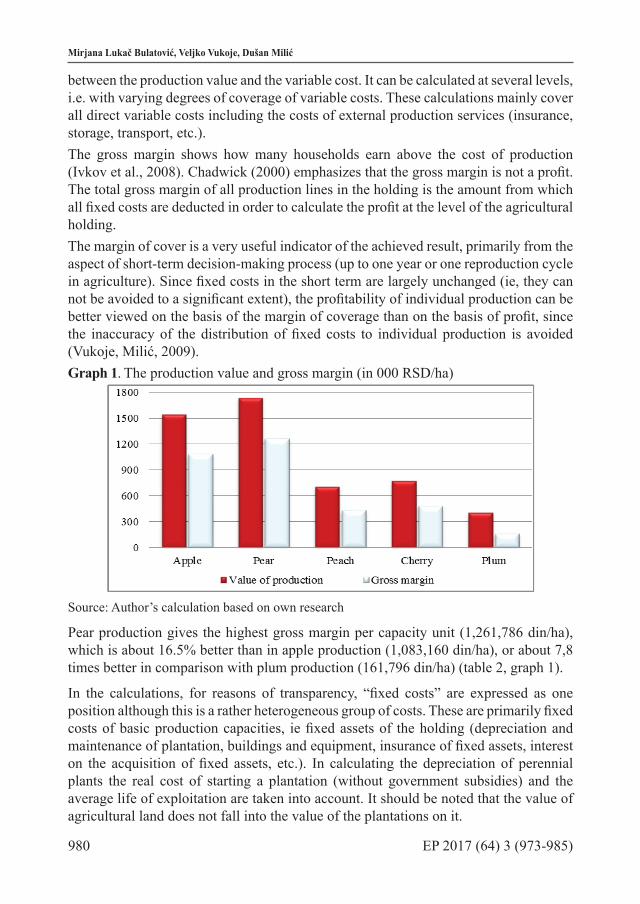
between the production value and the variable cost. It can be calculated at several levels, i.e. with varying degrees of coverage of variable costs. These calculations mainly cover all direct variable costs including the costs of external production services (insurance, storage, transport, etc.).The gross margin shows how many households earn above the cost of production (Ivkov et al., 2008). Chadwick (2000) emphasizes that the gross margin is not a profit. The total gross margin of all production lines in the holding is the amount from which all fixed costs are deducted in order to calculate the profit at the level of the agricultural holding.The margin of cover is a very useful indicator of the achieved result, primarily from the aspect of short-term decision-making process (up to one year or one reproduction cycle in agriculture). Since fixed costs in the short term are largely unchanged (ie, they can not be avoided to a significant extent), the profitability of individual production can be better viewed on the basis of the margin of coverage than on the basis of profit, since the inaccuracy of the distribution of fixed costs to individual production is avoided (Vukoje, Milić, 2009).Graph 1. The production value and gross margin (in 000 RSD/ha)
Source: Author’s calculation based on own research
Pear production gives the highest gross margin per capacity unit (1,261,786 din/ha), which is about 16.5% better than in apple production (1,083,160 din/ha), or about 7,8 times better in comparison with plum production (161,796 din/ha) (table 2, graph 1).
In the calculations, for reasons of transparency, “fixed costs” are expressed as one position although this is a rather heterogeneous group of costs. These are primarily fixed costs of basic production capacities, ie fixed assets of the holding (depreciation and maintenance of plantation, buildings and equipment, insurance of fixed assets, interest on the acquisition of fixed assets, etc.). In calculating the depreciation of perennial plants the real cost of starting a plantation (without government subsidies) and the average life of exploitation are taken into account. It should be noted that the value of agricultural land does not fall into the value of the plantations on it.

981EP 2017 (64) 3 (973-985)
ECONOMIC INDICATORS OF THE PRODUCTION OF IMPORTANT FRUIT-SPECIFIC SPECIES IN VOJVODINA
The second cost group is consists of overhead expenses of the household (electricity, water, taxes, contributions, heating, telephone, passenger car costs, commissions, fees, intellectual services, possible marketing costs, sales, etc.). These costs are calculated or distributed in proportion to the total variable costs of individual production. These costs represent a relatively significant item in the structure of total costs of individual production (12.6% -5.0%). Without their calculation, a reliable picture of the level of profitability of individual production and of the household as a whole cannot be obtained.
When fixed costs are deducted from the margin of coverage, a final net result in the form of profit and loss is obtained. This result, logically, shows a similar order of profitability of observed production as well as a margin of coverage, but there are some differences, primarily due to the different amount of direct depreciation costs. The highest net profit (1.019.179 din/ha) is also realized in pear production, which is 17.2% better compared to apple production, ie about 9.7 times better compared to plum production (table 2).
The coefficient of profitability (profitability rate, production profitability rate) falls into the group of so-called relative success indicators. Given that they are expressed as a coefficient, or a percentage, they are suitable for spatial and temporal comparison of different production, farms, etc.
The coefficient of economy shows that for each dinar of the costs involved in the production of pear, 3.19 dinars of production value is achieved, which represents a very good relationship (table 2, graph 2). A somewhat smaller but also high coefficient of economy is calculated in the production of apples (2.94). This indicator also shows the relatively high profitability of sour cherry production (2.27) and peach (2.17), ie satisfactory rate of plum production profitability (1.44). Significant differences in the level of profitability between individual productions are noticeable especially between the pear and the plum as the worst (2.21 times).
Graph 2. Coefficients of economy and profitability of income
Source: Calculation of authors based on own research

982 EP 2017 (64) 3 (973-985)
Mirjana Lukač Bulatović, Veljko Vukoje, Dušan Milić
The profit margin or profitability of the income shows the same order of profitability of the observed production as well as the economic efficiency coefficient, which is logical bearing in mind the formula under which it is calculated. In the production of pears, 68.7 RSD is earned on every 100 RSD, which is 2.25 times better than in plum production (30.6%) (table 2, graph 2).
The margin of coverage per unit of capacity (1 ha) and the economic efficiency coefficients, as the two most important indicators rank the observed production in the same way in terms of the level of their profitability. In the first place is pear production immediately behind it is an apple production with an approximate level of profitability, followed by cherry and peach, while the plum is definitely the worst. In practice, it may be that these two criteria do not match more or less in terms of the level of profitability of individual production, which requires additional indicators to be included in the analysis. In this case, such a problem does not exist.
Sensitive analysis measures the sensitivity of the results to varying the key physical and financial parameters of success. It shows the movement of the gross margin of individual production depending on the change in the yield or the selling price of the product. The exposure of individual production to this type of risk agrees with the previously shown level of profitability. Thus, in the production of plums, the financial result becomes negative in reducing yields or market prices by about 41%, while the production of pears is only lost with a decrease in yield or market prices by about 72%. There is therefore no danger of achieving a negative financial result in normal production conditions, even in the plum production as the least profitable production.
Conclusion
The results of the research show a generally high level of profitability of fruit production, but also significant differences between the types of observed production. According to all indicators the production of pears clearly stands out as the most profitable, with the largest gross margin per capacity unit (1.261.786 din/ha) and the highest economic coefficient (3.19). Apples does not lag far behind pears (gross margin 1,083,160 din/ha, economy coefficient 2,94), while plum is the least profitable (gross margin is 161,796 din/ha and the coefficient of economy 1,44).
The production of pears requires the highest investment per unit of capacity (545.370 din/ha), which is 1.9 times more than in the production of plums (280.511 din/ha). In the structure of total costs, the labor costs are dominant (from 22.3% in apple production to 42.7% in the production of plums). Also significant are the costs of plant protection (from 13.9% in cherries to 29.5% in apples), while the costs of mineral fertilizers are considerably lower, ranging from 8.9% in plums to 13.1% in peaches.
In fruit growing multiply higher amount of financial result is achieved per unit of area (ha) than in crop production. Although fruit production requires significantly higher capital and current investments per hectare, there is no dilemma that it is necessary to make constant efforts to increase fruit growing in Vojvodina. To achieve this it is

983EP 2017 (64) 3 (973-985)
ECONOMIC INDICATORS OF THE PRODUCTION OF IMPORTANT FRUIT-SPECIFIC SPECIES IN VOJVODINA
necessary to:
− raise intensive plantations, with those types and varieties of fruits which, according to the yields and quality, can provide higher return on investment;
− establish compulsory insurance of production, while developing new insurance models;
− have strong vertical connection between producers and processors of fruit, which is one of the basic assumptions of long-term supply of the processing industry with the necessary raw materials. High intensive fruit production cannot be achieved without modern industries for their processing;
− establish regions of fruit-growing production, which means the division of the RS into individual regions and, within them, sub-regions suitable for the cultivation of certain types and varieties of fruit;
− undertake a series of measures of agrarian policy in order to stabilize production and supply in the long run, and to ensure the economic safety of the producers.
Reference1. Chadwick, L. (2000): The Farm Management Handbook 2000/2001. 21st
Edition, The Scottish Agricultural College.2. Ćejvanović, F. Franić, R., Rozman, Č. (2005): Transition in Agriculture -
Review on Subsidy and Custom Rates Effects in Apple Production in Bosnia and Herzegovina, Journal of Central European Agriculture Vol. 6, No. 3, pp. 343-352.
3. Janković, S., Gos, S., Jovanović, R., Pusić, M., Todorović, G., Tolimar, N., Anđelić, B., Ivkov, I., Dalton, G. (2007): Poslovanje poljoprivrednih gazdinstava u Srbiji 2006, Institut za primenu nauke u poljoprivredi, Beogad.
4. Jovanović, D., Milenković, N., Damnjanović, R. (2017): Ocenjivanje i predviđanje potreba potrošača, Oditor, Vol. 3, No. 1, pp. 70-79.
5. Ivkov, I., Todorović S., Munćan M. (2008): Bruto marža kao značajan pokazatelj poslovanja poljoprivrednih gazdinstava, Tematski zbornik, Agroekonomska nauka i struka u tranziciji obrazovanja i agroprivrede, Poljoprivredni fakultet, Beograd, pp. 235-244.
6. Keserović, Z. (2004): Savremene tendencije u proizvodnji jabuke i kruške, Zadružni savez Vojvodine, Novi Sad.
7. Keserović, Z., Gvozdenović, D., Magazin, N., Milić, B. (2007): Integral Production of Fruits, Journal of Economics of Agriculture, Vol. 54, No. 2, pp. 149-160.
8. Keserović, Z., Magazin, N. (2014): Fruit growing in Serbia – State and Prospects. Closing Conference, Utilisation of the Census of Agriculture 2012 data in analysing status of agriculture and agricultural policy making in the Republic of Serbia, pp. 192-228.

984 EP 2017 (64) 3 (973-985)
Mirjana Lukač Bulatović, Veljko Vukoje, Dušan Milić
9. Lukač Bulatović, M. (2014): Ekonomska efikasnost proizvodnje i prerade voća, Monografija, Poljoprivredni fakultet, Novi Sad.
10. Lukač Bulatović, M., Rajić, Z., Đoković, J. (2013): Development of Fruit Production and Processing in The Republic of Serbia, Economics of Agriculture, The Balkan Scientific Association of Agrarian Economists, Vol. 60, No. 1, pp. 141 -153.
11. Milić, D., Kalanović Bulatović, B., Trmčić, S. (2009): Menadžment proizvodnje voća i grožđa, Monografija, Poljoprivredni fakultet, Novi Sad.
12. Milić, D., Lukač Bulatović, M., Kukić, Đ. (2006): Ocena ekonomske efekti vnosti podizanja zasada jabučastog voća, Časopis PTEP, Društvo za procesnu tehniku i energetiku u poljoprivredi, Vol. 10, No. 5, pp. 23-29.
13. Milić, D., Prenkić, P., Vlahović, B. (2001): Ekonomski efekti proizvodnje šljive, Tematski zbornik, Međunarodni naučni simpozijum Proizvodnja, prerada i plasman šljive i proizvoda od šljive, Koštunići, pp. 191-197.
14. Nikolić, D., Keserović, Z., Magazin, N., Paunović, S., Miletić, R.; Nikolić, M., Milivojević, J. (2012): Condition and Development Prospects of Fruit growing in Serbia, 14th Serbian Congress of Fruit and Grapevine Producers with International Participation, pp. 3-22.
15. Nott, B. S., Smith, I. (1998): Business Analysis Summary for Fruit Farmers, Michigan State University, Department of Agricultural Economics, Michigan.
16. Statistički godišnjak 2014-2016, Republičkog zavoda za statistiku, (available at: www.stat.gov.rs).
17. Vukoje, V., Koči, I. (2007): Proizvodno-ekonomski pokazatelji na poljoprivrednim gazdinstvima, poglavlje u monografiji „Sistem informacija u poljoprivrednom savetodavstvu Vojvodine”, Poljoprivredni fakultet Novi Sad, pp. 143-196.
18. Vukoje, V., Maletić, D. (2007): Sistem prikupljanja računovodstvenih podataka na poljoprivrednim gazdinstvima uzemljama EU – FADN, Agroekonomika br. 36, Poljoprivredni fakultet Novi Sad, pp. 155-162.
19. Vukoje, V., Milić, D. (2009): Ekonomski efekti u proizvodnji važnijih vrsti voćaka, Časopis Ekonomika poljoprivrede, Vol. 56, No. 3, pp. 377-387.
20. Vukoje, V., Dulić, V., Nikolić Đorić, E. (2017): Analiza proizvodno-ekonomskih rezultata poslovanja privrednih subjekata iz oblasti poljoprivrede i prehrambene industrije AP Vojvodine, Brošura, Poljoprivredni fakultet Novi Sad.

985EP 2017 (64) 3 (973-985)
ECONOMIC INDICATORS OF THE PRODUCTION OF IMPORTANT FRUIT-SPECIFIC SPECIES IN VOJVODINA
EKONOMSKI INDIKATORI PROIZVODNJE VAŽNIJIH VOĆNIH VRSTA U VOJVODINI6
Mirjana Lukač Bulatović7, Veljko Vukoje8, Dušan Milić9
Apstrakt
U radu se razmatraju osnovni proizvodno-ekonomski rezultati važnijih voćarskih proizvodnji (jabuka, kruška, breskva, višnja i šljiva) na poljoprivrednim gazdinstvima Vojvodine. Cilj istraživanja je da ocene najvažniji parametara isplativosti navedenih proizvodnjama, i predlože mere za poboljšanje postojećeg stanja. Komparativna analiza jasno pokazuje da je najisplativija prizvodnja kruške, a potom slede jabuka, višnja, breskva i šljiva. Proizvodnja kruške odbacuje najveću maržu pokrića po jedinici kapaciteta (1.261.786 din/ha), što je za 16,5% bolji rezultat nego u proizvodnji jabuke (1.083.160 din/ha), odnosno za oko 7,8 puta bolje u odnosu na proizvodnju šljive (161.796 din/ha). Najveći koeficijent ekonomičnosti (3,19) takođe beleži izvodnja kruške (jabuka 2,94; višnja 2,27; breskva 2,17 i šljiva 1,44). Dalji razvoj voćarske proizvodnje Vojvodine podrazmeva podizanje intenzivnih zasada sa kvalitenim sortama voća, čvršće vertikalno povezivanje proizvođača i prerađivača, obezbeđivanje ekonomske sigurnost proizvođača na dugi rok, izrada rejonizacije voćarske proizvodnje itd.Ključne reči: voćarska proizvodnja, indikatori uspeha, isplativost, Vojvodina
6 Rad je rezultat istraživanja u okviru projekta ‘’Analiza proizvodno-ekonomskih rezultata poslovanja privrednih subjekata iz oblasti poljoprivrede i prehrambene industrije AP Vojvodine’’, koji finansira Pokrajinski sekretarijat za nauku i tehnološki razvoj APV.
7 Vanredni profesor, dr Mirjana Lukač Bulatović, Univerzitet u Novom Sadu, Poljoprivredni fakultet, Trg Dositeja Obradovića br. 8, 21000 Novi Sad, Srbija, Telefon: +381 63 892 97 21, E-mail: [email protected]; [email protected]
8 Redovni profesor, dr VeljkoVukoje, Univerzitet u Novom Sadu, Poljoprivredni fakultet, Trg Dositeja Obradovića br. 8, 21000 Novi Sad, Srbija, Telefon: +381 63 836 77 18, E-mail: [email protected]
9 Redovni profesor, dr DušanMilić, Univerzitet u Novom Sadu, Poljoprivredni fakultet, Trg Dositeja Obradovića br. 8, 21000 Novi Sad, Srbija, Telefon: +381 63 557 582, E-mail: [email protected]