Embed Size (px)
Citation preview

113th Congress, 1st Session
Economic IndicatorsOCTOBER 2013
(Includes data available as of November 8, 2013)
Prepared for the Joint Economic Committee by the
Council of Economic Advisers
UNITED STATESGOVERNMENT PRINTING OFFICE
WASHINGTON : 2013

ii
JOINT ECONOMIC COMMITTEE (Created pursuant to Sec. 5(a) of Public Law 304, 79th Cong.)
Kevin Brady, Texas, ChairmanAmy Klobuchar, Minnesota, Vice Chairman
House of Representatives Senate
John Campbell, California Robert P. Casey, Jr., Pennsylvania Sean P. Duffy, Wisconsin Mark R. Warner, Virginia Justin Amash, Michigan Bernard Sanders, Vermont Erik Paulsen, Minnesota Christopher Murphy, Connecticut Richard L. Hanna, New York Martin Heinrich, New Mexico Carolyn B. Maloney, New York Dan Coats, Indiana Loretta Sanchez, California Mike Lee, Utah Elijah E. Cummings, Maryland Roger F. Wicker, Mississippi John Delaney, Maryland Pat Toomey, Pennsylvania
Robert P. O’Quinn, Executive Director
COUNCIL OF ECONOMIC ADVISERS
Jason Furman, ChairmanBetsey Stevenson, Member
James Stock, Member
[Public Law 120—81st Congress; Chapter 237—1st Session]
JOINT RESOLUTION [S.J. ReS. 55]
To print the monthly publication entitled “Economic Indicators”
Resolved by the Senate and House of Representatives of the United States of America in Congress assembled, That the Joint Economic Committee be authorized to issue a monthly publication entitled “Economic Indicators,” and that a sufficient quantity be printed to furnish one copy to each Member of Congress; the Secretary and the Sergeant at Arms of the Senate; the Clerk, Sergeant at Arms, and Doorkeeper of the House of Representatives; two copies to the libraries of the Senate and House, and the Congressional Library; seven hundred copies to the Joint Economic Committee; and the required numbers of copies to the Superintendent of Documents for distribution to depository libraries; and that the Superintendent of Documents be authorized to have copies printed for sale to the public.
Approved June 23, 1949.
Charts prepared under the direction of the Mail and Multimedia Division, Office of the Secretary, Department of Commerce.
Monthly issues of Economic Indicators in PDF form, and tables in Excel, are available online at:www.gpo.gov/economicindicators
To subscribe to the print edition, $58.00 per year ($81.20 outside the United States), contact the U.S. Government Printing Office
at 202-512-1800, www.gpo.gov/economicindicators, or:
SUPERINTENDENT OF DOCUMENTSU.S. GOVERNMENT PRINTING OFFICE
MAIL STOP: IDCCWASHINGTON, DC 20402-9328
1
Gross Domestic Product
1 GDP less exports of goods and services plus imports of goods and services. Source: Department of Commerce (Bureau of Economic Analysis).
[Billions of current dollars; quarterly data at seasonally adjusted annual rates]
PeriodGross
domestic product
Personal con-
sumption expendi-
tures
Gross private
domestic invest-ment
Exports and imports of goods and services
Government consumption expenditures and gross investment
Final sales of
domestic product
Gross domestic
purchases 1
Addendum: Gross
national product Net
exports Exports Imports Total
Federal State and localTotal National
defenseNon-
defense
2003 .................... 11,512.2 7,764.4 2,027.9 –500.9 1,043.4 1,544.3 2,220.8 824.8 519.9 304.9 1,396.0 11,493.0 12,013.2 11,580.32004 .................... 12,277.0 8,257.8 2,276.7 –614.8 1,183.1 1,797.9 2,357.4 892.4 570.2 322.1 1,465.0 12,213.2 12,891.8 12,367.12005 .................... 13,095.4 8,790.3 2,527.1 –715.7 1,310.4 2,026.1 2,493.7 946.3 608.3 338.1 1,547.4 13,035.8 13,811.1 13,189.02006 .................... 13,857.9 9,297.5 2,680.6 –762.4 1,478.5 2,240.9 2,642.2 1,002.0 642.4 359.6 1,640.2 13,790.9 14,620.3 13,926.32007 .................... 14,480.3 9,744.4 2,643.7 –709.8 1,665.7 2,375.5 2,801.9 1,049.8 678.7 371.0 1,752.2 14,445.9 15,190.1 14,606.82008 .................... 14,720.3 10,005.5 2,424.8 –713.2 1,843.1 2,556.4 3,003.2 1,155.6 754.1 401.5 1,847.6 14,752.3 15,433.5 14,893.22009 .................... 14,417.9 9,842.9 1,878.1 –392.2 1,583.8 1,976.0 3,089.1 1,217.7 788.3 429.4 1,871.4 14,565.5 14,810.1 14,565.12010 .................... 14,958.3 10,201.9 2,100.8 –518.5 1,843.5 2,362.0 3,174.0 1,303.9 832.8 471.1 1,870.2 14,896.7 15,476.7 15,164.22011 .................... 15,533.8 10,711.8 2,232.1 –568.7 2,101.2 2,669.9 3,158.7 1,304.1 835.8 468.2 1,854.7 15,497.4 16,102.6 15,794.62012 .................... 16,244.6 11,149.6 2,475.2 –547.2 2,195.9 2,743.1 3,167.0 1,295.7 817.1 478.6 1,871.3 16,178.5 16,791.8 16,497.42010: I ................ 14,672.5 10,042.3 1,989.5 –495.1 1,746.4 2,241.4 3,135.7 1,269.2 811.9 457.3 1,866.5 14,660.4 15,167.5 14,875.9 II ............... 14,879.2 10,134.7 2,092.7 –529.7 1,807.0 2,336.7 3,181.5 1,304.6 829.3 475.2 1,876.9 14,829.0 15,408.9 15,084.3 III .............. 15,049.8 10,234.3 2,164.6 –543.8 1,860.3 2,404.0 3,194.7 1,321.6 846.3 475.3 1,873.1 14,928.2 15,593.5 15,249.5 IV .............. 15,231.7 10,396.3 2,156.5 –505.3 1,960.4 2,465.7 3,184.2 1,320.1 843.5 476.6 1,864.2 15,169.3 15,737.0 15,447.22011: I ................ 15,242.9 10,527.1 2,120.4 –554.7 2,029.5 2,584.1 3,150.0 1,297.4 822.0 475.4 1,852.6 15,221.4 15,797.6 15,491.2 II ............... 15,461.9 10,662.6 2,199.9 –572.2 2,095.5 2,667.7 3,171.7 1,315.4 844.2 471.2 1,856.3 15,416.2 16,034.1 15,712.1 III .............. 15,611.8 10,778.6 2,222.2 –553.7 2,143.4 2,697.1 3,164.6 1,308.5 851.6 456.9 1,856.1 15,625.3 16,165.5 15,884.0 IV .............. 15,818.7 10,878.9 2,385.7 –594.4 2,136.2 2,730.7 3,148.5 1,294.9 825.6 469.3 1,853.6 15,726.8 16,413.1 16,091.02012: I ................ 16,041.6 11,019.1 2,453.6 –590.8 2,173.4 2,764.2 3,159.7 1,291.8 816.3 475.5 1,867.9 15,938.7 16,632.4 16,289.6 II ............... 16,160.4 11,100.2 2,454.0 –557.9 2,197.4 2,755.3 3,164.1 1,293.8 816.7 477.1 1,870.3 16,093.6 16,718.3 16,419.2 III .............. 16,356.0 11,193.6 2,493.3 –524.4 2,199.2 2,723.5 3,193.5 1,322.1 841.9 480.2 1,871.4 16,274.4 16,880.4 16,603.7 IV .............. 16,420.3 11,285.5 2,499.9 –515.8 2,213.7 2,729.5 3,150.7 1,275.2 793.7 481.5 1,875.4 16,407.3 16,936.1 16,677.32013: I ................ 16,535.3 11,379.2 2,555.1 –523.1 2,214.2 2,737.3 3,124.1 1,255.0 775.8 479.2 1,869.1 16,471.9 17,058.4 16,772.7 II ............... 16,661.0 11,427.1 2,621.0 –509.0 2,238.9 2,747.9 3,121.9 1,252.6 776.3 476.3 1,869.3 16,583.8 17,170.0 16,907.9 III p ............ 16,857.6 11,525.4 2,689.8 –493.1 2,268.8 2,761.9 3,135.6 1,251.0 777.2 473.9 1,884.5 16,747.3 17,350.8 ..................
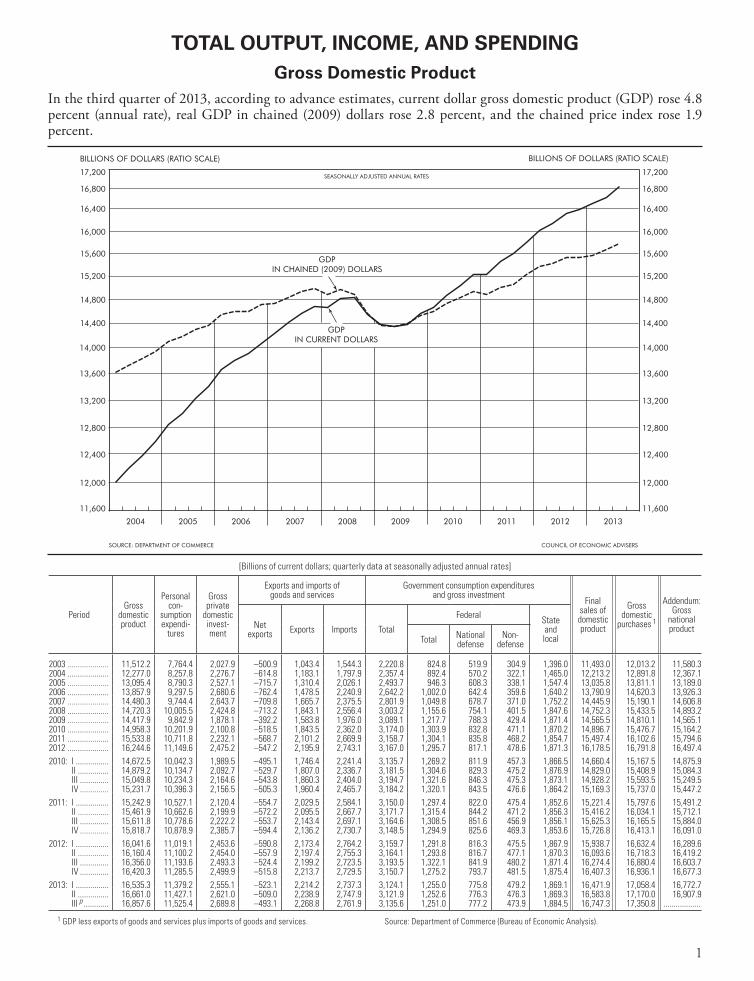
TOTAL OUTPUT, INCOME, AND SPENDING
In the third quarter of 2013, according to advance estimates, current dollar gross domestic product (GDP) rose 4.8 percent (annual rate), real GDP in chained (2009) dollars rose 2.8 percent, and the chained price index rose 1.9 percent.
2
Real Gross Domestic Product[Billions of chained (2009) dollars; quarterly data at seasonally adjusted annual rates]
PeriodGross
domestic product
Personal con-
sumption expendi-
tures
Gross private domestic investment
Exports and imports of goods and services
Government consumption expenditures and gross investment
Final sales of
domestic product
Gross domestic
purchases 1
Adden-dum: Gross
national product
Nonresi-dential fixed
invest-ment
Resi-dential fixed
invest-ment
Change in
private inven-tories
Net exports Exports Imports Total
FederalState and localTotal National
defenseNon-
defense
2003 .................... 13,270.0 8,866.2 1,526.1 744.5 22.6 –641.6 1,197.2 1,838.8 2,764.3 973.0 615.4 357.5 1,795.3 13,247.9 13,937.1 13,352.22004 .................... 13,774.0 9,205.6 1,605.4 818.9 71.4 –731.9 1,309.3 2,041.2 2,808.2 1,017.1 652.7 364.5 1,792.8 13,702.7 14,529.1 13,879.02005 .................... 14,235.6 9,527.8 1,717.4 872.6 64.3 –777.1 1,388.4 2,165.5 2,826.2 1,034.8 665.5 369.4 1,792.3 14,170.1 15,036.2 14,340.82006 .................... 14,615.2 9,814.9 1,839.6 806.6 71.6 –786.2 1,512.4 2,298.6 2,869.3 1,060.9 678.8 382.1 1,808.8 14,543.6 15,424.8 14,690.92007 .................... 14,876.8 10,035.5 1,948.4 654.8 35.5 –703.6 1,647.3 2,350.9 2,914.4 1,078.7 695.6 383.1 1,836.1 14,839.2 15,600.8 15,009.72008 .................... 14,833.6 9,999.2 1,934.4 497.7 –33.7 –546.9 1,741.8 2,288.7 2,994.8 1,152.3 748.1 404.2 1,842.4 14,868.9 15,392.0 15,009.02009 .................... 14,417.9 9,842.9 1,633.4 392.2 –147.6 –392.2 1,583.8 1,976.0 3,089.1 1,217.7 788.3 429.4 1,871.4 14,565.5 14,810.1 14,565.12010 .................... 14,779.4 10,035.9 1,673.8 382.4 58.2 –462.6 1,765.6 2,228.1 3,091.4 1,270.7 813.5 457.1 1,820.8 14,717.7 15,244.5 14,966.52011 .................... 15,052.4 10,291.3 1,800.5 384.3 33.6 –445.9 1,890.5 2,336.4 2,992.3 1,237.9 794.6 443.3 1,754.5 15,014.4 15,501.1 15,286.72012 .................... 15,470.7 10,517.6 1,931.8 433.7 57.6 –430.8 1,957.4 2,388.2 2,963.1 1,220.3 769.1 451.2 1,742.8 15,403.2 15,902.3 15,693.12010: I ................ 14,597.7 9,915.4 1,615.0 383.0 9.8 –413.6 1,700.4 2,113.9 3,084.3 1,247.8 798.6 449.2 1,836.5 14,584.3 15,011.5 14,782.7 II ............... 14,738.0 9,995.3 1,659.3 403.5 48.8 –474.3 1,739.3 2,213.6 3,106.2 1,273.4 811.0 462.4 1,832.8 14,686.3 15,215.4 14,925.1 III .............. 14,839.3 10,063.7 1,692.8 368.1 116.2 –504.9 1,784.9 2,289.8 3,103.5 1,285.0 825.9 459.1 1,818.5 14,718.3 15,348.5 15,020.5 IV .............. 14,942.4 10,169.0 1,728.1 375.1 58.1 –457.5 1,837.7 2,295.2 3,071.5 1,276.4 818.6 457.7 1,795.2 14,881.8 15,402.5 15,137.82011: I ................ 14,894.0 10,221.3 1,724.1 376.7 22.0 –456.5 1,854.7 2,311.3 3,012.0 1,241.6 787.8 453.7 1,770.5 14,871.9 15,354.0 15,119.2 II ............... 15,011.3 10,258.9 1,765.3 379.2 42.9 –438.3 1,876.9 2,315.2 3,002.4 1,247.0 800.8 446.2 1,755.5 14,961.8 15,451.6 15,235.6 III .............. 15,062.1 10,311.9 1,835.0 384.9 –11.0 –433.9 1,908.9 2,342.8 2,983.2 1,236.4 805.6 430.8 1,746.9 15,072.7 15,498.4 15,306.4 IV .............. 15,242.1 10,373.1 1,877.3 396.2 80.6 –454.7 1,921.7 2,376.4 2,971.7 1,226.7 784.2 442.5 1,745.0 15,151.3 15,700.5 15,485.72012: I ................ 15,381.6 10,447.8 1,903.8 417.2 89.2 –439.2 1,941.4 2,380.6 2,961.3 1,219.1 770.7 448.3 1,742.2 15,278.9 15,822.4 15,600.2 II ............... 15,427.7 10,496.8 1,925.0 423.0 56.8 –435.3 1,959.8 2,395.1 2,963.5 1,218.5 768.8 449.7 1,745.0 15,360.8 15,864.4 15,656.2 III .............. 15,534.0 10,541.0 1,926.4 437.3 77.2 –436.5 1,961.6 2,398.0 2,988.8 1,244.6 791.8 452.8 1,744.3 15,444.9 15,971.4 15,751.1 IV .............. 15,539.6 10,584.8 1,971.9 457.5 7.3 –412.1 1,967.0 2,379.1 2,938.8 1,198.9 745.0 453.9 1,739.8 15,528.3 15,950.8 15,764.82013: I ................ 15,583.9 10,644.0 1,949.0 471.2 42.2 –422.3 1,960.5 2,382.7 2,907.4 1,172.8 723.1 449.8 1,734.3 15,536.4 16,005.8 15,789.7 II ............... 15,679.7 10,691.9 1,971.3 487.1 56.6 –424.4 1,998.4 2,422.9 2,904.5 1,168.2 722.0 446.2 1,736.0 15,616.2 16,104.1 15,893.9 III p ............ 15,790.1 10,732.3 1,979.2 504.0 86.0 –413.2 2,020.8 2,434.0 2,906.0 1,163.2 720.8 442.4 1,742.5 15,694.5 16,202.5 ...............
1 GDP less exports of goods and services plus imports of goods and services.
Note: Because of the formula used for calculating real GDP, the chained (2009) dollar estimates for the detailed components do not add to the chained-dollar value of GDP or to any intermediate aggregates.
Source: Department of Commerce (Bureau of Economic Analysis).
Chained Price Indexes For Gross Domestic Product[Index numbers, 2009=100; quarterly data are seasonally adjusted]
PeriodGross
domestic product
Personal consumption expenditures
Gross private domestic investment
Exports and imports of goods and services
Government consumption expenditures and gross investment
Total Goods ServicesNonresi-dential fixed
Residential fixed Exports Imports
Federal State and localTotal National
defenseNon-
defense
2003 .................... 86.754 87.573 93.703 84.531 89.885 85.549 87.151 83.984 84.773 84.475 85.297 77.7612004 .................... 89.130 89.703 95.030 87.056 91.141 91.546 90.364 88.084 87.736 87.371 88.377 81.7192005 .................... 91.989 92.260 96.951 89.930 93.830 98.103 94.379 93.560 91.449 91.395 91.529 86.3332006 .................... 94.816 94.728 98.277 92.974 96.561 103.821 97.759 97.491 94.448 94.633 94.101 90.6772007 .................... 97.338 97.099 99.403 95.977 98.574 105.176 101.119 101.050 97.319 97.572 96.849 95.4262008 .................... 99.208 100.063 102.362 98.943 100.337 103.647 105.815 111.695 100.286 100.809 99.321 100.2792009 .................... 100.000 100.000 100.000 100.000 100.000 100.000 100.000 100.000 100.000 100.000 100.000 100.0002010 .................... 101.215 101.654 101.637 101.663 99.070 99.645 104.415 106.008 102.614 102.365 103.064 102.7142011 .................... 103.203 104.086 105.345 103.463 100.524 100.392 111.140 114.273 105.344 105.191 105.624 105.7102012 .................... 105.008 106.009 106.666 105.689 101.977 101.246 112.185 114.862 106.184 106.252 106.077 107.3712010: I ................ 100.509 101.282 101.786 101.038 98.735 100.027 102.749 106.052 101.719 101.671 101.811 101.629 II ............... 100.972 101.398 101.147 101.521 98.953 99.328 103.940 105.567 102.452 102.266 102.792 102.399 III .............. 101.432 101.698 101.307 101.890 99.095 99.325 104.261 104.985 102.855 102.480 103.530 102.991 IV .............. 101.948 102.239 102.308 102.204 99.496 99.898 106.710 107.426 103.429 103.043 104.123 103.8362011: I ................ 102.354 102.996 103.804 102.596 99.875 100.108 109.444 111.811 104.499 104.346 104.779 104.633 II ............... 103.024 103.938 105.395 103.217 100.456 100.461 111.659 115.233 105.483 105.416 105.608 105.740 III .............. 103.651 104.529 106.068 103.768 100.774 100.489 112.293 115.132 105.835 105.718 106.049 106.248 IV .............. 103.782 104.880 106.112 104.271 100.990 100.509 111.165 114.915 105.560 105.283 106.061 106.2202012: I ................ 104.296 105.471 106.681 104.872 101.506 100.315 111.955 116.117 105.959 105.914 106.051 107.214 II ............... 104.751 105.750 106.366 105.450 101.897 100.664 112.127 115.038 106.182 106.229 106.112 107.183 III .............. 105.345 106.193 106.718 105.939 102.157 101.505 112.114 113.570 106.224 106.322 106.065 107.288 IV .............. 105.640 106.622 106.900 106.493 102.350 102.500 112.543 114.725 106.370 106.542 106.081 107.7982013: I ................ 105.994 106.909 106.641 107.060 102.692 104.088 112.944 114.873 107.007 107.283 106.549 107.775 II ............... 106.165 106.878 105.740 107.477 103.008 105.396 112.034 113.411 107.229 107.512 106.760 107.676 III p ............ 106.667 107.391 106.325 107.954 103.300 106.186 112.274 113.466 107.550 107.816 107.108 108.152
Source: Department of Commerce (Bureau of Economic Analysis).
3
Gross Domestic Product and Related Price Measures: Indexes and Percent Changes
[Quarterly data are seasonally adjusted]
Period
Index numbers, 2009=100 Percent change from preceding period 1
Gross domestic product (GDP) Personal consumption expenditures (PCE) Gross domestic product (GDP) Personal consumption
expenditures (PCE)
Real GDP (chain-type
quantity index)
GDP chain-type
price index
GDP implicit
price deflator
PCE (chain-type price index)
PCE less food
and energy price index
GDP (current dollars)
Real GDP (chain-type
quantity index)
GDP chain-type
price index
GDP implicit
price deflator
PCE (chain-type price index)
PCE less food
and energy price index
2003 ...................... 92.038 86.754 86.754 87.573 89.048 4.8 2.8 2.0 2.0 2.0 1.52004 ...................... 95.534 89.130 89.132 89.703 90.751 6.6 3.8 2.7 2.7 2.4 1.92005 ...................... 98.735 91.989 91.991 92.260 92.710 6.7 3.4 3.2 3.2 2.9 2.22006 ...................... 101.368 94.816 94.818 94.728 94.785 5.8 2.7 3.1 3.1 2.7 2.22007 ...................... 103.182 97.338 97.335 97.099 96.829 4.5 1.8 2.7 2.7 2.5 2.22008 ...................... 102.883 99.208 99.236 100.063 98.824 1.7 –.3 1.9 2.0 3.1 2.12009 ...................... 100.000 100.000 100.000 100.000 100.000 –2.1 –2.8 .8 .8 –.1 1.22010 ...................... 102.507 101.215 101.211 101.654 101.287 3.7 2.5 1.2 1.2 1.7 1.32011 ...................... 104.400 103.203 103.199 104.086 102.743 3.8 1.8 2.0 2.0 2.4 1.42012 ...................... 107.302 105.008 105.002 106.009 104.632 4.6 2.8 1.7 1.7 1.8 1.82010: I .................. 101.247 100.509 100.513 101.282 100.911 3.0 1.6 1.3 1.4 1.4 1.0 II ................. 102.220 100.972 100.958 101.398 101.179 5.8 3.9 1.9 1.8 .5 1.1 III ................ 102.923 101.432 101.418 101.698 101.427 4.7 2.8 1.8 1.8 1.2 1.0 IV ................ 103.638 101.948 101.936 102.239 101.632 4.9 2.8 2.1 2.1 2.1 .82011: I .................. 103.302 102.354 102.343 102.996 101.959 .3 –1.3 1.6 1.6 3.0 1.3 II ................. 104.115 103.024 103.002 103.938 102.522 5.9 3.2 2.6 2.6 3.7 2.2 III ................ 104.468 103.651 103.650 104.529 103.039 3.9 1.4 2.5 2.5 2.3 2.0 IV ................ 105.716 103.782 103.783 104.880 103.452 5.4 4.9 .5 .5 1.3 1.62012: I .................. 106.683 104.296 104.291 105.471 104.010 5.8 3.7 2.0 2.0 2.3 2.2 II ................. 107.003 104.751 104.750 105.750 104.482 3.0 1.2 1.8 1.8 1.1 1.8 III ................ 107.741 105.345 105.292 106.193 104.849 4.9 2.8 2.3 2.1 1.7 1.4 IV ................ 107.780 105.640 105.667 106.622 105.187 1.6 .1 1.1 1.4 1.6 1.32013: I .................. 108.087 105.994 106.105 106.909 105.542 2.8 1.1 1.3 1.7 1.1 1.4 II ................. 108.751 106.165 106.259 106.878 105.711 3.1 2.5 .6 .6 –.1 .6 III p .............. 109.517 106.667 106.761 107.391 106.083 4.8 2.8 1.9 1.9 1.9 1.4
1 Quarterly percent changes are at annual rates. Source: Department of Commerce (Bureau of Economic Analysis).
Nonfinancial Corporate Business— Gross Value Added and Price, Costs, and Profits
[Quarterly data at seasonally adjusted annual rates]
Period
Gross value added of nonfinancial
corporate business (billions of dollars) 1
Price per unit of real gross value added of nonfinancial corporate business (dollars) 1, 2
TotalCompensation of employees
(unit labor cost)
Unit nonlabor cost Corporate profits with inventory valuation and capital consumption adjustments 4
Current dollars
Chained (2009) dollars
TotalConsumption
of fixed capital
Taxes on production
and imports 3
Net interest and
miscellaneous payments
TotalTaxes on corporate income
Profits after tax 5
2003 .................... 5,724.4 6,606.8 0.866 0.544 0.234 0.124 0.084 0.026 0.088 0.020 0.0682004 .................... 6,107.9 6,904.1 .885 .545 .232 .123 .086 .023 .107 .027 .0802005 .................... 6,532.1 7,131.7 .916 .551 .243 .128 .091 .024 .122 .038 .0842006 .................... 6,988.0 7,406.3 .944 .558 .249 .132 .092 .025 .137 .042 .0962007 .................... 7,203.9 7,480.5 .963 .576 .265 .139 .093 .033 .122 .039 .0832008 .................... 7,258.1 7,385.3 .983 .590 .283 .148 .093 .042 .110 .031 .0792009 .................... 6,861.4 6,861.4 1.000 .596 .299 .159 .099 .041 .105 .026 .0792010 .................... 7,243.1 7,244.4 1.000 .575 .290 .151 .099 .040 .135 .030 .1052011 .................... 7,636.4 7,464.6 1.023 .586 .291 .152 .101 .038 .145 .030 .1162012 .................... 8,030.8 7,743.2 1.037 .594 .291 .153 .100 .038 .151 .033 .1182010: I ................ 7,076.1 7,178.5 .986 .569 .289 .152 .098 .039 .127 .029 .098 II ............... 7,193.8 7,227.4 .995 .575 .290 .151 .099 .040 .131 .030 .100 III .............. 7,346.8 7,314.7 1.004 .574 .288 .150 .099 .039 .143 .031 .111 IV .............. 7,355.8 7,257.2 1.014 .583 .292 .152 .100 .040 .139 .031 .1082011: I ................ 7,464.4 7,365.1 1.013 .589 .291 .151 .101 .039 .133 .029 .103 II ............... 7,638.0 7,479.5 1.021 .583 .290 .151 .101 .038 .148 .030 .118 III .............. 7,715.6 7,465.6 1.033 .590 .293 .153 .101 .039 .150 .031 .120 IV .............. 7,727.5 7,548.1 1.024 .581 .292 .153 .101 .038 .151 .029 .1222012: I ................ 7,949.7 7,710.0 1.031 .590 .292 .152 .102 .038 .150 .033 .117 II ............... 8,007.0 7,740.1 1.034 .590 .292 .153 .101 .038 .152 .033 .119 III .............. 8,002.9 7,701.5 1.039 .596 .294 .155 .100 .039 .149 .032 .117 IV .............. 8,163.8 7,821.0 1.044 .600 .291 .154 .099 .038 .153 .034 .1182013: I ................ 8,163.4 7,795.6 1.047 .597 .297 .156 .100 .041 .153 .034 .118 II ............... 8,239.3 7,873.6 1.046 .597 .293 .156 .099 .038 .156 .034 .122
1 Estimates for nonfinancial corporate business are based on the North American Industry Clas-sification System (NAICS).
2 The implicit price deflator for gross value added of nonfinancial corporate business divided by 100.3 Less subsidies plus business current transfer payments.
4 Unit profits from current production.5 With inventory valuation and capital consumption adjustments.
Source: Department of Commerce (Bureau of Economic Analysis).
4
Real Personal Consumption Expenditures[Billions of chained (2009) dollars, except as noted; quarterly data at seasonally adjusted annual rates]
Period
Total personal
con-sumption expendi-
tures
Goods ServicesAdden-dum:
Personal con-
sumption expendi-
tures excluding food and energy 2
Retail sales of
new passenger cars and
light trucks
(millions of units)
Total goods
Durable Nondurable
Total services 1
Household con-
sumption expendi-
tures
Housing and
utilitiesHealth care
Financial services
and insurance
Total durable goods 1
Motor vehicles
and parts
Total non-
durable goods 1
Food and beverages purchased
for off-premises
con-sumption
Gasoline and
other energy goods
2003 .................... 8,866.2 2,904.5 917.6 394.6 1,998.5 713.3 296.8 5,965.6 5,761.7 1,676.0 1,392.5 643.1 7,645.3 16.62004 .................... 9,205.6 3,051.9 992.9 405.5 2,063.7 729.8 299.3 6,154.1 5,946.7 1,717.9 1,442.3 668.7 7,960.6 16.92005 .................... 9,527.8 3,177.2 1,046.9 400.0 2,132.3 757.6 298.0 6,349.4 6,143.4 1,788.4 1,490.4 704.1 8,249.9 16.92006 .................... 9,814.9 3,292.5 1,091.5 385.1 2,202.2 780.8 297.4 6,519.8 6,285.0 1,823.2 1,525.2 720.1 8,521.2 16.52007 .................... 10,035.5 3,381.8 1,141.7 392.8 2,239.3 791.3 296.8 6,650.4 6,409.2 1,840.8 1,563.2 742.5 8,728.1 16.12008 .................... 9,999.2 3,297.8 1,083.2 340.8 2,214.7 781.9 283.4 6,700.6 6,427.1 1,860.1 1,598.8 737.4 8,722.5 13.22009 .................... 9,842.9 3,198.4 1,023.3 317.1 2,175.1 770.0 284.5 6,644.5 6,368.5 1,881.0 1,627.4 719.0 8,573.3 10.42010 .................... 10,035.9 3,308.7 1,085.7 323.4 2,223.5 786.5 282.2 6,727.2 6,448.9 1,904.3 1,649.2 733.9 8,745.6 11.62011 .................... 10,291.3 3,419.9 1,157.1 339.4 2,266.0 798.8 275.2 6,871.1 6,592.0 1,928.4 1,693.3 756.0 9,004.1 12.72012 .................... 10,517.6 3,534.1 1,246.7 364.0 2,296.8 809.4 271.5 6,982.7 6,689.4 1,943.6 1,738.4 746.0 9,233.5 14.42010: I ................ 9,915.4 3,247.0 1,045.2 306.2 2,201.6 786.1 279.3 6,668.3 6,389.2 1,897.2 1,626.0 721.5 8,629.4 10.8 II ............... 9,995.3 3,288.0 1,076.3 319.7 2,212.1 780.6 282.5 6,707.2 6,425.6 1,896.5 1,640.9 736.1 8,714.7 11.5 III .............. 10,063.7 3,319.1 1,093.8 325.7 2,226.0 783.8 284.2 6,744.6 6,467.1 1,906.5 1,657.1 735.4 8,773.0 11.7 IV .............. 10,169.0 3,380.5 1,127.4 342.0 2,254.5 795.4 282.8 6,788.5 6,513.5 1,916.8 1,672.8 742.7 8,865.4 12.22011: I ................ 10,221.3 3,402.8 1,142.3 345.2 2,262.6 797.8 280.4 6,818.2 6,544.5 1,918.9 1,681.7 750.7 8,925.1 12.7 II ............... 10,258.9 3,404.6 1,140.0 330.0 2,266.5 800.7 273.8 6,854.1 6,578.8 1,925.1 1,692.7 751.4 8,971.7 12.3 III .............. 10,311.9 3,415.2 1,154.4 331.3 2,263.8 798.8 273.6 6,896.6 6,610.1 1,937.3 1,689.2 762.8 9,022.7 12.6 IV .............. 10,373.1 3,457.0 1,191.7 351.1 2,271.0 798.1 273.0 6,915.5 6,634.7 1,932.4 1,709.6 759.0 9,096.8 13.42012: I ................ 10,447.8 3,495.8 1,219.7 360.3 2,283.6 803.8 269.9 6,951.2 6,668.0 1,927.8 1,730.1 757.2 9,181.3 14.2 II ............... 10,496.8 3,514.7 1,228.6 356.3 2,293.9 808.4 274.7 6,981.4 6,688.3 1,949.2 1,731.4 751.1 9,203.2 14.2 III .............. 10,541.0 3,546.7 1,253.4 363.5 2,303.0 811.7 272.5 6,993.4 6,698.0 1,955.5 1,741.1 738.1 9,243.7 14.4 IV .............. 10,584.8 3,579.2 1,285.2 375.8 2,306.7 813.5 268.8 7,004.7 6,703.2 1,941.9 1,750.9 737.7 9,305.9 14.92013: I ................ 10,644.0 3,611.9 1,303.5 380.6 2,322.2 817.6 271.7 7,031.1 6,743.2 1,964.5 1,756.5 747.6 9,336.0 15.3 II ............... 10,691.9 3,639.6 1,323.2 379.7 2,331.7 815.3 271.1 7,051.5 6,766.1 1,964.8 1,771.9 754.9 9,388.8 15.5 III p ............ 10,732.3 3,678.4 1,348.5 385.8 2,347.1 820.8 270.3 7,053.4 6,766.6 1,953.6 1,775.8 755.6 9,438.0 15.7
National Income[Billions of dollars; quarterly data at seasonally adjusted annual rates]
Period National income
Com-pensation
of employ-
ees
Proprietors’ income 1 Rental
income of
persons with
capital con-
sumption adjust-ment
Corporate profits with inventory valuation and capital consumption adjustments
Net interest
and miscel-laneous
payments
Taxes on
produc-tion and
imports
Less: Subsidies
Business current transfer
payments
Current surplus
of govern-ment enter-prises
Farm Nonfarm Total
Profits with inventory valuation adjustment and without
capital consumption adjustment Capital con-
sumption adjust-mentTotal
Profits before
tax
Inventory valuation adjust-ment
2003 .................... 9,865.1 6,365.4 38.0 862.0 238.0 1,056.4 959.9 969.4 –9.6 96.5 466.2 808.0 49.1 76.3 3.92004 .................... 10,541.9 6,740.5 50.4 911.6 255.4 1,283.3 1,215.2 1,254.6 –39.5 68.2 403.5 863.9 46.4 81.4 –1.82005 .................... 11,240.8 7,087.8 46.4 932.6 238.4 1,477.7 1,621.2 1,653.3 –32.1 –143.5 496.8 934.5 60.9 93.9 –6.42006 .................... 12,005.6 7,503.2 36.0 1,017.7 207.5 1,646.5 1,815.7 1,851.4 –35.7 –169.2 580.9 991.9 51.5 82.6 –9.32007 .................... 12,322.3 7,899.1 38.1 941.1 189.4 1,529.0 1,708.9 1,748.4 –39.5 –179.9 663.4 1,034.6 54.6 98.6 –16.42008 .................... 12,430.8 8,079.2 47.0 979.5 262.1 1,285.1 1,345.5 1,382.4 –37.0 –60.4 693.4 1,041.9 52.6 116.4 –21.22009 .................... 12,124.5 7,787.8 35.5 937.5 333.7 1,392.6 1,474.8 1,468.2 6.7 –82.2 563.1 1,026.1 58.3 127.2 –20.62010 .................... 12,739.5 7,967.3 46.0 986.7 402.8 1,740.6 1,793.8 1,834.8 –41.0 –53.3 489.4 1,057.1 55.9 128.5 –22.92011 .................... 13,395.7 8,278.5 72.6 1,082.6 484.4 1,877.7 1,791.3 1,847.4 –56.0 86.4 456.9 1,097.1 60.0 129.6 –23.82012 .................... 13,971.6 8,611.6 75.4 1,149.6 541.2 2,009.5 2,180.0 2,190.0 –10.0 –170.5 439.6 1,122.9 57.3 106.9 –27.72010: I ................ 12,461.0 7,804.3 39.2 978.5 380.5 1,655.2 1,751.6 1,791.7 –40.1 –96.4 508.0 1,042.2 54.9 129.3 –21.2 II ............... 12,624.0 7,952.7 43.2 981.5 397.3 1,660.8 1,762.2 1,782.8 –20.6 –101.4 485.8 1,054.2 55.5 126.5 –22.6 III .............. 12,867.8 8,026.5 48.4 980.8 408.3 1,807.0 1,861.5 1,879.5 –18.1 –54.4 482.2 1,063.1 56.2 131.1 –23.5 IV .............. 13,005.4 8,085.7 53.2 1,006.0 425.0 1,839.2 1,800.0 1,885.2 –85.3 39.2 481.6 1,069.0 56.9 127.0 –24.32011: I ................ 13,156.7 8,207.4 71.7 1,044.9 458.5 1,755.0 1,672.2 1,792.3 –120.1 82.9 473.8 1,085.2 58.7 142.6 –23.8 II ............... 13,320.4 8,256.3 67.5 1,073.2 475.5 1,868.7 1,782.3 1,850.4 –68.2 86.4 436.7 1,099.9 59.9 125.6 –23.1 III .............. 13,502.0 8,343.3 74.1 1,101.2 489.9 1,893.8 1,805.4 1,833.1 –27.7 88.4 459.7 1,095.9 60.5 128.3 –23.7 IV .............. 13,603.6 8,306.9 76.9 1,111.1 513.5 1,993.4 1,905.4 1,913.6 –8.2 88.0 457.5 1,107.5 60.6 121.8 –24.42012: I ................ 13,845.0 8,514.3 74.6 1,139.7 524.8 1,979.9 2,142.5 2,162.1 –19.5 –162.7 453.9 1,124.4 57.8 115.7 –24.5 II ............... 13,875.3 8,553.8 77.0 1,140.8 537.8 1,998.4 2,169.8 2,160.0 9.8 –171.4 419.0 1,122.2 57.6 110.0 –26.1 III .............. 13,962.1 8,591.0 75.3 1,144.7 546.7 2,012.3 2,186.6 2,208.5 –22.0 –174.2 455.3 1,118.8 56.0 102.6 –28.5 IV .............. 14,204.0 8,787.4 74.5 1,173.0 555.4 2,047.2 2,221.1 2,229.5 –8.4 –173.9 430.3 1,126.3 57.7 99.5 –31.82013: I ................ 14,324.5 8,748.3 137.0 1,197.6 574.9 2,020.6 2,180.0 2,193.1 –13.0 –159.5 477.0 1,140.7 58.0 121.9 –35.5 II ............... 14,438.5 8,811.2 129.0 1,212.5 587.7 2,087.4 2,248.6 2,239.7 8.9 –161.1 444.0 1,138.8 58.9 125.8 –39.0 III p ............ ............... 8,858.9 131.5 1,226.7 600.2 ............... ............... ............... ............... –161.5 458.4 1,144.0 59.1 119.4 –41.5
1 With inventory valuation and capital consumption adjustments. Source: Department of Commerce (Bureau of Economic Analysis).
1 Includes other items, not shown separately. 2 Food consists of food and beverages purchased for off-premises consumption; food services,
which include purchased meals and beverages, are not classified as food.
Note: Because of the formula used for calculating real GDP, the chained (2009) dollar estimates for the detailed components do not add to the chained-dollar value of GDP or to any intermediate aggregates.
Source: Department of Commerce (Bureau of Economic Analysis).
5
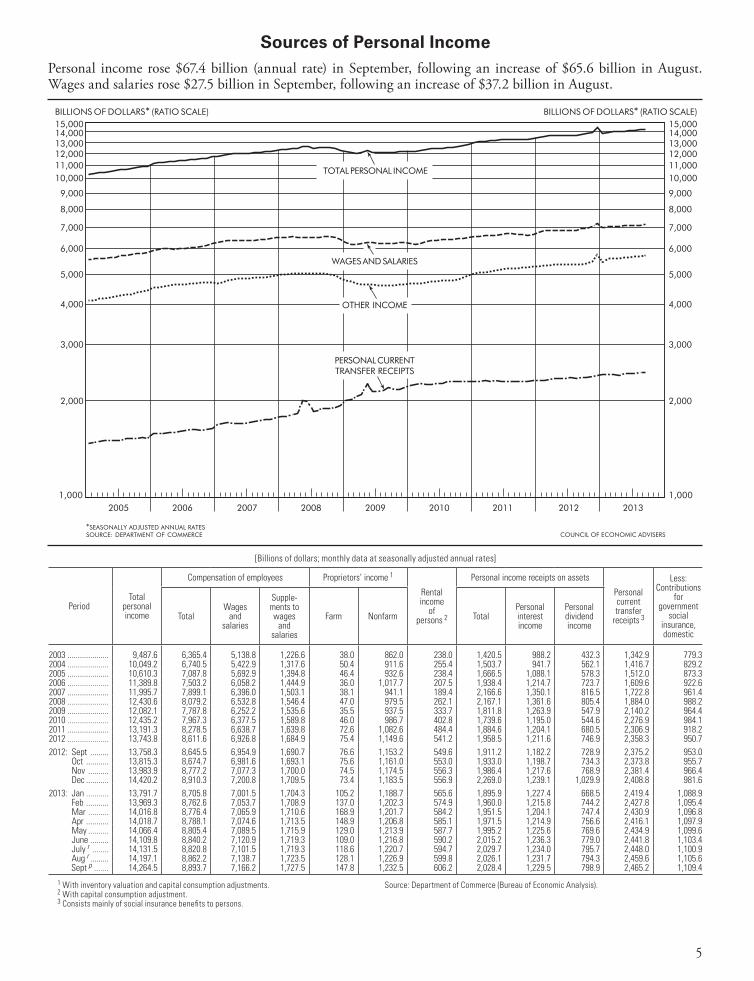
Sources of Personal Income
1 With inventory valuation and capital consumption adjustments.2 With capital consumption adjustment.3 Consists mainly of social insurance benefits to persons.
Source: Department of Commerce (Bureau of Economic Analysis).
[Billions of dollars; monthly data at seasonally adjusted annual rates]
PeriodTotal
personal income
Compensation of employees Proprietors’ income 1
Rental income
of persons 2
Personal income receipts on assets
Personal current transfer
receipts 3
Less: Contributions
for government
social insurance, domestic
TotalWages
and salaries
Supple-ments to wages
and salaries
Farm Nonfarm TotalPersonal interest income
Personal dividend income
2003 .................... 9,487.6 6,365.4 5,138.8 1,226.6 38.0 862.0 238.0 1,420.5 988.2 432.3 1,342.9 779.32004 .................... 10,049.2 6,740.5 5,422.9 1,317.6 50.4 911.6 255.4 1,503.7 941.7 562.1 1,416.7 829.22005 .................... 10,610.3 7,087.8 5,692.9 1,394.8 46.4 932.6 238.4 1,666.5 1,088.1 578.3 1,512.0 873.32006 .................... 11,389.8 7,503.2 6,058.2 1,444.9 36.0 1,017.7 207.5 1,938.4 1,214.7 723.7 1,609.6 922.62007 .................... 11,995.7 7,899.1 6,396.0 1,503.1 38.1 941.1 189.4 2,166.6 1,350.1 816.5 1,722.8 961.42008 .................... 12,430.6 8,079.2 6,532.8 1,546.4 47.0 979.5 262.1 2,167.1 1,361.6 805.4 1,884.0 988.22009 .................... 12,082.1 7,787.8 6,252.2 1,535.6 35.5 937.5 333.7 1,811.8 1,263.9 547.9 2,140.2 964.42010 .................... 12,435.2 7,967.3 6,377.5 1,589.8 46.0 986.7 402.8 1,739.6 1,195.0 544.6 2,276.9 984.12011 .................... 13,191.3 8,278.5 6,638.7 1,639.8 72.6 1,082.6 484.4 1,884.6 1,204.1 680.5 2,306.9 918.22012 .................... 13,743.8 8,611.6 6,926.8 1,684.9 75.4 1,149.6 541.2 1,958.5 1,211.6 746.9 2,358.3 950.72012: Sept ......... 13,758.3 8,645.5 6,954.9 1,690.7 76.6 1,153.2 549.6 1,911.2 1,182.2 728.9 2,375.2 953.0 Oct ........... 13,815.3 8,674.7 6,981.6 1,693.1 75.6 1,161.0 553.0 1,933.0 1,198.7 734.3 2,373.8 955.7 Nov .......... 13,983.9 8,777.2 7,077.3 1,700.0 74.5 1,174.5 556.3 1,986.4 1,217.6 768.9 2,381.4 966.4 Dec ........... 14,420.2 8,910.3 7,200.8 1,709.5 73.4 1,183.5 556.9 2,269.0 1,239.1 1,029.9 2,408.8 981.62013: Jan ........... 13,791.7 8,705.8 7,001.5 1,704.3 105.2 1,188.7 565.6 1,895.9 1,227.4 668.5 2,419.4 1,088.9 Feb ........... 13,969.3 8,762.6 7,053.7 1,708.9 137.0 1,202.3 574.9 1,960.0 1,215.8 744.2 2,427.8 1,095.4 Mar .......... 14,016.8 8,776.4 7,065.9 1,710.6 168.9 1,201.7 584.2 1,951.5 1,204.1 747.4 2,430.9 1,096.8 Apr ........... 14,018.7 8,788.1 7,074.6 1,713.5 148.9 1,206.8 585.1 1,971.5 1,214.9 756.6 2,416.1 1,097.9 May .......... 14,066.4 8,805.4 7,089.5 1,715.9 129.0 1,213.9 587.7 1,995.2 1,225.6 769.6 2,434.9 1,099.6 June ......... 14,109.8 8,840.2 7,120.9 1,719.3 109.0 1,216.8 590.2 2,015.2 1,236.3 779.0 2,441.8 1,103.4 July r ........ 14,131.5 8,820.8 7,101.5 1,719.3 118.6 1,220.7 594.7 2,029.7 1,234.0 795.7 2,448.0 1,100.9 Aug r ......... 14,197.1 8,862.2 7,138.7 1,723.5 128.1 1,226.9 599.8 2,026.1 1,231.7 794.3 2,459.6 1,105.6 Sept p ....... 14,264.5 8,893.7 7,166.2 1,727.5 147.8 1,232.5 606.2 2,028.4 1,229.5 798.9 2,465.2 1,109.4
Personal income rose $67.4 billion (annual rate) in September, following an increase of $65.6 billion in August. Wages and salaries rose $27.5 billion in September, following an increase of $37.2 billion in August.
6
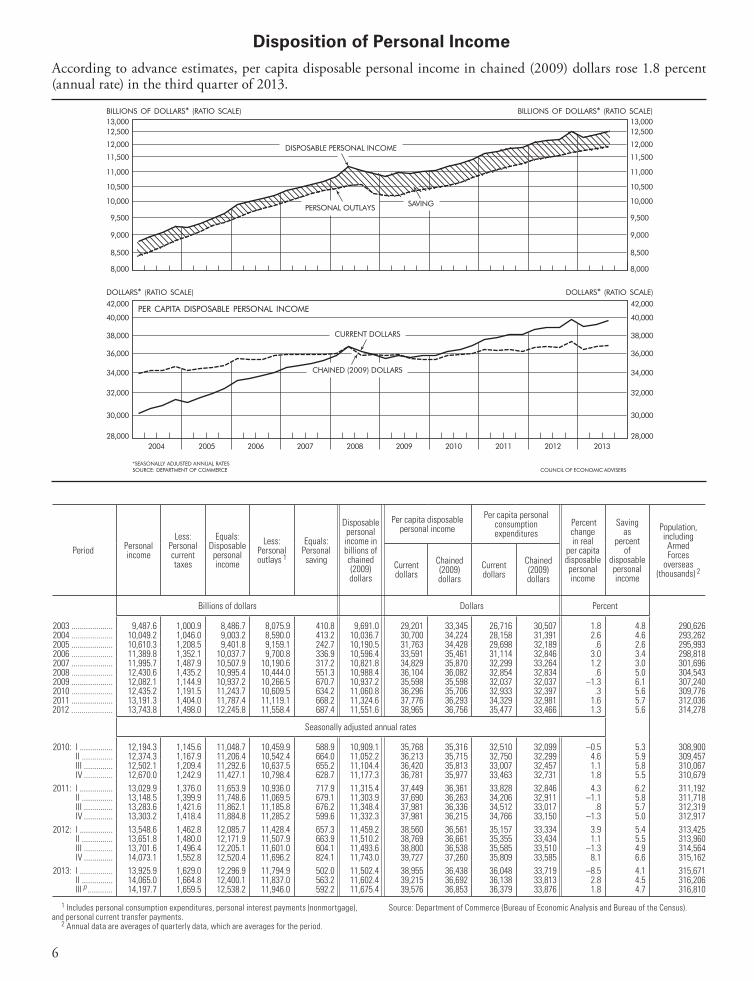
Disposition of Personal Income
1 Includes personal consumption expenditures, personal interest payments (nonmortgage), and personal current transfer payments.
2 Annual data are averages of quarterly data, which are averages for the period.
Source: Department of Commerce (Bureau of Economic Analysis and Bureau of the Census).
Period Personal income
Less: Personal current taxes
Equals: Disposable
personal income
Less: Personal outlays 1
Equals: Personal saving
Disposable personal income in billions of chained (2009) dollars
Per capita disposable personal income
Per capita personal consumption expenditures
Percent change in real
per capita disposable personal income
Saving as
percent of
disposable personal income
Population, including Armed Forces
overseas (thousands) 2
Current dollars
Chained (2009) dollars
Current dollars
Chained (2009) dollars
Billions of dollars Dollars Percent
2003 .................... 9,487.6 1,000.9 8,486.7 8,075.9 410.8 9,691.0 29,201 33,345 26,716 30,507 1.8 4.8 290,6262004 .................... 10,049.2 1,046.0 9,003.2 8,590.0 413.2 10,036.7 30,700 34,224 28,158 31,391 2.6 4.6 293,2622005 .................... 10,610.3 1,208.5 9,401.8 9,159.1 242.7 10,190.5 31,763 34,428 29,698 32,189 .6 2.6 295,9932006 .................... 11,389.8 1,352.1 10,037.7 9,700.8 336.9 10,596.4 33,591 35,461 31,114 32,846 3.0 3.4 298,8182007 .................... 11,995.7 1,487.9 10,507.9 10,190.6 317.2 10,821.8 34,829 35,870 32,299 33,264 1.2 3.0 301,6962008 .................... 12,430.6 1,435.2 10,995.4 10,444.0 551.3 10,988.4 36,104 36,082 32,854 32,834 .6 5.0 304,5432009 .................... 12,082.1 1,144.9 10,937.2 10,266.5 670.7 10,937.2 35,598 35,598 32,037 32,037 –1.3 6.1 307,2402010 .................... 12,435.2 1,191.5 11,243.7 10,609.5 634.2 11,060.8 36,296 35,706 32,933 32,397 .3 5.6 309,7762011 .................... 13,191.3 1,404.0 11,787.4 11,119.1 668.2 11,324.6 37,776 36,293 34,329 32,981 1.6 5.7 312,0362012 .................... 13,743.8 1,498.0 12,245.8 11,558.4 687.4 11,551.6 38,965 36,756 35,477 33,466 1.3 5.6 314,278
Seasonally adjusted annual rates
2010: I ................ 12,194.3 1,145.6 11,048.7 10,459.9 588.9 10,909.1 35,768 35,316 32,510 32,099 –0.5 5.3 308,900 II ............... 12,374.3 1,167.9 11,206.4 10,542.4 664.0 11,052.2 36,213 35,715 32,750 32,299 4.6 5.9 309,457 III .............. 12,502.1 1,209.4 11,292.6 10,637.5 655.2 11,104.4 36,420 35,813 33,007 32,457 1.1 5.8 310,067 IV .............. 12,670.0 1,242.9 11,427.1 10,798.4 628.7 11,177.3 36,781 35,977 33,463 32,731 1.8 5.5 310,6792011: I ................ 13,029.9 1,376.0 11,653.9 10,936.0 717.9 11,315.4 37,449 36,361 33,828 32,846 4.3 6.2 311,192 II ............... 13,148.5 1,399.9 11,748.6 11,069.5 679.1 11,303.9 37,690 36,263 34,206 32,911 –1.1 5.8 311,718 III .............. 13,283.6 1,421.6 11,862.1 11,185.8 676.2 11,348.4 37,981 36,336 34,512 33,017 .8 5.7 312,319 IV .............. 13,303.2 1,418.4 11,884.8 11,285.2 599.6 11,332.3 37,981 36,215 34,766 33,150 –1.3 5.0 312,9172012: I ................ 13,548.6 1,462.8 12,085.7 11,428.4 657.3 11,459.2 38,560 36,561 35,157 33,334 3.9 5.4 313,425 II ............... 13,651.8 1,480.0 12,171.9 11,507.9 663.9 11,510.2 38,769 36,661 35,355 33,434 1.1 5.5 313,960 III .............. 13,701.6 1,496.4 12,205.1 11,601.0 604.1 11,493.6 38,800 36,538 35,585 33,510 –1.3 4.9 314,564 IV .............. 14,073.1 1,552.8 12,520.4 11,696.2 824.1 11,743.0 39,727 37,260 35,809 33,585 8.1 6.6 315,1622013: I ................ 13,925.9 1,629.0 12,296.9 11,794.9 502.0 11,502.4 38,955 36,438 36,048 33,719 –8.5 4.1 315,671 II ............... 14,065.0 1,664.8 12,400.1 11,837.0 563.2 11,602.4 39,215 36,692 36,138 33,813 2.8 4.5 316,206 III p ............ 14,197.7 1,659.5 12,538.2 11,946.0 592.2 11,675.4 39,576 36,853 36,379 33,876 1.8 4.7 316,810
According to advance estimates, per capita disposable personal income in chained (2009) dollars rose 1.8 percent (annual rate) in the third quarter of 2013.
7
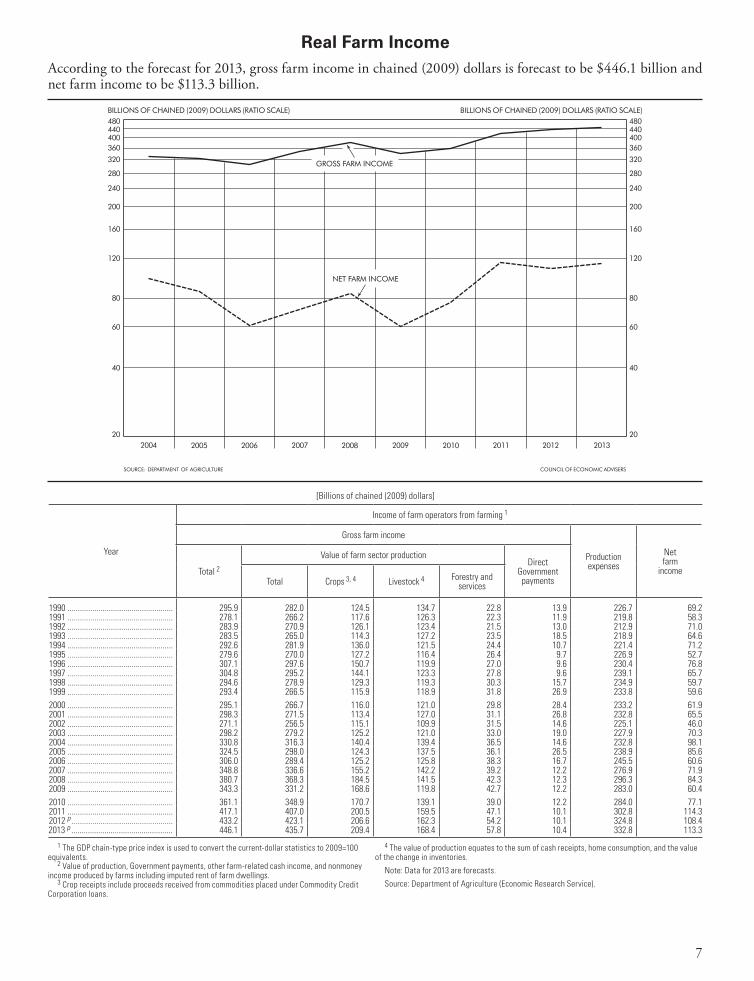
Real Farm Income
1 The GDP chain-type price index is used to convert the current-dollar statistics to 2009=100 equivalents.
2 Value of production, Government payments, other farm-related cash income, and nonmoney income produced by farms including imputed rent of farm dwellings.
3 Crop receipts include proceeds received from commodities placed under Commodity Credit Corporation loans.
4 The value of production equates to the sum of cash receipts, home consumption, and the value of the change in inventories.
Note: Data for 2013 are forecasts.
Source: Department of Agriculture (Economic Research Service).
[Billions of chained (2009) dollars]
Year
Income of farm operators from farming 1
Gross farm income
Production expenses
Net farm
incomeTotal 2Value of farm sector production
Direct Government
paymentsTotal Crops 3, 4 Livestock 4 Forestry and services
1990 ................................................... 295.9 282.0 124.5 134.7 22.8 13.9 226.7 69.21991 ................................................... 278.1 266.2 117.6 126.3 22.3 11.9 219.8 58.31992 ................................................... 283.9 270.9 126.1 123.4 21.5 13.0 212.9 71.01993 ................................................... 283.5 265.0 114.3 127.2 23.5 18.5 218.9 64.61994 ................................................... 292.6 281.9 136.0 121.5 24.4 10.7 221.4 71.21995 ................................................... 279.6 270.0 127.2 116.4 26.4 9.7 226.9 52.71996 ................................................... 307.1 297.6 150.7 119.9 27.0 9.6 230.4 76.81997 ................................................... 304.8 295.2 144.1 123.3 27.8 9.6 239.1 65.71998 ................................................... 294.6 278.9 129.3 119.3 30.3 15.7 234.9 59.71999 ................................................... 293.4 266.5 115.9 118.9 31.8 26.9 233.8 59.62000 ................................................... 295.1 266.7 116.0 121.0 29.8 28.4 233.2 61.92001 ................................................... 298.3 271.5 113.4 127.0 31.1 26.8 232.8 65.52002 ................................................... 271.1 256.5 115.1 109.9 31.5 14.6 225.1 46.02003 ................................................... 298.2 279.2 125.2 121.0 33.0 19.0 227.9 70.32004 ................................................... 330.8 316.3 140.4 139.4 36.5 14.6 232.8 98.12005 ................................................... 324.5 298.0 124.3 137.5 36.1 26.5 238.9 85.62006 ................................................... 306.0 289.4 125.2 125.8 38.3 16.7 245.5 60.62007 ................................................... 348.8 336.6 155.2 142.2 39.2 12.2 276.9 71.92008 ................................................... 380.7 368.3 184.5 141.5 42.3 12.3 296.3 84.32009 ................................................... 343.3 331.2 168.6 119.8 42.7 12.2 283.0 60.42010 ................................................... 361.1 348.9 170.7 139.1 39.0 12.2 284.0 77.12011 ................................................... 417.1 407.0 200.5 159.5 47.1 10.1 302.8 114.32012 p ................................................. 433.2 423.1 206.6 162.3 54.2 10.1 324.8 108.42013 p ................................................. 446.1 435.7 209.4 168.4 57.8 10.4 332.8 113.3
According to the forecast for 2013, gross farm income in chained (2009) dollars is forecast to be $446.1 billion and net farm income to be $113.3 billion.
8
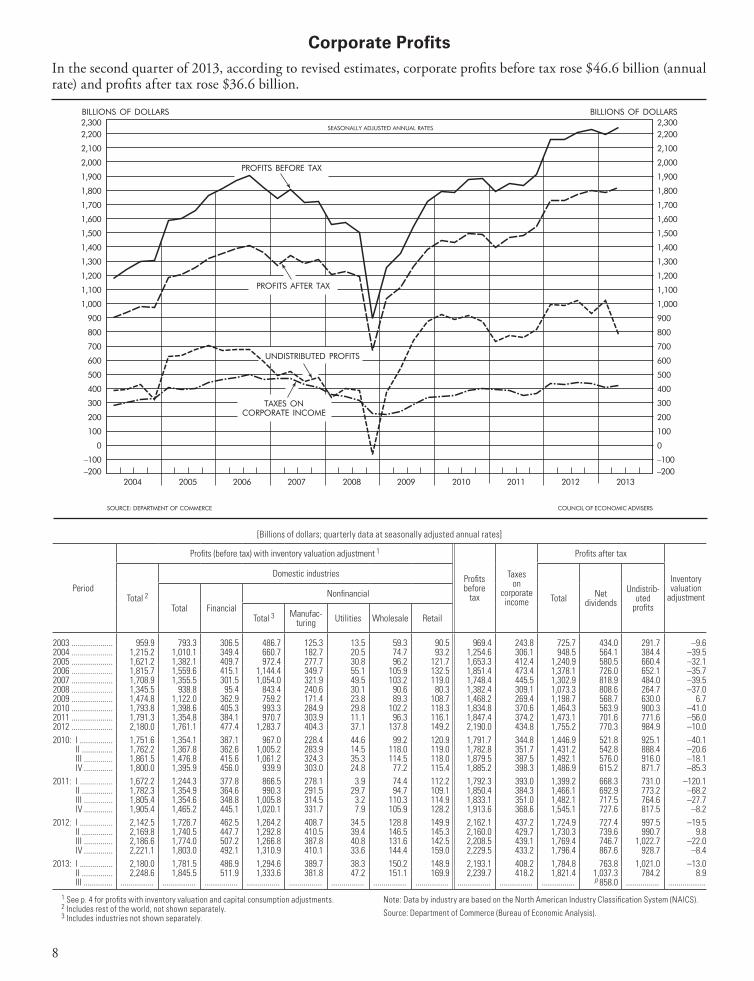
Corporate Profits
Note: Data by industry are based on the North American Industry Classification System (NAICS).
Source: Department of Commerce (Bureau of Economic Analysis).
[Billions of dollars; quarterly data at seasonally adjusted annual rates]
Period
Profits (before tax) with inventory valuation adjustment 1
Profits before
tax
Taxes on
corporate income
Profits after tax
Inventory valuation
adjustmentTotal 2
Domestic industries
Total Net dividends
Undistrib-uted
profitsTotal Financial
Nonfinancial
Total 3 Manufac-turing Utilities Wholesale Retail
2003 .................... 959.9 793.3 306.5 486.7 125.3 13.5 59.3 90.5 969.4 243.8 725.7 434.0 291.7 –9.62004 .................... 1,215.2 1,010.1 349.4 660.7 182.7 20.5 74.7 93.2 1,254.6 306.1 948.5 564.1 384.4 –39.52005 .................... 1,621.2 1,382.1 409.7 972.4 277.7 30.8 96.2 121.7 1,653.3 412.4 1,240.9 580.5 660.4 –32.12006 .................... 1,815.7 1,559.6 415.1 1,144.4 349.7 55.1 105.9 132.5 1,851.4 473.4 1,378.1 726.0 652.1 –35.72007 .................... 1,708.9 1,355.5 301.5 1,054.0 321.9 49.5 103.2 119.0 1,748.4 445.5 1,302.9 818.9 484.0 –39.52008 .................... 1,345.5 938.8 95.4 843.4 240.6 30.1 90.6 80.3 1,382.4 309.1 1,073.3 808.6 264.7 –37.02009 .................... 1,474.8 1,122.0 362.9 759.2 171.4 23.8 89.3 108.7 1,468.2 269.4 1,198.7 568.7 630.0 6.72010 .................... 1,793.8 1,398.6 405.3 993.3 284.9 29.8 102.2 118.3 1,834.8 370.6 1,464.3 563.9 900.3 –41.02011 .................... 1,791.3 1,354.8 384.1 970.7 303.9 11.1 96.3 116.1 1,847.4 374.2 1,473.1 701.6 771.6 –56.02012 .................... 2,180.0 1,761.1 477.4 1,283.7 404.3 37.1 137.8 149.2 2,190.0 434.8 1,755.2 770.3 984.9 –10.02010: I ................ 1,751.6 1,354.1 387.1 967.0 228.4 44.6 99.2 120.9 1,791.7 344.8 1,446.9 521.8 925.1 –40.1 II ............... 1,762.2 1,367.8 362.6 1,005.2 283.9 14.5 118.0 119.0 1,782.8 351.7 1,431.2 542.8 888.4 –20.6 III .............. 1,861.5 1,476.8 415.6 1,061.2 324.3 35.3 114.5 118.0 1,879.5 387.5 1,492.1 576.0 916.0 –18.1 IV .............. 1,800.0 1,395.9 456.0 939.9 303.0 24.8 77.2 115.4 1,885.2 398.3 1,486.9 615.2 871.7 –85.32011: I ................ 1,672.2 1,244.3 377.8 866.5 278.1 3.9 74.4 112.2 1,792.3 393.0 1,399.2 668.3 731.0 –120.1 II ............... 1,782.3 1,354.9 364.6 990.3 291.5 29.7 94.7 109.1 1,850.4 384.3 1,466.1 692.9 773.2 –68.2 III .............. 1,805.4 1,354.6 348.8 1,005.8 314.5 3.2 110.3 114.9 1,833.1 351.0 1,482.1 717.5 764.6 –27.7 IV .............. 1,905.4 1,465.2 445.1 1,020.1 331.7 7.9 105.9 128.2 1,913.6 368.6 1,545.1 727.6 817.5 –8.22012: I ................ 2,142.5 1,726.7 462.5 1,264.2 408.7 34.5 128.8 149.9 2,162.1 437.2 1,724.9 727.4 997.5 –19.5 II ............... 2,169.8 1,740.5 447.7 1,292.8 410.5 39.4 146.5 145.3 2,160.0 429.7 1,730.3 739.6 990.7 9.8 III .............. 2,186.6 1,774.0 507.2 1,266.8 387.8 40.8 131.6 142.5 2,208.5 439.1 1,769.4 746.7 1,022.7 –22.0 IV .............. 2,221.1 1,803.0 492.1 1,310.9 410.1 33.6 144.4 159.0 2,229.5 433.2 1,796.4 867.6 928.7 –8.42013: I ................ 2,180.0 1,781.5 486.9 1,294.6 389.7 38.3 150.2 148.9 2,193.1 408.2 1,784.8 763.8 1,021.0 –13.0 II ............... 2,248.6 1,845.5 511.9 1,333.6 381.8 47.2 151.1 169.9 2,239.7 418.2 1,821.4 1,037.3 784.2 8.9 III .............. ................ ................ ................ ................ ................ ................ ................ ................ ................ ................ ................ p 858.0 ................ ..................
1 See p. 4 for profits with inventory valuation and capital consumption adjustments.2 Includes rest of the world, not shown separately.3 Includes industries not shown separately.
In the second quarter of 2013, according to revised estimates, corporate profits before tax rose $46.6 billion (annual rate) and profits after tax rose $36.6 billion.
9
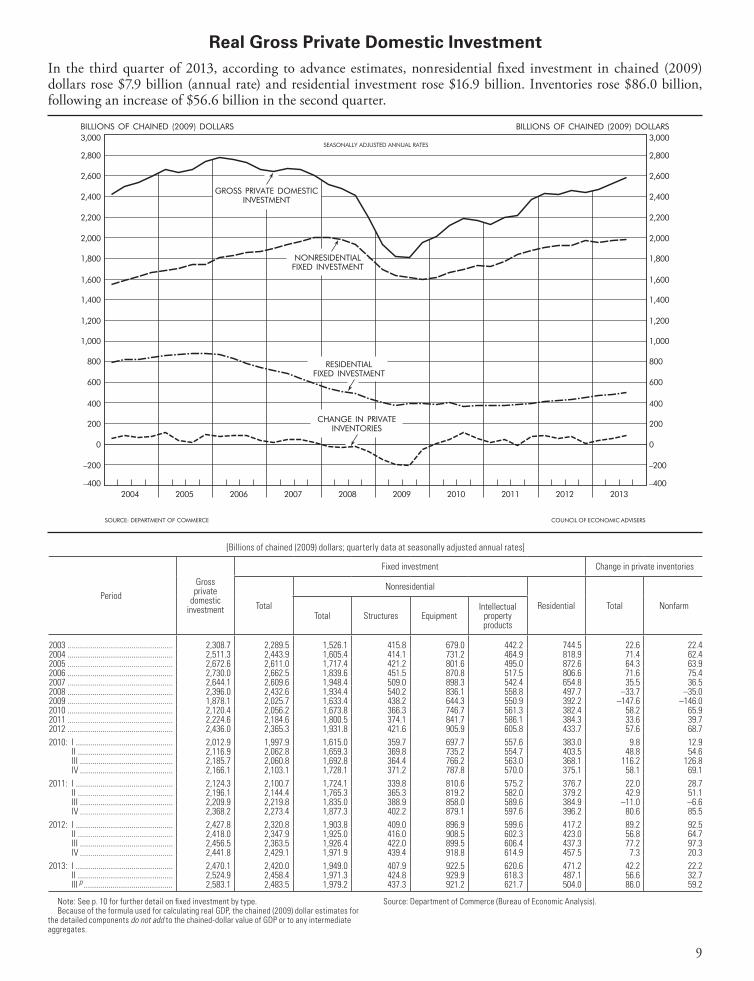
Real Gross Private Domestic Investment
Note: See p. 10 for further detail on fixed investment by type.Because of the formula used for calculating real GDP, the chained (2009) dollar estimates for
the detailed components do not add to the chained-dollar value of GDP or to any intermediate aggregates.
Source: Department of Commerce (Bureau of Economic Analysis).
[Billions of chained (2009) dollars; quarterly data at seasonally adjusted annual rates]
PeriodGross private
domestic investment
Fixed investment Change in private inventories
Total
Nonresidential
Residential Total NonfarmTotal Structures Equipment
Intellectual property products
2003 ................................................... 2,308.7 2,289.5 1,526.1 415.8 679.0 442.2 744.5 22.6 22.42004 ................................................... 2,511.3 2,443.9 1,605.4 414.1 731.2 464.9 818.9 71.4 62.42005 ................................................... 2,672.6 2,611.0 1,717.4 421.2 801.6 495.0 872.6 64.3 63.92006 ................................................... 2,730.0 2,662.5 1,839.6 451.5 870.8 517.5 806.6 71.6 75.42007 ................................................... 2,644.1 2,609.6 1,948.4 509.0 898.3 542.4 654.8 35.5 36.52008 ................................................... 2,396.0 2,432.6 1,934.4 540.2 836.1 558.8 497.7 –33.7 –35.02009 ................................................... 1,878.1 2,025.7 1,633.4 438.2 644.3 550.9 392.2 –147.6 –146.02010 ................................................... 2,120.4 2,056.2 1,673.8 366.3 746.7 561.3 382.4 58.2 65.92011 ................................................... 2,224.6 2,184.6 1,800.5 374.1 841.7 586.1 384.3 33.6 39.72012 ................................................... 2,436.0 2,365.3 1,931.8 421.6 905.9 605.8 433.7 57.6 68.72010: I ............................................... 2,012.9 1,997.9 1,615.0 359.7 697.7 557.6 383.0 9.8 12.9 II .............................................. 2,116.9 2,062.8 1,659.3 369.8 735.2 554.7 403.5 48.8 54.6 III ............................................. 2,185.7 2,060.8 1,692.8 364.4 766.2 563.0 368.1 116.2 126.8 IV ............................................. 2,166.1 2,103.1 1,728.1 371.2 787.8 570.0 375.1 58.1 69.12011: I ............................................... 2,124.3 2,100.7 1,724.1 339.8 810.6 575.2 376.7 22.0 28.7 II .............................................. 2,196.1 2,144.4 1,765.3 365.3 819.2 582.0 379.2 42.9 51.1 III ............................................. 2,209.9 2,219.8 1,835.0 388.9 858.0 589.6 384.9 –11.0 –6.6 IV ............................................. 2,368.2 2,273.4 1,877.3 402.2 879.1 597.6 396.2 80.6 85.52012: I ............................................... 2,427.8 2,320.8 1,903.8 409.0 896.9 599.6 417.2 89.2 92.5 II .............................................. 2,418.0 2,347.9 1,925.0 416.0 908.5 602.3 423.0 56.8 64.7 III ............................................. 2,456.5 2,363.5 1,926.4 422.0 899.5 606.4 437.3 77.2 97.3 IV ............................................. 2,441.8 2,429.1 1,971.9 439.4 918.8 614.9 457.5 7.3 20.32013: I ............................................... 2,470.1 2,420.0 1,949.0 407.9 922.5 620.6 471.2 42.2 22.2 II .............................................. 2,524.9 2,458.4 1,971.3 424.8 929.9 618.3 487.1 56.6 32.7 III p ........................................... 2,583.1 2,483.5 1,979.2 437.3 921.2 621.7 504.0 86.0 59.2
In the third quarter of 2013, according to advance estimates, nonresidential fixed investment in chained (2009) dollars rose $7.9 billion (annual rate) and residential investment rose $16.9 billion. Inventories rose $86.0 billion, following an increase of $56.6 billion in the second quarter.
10
Real Private Fixed Investment by Type[Billions of chained (2009) dollars; quarterly data at seasonally adjusted annual rates]
PeriodTotal fixed
invest-ment
Nonresidential Residential
Total nonresi-dential
Structures
Equipment Intellectual property products
Total resi-
dential 2
Structures
Total 2
Information processing equipment
Industrial equip-ment
Transpor-tation equip-ment
Total 2 SoftwareResearch
and develop-ment 3
Total 2 Single familyTotal
Computers and
peripheral equipment 1
Other
2003 ............ 2,289.5 1,526.1 415.8 679.0 185.8 ................... 147.3 172.2 154.8 442.2 189.0 189.1 744.5 735.9 362.22004 ............ 2,443.9 1,605.4 414.1 731.2 204.5 ................... 160.7 169.1 176.5 464.9 207.9 191.0 818.9 809.2 405.72005 ............ 2,611.0 1,717.4 421.2 801.6 222.2 ................... 172.6 183.6 197.9 495.0 221.2 202.3 872.6 862.5 433.02006 ............ 2,662.5 1,839.6 451.5 870.8 250.9 ................... 187.5 199.1 212.6 517.5 230.3 215.0 806.6 796.3 390.72007 ............ 2,609.6 1,948.4 509.0 898.3 279.9 ................... 207.9 205.3 203.6 542.4 244.2 227.9 654.8 644.9 283.72008 ............ 2,432.6 1,934.4 540.2 836.1 281.0 ................... 204.2 195.5 156.9 558.8 256.2 235.5 497.7 488.4 178.22009 ............ 2,025.7 1,633.4 438.2 644.3 256.1 ................... 179.3 152.1 70.6 550.9 256.8 229.0 392.2 383.9 105.32010 ............ 2,056.2 1,673.8 366.3 746.7 281.4 ................... 196.8 151.3 136.9 561.3 254.2 234.4 382.4 373.6 114.42011 ............ 2,184.6 1,800.5 374.1 841.7 287.9 ................... 204.3 175.0 181.0 586.1 269.8 241.8 384.3 375.1 109.22012 ............ 2,365.3 1,931.8 421.6 905.9 295.7 ................... 207.8 184.6 221.0 605.8 285.9 245.7 433.7 424.2 132.12010: I ........ 1,997.9 1,615.0 359.7 697.7 276.0 ................... 188.5 143.0 109.7 557.6 256.0 232.7 383.0 374.4 115.7 II ....... 2,062.8 1,659.3 369.8 735.2 277.8 ................... 191.5 151.1 130.9 554.7 250.9 231.5 403.5 394.6 121.7 III ...... 2,060.8 1,692.8 364.4 766.2 282.5 ................... 199.5 152.8 152.0 563.0 253.3 235.6 368.1 359.3 112.6 IV ...... 2,103.1 1,728.1 371.2 787.8 289.5 ................... 207.7 158.3 155.1 570.0 256.7 237.8 375.1 366.2 107.72011: I ........ 2,100.7 1,724.1 339.8 810.6 283.6 ................... 205.2 166.7 166.0 575.2 261.8 239.0 376.7 367.7 108.2 II ....... 2,144.4 1,765.3 365.3 819.2 289.0 ................... 205.1 166.8 167.7 582.0 266.7 241.2 379.2 370.1 107.2 III ...... 2,219.8 1,835.0 388.9 858.0 288.6 ................... 203.8 179.0 185.5 589.6 272.2 242.9 384.9 375.7 109.5 IV ...... 2,273.4 1,877.3 402.2 879.1 290.4 ................... 203.2 187.7 204.6 597.6 278.6 244.1 396.2 386.8 111.72012: I ........ 2,320.8 1,903.8 409.0 896.9 300.0 ................... 208.0 180.5 217.0 599.6 279.7 245.3 417.2 407.8 120.8 II ....... 2,347.9 1,925.0 416.0 908.5 292.0 ................... 204.1 184.9 229.1 602.3 284.0 244.1 423.0 413.7 126.6 III ...... 2,363.5 1,926.4 422.0 899.5 288.6 ................... 208.7 185.0 218.8 606.4 286.6 245.7 437.3 427.7 134.6 IV ...... 2,429.1 1,971.9 439.4 918.8 302.1 ................... 210.3 187.8 219.4 614.9 293.1 247.6 457.5 447.8 146.42013: I ........ 2,420.0 1,949.0 407.9 922.5 300.0 ................... 211.8 188.0 215.1 620.6 298.6 247.4 471.2 461.2 155.8 II ....... 2,458.4 1,971.3 424.8 929.9 306.8 ................... 221.6 187.5 218.5 618.3 294.1 248.8 487.1 476.9 160.5 III p .... 2,483.5 1,979.2 437.3 921.2 303.8 ................... 219.1 195.2 216.2 621.7 296.5 250.2 504.0 493.6 163.8
1 Because computers exhibit rapid changes in prices relative to other prices in the economy, the chained-dollar estimates should not be used to measure the component’s relative importance or its contribution to the growth rate of more aggregate series. The quantity index for computers can be used to accurately measure the real growth rate of this series. For information on this component, see Survey of Current Business Table 5.3.1 (for growth rates), Table 5.3.2 (for contributions), and Table 5.3.3 (for quantity indexes).
2 Includes other items, not shown separately.3 Research and development investment excludes expenditures for software development.
Note: Because of the formula used for calculating real GDP, the chained (2009) dollar estimates for the detailed components do not add to the chained-dollar value of GDP or to any intermediate aggregates.
Source: Department of Commerce (Bureau of Economic Analysis).
Business Investment[Billions of dollars]
Period
Capital expenditures
Total capital
expendi-tures
By industry
For compa-
nies without employ-
ees
Total by
industry
Forestry, fishing,
and agri-cultural services
Mining Utilities Con-struction
Manu-factur-
ing
Whole-sale trade
Retail trade
Trans-portation
and ware-
housing
Informa-tion
Finance and
insur-ance
Real estate
and rental and
leasing
Profes-sional, scien-tific, and
technical services
Health care and
social assis-tance
Other 1
For companies with employees
1996 ........ 807.1 ............. ............. ............. ............. ............. ............. ............. ............. ............. ............. ............. ............. ............. ............. ............. ...............1997 ........ 871.8 ............. ............. ............. ............. ............. ............. ............. ............. ............. ............. ............. ............. ............. ............. ............. ...............1998 ........ 970.9 896.5 0.9 40.4 36.0 26.9 203.6 29.2 57.3 51.3 96.5 118.2 85.2 22.3 47.1 81.7 74.41999 ........ 1,047.0 974.6 1.7 30.6 42.8 23.1 196.4 32.4 64.1 57.3 122.8 130.1 100.6 29.5 51.3 91.8 72.32000 ........ 1,161.0 1,089.9 1.5 42.5 61.3 25.0 214.8 33.6 69.8 59.9 160.2 133.7 92.5 34.1 52.2 108.9 71.22001 ........ 1,109.0 1,052.3 1.5 51.3 82.8 24.8 192.8 30.0 66.9 57.8 144.8 131.1 82.7 30.5 52.9 102.5 56.72002 ........ 997.9 917.5 1.9 42.5 65.5 24.8 157.2 26.8 59.3 47.1 88.2 128.4 94.5 25.9 59.3 96.1 80.42003 ........ 975.0 886.8 1.9 50.5 54.6 23.2 149.1 26.0 65.9 44.5 80.5 120.8 88.0 24.7 61.2 96.2 88.22004 ........ 1,042.1 953.2 2.1 51.3 50.4 28.6 156.7 32.3 72.2 46.1 83.5 153.6 91.6 26.7 64.6 93.6 88.92005 ........ 1,144.8 1,062.5 2.7 66.7 58.0 30.1 165.6 40.6 73.5 56.9 91.4 161.4 103.0 33.1 73.8 105.6 82.22006 ........ 1,309.9 1,217.1 2.7 99.3 69.8 30.3 192.4 36.6 86.7 68.0 104.4 163.1 132.1 30.3 75.3 126.3 92.82007 ........ 1,354.7 1,270.5 2.1 120.7 85.4 36.7 197.3 30.8 82.5 67.4 106.1 173.4 117.5 31.8 84.2 134.8 84.22008 ........ 1,374.2 1,294.5 2.3 149.3 98.7 40.8 213.1 32.4 73.2 79.6 103.3 132.9 106.9 33.0 90.2 138.7 79.72009 ........ 1,090.7 1,015.3 2.2 100.6 103.0 19.8 155.2 25.3 58.4 55.7 88.4 99.5 72.9 28.2 79.4 127.0 75.42010 ........ 1,105.7 1,036.2 3.3 115.7 94.5 17.9 160.8 31.1 65.3 59.0 97.2 103.1 81.3 28.2 78.4 100.6 69.52011 ......... 1,225.6 1,152.2 3.1 149.5 98.0 21.8 193.4 35.5 67.4 72.3 99.7 109.6 91.1 28.2 83.2 99.6 73.4
1 Includes the following industries: Management of companies and enterprises; administrative and support and waste management; educational services; arts, entertainment, and recreation; accommodation and food services; and other services (except public administration). Also includes an item for structure and equipment expenditures serving multiple industry categories.
Note: Data from Annual Capital Expenditures. Industry data are based on the North American Industry Classification System (NAICS).
Data shown in this table are capital expenditures for both new and used structures and equipment.
Source: Department of Commerce (Bureau of the Census).
11
1 Civilian labor force (or employment) as percent of civilian noninstitutional population; and unemployment as percent of civilian labor force.
2 Not strictly comparable with earlier data.
Note: Beginning January 2013, data reflect revised population controls and are not strictly comparable with earlier data.
See Employment and Earnings for details on breaks in series.
Source: Department of Labor (Bureau of Labor Statistics).
Status of the Labor Force
[Thousands of persons 16 years of age and over, except as noted; monthly data seasonally adjusted except as noted by NSA]
Period
Civilian noninsti-tutional popula-
tion (NSA)
Civilian labor force
Civilian employment Unemployment
Not in
labor force
Percent 1
TotalMen
20 years and over
Women 20 years
and over
Both sexes 16–19 years
TotalMen
20 years and over
Women 20 years
and over
Both sexes 16–19 years
Labor force
participa-tion rate
Employ-ment/
popula-tion ratio
Unemploy-ment rate
2003 2 .................. 221,168 146,510 137,736 70,415 61,402 5,919 8,774 4,209 3,314 1,251 74,658 66.2 62.3 6.02004 2 .................. 223,357 147,401 139,252 71,572 61,773 5,907 8,149 3,791 3,150 1,208 75,956 66.0 62.3 5.52005 2 .................. 226,082 149,320 141,730 73,050 62,702 5,978 7,591 3,392 3,013 1,186 76,762 66.0 62.7 5.12006 2 .................. 228,815 151,428 144,427 74,431 63,834 6,162 7,001 3,131 2,751 1,119 77,387 66.2 63.1 4.62007 2 .................. 231,867 153,124 146,047 75,337 64,799 5,911 7,078 3,259 2,718 1,101 78,743 66.0 63.0 4.62008 2 .................. 233,788 154,287 145,362 74,750 65,039 5,573 8,924 4,297 3,342 1,285 79,501 66.0 62.2 5.82009 2 .................. 235,801 154,142 139,877 71,341 63,699 4,837 14,265 7,555 5,157 1,552 81,659 65.4 59.3 9.32010 2 .................. 237,830 153,889 139,064 71,230 63,456 4,378 14,825 7,763 5,534 1,528 83,941 64.7 58.5 9.62011 2 .................. 239,618 153,617 139,869 72,182 63,360 4,327 13,747 6,898 5,450 1,400 86,001 64.1 58.4 8.92012 2 .................. 243,284 154,975 142,469 73,403 64,640 4,426 12,506 5,984 5,125 1,397 88,310 63.7 58.6 8.12012: Oct ........... 243,983 155,576 143,328 73,845 65,014 4,469 12,248 5,834 5,027 1,387 88,407 63.8 58.7 7.9 Nov .......... 244,174 155,319 143,277 73,821 64,988 4,468 12,042 5,747 4,918 1,376 88,855 63.6 58.7 7.8 Dec ........... 244,350 155,511 143,305 73,949 64,954 4,402 12,206 5,746 5,105 1,355 88,839 63.6 58.6 7.82013: Jan 2 ......... 244,663 155,654 143,322 74,139 64,675 4,508 12,332 5,877 5,074 1,381 89,008 63.6 58.6 7.9 Feb ........... 244,828 155,524 143,492 74,249 64,867 4,376 12,032 5,661 4,905 1,466 89,304 63.5 58.6 7.7 Mar .......... 244,995 155,028 143,286 74,228 64,707 4,351 11,742 5,519 4,837 1,386 89,967 63.3 58.5 7.6 Apr ........... 245,175 155,238 143,579 74,159 65,101 4,320 11,659 5,644 4,642 1,372 89,936 63.3 58.6 7.5 May .......... 245,363 155,658 143,898 74,124 65,329 4,445 11,760 5,754 4,566 1,441 89,705 63.4 58.6 7.6 June ......... 245,552 155,835 144,058 74,276 65,314 4,469 11,777 5,607 4,761 1,409 89,717 63.5 58.7 7.6 July .......... 245,756 155,798 144,285 74,328 65,489 4,469 11,514 5,581 4,544 1,388 89,957 63.4 58.7 7.4 Aug .......... 245,959 155,486 144,170 74,010 65,750 4,410 11,316 5,629 4,390 1,297 90,473 63.2 58.6 7.3 Sept ......... 246,168 155,559 144,303 74,143 65,582 4,578 11,255 5,654 4,354 1,248 90,609 63.2 58.6 7.2 Oct ........... 246,381 154,839 143,568 73,869 65,255 4,443 11,272 5,551 4,451 1,269 91,541 62.8 58.3 7.3
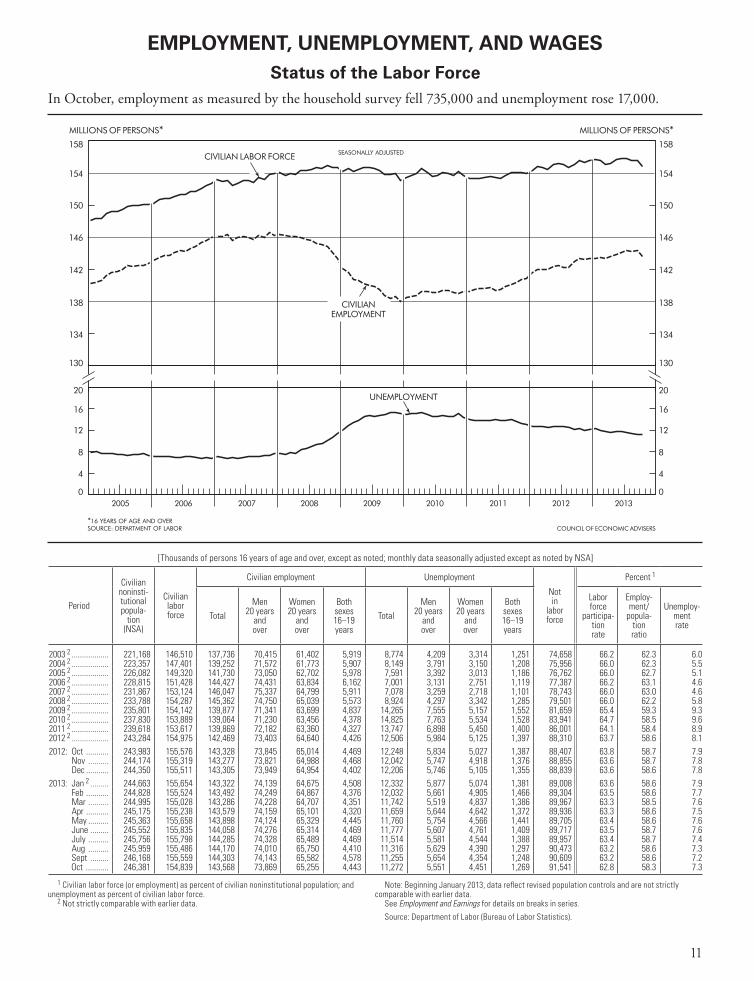
EMPLOYMENT, UNEMPLOYMENT, AND WAGES
In October, employment as measured by the household survey fell 735,000 and unemployment rose 17,000.
12
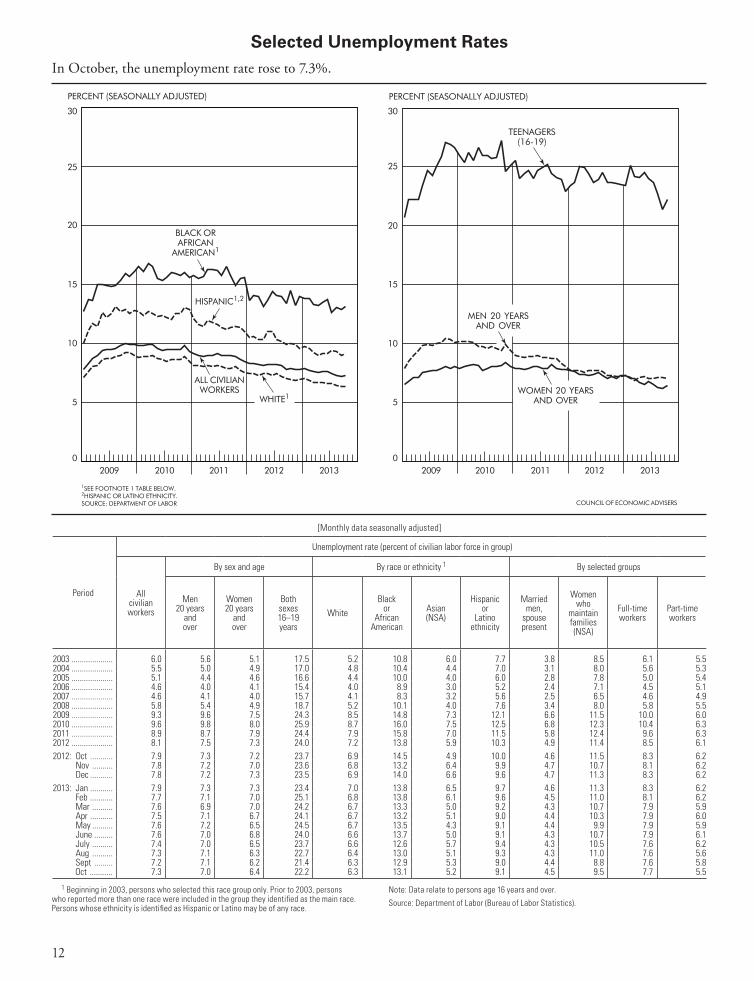
Selected Unemployment Rates
1 Beginning in 2003, persons who selected this race group only. Prior to 2003, persons who reported more than one race were included in the group they identified as the main race. Persons whose ethnicity is identified as Hispanic or Latino may be of any race.
Note: Data relate to persons age 16 years and over.
Source: Department of Labor (Bureau of Labor Statistics).
[Monthly data seasonally adjusted]
Period
Unemployment rate (percent of civilian labor force in group)
All civilian workers
By sex and age By race or ethnicity 1 By selected groups
Men 20 years
and over
Women 20 years
and over
Both sexes 16–19 years
WhiteBlack
or African
American
Asian (NSA)
Hispanic or
Latino ethnicity
Married men,
spouse present
Women who
maintain families (NSA)
Full-time workers
Part-time workers
2003 .................... 6.0 5.6 5.1 17.5 5.2 10.8 6.0 7.7 3.8 8.5 6.1 5.52004 .................... 5.5 5.0 4.9 17.0 4.8 10.4 4.4 7.0 3.1 8.0 5.6 5.32005 .................... 5.1 4.4 4.6 16.6 4.4 10.0 4.0 6.0 2.8 7.8 5.0 5.42006 .................... 4.6 4.0 4.1 15.4 4.0 8.9 3.0 5.2 2.4 7.1 4.5 5.12007 .................... 4.6 4.1 4.0 15.7 4.1 8.3 3.2 5.6 2.5 6.5 4.6 4.92008 .................... 5.8 5.4 4.9 18.7 5.2 10.1 4.0 7.6 3.4 8.0 5.8 5.52009 .................... 9.3 9.6 7.5 24.3 8.5 14.8 7.3 12.1 6.6 11.5 10.0 6.02010 .................... 9.6 9.8 8.0 25.9 8.7 16.0 7.5 12.5 6.8 12.3 10.4 6.32011 .................... 8.9 8.7 7.9 24.4 7.9 15.8 7.0 11.5 5.8 12.4 9.6 6.32012 .................... 8.1 7.5 7.3 24.0 7.2 13.8 5.9 10.3 4.9 11.4 8.5 6.12012: Oct ........... 7.9 7.3 7.2 23.7 6.9 14.5 4.9 10.0 4.6 11.5 8.3 6.2 Nov .......... 7.8 7.2 7.0 23.6 6.8 13.2 6.4 9.9 4.7 10.7 8.1 6.2 Dec ........... 7.8 7.2 7.3 23.5 6.9 14.0 6.6 9.6 4.7 11.3 8.3 6.22013: Jan ........... 7.9 7.3 7.3 23.4 7.0 13.8 6.5 9.7 4.6 11.3 8.3 6.2 Feb ........... 7.7 7.1 7.0 25.1 6.8 13.8 6.1 9.6 4.5 11.0 8.1 6.2 Mar .......... 7.6 6.9 7.0 24.2 6.7 13.3 5.0 9.2 4.3 10.7 7.9 5.9 Apr ........... 7.5 7.1 6.7 24.1 6.7 13.2 5.1 9.0 4.4 10.3 7.9 6.0 May .......... 7.6 7.2 6.5 24.5 6.7 13.5 4.3 9.1 4.4 9.9 7.9 5.9 June ......... 7.6 7.0 6.8 24.0 6.6 13.7 5.0 9.1 4.3 10.7 7.9 6.1 July .......... 7.4 7.0 6.5 23.7 6.6 12.6 5.7 9.4 4.3 10.5 7.6 6.2 Aug .......... 7.3 7.1 6.3 22.7 6.4 13.0 5.1 9.3 4.3 11.0 7.6 5.6 Sept ......... 7.2 7.1 6.2 21.4 6.3 12.9 5.3 9.0 4.4 8.8 7.6 5.8 Oct ........... 7.3 7.0 6.4 22.2 6.3 13.1 5.2 9.1 4.5 9.5 7.7 5.5
In October, the unemployment rate rose to 7.3%.
13
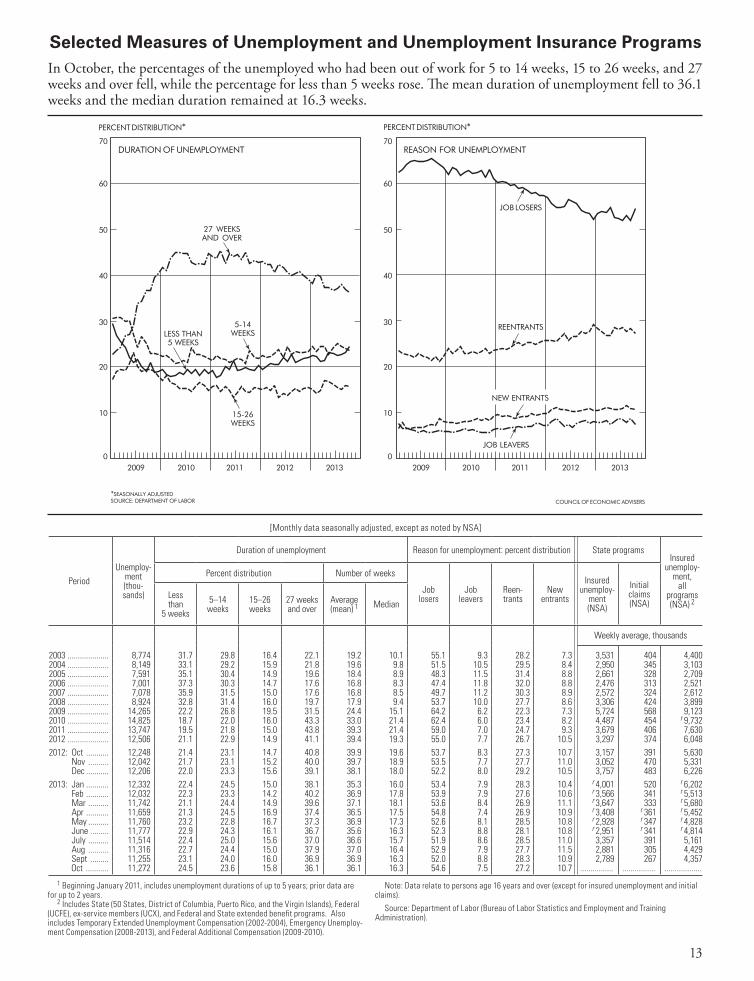
Selected Measures of Unemployment and Unemployment Insurance Programs
1 Beginning January 2011, includes unemployment durations of up to 5 years; prior data are for up to 2 years.
2 Includes State (50 States, District of Columbia, Puerto Rico, and the Virgin Islands), Federal (UCFE), ex-service members (UCX), and Federal and State extended benefit programs. Also includes Temporary Extended Unemployment Compensation (2002-2004), Emergency Unemploy-ment Compensation (2008-2013), and Federal Additional Compensation (2009-2010).
Note: Data relate to persons age 16 years and over (except for insured unemployment and initial claims).
Source: Department of Labor (Bureau of Labor Statistics and Employment and Training Administration).
[Monthly data seasonally adjusted, except as noted by NSA]
PeriodUnemploy-
ment (thou-sands)
Duration of unemployment Reason for unemployment: percent distribution State programsInsured
unemploy-ment,
all programs (NSA) 2
Percent distribution Number of weeks
Job losers
Job leavers
Reen-trants
New entrants
Insured unemploy-
ment (NSA)
Initial claims (NSA)
Less than
5 weeks5–14
weeks15–26 weeks
27 weeks and over
Average (mean) 1 Median
Weekly average, thousands
2003 .................... 8,774 31.7 29.8 16.4 22.1 19.2 10.1 55.1 9.3 28.2 7.3 3,531 404 4,4002004 .................... 8,149 33.1 29.2 15.9 21.8 19.6 9.8 51.5 10.5 29.5 8.4 2,950 345 3,1032005 .................... 7,591 35.1 30.4 14.9 19.6 18.4 8.9 48.3 11.5 31.4 8.8 2,661 328 2,7092006 .................... 7,001 37.3 30.3 14.7 17.6 16.8 8.3 47.4 11.8 32.0 8.8 2,476 313 2,5212007 .................... 7,078 35.9 31.5 15.0 17.6 16.8 8.5 49.7 11.2 30.3 8.9 2,572 324 2,6122008 .................... 8,924 32.8 31.4 16.0 19.7 17.9 9.4 53.7 10.0 27.7 8.6 3,306 424 3,8992009 .................... 14,265 22.2 26.8 19.5 31.5 24.4 15.1 64.2 6.2 22.3 7.3 5,724 568 9,1232010 .................... 14,825 18.7 22.0 16.0 43.3 33.0 21.4 62.4 6.0 23.4 8.2 4,487 454 r 9,7322011 .................... 13,747 19.5 21.8 15.0 43.8 39.3 21.4 59.0 7.0 24.7 9.3 3,679 406 7,6302012 .................... 12,506 21.1 22.9 14.9 41.1 39.4 19.3 55.0 7.7 26.7 10.5 3,297 374 6,0482012: Oct ........... 12,248 21.4 23.1 14.7 40.8 39.9 19.6 53.7 8.3 27.3 10.7 3,157 391 5,630 Nov .......... 12,042 21.7 23.1 15.2 40.0 39.7 18.9 53.5 7.7 27.7 11.0 3,052 470 5,331 Dec ........... 12,206 22.0 23.3 15.6 39.1 38.1 18.0 52.2 8.0 29.2 10.5 3,757 483 6,2262013: Jan ........... 12,332 22.4 24.5 15.0 38.1 35.3 16.0 53.4 7.9 28.3 10.4 r 4,001 520 r 6,202 Feb ........... 12,032 22.3 23.3 14.2 40.2 36.9 17.8 53.9 7.9 27.6 10.6 r 3,566 341 r 5,513 Mar .......... 11,742 21.1 24.4 14.9 39.6 37.1 18.1 53.6 8.4 26.9 11.1 r 3,647 333 r 5,680 Apr ........... 11,659 21.3 24.5 16.9 37.4 36.5 17.5 54.8 7.4 26.9 10.9 r 3,408 r 361 r 5,452 May .......... 11,760 23.2 22.8 16.7 37.3 36.9 17.3 52.6 8.1 28.5 10.8 r 2,928 r 347 r 4,828 June ......... 11,777 22.9 24.3 16.1 36.7 35.6 16.3 52.3 8.8 28.1 10.8 r 2,951 r 341 r 4,814 July .......... 11,514 22.4 25.0 15.6 37.0 36.6 15.7 51.9 8.6 28.5 11.0 3,357 391 5,161 Aug .......... 11,316 22.7 24.4 15.0 37.9 37.0 16.4 52.9 7.9 27.7 11.5 2,881 305 4,429 Sept ......... 11,255 23.1 24.0 16.0 36.9 36.9 16.3 52.0 8.8 28.3 10.9 2,789 267 4,357 Oct ........... 11,272 24.5 23.6 15.8 36.1 36.1 16.3 54.6 7.5 27.2 10.7 ................ ................ ..................
In October, the percentages of the unemployed who had been out of work for 5 to 14 weeks, 15 to 26 weeks, and 27 weeks and over fell, while the percentage for less than 5 weeks rose. The mean duration of unemployment fell to 36.1 weeks and the median duration remained at 16.3 weeks.
14
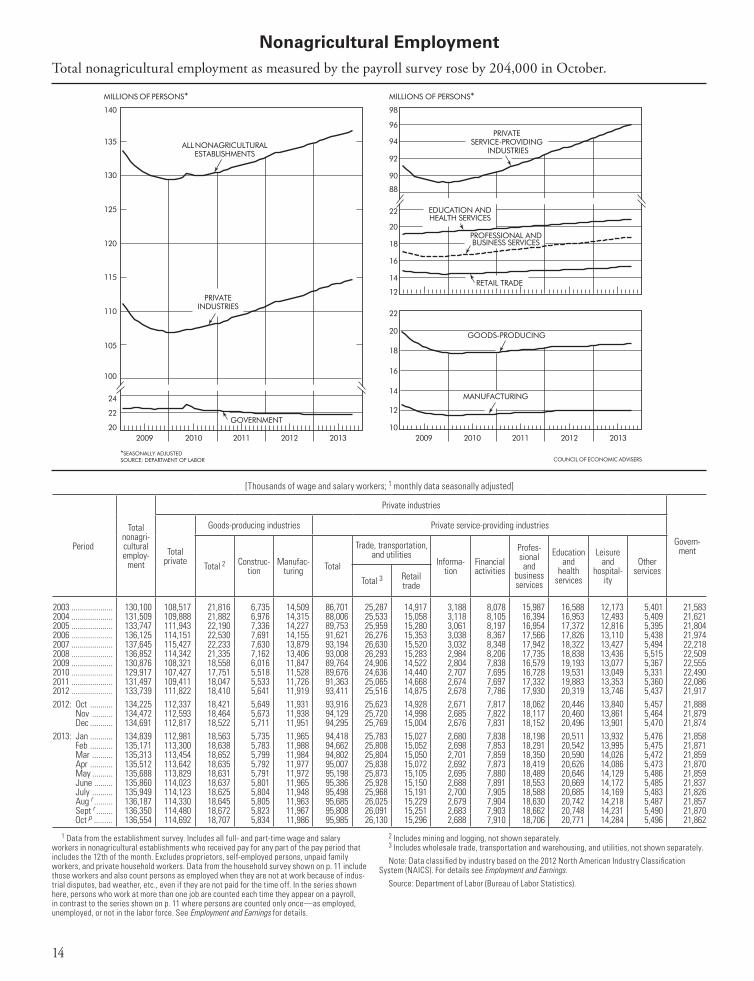
Nonagricultural Employment
1 Data from the establishment survey. Includes all full- and part-time wage and salary workers in nonagricultural establishments who received pay for any part of the pay period that includes the 12th of the month. Excludes proprietors, self-employed persons, unpaid family workers, and private household workers. Data from the household survey shown on p. 11 include those workers and also count persons as employed when they are not at work because of indus-trial disputes, bad weather, etc., even if they are not paid for the time off. In the series shown here, persons who work at more than one job are counted each time they appear on a payroll, in contrast to the series shown on p. 11 where persons are counted only once—as employed, unemployed, or not in the labor force. See Employment and Earnings for details.
2 Includes mining and logging, not shown separately.3 Includes wholesale trade, transportation and warehousing, and utilities, not shown separately.
Note: Data classified by industry based on the 2012 North American Industry Classification System (NAICS). For details see Employment and Earnings.
Source: Department of Labor (Bureau of Labor Statistics).
[Thousands of wage and salary workers; 1 monthly data seasonally adjusted]
Period
Total nonagri-cultural employ-
ment
Private industries
Govern-mentTotal
private
Goods-producing industries Private service-providing industries
Total 2 Construc-tion
Manufac-turing Total
Trade, transportation, and utilities
Informa-tion
Financial activities
Profes-sional and
business services
Education and
health services
Leisure and
hospital-ity
Other services
Total 3 Retail trade
2003 .................... 130,100 108,517 21,816 6,735 14,509 86,701 25,287 14,917 3,188 8,078 15,987 16,588 12,173 5,401 21,5832004 .................... 131,509 109,888 21,882 6,976 14,315 88,006 25,533 15,058 3,118 8,105 16,394 16,953 12,493 5,409 21,6212005 .................... 133,747 111,943 22,190 7,336 14,227 89,753 25,959 15,280 3,061 8,197 16,954 17,372 12,816 5,395 21,8042006 .................... 136,125 114,151 22,530 7,691 14,155 91,621 26,276 15,353 3,038 8,367 17,566 17,826 13,110 5,438 21,9742007 .................... 137,645 115,427 22,233 7,630 13,879 93,194 26,630 15,520 3,032 8,348 17,942 18,322 13,427 5,494 22,2182008 .................... 136,852 114,342 21,335 7,162 13,406 93,008 26,293 15,283 2,984 8,206 17,735 18,838 13,436 5,515 22,5092009 .................... 130,876 108,321 18,558 6,016 11,847 89,764 24,906 14,522 2,804 7,838 16,579 19,193 13,077 5,367 22,5552010 .................... 129,917 107,427 17,751 5,518 11,528 89,676 24,636 14,440 2,707 7,695 16,728 19,531 13,049 5,331 22,4902011 .................... 131,497 109,411 18,047 5,533 11,726 91,363 25,065 14,668 2,674 7,697 17,332 19,883 13,353 5,360 22,0862012 .................... 133,739 111,822 18,410 5,641 11,919 93,411 25,516 14,875 2,678 7,786 17,930 20,319 13,746 5,437 21,9172012: Oct ........... 134,225 112,337 18,421 5,649 11,931 93,916 25,623 14,928 2,671 7,817 18,062 20,446 13,840 5,457 21,888 Nov .......... 134,472 112,593 18,464 5,673 11,938 94,129 25,720 14,998 2,685 7,822 18,117 20,460 13,861 5,464 21,879 Dec ........... 134,691 112,817 18,522 5,711 11,951 94,295 25,769 15,004 2,676 7,831 18,152 20,496 13,901 5,470 21,8742013: Jan ........... 134,839 112,981 18,563 5,735 11,965 94,418 25,783 15,027 2,680 7,838 18,198 20,511 13,932 5,476 21,858 Feb ........... 135,171 113,300 18,638 5,783 11,988 94,662 25,808 15,052 2,698 7,853 18,291 20,542 13,995 5,475 21,871 Mar .......... 135,313 113,454 18,652 5,799 11,984 94,802 25,804 15,050 2,701 7,859 18,350 20,590 14,026 5,472 21,859 Apr ........... 135,512 113,642 18,635 5,792 11,977 95,007 25,838 15,072 2,692 7,873 18,419 20,626 14,086 5,473 21,870 May .......... 135,688 113,829 18,631 5,791 11,972 95,198 25,873 15,105 2,695 7,880 18,489 20,646 14,129 5,486 21,859 June ......... 135,860 114,023 18,637 5,801 11,965 95,386 25,928 15,150 2,688 7,891 18,553 20,669 14,172 5,485 21,837 July .......... 135,949 114,123 18,625 5,804 11,948 95,498 25,968 15,191 2,700 7,905 18,588 20,685 14,169 5,483 21,826 Aug r ......... 136,187 114,330 18,645 5,805 11,963 95,685 26,025 15,229 2,679 7,904 18,630 20,742 14,218 5,487 21,857 Sept r ........ 136,350 114,480 18,672 5,823 11,967 95,808 26,091 15,251 2,683 7,903 18,662 20,748 14,231 5,490 21,870 Oct p ......... 136,554 114,692 18,707 5,834 11,986 95,985 26,130 15,296 2,688 7,910 18,706 20,771 14,284 5,496 21,862
Total nonagricultural employment as measured by the payroll survey rose by 204,000 in October.
15
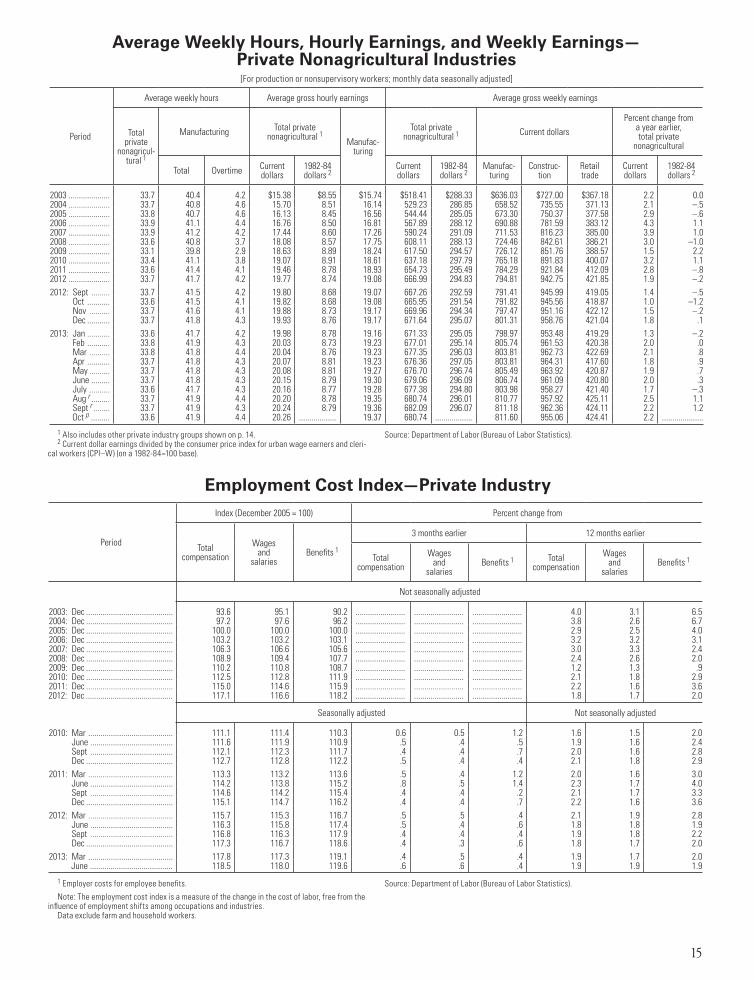
Employment Cost Index—Private Industry
Period
Index (December 2005 = 100) Percent change from
Total compensation
Wages and
salariesBenefits 1
3 months earlier 12 months earlier
Total compensation
Wages and
salariesBenefits 1 Total
compensationWages
and salaries
Benefits 1
Not seasonally adjusted
2003: Dec .......................................... 93.6 95.1 90.2 ........................ ........................ ........................ 4.0 3.1 6.52004: Dec .......................................... 97.2 97.6 96.2 ........................ ........................ ........................ 3.8 2.6 6.72005: Dec .......................................... 100.0 100.0 100.0 ........................ ........................ ........................ 2.9 2.5 4.02006: Dec .......................................... 103.2 103.2 103.1 ........................ ........................ ........................ 3.2 3.2 3.12007: Dec .......................................... 106.3 106.6 105.6 ........................ ........................ ........................ 3.0 3.3 2.42008: Dec .......................................... 108.9 109.4 107.7 ........................ ........................ ........................ 2.4 2.6 2.02009: Dec .......................................... 110.2 110.8 108.7 ........................ ........................ ........................ 1.2 1.3 .92010: Dec .......................................... 112.5 112.8 111.9 ........................ ........................ ........................ 2.1 1.8 2.92011: Dec .......................................... 115.0 114.6 115.9 ........................ ........................ ........................ 2.2 1.6 3.62012: Dec .......................................... 117.1 116.6 118.2 ........................ ........................ ........................ 1.8 1.7 2.0
Seasonally adjusted Not seasonally adjusted
2010: Mar ......................................... 111.1 111.4 110.3 0.6 0.5 1.2 1.6 1.5 2.0 June ........................................ 111.6 111.9 110.9 .5 .4 .5 1.9 1.6 2.4 Sept ........................................ 112.1 112.3 111.7 .4 .4 .7 2.0 1.6 2.8 Dec .......................................... 112.7 112.8 112.2 .5 .4 .4 2.1 1.8 2.92011: Mar ......................................... 113.3 113.2 113.6 .5 .4 1.2 2.0 1.6 3.0 June ........................................ 114.2 113.8 115.2 .8 .5 1.4 2.3 1.7 4.0 Sept ........................................ 114.6 114.2 115.4 .4 .4 .2 2.1 1.7 3.3 Dec .......................................... 115.1 114.7 116.2 .4 .4 .7 2.2 1.6 3.62012: Mar ......................................... 115.7 115.3 116.7 .5 .5 .4 2.1 1.9 2.8 June ........................................ 116.3 115.8 117.4 .5 .4 .6 1.8 1.8 1.9 Sept ........................................ 116.8 116.3 117.9 .4 .4 .4 1.9 1.8 2.2 Dec .......................................... 117.3 116.7 118.6 .4 .3 .6 1.8 1.7 2.02013: Mar ......................................... 117.8 117.3 119.1 .4 .5 .4 1.9 1.7 2.0 June ........................................ 118.5 118.0 119.6 .6 .6 .4 1.9 1.9 1.9
Average Weekly Hours, Hourly Earnings, and Weekly Earnings—Private Nonagricultural Industries[For production or nonsupervisory workers; monthly data seasonally adjusted]
Period
Average weekly hours Average gross hourly earnings Average gross weekly earnings
Total private
nonagricul-tural 1
Manufacturing Total private nonagricultural 1 Manufac-
turing
Total private nonagricultural 1 Current dollars
Percent change from a year earlier, total private
nonagricultural
Total Overtime Current dollars
1982-84 dollars 2
Current dollars
1982-84 dollars 2
Manufac-turing
Construc-tion
Retail trade
Current dollars
1982-84 dollars 2
2003 .................... 33.7 40.4 4.2 $15.38 $8.55 $15.74 $518.41 $288.33 $636.03 $727.00 $367.18 2.2 0.02004 .................... 33.7 40.8 4.6 15.70 8.51 16.14 529.23 286.85 658.52 735.55 371.13 2.1 –.52005 .................... 33.8 40.7 4.6 16.13 8.45 16.56 544.44 285.05 673.30 750.37 377.58 2.9 –.62006 .................... 33.9 41.1 4.4 16.76 8.50 16.81 567.89 288.12 690.88 781.59 383.12 4.3 1.12007 .................... 33.9 41.2 4.2 17.44 8.60 17.26 590.24 291.09 711.53 816.23 385.00 3.9 1.02008 .................... 33.6 40.8 3.7 18.08 8.57 17.75 608.11 288.13 724.46 842.61 386.21 3.0 –1.02009 .................... 33.1 39.8 2.9 18.63 8.89 18.24 617.50 294.57 726.12 851.76 388.57 1.5 2.22010 .................... 33.4 41.1 3.8 19.07 8.91 18.61 637.18 297.79 765.18 891.83 400.07 3.2 1.12011 .................... 33.6 41.4 4.1 19.46 8.78 18.93 654.73 295.49 784.29 921.84 412.09 2.8 –.82012 .................... 33.7 41.7 4.2 19.77 8.74 19.08 666.99 294.83 794.81 942.75 421.85 1.9 –.22012: Sept ......... 33.7 41.5 4.2 19.80 8.68 19.07 667.26 292.59 791.41 945.99 419.05 1.4 –.5 Oct ........... 33.6 41.5 4.1 19.82 8.68 19.08 665.95 291.54 791.82 945.56 418.87 1.0 –1.2 Nov .......... 33.7 41.6 4.1 19.88 8.73 19.17 669.96 294.34 797.47 951.16 422.12 1.5 –.2 Dec ........... 33.7 41.8 4.3 19.93 8.76 19.17 671.64 295.07 801.31 958.76 421.04 1.8 .12013: Jan ........... 33.6 41.7 4.2 19.98 8.78 19.16 671.33 295.05 798.97 953.48 419.29 1.3 –.2 Feb ........... 33.8 41.9 4.3 20.03 8.73 19.23 677.01 295.14 805.74 961.53 420.38 2.0 .0 Mar .......... 33.8 41.8 4.4 20.04 8.76 19.23 677.35 296.03 803.81 962.73 422.69 2.1 .8 Apr ........... 33.7 41.8 4.3 20.07 8.81 19.23 676.36 297.05 803.81 964.31 417.60 1.8 .9 May .......... 33.7 41.8 4.3 20.08 8.81 19.27 676.70 296.74 805.49 963.92 420.87 1.9 .7 June ......... 33.7 41.8 4.3 20.15 8.79 19.30 679.06 296.09 806.74 961.09 420.80 2.0 .3 July .......... 33.6 41.7 4.3 20.16 8.77 19.28 677.38 294.80 803.98 958.27 421.40 1.7 –.3 Aug r ......... 33.7 41.9 4.4 20.20 8.78 19.35 680.74 296.01 810.77 957.92 425.11 2.5 1.1 Sept r ........ 33.7 41.9 4.3 20.24 8.79 19.36 682.09 296.07 811.18 962.36 424.11 2.2 1.2 Oct p ......... 33.6 41.9 4.4 20.26 .................. 19.37 680.74 .................. 811.60 955.06 424.41 2.2 ....................
1 Also includes other private industry groups shown on p. 14.2 Current dollar earnings divided by the consumer price index for urban wage earners and cleri-
cal workers (CPI–W) (on a 1982-84=100 base).
Source: Department of Labor (Bureau of Labor Statistics).
1 Employer costs for employee benefits.
Note: The employment cost index is a measure of the change in the cost of labor, free from the influence of employment shifts among occupations and industries.
Data exclude farm and household workers.
Source: Department of Labor (Bureau of Labor Statistics).
16
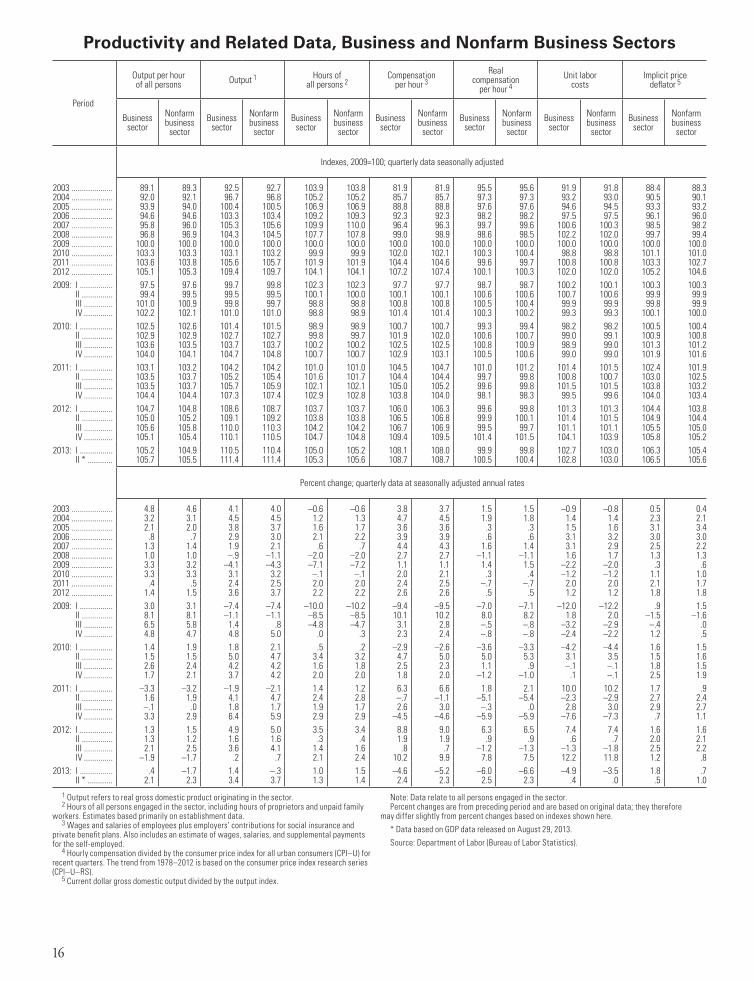
Productivity and Related Data, Business and Nonfarm Business Sectors
Period
Output per hour of all persons Output 1 Hours of
all persons 2Compensation
per hour 3Real
compensation per hour 4
Unit labor costs
Implicit price deflator 5
Business sector
Nonfarm business
sectorBusiness
sectorNonfarm business
sectorBusiness
sectorNonfarm business
sectorBusiness
sectorNonfarm business
sectorBusiness
sectorNonfarm business
sectorBusiness
sectorNonfarm business
sectorBusiness
sectorNonfarm business
sector
Indexes, 2009=100; quarterly data seasonally adjusted
2003 .................... 89.1 89.3 92.5 92.7 103.9 103.8 81.9 81.9 95.5 95.6 91.9 91.8 88.4 88.32004 .................... 92.0 92.1 96.7 96.8 105.2 105.2 85.7 85.7 97.3 97.3 93.2 93.0 90.5 90.12005 .................... 93.9 94.0 100.4 100.5 106.9 106.9 88.8 88.8 97.6 97.6 94.6 94.5 93.3 93.22006 .................... 94.6 94.6 103.3 103.4 109.2 109.3 92.3 92.3 98.2 98.2 97.5 97.5 96.1 96.02007 .................... 95.8 96.0 105.3 105.6 109.9 110.0 96.4 96.3 99.7 99.6 100.6 100.3 98.5 98.22008 .................... 96.8 96.9 104.3 104.5 107.7 107.8 99.0 98.9 98.6 98.5 102.2 102.0 99.7 99.42009 .................... 100.0 100.0 100.0 100.0 100.0 100.0 100.0 100.0 100.0 100.0 100.0 100.0 100.0 100.02010 .................... 103.3 103.3 103.1 103.2 99.9 99.9 102.0 102.1 100.3 100.4 98.8 98.8 101.1 101.02011 .................... 103.6 103.8 105.6 105.7 101.9 101.9 104.4 104.6 99.6 99.7 100.8 100.8 103.3 102.72012 .................... 105.1 105.3 109.4 109.7 104.1 104.1 107.2 107.4 100.1 100.3 102.0 102.0 105.2 104.62009: I ................ 97.5 97.6 99.7 99.8 102.3 102.3 97.7 97.7 98.7 98.7 100.2 100.1 100.3 100.3 II ............... 99.4 99.5 99.5 99.5 100.1 100.0 100.1 100.1 100.6 100.6 100.7 100.6 99.9 99.9 III .............. 101.0 100.9 99.8 99.7 98.8 98.8 100.8 100.8 100.5 100.4 99.9 99.9 99.8 99.9 IV .............. 102.2 102.1 101.0 101.0 98.8 98.9 101.4 101.4 100.3 100.2 99.3 99.3 100.1 100.02010: I ................ 102.5 102.6 101.4 101.5 98.9 98.9 100.7 100.7 99.3 99.4 98.2 98.2 100.5 100.4 II ............... 102.9 102.9 102.7 102.7 99.8 99.7 101.9 102.0 100.6 100.7 99.0 99.1 100.9 100.8 III .............. 103.6 103.5 103.7 103.7 100.2 100.2 102.5 102.5 100.8 100.9 98.9 99.0 101.3 101.2 IV .............. 104.0 104.1 104.7 104.8 100.7 100.7 102.9 103.1 100.5 100.6 99.0 99.0 101.9 101.62011: I ................ 103.1 103.2 104.2 104.2 101.0 101.0 104.5 104.7 101.0 101.2 101.4 101.5 102.4 101.9 II ............... 103.5 103.7 105.2 105.4 101.6 101.7 104.4 104.4 99.7 99.8 100.8 100.7 103.0 102.5 III .............. 103.5 103.7 105.7 105.9 102.1 102.1 105.0 105.2 99.6 99.8 101.5 101.5 103.8 103.2 IV .............. 104.4 104.4 107.3 107.4 102.9 102.8 103.8 104.0 98.1 98.3 99.5 99.6 104.0 103.42012: I ................ 104.7 104.8 108.6 108.7 103.7 103.7 106.0 106.3 99.6 99.8 101.3 101.3 104.4 103.8 II ............... 105.0 105.2 109.1 109.2 103.8 103.8 106.5 106.8 99.9 100.1 101.4 101.5 104.9 104.4 III .............. 105.6 105.8 110.0 110.3 104.2 104.2 106.7 106.9 99.5 99.7 101.1 101.1 105.5 105.0 IV .............. 105.1 105.4 110.1 110.5 104.7 104.8 109.4 109.5 101.4 101.5 104.1 103.9 105.8 105.22013: I ................ 105.2 104.9 110.5 110.4 105.0 105.2 108.1 108.0 99.9 99.8 102.7 103.0 106.3 105.4 II * ............ 105.7 105.5 111.4 111.4 105.3 105.6 108.7 108.7 100.5 100.4 102.8 103.0 106.5 105.6
Percent change; quarterly data at seasonally adjusted annual rates
2003 .................... 4.8 4.6 4.1 4.0 –0.6 –0.6 3.8 3.7 1.5 1.5 –0.9 –0.8 0.5 0.42004 .................... 3.2 3.1 4.5 4.5 1.2 1.3 4.7 4.5 1.9 1.8 1.4 1.4 2.3 2.12005 .................... 2.1 2.0 3.8 3.7 1.6 1.7 3.6 3.6 .3 .3 1.5 1.6 3.1 3.42006 .................... .8 .7 2.9 3.0 2.1 2.2 3.9 3.9 .6 .6 3.1 3.2 3.0 3.02007 .................... 1.3 1.4 1.9 2.1 .6 .7 4.4 4.3 1.6 1.4 3.1 2.9 2.5 2.22008 .................... 1.0 1.0 –.9 –1.1 –2.0 –2.0 2.7 2.7 –1.1 –1.1 1.6 1.7 1.3 1.32009 .................... 3.3 3.2 –4.1 –4.3 –7.1 –7.2 1.1 1.1 1.4 1.5 –2.2 –2.0 .3 .62010 .................... 3.3 3.3 3.1 3.2 –.1 –.1 2.0 2.1 .3 .4 –1.2 –1.2 1.1 1.02011 .................... .4 .5 2.4 2.5 2.0 2.0 2.4 2.5 –.7 –.7 2.0 2.0 2.1 1.72012 .................... 1.4 1.5 3.6 3.7 2.2 2.2 2.6 2.6 .5 .5 1.2 1.2 1.8 1.82009: I ................ 3.0 3.1 –7.4 –7.4 –10.0 –10.2 –9.4 –9.5 –7.0 –7.1 –12.0 –12.2 .9 1.5 II ............... 8.1 8.1 –1.1 –1.1 –8.5 –8.5 10.1 10.2 8.0 8.2 1.8 2.0 –1.5 –1.6 III .............. 6.5 5.8 1.4 .8 –4.8 –4.7 3.1 2.8 –.5 –.8 –3.2 –2.9 –.4 .0 IV .............. 4.8 4.7 4.8 5.0 .0 .3 2.3 2.4 –.8 –.8 –2.4 –2.2 1.2 .52010: I ................ 1.4 1.9 1.8 2.1 .5 .2 –2.9 –2.6 –3.6 –3.3 –4.2 –4.4 1.6 1.5 II ............... 1.5 1.5 5.0 4.7 3.4 3.2 4.7 5.0 5.0 5.3 3.1 3.5 1.5 1.6 III .............. 2.6 2.4 4.2 4.2 1.6 1.8 2.5 2.3 1.1 .9 –.1 –.1 1.8 1.5 IV .............. 1.7 2.1 3.7 4.2 2.0 2.0 1.8 2.0 –1.2 –1.0 .1 –.1 2.5 1.92011: I ................ –3.3 –3.2 –1.9 –2.1 1.4 1.2 6.3 6.6 1.8 2.1 10.0 10.2 1.7 .9 II ............... 1.6 1.9 4.1 4.7 2.4 2.8 –.7 –1.1 –5.1 –5.4 –2.3 –2.9 2.7 2.4 III .............. –.1 .0 1.8 1.7 1.9 1.7 2.6 3.0 –.3 .0 2.8 3.0 2.9 2.7 IV .............. 3.3 2.9 6.4 5.9 2.9 2.9 –4.5 –4.6 –5.9 –5.9 –7.6 –7.3 .7 1.12012: I ................ 1.3 1.5 4.9 5.0 3.5 3.4 8.8 9.0 6.3 6.5 7.4 7.4 1.6 1.6 II ............... 1.3 1.2 1.6 1.6 .3 .4 1.9 1.9 .9 .9 .6 .7 2.0 2.1 III .............. 2.1 2.5 3.6 4.1 1.4 1.6 .8 .7 –1.2 –1.3 –1.3 –1.8 2.5 2.2 IV .............. –1.9 –1.7 .2 .7 2.1 2.4 10.2 9.9 7.8 7.5 12.2 11.8 1.2 .82013: I ................ .4 –1.7 1.4 –.3 1.0 1.5 –4.6 –5.2 –6.0 –6.6 –4.9 –3.5 1.8 .7 II * ............ 2.1 2.3 3.4 3.7 1.3 1.4 2.4 2.3 2.5 2.3 .4 .0 .5 1.0
1 Output refers to real gross domestic product originating in the sector.2 Hours of all persons engaged in the sector, including hours of proprietors and unpaid family
workers. Estimates based primarily on establishment data.3 Wages and salaries of employees plus employers’ contributions for social insurance and
private benefit plans. Also includes an estimate of wages, salaries, and supplemental payments for the self-employed.
4 Hourly compensation divided by the consumer price index for all urban consumers (CPI–U) for recent quarters. The trend from 1978–2012 is based on the consumer price index research series (CPI–U–RS).
5 Current dollar gross domestic output divided by the output index.
Note: Data relate to all persons engaged in the sector.Percent changes are from preceding period and are based on original data; they therefore
may differ slightly from percent changes based on indexes shown here.
* Data based on GDP data released on August 29, 2013.
Source: Department of Labor (Bureau of Labor Statistics).
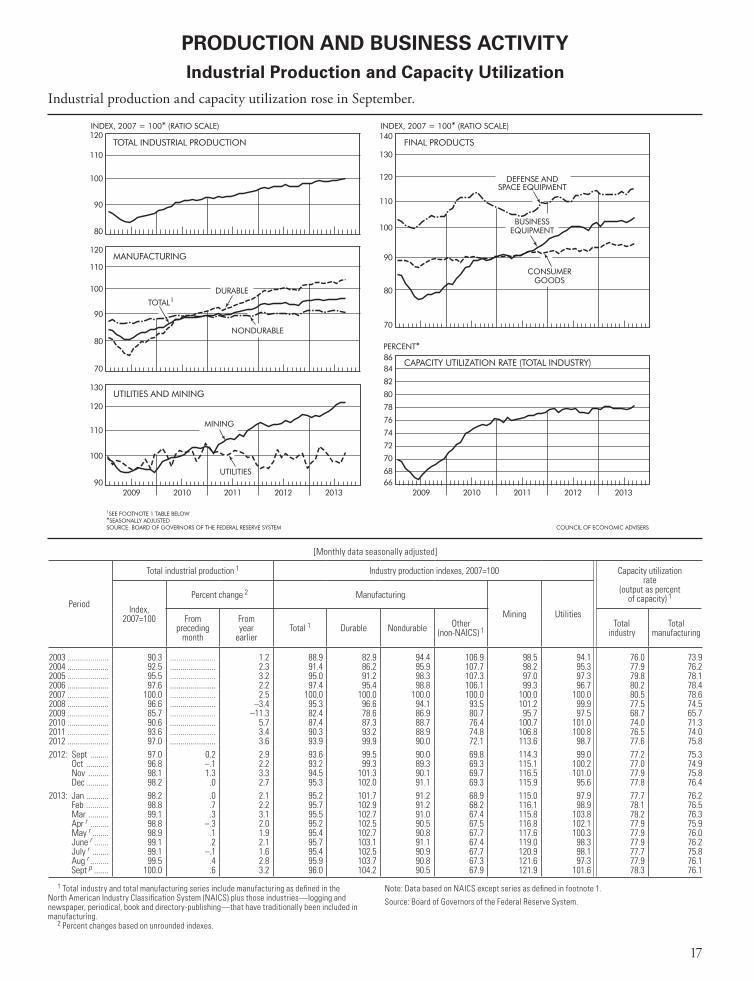
17
Industrial Production and Capacity Utilization
1 Total industry and total manufacturing series include manufacturing as defined in the North American Industry Classification System (NAICS) plus those industries—logging and newspaper, periodical, book and directory-publishing—that have traditionally been included in manufacturing.
2 Percent changes based on unrounded indexes.
Note: Data based on NAICS except series as defined in footnote 1.
Source: Board of Governors of the Federal Reserve System.
[Monthly data seasonally adjusted]
Period
Total industrial production 1 Industry production indexes, 2007=100 Capacity utilization rate
(output as percent of capacity) 1
Index, 2007=100
Percent change 2 Manufacturing
Mining UtilitiesFrom preceding
month
From year
earlierTotal 1 Durable Nondurable Other
(non-NAICS) 1Total
industryTotal
manufacturing
2003 .................... 90.3 ...................... 1.2 88.9 82.9 94.4 106.9 98.5 94.1 76.0 73.92004 .................... 92.5 ...................... 2.3 91.4 86.2 95.9 107.7 98.2 95.3 77.9 76.22005 .................... 95.5 ...................... 3.2 95.0 91.2 98.3 107.3 97.0 97.3 79.8 78.12006 .................... 97.6 ...................... 2.2 97.4 95.4 98.8 106.1 99.3 96.7 80.2 78.42007 .................... 100.0 ...................... 2.5 100.0 100.0 100.0 100.0 100.0 100.0 80.5 78.62008 .................... 96.6 ...................... –3.4 95.3 96.6 94.1 93.5 101.2 99.9 77.5 74.52009 .................... 85.7 ...................... –11.3 82.4 78.6 86.9 80.7 95.7 97.5 68.7 65.72010 .................... 90.6 ...................... 5.7 87.4 87.3 88.7 76.4 100.7 101.0 74.0 71.32011 .................... 93.6 ...................... 3.4 90.3 93.2 88.9 74.8 106.8 100.8 76.5 74.02012 .................... 97.0 ...................... 3.6 93.9 99.9 90.0 72.1 113.6 98.7 77.6 75.82012: Sept ......... 97.0 0.2 2.9 93.6 99.5 90.0 69.8 114.3 99.0 77.2 75.3 Oct ........... 96.8 –.1 2.2 93.2 99.3 89.3 69.3 115.1 100.2 77.0 74.9 Nov .......... 98.1 1.3 3.3 94.5 101.3 90.1 69.7 116.5 101.0 77.9 75.8 Dec ........... 98.2 .0 2.7 95.3 102.0 91.1 69.3 115.9 95.6 77.8 76.42013: Jan ........... 98.2 .0 2.1 95.2 101.7 91.2 68.9 115.0 97.9 77.7 76.2 Feb ........... 98.8 .7 2.2 95.7 102.9 91.2 68.2 116.1 98.9 78.1 76.5 Mar .......... 99.1 .3 3.1 95.5 102.7 91.0 67.4 115.8 103.8 78.2 76.3 Apr r ......... 98.8 –.3 2.0 95.2 102.5 90.5 67.5 116.8 102.1 77.9 75.9 May r ........ 98.9 .1 1.9 95.4 102.7 90.8 67.7 117.6 100.3 77.9 76.0 June r ....... 99.1 .2 2.1 95.7 103.1 91.1 67.4 119.0 98.3 77.9 76.2 July r ........ 99.1 –.1 1.6 95.4 102.5 90.9 67.7 120.9 98.1 77.7 75.8 Aug r ......... 99.5 .4 2.8 95.9 103.7 90.8 67.3 121.6 97.3 77.9 76.1 Sept p ....... 100.0 .6 3.2 96.0 104.2 90.5 67.9 121.9 101.6 78.3 76.1
PRODUCTION AND BUSINESS ACTIVITY
Industrial production and capacity utilization rose in September.
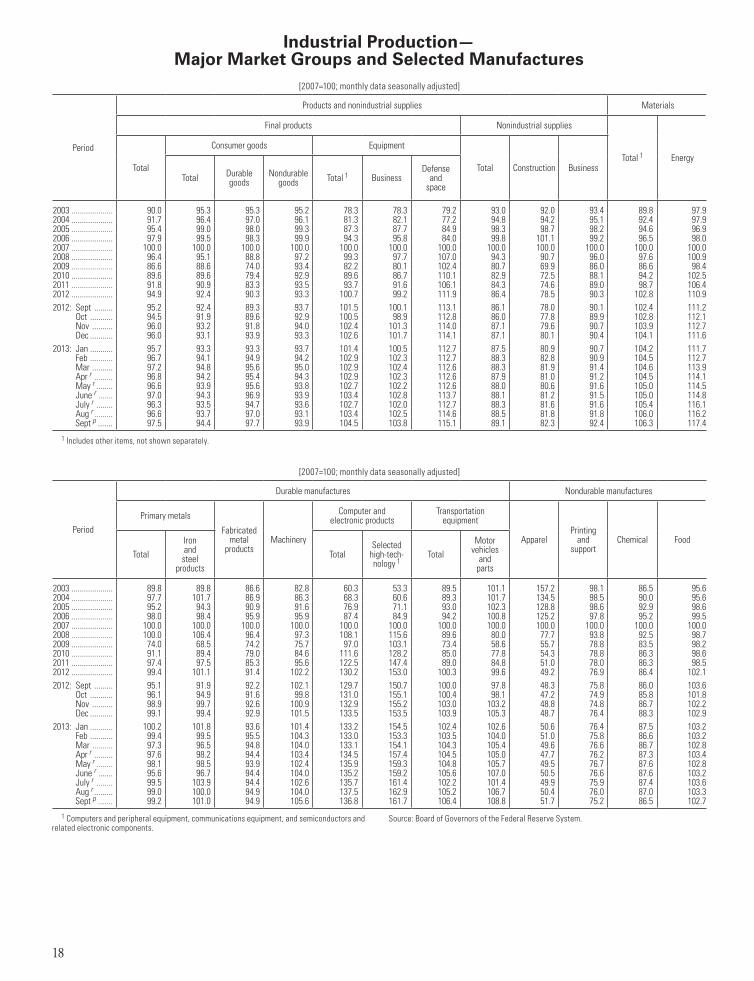
18
[2007=100; monthly data seasonally adjusted]
Period
Durable manufactures Nondurable manufactures
Primary metals
Fabricated metal
productsMachinery
Computer and electronic products
Transportation equipment
ApparelPrinting
and support
Chemical Food
TotalIron and
steel products
TotalSelected
high-tech-nology 1
TotalMotor
vehicles and
parts
2003 .................... 89.8 89.8 86.6 82.8 60.3 53.3 89.5 101.1 157.2 98.1 86.5 95.62004 .................... 97.7 101.7 86.9 86.3 68.3 60.6 89.3 101.7 134.5 98.5 90.0 95.62005 .................... 95.2 94.3 90.9 91.6 76.9 71.1 93.0 102.3 128.8 98.6 92.9 98.62006 .................... 98.0 98.4 95.9 95.9 87.4 84.9 94.2 100.8 125.2 97.8 95.2 99.52007 .................... 100.0 100.0 100.0 100.0 100.0 100.0 100.0 100.0 100.0 100.0 100.0 100.02008 .................... 100.0 106.4 96.4 97.3 108.1 115.6 89.6 80.0 77.7 93.8 92.5 98.72009 .................... 74.0 68.5 74.2 75.7 97.0 103.1 73.4 58.6 55.7 78.8 83.5 98.22010 .................... 91.1 89.4 79.0 84.6 111.6 128.2 85.0 77.8 54.3 78.8 86.3 98.62011 .................... 97.4 97.5 85.3 95.6 122.5 147.4 89.0 84.8 51.0 78.0 86.3 98.52012 .................... 99.4 101.1 91.4 102.2 130.2 153.0 100.3 99.6 49.2 76.9 86.4 102.12012: Sept ......... 95.1 91.9 92.2 102.1 129.7 150.7 100.0 97.8 48.3 75.8 86.0 103.6 Oct ........... 96.1 94.9 91.6 99.8 131.0 155.1 100.4 98.1 47.2 74.9 85.8 101.8 Nov .......... 98.9 99.7 92.6 100.9 132.9 155.2 103.0 103.2 48.8 74.8 86.7 102.2 Dec ........... 99.1 99.4 92.9 101.5 133.5 153.5 103.9 105.3 48.7 76.4 88.3 102.92013: Jan ........... 100.2 101.8 93.6 101.4 133.2 154.5 102.4 102.6 50.6 76.4 87.5 103.2 Feb ........... 99.4 99.5 95.5 104.3 133.0 153.3 103.5 104.0 51.0 75.8 86.6 103.2 Mar .......... 97.3 96.5 94.8 104.0 133.1 154.1 104.3 105.4 49.6 76.6 86.7 102.8 Apr r ......... 97.6 98.2 94.4 103.4 134.5 157.4 104.5 105.0 47.7 76.2 87.3 103.4 May r ........ 98.1 98.5 93.9 102.4 135.9 159.3 104.8 105.7 49.5 76.7 87.6 102.8 June r ....... 95.6 96.7 94.4 104.0 135.2 159.2 105.6 107.0 50.5 76.6 87.6 103.2 July r ........ 99.5 103.9 94.4 102.6 135.7 161.4 102.2 101.4 49.9 75.9 87.4 103.6 Aug r ......... 99.0 100.0 94.9 104.0 137.5 162.9 105.2 106.7 50.4 76.0 87.0 103.3 Sept p ....... 99.2 101.0 94.9 105.6 136.8 161.7 106.4 108.8 51.7 75.2 86.5 102.7
[2007=100; monthly data seasonally adjusted]
Period
Products and nonindustrial supplies Materials
Final products Nonindustrial supplies
Total 1 EnergyTotal
Consumer goods Equipment
Total Construction BusinessTotal Durable
goodsNondurable
goods Total 1 BusinessDefense
and space
2003 .................... 90.0 95.3 95.3 95.2 78.3 78.3 79.2 93.0 92.0 93.4 89.8 97.92004 .................... 91.7 96.4 97.0 96.1 81.3 82.1 77.2 94.8 94.2 95.1 92.4 97.92005 .................... 95.4 99.0 98.0 99.3 87.3 87.7 84.9 98.3 98.7 98.2 94.6 96.92006 .................... 97.9 99.5 98.3 99.9 94.3 95.8 84.0 99.8 101.1 99.2 96.5 98.02007 .................... 100.0 100.0 100.0 100.0 100.0 100.0 100.0 100.0 100.0 100.0 100.0 100.02008 .................... 96.4 95.1 88.8 97.2 99.3 97.7 107.0 94.3 90.7 96.0 97.6 100.92009 .................... 86.6 88.6 74.0 93.4 82.2 80.1 102.4 80.7 69.9 86.0 86.6 98.42010 .................... 89.6 89.6 79.4 92.9 89.6 86.7 110.1 82.9 72.5 88.1 94.2 102.52011 .................... 91.8 90.9 83.3 93.5 93.7 91.6 106.1 84.3 74.6 89.0 98.7 106.42012 .................... 94.9 92.4 90.3 93.3 100.7 99.2 111.9 86.4 78.5 90.3 102.8 110.92012: Sept ......... 95.2 92.4 89.3 93.7 101.5 100.1 113.1 86.1 78.0 90.1 102.4 111.2 Oct ........... 94.5 91.9 89.6 92.9 100.5 98.9 112.8 86.0 77.8 89.9 102.8 112.1 Nov .......... 96.0 93.2 91.8 94.0 102.4 101.3 114.0 87.1 79.6 90.7 103.9 112.7 Dec ........... 96.0 93.1 93.9 93.3 102.6 101.7 114.1 87.1 80.1 90.4 104.1 111.62013: Jan ........... 95.7 93.3 93.3 93.7 101.4 100.5 112.7 87.5 80.9 90.7 104.2 111.7 Feb ........... 96.7 94.1 94.9 94.2 102.9 102.3 112.7 88.3 82.8 90.9 104.5 112.7 Mar .......... 97.2 94.8 95.6 95.0 102.9 102.4 112.6 88.3 81.9 91.4 104.6 113.9 Apr r ......... 96.8 94.2 95.4 94.3 102.9 102.3 112.6 87.9 81.0 91.2 104.5 114.1 May r ........ 96.6 93.9 95.6 93.8 102.7 102.2 112.6 88.0 80.6 91.6 105.0 114.5 June r ....... 97.0 94.3 96.9 93.9 103.4 102.8 113.7 88.1 81.2 91.5 105.0 114.8 July r ........ 96.3 93.5 94.7 93.6 102.7 102.0 112.7 88.3 81.6 91.6 105.4 116.1 Aug r ......... 96.6 93.7 97.0 93.1 103.4 102.5 114.6 88.5 81.8 91.8 106.0 116.2 Sept p ....... 97.5 94.4 97.7 93.9 104.5 103.8 115.1 89.1 82.3 92.4 106.3 117.4
1 Includes other items, not shown separately.
1 Computers and peripheral equipment, communications equipment, and semiconductors and related electronic components.
Source: Board of Governors of the Federal Reserve System.
Industrial Production— Major Market Groups and Selected Manufactures
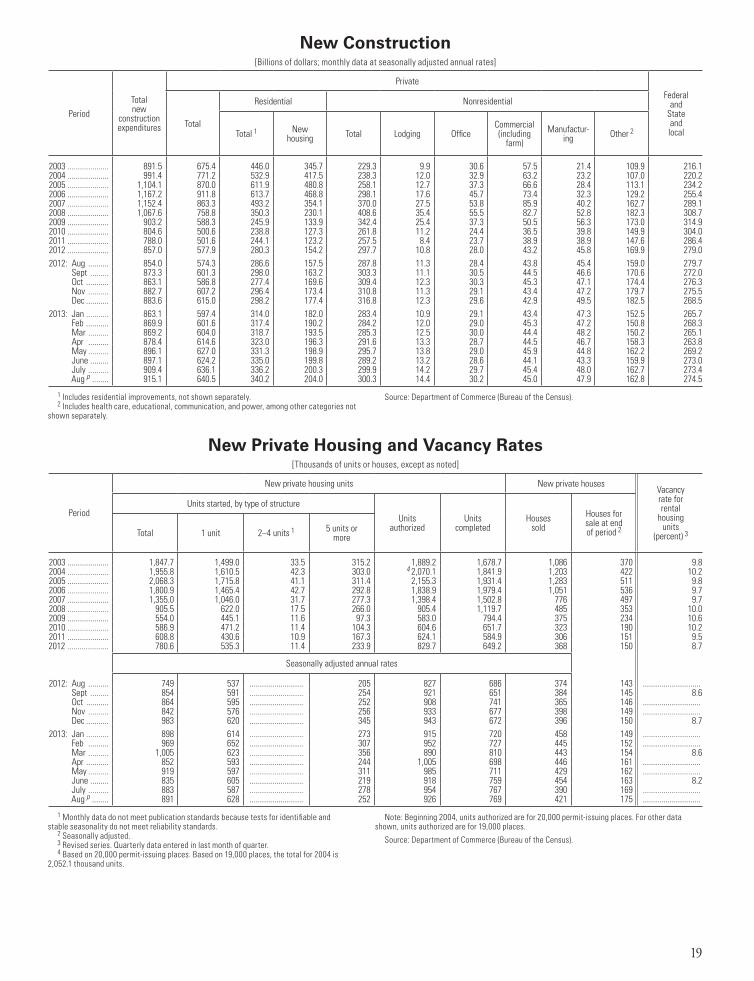
19
New Construction[Billions of dollars; monthly data at seasonally adjusted annual rates]
PeriodTotal new
construction expenditures
PrivateFederal
and State and local
Total
Residential Nonresidential
Total 1 New housing Total Lodging Office
Commercial (including
farm)Manufactur-
ing Other 2
2003 .................... 891.5 675.4 446.0 345.7 229.3 9.9 30.6 57.5 21.4 109.9 216.12004 .................... 991.4 771.2 532.9 417.5 238.3 12.0 32.9 63.2 23.2 107.0 220.22005 .................... 1,104.1 870.0 611.9 480.8 258.1 12.7 37.3 66.6 28.4 113.1 234.22006 .................... 1,167.2 911.8 613.7 468.8 298.1 17.6 45.7 73.4 32.3 129.2 255.42007 .................... 1,152.4 863.3 493.2 354.1 370.0 27.5 53.8 85.9 40.2 162.7 289.12008 .................... 1,067.6 758.8 350.3 230.1 408.6 35.4 55.5 82.7 52.8 182.3 308.72009 .................... 903.2 588.3 245.9 133.9 342.4 25.4 37.3 50.5 56.3 173.0 314.92010 .................... 804.6 500.6 238.8 127.3 261.8 11.2 24.4 36.5 39.8 149.9 304.02011 .................... 788.0 501.6 244.1 123.2 257.5 8.4 23.7 38.9 38.9 147.6 286.42012 .................... 857.0 577.9 280.3 154.2 297.7 10.8 28.0 43.2 45.8 169.9 279.02012: Aug .......... 854.0 574.3 286.6 157.5 287.8 11.3 28.4 43.8 45.4 159.0 279.7 Sept ......... 873.3 601.3 298.0 163.2 303.3 11.1 30.5 44.5 46.6 170.6 272.0 Oct ........... 863.1 586.8 277.4 169.6 309.4 12.3 30.3 45.3 47.1 174.4 276.3 Nov .......... 882.7 607.2 296.4 173.4 310.8 11.3 29.1 43.4 47.2 179.7 275.5 Dec ........... 883.6 615.0 298.2 177.4 316.8 12.3 29.6 42.9 49.5 182.5 268.52013: Jan ........... 863.1 597.4 314.0 182.0 283.4 10.9 29.1 43.4 47.3 152.5 265.7 Feb ........... 869.9 601.6 317.4 190.2 284.2 12.0 29.0 45.3 47.2 150.8 268.3 Mar .......... 869.2 604.0 318.7 193.5 285.3 12.5 30.0 44.4 48.2 150.2 265.1 Apr .......... 878.4 614.6 323.0 196.3 291.6 13.3 28.7 44.5 46.7 158.3 263.8 May .......... 896.1 627.0 331.3 198.9 295.7 13.8 29.0 45.9 44.8 162.2 269.2 June ......... 897.1 624.2 335.0 199.8 289.2 13.2 28.6 44.1 43.3 159.9 273.0 July .......... 909.4 636.1 336.2 200.3 299.9 14.2 29.7 45.4 48.0 162.7 273.4 Aug p ........ 915.1 640.5 340.2 204.0 300.3 14.4 30.2 45.0 47.9 162.8 274.5
New Private Housing and Vacancy Rates[Thousands of units or houses, except as noted]
Period
New private housing units New private housesVacancy rate for rental
housing units
(percent) 3
Units started, by type of structure
Units authorized
Units completed
Houses sold
Houses for sale at end of period 2Total 1 unit 2–4 units 1 5 units or
more
2003 .................... 1,847.7 1,499.0 33.5 315.2 1,889.2 1,678.7 1,086 370 9.82004 .................... 1,955.8 1,610.5 42.3 303.0 4 2,070.1 1,841.9 1,203 422 10.22005 .................... 2,068.3 1,715.8 41.1 311.4 2,155.3 1,931.4 1,283 511 9.82006 .................... 1,800.9 1,465.4 42.7 292.8 1,838.9 1,979.4 1,051 536 9.72007 .................... 1,355.0 1,046.0 31.7 277.3 1,398.4 1,502.8 776 497 9.72008 .................... 905.5 622.0 17.5 266.0 905.4 1,119.7 485 353 10.02009 .................... 554.0 445.1 11.6 97.3 583.0 794.4 375 234 10.62010 .................... 586.9 471.2 11.4 104.3 604.6 651.7 323 190 10.22011 .................... 608.8 430.6 10.9 167.3 624.1 584.9 306 151 9.52012 .................... 780.6 535.3 11.4 233.9 829.7 649.2 368 150 8.7
Seasonally adjusted annual rates
2012: Aug .......... 749 537 .......................... 205 827 686 374 143 ............................ Sept ......... 854 591 .......................... 254 921 651 384 145 8.6 Oct ........... 864 595 .......................... 252 908 741 365 146 ............................ Nov .......... 842 576 .......................... 256 933 677 398 149 ............................ Dec ........... 983 620 .......................... 345 943 672 396 150 8.72013: Jan ........... 898 614 .......................... 273 915 720 458 149 ............................ Feb .......... 969 652 .......................... 307 952 727 445 152 ............................ Mar .......... 1,005 623 .......................... 356 890 810 443 154 8.6 Apr ........... 852 593 .......................... 244 1,005 698 446 161 ............................ May .......... 919 597 .......................... 311 985 711 429 162 ............................ June ......... 835 605 .......................... 219 918 759 454 163 8.2 July .......... 883 587 .......................... 278 954 767 390 169 ............................ Aug p ........ 891 628 .......................... 252 926 769 421 175 ............................
1 Includes residential improvements, not shown separately. 2 Includes health care, educational, communication, and power, among other categories not
shown separately.
Source: Department of Commerce (Bureau of the Census).
1 Monthly data do not meet publication standards because tests for identifiable and stable seasonality do not meet reliability standards.
2 Seasonally adjusted.3 Revised series. Quarterly data entered in last month of quarter.4 Based on 20,000 permit-issuing places. Based on 19,000 places, the total for 2004 is
2,052.1 thousand units.
Note: Beginning 2004, units authorized are for 20,000 permit-issuing places. For other data shown, units authorized are for 19,000 places.
Source: Department of Commerce (Bureau of the Census).
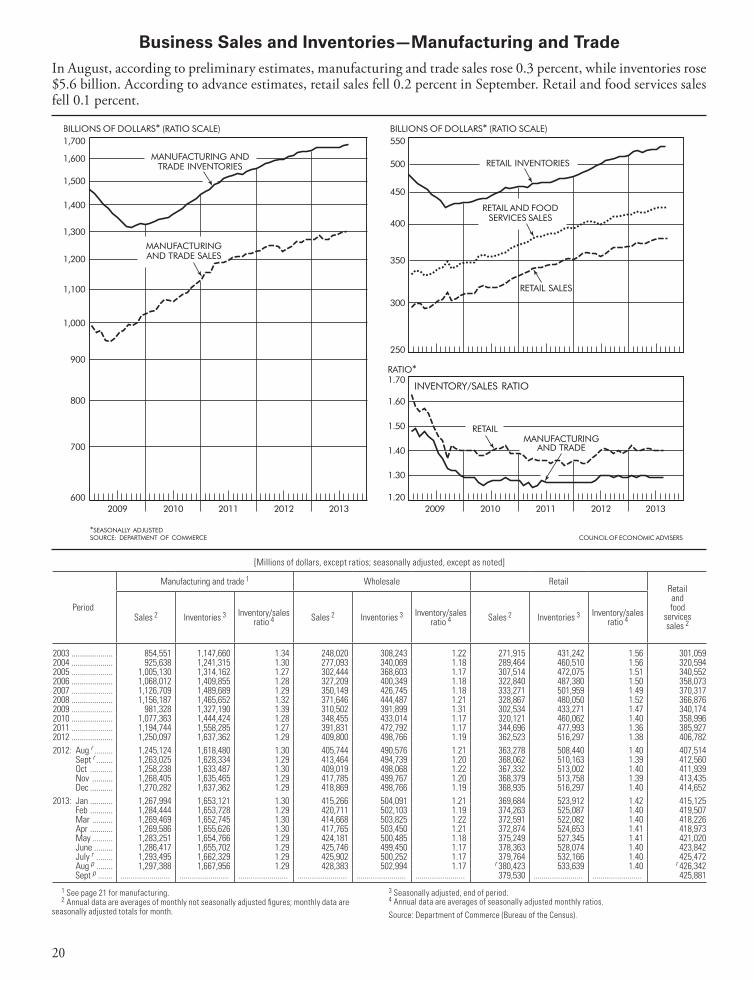
20
Business Sales and Inventories—Manufacturing and Trade
1 See page 21 for manufacturing.2 Annual data are averages of monthly not seasonally adjusted figures; monthly data are
seasonally adjusted totals for month.
3 Seasonally adjusted, end of period.4 Annual data are averages of seasonally adjusted monthly ratios.
Source: Department of Commerce (Bureau of the Census).
[Millions of dollars, except ratios; seasonally adjusted, except as noted]
Period
Manufacturing and trade 1 Wholesale RetailRetail and food
services sales 2
Sales 2 Inventories 3 Inventory/sales ratio 4 Sales 2 Inventories 3 Inventory/sales
ratio 4 Sales 2 Inventories 3 Inventory/sales ratio 4
2003 .................... 854,551 1,147,660 1.34 248,020 308,243 1.22 271,915 431,242 1.56 301,0592004 .................... 925,638 1,241,315 1.30 277,093 340,069 1.18 289,464 460,510 1.56 320,5942005 .................... 1,005,130 1,314,162 1.27 302,444 368,603 1.17 307,514 472,075 1.51 340,5522006 .................... 1,068,012 1,409,855 1.28 327,209 400,349 1.18 322,840 487,380 1.50 358,0732007 .................... 1,126,709 1,489,689 1.29 350,149 426,745 1.18 333,271 501,959 1.49 370,3172008 .................... 1,156,187 1,465,652 1.32 371,646 444,487 1.21 328,867 480,050 1.52 366,8762009 .................... 981,328 1,327,190 1.39 310,502 391,899 1.31 302,534 433,271 1.47 340,1742010 .................... 1,077,363 1,444,424 1.28 348,455 433,014 1.17 320,121 460,062 1.40 358,9962011 .................... 1,194,744 1,558,285 1.27 391,831 472,792 1.17 344,696 477,993 1.36 385,9272012 .................... 1,250,097 1,637,362 1.29 409,800 498,766 1.19 362,523 516,297 1.38 406,7822012: Aug r ......... 1,245,124 1,618,480 1.30 405,744 490,576 1.21 363,278 508,440 1.40 407,514 Sept r ........ 1,263,025 1,628,334 1.29 413,464 494,739 1.20 368,062 510,163 1.39 412,560 Oct ........... 1,258,238 1,633,487 1.30 409,019 498,068 1.22 367,332 513,002 1.40 411,939 Nov .......... 1,268,405 1,635,465 1.29 417,785 499,767 1.20 368,379 513,758 1.39 413,435 Dec ........... 1,270,282 1,637,362 1.29 418,869 498,766 1.19 368,935 516,297 1.40 414,6522013: Jan ........... 1,267,994 1,653,121 1.30 415,266 504,091 1.21 369,684 523,912 1.42 415,125 Feb ........... 1,284,444 1,653,728 1.29 420,711 502,103 1.19 374,263 525,087 1.40 419,507 Mar .......... 1,269,469 1,652,745 1.30 414,668 503,825 1.22 372,591 522,082 1.40 418,226 Apr ........... 1,269,586 1,655,626 1.30 417,765 503,450 1.21 372,874 524,653 1.41 418,973 May .......... 1,283,251 1,654,766 1.29 424,181 500,485 1.18 375,249 527,345 1.41 421,020 June ......... 1,286,417 1,655,702 1.29 425,746 499,450 1.17 378,363 528,074 1.40 423,842 July r ........ 1,293,495 1,662,329 1.29 425,902 500,252 1.17 379,764 532,166 1.40 425,472 Aug p ........ 1,297,388 1,667,956 1.29 428,383 502,994 1.17 r 380,423 533,639 1.40 r 426,342 Sept p ....... ........................ ........................ ........................ ........................ ........................ ........................ 379,530 ........................ ........................ 425,881
In August, according to preliminary estimates, manufacturing and trade sales rose 0.3 percent, while inventories rose $5.6 billion. According to advance estimates, retail sales fell 0.2 percent in September. Retail and food services sales fell 0.1 percent.
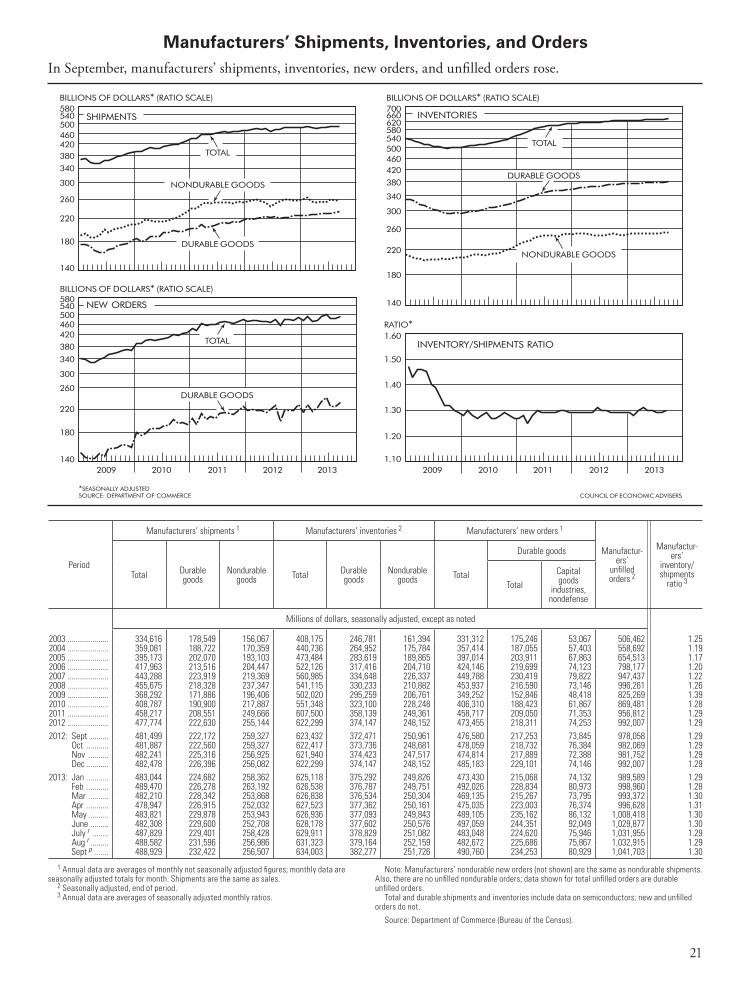
21
Manufacturers’ Shipments, Inventories, and Orders
1 Annual data are averages of monthly not seasonally adjusted figures; monthly data are seasonally adjusted totals for month. Shipments are the same as sales.
2 Seasonally adjusted, end of period.3 Annual data are averages of seasonally adjusted monthly ratios.
Note: Manufacturers’ nondurable new orders (not shown) are the same as nondurable shipments. Also, there are no unfilled nondurable orders; data shown for total unfilled orders are durable unfilled orders.
Total and durable shipments and inventories include data on semiconductors; new and unfilled orders do not.
Source: Department of Commerce (Bureau of the Census).
Period
Manufacturers’ shipments 1 Manufacturers’ inventories 2 Manufacturers’ new orders 1
Manufactur-ers’
unfilled orders 2
Manufactur-ers’
inventory/shipments
ratio 3Total Durable
goodsNondurable
goods Total Durable goods
Nondurable goods Total
Durable goods
TotalCapital goods
industries, nondefense
Millions of dollars, seasonally adjusted, except as noted
2003 .................... 334,616 178,549 156,067 408,175 246,781 161,394 331,312 175,246 53,067 506,462 1.252004 .................... 359,081 188,722 170,359 440,736 264,952 175,784 357,414 187,055 57,403 558,692 1.192005 .................... 395,173 202,070 193,103 473,484 283,619 189,865 397,014 203,911 67,863 654,513 1.172006 .................... 417,963 213,516 204,447 522,126 317,416 204,710 424,146 219,699 74,123 798,177 1.202007 .................... 443,288 223,919 219,369 560,985 334,648 226,337 449,788 230,419 79,822 947,437 1.222008 .................... 455,675 218,328 237,347 541,115 330,233 210,882 453,937 216,590 73,146 996,261 1.262009 .................... 368,292 171,886 196,406 502,020 295,259 206,761 349,252 152,846 48,418 825,269 1.392010 .................... 408,787 190,900 217,887 551,348 323,100 228,248 406,310 188,423 61,867 869,481 1.282011 .................... 458,217 208,551 249,666 607,500 358,139 249,361 458,717 209,050 71,353 956,812 1.292012 .................... 477,774 222,630 255,144 622,299 374,147 248,152 473,455 218,311 74,253 992,007 1.292012: Sept ......... 481,499 222,172 259,327 623,432 372,471 250,961 476,580 217,253 73,845 978,058 1.29 Oct ........... 481,887 222,560 259,327 622,417 373,736 248,681 478,059 218,732 76,384 982,069 1.29 Nov .......... 482,241 225,316 256,925 621,940 374,423 247,517 474,814 217,889 72,388 981,752 1.29 Dec ........... 482,478 226,396 256,082 622,299 374,147 248,152 485,183 229,101 74,146 992,007 1.292013: Jan ........... 483,044 224,682 258,362 625,118 375,292 249,826 473,430 215,068 74,132 989,589 1.29 Feb ........... 489,470 226,278 263,192 626,538 376,787 249,751 492,026 228,834 80,973 998,960 1.28 Mar .......... 482,210 228,342 253,868 626,838 376,534 250,304 469,135 215,267 73,795 993,372 1.30 Apr ........... 478,947 226,915 252,032 627,523 377,362 250,161 475,035 223,003 76,374 996,628 1.31 May .......... 483,821 229,878 253,943 626,936 377,093 249,843 489,105 235,162 86,132 1,008,418 1.30 June ......... 482,308 229,600 252,708 628,178 377,602 250,576 497,059 244,351 92,049 1,029,877 1.30 July r ........ 487,829 229,401 258,428 629,911 378,829 251,082 483,048 224,620 75,946 1,031,955 1.29 Aug r ......... 488,582 231,596 256,986 631,323 379,164 252,159 482,672 225,686 75,867 1,032,915 1.29 Sept p ....... 488,929 232,422 256,507 634,003 382,277 251,726 490,760 234,253 80,929 1,041,703 1.30
In September, manufacturers’ shipments, inventories, new orders, and unfilled orders rose.
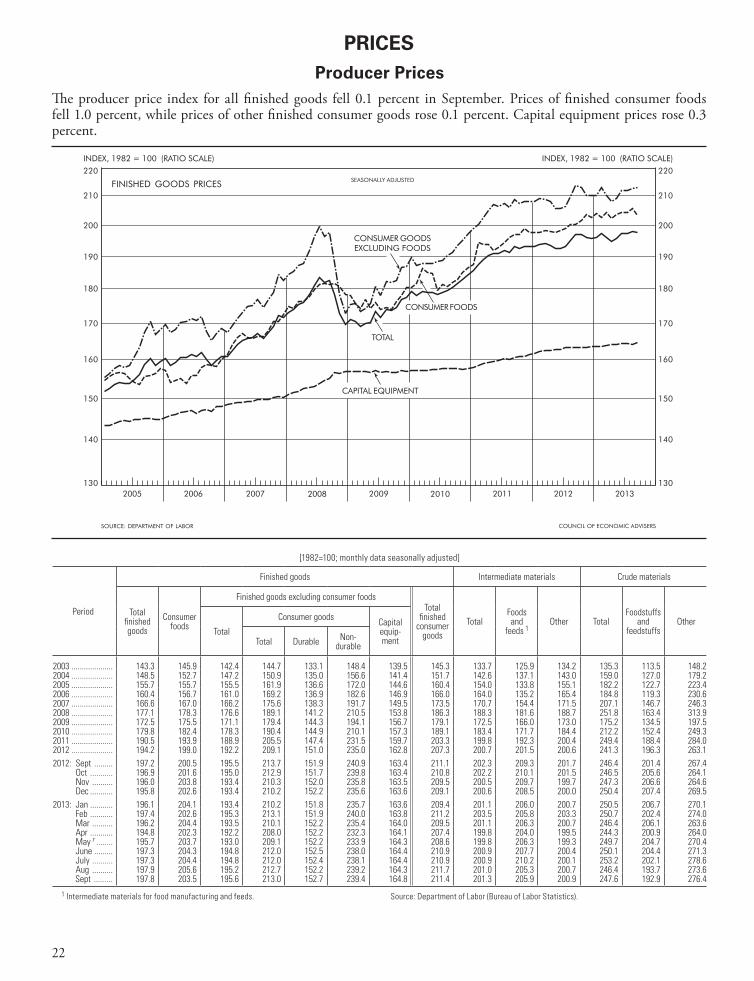
22
Producer Prices
1 Intermediate materials for food manufacturing and feeds. Source: Department of Labor (Bureau of Labor Statistics).
[1982=100; monthly data seasonally adjusted]
Period
Finished goods Intermediate materials Crude materials
Total finished goods
Consumer foods
Finished goods excluding consumer foodsTotal
finished consumer
goodsTotal
Foods and
feeds 1Other Total
Foodstuffs and
feedstuffsOther
Total
Consumer goods Capital equip-mentTotal Durable Non-
durable
2003 .................... 143.3 145.9 142.4 144.7 133.1 148.4 139.5 145.3 133.7 125.9 134.2 135.3 113.5 148.22004 .................... 148.5 152.7 147.2 150.9 135.0 156.6 141.4 151.7 142.6 137.1 143.0 159.0 127.0 179.22005 .................... 155.7 155.7 155.5 161.9 136.6 172.0 144.6 160.4 154.0 133.8 155.1 182.2 122.7 223.42006 .................... 160.4 156.7 161.0 169.2 136.9 182.6 146.9 166.0 164.0 135.2 165.4 184.8 119.3 230.62007 .................... 166.6 167.0 166.2 175.6 138.3 191.7 149.5 173.5 170.7 154.4 171.5 207.1 146.7 246.32008 .................... 177.1 178.3 176.6 189.1 141.2 210.5 153.8 186.3 188.3 181.6 188.7 251.8 163.4 313.92009 .................... 172.5 175.5 171.1 179.4 144.3 194.1 156.7 179.1 172.5 166.0 173.0 175.2 134.5 197.52010 .................... 179.8 182.4 178.3 190.4 144.9 210.1 157.3 189.1 183.4 171.7 184.4 212.2 152.4 249.32011 .................... 190.5 193.9 188.9 205.5 147.4 231.5 159.7 203.3 199.8 192.3 200.4 249.4 188.4 284.02012 .................... 194.2 199.0 192.2 209.1 151.0 235.0 162.8 207.3 200.7 201.5 200.6 241.3 196.3 263.12012: Sept ......... 197.2 200.5 195.5 213.7 151.9 240.9 163.4 211.1 202.3 209.3 201.7 246.4 201.4 267.4 Oct ........... 196.9 201.6 195.0 212.9 151.7 239.8 163.4 210.8 202.2 210.1 201.5 246.5 205.6 264.1 Nov .......... 196.0 203.8 193.4 210.3 152.0 235.8 163.5 209.5 200.5 209.7 199.7 247.3 206.6 264.6 Dec ........... 195.8 202.6 193.4 210.2 152.2 235.6 163.6 209.1 200.6 208.5 200.0 250.4 207.4 269.52013: Jan ........... 196.1 204.1 193.4 210.2 151.8 235.7 163.6 209.4 201.1 206.0 200.7 250.5 206.7 270.1 Feb ........... 197.4 202.6 195.3 213.1 151.9 240.0 163.8 211.2 203.5 205.8 203.3 250.7 202.4 274.0 Mar .......... 196.2 204.4 193.5 210.1 152.2 235.4 164.0 209.5 201.1 206.3 200.7 246.4 206.1 263.6 Apr ........... 194.8 202.3 192.2 208.0 152.2 232.3 164.1 207.4 199.8 204.0 199.5 244.3 200.9 264.0 May r ........ 195.7 203.7 193.0 209.1 152.2 233.9 164.3 208.6 199.8 206.3 199.3 249.7 204.7 270.4 June ......... 197.3 204.3 194.8 212.0 152.5 238.0 164.4 210.9 200.9 207.7 200.4 250.1 204.4 271.3 July .......... 197.3 204.4 194.8 212.0 152.4 238.1 164.4 210.9 200.9 210.2 200.1 253.2 202.1 278.6 Aug .......... 197.9 205.6 195.2 212.7 152.2 239.2 164.3 211.7 201.0 205.3 200.7 246.4 193.7 273.6 Sept ......... 197.8 203.5 195.6 213.0 152.7 239.4 164.8 211.4 201.3 205.9 200.9 247.6 192.9 276.4
PRICES
The producer price index for all finished goods fell 0.1 percent in September. Prices of finished consumer foods fell 1.0 percent, while prices of other finished consumer goods rose 0.1 percent. Capital equipment prices rose 0.3 percent.
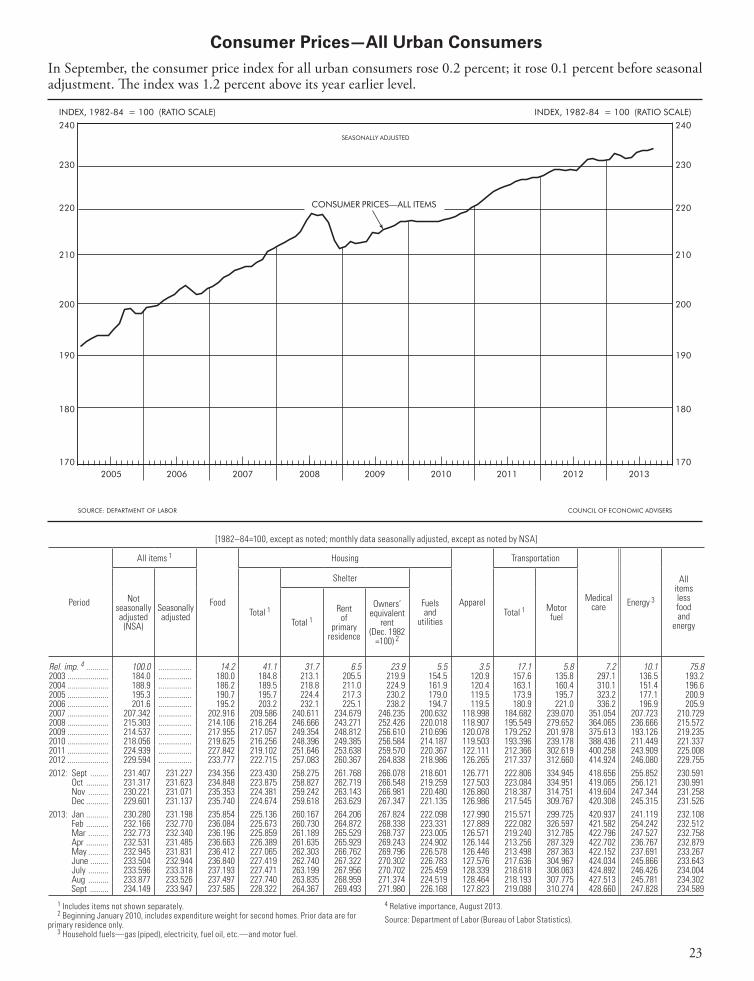
23
In September, the consumer price index for all urban consumers rose 0.2 percent; it rose 0.1 percent before seasonal adjustment. The index was 1.2 percent above its year earlier level.
Consumer Prices—All Urban Consumers
1 Includes items not shown separately.2 Beginning January 2010, includes expenditure weight for second homes. Prior data are for
primary residence only. 3 Household fuels—gas (piped), electricity, fuel oil, etc.—and motor fuel.
4 Relative importance, August 2013.
Source: Department of Labor (Bureau of Labor Statistics).
[1982–84=100, except as noted; monthly data seasonally adjusted, except as noted by NSA]
Period
All items 1
Food
Housing
Apparel
Transportation
Medical care Energy 3
All items less food and
energy
Not seasonally adjusted
(NSA)
Seasonally adjusted Total 1
Shelter
Fuels and
utilitiesTotal 1 Motor
fuelTotal 1Rent
of primary
residence
Owners’ equivalent
rent (Dec. 1982
=100) 2
Rel. imp. 4 ........... 100.0 ................ 14.2 41.1 31.7 6.5 23.9 5.5 3.5 17.1 5.8 7.2 10.1 75.82003 .................... 184.0 ................ 180.0 184.8 213.1 205.5 219.9 154.5 120.9 157.6 135.8 297.1 136.5 193.22004 .................... 188.9 ................ 186.2 189.5 218.8 211.0 224.9 161.9 120.4 163.1 160.4 310.1 151.4 196.62005 .................... 195.3 ................ 190.7 195.7 224.4 217.3 230.2 179.0 119.5 173.9 195.7 323.2 177.1 200.92006 .................... 201.6 ................ 195.2 203.2 232.1 225.1 238.2 194.7 119.5 180.9 221.0 336.2 196.9 205.92007 .................... 207.342 ................ 202.916 209.586 240.611 234.679 246.235 200.632 118.998 184.682 239.070 351.054 207.723 210.7292008 .................... 215.303 ................ 214.106 216.264 246.666 243.271 252.426 220.018 118.907 195.549 279.652 364.065 236.666 215.5722009 .................... 214.537 ................ 217.955 217.057 249.354 248.812 256.610 210.696 120.078 179.252 201.978 375.613 193.126 219.2352010 .................... 218.056 ................ 219.625 216.256 248.396 249.385 256.584 214.187 119.503 193.396 239.178 388.436 211.449 221.3372011 .................... 224.939 ................ 227.842 219.102 251.646 253.638 259.570 220.367 122.111 212.366 302.619 400.258 243.909 225.0082012 .................... 229.594 ................ 233.777 222.715 257.083 260.367 264.838 218.986 126.265 217.337 312.660 414.924 246.080 229.7552012: Sept ......... 231.407 231.227 234.356 223.430 258.275 261.768 266.078 218.601 126.771 222.806 334.945 418.656 255.852 230.591 Oct ........... 231.317 231.623 234.848 223.875 258.827 262.719 266.548 219.259 127.503 223.084 334.951 419.065 256.121 230.991 Nov .......... 230.221 231.071 235.353 224.381 259.242 263.143 266.981 220.480 126.860 218.387 314.751 419.604 247.344 231.258 Dec ........... 229.601 231.137 235.740 224.674 259.618 263.629 267.347 221.135 126.986 217.545 309.767 420.308 245.315 231.5262013: Jan ........... 230.280 231.198 235.854 225.136 260.167 264.206 267.824 222.098 127.990 215.571 299.725 420.937 241.119 232.108 Feb ........... 232.166 232.770 236.084 225.673 260.730 264.872 268.338 223.331 127.889 222.082 326.597 421.582 254.242 232.512 Mar .......... 232.773 232.340 236.196 225.859 261.189 265.529 268.737 223.005 126.571 219.240 312.785 422.796 247.527 232.758 Apr ........... 232.531 231.485 236.663 226.389 261.635 265.929 269.243 224.902 126.144 213.256 287.329 422.702 236.767 232.879 May .......... 232.945 231.831 236.412 227.065 262.303 266.762 269.796 226.578 126.446 213.498 287.363 422.152 237.691 233.267 June ......... 233.504 232.944 236.840 227.419 262.740 267.322 270.302 226.783 127.576 217.636 304.967 424.034 245.866 233.643 July .......... 233.596 233.318 237.193 227.471 263.199 267.956 270.702 225.459 128.339 218.618 308.063 424.892 246.426 234.004 Aug .......... 233.877 233.526 237.497 227.740 263.835 268.959 271.374 224.519 128.464 218.193 307.775 427.513 245.781 234.302 Sept ......... 234.149 233.947 237.585 228.322 264.367 269.493 271.980 226.168 127.823 219.088 310.274 428.660 247.828 234.589
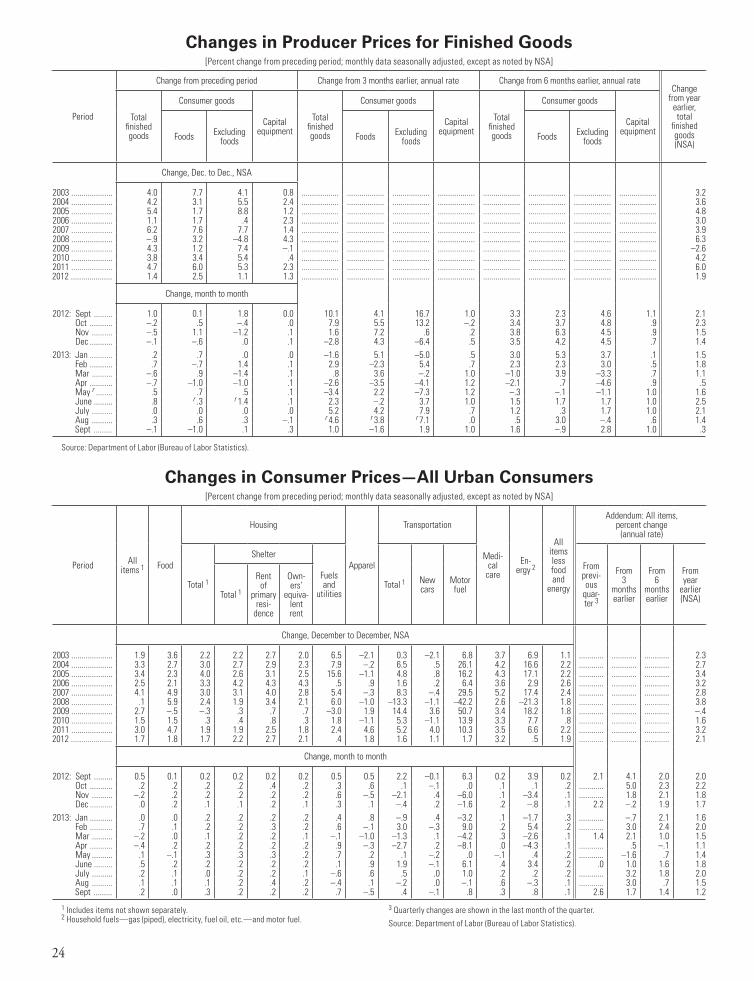
24
Changes in Consumer Prices—All Urban Consumers[Percent change from preceding period; monthly data seasonally adjusted, except as noted by NSA]
Period All items 1 Food
Housing
Apparel
Transportation
Medi-cal
careEn-
ergy 2
All items less food and
energy
Addendum: All items, percent change
(annual rate)
Total 1
Shelter
Fuels and
utilitiesTotal 1 New
carsMotor fuel
From previ-ous
quar-ter 3
From 3
months earlier
From 6
months earlier
From year
earlier (NSA)Total 1
Rent of
primary resi-
dence
Own-ers’
equiva-lent rent
Change, December to December, NSA
2003 .................... 1.9 3.6 2.2 2.2 2.7 2.0 6.5 –2.1 0.3 –2.1 6.8 3.7 6.9 1.1 ............ ............ ............ 2.32004 .................... 3.3 2.7 3.0 2.7 2.9 2.3 7.9 –.2 6.5 .5 26.1 4.2 16.6 2.2 ............ ............ ............ 2.72005 .................... 3.4 2.3 4.0 2.6 3.1 2.5 15.6 –1.1 4.8 .8 16.2 4.3 17.1 2.2 ............ ............ ............ 3.42006 .................... 2.5 2.1 3.3 4.2 4.3 4.3 .5 .9 1.6 .2 6.4 3.6 2.9 2.6 ............ ............ ............ 3.22007 .................... 4.1 4.9 3.0 3.1 4.0 2.8 5.4 –.3 8.3 –.4 29.5 5.2 17.4 2.4 ............ ............ ............ 2.82008 .................... .1 5.9 2.4 1.9 3.4 2.1 6.0 –1.0 –13.3 –1.1 –42.2 2.6 –21.3 1.8 ............ ............ ............ 3.82009 .................... 2.7 –.5 –.3 .3 .7 .7 –3.0 1.9 14.4 3.6 50.7 3.4 18.2 1.8 ............ ............ ............ –.42010 .................... 1.5 1.5 .3 .4 .8 .3 1.8 –1.1 5.3 –1.1 13.9 3.3 7.7 .8 ............ ............ ............ 1.62011 .................... 3.0 4.7 1.9 1.9 2.5 1.8 2.4 4.6 5.2 4.0 10.3 3.5 6.6 2.2 ............ ............ ............ 3.22012 .................... 1.7 1.8 1.7 2.2 2.7 2.1 .4 1.8 1.6 1.1 1.7 3.2 .5 1.9 ............ ............ ............ 2.1
Change, month to month
2012: Sept ......... 0.5 0.1 0.2 0.2 0.2 0.2 0.5 0.5 2.2 –0.1 6.3 0.2 3.9 0.2 2.1 4.1 2.0 2.0 Oct ........... .2 .2 .2 .2 .4 .2 .3 .6 .1 –.1 .0 .1 .1 .2 ............ 5.0 2.3 2.2 Nov .......... –.2 .2 .2 .2 .2 .2 .6 –.5 –2.1 .4 –6.0 .1 –3.4 .1 ............ 1.8 2.1 1.8 Dec ........... .0 .2 .1 .1 .2 .1 .3 .1 –.4 .2 –1.6 .2 –.8 .1 2.2 –.2 1.9 1.72013: Jan ........... .0 .0 .2 .2 .2 .2 .4 .8 –.9 .4 –3.2 .1 –1.7 .3 ............ –.7 2.1 1.6 Feb ........... .7 .1 .2 .2 .3 .2 .6 –.1 3.0 –.3 9.0 .2 5.4 .2 ............ 3.0 2.4 2.0 Mar .......... –.2 .0 .1 .2 .2 .1 –.1 –1.0 –1.3 .1 –4.2 .3 –2.6 .1 1.4 2.1 1.0 1.5 Apr ........... –.4 .2 .2 .2 .2 .2 .9 –.3 –2.7 .2 –8.1 .0 –4.3 .1 ............ .5 –.1 1.1 May .......... .1 –.1 .3 .3 .3 .2 .7 .2 .1 –.2 .0 –.1 .4 .2 ............ –1.6 .7 1.4 June ......... .5 .2 .2 .2 .2 .2 .1 .9 1.9 –.1 6.1 .4 3.4 .2 .0 1.0 1.6 1.8 July .......... .2 .1 .0 .2 .2 .1 –.6 .6 .5 .0 1.0 .2 .2 .2 ............ 3.2 1.8 2.0 Aug .......... .1 .1 .1 .2 .4 .2 –.4 .1 –.2 .0 –.1 .6 –.3 .1 ............ 3.0 .7 1.5 Sept ......... .2 .0 .3 .2 .2 .2 .7 –.5 .4 –.1 .8 .3 .8 .1 2.6 1.7 1.4 1.2
Changes in Producer Prices for Finished Goods[Percent change from preceding period; monthly data seasonally adjusted, except as noted by NSA]
Period
Change from preceding period Change from 3 months earlier, annual rate Change from 6 months earlier, annual rateChange
from year earlier, total
finished goods (NSA)
Total finished goods
Consumer goods
Capital equipment
Total finished goods
Consumer goods
Capital equipment
Total finished goods
Consumer goods
Capital equipmentFoods Excluding
foods Foods Excluding foods Foods Excluding
foods
Change, Dec. to Dec., NSA
2003 .................... 4.0 7.7 4.1 0.8 .................. .................. .................. .................. .................. .................. .................. .................. 3.22004 .................... 4.2 3.1 5.5 2.4 .................. .................. .................. .................. .................. .................. .................. .................. 3.62005 .................... 5.4 1.7 8.8 1.2 .................. .................. .................. .................. .................. .................. .................. .................. 4.82006 .................... 1.1 1.7 .4 2.3 .................. .................. .................. .................. .................. .................. .................. .................. 3.02007 .................... 6.2 7.6 7.7 1.4 .................. .................. .................. .................. .................. .................. .................. .................. 3.92008 .................... –.9 3.2 –4.8 4.3 .................. .................. .................. .................. .................. .................. .................. .................. 6.32009 .................... 4.3 1.2 7.4 –.1 .................. .................. .................. .................. .................. .................. .................. .................. –2.62010 .................... 3.8 3.4 5.4 .4 .................. .................. .................. .................. .................. .................. .................. .................. 4.22011 .................... 4.7 6.0 5.3 2.3 .................. .................. .................. .................. .................. .................. .................. .................. 6.02012 .................... 1.4 2.5 1.1 1.3 .................. .................. .................. .................. .................. .................. .................. .................. 1.9
Change, month to month
2012: Sept ......... 1.0 0.1 1.8 0.0 10.1 4.1 16.7 1.0 3.3 2.3 4.6 1.1 2.1 Oct ........... –.2 .5 –.4 .0 7.9 5.5 13.2 –.2 3.4 3.7 4.8 .9 2.3 Nov .......... –.5 1.1 –1.2 .1 1.6 7.2 .6 .2 3.8 6.3 4.5 .9 1.5 Dec ........... –.1 –.6 .0 .1 –2.8 4.3 –6.4 .5 3.5 4.2 4.5 .7 1.42013: Jan ........... .2 .7 .0 .0 –1.6 5.1 –5.0 .5 3.0 5.3 3.7 .1 1.5 Feb ........... .7 –.7 1.4 .1 2.9 –2.3 5.4 .7 2.3 2.3 3.0 .5 1.8 Mar .......... –.6 .9 –1.4 .1 .8 3.6 –.2 1.0 –1.0 3.9 –3.3 .7 1.1 Apr ........... –.7 –1.0 –1.0 .1 –2.6 –3.5 –4.1 1.2 –2.1 .7 –4.6 .9 .5 May r ........ .5 .7 .5 .1 –3.4 2.2 –7.3 1.2 –.3 –.1 –1.1 1.0 1.6 June ......... .8 r .3 r 1.4 .1 2.3 –.2 3.7 1.0 1.5 1.7 1.7 1.0 2.5 July .......... .0 .0 .0 .0 5.2 4.2 7.9 .7 1.2 .3 1.7 1.0 2.1 Aug .......... .3 .6 .3 –.1 r 4.6 r 3.8 r 7.1 .0 .5 3.0 –.4 .6 1.4 Sept ......... –.1 –1.0 .1 .3 1.0 –1.6 1.9 1.0 1.6 –.9 2.8 1.0 .3
1 Includes items not shown separately.2 Household fuels—gas (piped), electricity, fuel oil, etc.—and motor fuel.
3 Quarterly changes are shown in the last month of the quarter.
Source: Department of Labor (Bureau of Labor Statistics).
Source: Department of Labor (Bureau of Labor Statistics).
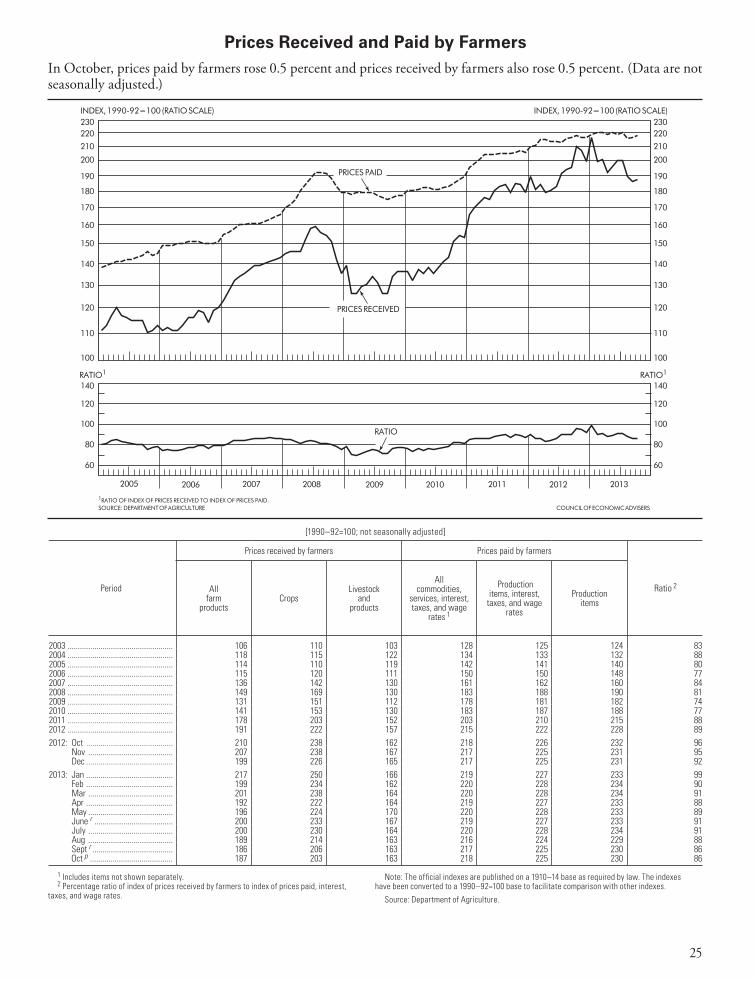
25
Prices Received and Paid by Farmers
1 Includes items not shown separately.2 Percentage ratio of index of prices received by farmers to index of prices paid, interest,
taxes, and wage rates.
Note: The official indexes are published on a 1910–14 base as required by law. The indexes have been converted to a 1990–92=100 base to facilitate comparison with other indexes.
Source: Department of Agriculture.
[1990–92=100; not seasonally adjusted]
Period
Prices received by farmers Prices paid by farmers
Ratio 2All farm
productsCrops
Livestock and
products
All commodities,
services, interest, taxes, and wage
rates 1
Production items, interest,
taxes, and wage rates
Production items
2003 ................................................... 106 110 103 128 125 124 832004 ................................................... 118 115 122 134 133 132 882005 ................................................... 114 110 119 142 141 140 802006 ................................................... 115 120 111 150 150 148 772007 ................................................... 136 142 130 161 162 160 842008 ................................................... 149 169 130 183 188 190 812009 ................................................... 131 151 112 178 181 182 742010 ................................................... 141 153 130 183 187 188 772011 ................................................... 178 203 152 203 210 215 882012 ................................................... 191 222 157 215 222 228 892012: Oct .......................................... 210 238 162 218 226 232 96 Nov ......................................... 207 238 167 217 225 231 95 Dec .......................................... 199 226 165 217 225 231 922013: Jan .......................................... 217 250 166 219 227 233 99 Feb .......................................... 199 234 162 220 228 234 90 Mar ......................................... 201 238 164 220 228 234 91 Apr .......................................... 192 222 164 219 227 233 88 May ......................................... 196 224 170 220 228 233 89 June r ...................................... 200 233 167 219 227 233 91 July ......................................... 200 230 164 220 228 234 91 Aug ......................................... 189 214 163 216 224 229 88 Sept r ....................................... 186 206 163 217 225 230 86 Oct p ........................................ 187 203 163 218 225 230 86
In October, prices paid by farmers rose 0.5 percent and prices received by farmers also rose 0.5 percent. (Data are not seasonally adjusted.)
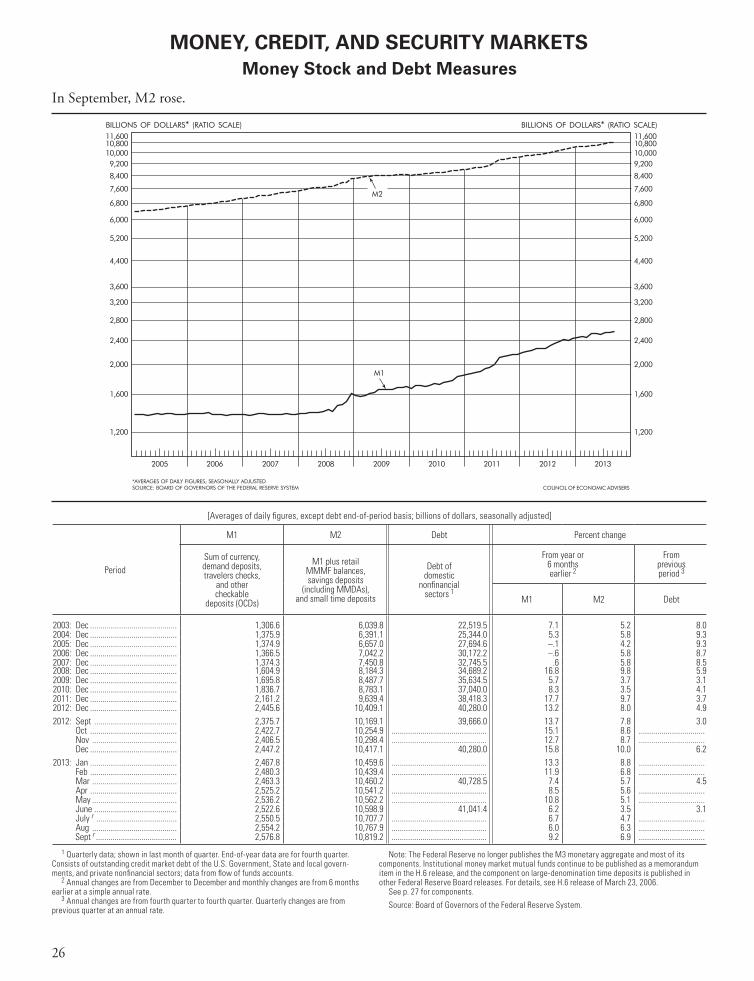
26
Money Stock and Debt Measures
1 Quarterly data; shown in last month of quarter. End-of-year data are for fourth quarter. Consists of outstanding credit market debt of the U.S. Government, State and local govern-ments, and private nonfinancial sectors; data from flow of funds accounts.
2 Annual changes are from December to December and monthly changes are from 6 months earlier at a simple annual rate.
3 Annual changes are from fourth quarter to fourth quarter. Quarterly changes are from previous quarter at an annual rate.
Note: The Federal Reserve no longer publishes the M3 monetary aggregate and most of its components. Institutional money market mutual funds continue to be published as a memorandum item in the H.6 release, and the component on large-denomination time deposits is published in other Federal Reserve Board releases. For details, see H.6 release of March 23, 2006.
See p. 27 for components.
Source: Board of Governors of the Federal Reserve System.
[Averages of daily figures, except debt end-of-period basis; billions of dollars, seasonally adjusted]
Period
M1 M2 Debt Percent change
Sum of currency, demand deposits, travelers checks,
and other checkable
deposits (OCDs)
M1 plus retail MMMF balances, savings deposits
(including MMDAs), and small time deposits
Debt of domestic
nonfinancial sectors 1
From year or 6 months earlier 2
From previous period 3
M1 M2 Debt
2003: Dec .......................................... 1,306.6 6,039.8 22,519.5 7.1 5.2 8.02004: Dec .......................................... 1,375.9 6,391.1 25,344.0 5.3 5.8 9.32005: Dec .......................................... 1,374.9 6,657.0 27,694.6 –.1 4.2 9.32006: Dec .......................................... 1,366.5 7,042.2 30,172.2 –.6 5.8 8.72007: Dec .......................................... 1,374.3 7,450.8 32,745.5 .6 5.8 8.52008: Dec .......................................... 1,604.9 8,184.3 34,689.2 16.8 9.8 5.92009: Dec .......................................... 1,695.8 8,487.7 35,634.5 5.7 3.7 3.12010: Dec .......................................... 1,836.7 8,783.1 37,040.0 8.3 3.5 4.12011: Dec .......................................... 2,161.2 9,639.4 38,418.3 17.7 9.7 3.72012: Dec .......................................... 2,445.6 10,409.1 40,280.0 13.2 8.0 4.92012: Sept ........................................ 2,375.7 10,169.1 39,666.0 13.7 7.8 3.0 Oct .......................................... 2,422.7 10,254.9 .............................................. 15.1 8.6 ................................ Nov ......................................... 2,406.5 10,298.4 .............................................. 12.7 8.7 ................................ Dec .......................................... 2,447.2 10,417.1 40,280.0 15.8 10.0 6.22013: Jan .......................................... 2,467.8 10,459.6 .............................................. 13.3 8.8 ................................ Feb .......................................... 2,480.3 10,439.4 .............................................. 11.9 6.8 ................................ Mar ......................................... 2,463.3 10,460.2 40,728.5 7.4 5.7 4.5 Apr .......................................... 2,525.2 10,541.2 .............................................. 8.5 5.6 ................................ May ......................................... 2,536.2 10,562.2 .............................................. 10.8 5.1 ................................ June ........................................ 2,522.6 10,598.9 41,041.4 6.2 3.5 3.1 July r ....................................... 2,550.5 10,707.7 .............................................. 6.7 4.7 ................................ Aug ......................................... 2,554.2 10,767.9 .............................................. 6.0 6.3 ................................ Sept r ....................................... 2,576.8 10,819.2 .............................................. 9.2 6.9 ................................
MONEY, CREDIT, AND SECURITY MARKETS
In September, M2 rose.
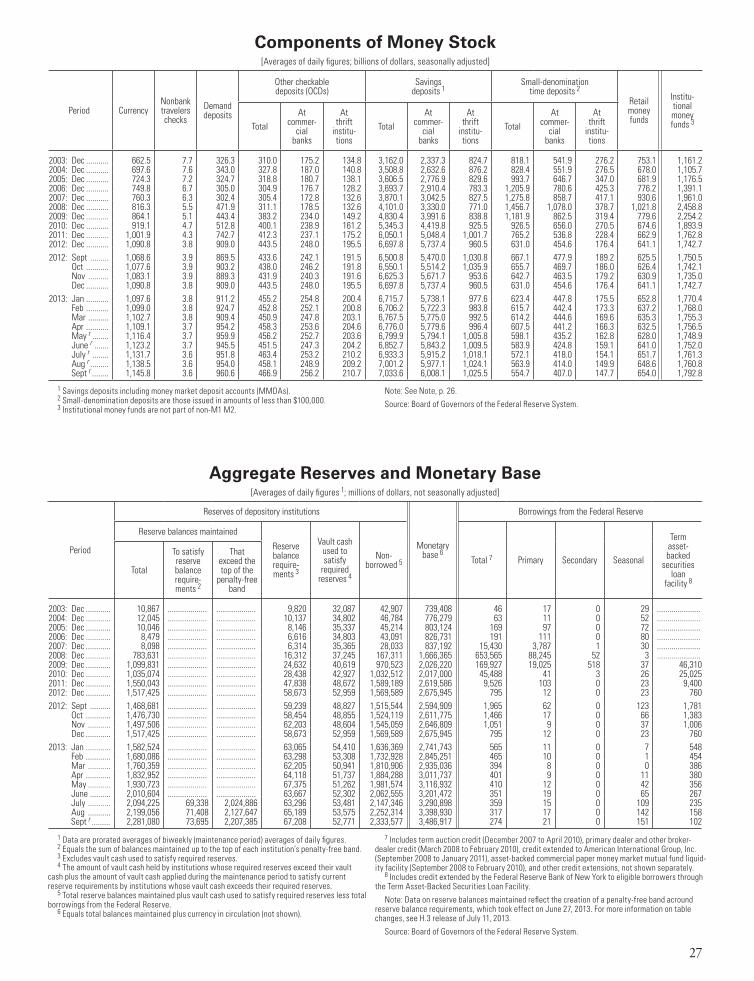
27
Components of Money Stock[Averages of daily figures; billions of dollars, seasonally adjusted]
Period CurrencyNonbank travelers checks
Demand deposits
Other checkable deposits (OCDs)
Savings deposits 1
Small-denomination time deposits 2
Retail money funds
Institu-tional money funds 3Total
At commer-
cial banks
At thrift
institu-tions
TotalAt
commer-cial
banks
At thrift
institu-tions
TotalAt
commer-cial
banks
At thrift
institu-tions
2003: Dec ........... 662.5 7.7 326.3 310.0 175.2 134.8 3,162.0 2,337.3 824.7 818.1 541.9 276.2 753.1 1,161.22004: Dec ........... 697.6 7.6 343.0 327.8 187.0 140.8 3,508.8 2,632.6 876.2 828.4 551.9 276.5 678.0 1,105.72005: Dec ........... 724.3 7.2 324.7 318.8 180.7 138.1 3,606.5 2,776.9 829.6 993.7 646.7 347.0 681.9 1,176.52006: Dec ........... 749.8 6.7 305.0 304.9 176.7 128.2 3,693.7 2,910.4 783.3 1,205.9 780.6 425.3 776.2 1,391.12007: Dec ........... 760.3 6.3 302.4 305.4 172.8 132.6 3,870.1 3,042.5 827.5 1,275.8 858.7 417.1 930.6 1,961.02008: Dec ........... 816.3 5.5 471.9 311.1 178.5 132.6 4,101.0 3,330.0 771.0 1,456.7 1,078.0 378.7 1,021.8 2,458.82009: Dec ........... 864.1 5.1 443.4 383.2 234.0 149.2 4,830.4 3,991.6 838.8 1,181.9 862.5 319.4 779.6 2,254.22010: Dec ........... 919.1 4.7 512.8 400.1 238.9 161.2 5,345.3 4,419.8 925.5 926.5 656.0 270.5 674.6 1,893.92011: Dec ........... 1,001.9 4.3 742.7 412.3 237.1 175.2 6,050.1 5,048.4 1,001.7 765.2 536.8 228.4 662.9 1,762.82012: Dec ........... 1,090.8 3.8 909.0 443.5 248.0 195.5 6,697.8 5,737.4 960.5 631.0 454.6 176.4 641.1 1,742.72012: Sept ......... 1,068.6 3.9 869.5 433.6 242.1 191.5 6,500.8 5,470.0 1,030.8 667.1 477.9 189.2 625.5 1,750.5 Oct ........... 1,077.6 3.9 903.2 438.0 246.2 191.8 6,550.1 5,514.2 1,035.9 655.7 469.7 186.0 626.4 1,742.1 Nov .......... 1,083.1 3.9 889.3 431.9 240.3 191.6 6,625.3 5,671.7 953.6 642.7 463.5 179.2 630.9 1,735.0 Dec ........... 1,090.8 3.8 909.0 443.5 248.0 195.5 6,697.8 5,737.4 960.5 631.0 454.6 176.4 641.1 1,742.72013: Jan ........... 1,097.6 3.8 911.2 455.2 254.8 200.4 6,715.7 5,738.1 977.6 623.4 447.8 175.5 652.8 1,770.4 Feb ........... 1,099.0 3.8 924.7 452.8 252.1 200.8 6,706.2 5,722.3 983.8 615.7 442.4 173.3 637.2 1,768.0 Mar .......... 1,102.7 3.8 909.4 450.9 247.8 203.1 6,767.5 5,775.0 992.5 614.2 444.6 169.6 635.3 1,755.3 Apr ........... 1,109.1 3.7 954.2 458.3 253.6 204.6 6,776.0 5,779.6 996.4 607.5 441.2 166.3 632.5 1,756.5 May r ........ 1,116.4 3.7 959.9 456.2 252.7 203.6 6,799.9 5,794.1 1,005.8 598.1 435.2 162.8 628.0 1,748.9 June r ....... 1,123.2 3.7 945.5 451.5 247.3 204.2 6,852.7 5,843.2 1,009.5 583.9 424.8 159.1 641.0 1,752.0 July r ........ 1,131.7 3.6 951.8 463.4 253.2 210.2 6,933.3 5,915.2 1,018.1 572.1 418.0 154.1 651.7 1,761.3 Aug r ......... 1,138.5 3.6 954.0 458.1 248.9 209.2 7,001.2 5,977.1 1,024.1 563.9 414.0 149.9 648.6 1,760.8 Sept r ........ 1,145.8 3.6 960.6 466.9 256.2 210.7 7,033.6 6,008.1 1,025.5 554.7 407.0 147.7 654.0 1,792.8
1 Savings deposits including money market deposit accounts (MMDAs).2 Small-denomination deposits are those issued in amounts of less than $100,000.3 Institutional money funds are not part of non-M1 M2.
Note: See Note, p. 26.
Source: Board of Governors of the Federal Reserve System.
Aggregate Reserves and Monetary Base[Averages of daily figures 1; millions of dollars, not seasonally adjusted]
Period
Reserves of depository institutions
Monetary base 6
Borrowings from the Federal Reserve
Reserve balances maintained
Reserve balance require-ments 3
Vault cash used to satisfy
required reserves 4
Non- borrowed 5 Total 7 Primary Secondary Seasonal
Term asset- backed
securities loan
facility 8Total
To satisfy reserve balance require-ments 2
That exceed the top of the
penalty-free band
2003: Dec ............ 10,867 ................... ................... 9,820 32,087 42,907 739,408 46 17 0 29 .....................2004: Dec ............ 12,045 ................... ................... 10,137 34,802 46,784 776,279 63 11 0 52 .....................2005: Dec ............ 10,046 ................... ................... 8,146 35,337 45,214 803,124 169 97 0 72 .....................2006: Dec ............ 8,479 ................... ................... 6,616 34,803 43,091 826,731 191 111 0 80 .....................2007: Dec ............ 8,098 ................... ................... 6,314 35,365 28,033 837,192 15,430 3,787 1 30 .....................2008: Dec ............ 783,631 ................... ................... 16,312 37,245 167,311 1,666,365 653,565 88,245 52 3 .....................2009: Dec ............ 1,099,831 ................... ................... 24,632 40,619 970,523 2,026,220 169,927 19,025 518 37 46,3102010: Dec ............ 1,035,074 ................... ................... 28,438 42,927 1,032,512 2,017,000 45,488 41 3 26 25,0252011: Dec ............ 1,550,043 ................... ................... 47,838 48,672 1,589,189 2,619,586 9,526 103 0 23 9,4002012: Dec ............ 1,517,425 ................... ................... 58,673 52,959 1,569,589 2,675,945 795 12 0 23 7602012: Sept .......... 1,468,681 ................... ................... 59,239 48,827 1,515,544 2,594,909 1,965 62 0 123 1,781 Oct ............ 1,476,730 ................... ................... 58,454 48,855 1,524,119 2,611,775 1,466 17 0 66 1,383 Nov ........... 1,497,506 ................... ................... 62,203 48,604 1,545,059 2,646,809 1,051 9 0 37 1,006 Dec ............ 1,517,425 ................... ................... 58,673 52,959 1,569,589 2,675,945 795 12 0 23 7602013: Jan ............ 1,582,524 ................... ................... 63,065 54,410 1,636,369 2,741,743 565 11 0 7 548 Feb ............ 1,680,086 ................... ................... 63,298 53,308 1,732,928 2,845,251 465 10 0 1 454 Mar ........... 1,760,359 ................... ................... 62,205 50,941 1,810,906 2,935,036 394 8 0 0 386 Apr ............ 1,832,952 ................... ................... 64,118 51,737 1,884,288 3,011,737 401 9 0 11 380 May ........... 1,930,723 ................... ................... 67,375 51,262 1,981,574 3,116,932 410 12 0 42 356 June .......... 2,010,604 ................... ................... 63,667 52,302 2,062,555 3,201,472 351 19 0 65 267 July ........... 2,094,225 69,338 2,024,886 63,296 53,481 2,147,346 3,290,898 359 15 0 109 235 Aug ........... 2,199,056 71,408 2,127,647 65,189 53,575 2,252,314 3,398,930 317 17 0 142 158 Sept r ......... 2,281,080 73,695 2,207,385 67,208 52,771 2,333,577 3,486,917 274 21 0 151 102
1 Data are prorated averages of biweekly (maintenance period) averages of daily figures. 2 Equals the sum of balances maintained up to the top of each institution’s penalty-free band.3 Excludes vault cash used to satisfy required reserves.4 The amount of vault cash held by institutions whose required reserves exceed their vault
cash plus the amount of vault cash applied during the maintenance period to satisfy current reserve requirements by institutions whose vault cash exceeds their required reserves.
5 Total reserve balances maintained plus vault cash used to satisfy required reserves less total borrowings from the Federal Reserve.
6 Equals total balances maintained plus currency in circulation (not shown).
7 Includes term auction credit (December 2007 to April 2010), primary dealer and other broker-dealer credit (March 2008 to February 2010), credit extended to American International Group, Inc. (September 2008 to January 2011), asset-backed commercial paper money market mutual fund liquid-ity facility (September 2008 to February 2010), and other credit extensions, not shown separately.
8 Includes credit extended by the Federal Reserve Bank of New York to eligible borrowers through the Term Asset-Backed Securities Loan Facility.
Note: Data on reserve balances maintained reflect the creation of a penalty-free band acround reserve balance requirements, which took effect on June 27, 2013. For more information on table changes, see H.3 release of July 11, 2013.
Source: Board of Governors of the Federal Reserve System.
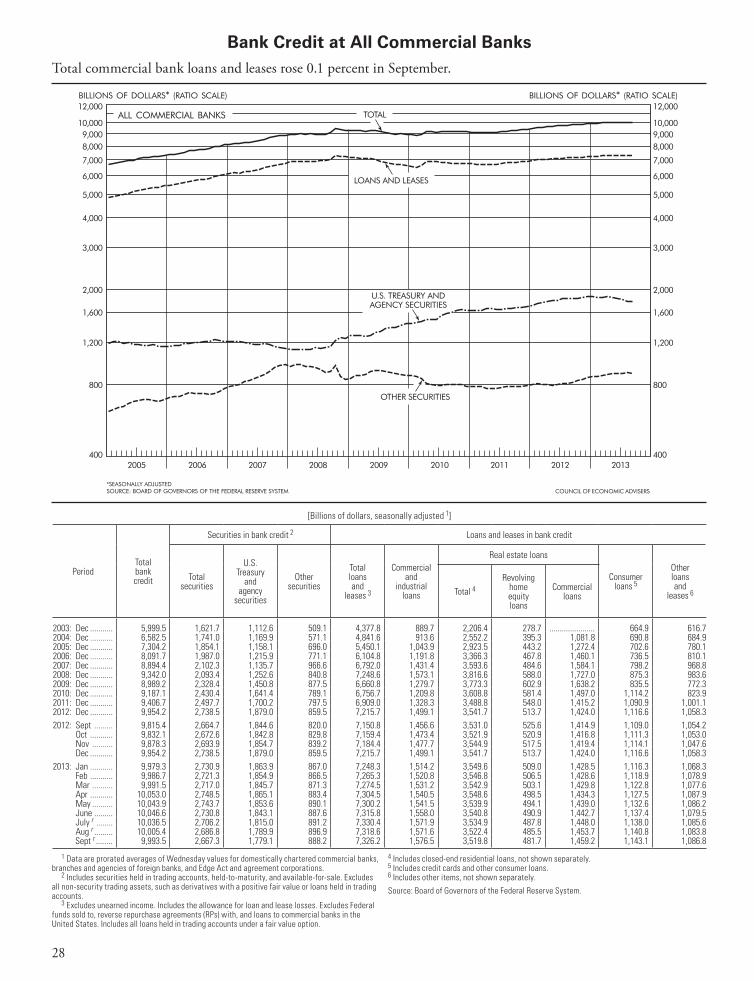
28
Bank Credit at All Commercial Banks
1 Data are prorated averages of Wednesday values for domestically chartered commercial banks, branches and agencies of foreign banks, and Edge Act and agreement corporations.
2 Includes securities held in trading accounts, held-to-maturity, and available-for-sale. Excludes all non-security trading assets, such as derivatives with a positive fair value or loans held in trading accounts.
3 Excludes unearned income. Includes the allowance for loan and lease losses. Excludes Federal funds sold to, reverse repurchase agreements (RPs) with, and loans to commercial banks in the United States. Includes all loans held in trading accounts under a fair value option.
4 Includes closed-end residential loans, not shown separately.5 Includes credit cards and other consumer loans.6 Includes other items, not shown separately.
Source: Board of Governors of the Federal Reserve System.
[Billions of dollars, seasonally adjusted 1]
PeriodTotal bank credit
Securities in bank credit 2 Loans and leases in bank credit
Total securities
U.S. Treasury
and agency
securities
Other securities
Total loans and
leases 3
Commercial and
industrial loans
Real estate loans
Consumer loans 5
Other loans and
leases 6Total 4Revolving
home equity loans
Commercial loans
2003: Dec ........... 5,999.5 1,621.7 1,112.6 509.1 4,377.8 889.7 2,206.4 278.7 ...................... 664.9 616.72004: Dec ........... 6,582.5 1,741.0 1,169.9 571.1 4,841.6 913.6 2,552.2 395.3 1,081.8 690.8 684.92005: Dec ........... 7,304.2 1,854.1 1,158.1 696.0 5,450.1 1,043.9 2,923.5 443.2 1,272.4 702.6 780.12006: Dec ........... 8,091.7 1,987.0 1,215.9 771.1 6,104.8 1,191.8 3,366.3 467.8 1,460.1 736.5 810.12007: Dec ........... 8,894.4 2,102.3 1,135.7 966.6 6,792.0 1,431.4 3,593.6 484.6 1,584.1 798.2 968.82008: Dec ........... 9,342.0 2,093.4 1,252.6 840.8 7,248.6 1,573.1 3,816.6 588.0 1,727.0 875.3 983.62009: Dec ........... 8,989.2 2,328.4 1,450.8 877.5 6,660.8 1,279.7 3,773.3 602.9 1,638.2 835.5 772.32010: Dec ........... 9,187.1 2,430.4 1,641.4 789.1 6,756.7 1,209.8 3,608.8 581.4 1,497.0 1,114.2 823.92011: Dec ........... 9,406.7 2,497.7 1,700.2 797.5 6,909.0 1,328.3 3,488.8 548.0 1,415.2 1,090.9 1,001.12012: Dec ........... 9,954.2 2,738.5 1,879.0 859.5 7,215.7 1,499.1 3,541.7 513.7 1,424.0 1,116.6 1,058.32012: Sept ......... 9,815.4 2,664.7 1,844.6 820.0 7,150.8 1,456.6 3,531.0 525.6 1,414.9 1,109.0 1,054.2 Oct ........... 9,832.1 2,672.6 1,842.8 829.8 7,159.4 1,473.4 3,521.9 520.9 1,416.8 1,111.3 1,053.0 Nov .......... 9,878.3 2,693.9 1,854.7 839.2 7,184.4 1,477.7 3,544.9 517.5 1,419.4 1,114.1 1,047.6 Dec ........... 9,954.2 2,738.5 1,879.0 859.5 7,215.7 1,499.1 3,541.7 513.7 1,424.0 1,116.6 1,058.32013: Jan ........... 9,979.3 2,730.9 1,863.9 867.0 7,248.3 1,514.2 3,549.6 509.0 1,428.5 1,116.3 1,068.3 Feb ........... 9,986.7 2,721.3 1,854.9 866.5 7,265.3 1,520.8 3,546.8 506.5 1,428.6 1,118.9 1,078.9 Mar .......... 9,991.5 2,717.0 1,845.7 871.3 7,274.5 1,531.2 3,542.9 503.1 1,429.8 1,122.8 1,077.6 Apr ........... 10,053.0 2,748.5 1,865.1 883.4 7,304.5 1,540.5 3,548.6 498.5 1,434.3 1,127.5 1,087.9 May .......... 10,043.9 2,743.7 1,853.6 890.1 7,300.2 1,541.5 3,539.9 494.1 1,439.0 1,132.6 1,086.2 June ......... 10,046.6 2,730.8 1,843.1 887.6 7,315.8 1,558.0 3,540.8 490.9 1,442.7 1,137.4 1,079.5 July r ........ 10,036.5 2,706.2 1,815.0 891.2 7,330.4 1,571.9 3,534.9 487.8 1,448.0 1,138.0 1,085.6 Aug r ......... 10,005.4 2,686.8 1,789.9 896.9 7,318.6 1,571.6 3,522.4 485.5 1,453.7 1,140.8 1,083.8 Sept r ........ 9,993.5 2,667.3 1,779.1 888.2 7,326.2 1,576.5 3,519.8 481.7 1,459.2 1,143.1 1,086.8
Total commercial bank loans and leases rose 0.1 percent in September.
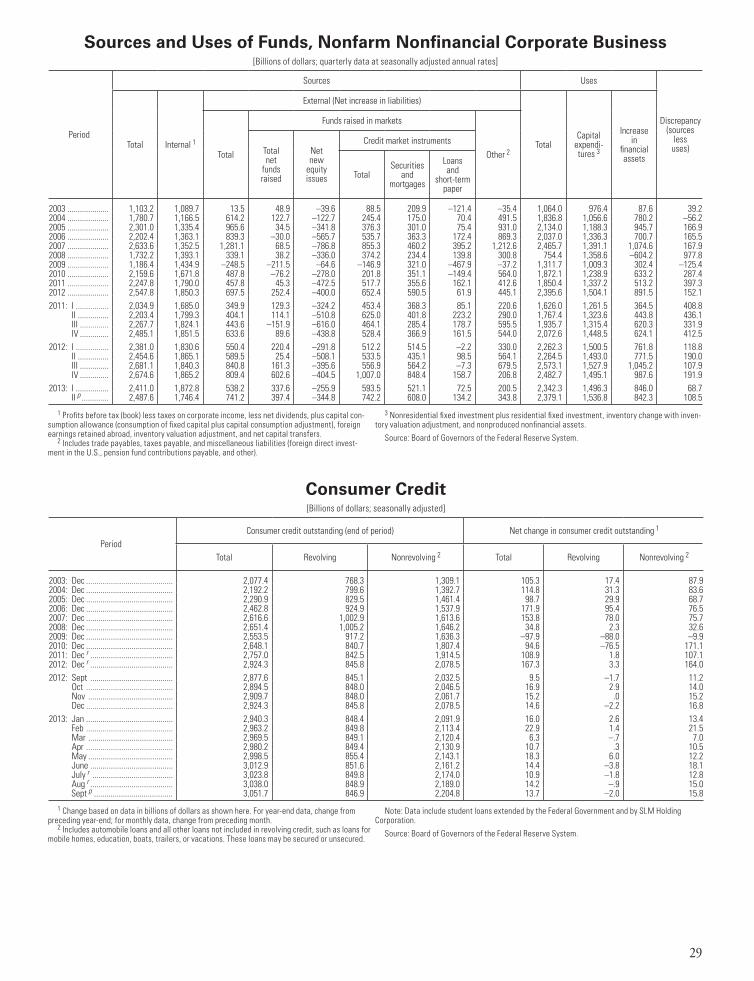
29
Sources and Uses of Funds, Nonfarm Nonfinancial Corporate Business[Billions of dollars; quarterly data at seasonally adjusted annual rates]
Period
Sources Uses
Discrepancy (sources
less uses)Total Internal 1
External (Net increase in liabilities)
TotalCapital
expendi-tures 3
Increase in
financial assetsTotal
Funds raised in markets
Other 2Total net
funds raised
Net new
equity issues
Credit market instruments
TotalSecurities
and mortgages
Loans and
short-term paper
2003 .................... 1,103.2 1,089.7 13.5 48.9 –39.6 88.5 209.9 –121.4 –35.4 1,064.0 976.4 87.6 39.22004 .................... 1,780.7 1,166.5 614.2 122.7 –122.7 245.4 175.0 70.4 491.5 1,836.8 1,056.6 780.2 –56.22005 .................... 2,301.0 1,335.4 965.6 34.5 –341.8 376.3 301.0 75.4 931.0 2,134.0 1,188.3 945.7 166.92006 .................... 2,202.4 1,363.1 839.3 –30.0 –565.7 535.7 363.3 172.4 869.3 2,037.0 1,336.3 700.7 165.52007 .................... 2,633.6 1,352.5 1,281.1 68.5 –786.8 855.3 460.2 395.2 1,212.6 2,465.7 1,391.1 1,074.6 167.92008 .................... 1,732.2 1,393.1 339.1 38.2 –336.0 374.2 234.4 139.8 300.8 754.4 1,358.6 –604.2 977.82009 .................... 1,186.4 1,434.9 –248.5 –211.5 –64.6 –146.9 321.0 –467.9 –37.2 1,311.7 1,009.3 302.4 –125.42010 .................... 2,159.6 1,671.8 487.8 –76.2 –278.0 201.8 351.1 –149.4 564.0 1,872.1 1,238.9 633.2 287.42011 .................... 2,247.8 1,790.0 457.8 45.3 –472.5 517.7 355.6 162.1 412.6 1,850.4 1,337.2 513.2 397.32012 .................... 2,547.8 1,850.3 697.5 252.4 –400.0 652.4 590.5 61.9 445.1 2,395.6 1,504.1 891.5 152.12011: I ................ 2,034.9 1,685.0 349.9 129.3 –324.2 453.4 368.3 85.1 220.6 1,626.0 1,261.5 364.5 408.8 II ............... 2,203.4 1,799.3 404.1 114.1 –510.8 625.0 401.8 223.2 290.0 1,767.4 1,323.6 443.8 436.1 III .............. 2,267.7 1,824.1 443.6 –151.9 –616.0 464.1 285.4 178.7 595.5 1,935.7 1,315.4 620.3 331.9 IV .............. 2,485.1 1,851.5 633.6 89.6 –438.8 528.4 366.9 161.5 544.0 2,072.6 1,448.5 624.1 412.52012: I ................ 2,381.0 1,830.6 550.4 220.4 –291.8 512.2 514.5 –2.2 330.0 2,262.3 1,500.5 761.8 118.8 II ............... 2,454.6 1,865.1 589.5 25.4 –508.1 533.5 435.1 98.5 564.1 2,264.5 1,493.0 771.5 190.0 III .............. 2,681.1 1,840.3 840.8 161.3 –395.6 556.9 564.2 –7.3 679.5 2,573.1 1,527.9 1,045.2 107.9 IV .............. 2,674.6 1,865.2 809.4 602.6 –404.5 1,007.0 848.4 158.7 206.8 2,482.7 1,495.1 987.6 191.92013: I ................ 2,411.0 1,872.8 538.2 337.6 –255.9 593.5 521.1 72.5 200.5 2,342.3 1,496.3 846.0 68.7 II p ............. 2,487.6 1,746.4 741.2 397.4 –344.8 742.2 608.0 134.2 343.8 2,379.1 1,536.8 842.3 108.5
Consumer Credit[Billions of dollars; seasonally adjusted]
PeriodConsumer credit outstanding (end of period) Net change in consumer credit outstanding 1
Total Revolving Nonrevolving 2 Total Revolving Nonrevolving 2
2003: Dec .......................................... 2,077.4 768.3 1,309.1 105.3 17.4 87.92004: Dec .......................................... 2,192.2 799.6 1,392.7 114.8 31.3 83.62005: Dec .......................................... 2,290.9 829.5 1,461.4 98.7 29.9 68.72006: Dec .......................................... 2,462.8 924.9 1,537.9 171.9 95.4 76.52007: Dec .......................................... 2,616.6 1,002.9 1,613.6 153.8 78.0 75.72008: Dec .......................................... 2,651.4 1,005.2 1,646.2 34.8 2.3 32.62009: Dec .......................................... 2,553.5 917.2 1,636.3 –97.9 –88.0 –9.92010: Dec .......................................... 2,648.1 840.7 1,807.4 94.6 –76.5 171.12011: Dec r ........................................ 2,757.0 842.5 1,914.5 108.9 1.8 107.12012: Dec r ........................................ 2,924.3 845.8 2,078.5 167.3 3.3 164.02012: Sept ........................................ 2,877.6 845.1 2,032.5 9.5 –1.7 11.2 Oct .......................................... 2,894.5 848.0 2,046.5 16.9 2.9 14.0 Nov ......................................... 2,909.7 848.0 2,061.7 15.2 .0 15.2 Dec .......................................... 2,924.3 845.8 2,078.5 14.6 –2.2 16.82013: Jan .......................................... 2,940.3 848.4 2,091.9 16.0 2.6 13.4 Feb .......................................... 2,963.2 849.8 2,113.4 22.9 1.4 21.5 Mar ......................................... 2,969.5 849.1 2,120.4 6.3 –.7 7.0 Apr .......................................... 2,980.2 849.4 2,130.9 10.7 .3 10.5 May ......................................... 2,998.5 855.4 2,143.1 18.3 6.0 12.2 June ........................................ 3,012.9 851.6 2,161.2 14.4 –3.8 18.1 July r ....................................... 3,023.8 849.8 2,174.0 10.9 –1.8 12.8 Aug r ........................................ 3,038.0 848.9 2,189.0 14.2 –.9 15.0 Sept p ...................................... 3,051.7 846.9 2,204.8 13.7 –2.0 15.8
1 Profits before tax (book) less taxes on corporate income, less net dividends, plus capital con-sumption allowance (consumption of fixed capital plus capital consumption adjustment), foreign earnings retained abroad, inventory valuation adjustment, and net capital transfers.
2 Includes trade payables, taxes payable, and miscellaneous liabilities (foreign direct invest-ment in the U.S., pension fund contributions payable, and other).
3 Nonresidential fixed investment plus residential fixed investment, inventory change with inven-tory valuation adjustment, and nonproduced nonfinancial assets.
Source: Board of Governors of the Federal Reserve System.
1 Change based on data in billions of dollars as shown here. For year-end data, change from preceding year-end; for monthly data, change from preceding month.
2 Includes automobile loans and all other loans not included in revolving credit, such as loans for mobile homes, education, boats, trailers, or vacations. These loans may be secured or unsecured.
Note: Data include student loans extended by the Federal Government and by SLM Holding Corporation.
Source: Board of Governors of the Federal Reserve System.
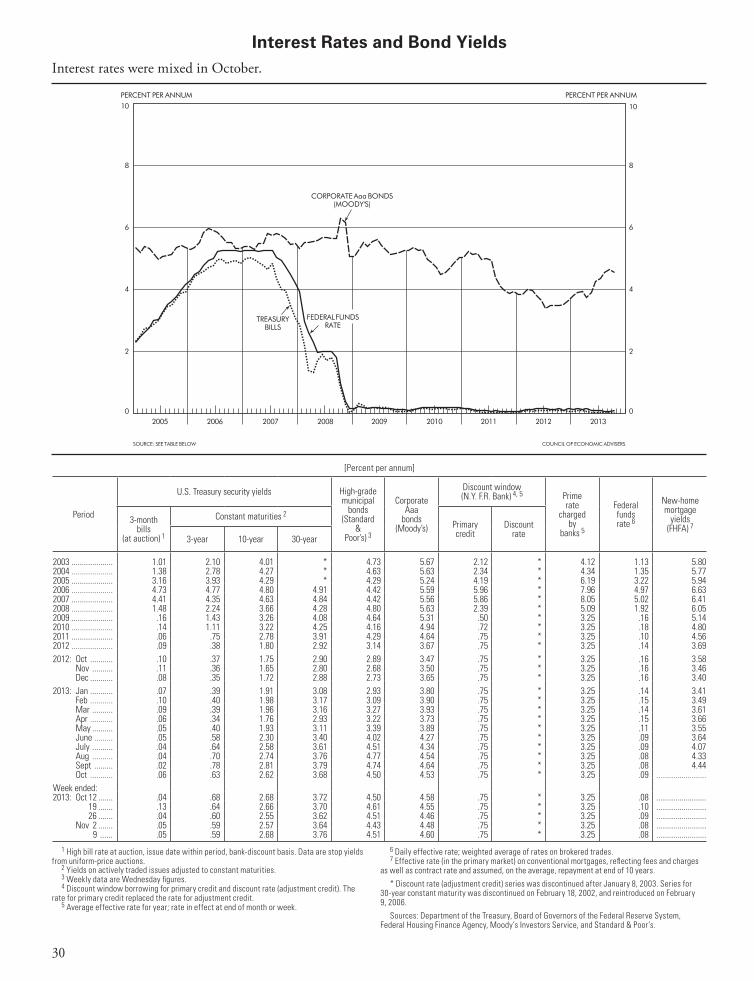
30
1 High bill rate at auction, issue date within period, bank-discount basis. Data are stop yields from uniform-price auctions.
2 Yields on actively traded issues adjusted to constant maturities.3 Weekly data are Wednesday figures.4 Discount window borrowing for primary credit and discount rate (adjustment credit). The
rate for primary credit replaced the rate for adjustment credit.5 Average effective rate for year; rate in effect at end of month or week.
6 Daily effective rate; weighted average of rates on brokered trades.7 Effective rate (in the primary market) on conventional mortgages, reflecting fees and charges
as well as contract rate and assumed, on the average, repayment at end of 10 years.
* Discount rate (adjustment credit) series was discontinued after January 8, 2003. Series for 30-year constant maturity was discontinued on February 18, 2002, and reintroduced on February 9, 2006.
Sources: Department of the Treasury, Board of Governors of the Federal Reserve System, Federal Housing Finance Agency, Moody’s Investors Service, and Standard & Poor’s.
[Percent per annum]
Period
U.S. Treasury security yields High-grade municipal
bonds (Standard
& Poor’s) 3
Corporate Aaa
bonds (Moody’s)
Discount window (N.Y. F.R. Bank) 4, 5 Prime
rate charged
by banks 5
Federal funds rate 6
New-home mortgage
yields (FHFA) 7
3-month bills
(at auction) 1
Constant maturities 2
Primary credit
Discount rate3-year 10-year 30-year
2003 .................... 1.01 2.10 4.01 * 4.73 5.67 2.12 * 4.12 1.13 5.802004 .................... 1.38 2.78 4.27 * 4.63 5.63 2.34 * 4.34 1.35 5.772005 .................... 3.16 3.93 4.29 * 4.29 5.24 4.19 * 6.19 3.22 5.942006 .................... 4.73 4.77 4.80 4.91 4.42 5.59 5.96 * 7.96 4.97 6.632007 .................... 4.41 4.35 4.63 4.84 4.42 5.56 5.86 * 8.05 5.02 6.412008 .................... 1.48 2.24 3.66 4.28 4.80 5.63 2.39 * 5.09 1.92 6.052009 .................... .16 1.43 3.26 4.08 4.64 5.31 .50 * 3.25 .16 5.142010 .................... .14 1.11 3.22 4.25 4.16 4.94 .72 * 3.25 .18 4.802011 .................... .06 .75 2.78 3.91 4.29 4.64 .75 * 3.25 .10 4.562012 .................... .09 .38 1.80 2.92 3.14 3.67 .75 * 3.25 .14 3.692012: Oct ........... .10 .37 1.75 2.90 2.89 3.47 .75 * 3.25 .16 3.58 Nov .......... .11 .36 1.65 2.80 2.68 3.50 .75 * 3.25 .16 3.46 Dec ........... .08 .35 1.72 2.88 2.73 3.65 .75 * 3.25 .16 3.402013: Jan ........... .07 .39 1.91 3.08 2.93 3.80 .75 * 3.25 .14 3.41 Feb ........... .10 .40 1.98 3.17 3.09 3.90 .75 * 3.25 .15 3.49 Mar .......... .09 .39 1.96 3.16 3.27 3.93 .75 * 3.25 .14 3.61 Apr ........... .06 .34 1.76 2.93 3.22 3.73 .75 * 3.25 .15 3.66 May .......... .05 .40 1.93 3.11 3.39 3.89 .75 * 3.25 .11 3.55 June ......... .05 .58 2.30 3.40 4.02 4.27 .75 * 3.25 .09 3.64 July .......... .04 .64 2.58 3.61 4.51 4.34 .75 * 3.25 .09 4.07 Aug .......... .04 .70 2.74 3.76 4.77 4.54 .75 * 3.25 .08 4.33 Sept ......... .02 .78 2.81 3.79 4.74 4.64 .75 * 3.25 .08 4.44 Oct ........... .06 .63 2.62 3.68 4.50 4.53 .75 * 3.25 .09 ........................Week ended:2013: Oct 12 ....... .04 .68 2.68 3.72 4.50 4.58 .75 * 3.25 .08 ........................ 19 ....... .13 .64 2.66 3.70 4.61 4.55 .75 * 3.25 .10 ........................ 26 ....... .04 .60 2.55 3.62 4.51 4.46 .75 * 3.25 .09 ........................ Nov 2 ....... .05 .59 2.57 3.64 4.43 4.48 .75 * 3.25 .08 ........................ 9 ...... .05 .59 2.68 3.76 4.51 4.60 .75 * 3.25 .08 ........................
Interest Rates and Bond Yields
2011: July 9 ... 16 ... 23 ... 30 ... Aug 6 ..
Interest rates were mixed in October.
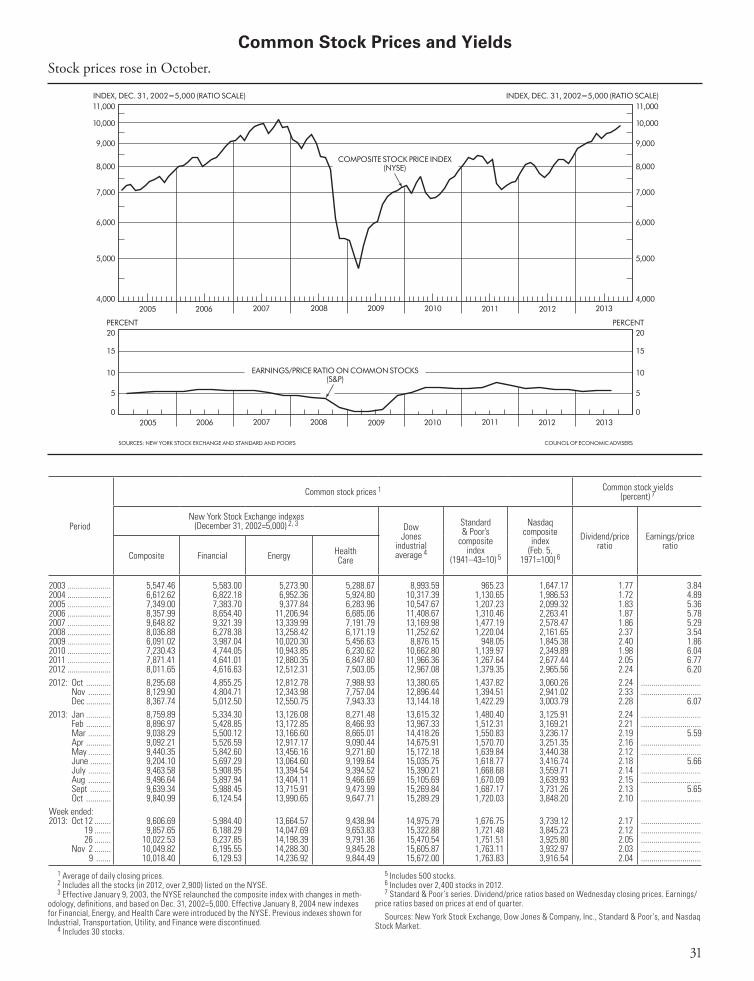
31
Common Stock Prices and Yields
1 Average of daily closing prices.2 Includes all the stocks (in 2012, over 2,900) listed on the NYSE.3 Effective January 9, 2003, the NYSE relaunched the composite index with changes in meth-
odology, definitions, and based on Dec. 31, 2002=5,000. Effective January 8, 2004 new indexes for Financial, Energy, and Health Care were introduced by the NYSE. Previous indexes shown for Industrial, Transportation, Utility, and Finance were discontinued.
4 Includes 30 stocks.
5 Includes 500 stocks.6 Includes over 2,400 stocks in 2012.7 Standard & Poor’s series. Dividend/price ratios based on Wednesday closing prices. Earnings/
price ratios based on prices at end of quarter.
Sources: New York Stock Exchange, Dow Jones & Company, Inc., Standard & Poor’s, and Nasdaq Stock Market.
Period
Common stock prices 1 Common stock yields (percent) 7
New York Stock Exchange indexes (December 31, 2002=5,000) 2, 3 Dow
Jones industrial average 4
Standard & Poor’s
composite index
(1941–43=10) 5
Nasdaq composite
index (Feb. 5,
1971=100) 6
Dividend/price ratio
Earnings/price ratio
Composite Financial Energy Health Care
2003 ..................... 5,547.46 5,583.00 5,273.90 5,288.67 8,993.59 965.23 1,647.17 1.77 3.842004 ..................... 6,612.62 6,822.18 6,952.36 5,924.80 10,317.39 1,130.65 1,986.53 1.72 4.892005 ..................... 7,349.00 7,383.70 9,377.84 6,283.96 10,547.67 1,207.23 2,099.32 1.83 5.362006 ..................... 8,357.99 8,654.40 11,206.94 6,685.06 11,408.67 1,310.46 2,263.41 1.87 5.782007 ..................... 9,648.82 9,321.39 13,339.99 7,191.79 13,169.98 1,477.19 2,578.47 1.86 5.292008 ..................... 8,036.88 6,278.38 13,258.42 6,171.19 11,252.62 1,220.04 2,161.65 2.37 3.542009 ..................... 6,091.02 3,987.04 10,020.30 5,456.63 8,876.15 948.05 1,845.38 2.40 1.862010 ..................... 7,230.43 4,744.05 10,943.85 6,230.62 10,662.80 1,139.97 2,349.89 1.98 6.042011 ..................... 7,871.41 4,641.01 12,880.35 6,847.80 11,966.36 1,267.64 2,677.44 2.05 6.772012 ..................... 8,011.65 4,616.63 12,512.31 7,503.05 12,967.08 1,379.35 2,965.56 2.24 6.202012: Oct ............ 8,295.68 4,855.25 12,812.78 7,988.93 13,380.65 1,437.82 3,060.26 2.24 ............................. Nov ........... 8,129.90 4,804.71 12,343.98 7,757.04 12,896.44 1,394.51 2,941.02 2.33 ............................. Dec ............ 8,367.74 5,012.50 12,550.75 7,943.33 13,144.18 1,422.29 3,003.79 2.28 6.072013: Jan ............ 8,759.89 5,334.30 13,126.08 8,271.48 13,615.32 1,480.40 3,125.91 2.24 ............................. Feb ............ 8,896.97 5,428.85 13,172.85 8,466.93 13,967.33 1,512.31 3,169.21 2.21 ............................. Mar ........... 9,038.29 5,500.12 13,166.60 8,665.01 14,418.26 1,550.83 3,236.17 2.19 5.59 Apr ............ 9,092.21 5,526.59 12,917.17 9,090.44 14,675.91 1,570.70 3,251.35 2.16 ............................. May ........... 9,440.35 5,842.60 13,456.16 9,271.60 15,172.18 1,639.84 3,440.38 2.12 ............................. June .......... 9,204.10 5,697.29 13,064.60 9,199.64 15,035.75 1,618.77 3,416.74 2.18 5.66 July ........... 9,463.58 5,908.95 13,394.54 9,394.52 15,390.21 1,668.68 3,559.71 2.14 ............................. Aug ........... 9,496.64 5,897.94 13,404.11 9,466.69 15,105.69 1,670.09 3,639.93 2.15 ............................. Sept .......... 9,639.34 5,988.45 13,715.91 9,473.99 15,269.84 1,687.17 3,731.26 2.13 5.65 Oct ............ 9,840.99 6,124.54 13,990.65 9,647.71 15,289.29 1,720.03 3,848.20 2.10 .............................Week ended:2013: Oct 12 ........ 9,606.69 5,984.40 13,664.57 9,438.94 14,975.79 1,676.75 3,739.12 2.17 ............................. 19 ........ 9,857.65 6,188.29 14,047.69 9,653.83 15,322.88 1,721.48 3,845.23 2.12 ............................. 26 ........ 10,022.53 6,237.85 14,198.39 9,791.36 15,470.54 1,751.51 3,925.80 2.05 ............................. Nov 2 ........ 10,049.82 6,195.55 14,288.30 9,845.28 15,605.87 1,763.11 3,932.97 2.03 ............................. 9 ....... 10,018.40 6,129.53 14,236.92 9,844.49 15,672.00 1,763.83 3,916.54 2.04 .............................
Stock prices rose in October.
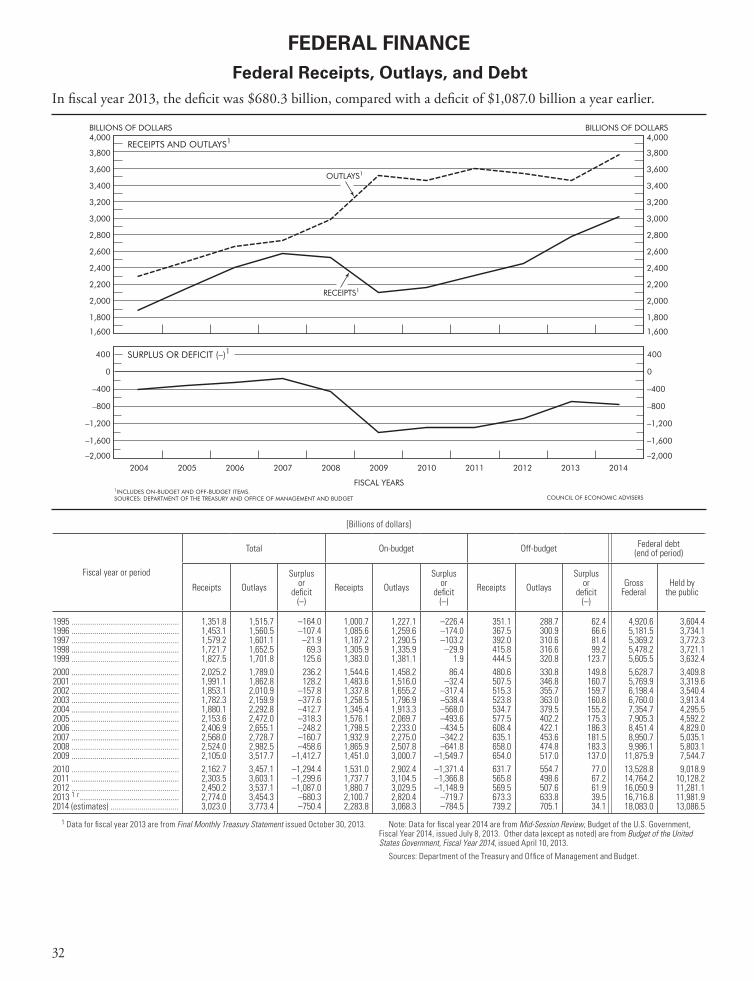
32
Federal Receipts, Outlays, and Debt
1 Data for fiscal year 2013 are from Final Monthly Treasury Statement issued October 30, 2013. Note: Data for fiscal year 2014 are from Mid-Session Review, Budget of the U.S. Government, Fiscal Year 2014, issued July 8, 2013. Other data (except as noted) are from Budget of the United States Government, Fiscal Year 2014, issued April 10, 2013.
Sources: Department of the Treasury and Office of Management and Budget.
[Billions of dollars]
Fiscal year or period
Total On-budget Off-budget Federal debt (end of period)
Receipts OutlaysSurplus
or deficit
(–)Receipts Outlays
Surplus or
deficit (–)
Receipts OutlaysSurplus
or deficit
(–)
Gross Federal
Held by the public
1995 .................................................... 1,351.8 1,515.7 –164.0 1,000.7 1,227.1 –226.4 351.1 288.7 62.4 4,920.6 3,604.41996 .................................................... 1,453.1 1,560.5 –107.4 1,085.6 1,259.6 –174.0 367.5 300.9 66.6 5,181.5 3,734.11997 .................................................... 1,579.2 1,601.1 –21.9 1,187.2 1,290.5 –103.2 392.0 310.6 81.4 5,369.2 3,772.31998 .................................................... 1,721.7 1,652.5 69.3 1,305.9 1,335.9 –29.9 415.8 316.6 99.2 5,478.2 3,721.11999 .................................................... 1,827.5 1,701.8 125.6 1,383.0 1,381.1 1.9 444.5 320.8 123.7 5,605.5 3,632.42000 .................................................... 2,025.2 1,789.0 236.2 1,544.6 1,458.2 86.4 480.6 330.8 149.8 5,628.7 3,409.82001 .................................................... 1,991.1 1,862.8 128.2 1,483.6 1,516.0 –32.4 507.5 346.8 160.7 5,769.9 3,319.62002 .................................................... 1,853.1 2,010.9 –157.8 1,337.8 1,655.2 –317.4 515.3 355.7 159.7 6,198.4 3,540.42003 .................................................... 1,782.3 2,159.9 –377.6 1,258.5 1,796.9 –538.4 523.8 363.0 160.8 6,760.0 3,913.42004 .................................................... 1,880.1 2,292.8 –412.7 1,345.4 1,913.3 –568.0 534.7 379.5 155.2 7,354.7 4,295.52005 .................................................... 2,153.6 2,472.0 –318.3 1,576.1 2,069.7 –493.6 577.5 402.2 175.3 7,905.3 4,592.22006 .................................................... 2,406.9 2,655.1 –248.2 1,798.5 2,233.0 –434.5 608.4 422.1 186.3 8,451.4 4,829.02007 .................................................... 2,568.0 2,728.7 –160.7 1,932.9 2,275.0 –342.2 635.1 453.6 181.5 8,950.7 5,035.12008 .................................................... 2,524.0 2,982.5 –458.6 1,865.9 2,507.8 –641.8 658.0 474.8 183.3 9,986.1 5,803.12009 .................................................... 2,105.0 3,517.7 –1,412.7 1,451.0 3,000.7 –1,549.7 654.0 517.0 137.0 11,875.9 7,544.72010 .................................................... 2,162.7 3,457.1 –1,294.4 1,531.0 2,902.4 –1,371.4 631.7 554.7 77.0 13,528.8 9,018.92011 .................................................... 2,303.5 3,603.1 –1,299.6 1,737.7 3,104.5 –1,366.8 565.8 498.6 67.2 14,764.2 10,128.22012 .................................................... 2,450.2 3,537.1 –1,087.0 1,880.7 3,029.5 –1,148.9 569.5 507.6 61.9 16,050.9 11,281.12013 1 r ................................................ 2,774.0 3,454.3 –680.3 2,100.7 2,820.4 –719.7 673.3 633.8 39.5 16,716.8 11,981.92014 (estimates) ................................. 3,023.0 3,773.4 –750.4 2,283.8 3,068.3 –784.5 739.2 705.1 34.1 18,083.0 13,086.5
FEDERAL FINANCE
In fiscal year 2013, the deficit was $680.3 billion, compared with a deficit of $1,087.0 billion a year earlier.
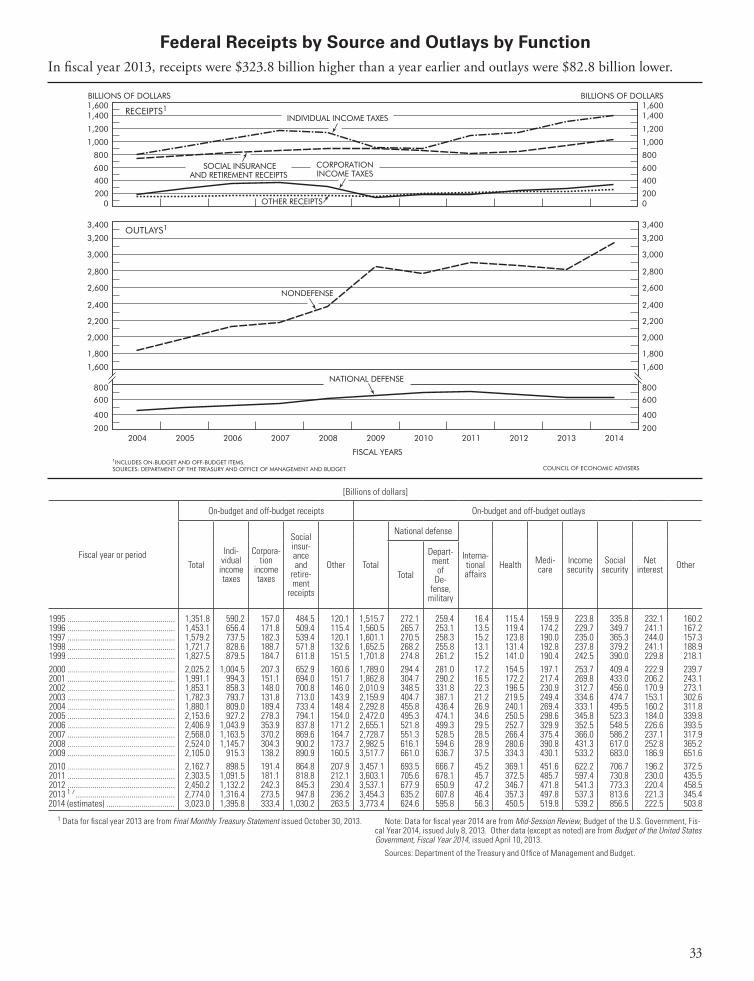
33
In fiscal year 2013, receipts were $323.8 billion higher than a year earlier and outlays were $82.8 billion lower.
Federal Receipts by Source and Outlays by Function
1 Data for fiscal year 2013 are from Final Monthly Treasury Statement issued October 30, 2013. Note: Data for fiscal year 2014 are from Mid-Session Review, Budget of the U.S. Government, Fis-cal Year 2014, issued July 8, 2013. Other data (except as noted) are from Budget of the United States Government, Fiscal Year 2014, issued April 10, 2013.
Sources: Department of the Treasury and Office of Management and Budget.
[Billions of dollars]
Fiscal year or period
On-budget and off-budget receipts On-budget and off-budget outlays
TotalIndi-
vidual income taxes
Corpora-tion
income taxes
Social insur-ance and
retire-ment
receipts
Other Total
National defense
Interna-tional affairs
Health Medi-care
Income security
Social security
Net interest Other
Total
Depart-ment
of De-
fense, military
1995 .................................................... 1,351.8 590.2 157.0 484.5 120.1 1,515.7 272.1 259.4 16.4 115.4 159.9 223.8 335.8 232.1 160.21996 .................................................... 1,453.1 656.4 171.8 509.4 115.4 1,560.5 265.7 253.1 13.5 119.4 174.2 229.7 349.7 241.1 167.21997 .................................................... 1,579.2 737.5 182.3 539.4 120.1 1,601.1 270.5 258.3 15.2 123.8 190.0 235.0 365.3 244.0 157.31998 .................................................... 1,721.7 828.6 188.7 571.8 132.6 1,652.5 268.2 255.8 13.1 131.4 192.8 237.8 379.2 241.1 188.91999 .................................................... 1,827.5 879.5 184.7 611.8 151.5 1,701.8 274.8 261.2 15.2 141.0 190.4 242.5 390.0 229.8 218.12000 .................................................... 2,025.2 1,004.5 207.3 652.9 160.6 1,789.0 294.4 281.0 17.2 154.5 197.1 253.7 409.4 222.9 239.72001 .................................................... 1,991.1 994.3 151.1 694.0 151.7 1,862.8 304.7 290.2 16.5 172.2 217.4 269.8 433.0 206.2 243.12002 .................................................... 1,853.1 858.3 148.0 700.8 146.0 2,010.9 348.5 331.8 22.3 196.5 230.9 312.7 456.0 170.9 273.12003 .................................................... 1,782.3 793.7 131.8 713.0 143.9 2,159.9 404.7 387.1 21.2 219.5 249.4 334.6 474.7 153.1 302.62004 .................................................... 1,880.1 809.0 189.4 733.4 148.4 2,292.8 455.8 436.4 26.9 240.1 269.4 333.1 495.5 160.2 311.82005 .................................................... 2,153.6 927.2 278.3 794.1 154.0 2,472.0 495.3 474.1 34.6 250.5 298.6 345.8 523.3 184.0 339.82006 .................................................... 2,406.9 1,043.9 353.9 837.8 171.2 2,655.1 521.8 499.3 29.5 252.7 329.9 352.5 548.5 226.6 393.52007 .................................................... 2,568.0 1,163.5 370.2 869.6 164.7 2,728.7 551.3 528.5 28.5 266.4 375.4 366.0 586.2 237.1 317.92008 .................................................... 2,524.0 1,145.7 304.3 900.2 173.7 2,982.5 616.1 594.6 28.9 280.6 390.8 431.3 617.0 252.8 365.22009 .................................................... 2,105.0 915.3 138.2 890.9 160.5 3,517.7 661.0 636.7 37.5 334.3 430.1 533.2 683.0 186.9 651.62010 .................................................... 2,162.7 898.5 191.4 864.8 207.9 3,457.1 693.5 666.7 45.2 369.1 451.6 622.2 706.7 196.2 372.52011 .................................................... 2,303.5 1,091.5 181.1 818.8 212.1 3,603.1 705.6 678.1 45.7 372.5 485.7 597.4 730.8 230.0 435.52012 .................................................... 2,450.2 1,132.2 242.3 845.3 230.4 3,537.1 677.9 650.9 47.2 346.7 471.8 541.3 773.3 220.4 458.52013 1 r ................................................ 2,774.0 1,316.4 273.5 947.8 236.2 3,454.3 635.2 607.8 46.4 357.3 497.8 537.3 813.6 221.3 345.42014 (estimates) ................................. 3,023.0 1,395.8 333.4 1,030.2 263.5 3,773.4 624.6 595.8 56.3 450.5 519.8 539.2 856.5 222.5 503.8
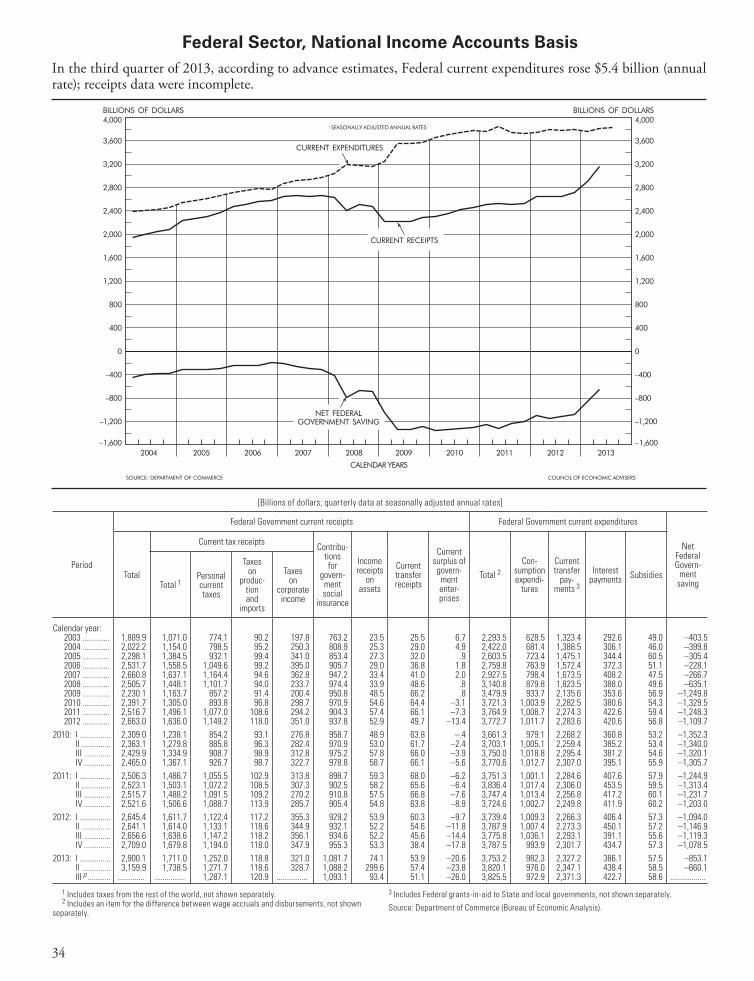
34
Federal Sector, National Income Accounts Basis
[Billions of dollars; quarterly data at seasonally adjusted annual rates]
Period
Federal Government current receipts Federal Government current expenditures
Net Federal Govern-
ment saving
Total
Current tax receipts Contribu-tions for
govern-ment social
insurance
Income receipts
on assets
Current transfer receipts
Current surplus of govern-ment enter-prises
Total 2Con-
sumption expendi-
tures
Current transfer
pay-ments 3
Interest payments Subsidies
Total 1Personal current taxes
Taxes on
produc-tion and
imports
Taxes on
corporate income
Calendar year:2003 ............. 1,889.9 1,071.0 774.1 90.2 197.8 763.2 23.5 25.5 6.7 2,293.5 628.5 1,323.4 292.6 49.0 –403.52004 ............. 2,022.2 1,154.0 798.5 95.2 250.3 808.9 25.3 29.0 4.9 2,422.0 681.4 1,388.5 306.1 46.0 –399.82005 ............. 2,298.1 1,384.5 932.1 99.4 341.0 853.4 27.3 32.0 .9 2,603.5 723.4 1,475.1 344.4 60.5 –305.42006 ............. 2,531.7 1,558.5 1,049.6 99.2 395.0 905.7 29.0 36.8 1.8 2,759.8 763.9 1,572.4 372.3 51.1 –228.12007 ............. 2,660.8 1,637.1 1,164.4 94.6 362.8 947.2 33.4 41.0 2.0 2,927.5 798.4 1,673.5 408.2 47.5 –266.72008 ............. 2,505.7 1,448.1 1,101.7 94.0 233.7 974.4 33.9 48.6 .8 3,140.8 879.8 1,823.5 388.0 49.6 –635.12009 ............. 2,230.1 1,163.7 857.2 91.4 200.4 950.8 48.5 66.2 .8 3,479.9 933.7 2,135.6 353.6 56.9 –1,249.82010 ............. 2,391.7 1,305.0 893.8 96.8 298.7 970.9 54.6 64.4 –3.1 3,721.3 1,003.9 2,282.5 380.6 54.3 –1,329.52011 ............. 2,516.7 1,496.1 1,077.0 108.6 294.2 904.3 57.4 66.1 –7.3 3,764.9 1,008.7 2,274.3 422.6 59.4 –1,248.32012 ............. 2,663.0 1,636.0 1,149.2 118.0 351.0 937.8 52.9 49.7 –13.4 3,772.7 1,011.7 2,283.6 420.6 56.8 –1,109.7
2010: I ............... 2,309.0 1,238.1 854.2 93.1 276.8 958.7 48.9 63.8 –.4 3,661.3 979.1 2,268.2 360.8 53.2 –1,352.3 II .............. 2,363.1 1,279.8 885.8 96.3 282.4 970.9 53.0 61.7 –2.4 3,703.1 1,005.1 2,259.4 385.2 53.4 –1,340.0 III ............. 2,429.9 1,334.9 908.7 98.9 312.8 975.2 57.8 66.0 –3.9 3,750.0 1,018.8 2,295.4 381.2 54.6 –1,320.1 IV ............. 2,465.0 1,367.1 926.7 98.7 322.7 978.8 58.7 66.1 –5.6 3,770.6 1,012.7 2,307.0 395.1 55.9 –1,305.72011: I ............... 2,506.3 1,486.7 1,055.5 102.9 313.8 898.7 59.3 68.0 –6.2 3,751.3 1,001.1 2,284.6 407.6 57.9 –1,244.9 II .............. 2,523.1 1,503.1 1,072.2 108.5 307.3 902.5 58.2 65.6 –6.4 3,836.4 1,017.4 2,306.0 453.5 59.5 –1,313.4 III ............. 2,515.7 1,488.2 1,091.5 109.2 270.2 910.8 57.5 66.8 –7.6 3,747.4 1,013.4 2,256.8 417.2 60.1 –1,231.7 IV ............. 2,521.6 1,506.6 1,088.7 113.9 285.7 905.4 54.8 63.8 –8.9 3,724.6 1,002.7 2,249.8 411.9 60.2 –1,203.02012: I ............... 2,645.4 1,611.7 1,122.4 117.2 355.3 929.2 53.9 60.3 –9.7 3,739.4 1,009.3 2,266.3 406.4 57.3 –1,094.0 II .............. 2,641.1 1,614.0 1,133.1 118.6 344.9 932.1 52.2 54.6 –11.8 3,787.9 1,007.4 2,273.3 450.1 57.2 –1,146.9 III ............. 2,656.6 1,638.6 1,147.2 118.2 356.1 934.6 52.2 45.6 –14.4 3,775.8 1,036.1 2,293.1 391.1 55.6 –1,119.3 IV ............. 2,709.0 1,679.8 1,194.0 118.0 347.9 955.3 53.3 38.4 –17.8 3,787.5 993.9 2,301.7 434.7 57.3 –1,078.52013: I ............... 2,900.1 1,711.0 1,252.0 118.8 321.0 1,081.7 74.1 53.9 –20.6 3,753.2 982.3 2,327.2 386.1 57.5 –853.1 II .............. 3,159.9 1,738.5 1,271.7 118.6 328.7 1,088.2 299.6 57.4 –23.8 3,820.1 976.0 2,347.1 438.4 58.5 –660.1 III p ........... ............. ............... 1,287.1 120.9 ............... 1,093.1 93.4 51.1 –26.0 3,825.5 972.9 2,371.3 422.7 58.6 .................
1 Includes taxes from the rest of the world, not shown separately.2 Includes an item for the difference between wage accruals and disbursements, not shown
separately.
3 Includes Federal grants-in-aid to State and local governments, not shown separately.
Source: Department of Commerce (Bureau of Economic Analysis).
In the third quarter of 2013, according to advance estimates, Federal current expenditures rose $5.4 billion (annual rate); receipts data were incomplete.
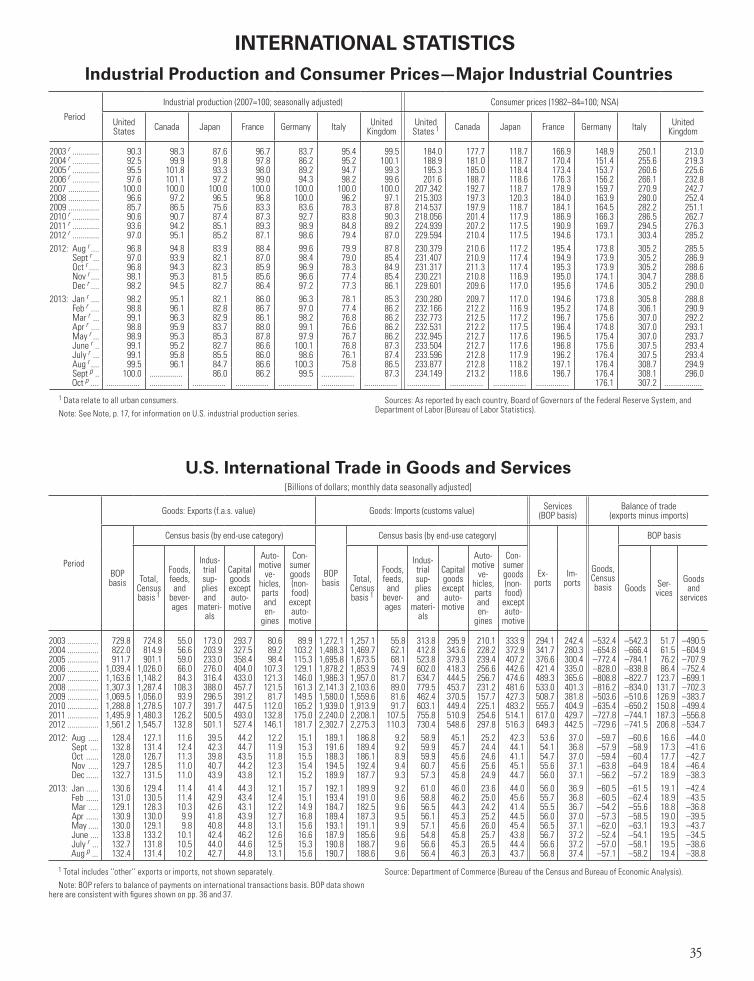
35
INTERNATIONAL STATISTICS
Industrial Production and Consumer Prices—Major Industrial Countries
Period
Industrial production (2007=100; seasonally adjusted) Consumer prices (1982–84=100; NSA)
United States Canada Japan France Germany Italy United
KingdomUnited
States 1 Canada Japan France Germany Italy United Kingdom
2003 r ............. 90.3 98.3 87.6 96.7 83.7 95.4 99.5 184.0 177.7 118.7 166.9 148.9 250.1 213.02004 r ............. 92.5 99.9 91.8 97.8 86.2 95.2 100.1 188.9 181.0 118.7 170.4 151.4 255.6 219.32005 r ............. 95.5 101.8 93.3 98.0 89.2 94.7 99.3 195.3 185.0 118.4 173.4 153.7 260.6 225.62006 r ............. 97.6 101.1 97.2 99.0 94.3 98.2 99.6 201.6 188.7 118.6 176.3 156.2 266.1 232.82007 ............... 100.0 100.0 100.0 100.0 100.0 100.0 100.0 207.342 192.7 118.7 178.9 159.7 270.9 242.72008 ............... 96.6 97.2 96.5 96.8 100.0 96.2 97.1 215.303 197.3 120.3 184.0 163.9 280.0 252.42009 ............... 85.7 86.5 75.6 83.3 83.6 78.3 87.8 214.537 197.9 118.7 184.1 164.5 282.2 251.12010 r ............. 90.6 90.7 87.4 87.3 92.7 83.8 90.3 218.056 201.4 117.9 186.9 166.3 286.5 262.72011 r ............. 93.6 94.2 85.1 89.3 98.9 84.8 89.2 224.939 207.2 117.5 190.9 169.7 294.5 276.32012 r ............. 97.0 95.1 85.2 87.1 98.6 79.4 87.0 229.594 210.4 117.5 194.6 173.1 303.4 285.22012: Aug r .... 96.8 94.8 83.9 88.4 99.6 79.9 87.8 230.379 210.6 117.2 195.4 173.8 305.2 285.5 Sept r ... 97.0 93.9 82.1 87.0 98.4 79.0 85.4 231.407 210.9 117.4 194.9 173.9 305.2 286.9 Oct r ..... 96.8 94.3 82.3 85.9 96.9 78.3 84.9 231.317 211.3 117.4 195.3 173.9 305.2 288.6 Nov r .... 98.1 95.3 81.5 85.6 96.6 77.4 85.4 230.221 210.8 116.9 195.0 174.1 304.7 288.6 Dec r .... 98.2 94.5 82.7 86.4 97.2 77.3 86.1 229.601 209.6 117.0 195.6 174.6 305.2 290.02013: Jan r .... 98.2 95.1 82.1 86.0 96.3 78.1 85.3 230.280 209.7 117.0 194.6 173.8 305.8 288.8 Feb r .... 98.8 96.1 82.8 86.7 97.0 77.4 86.2 232.166 212.2 116.9 195.2 174.8 306.1 290.9 Mar r ... 99.1 96.3 82.9 86.1 98.2 76.8 86.2 232.773 212.5 117.2 196.7 175.6 307.0 292.2 Apr r .... 98.8 95.9 83.7 88.0 99.1 76.6 86.2 232.531 212.2 117.5 196.4 174.8 307.0 293.1 May r ... 98.9 95.3 85.3 87.8 97.9 76.7 86.2 232.945 212.7 117.6 196.5 175.4 307.0 293.7 June r .. 99.1 95.2 82.7 86.6 100.1 76.8 87.3 233.504 212.7 117.6 196.8 175.6 307.5 293.4 July r ... 99.1 95.8 85.5 86.0 98.6 76.1 87.4 233.596 212.8 117.9 196.2 176.4 307.5 293.4 Aug r .... 99.5 96.1 84.7 86.6 100.3 75.8 86.5 233.877 212.8 118.2 197.1 176.4 308.7 294.9 Sept p .. 100.0 ................ 86.0 86.2 99.5 ................ 87.3 234.149 213.2 118.6 196.7 176.4 308.1 296.0 Oct p .... ................ ................ ................ ................ ................ ................ ................ ................ ................ ................ ................ 176.1 307.2 ..................
U.S. International Trade in Goods and Services[Billions of dollars; monthly data seasonally adjusted]
Period
Goods: Exports (f.a.s. value) Goods: Imports (customs value) Services (BOP basis)
Balance of trade (exports minus imports)
BOP basis
Census basis (by end-use category)
BOP basis
Census basis (by end-use category)
Ex-ports
Im-ports
Goods, Census basis
BOP basis
Total, Census basis 1
Foods, feeds,
and bever-ages
Indus-trial sup-plies and
materi-als
Capital goods except auto-
motive
Auto-motive
ve-hicles, parts and en-
gines
Con-sumer goods (non-food)
except auto-
motive
Total, Census basis 1
Foods, feeds,
and bever-ages
Indus-trial sup-plies and
materi-als
Capital goods except auto-
motive
Auto-motive
ve-hicles, parts and en-
gines
Con-sumer goods (non-food)
except auto-
motive
Goods Ser-vices
Goods and
services
2003 ............... 729.8 724.8 55.0 173.0 293.7 80.6 89.9 1,272.1 1,257.1 55.8 313.8 295.9 210.1 333.9 294.1 242.4 –532.4 –542.3 51.7 –490.52004 ............... 822.0 814.9 56.6 203.9 327.5 89.2 103.2 1,488.3 1,469.7 62.1 412.8 343.6 228.2 372.9 341.7 280.3 –654.8 –666.4 61.5 –604.92005 ............... 911.7 901.1 59.0 233.0 358.4 98.4 115.3 1,695.8 1,673.5 68.1 523.8 379.3 239.4 407.2 376.6 300.4 –772.4 –784.1 76.2 –707.92006 ............... 1,039.4 1,026.0 66.0 276.0 404.0 107.3 129.1 1,878.2 1,853.9 74.9 602.0 418.3 256.6 442.6 421.4 335.0 –828.0 –838.8 86.4 –752.42007 ............... 1,163.6 1,148.2 84.3 316.4 433.0 121.3 146.0 1,986.3 1,957.0 81.7 634.7 444.5 256.7 474.6 489.3 365.6 –808.8 –822.7 123.7 –699.12008 ............... 1,307.3 1,287.4 108.3 388.0 457.7 121.5 161.3 2,141.3 2,103.6 89.0 779.5 453.7 231.2 481.6 533.0 401.3 –816.2 –834.0 131.7 –702.32009 ............... 1,069.5 1,056.0 93.9 296.5 391.2 81.7 149.5 1,580.0 1,559.6 81.6 462.4 370.5 157.7 427.3 508.7 381.8 –503.6 –510.6 126.9 –383.72010 ............... 1,288.8 1,278.5 107.7 391.7 447.5 112.0 165.2 1,939.0 1,913.9 91.7 603.1 449.4 225.1 483.2 555.7 404.9 –635.4 –650.2 150.8 –499.42011 ............... 1,495.9 1,480.3 126.2 500.5 493.0 132.8 175.0 2,240.0 2,208.1 107.5 755.8 510.9 254.6 514.1 617.0 429.7 –727.8 –744.1 187.3 –556.82012 ............... 1,561.2 1,545.7 132.8 501.1 527.4 146.1 181.7 2,302.7 2,275.3 110.3 730.4 548.6 297.8 516.3 649.3 442.5 –729.6 –741.5 206.8 –534.72012: Aug ..... 128.4 127.1 11.6 39.5 44.2 12.2 15.1 189.1 186.8 9.2 58.9 45.1 25.2 42.3 53.6 37.0 –59.7 –60.6 16.6 –44.0 Sept .... 132.8 131.4 12.4 42.3 44.7 11.9 15.3 191.6 189.4 9.2 59.9 45.7 24.4 44.1 54.1 36.8 –57.9 –58.9 17.3 –41.6 Oct ...... 128.0 126.7 11.3 39.8 43.5 11.8 15.5 188.3 186.1 8.9 59.9 45.6 24.6 41.1 54.7 37.0 –59.4 –60.4 17.7 –42.7 Nov ..... 129.7 128.5 11.0 40.7 44.2 12.3 15.4 194.5 192.4 9.4 60.7 45.6 25.6 45.1 55.6 37.1 –63.8 –64.9 18.4 –46.4 Dec ...... 132.7 131.5 11.0 43.9 43.8 12.1 15.2 189.9 187.7 9.3 57.3 45.8 24.9 44.7 56.0 37.1 –56.2 –57.2 18.9 –38.32013: Jan ...... 130.6 129.4 11.4 41.4 44.3 12.1 15.7 192.1 189.9 9.2 61.0 46.0 23.6 44.0 56.0 36.9 –60.5 –61.5 19.1 –42.4 Feb ...... 131.0 130.5 11.4 42.9 43.4 12.4 15.1 193.4 191.0 9.6 58.8 46.2 25.0 45.6 55.7 36.8 –60.5 –62.4 18.9 –43.5 Mar ..... 129.1 128.3 10.3 42.6 43.1 12.2 14.9 184.7 182.5 9.6 56.5 44.3 24.2 41.4 55.5 36.7 –54.2 –55.6 18.8 –36.8 Apr ...... 130.9 130.0 9.9 41.8 43.9 12.7 16.8 189.4 187.3 9.5 56.1 45.3 25.2 44.5 56.0 37.0 –57.3 –58.5 19.0 –39.5 May ..... 130.0 129.1 9.8 40.8 44.8 13.1 15.6 193.1 191.1 9.9 57.1 45.6 26.0 45.4 56.5 37.1 –62.0 –63.1 19.3 –43.7 June .... 133.8 133.2 10.1 42.4 46.2 12.6 16.6 187.9 185.6 9.6 54.8 45.8 25.7 43.8 56.7 37.2 –52.4 –54.1 19.5 –34.5 July r ... 132.7 131.8 10.5 44.0 44.6 12.5 15.3 190.8 188.7 9.6 56.6 45.3 26.5 44.4 56.6 37.2 –57.0 –58.1 19.5 –38.6 Aug p ... 132.4 131.4 10.2 42.7 44.8 13.1 15.6 190.7 188.6 9.6 56.4 46.3 26.3 43.7 56.8 37.4 –57.1 –58.2 19.4 –38.8
1 Data relate to all urban consumers.
Note: See Note, p. 17, for information on U.S. industrial production series.
1 Total includes ‘‘other’’ exports or imports, not shown separately.
Note: BOP refers to balance of payments on international transactions basis. BOP data shown here are consistent with figures shown on pp. 36 and 37.
Source: Department of Commerce (Bureau of the Census and Bureau of Economic Analysis).
Sources: As reported by each country, Board of Governors of the Federal Reserve System, and Department of Labor (Bureau of Labor Statistics).
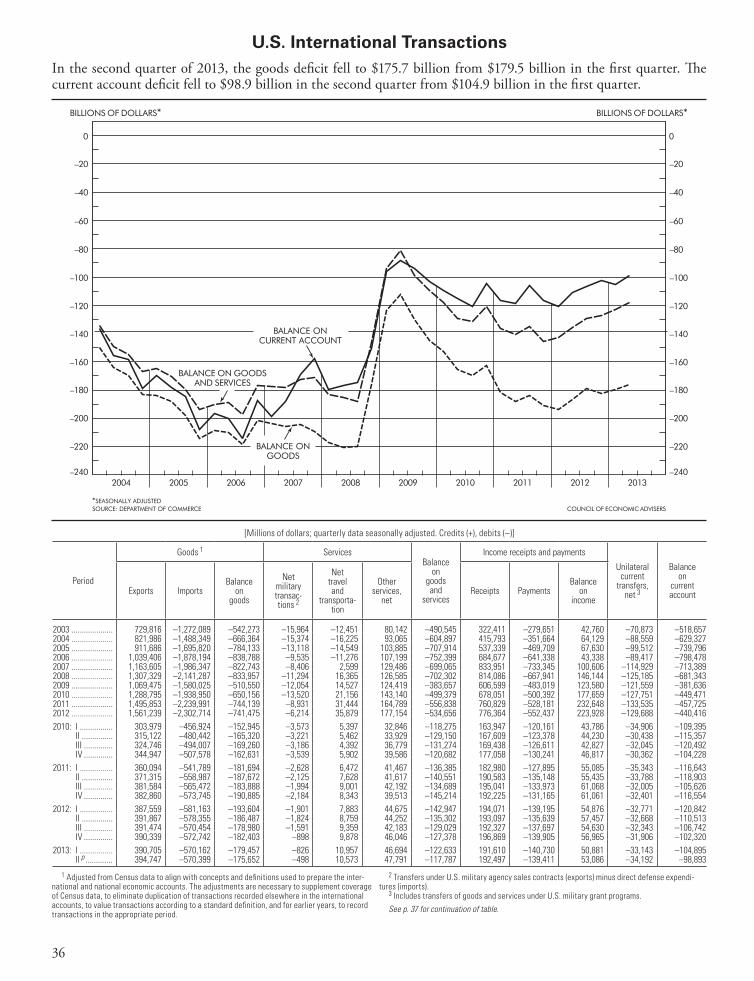
36
U.S. International Transactions
1 Adjusted from Census data to align with concepts and definitions used to prepare the inter-national and national economic accounts. The adjustments are necessary to supplement coverage of Census data, to eliminate duplication of transactions recorded elsewhere in the international accounts, to value transactions according to a standard definition, and for earlier years, to record transactions in the appropriate period.
[Millions of dollars; quarterly data seasonally adjusted. Credits (+), debits (–)]
Period
Goods 1 ServicesBalance
on goods and
services
Income receipts and payments
Unilateral current
transfers, net 3
Balance on
current accountExports Imports
Balance on
goods
Net military transac-tions 2
Net travel and
transporta-tion
Other services,
netReceipts Payments
Balance on
income
2003 .................... 729,816 –1,272,089 –542,273 –15,964 –12,451 80,142 –490,545 322,411 –279,651 42,760 –70,873 –518,6572004 .................... 821,986 –1,488,349 –666,364 –15,374 –16,225 93,065 –604,897 415,793 –351,664 64,129 –88,559 –629,3272005 .................... 911,686 –1,695,820 –784,133 –13,118 –14,549 103,885 –707,914 537,339 –469,709 67,630 –99,512 –739,7962006 .................... 1,039,406 –1,878,194 –838,788 –9,535 –11,276 107,199 –752,399 684,677 –641,338 43,338 –89,417 –798,4782007 .................... 1,163,605 –1,986,347 –822,743 –8,406 2,599 129,486 –699,065 833,951 –733,345 100,606 –114,929 –713,3892008 .................... 1,307,329 –2,141,287 –833,957 –11,294 16,365 126,585 –702,302 814,086 –667,941 146,144 –125,185 –681,3432009 .................... 1,069,475 –1,580,025 –510,550 –12,054 14,527 124,419 –383,657 606,599 –483,019 123,580 –121,559 –381,6362010 .................... 1,288,795 –1,938,950 –650,156 –13,520 21,156 143,140 –499,379 678,051 –500,392 177,659 –127,751 –449,4712011 .................... 1,495,853 –2,239,991 –744,139 –8,931 31,444 164,789 –556,838 760,829 –528,181 232,648 –133,535 –457,7252012 .................... 1,561,239 –2,302,714 –741,475 –6,214 35,879 177,154 –534,656 776,364 –552,437 223,928 –129,688 –440,4162010: I ................ 303,979 –456,924 –152,945 –3,573 5,397 32,846 –118,275 163,947 –120,161 43,786 –34,906 –109,395 II ............... 315,122 –480,442 –165,320 –3,221 5,462 33,929 –129,150 167,609 –123,378 44,230 –30,438 –115,357 III .............. 324,746 –494,007 –169,260 –3,186 4,392 36,779 –131,274 169,438 –126,611 42,827 –32,045 –120,492 IV .............. 344,947 –507,578 –162,631 –3,539 5,902 39,586 –120,682 177,058 –130,241 46,817 –30,362 –104,2282011: I ................ 360,094 –541,789 –181,694 –2,628 6,472 41,467 –136,385 182,980 –127,895 55,085 –35,343 –116,643 II ............... 371,315 –558,987 –187,672 –2,125 7,628 41,617 –140,551 190,583 –135,148 55,435 –33,788 –118,903 III .............. 381,584 –565,472 –183,888 –1,994 9,001 42,192 –134,689 195,041 –133,973 61,068 –32,005 –105,626 IV .............. 382,860 –573,745 –190,885 –2,184 8,343 39,513 –145,214 192,225 –131,165 61,061 –32,401 –116,5542012: I ................ 387,559 –581,163 –193,604 –1,901 7,883 44,675 –142,947 194,071 –139,195 54,876 –32,771 –120,842 II ............... 391,867 –578,355 –186,487 –1,824 8,759 44,252 –135,302 193,097 –135,639 57,457 –32,668 –110,513 III .............. 391,474 –570,454 –178,980 –1,591 9,359 42,183 –129,029 192,327 –137,697 54,630 –32,343 –106,742 IV .............. 390,339 –572,742 –182,403 –898 9,878 46,046 –127,378 196,869 –139,905 56,965 –31,906 –102,3202013: I ................ 390,705 –570,162 –179,457 –826 10,957 46,694 –122,633 191,610 –140,730 50,881 –33,143 –104,895 II p ............. 394,747 –570,399 –175,652 –498 10,573 47,791 –117,787 192,497 –139,411 53,086 –34,192 –98,893
2 Transfers under U.S. military agency sales contracts (exports) minus direct defense expendi-tures (imports).
3 Includes transfers of goods and services under U.S. military grant programs.
See p. 37 for continuation of table.
In the second quarter of 2013, the goods deficit fell to $175.7 billion from $179.5 billion in the first quarter. The current account deficit fell to $98.9 billion in the second quarter from $104.9 billion in the first quarter.
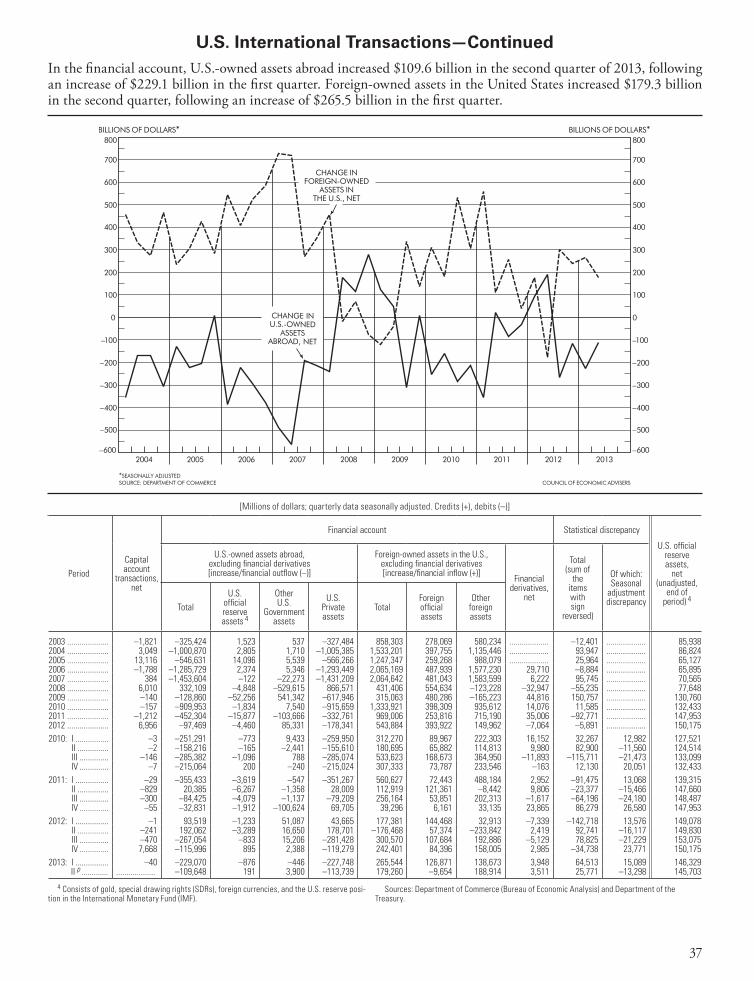
37
U.S. International Transactions—Continued
4 Consists of gold, special drawing rights (SDRs), foreign currencies, and the U.S. reserve posi-tion in the International Monetary Fund (IMF).
Sources: Department of Commerce (Bureau of Economic Analysis) and Department of the Treasury.
[Millions of dollars; quarterly data seasonally adjusted. Credits (+), debits (–)]
PeriodCapital account
transactions, net
Financial account Statistical discrepancy
U.S. official reserve assets,
net (unadjusted,
end of period) 4
U.S.-owned assets abroad, excluding financial derivatives [increase/financial outflow (–)]
Foreign-owned assets in the U.S., excluding financial derivatives [increase/financial inflow (+)]
Financial derivatives,
net
Total (sum of
the items with sign
reversed)
Of which: Seasonal
adjustment discrepancyTotal
U.S. official reserve assets 4
Other U.S.
Government assets
U.S. Private assets
TotalForeign official assets
Other foreign assets
2003 .................... –1,821 –325,424 1,523 537 –327,484 858,303 278,069 580,234 ................... –12,401 ................... 85,9382004 .................... 3,049 –1,000,870 2,805 1,710 –1,005,385 1,533,201 397,755 1,135,446 ................... 93,947 ................... 86,8242005 .................... 13,116 –546,631 14,096 5,539 –566,266 1,247,347 259,268 988,079 ................... 25,964 ................... 65,1272006 .................... –1,788 –1,285,729 2,374 5,346 –1,293,449 2,065,169 487,939 1,577,230 29,710 –8,884 ................... 65,8952007 .................... 384 –1,453,604 –122 –22,273 –1,431,209 2,064,642 481,043 1,583,599 6,222 95,745 ................... 70,5652008 .................... 6,010 332,109 –4,848 –529,615 866,571 431,406 554,634 –123,228 –32,947 –55,235 ................... 77,6482009 .................... –140 –128,860 –52,256 541,342 –617,946 315,063 480,286 –165,223 44,816 150,757 ................... 130,7602010 .................... –157 –909,953 –1,834 7,540 –915,659 1,333,921 398,309 935,612 14,076 11,585 ................... 132,4332011 .................... –1,212 –452,304 –15,877 –103,666 –332,761 969,006 253,816 715,190 35,006 –92,771 ................... 147,9532012 .................... 6,956 –97,469 –4,460 85,331 –178,341 543,884 393,922 149,962 –7,064 –5,891 ................... 150,1752010: I ................ –3 –251,291 –773 9,433 –259,950 312,270 89,967 222,303 16,152 32,267 12,982 127,521 II ............... –2 –158,216 –165 –2,441 –155,610 180,695 65,882 114,813 9,980 82,900 –11,560 124,514 III .............. –146 –285,382 –1,096 788 –285,074 533,623 168,673 364,950 –11,893 –115,711 –21,473 133,099 IV .............. –7 –215,064 200 –240 –215,024 307,333 73,787 233,546 –163 12,130 20,051 132,4332011: I ................ –29 –355,433 –3,619 –547 –351,267 560,627 72,443 488,184 2,952 –91,475 13,068 139,315 II ............... –829 20,385 –6,267 –1,358 28,009 112,919 121,361 –8,442 9,806 –23,377 –15,466 147,660 III .............. –300 –84,425 –4,079 –1,137 –79,209 256,164 53,851 202,313 –1,617 –64,196 –24,180 148,487 IV .............. –55 –32,831 –1,912 –100,624 69,705 39,296 6,161 33,135 23,865 86,279 26,580 147,9532012: I ................ –1 93,519 –1,233 51,087 43,665 177,381 144,468 32,913 –7,339 –142,718 13,576 149,078 II ............... –241 192,062 –3,289 16,650 178,701 –176,468 57,374 –233,842 2,419 92,741 –16,117 149,830 III .............. –470 –267,054 –833 15,206 –281,428 300,570 107,684 192,886 –5,129 78,825 –21,229 153,075 IV .............. 7,668 –115,996 895 2,388 –119,279 242,401 84,396 158,005 2,985 –34,738 23,771 150,1752013: I ................ –40 –229,070 –876 –446 –227,748 265,544 126,871 138,673 3,948 64,513 15,089 146,329 II p ............. ................... –109,648 191 3,900 –113,739 179,260 –9,654 188,914 3,511 25,771 –13,298 145,703
In the financial account, U.S.-owned assets abroad increased $109.6 billion in the second quarter of 2013, following an increase of $229.1 billion in the first quarter. Foreign-owned assets in the United States increased $179.3 billion in the second quarter, following an increase of $265.5 billion in the first quarter.
38
CONTENTSTOTAL OUTPUT, INCOME, AND SPENDING Page
Gross Domestic Product ....................................................................................................................................................... 1Real Gross Domestic Product ............................................................................................................................................... 2Chained Price Indexes For Gross Domestic Product ........................................................................................................... 2Gross Domestic Product and Related Price Measures: Indexes and Percent Changes .......................................................... 3Nonfinancial Corporate Business—Gross Value Added and Price, Costs, and Profits ......................................................... 3National Income ................................................................................................................................................................... 4Real Personal Consumption Expenditures ........................................................................................................................... 4Sources of Personal Income .................................................................................................................................................. 5Disposition of Personal Income ............................................................................................................................................ 6Real Farm Income ................................................................................................................................................................ 7Corporate Profits .................................................................................................................................................................. 8Real Gross Private Domestic Investment .............................................................................................................................. 9Real Private Fixed Investment by Type ................................................................................................................................. 10Business Investment .............................................................................................................................................................. 10
EMPLOYMENT, UNEMPLOYMENT, AND WAGESStatus of the Labor Force ...................................................................................................................................................... 11Selected Unemployment Rates .............................................................................................................................................. 12Selected Measures of Unemployment and Unemployment Insurance Programs .................................................................. 13Nonagricultural Employment ............................................................................................................................................... 14Average Weekly Hours, Hourly Earnings, and Weekly Earnings—Private Nonagricultural Industries ............................... 15Employment Cost Index—Private Industry ......................................................................................................................... 15Productivity and Related Data, Business and Nonfarm Business Sectors ............................................................................. 16
PRODUCTION AND BUSINESS ACTIVITYIndustrial Production and Capacity Utilization ................................................................................................................... 17Industrial Production—Major Market Groups and Selected Manufactures ......................................................................... 18New Construction ................................................................................................................................................................ 19New Private Housing and Vacancy Rates ............................................................................................................................. 19Business Sales and Inventories—Manufacturing and Trade ................................................................................................. 20Manufacturers’ Shipments, Inventories, and Orders ............................................................................................................. 21
PRICESProducer Prices ..................................................................................................................................................................... 22Consumer Prices—All Urban Consumers ............................................................................................................................ 23Changes in Producer Prices for Finished Goods ................................................................................................................... 24Changes in Consumer Prices—All Urban Consumers ......................................................................................................... 24Prices Received and Paid by Farmers .................................................................................................................................... 25
MONEY, CREDIT, AND SECURITY MARKETSMoney Stock and Debt Measures ......................................................................................................................................... 26Components of Money Stock ............................................................................................................................................... 27Aggregate Reserves and Monetary Base ................................................................................................................................ 27Bank Credit at All Commercial Banks ................................................................................................................................. 28Sources and Uses of Funds, Nonfarm Nonfinancial Corporate Business ............................................................................. 29Consumer Credit .................................................................................................................................................................. 29Interest Rates and Bond Yields ............................................................................................................................................. 30Common Stock Prices and Yields ......................................................................................................................................... 31
FEDERAL FINANCEFederal Receipts, Outlays, and Debt .................................................................................................................................... 32Federal Receipts by Source and Outlays by Function ........................................................................................................... 33Federal Sector, National Income Accounts Basis .................................................................................................................. 34
INTERNATIONAL STATISTICSIndustrial Production and Consumer Prices—Major Industrial Countries .......................................................................... 35U.S. International Trade in Goods and Services ................................................................................................................... 35U.S. International Transactions ............................................................................................................................................ 36
General NotesDetail in these tables may not add to totals because of rounding. Unless otherwise noted, all dollar figures are in current dollars. Symbols used: p Preliminary. r Revised. c Corrected. ... Not available (also, not applicable). NSA Not seasonally adjusted.
U.S. GOVERNMENT PRINTING OFFICE : 2013 85-435