Embed Size (px)
Citation preview

in this issue
economic indices
3Q '04 employment
population revisions
june 2005 v4, n2
Leading Economic Index Rises as Initial ClaimsDrop Sharply; Current and Lagging Indicies areMixed; Manufacturing Employment Rebounds
economic indicatorsdepartment of financial services
Gwinnett County Department of Financial Services, Forecasting and Research Division, 75 Langley Drive, Lawrenceville, GA 30045
The Gwinnett County Index of Leading Economic Indicators rose in May, as four of the five leading indicators improved during the month. However, since our last Economic Indicators newsletter, the index is down 1.0 percent. For the twelve months ending in May 2005, the Leading Index is up just 1.0 percent. The leading index, which is designed to forecast the county’s economic performance 3 to 6 months in advance, rose above the 12-month moving average in May for the first time in three months. If the index is consistently above this average the local economy is likely to enter or continue a period of economic growth. Unfortunately, the index has not been consistently above the average. Combined with the anemic 1.0 percent annual growth, this suggests that
the local economy is still struggling to find consistent footing (Figure 1). As mentioned, four of the five leading indicators improved in May. The largest improvement was in initial unemployment claims which dropped 28 percent from the previous month (seasonally adjusted). On a year-to-date basis, through May, initial claims are running well below 2004 levels (Figure 2). Another boost to the index was the increase in single-family building permits which posted a 15.2 percent increase in May (seasonally adjusted), and were 7.8 percent above May of 2004. For the year, the average monthly number of single-family permits issued is running 0.8 percent above last year (Figure 3). According to the Census Bureau, Gwinnett added
Leading Index Components: May-05
Initial Unemployment Claims Down -28.0%
Gwinnett Stock Index Up 5.2%
Consumer Expectations Up 14.0%
Manufacturing Weekly Hours Down -2.4%
Single Family Building Permits Up 15.2%
Leading Economic Index Up 1.5%
12-Month Change Up 1.0%
Figure 1: Gwinnett County Leading Economic Index(1997 = 100)
90
92
94
96
98
100
102
Jan-9
7Ju
l-97
Jan-9
8Ju
l-98
Jan-9
9Ju
l-99
Jan-0
0Ju
l-00
Jan-0
1Ju
l-01
Jan-0
2Ju
l-02
Jan-0
3Ju
l-03
Jan-0
4Ju
l-04
Jan-0
5
12-month
moving average

2current index
Gwinnett County Department of Financial Services, Forecasting and Research Division, 75 Langley Drive, Lawrenceville, GA 30045
27,000 people in 2004, and the forecast is for at least another 26,000 in 2005. As the population continues to grow at such strong levels and mortgage rates remain low, single-family permits, as well as local construction, should remain strong for some time. Current Economic Indicators The Gwinnett County Index of Current Economic Indicators declined slightly in April as two of the four indicators declined. However, since the last Economic Indicators newsletter, the index is up 0.1 percent, and for the twelve months ending in April 2005, the Current Index is up 2.2 percent. The Current Index, which is designed to track the current state of the Gwinnett County economy, has been above the
12-month moving average for 14 consecutive months. This is significant because if the index is consistently above this average, then it usually means that the economy is likely experiencing a period of economic growth. While the local economy is growing, as the Index of Leading Indicators suggests, this growth is anemic and certainly not the type of growth that the county experienced prior to the recession (Figure 4.) The variables in the Current Economic Index are sending very mixed signals. On a seasonally adjusted basis, sales tax revenue reached an all-time high in April (Figure 5), while at the same time employment posted a level in April that was lower than the same month a year ago. Another positive current economic indicator is the number of room nights that were logged in local hotels. On a seasonally
Figure 3: Single-Family Building Permits(Seasonally Adjusted Annual Rate)
3.8%4.5%
10.7%
-2.7%-3.3%
2.7%
0.8%
-4%
-2%
0%
2%
4%
6%
8%
10%
12%
1999 2000 2001 2002 2003 2004 2005YTD
Figure 2: Initial Unemployment Claims (Monthly Average; Seasonally Adjusted)
859 925 870 926
2,097
2,353 2,413
2,024
1,664
0
500
1,000
1,500
2,000
2,500
3,000
1997 1998 1999 2000 2001 2002 2003 2004 2005YTD
Figure 4: Gwinnett Current Economic Index(1997 = 100)
90
95
100
105
110
115
120
125
130
Jan-97Jul-97
Jan-98Jul-98
Jan-99Jul-99
Jan-00Jul-00
Jan-01Jul-01
Jan-02Jul-02
Jan-03Jul-03
Jan-04Jul-04
Jan-05
12-month
moving average
Figure 5: Monthly Sales Tax Collections (1998 - Current; Seasonally Adjusted)
$7,000,000
$8,000,000
$9,000,000
$10,000,000
$11,000,000
$12,000,000
$13,000,000
1998 1999 2000 2001 2002 2003 2004 2005
12-month
moving average
3lagging index
Gwinnett County Department of Financial Services, Forecasting and Research Division, 75 Langley Drive, Lawrenceville, GA 30045
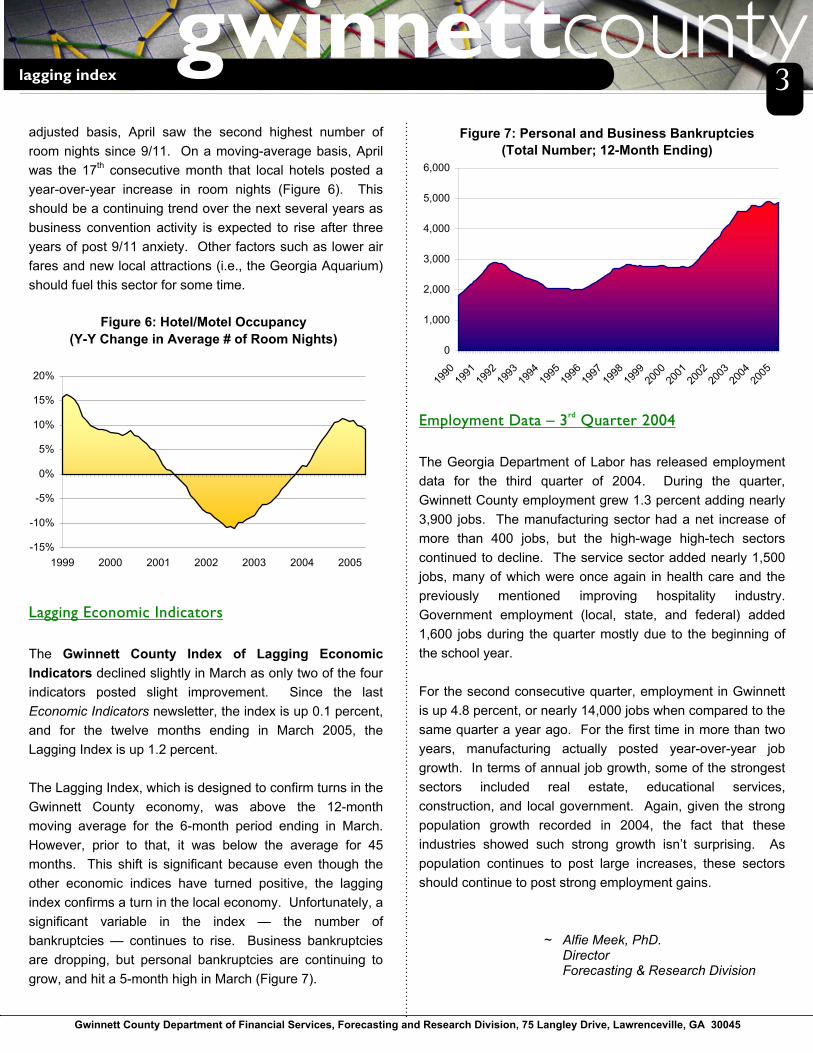
Figure 7: Personal and Business Bankruptcies(Total Number; 12-Month Ending)
0
1,000
2,000
3,000
4,000
5,000
6,000
1990199119921993199419951996199719981999200020012002200320042005
Figure 6: Hotel/Motel Occupancy(Y-Y Change in Average # of Room Nights)
-15%
-10%
-5%
0%
5%
10%
15%
20%
1999 2000 2001 2002 2003 2004 2005
adjusted basis, April saw the second highest number of room nights since 9/11. On a moving-average basis, April was the 17th consecutive month that local hotels posted a year-over-year increase in room nights (Figure 6). This should be a continuing trend over the next several years as business convention activity is expected to rise after three years of post 9/11 anxiety. Other factors such as lower air fares and new local attractions (i.e., the Georgia Aquarium) should fuel this sector for some time. Lagging Economic Indicators The Gwinnett County Index of Lagging Economic Indicators declined slightly in March as only two of the four indicators posted slight improvement. Since the last Economic Indicators newsletter, the index is up 0.1 percent, and for the twelve months ending in March 2005, the Lagging Index is up 1.2 percent. The Lagging Index, which is designed to confirm turns in the Gwinnett County economy, was above the 12-month moving average for the 6-month period ending in March. However, prior to that, it was below the average for 45 months. This shift is significant because even though the other economic indices have turned positive, the lagging index confirms a turn in the local economy. Unfortunately, a significant variable in the index — the number of bankruptcies — continues to rise. Business bankruptcies are dropping, but personal bankruptcies are continuing to grow, and hit a 5-month high in March (Figure 7).
Employment Data – 3rd Quarter 2004 The Georgia Department of Labor has released employment data for the third quarter of 2004. During the quarter, Gwinnett County employment grew 1.3 percent adding nearly 3,900 jobs. The manufacturing sector had a net increase of more than 400 jobs, but the high-wage high-tech sectors continued to decline. The service sector added nearly 1,500 jobs, many of which were once again in health care and the previously mentioned improving hospitality industry. Government employment (local, state, and federal) added 1,600 jobs during the quarter mostly due to the beginning of the school year. For the second consecutive quarter, employment in Gwinnett is up 4.8 percent, or nearly 14,000 jobs when compared to the same quarter a year ago. For the first time in more than two years, manufacturing actually posted year-over-year job growth. In terms of annual job growth, some of the strongest sectors included real estate, educational services, construction, and local government. Again, given the strong population growth recorded in 2004, the fact that these industries showed such strong growth isn’t surprising. As population continues to post large increases, these sectors should continue to post strong employment gains.
~ Alfie Meek, PhD. Director Forecasting & Research Division

4employment data
Gwinnett County Department of Financial Services, Forecasting and Research Division, 75 Langley Drive, Lawrenceville, GA 30045
3rd Quarter 2nd Quarter 3rd Quarter Quarterly Y-Y2003 2004 2004 Growth Growth
Goods Producing 47,092 47,160 47,954 1.7% 1.8% Agriculture, Forestry, & Fishing (11) 262 288 276 -4.2% 5.3% Mining (21) 167 166 168 1.2% 0.6% Construction (23) 21,932 22,338 22,704 1.6% 3.5% Manufacturing (31-33) 24,731 24,368 24,806 1.8% 0.3% Food Manufacturing (311) 1,203 1,388 1,781 28.3% 48.0% Beverage & Tobacco Manufacturing (312) 41 * 28 * -31.7% Textile Mills (313) 25 59 62 5.1% 148.0% Textile Product Mills (314) 341 300 296 -1.3% -13.2% Apparel Manufacturing (315) 223 273 256 -6.2% 14.8% Leather & Allied Product Manufacturing (316) 33 * * * * Wood Product Manufacturing (321) 794 1,131 1,177 4.1% 48.2% Paper Manufacturing (322) 852 736 775 5.3% -9.0% Printing and Related Activities (323) 2,231 2,229 2,235 0.3% 0.2% Petroleum and Coal Products Manufacturing (324) 87 86 89 3.5% 2.3% Chemical Manufacturing (325) 1,185 1,061 1,067 0.6% -10.0% Plastics & Rubber Products Manufacturing (326) 1,295 1,409 1,401 -0.6% 8.2% Nonmetallic Mineral Product Manufacturing (327) 695 803 820 2.1% 18.0% Primary Metal Manufacturing (331) 207 * * * * Fabricated Metal Manufacturing (332) 1,694 1,724 1,804 4.6% 6.5% Machinery Manufacturing (333) 1,557 1,488 1,444 -3.0% -7.3% Computer & Electronic Product Manufacturing (334) 5,437 5,430 5,397 -0.6% -0.7% Electrical Equipment/Appliance (335) 1,729 1,361 1,351 -0.7% -21.9% Transportation Equipment (336) 826 618 604 -2.3% -26.9% Furniture and Related Products Manufacturing (337) 916 1,054 1,108 5.1% 21.0% Miscellaneous Manufacturing Industries (339) 3,360 3,059 2,970 -2.9% -11.6%Service Producing 219,969 225,196 226,652 0.6% 3.0% Wholesale Trade (42) 31,156 30,694 29,988 -2.3% -3.7% Retail Trade (44-45) 42,469 41,587 41,777 0.5% -1.6% Transportation and Warehousing (48-49) 5,051 4,849 4,946 2.0% -2.1% Utilities 449 443 446 0.7% -0.7% Information (51) 11,378 11,948 12,093 1.2% 6.3% Finance and Insurance (52) 15,190 15,273 15,392 0.8% 1.3% Real Estate and Rental and Leasing (53) 4,730 5,087 5,350 5.2% 13.1% Professional, Scientific/Technical Services (54) 18,549 18,905 19,056 0.8% 2.7% Management: Companies/Enterprises (55) 5,406 5,730 5,702 -0.5% 5.5% Administrative, Support, and Waste Mgt. Services (56) 31,598 34,973 35,593 1.8% 12.6% Educational Services (61) 2,186 2,619 2,593 -1.0% 18.6% Health Care and Social Services (62) 17,976 17,891 18,035 0.8% 0.3% Arts, Entertainment, and Recreation (71) 2,317 2,357 2,441 3.6% 5.4% Accomodation and Food Services (72) 24,064 24,968 25,399 1.7% 5.5% Other Services (81) 7,450 7,872 7,841 -0.4% 5.2%Unclassified (industry not assigned) 501 497 507 2.0% 1.2%Total Private Employment 267,562 272,853 275,113 0.8% 2.8%
Federal 3,056 3,026 3,035 0.3% -0.7% State 1,937 1,944 2,170 11.6% 12.0% Local 19,738 24,553 25,927 5.6% 31.4%Total Government Employment 24,731 29,523 31,132 5.4% 25.9%
TOTAL GWINNETT EMPLOYMENT (JOBS) 292,293 302,376 306,245 1.3% 4.8%
* Denotes confidential data relating to individual employers which cannot be released.Source: Georgia Department of Labor. Data represent jobs covered by unemployment insurance legislation.

5index data
Gwinnett County Department of Financial Services, Forecasting and Research Division, 75 Langley Drive, Lawrenceville, GA 30045
Gwinnett County, Georgia Business Cycle IndicatorsJune, 2005
Gwinnett County Economic Indices: May-05 Apr-05 Mar-05 Feb-05 Jan-05
Leading Economic Index (1997 = 100) 96.53 95.14 96.06 97.47 98.18 Current Economic Index ( 1997 = 100) - 123.30 124.10 123.21 123.19 Lagging Economic Index (1997 = 100) - - 73.04 73.34 73.43
Apr-05 May-04to to
Gwinnett County Leading Economic Index May-05 Apr-05 May-04 May-05 May-05
Leading Economic Index (1997=100) 96.53 95.14 95.56 1.5% 1.0%
Components: Initial Unemployment Claims (Seasonally Adjusted) 1,636 2,274 1,908 -28.0% -14.2% Initial Unemployment Claims (Unadjusted) 1,582 1,682 1,652 -5.9% -4.2%
Bloomberg Gwinnett Stock Index (12/31/97 = 100) 79.94 76.02 78.37 5.2% 2.0%
South Atlantic Consumer Expectations 104.8 92.2 101.4 13.7% 3.4%
Atlanta Manufacturing Averge Weekly Hours (Seasonally Adjusted) 36.2 37.1 35.4 -2.4% 2.5% Atlanta Manufacturing Averge Weekly Hours (Unadjusted) 36.7 36.8 35.8 -0.3% 2.5%
New Single Family Building Permits (Seasonally Adjusted) 755 655 700 15.2% 7.8% New Single Family Building Permits (Unadjusted) 807 679 717 18.9% 12.6%
Mar-05 Apr-04to to
Gwinnett County Current Economic Index * Apr-05 Mar-05 Apr-04 Apr-05 Apr-05
Current Economic Index (1997=100) 123.30 124.10 120.62 -0.6% 2.2%
Components: Sales Tax Receipts (Constant 1982-84 $'s; Ths., Seasonally Adj.) $8,794.2 $8,503.2 $8,055.2 3.4% 9.2% Sales Tax Receipts (Current $'s, Ths., Unadjusted) $12,038.2 $11,545.8 $11,220.0 4.3% 7.3%
Household Employment (Seasonally Adjusted) 363,139 368,748 363,768 -1.5% -0.2% Household Employment (Unadjusted) 363,437 368,733 364,066 -1.4% -0.2%
South Atlantic Consumer Confidence (Present Situation) 134.2 142.6 114.5 -5.9% 17.2%
Hotel/Motel Occupancy - Room Nights (Ths., Seasonally Adj.) 196.0 186.6 181.9 5.0% 7.8% Hotel/Motel Occupancy - Room Nights (Ths., Unadjusted) 203.0 194.7 187.4 4.3% 8.3%
* (Data for the Current Index is one month behind due to the lag in sales tax receipts)Feb-05 Mar-04
to toGwinnett County Lagging Economic Index ** Mar-05 Feb-05 Mar-04 Mar-05 Mar-05
Lagging Economic Index (1997=100) 73.04 73.34 72.18 -0.4% 1.2%
Components: Average Duration of Unemployment Benefits (Weeks, Seasonally Adjusted) 14.74 14.83 15.44 -0.6% -4.5% Average Duration of Unemployment Benefits (Weeks, Unadjusted) 14.70 14.80 15.40 -0.7% -4.5%
Prime Rate Charged by Banks 5.58 5.48 4.00 1.8% 39.5%
Unemployment Rate (Seasonally Adjusted) 4.5% 4.3% 3.9% 0.1% 0.6% Unemployment Rate (Unadjusted) 4.3% 4.4% 3.8% -0.1% 0.6%
Bankruptcies (Number, 12-month ending) 4,872 4,819 4,731 1.1% 3.0%
** (Data for the Lagging Index is one quarter behind due to the lag in bankruptcy data)

6indicators
GWINNETT COUNTY, GEORGIATop Employers in 2005 2000-2004 U.S. COUNTY
1 Gwinnett County Public Schools 17,697 POPULATION GROWTH RANK: 562 Gwinnett County Government 4,391 3 Gwinnett Health Care System 3,959 2004 U.S. COUNTY4 WalMart 3,067 POPULATION NUMBER RANK: 755 Publix * 2,847 6 United States Postal Service 2,442 1 = fastest/largest 3,141 = slowest/smallest7 State of Georgia 2,055 8 Primerica 1,650 9 Scientific-Atlanta 1,548
10 Kroger * 1,484 11 Home Depot ** 1,112 12 Waffle House 1,066 13 Atlanta Journal Constitution * 972 14 Emory Eastside Medical Center * 843 15 CheckFree 810
Source: Calls to individual companies in March '05.* Full-time equivalents (FTEs) Source: Gwinnett County Tax Assessor.** Based on business license data.
Indicators 1997 1998 1999 2000 2001 2002 2003 2004
Total Employment (Jobs) 235,293 253,781 266,087 282,229 289,600 288,969 291,860 - % change 6.2 7.9 4.8 6.1 2.6 (0.2) 1.0 -
Unemployment Rate 2.6 2.5 2.4 2.2 2.8 4.5 4.1 3.9 Total Personal Income ($Bil) 14.2 15.6 17.1 19.0 19.5 19.7 20.4 -
% change 8.5 10.0 9.6 11.2 2.6 1.2 3.4 - Sales Tax Revenue ($Mil) 58.7 97.7 109.6 119.7 120.8 119.6 119.8 131.8 Population 516,032 540,954 567,569 596,544 623,621 648,833 673,774 700,794 Single-Family Permits 5,819 6,967 7,301 7,597 8,440 8,201 7,915 8,199 Median Existing Home Price ($Ths) 119.5 127.8 135.8 144.6 153.1 159.9 164.3 169.0 Mortgage Originations ($Mil) 2,317 4,039 3,361 3,161 7,070 8,848 11,005 7,503 Net Migration (000) 20.6 18.6 19.9 21.1 18.4 16.4 16.0 16.5 Personal Bankruptcies 2,732 2,713 2,676 2,667 3,313 4,044 4,553 4,513
Source: Gwinnett County; Georgia Dept. of Labor; U.S. District Courts; Bureau of Economic Analysis; U.S. Census Bureau; and Economy.com
Source: Gwinnett County Tax Assessor. Source: Bureau of Economic Analysis, 2002.
Gwinnett County Department of Financial Services, Forecasting and Research Division, 75 Langley Drive, Lawrenceville, GA 30045Although the information in this report has been obtained from sources that we believe to be reliable, we do not guarantee its accuracy, and suchinformation may be incomplete or condensed.
2003 PER CAPITA INCOME
$30,277$33,308
$29,000$31,472
GWN ATL GA US
HOUSE VALUE DISTRIBUTION
5.7
72.2
16.3
3.7
1.1
0.9
0.2
0 10 20 30 40 50 60 70 80
<$100,000
$100,000 - $199,999
$200,000 - $299,999
$300,000 - $399,999
$400,000 - $499,999
$500,000 - $999,999
>$1,000,000 % of single-familyresidences, 2003.Ave. value = $173,806
NET TAXABLE DIGEST: $23.3 B
54%38%
8%Residential
Commercial
Motor Vehicle