Embed Size (px)
Citation preview

M
EconMay 2017
nomicc Indicato
ors: 2
Vail Valley
Report Autho
2017
Partnership/V101 Fawcett Rd
vailvalleyparor: Andrej A. Birju
/Vail Valley Ecd., Ste. 240 | Avortnership.com | vulin, Ph.D., Resea
Pconomic Deveon, CO 81620 | 97vailvalleymeansbarch Director | 97
Prepared by: elopment 70‐476‐1000 usiness.com 70‐328‐0299

Vail Valley Ec
20,000
40,000
60,000
80,000
100,000
199
Grow
conomic Develo
21,928
30,8
90 1995 Est.
wth 1990‐2000: 9
opment
883
41,659
2000 200
E
Da
Growth 200
90%
49,421 52,
05 Est. 2010
Eagle Coun
ata Source: Colora
0‐2010: 25%
Projected Growt
20
071 53,320
2015 Est. 2Fo
nty Popula
ado State Demog
th 2010‐2020: 16
Projected G
017 Economic
60,579
2020orecast
2025Forecas
ation
grapher June 20
6%
rowth 2020‐2030
Projec
indicators
68,393
76,58
st2030
Forecast F
017
0: 26%
cted Growth 203
81
85,174
93,
2035Forecast
204Forec
0‐2040: 22%
2
481
40cast

Vail Valley Ec
0
1,000
2,000
3,000
4,000
5,000
6,000
7,000
8,000
conomic Develo
6,51
4
5,190
1,0
2
4,58
2006
opment
19
4,891
0
098
96
7
6
Esti
Data
imated Pop
Source: Colorad
20
6,372
6,447 6,445
1,017
263
5,240
2011
pulation b
do State Demogra
017 Economic
by Town
apher June 2017
indicators
6,9
1
5
20
6,5706,748
983
1,047
280
5,486
16
AvonEagleGypsumMinturnRed CliffVail
3

Vail Valley Ec
0
20,000
40,000
60,000
80,000
100,000
199
0%10%20%30%40%50%60%70%80%90%
100%
199
Perc
conomic Develo
0 2000
Populati
90 2000
cent of Popu
opment
2010 2020
ion by Age C
2010 2020
ulation in Eac
Da
An Agin
2030 204
Category
2030 204
ch Age Categ
ata Source: Color
20
ng Populat
40
85‐90+
65‐84
45‐64
25‐44
0‐24
40
gory
85‐90+
65‐84
45‐64
25‐44
0‐24
rado State Demo
017 Economic
tion
Eagle Cgroups grow dithose b Both th25) as wof 25-44somewhCounty2030. While again popgrowth in the oand oldpopulatis expectotal byin placeto grow
grapher June 201
indicators
County is agingabove 65 yearisproportionalelow 65 years.
he younger popwell as the “fam4 are projectedhat smaller pro
y’s total residen
all age groups apulation by 20relative to cur
older adult segmder are about 9tion currently, cted to make uy 2020 and 16%e and by in-migwth in the olde
17
g. That is, age rs are forecast lly faster than .
pulation (undemily age” groud to become oportion of thnts from 2010
are expected t030, the higherrent status coment. Adults 6
9% of the and that segm
up 12% of the% by 2030. Agration contrib
er age groups.
4
to
er up a
he to
to st
omes 65
ment e ging bute
Vail Valley Ec
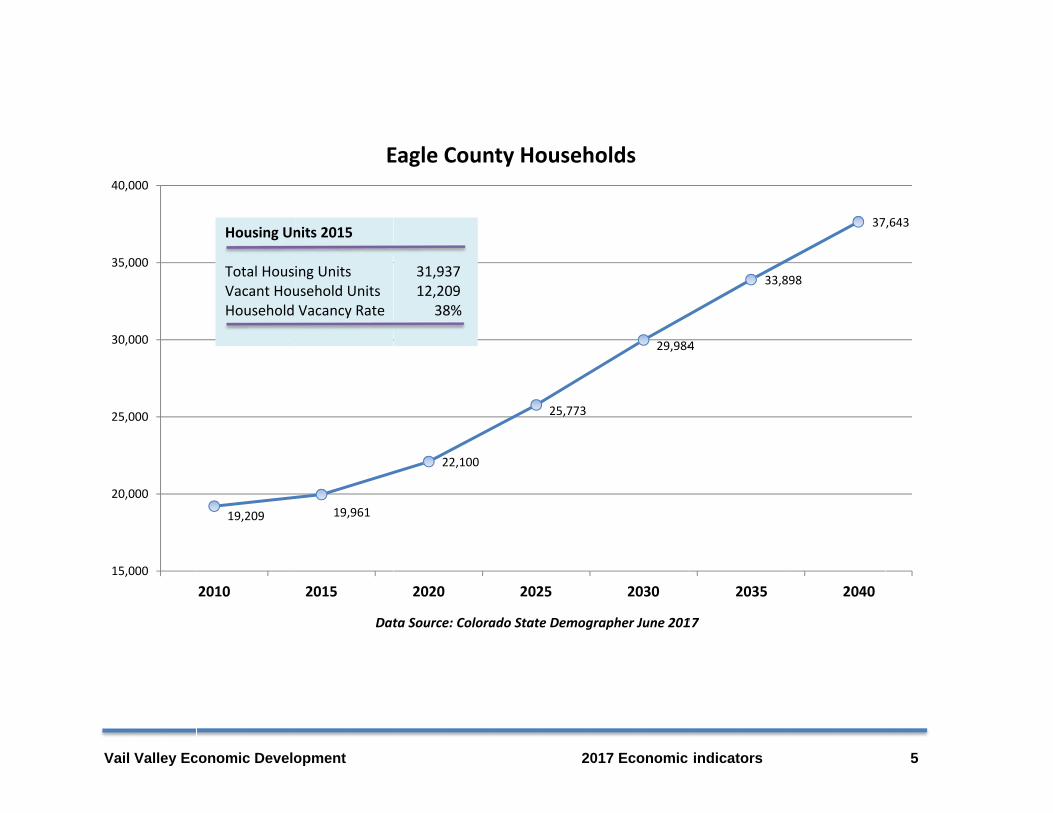
15,000
20,000
25,000
30,000
35,000
40,000
conomic Develo
19,209
2010
Housing Un
Total HousVacant HouHousehold
opment
19,961
2015
E
Dat
nits 2015
ing Unitsusehold UnitsVacancy Rate
22,100
2020
Eagle Coun
ta Source: Colora
31,93712,209
38%
20
25,773
2025
nty Househ
ado State Demog
017 Economic
29,984
2030
holds
grapher June 201
indicators
4
33,8
2035
17
898
37
2040
5
,643
Vail Valley Ec
0%
2015_Est
2010 Census
2005 Est.
2000 Census
conomic Develo
32%
30%
23%
23
20%
opment
% 40%
Dem
Data Source: Co
7
77
77
60%
mographics
olorado State De
20
68%
70%
7%
7
80%
: Race and
emographer June
017 Economic
100%
d Ethnicity
e 2017
indicators
%
Hisp
Non
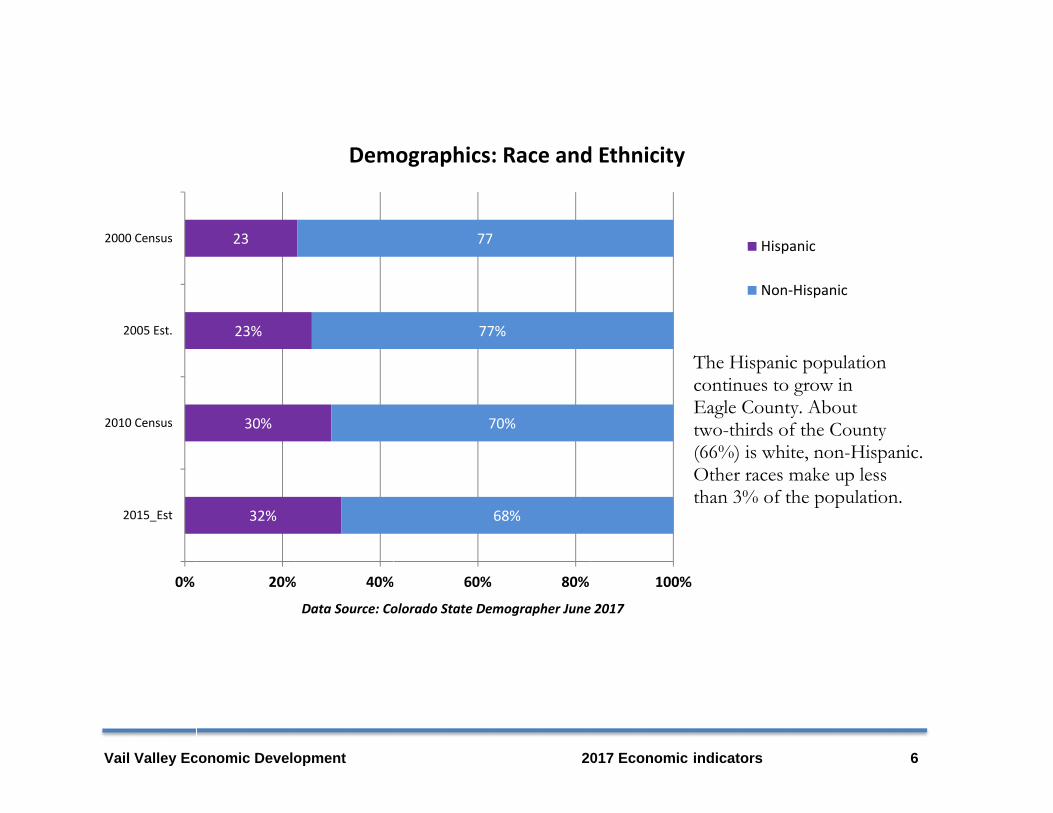
The Hispanicontinues toEagle Counttwo-thirds o(66%) is whiOther races than 3% of t
panic
‐Hispanic
ic populationo grow inty. About
of the Countyite, non-Hispmake up lessthe populatio
6
n
y panic. s on.
Vail Valley Ec
0
20
40
60
80
Percen
t
conomic Develo
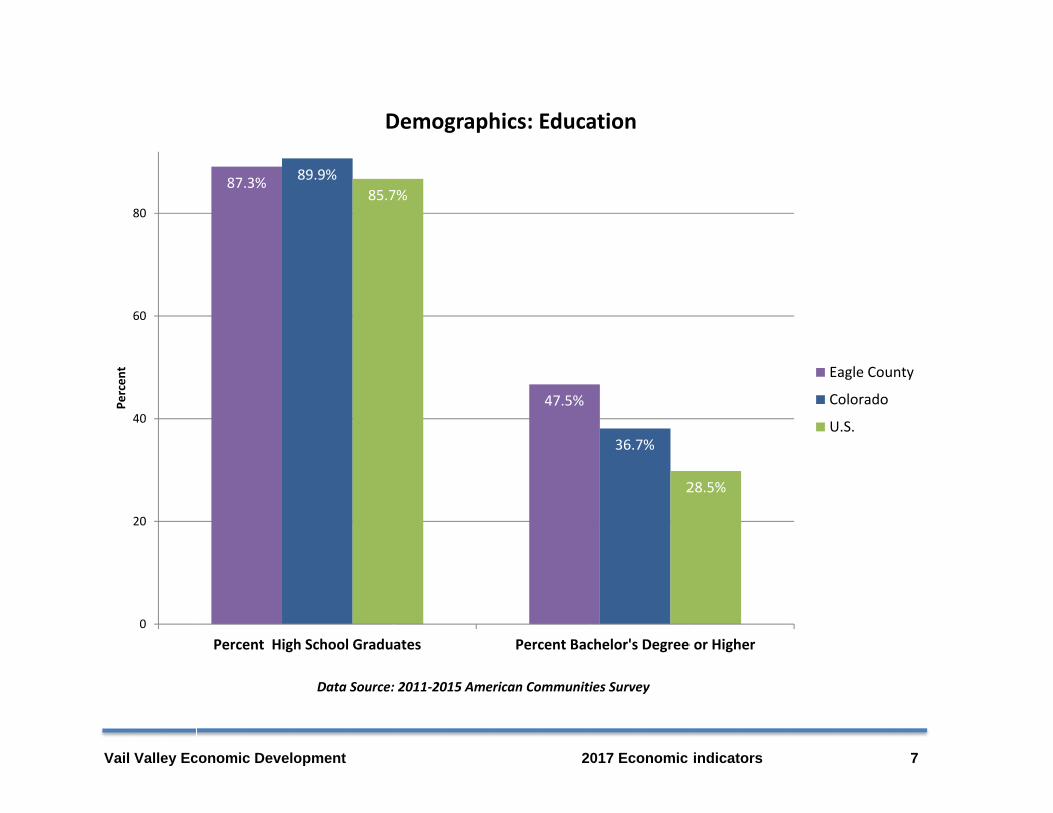
87.3%
Percent High
opment
89.9%85.7
h School Gradu
D
Data Source:
7%
ates
Demograph
: 2011‐2015 Ame
20
47.5%
Percent Bac
hics: Educa
erican Communiti
017 Economic
36.7%
2
chelor's Degree
ation
ies Survey
indicators
28.5%
e or Higher
Eagle Co
Colorado
U.S.
7
unty
o

Vail Valley Ec
20
40
60
80
conomic Develo
0
0,000
0,000
0,000
0,000
0
4
8
12
16
Percen
t
opment
72,214
Eagle County
9.2
Eagle County
P
D
Demogr
Median H
Percent of Ind
Data Source: 201
20
aphics: Inc
60,629
Colorado
Household Inc
12.7
Colorado
dividuals Belo
11‐2015 American
017 Economic
come
come
ow Poverty Lin
n Communities S
indicators
53,889
U.S.
15.5
U.S.
ne
Survey
8

Vail Valley Ec
0
5,000
10,000
15,000
20,000
25,000
30,000
35,000
40,000
200
0.0
2.0
4.0
6.0
8.0
10.0
200
Percen
t
conomic Develo
07 2008
Nu
Nu
Nu
07 2008
opment
2009
umber in Labor F
umber Employed
umber Unemplo
2009
Data
Local
2010 20
Force
d
oyed
2010 20
Unemploym
a Source: Colorad
20
Employme
011 2012
011 2012
ment Rate
do Dept. of Labor
017 Economic
ent
2013
Averag2016 An
Eagle CColorad
2013
r and Employmen
indicators
2014 20
ge Weekly Wagnnual
Countydo
2014 20
nt
015 2016
ge
$ 838$1,052
015 2016
9
6
6
Vail Valley Ec
‐8.0%
‐6.0%
‐4.0%
‐2.0%
0.0%
2.0%
4.0%
6.0%
8.0%
Percen
t Cha
nge from
Prio
r Year
‐0.05
‐0.04
‐0.03
‐0.02
‐0.01
0
0.01
0.02
0.03
Employed
Ratio M
inus
Labo
r Ratio
conomic Develo
2008 20
2008 20
Data S
opment
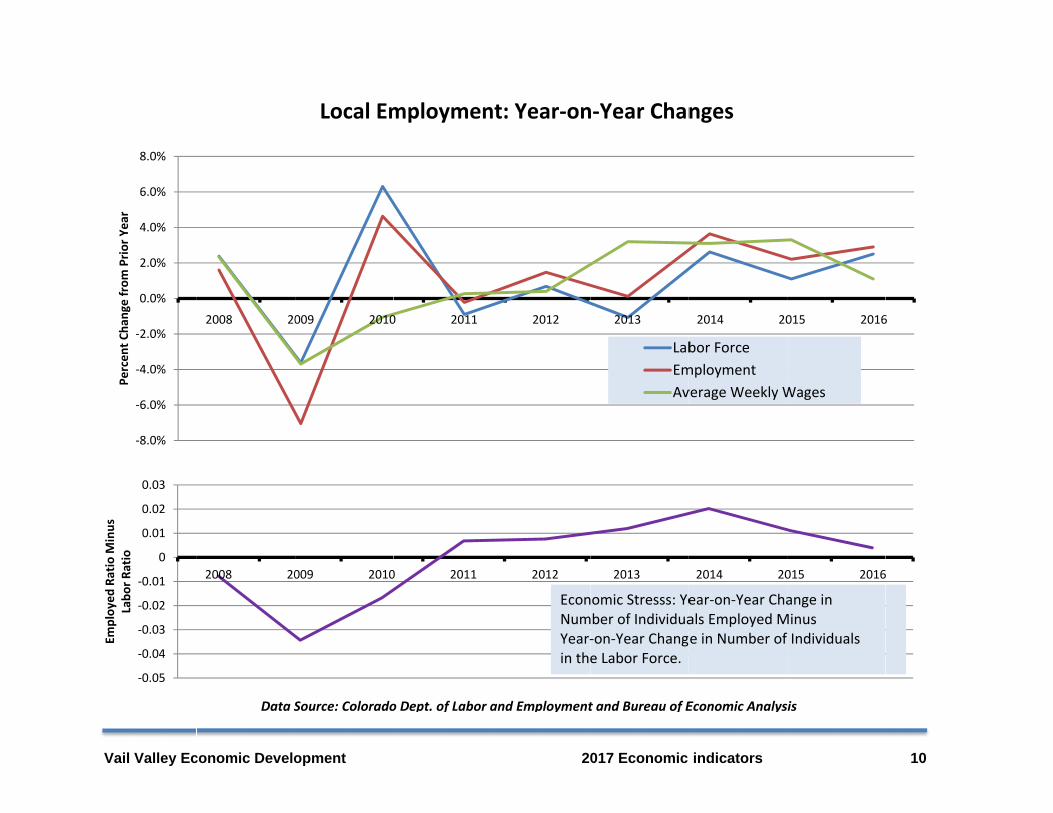
Local Em
009 2010
009 2010
Source: Colorado
mploymen
0 2011
0 2011
o Dept. of Labor a
20
nt: Year‐on
2012
2012
EconNumYear‐in the
and Employment
017 Economic
n‐Year Chan
2013
LabEmAv
2013
nomic Stresss: Yember of Individua‐on‐Year Change Labor Force.
t and Bureau of E
indicators
nges
2014 20
bor Forcemploymentverage Weekly W
2014 20
ear‐on‐Year Chaals Employed Mge in Number of
Economic Analys
015 2016
Wages
015 2016
ange in Minusf Individuals
sis
10
6
6

Vail Valley Ec
5
5
conomic Develo
Ma
7%
7%
%
5%
4%
4%
2
opment
arket Segm
10%
11%
2016 Annua
Data S
mentation:
2
11%
l
Source: Colorado
20
Employee
24%
12%
o Department of L
017 Economic
es by Indus
Accommo
Arts, Ente
Retail Tra
Construct
Health Ca
Administr
Public Ad
Real Estat
Education
Professio
All Other
Labor and Emplo
indicators
stry sector
odation & Food
ertainment & Re
ade
tion
are & Social Ass
rative & Waste
dministration
te, Finance, Ins
n Services
onal, Scientific &
oyment
r
d Services
ecreation
sistance
Services
urance
& Technical Svc
11

Vail Valley Ec
1
conomic Develo
Mark
11%
1%
14%
21%
opment
ket Segmen
7%1%
%
2016
Data
ntation: Es
8%
3%
5%
Annual
Source: Colorad
20
stablishme
11%
18%
do Department of
017 Economic
ents by Ind
Accommo
Arts, Ente
Retail Tra
Construct
Health Ca
Administr
Public Ad
Real Estat
Education
Professio
All Other
f Labor and Empl
indicators
dustry sect
odation & Food
ertainment & Re
ade
tion
are & Social Ass
rative & Waste
dministration
te, Finance, Ins
n Services
onal, Scientific &
loyment
tor
d Services
ecreation
sistance
Services
urance
& Technical Svc
12

Vail Valley Ec
2
$500,000
$1,000,000
$1,500,000
$2,000,000
$2,500,000
conomic Develo
,367,789 2,35
2007 20
opment
55,829
1,876,
008 200
486
1,911,03
09 2010
Eagle Cou(in
Data Source: C
20
32,067,156
2011
nty Retail Thousands)
Colorado Departm
017 Economic
2,115,789
2012
Sales
ment of Revenue
indicators
2,263,6832,3
2013
e
391,083
2,50
2014 20
13
07,384
015
Vail Valley Ec
$12
$0
$2,000,000
$4,000,000
$6,000,000
$8,000,000
$10,000,000
$12,000,000
$14,000,000
$16,000,000
conomic Develo
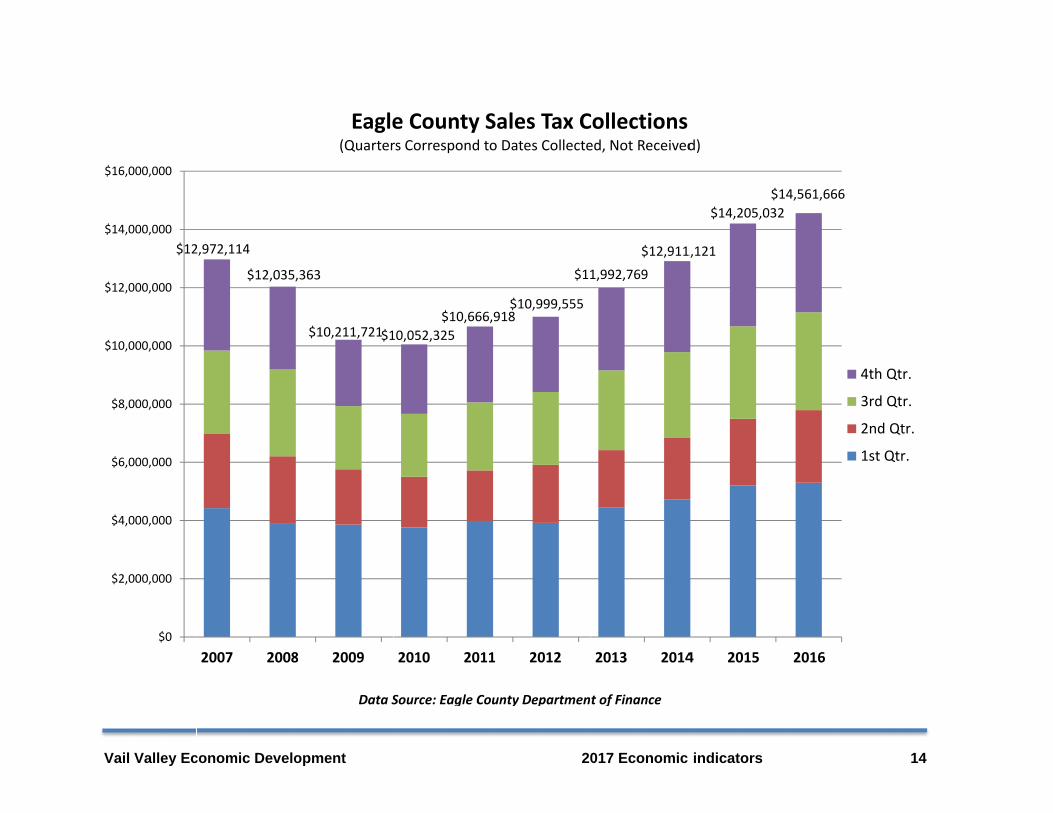
2,972,114
$12,035
2007 2008
opment
,363
$10,211,721$1
8 2009
Eagle(Quarter
Data S
10,052,325$10,666,
2010 2011
e County Srs Correspond to
Source: Eagle Co
20
,918$10,999,555
$11
1 2012
Sales Tax Co Dates Collecte
unty Departmen
017 Economic
1,992,769
$12,911
2013 2014
Collectionsed, Not Received
t of Finance
indicators
1,121
$14,205,032$14
4 2015
d)
4,561,666
2016
4th
3rd
2nd
1st Q
14
Qtr.
Qtr.
Qtr.
Qtr.

N
T(
M
Vail Valley Ec
Number Sold
Percent of Prev
Total Dollar V(in Thousands
Percent of Prev
Mean Sales P
Single
Mult
Vacant Re
Com
conomic Develo
vious Year
Volume s) $1
vious Year
Price
e Family $1
i‐Family $8
es. Land $3
mmercial $8
opment
2011
1,357
109%
,158,049 $
77%
,003,971 $
859,243
350,346
851,585 $
D
Re
2012
1,726
127%
$1,513,490
131%
$1,042,750
$775,323
$388,551
$1,079,502
Data Source: Land
20
eal Estate
2013
1,766
102%
$1,402,637
93%
$970,764
$802,332
$264,250
$873,330
d Title Guarantee
017 Economic
2014
1,802
102%
$1,779,363
127%
$1,236,694
$900,299
$324,936
$1,754,116
e Company
indicators
2015
2,061
114%
3 $1,989,13
112%
4 $1,194,55
$871,36
$341,85
6 $1,475,78
2016
2,048
99%
38 $1,957,
98%
52 $1,185,
66 $784,6
3 $273,3
84 $1,983,
16
6
8
%
,962
%
,357
625
393
,113

Vail Valley Ec
Nu
Total
conomic Develo
umber Sold
2015
2016
Percent of Pr
Dollar Volum
2015
2016
Percent of Pr
opment
Rea
revious Year
me
revious Year
al Estate – S
Gypsum
177
187
106%
$63,649,368
$66,806,318
105%
Data Source: La
20
Select Loca
Eag
201
200
100%
$102,26
$106,35
104%
and Title Guaran
017 Economic
al Markets
le
1
0
%
68,102 $5
55,594 $7
%
tee Company
indicators
s
Avon
120
156
130%
50,980,578
77,310,461
152%
Vail Villag
68
48
71%
$283,182,3
$162,726,7
57%
17
ge
348
776
Vail Valley Ec
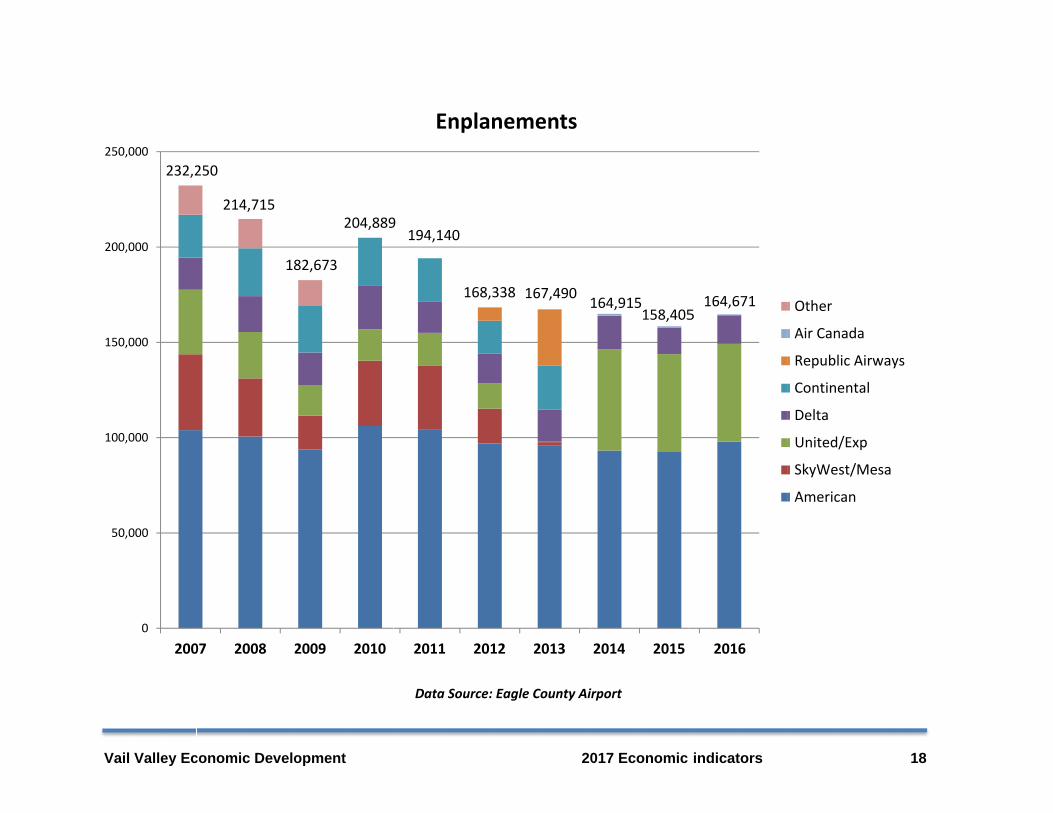
232,2
0
50,000
100,000
150,000
200,000
250,000
200
conomic Develo
250
214,715
18
07 2008 2
opment
82,673
204,889
2009 2010
9194,140
168,
2011 201
Enpla
Data Source:
20
338 167,490
12 2013
nements
: Eagle County Ai
017 Economic
164,915158,405
2014 2015
irport
indicators
5164,671
2016
Other
Air Canada
Republic Airwa
Continental
Delta
United/Exp
SkyWest/Mesa
American
18
ays
a

4
Vail Valley Ec
5,541
0
1000
2000
3000
4000
5000
6000
7000
2007‐08
conomic Develo
5,8216
8 2008‐09 20
opment
Eagle C
6,049 5,970
009‐10 2010‐1
Data
County Sch
6,180
1 2011‐12 2
Source: Eagle Co
20
hools’ K‐12
6,223 6,34
2012‐13 2013‐
ounty Schools’ Oc
017 Economic
2 Enrollme
44 6,464
14 2014‐15
ctober Count
indicators
ents
6,559 6,6
2015‐16 2016
Ov20
628
6‐17
High
Middle
Elementa
verall Growth007‐2016 is 20%
19
ary
%

Vail Valley Ec
Free(
20
30
40
50
60
2007
Percen
t
conomic Develo
Eagle /Reduced Less than 4% of
50
53
34
37
32
35
7‐08 2008‐09
Hisp
Free
No/L
opment
County ScLunch andf the School Pop
52
41
34
9 2009‐10
panic/Latino
e/Reduced Luch
Limited English
D
hools’ Perd Studentspulation Indicate
50 5
46
33
2010‐11 201
Proficieny
Data Source: Eag
20
cent Hispas with No oes a Race/Ethni
50 50
43
46
33
30
11‐12 2012‐1
gle County Schoo
017 Economic
anic/Latinoor Limited city Other Than
51
43
28
3 2013‐14
ls October Count
indicators
o PopulatioLanguage n White or Hispa
52
41
28
2014‐15 20
t
on, Proficiencanic/Latino)
52
41
27
015‐16 2016‐
20
cy
52
41
27
17