Embed Size (px)
Citation preview
CHAPTER IV
ECONOMIC IMPORTANCE OF THE PLANTATION SECTOR IN KERALA
CHAPTER IV
ECONOMIC IMPORTANCE OF THE PLANTATION SECTOR IN KERALA
With nearly half the plantation area in the country and a major interest
in all the four crops-tea, coffee, rubber and cardamom-Kerala is
undoubtedly India's most important plantation state.' These plantations ensure
a better return to growers, higher revenue to the Govenunent, improved income
to workers and above all the overall development of the Kerala economy.
Arnong the various categories under the non-food grain sector, plantation crops
have recorded the maximum growth in area during the period 1976-'77 to
1995-'96 as revealed by the enormous increase in their area index from 95.04
to 181.26.' Plantations are ago-industrial undertakings regularly employing a
large number of workers and are mainly concerned with production for
comnercial purposes. With one third of Kerala's State Domestic Product (SDP)
coming from the agricultural sector, the role of plantation crops in its
;rgricultural economy may be viewed in ternls of
(i) share in cultivated area;
(ii) contribution to state agricultural income;
(iii) share of foreign exchange earnings;
(iv) contribution to the state's tax revenue; and
(v) employment potential.
I IJPASI, The Plarrtr~s' ('hrotiicle (Coonoor. AugustISeptember 1992) p.362
2. UPASI, Plarller :s /);rectory (Coonoor, September 1996) p. 1

F'lpre 4. I Kerala-The Important State in the Plantation Map of India
Source: UPASI.

4.1 Share in Cultivated Area
Kerala accounts for about 46 per cent of the total area under plantations
in ~ n d i a . ~ The crop-wise break up in terms of area and production is shown in
Table 4.1.
Table 4.1
Place of Kerala in India's Plantation Map (1995-'96)
Type of Area (Hectares) Production (Tonnes) crop Kerala India Kerala India
Tea 34,656 4,30,888 64,794 7,49,888
Coffee 82,348 2,92,467 40,400 2,00,000
Rubber 4,43,300 5,15,572 4.76,495 5,06,910
Cardamom 43,320 83,700 4,185 6,338
Source: (a) State Planning Board, Government of Kerala, Thiruvananthapuram (b) Directorate of Economics and Statistics, Thiruvananthapuram.
It is evident from the table that rubber cultivation in Kerala forms b5.98 per
cent of the total area under rubber in the country. Kerala's rubber production is
94 per cent of the total rubber production in India. Cardamom also occupies a
prominent place in the matter of area and production. Kerala accounts for 5 1.76
per cent of the area and 66 per cent of the production of cardamom in the
country.
Based on Table 4.1, Figures 4.2 and 4.3 give a diagrammatic
representation of the area and production of plantation crops in Kerala
respectively .
3 . Economic Review, op. cit., 1997, p. 48

Figure 4 2 Area Under Plantation Crops in India and Kerala (1995-'96)
Tea Coffee Rubber Cardamom
Type of crop
Source: Table 4.1

Figure 3.3 Production of Plantation Crops in India and Kerala (1995-'96)
Kerala
Tea Coffee Rubber Cardamom
Type of crop
Source: Table 4.1

4.1.1 Share in Net Cultivated Area
Plantation crops account for about 27 per cent of the net cultivated area
in eral la.^ The details are shown in Table 4.2.
Table 4.2
Area under plantation crops vis-a-vis total cultivated area in Kerala (area in '000 hect.)
Year Plantat~ons Total for Total Plantations Cultivated
Tea Coffee Rubber Cardamom m Kerala area in Kerala
1995-'96 35 82 443 43 603 2,263
Source: Directorate of Economics and Statistics, Thi~vananthapuram.
Figure 4.4 shows the area under plantation crops during the period
1990-'91 to 1995-'96.
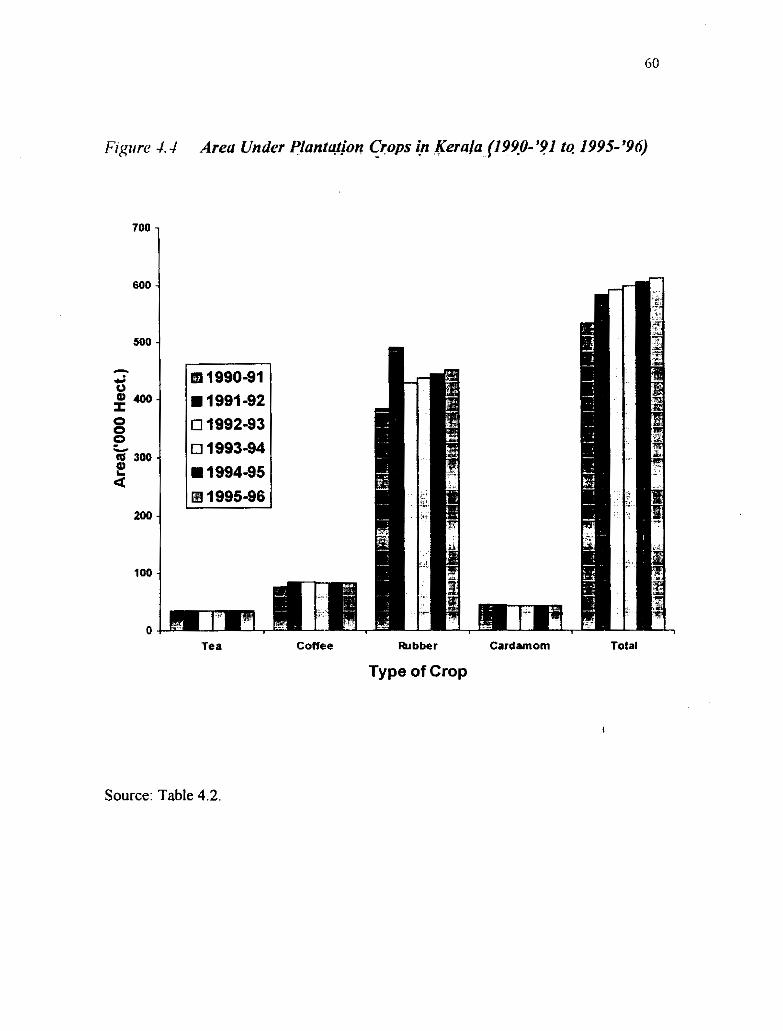
F~gure X -I Area Under Plantution Crops - in Kerala (1990-'91 tg 1995'94)
- . Tea coffee Rubber Cardamom Total
Type of Crop
Source: Table 4.2
Among the four crops, lubber accounts for the largest share in the net
cultivated area in Kerala.
4.2 Contribution to State Agricultural Income
The State's Income fiom all the sectors in 1995-'96 is Rs. 7,018 crores.
The contribution of agricultural sector to the state income is Rs. 2,365 crores.
The plantation crops account for Rs. 723.69 ~ r o r e s . ~
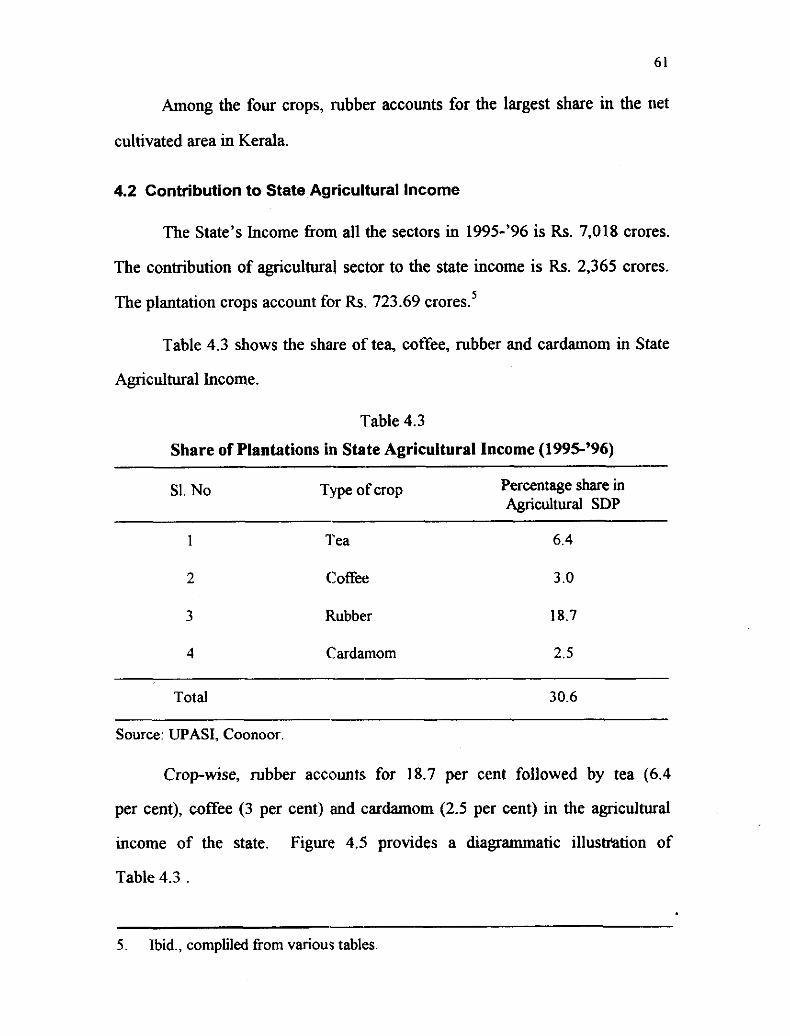
Table 4.3 shows the share of tea, coffee, rubber and cardamom in State
Agricultural Income.
Table 4.3
Share of Plantations in State Agricultural Income (1995'96) - -
S1. No Type of crop Percentage share in Agricultural SDP
1 Tea 6.4
2 Coffee 3.0
3 Rubber 18.7
4 Cardamom 2.5
Total 30.6
Source: UPASI. Coonoor
Crop-wise, rubber accounts for 18.7 per cent followed by tea (6.4
per cent), coffee (3 per cent) and cardamom (2.5 per cent) in the agricultural
income of the state. Figure 4.5 provides a diagrammatic illus!~%tion of
Table 4.3 .
5 . Ibid., compliled from various tables.

Figure 4.5 Share of Plantations in State Agricultural Income (1995-'96)
Tea Coffee Rubber Cardamom
Type of crop
Source: Table 4.3.
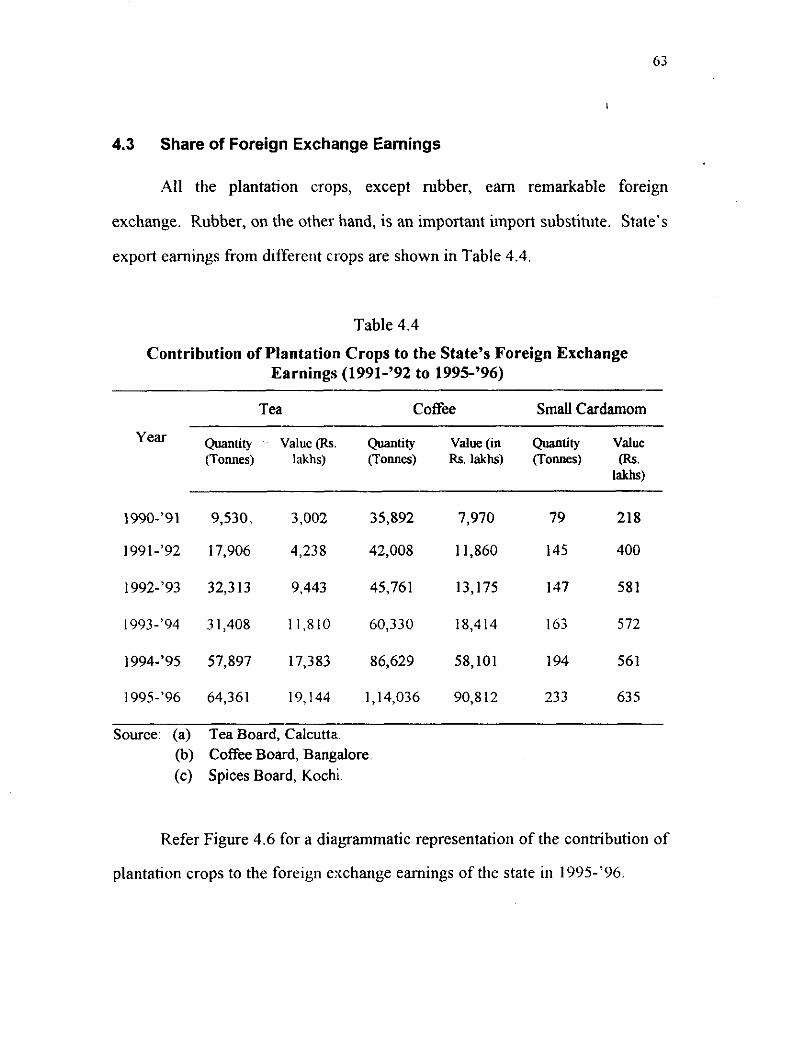
4.3 Share of Foreign Exchange Earnings
All the plantation crops, except rubber, earn remarkable foreign
exchange. Rubber, on the other hand, is an important import substitute. State's
export earnings from different crops are shown in Table 4.4.
Table 4.4
Contribution of Plantation Crops to the State's Foreign Exchange Earnings (1991-'92 to 1995-'96)
Tea Coffee Small Cardamom
Year Quantity Value (Rs. Quantity Value(in Quantity Value (Tomes) lakhs) (Tomes) Rs. lakhs) (Tomes) (Rs.
l u )
Source: (a) Tea Board, Calcutta. (b) Coffee Board, Bangalore. (c) Spices Board, Kochi
Refer Figure 4.6 for a diagrammatic representation of the contribution of
plantation crops to the foreign exchange earnings of the state in 1995.96.

r e 6 Contribution qf Plantation Crops to the Foreign Exclrunge Earning of Kerala (1995'96)
I
Tea Coffee Cardamom
Type of crop
Source: Table 4.4.

4.4 Contribution to the State's Tax Revenue
Contribution of plantation crops to the state's tax revenue is an
important indicator of the economic significance of this sector.
Table 4.5 shows the details of the Centre-State break up of the various
taxes from the Plantation sector to the State Govenunent. I
,A varlety of taxes ;inti duties to the Central and State Ciovcrnlnents are
being paid by the plantation sector. The Central Sales Tax is levied under the
Central Act and collected by the State Government. The entire amount comes
to the State Treasury. A portion of the Central Income Tax and Excise duty
also goes to the State Revenue. The most important areas of taxation of Kerala
Government are (i) State Sales TdPurchase Tax (ii) Agricultural Income Tax
and (iii) Plantation Tax.
Table 4.5
Duties and Taxes Paid by Plantations
Centre State
1. Central income tax 1. Agricultural income tax
2. Cess under Commodity Acts 2. Land tax
3 . Excise duty 3. Plantation tax
4. Central sales tax 4. State sales tax/Purchase tax
5 . Factory license fee 5. Building tax
6. Land cess
7. Machinery license fee
8. Professional tax
9. Service tax
Source: (a) Directorate of Economics and Statistics, op cit
(b) UPASI, op. cil.

4.5 Employment in the Pla~itation Sector
A striking characteristic of plantation agriculture is that it is labour
intensive. The four crops account for about 21 per cent of the agricultural
employment in the state.' Table 4.6 shows that plantations in Kerala provide
permanent employment to over 3.6 lakh workers throughout the year.7
Table 4.6
Average daily employment in plantations in Kerala (no. of persons) (1995-'96)
Plantation No. of labourers
Tea
Coffee 24,385 (7)
Rubber 2,30,000 (64)
Cardamom 22,000 (6)
Total 3,60,330
Source: (a) State Planning Hoard, op ci! (b) UPASI, op cit
Fibures in parenthesis indicate the percentage of workers in each plantation
Based on this table, Figure 4.7 shows the percentage of average daily
employment in the four crops.
6. PInn!er 's 1)irector): 011 ci!., 7.
7. Ibid.
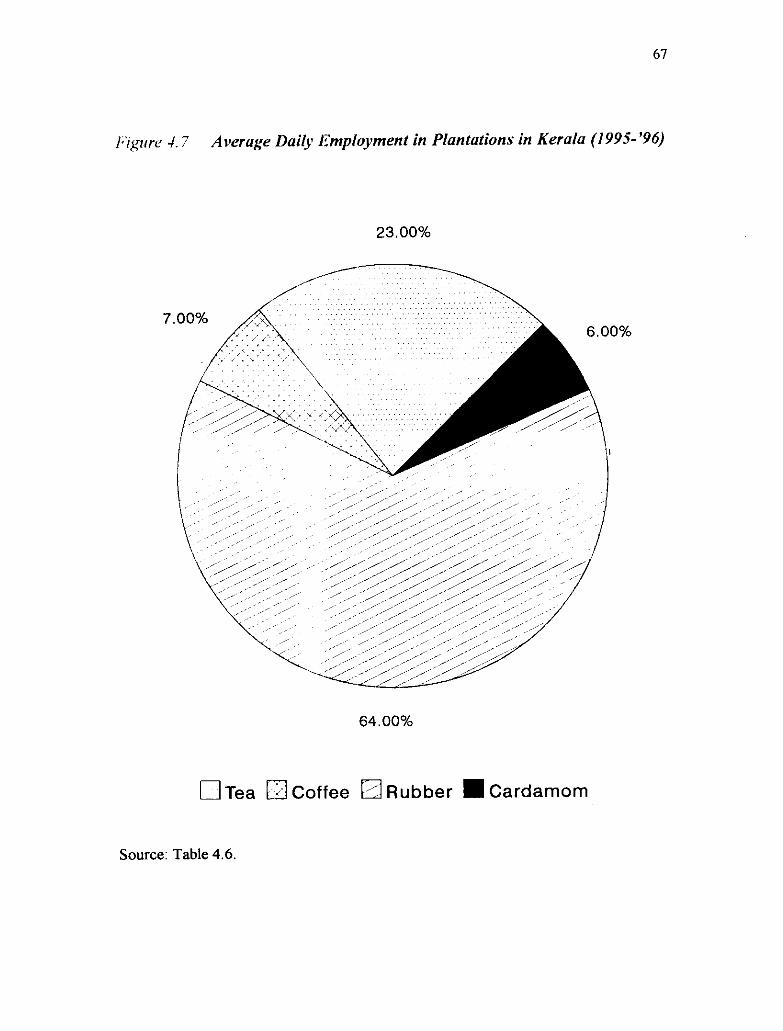
I*'/gzrre 4.7 Average Dailq' l?mployment in Plantations in Kerala (1995-'96)
23.00%
64.00%
n ~ e a a Coffee [3 Rubber Cardamom
Source Table 4.6.

In Kerala, rubber plantations employ the largest number of workers
followed by tea, coffee and cardaniom.
4.6 Plantation Crops in Kerala's Economy
A study of the relative share of plantations in terms of the net cultivated
area, state domestic product, foreign exchange earnings to the country, tax
revenue and employment potential reveals the importance of this sector in
Kerala. Table 4.7 shows the sibpificance of this sector to the state's economy.
Table 4.7
Plantation Crops in Kerala's Economy (1995-'96)
Type of Share in net Share in agric- Share in Share in cultivated area ultural SDP country's crop emp\oyment
export earnings
(Percentage)
Tea 1.9 6.4 6.9 4.6
Coffee 3.8 3.0 13.2 3.0
Rubber 18.7 18.7 Nil 11.7
Cardamom 2.5 2.5 80.0 1.6
All Crops 26.9 30.6 9.8 20.9
Source (a) UPASI, op ci/
(b) Directorate of Economic and Statistics, op. crl.
Though export ea~nings from rubber is nil, its importance in our
economy is evident from the share it occupies in net cultivated area, in
agricultural SDP and in employment generation. Export earnings to the country
are the largest from cardamom, i.e., 80 per cent. Coffee comes next to
cardamom (13.2 per cent). Though the share of tea in net cultivated area is
only 1.9 per cent, it contributes substantially to agricultural SDP (6.4 per cent),
export earnings (6.9 per cent) and employment (4.6 per cent).
4.7 Growth of Plantations in Kerala
Tables 4.8, 4.9, 4.10 and 4.11 give details about the growth of tea,
coffee, rubber and cardamom in telms of area and production in Kerala.
Table 4.8 and Figure 4.8 provide statistics relating to the area and
production of tea plantations in Kerala during the period 1950-1996.

70
Table 4.8 I
Growth of Tea Plantations in Kerala (1950-1996)
Year Area (Hectares) Production (Tonnes)
Source: Computed from the data published by
( I ) Hutidbook ofl'lru~la~ion I.uct.s, UPASI, Coonoor, 1990 ( 2 ) Tea Board, Calcutta.

Figure 4.8 Growth of Tea Plantations in Kmala (Area and Production) (1950-1995)
- 60000 V) a, c S = smw S .- CI 0 4 40000
2 P
Year
Source: Table 4.8
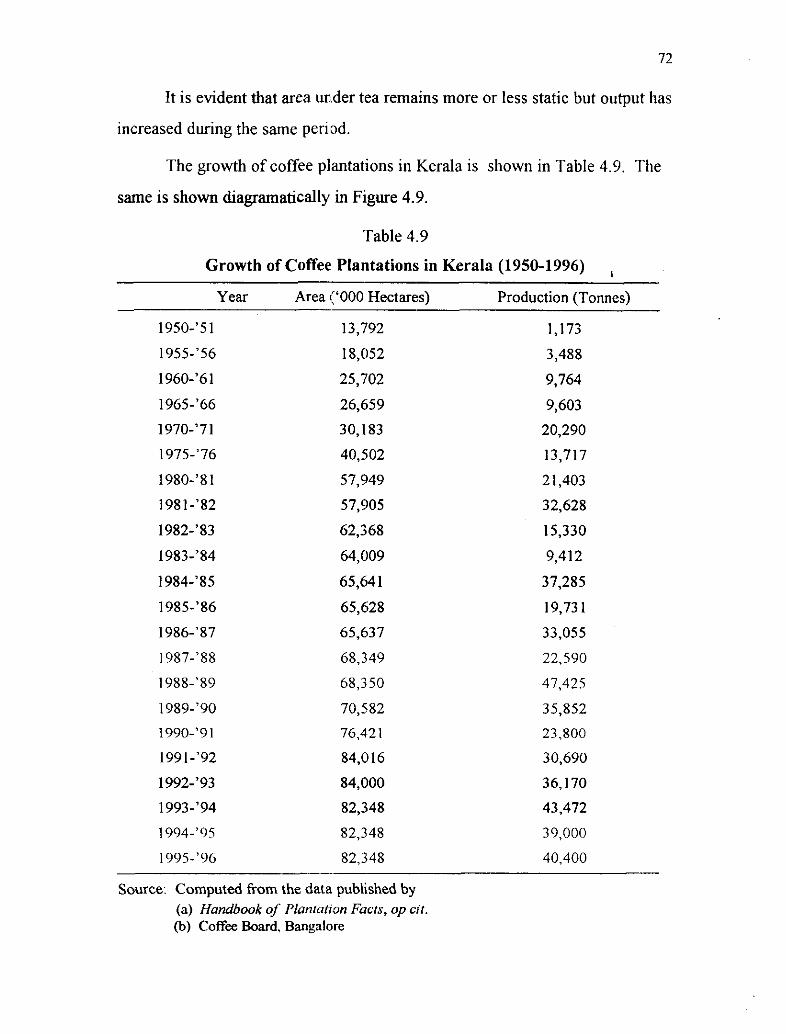
It is evident that area under tea remains more or less static but output has
increased during the same period.
The growth of coffee plantations in Kerala is shown in Table 4.9. The
same is shown diagramatically in Figure 4.9.
Table 4.9
Growth of Coffee Plantations in Kerala (1950-1996) , Year Area ('000 Hectares) Production (Tonnes)
1950-'5 1 13,792 1,173
- ~ ~ - ~ ~~ -~
Source: Computed from the data published by (a) Handbook of Plantat~on Facts, op cit. (b) Coffee Board, Bangalore
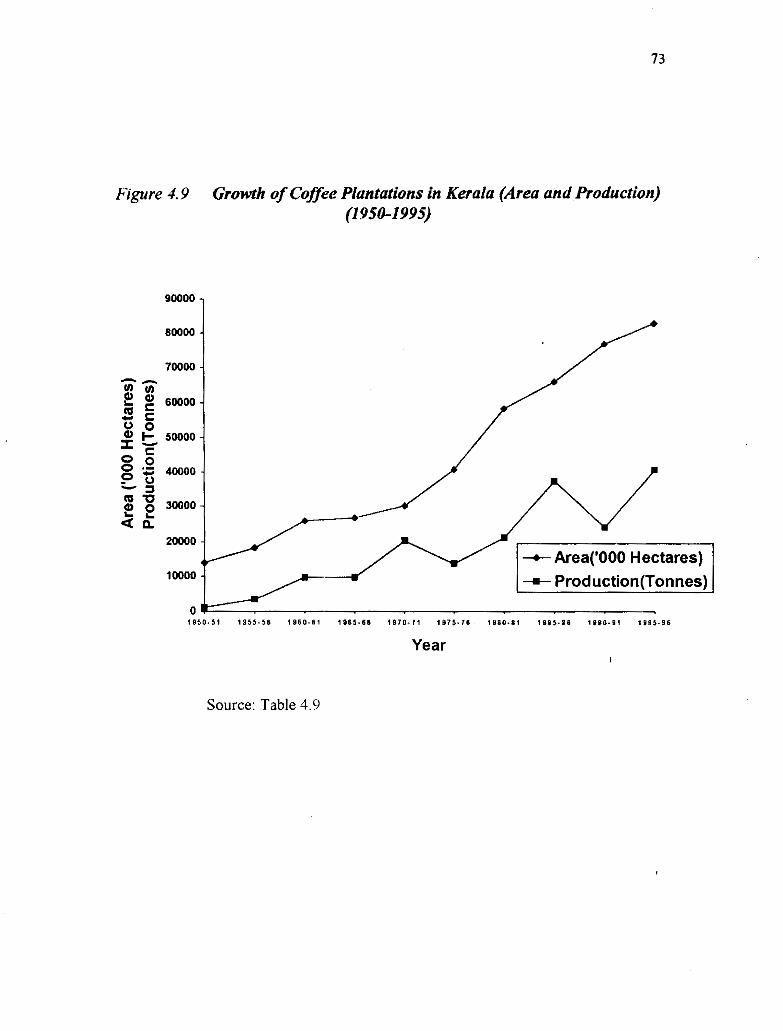
Figure 4.9 Growth of Coffee Plantations in Kerala (Area and Production) (1 950-1 995)
Year
Source: Table 4.9

It is clear from the table and figure, that on the whole, area under coffee
and output of coffee are on an increase in Kerala during the period 1950-1996,
though there are slight variations.
Table 4.10 gives the iuea and production figures relating to rubber in
Kerala during the period 1955'-'56 to 1995-'96
Table 4.10
Growth of Rubber Plantations in Kerala (1955-'56 to 1995-'96)
Year Area ('000 Hectares) Production ( T o m )
1955-'56 78,457 21,680
1960-'61 1,22,628 23,175
1965-'66 1,54,878 46,953
1970-'71 1,87,762 86,773
1975-'76 2,05,383 1.28.769
1980-'8 1 2,47,100 1,40,320
198 1 -'82 2,62,600 1.39.435
1982-33 2,78,000 1,52,662 1
1983-'84 2,94,300 1.62.212
1984-'85 3,12,000 1.72.092
1985--86 3,26,700 1,84,563
1986-'87 3,43,200 2,02,129
1987-'88 3,55,400 2,16,562
1988-'89 3,66,500 2,38,414
1989-'90 3,76,000 2,75,397
1990-'9 I 3,84,000 3,07,521
199 1 -'92 4,19,174 3,43,109
1992-'93 4,28,864 3,68,@8
1993-'94 4,37,138 4,08,311
1994-'95 4,43,300 4,42,830
1995-'96 4,43,300 4,76,495
Source: Computed fiom the data published by (a) Handbook ofPlantatron Facts, op cit (b) Rubber Board, Kottaym.

Area under rubber plantation has shown a tremendous increase from
78,457 hectares in 1955-'56 to 4,43,300 hectares in 1995-'96 resulting in an
increase of 465 per cent. Production also has increased from 21,680 tomes in
1955-'56 to 4,76,495 tomes in 1995-'96 leading to 2,098 per cent increase in
output during the period.
Figure 4.10 also presents the growth of area and production of rubber in
Kerala.
Figure -1.10 Growth of Rubber Plantations in Kerala (1955-'56 to 1995-'96)
Year
Source: Table 4.10

The growth of cardamom plantations in Kerala from 1960-'61 to
1995-'96 is shown in Table 4.1 1.
Table 4.11
Growth of Cardamom Plantations in Kerala (1960-'61 to 1995'96)
Year Area ('000 Hectares) Production (Tonnes)
1989-'90 44 1,900
1990-'9 1 44 2,885
1991-'92 44 2,770 I
1992-'93 43 2,424
1993-'94 43 4,430
1994-'95 43 4.43 1
1995-'96 43 4,185
Source: Computed from the data published by
(a) Ha?idhook of l'ltrtrlation Facts, op cit. (b) Spices Board, Kochi.

It is clear from the table that area under cardamom cultivation has been
increasing till 1988-'89 after which a decrease in area is taking place. There are
irregular variations in production figures also during the period 1960-'61 to
1995-'96. Figure 4.11 also reveals this.
figure 4. 11 Growth of Cardamom Plantations in Keralu (1960-'61 to 1995-'96)
MOO
3500
Year
Source: Table 4.1 1

4.8 Small Growers in the Plantation Sector
There is predominance of small growers in the plantation sector. Table
4.12 reveals the share of small growers in the production of plantation crops in
South India.
Table 4.12
Small Growers' Share in the Production of Plantation Crops in South India (1995-'96)
-- -- --
No of small Total production Produrnon of Produdon of Crop growers from South small growers small growers to
(Tomes) (Tomes) total (per cent)
Tea 40,000 1,82,000 40,000 22 0
Coffee 1,30,000 2,00,000 1,20,000 60.0
Rubber 8,00,000 5,07,000 4,05,600 80.0
Cardamom 30,000 7,500 6,750 90 0
Source: UPASI, op. cit,
In cardamom and rubber, small growers predominate the production,
90 per cent and 80 per cent respectively. Sixty per cent of the output of coffee
is contributed by small growers. There is the predominance of large holdings in
tea and hence share of production of small growers is only 22 per cent.
Refer Figure 4.12 for a diagrammatic representation of the details shown
in Table 4.12.

figure -1. I2 Share of Smull Growers in the Production of Pluntation Crops in South India (1995-'96)
Tea Coffee Rubber Cardamom
Type of crop
Source: Table 4.12,
XO
4.9 Tea
Tea is of greater significance to Kerala because of the high land
productivity, relative to other crops, export earnings and employment in rural
and backward areas.
4.9.1 Area
Among all the tea producing countries of the world, India has the largest
acreage under the crop. Major tea growing regions are located in Assam and
West Bengal in North India and Tamil Nadu and Kerala in South India. The
total area under the crop is 4,30,888 hectares of which South India accounts for
85,100 hectares which constitutes 20 per cent.' In South India tea is mainly
grown in Nilgiris, Anamallais, Kaman Devan Hills and over the slopes of
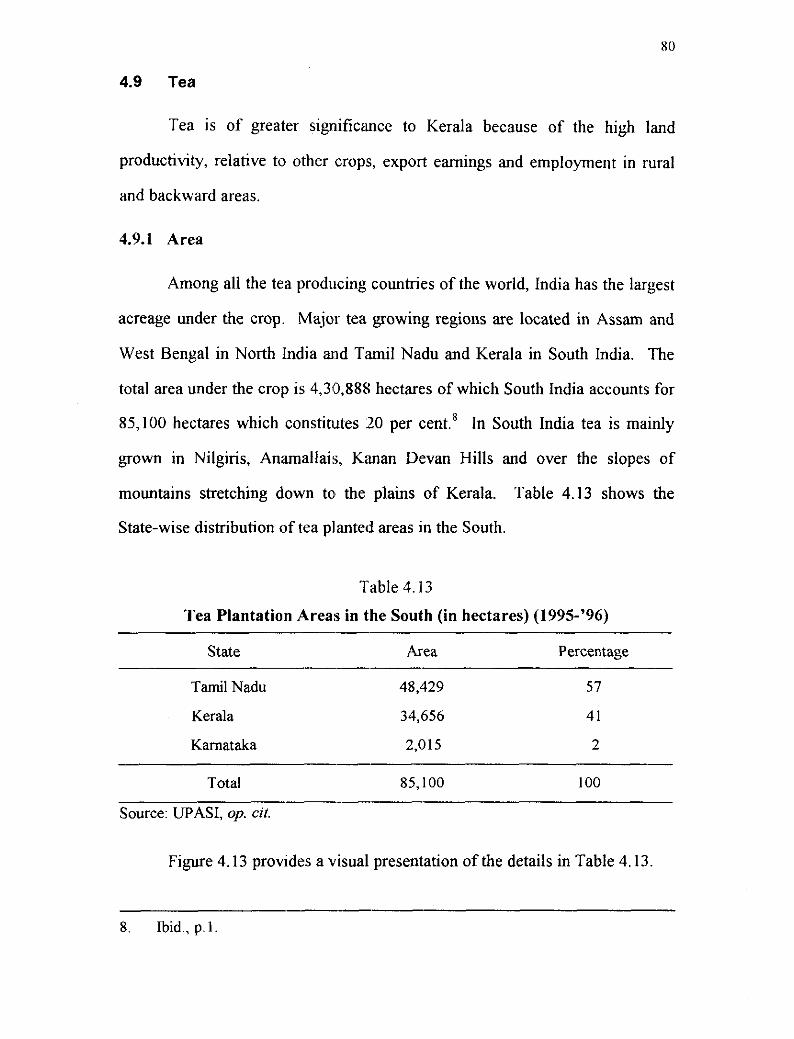
mountains stretching down to the plains of Kerala. Table 4.13 shows the
State-wise distribution of tea planted areas in the South.
Table 4.13
Tea Plantation Areas in the South (in hectares) (1995'96)
State Area Percentage
Tamil Nadu
Kerala
Karnataka
Total 85,100 100
Source: UPASI, op. cit.
Fi y e 4.13 provides a visual presentation of the details in Table 4.13.
8. Ibid., p.1.

Figure 4.13 Tea Plantation Areas in South India (1995-'96)
Kerala . Karnataka ~arni l Nadu
Source: Table 4.13.

Both the table and the figure show clearly that, of the three South Indian
states, tea is concentrated in Tamil Nadu followed by Kerala and Kamataka.
Between 1950 and 199:j, tea acreage went up by 5.5 per cent in Kerala,
that is, fiom 32,849 hectares to 34,656 hectares.
4.9.2 Production
Between 1950 and 1995, tea output in Kerala went up from 22,298
tonnes to 64,794 tonnes, an increase of 191 per cent.' Although tea production
in the state has increased over the years, it has been at a lower rate. As a result,
share of Kerala in the South Indian tea market has shrunk. ,
4.9.3 Productivity
Between 1950 and 1995, there was an increase in yield from
900 to 1880 kg/hectare.'" In spite of the marked improvement in productivity in
Kerala, it is still substantially lower than that in Tamil Nadu. Partly this could
be attributed to agronomical factors such as soil erosion, heavy monsoon,
periodic drought and frost.
4.9.4 Structure of Tea Plantations
Most of the tea plantations in Kerala are in Idukki district. Cultivation of
tea is carried on by large and small growers.
Although there are thousands of tea estates in India with a number of
small growers, over the years tea plantations have emerged as a corporatised
activity.
- 9. Ibid.
10. Ibid.. p. 3 .

4.10 Coffee
Coffee is another plantation crop of national imponance cultivated in I I
Kerala. The state accounts for 28 per cent of the counhy's area under coffee.
2.10.1 Area
Robusta and Arabica are two main varieties of coffee. Kerala is a major
Robusta growing belt and has the largest area under this variety. The area
under Arabica has stagnated around 3400 hectares whereas notable expansion
has taken place in Robusta cultivdtion. Total area under coffee in Kerala has
increased from 13,792 hectares in 1950-'51 to 82,348 hectares in 1995-'96.12
As a result, Kerala's share in the country's total coffee area has gone up from
15 to 28 per cent."
4.10.2 Production
Coffee production tends to v'ary widely from year to year; a high
cropping season is followed by a low yielding year. The fluctuation is seen
more in the Robusta variety largely grown in Kerala. Coffee production in
Kerala has been rising annually. It was 39,000 tomes in 1994-'95 and 40,400
tonnes in 1995-'96.
The share of Kerda in the country's total coffee production is 20.2 per
cent in 1995-'96'''
1 1. UPASI, 1997. 12. Ibid. 13. Ibid. 14. Ibid.

4.10.3 Productivity
Despite the state yield in Robusta increasing from 225 kghectare in
1955'56 to 520 kg/hectare in 1995-'96, it is less than 40 per cent of that
available in Karnataka. influenced to a large extent by the concentration of
small holdings in eral la.' '
4.10.4 Structure of Coffee Plantations
In the coffee economy of the country, small growers play an important
role. There are 1,28,324 coffee holdings/estates in India of which 1,20,200 are
below 10 hectares. Ninety-four per cent of India's coffee growers are s~nall
and marginal growers. Generally. small growers (owning up to 10 hectares)
account for 53 per cent of the coffee area and 48 per cent of the
In Kerala there are 77,073 units of which 75,559 units are below
10 hectares." Nearly 82 per cent of the area under coffee in the state is in I
Wayanad district.
4.11 Rubber
Natural Rubber occupies the prime position in Kerala among plantation
crops. In area expansion and increased production, rubber leads all other
agricultural crops. Kerala accour~ts for about 85.98 per cent of the country's
rubber area and 94 per cent of the national production in India. The rubber
1 5 . Government of India, Ei:or~omic Survey (New Delhi, 1995) p. 48.
16. UPASI, 1997.
17. Ibid.

manufacturing industry in the state accounts for only 15 per cent of the natural
rubber production in era la.''
4.11.1 Area
There has been a striking increase in the area under rubber in Kerala
having gone up from 78,457 hectares in 1955-'56 to about 4,43,300 hectares in
1995-'96. It is worth mentioning that 85.98 per cent of the country's area
expansion during the above period has taken place in ~ e r a 1 a . l ~
Rubber production between 1955-'56 to 1995-'96 registered a
remarkable annual growth rate of over 15 per cent which is the highest
compared to the other agricultural crops in the country. Rubber production in
Kerala in 1995-'96 is 4,76,495 tonnes which is over 20 times that of 1960.
It was 23,175 tonnes in 1960.
4.1 1.3 Productivity
Apart &om area expansion, the improvement in productivity per hectare
has also contributed significantly to the increase in production. Rubber has I
registered the highest rate of growth in productivity among all the agricultural
crops in the country.
18. Land Resources of Kerala Sttrte, op cit., 1996, p. 149.
19. The Planrers ' Chronicle, op cit., June 1997, p. 128.
20. Ibid.

4.11.4 Structure of Rubber Plantations
Though rubber cultivation was mainly in the large grower sector
(20 hectares and above) in the initial stage, later small growers entered this
field and the area under them exceeded the area of estates. At present,
90 per cent of the area and 85 per cent of the production are accounted for the
small holders. Now there are about 8,00,000 small holdings." In Kerala,
rubber is mainly cultivated in Kottayam district.
4.12 Cardamom
Kerala has the largest stake in cardamom, as in the case of rubber.
Cardamom (small) is grown i n the three Southern States of Kerala, Karnataka
and Tamil Nadu. Presently there are 40,530 growers and the total area under
the crop is about 81,000 hectares." Small holdings up to 8 hectares account for -
98 per cent of the holdings covering 62 per cent of the area.
4.12.1 Area
In Kerala, area under cardamom is 43,320 hectares in 1995-'96. Kerala
accounts for about 52 per cent of the area under small cardamom in India.23
4.12.2 Production
Among the plantation crops, cardamom production is greatly influenced I
by climatic conditions and is also most susceptive to attack by pests and
21. Ibid., p. 5 .
22. Planfers' Directory, op cit., p. 7 .
23. E;cotiomic Review, op. cil., p. 47.
diseases. Kerala accounts for 66 per cent of the country's total productio~l of
cardamom, which is 4,185 tonnes in 1995-'96.
4.12.3 Productivity
The plant being highly susceptible to weather and diseases, yield has
been at a relatively low level of 80 kghectare in comparison to the yield level
of 250 kghectare of the principal competitor, Guatemala. Thanks to the new
varieties identified and propagated through biotechnology, the crop has
registered substantial improvement in productivity in recent years. The average
productivity which was hovering around 80 kghectare during the last two
decades has nearly doubled during the last two years.24
4.12.4 Structure of Cardamom Plantations
Small growers dominate the cardamom plantations. Cardamom has
among the plantation crops, lowest economic life requiring more frequent
replanting. In Kerala, cardamom is mainly cultivated in Idukki district.
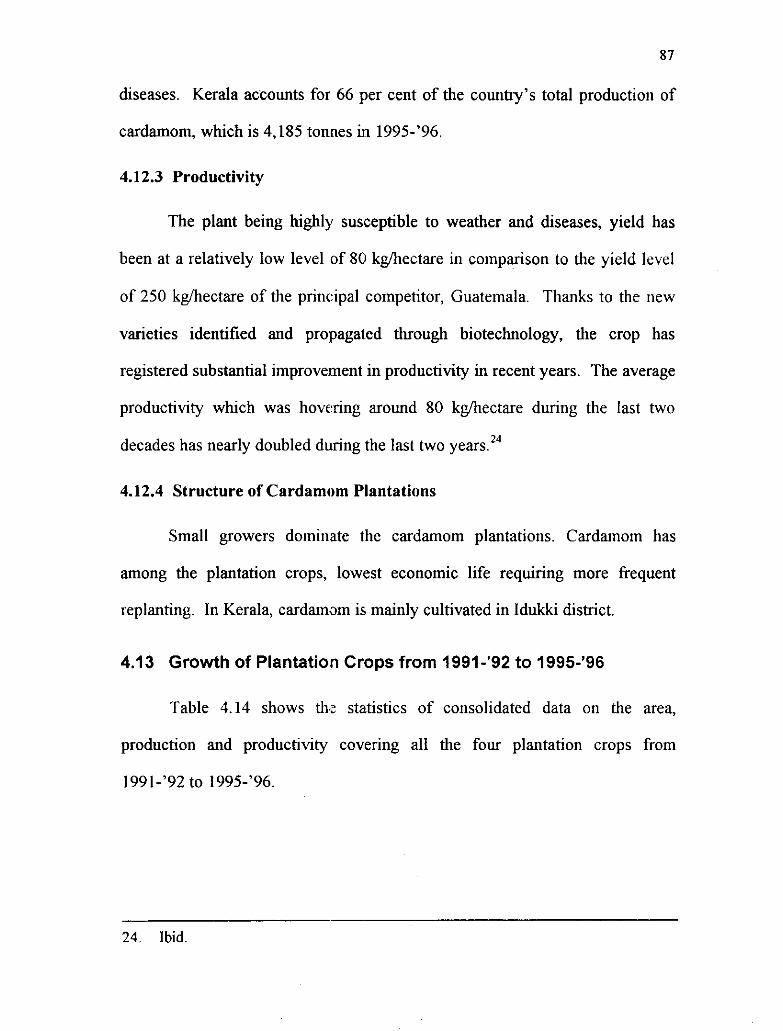
4.13 Growth of Plantation Crops from 1991-'92 to 1995-'96
Table 4.14 shows the statistics of consolidated data on the area,
production and productivity covering all the four plantation crops from
1991-'92 to 1995'96.
24. Ibid.

Table 4.14
Plantation Crops-Area, Production, Productivity (1991-'92 to 1995'96)
199 1-92 1992-93 1993-94 1994-95 1995-96
Kerala Ind~a Kerala India Kerala India Kerala Inda Kerala Ind~a
Area (Hectares)
Tea 34,708 4,20,500 34,488 4,22,592 34,624 4,22,432 34,656 4,24,469 34,656 4,30,888
Rubber 4,19,174 4,88,514 4,28,864 4,99,374 4,37,138 5,08,420 4,43,300 5,15,572 4,43,300 5,15,572
Cardamom 44,008 81,113 43,386 81,113 43,456 81,113 43,320 81,113 43,320 81,113
Production (TOM~SS)
Tea 66,803 7,54,192 54,435 7,03,93 1 66,691 7,58,063 65,141 7,43,780 64,794 7,49,888
Coffee 30,960 1,80,000 36,170 1,61,500 43,472 2,08,000 39,000 1,80,000 40,400 2,00,000
Rubber 3,43,109 3,66,745 3,68,648 3,93,490 4,08,311 4,35,160 4,42,830 4,71,815 4,76,495 5,06,910
Cardamom 3,460 5,000 2,424 3,000 4,430 6,600 4.43 1 7,000 4,185 6,338
Productivitv (Kd3a. l
Tea 1,925 1,794 1,578 1,666 1,926 1,795 1,880 1,752 1,780 1,750
Coffee 466 80 1 43 1 597 655 936 589 788 595 922
Rubber 1,139 1,130 1,203 1,154 1,304 1,285 1,389 1,362 990 912
Cardamom 79 62 56 37 136 108- 145 113 155 120 Source: Computed from
(a) Farm Guide, Government of India, 1996. (b) UPASI, Coonoor (c) Rubber Board, Kottayam.
89
Of the four, plantation area under rubber has marked an increase from
4,19,174 hectares in 1991-'92 to 4,43,300 hectares in 1995-'96 resulting in
5.76 per cent. Area under tea has declined by 0.15 per cent during the sane
period as there was a decline from 34,708 hectares in 1991-'92 to 34,656
hectares in 1995'96. Coffee also showed a 2 per cent decline in area between
1991-'92 and 1995-'96 as the decline in area was firom 84,016 hectares to
82,348 hectares during this period. Area under cardamom is also showing a
declining trend. In 1991-92 the area under cardamom was 44,008 hectares. But
in 1995-'96 it has declined to 43,320 hectares leading to 1.6 per cent decline.
In the production front also rubber has marked a spectacular increase of
38.9 per cent during the period 1991-'92 to 1995-'96. Coffee and cardamom
production have also increased by 30.5 per cent and 21 per cent respectively
during the same period. But production of tea declined from 66,803 tonnes in
1991-'92 to 64,794 tonnes in 1995-'96 resulting in 3 per cent decline. I
Cardamom has showed a marked increase in productivity, i.e.,
96 per cent during the same period. Productivity of coffee also has increased
by 27.7%. Productivity of rubber and tea has declined by 13 per cent and
7.5 per cent respectively during the five year period 1991-'92 to 1995-'96.
4.14 Plantation Crops in the Different Districts of Kerala
The largest area under tea plantations are in Idukki, followed by
Wayanad and Kottayam. Figure 4.14 shows this. Coffee is concentrated in
Wayanad, other major coffee growing districts being Idukki and Palakkad.
Refer FigLre 4.15 for the details. Kottayam has the lion's share of rubber
plantations in Kerala, followed by Pathanamthitta, Ernakulam and Idukki. Area
under rubber in these districts are shown in Figure 4 16. Idukki has the largest
area under cardamom followed by Wayanad, Palakkad and Kozhikode districts.
Figure 4.17 gives the area in these districts.

Figure 4.14 Major Tea Plaiztation Districts of Kerala (1995- '96) (Area in hectares)
ldukki wayanad Kottayam .m Kollam
Source: Table 2.3.

Figure 4.15 Major Coffee PIarztation Districts of Kerala (1995-'96) (Area in hectares)
wayanad ldukki 1 Palakkad
Source: Table 2.3

Figure 4.16 Major Rubber Plantation Districfi of Kerala (1995- 96) (Area in hectares)
Kottayam ldukki Ernakulam Pathanamthitta
Source Table 2 3

Figure 4.17 Major Cardamom l'lantation Districts of Kerala (1995- '96) (Area in hectares)
wayanad ldukki Palakkad . Kozhikode .
Source: Table 2.3

4.15 Women Workers in the Pla,ntation Sector
The plantation sect(,, eniplol/s a large number of women. This sector
provides significant emplo.:ment opportunities to about 1.25 lakh wornen
workers.
Table 4.15 shows ,!le percmtage of female labour to total labour
employed in these four crops.
Table 4.15
Employment of Women in Plantations (1995-'96)
Plantation No: of women ~~~~l labourers Percentage of female worker:; - labour to total labour
Tea 47.009 83,945 56
Coffee 11,217 24,385 46
Rubber 57,500 2,30,000 25
Cardamom 7,260 22,000 3 3
Source: UPASI, Coonoor
The table shows clearly that women workers constitute 56 per cent of
the total labour force in tea plantatiola. Women workers in coffee plantations
accounts to 46 per cent of total employment. Cardamom plantations occupy
the third position in female eniplqyment with 33 percentage. Twenty-five
per cent of the labour in rubber plantations are females. The employment of
women in the four plantations is shown in Figure 4.18.
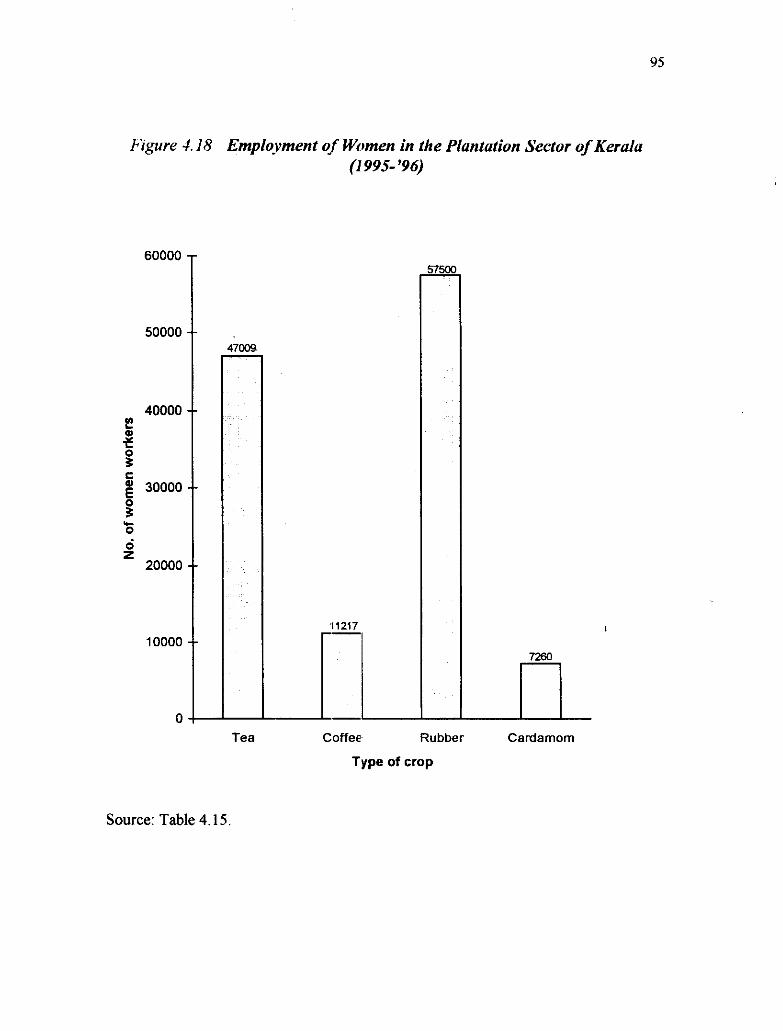
Figure -1.18 Employment of Women in the Plantation Sector of Keralu (1 995-'96)
Tea Coffee Rubber Cardamom
Type of crop
Source: Table 4.15.
4.16 Plantation Labour Compared t o Other Agricultural Labour
Plantation labour, unlike other industries, is open air work and is a
special kind of agricultural employnent. It is for this reason, obviously that
women are employed in large numbers in the estates than in factories. The
work is unskilled and women from villages are far more used to this form of
employment than working as skilled hands in other industries.
A peculiar feature of plantation labour, especially those in tea, coffee
and cardamom is that plantation labour is recruited on a family basis from
distant villages as most of the estates are situated in remote places of high
altitudes where workers are not easily available. As a settled labour force is
essential, whole families are usuall!~ employed. As wages are lower than in
other agncultural jobs, every memb8:r of the family seeks work for economic
reasons. Women are also paid less than men and are therefore employed in
large numbers.
A distinguishing feature of plantations workers, compared to other
agncultural workers, is that they earn a regular income to support the family.
They are one of the most organrsed labour force of the economy Moreover,
the mechanisation of the worlts ill plantations do not pause a threat of
unemployment to these women workers, as the scope of mechanisation is
limited in our state. The socio-economic background of the plantation workers
also differ from their counterparts m other crops. They are from different
social, racial and cultural groups, each following their own entity.

The most important job on a tea estate is plucking of tea leaves. The
harvesting of tea leaves from the bushes in plantation goes by the name of
plucking. This is done by careful1.y snapping off the tender shoot between the
thumb and first fmger. Basically, the harvest is of a bud and the two tender
leaves below it because this is where the highest concenhation of flavour
producing chemical is The timing of plucking operation has therefore to be
geared to the rate of growth of the new shoots, which of course varies fiom
season to season. Plucking, although an apparently simple job, requires a
certain degree of skill and great attention.
Two-thirds of the total number of labour-days in tea plantations are
ordinarily devoted to plucking,. Women are usually employed in plucking tea
leaves, because they are considered cleverer than men in this job. In fact, the
plucking of tea leaves is the exclusive occupation of women because a skilled
leaf picker is usually a wcrmar., needing little supervision in her work. I
Moreover, some facts stand out which favours the employment of women.
Women are obviously more isteatly workers and they are also more regular.
The maternal instinct also seems to be exploited. For the sake of keeping their
children fed, they are less likely to risk their jobs by absenteeism.
Again by making the wifr: a permanent worker, her husband is kept
permanently available for work as and when there is demand. The children can
also be drawn upon for cheap labour.
The data on the total num1)er of persons employed in the tea estates in
Kerala and Tamil Nadu show that women workers outnumber men. Women

are also employed in weeding and replanting. A few women are given job in
the factories also.
In coffee plantations, plucking of coffee bemes is a job where women
are preferred to men. They are also employed in kmvath, planting, weeding and
separating seeds. Manuring is also (lone by women workers.
In cardamom plantations. collection of ripe cardamom seeds, separating
the stalks of the seeds, weeding and replanting are the female jobs.
The major job undertaken by women in rubber plantations is collection
of field latex from the rubber trees. They also assist the men in tapping the
trees. They have a complementary role in rubber estates.
4.17 Recruitment System
During the pre-independent period, recruitment in the plantations of
South India was through the intermediaries called kangan~s, who were
themselves erstwhile workers in the gardens. Because of their contacts or
ability to work or get work done, they were engaged to bring labour for whlch
they recelved a cornmisslon from the workers they brought. A distindt feature
of recruitment was that the unit of recruitment was the family and not the
individual.
Though the system of recruitn~ent through kanganis was abolished and
lost its importance during the post-independent period, it still continues in
certain estates. Many estates have settled labour of a generation or more, and
on that account, local labour is avail;xble for recruitment. A large number of

workers are employed as casual labour or through contractors. As permanent
workers usually reside on the estates, they are in a position to introduce their
unemployed relatives whenever vac:ancies occur. Those who have worked as
casual labourers are given preference in recruitment as permanent workers.
Trade unions and their leaders have a say in recruiting new labourers.