Embed Size (px)
Citation preview

Relevant • Independent • Objectivewww.ceri.ca1
Economic Impacts of Low Crude Prices on the Canadian Economy
Canadian Energy Research Institute
Dinara MillingtonCanadian Energy Research Institute
Ryder Scott Canada Reserves ConferenceMay 10, 2016
Relevant • Independent • Objectivewww.ceri.ca2
Canadian Energy Research Institute
Founded in 1975, the Canadian Energy Research Institute (CERI) is an independent, non-profit research institute specializing in the analysis of energy economics and relatedenvironmental policy issues in the energy production, transportation, and consumptionsectors.
Our mission is to provide relevant, independent, and objective economic research ofenergy and environmental issues to benefit business, government, academia and thepublic.
Our core supporters include the Canadian Government (Natural Resources Canada), theGovernment of Alberta (Alberta Energy), and the Canadian Association of PetroleumProducers (CAPP), Chemistry Industry Association of Canada (CIAC), Alberta’s IndustrialHeartland Association (AIHA), and the University of Calgary. In-kind support is alsoprovided by the Alberta Energy Regulator (AER) and Petroleum Services Association ofCanada (PSAC).
All of CERI’s research is placed in the public domain and can be accessed via our websiteat www.ceri.ca .

Relevant • Independent • Objectivewww.ceri.ca3
Agenda
CERI’s Study 156: “Low Crude Oil Prices and Their Impact on the Canadian Economy”:
• Background• Modelling Methodology• Assumptions• Results on National Level• Results for Selected Provinces• Conclusions

Relevant • Independent • Objectivewww.ceri.ca4
Background: Crude Oil Prices (Jan’13 – Mar’16)
$0
$20
$40
$60
$80
$100
$120
$140
US$
/bbl
Cushing, OK WTI Spot Price FOB (US$/bbl)
Europe Brent Spot Price FOB (US$/bbl)
Source: EIA

Relevant • Independent • Objectivewww.ceri.ca5
Modelling Methodology: I/O Model
CERI’s Canada Multi-Regional Input/Output Model (UCMRIO 3.0):
• Addresses the way economic circumstances in one part of an economy can ripple through the rest of it;
• Determines an approximate impact on various economic variables due to the introduction to the economy of a particular set of expenditures or ‘shocks’;
• Models any activity that leads to increased production capacity in an economy: the construction or development of the capacity, and the operation of the capacity to generate outputs.

Relevant • Independent • Objectivewww.ceri.ca6
Modelling Methodology: Scenarios
• Investment:• Reference Case Capital Investment in oil sands
• Operations:• Oil Sands Revenues (Reference Case price and production)
Reference Case
• Investment:• Low Case Capital Investment in oil sands
• Operations:• Oil Sands Revenues (Low Case price and production)• Change in non-energy exports*
Low Case
*Incremental change in non-energy exports as a result of a low exchange rate will only transpire on the operations side of the aforementioned economic sectors. In other words, no capital investment assumption is made to build production capacity in thosefive economic sectors in the 7-year time period.

Relevant • Independent • Objectivewww.ceri.ca7
Assumptions for Two Scenarios

Relevant • Independent • Objectivewww.ceri.ca8
Assumptions for Two Scenarios: Oil Prices
$53.25
$67.58 $69.94 $69.44 $70.43 $71.36 $72.88 $87.63
$102.15 $98.88 $100.36 $93.26
$46.26 $45.94 $46.14 $46.84 $48.61 $50.32 $51.52
$-
$20.00
$40.00
$60.00
$80.00
$100.00
$120.00
2010 2011 2012 2013 2014 2015 2016 2017 2018 2019 2020 2021
2014
US$
/bb
l
EIA_AEO Ref.Case EIA_AEO Low Case
Source: EIA

Relevant • Independent • Objectivewww.ceri.ca9
Assumptions for Two Scenarios: Oil Sands Production and Capital Investment
2,027 2,078 2,255
2,398 2,602
2,746 2,942
1,338 1,470
1,621 1,752
1,976 2,074 2,230
2,478 2,651
2,801 3,008
3,138
-
500
1,000
1,500
2,000
2,500
3,000
3,500
2010 2011 2012 2013 2014 2015 2016 2017 2018 2019 2020 2021
('000
b/d
)
Net Bitumen and SCO to Market-Low Case Net Bitumen and SCO to Market-Ref Case
-
5,000
10,000
15,000
20,000
25,000
30,000
2015 2016 2017 2018 2019 2020 2021
(Mln
CDN
$)
Capital Investment-Ref Case Capital Investment-Low Case

Relevant • Independent • Objectivewww.ceri.ca10
Assumptions for Two Scenarios: Non-Energy Exports
$0
$5,000
$10,000
$15,000
$20,000
$25,000
$30,000
2015 2016 2017 2018 2019 2020 2021
(CDN
Mln
$)
Other balance of payments adjustments [C24] Special transactions trade [C23]
Consumer goods [C22] Aircraft and other transportation equipment and parts [C21]
Motor vehicles and parts [C19] Electronic and electrical equipment and parts [C18]
Industrial machinery, equipment and parts [C17] Basic and industrial chemical, plastic and rubber products [C15]
Metal and non-metallic mineral products [C14] Metal ores and non-metallic minerals [C13]
Non-Energy Exports in CDN$

Relevant • Independent • Objectivewww.ceri.ca11
Summary of Results: Total Impacts on Canadian Economy (Cumulative 2015-2021)
2015-2021 Unit of Measure Ref.Case Low Case Low vs. Ref.
Case % Change
GDP Growth Mln CDN$ 830,336 626,887 ($203,449) -24.5%
Compensation Mln CDN$ 384,578 297,680 ($86,898) -22.6%
EmploymentThousand person-years
4,109 3,298 (811) -19.7%
Federal Taxes Mln CDN$ 95,063 71,307 ($23,756) -25.0%
Provincial Taxes Mln CDN$ 58,543 45,457 ($13,087) -22.4%
Relevant • Independent • Objectivewww.ceri.ca12
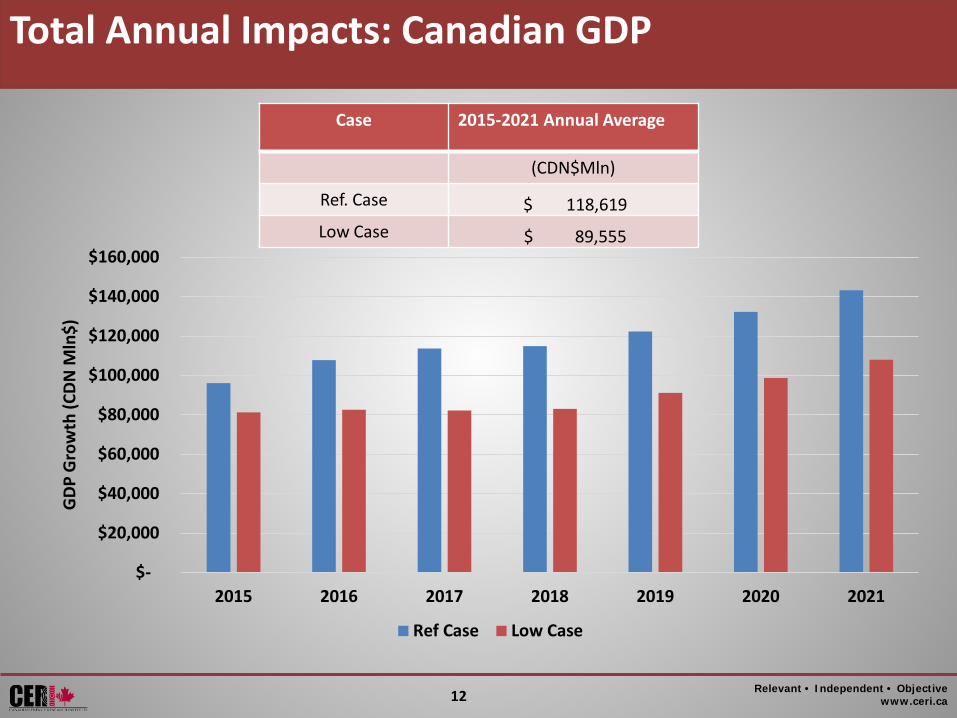
Total Annual Impacts: Canadian GDP
Case 2015-2021 Annual Average
(CDN$Mln)
Ref. Case $ 118,619 Low Case $ 89,555
$-
$20,000
$40,000
$60,000
$80,000
$100,000
$120,000
$140,000
$160,000
2015 2016 2017 2018 2019 2020 2021
GDP
Gro
wth
(CDN
Mln
$)
Ref Case Low Case
Relevant • Independent • Objectivewww.ceri.ca13
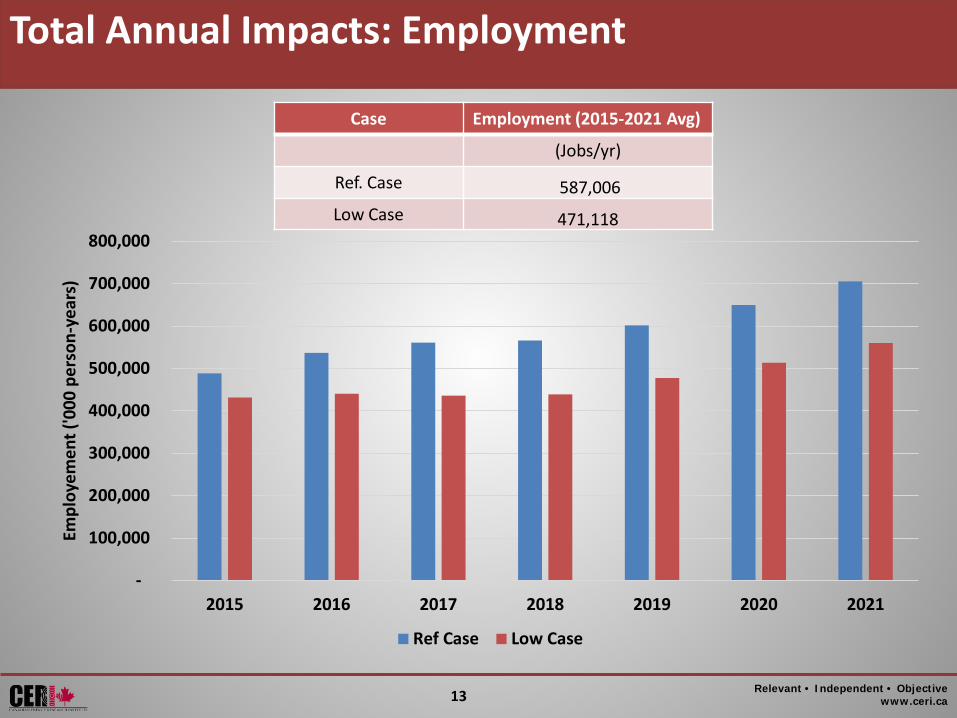
Total Annual Impacts: Employment
Case Employment (2015-2021 Avg)
(Jobs/yr)
Ref. Case 587,006 Low Case 471,118
-
100,000
200,000
300,000
400,000
500,000
600,000
700,000
800,000
2015 2016 2017 2018 2019 2020 2021
Empl
oyem
ent (
'000
per
son-
year
s)
Ref Case Low Case
Relevant • Independent • Objectivewww.ceri.ca14
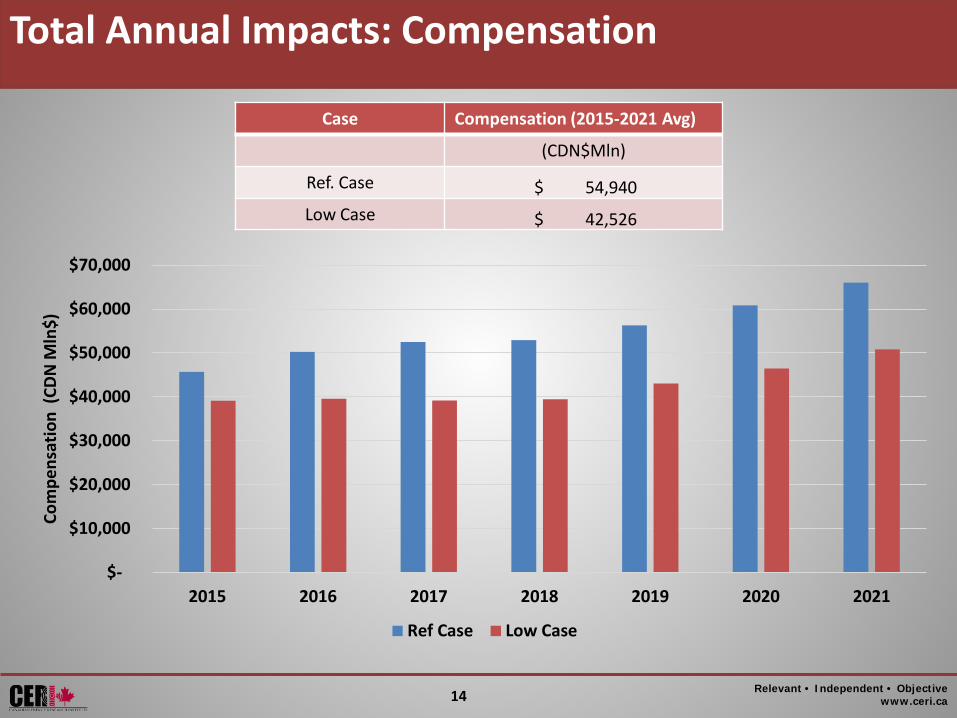
Total Annual Impacts: Compensation
Case Compensation (2015-2021 Avg)
(CDN$Mln)
Ref. Case $ 54,940 Low Case $ 42,526
$-
$10,000
$20,000
$30,000
$40,000
$50,000
$60,000
$70,000
2015 2016 2017 2018 2019 2020 2021
Com
pens
atio
n (C
DN M
ln$)
Ref Case Low Case
Relevant • Independent • Objectivewww.ceri.ca15
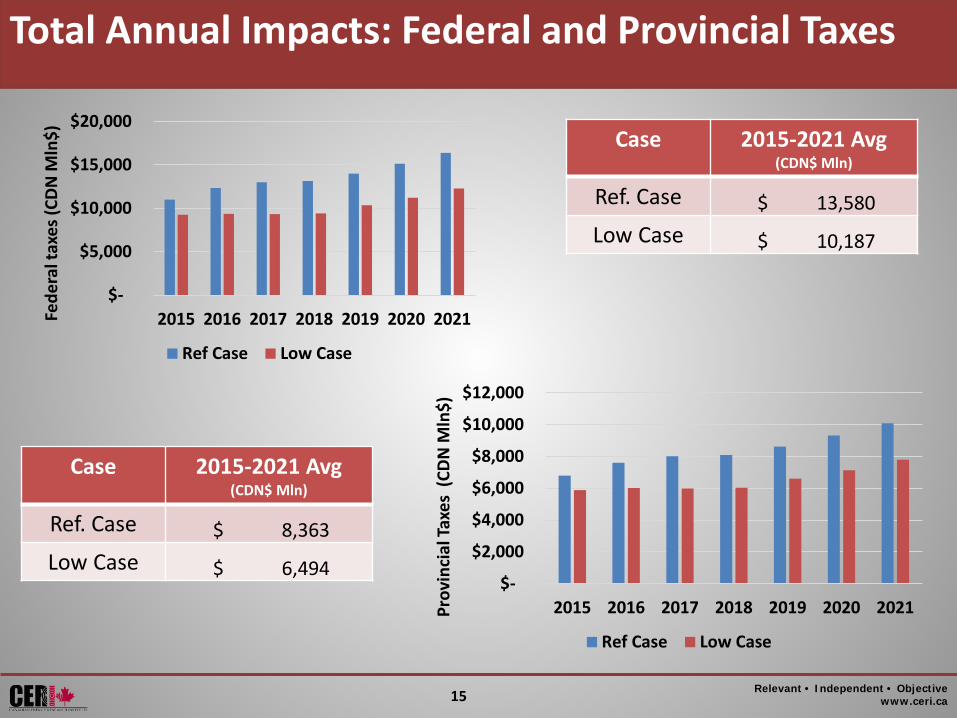
Total Annual Impacts: Federal and Provincial Taxes
Case 2015-2021 Avg (CDN$ Mln)
Ref. Case $ 13,580 Low Case $ 10,187
Case 2015-2021 Avg (CDN$ Mln)
Ref. Case $ 8,363 Low Case $ 6,494
$-
$5,000
$10,000
$15,000
$20,000
2015 2016 2017 2018 2019 2020 2021Fede
ral t
axes
(CD
N M
ln$)
Ref Case Low Case
$-
$2,000
$4,000
$6,000
$8,000
$10,000
$12,000
2015 2016 2017 2018 2019 2020 2021Prov
inci
al Ta
xes
(CDN
Mln
$)
Ref Case Low Case

Relevant • Independent • Objectivewww.ceri.ca16
Provincial Impacts for AB and ON
Rank Industry % Share of GDP
Ref Case Low Case % change
AB 1 Oil Sands 39.72% $ 331,018 $ 227,898 -31.2%
AB 2 Household 11.71% $ 97,582 $ 67,834 -30.5%
AB 3Finance, Insurance, Real
Estate and Rental and Leasing
7.89% $ 65,755 $ 46,115 -29.9%
AB 4 Conventional Oil 6.13% $ 51,080 $ 36,250 -29.0%
AB 5 Owner occupied dwellings 5.12% $ 42,675 $ 29,665 -30.5%
ON 1Finance, Insurance, Real
Estate and Rental and Leasing
23.22% $ 13,491 $ 16,083 19.2%
ON 2 Wholesale Trade 11.08% $ 3,310 $ 7,678 132.0%
ON 3 Household (Labour) 10.79% $ 5,407 $ 7,476 38.3%
ON 4 Other Manufacturing 10.16% $ 5,460 $ 7,037 28.9%
ON 5 Transportation &Warehousing 7.87% $ 2,893 $ 5,455 88.6%
Relevant • Independent • Objectivewww.ceri.ca17
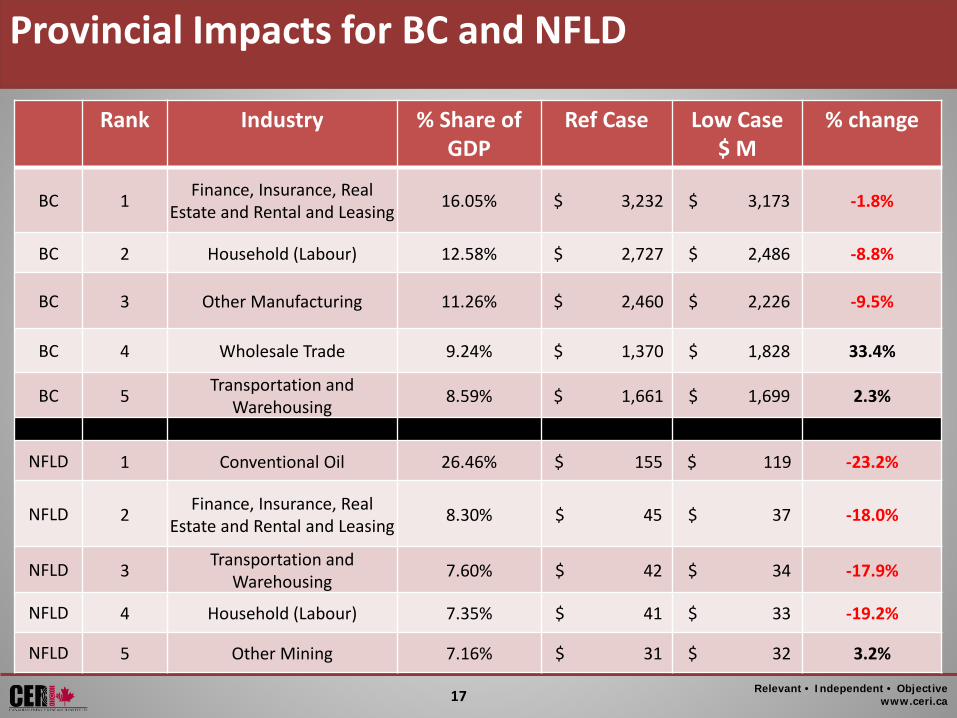
Provincial Impacts for BC and NFLD
Rank Industry % Share of GDP
Ref Case Low Case$ M
% change
BC 1 Finance, Insurance, Real Estate and Rental and Leasing 16.05% $ 3,232 $ 3,173 -1.8%
BC 2 Household (Labour) 12.58% $ 2,727 $ 2,486 -8.8%
BC 3 Other Manufacturing 11.26% $ 2,460 $ 2,226 -9.5%
BC 4 Wholesale Trade 9.24% $ 1,370 $ 1,828 33.4%
BC 5 Transportation and Warehousing 8.59% $ 1,661 $ 1,699 2.3%
NFLD 1 Conventional Oil 26.46% $ 155 $ 119 -23.2%
NFLD 2 Finance, Insurance, Real Estate and Rental and Leasing 8.30% $ 45 $ 37 -18.0%
NFLD 3 Transportation and Warehousing 7.60% $ 42 $ 34 -17.9%
NFLD 4 Household (Labour) 7.35% $ 41 $ 33 -19.2%
NFLD 5 Other Mining 7.16% $ 31 $ 32 3.2%

Relevant • Independent • Objectivewww.ceri.ca18
Conclusions
• Low oil prices are influenced by low economic growth in Asia, Europe and North America. They are also influenced by increased oil production efficiency and high amounts of supply. The low oil price environment is expected to continue for several years.
• As a net oil exporter, Canada is and will be affected by the lower prices, operating through several channels.
• Stronger US growth and a weaker Canadian dollar have boosted non-energy exports. Investment spending and job creation have also begun to pick up in non-energy sectors, although significant slack remains in the labour market.
• Overall, Canadian economic growth could contract by an average of 23 percent if low oil prices persist over the next seven years.
In summary, for the duration of the forecasted time horizon (2015-2021), every dollar gain in the annualized price of WTI, would increase national Canadian GDP by $1.7 billion on average.
Relevant • Independent • Objectivewww.ceri.ca19
Thank you!
www.ceri.ca