Embed Size (px)
Citation preview

2014-2015
Economic Impacts & Contributions to the U.S. Economy
PREPARED BY:
COMMISSIONED BY:

Authors
Center for Economic Business Research
Dr. Hart Hodges, PhD., Supervisor
James McCafferty, Supervisor
Yubin (Lee) Li
Joshua Grandbounche

Table of Contents
Executive Summary ...................................................................................................................................... ii
National Level Estimates ........................................................................................................................... ii
State and Congressional District Level Estimates .................................................................................... vi
Introduction .................................................................................................................................................. 1
Previous Studies ........................................................................................................................................... 7
Data and Methodology ................................................................................................................................ 9
EB-5 Investments through Regional Centers ............................................................................................ 9
EB-5 Investors Household Spending ....................................................................................................... 19
Other EB-5 Immigration Spending .......................................................................................................... 23
Economic Impact Results ........................................................................................................................... 30
All Related Spending by EB-5 Regional Center Investors ........................................................................ 30
EB-5 Investments through Regional Centers .......................................................................................... 34
EB-5 Investors Household Spending ....................................................................................................... 42
Other EB-5 Immigration Spending .......................................................................................................... 47
Discussions.................................................................................................................................................. 49
Economic Contributions of EB-5 Regional Center Projects Full Capital Stack ........................................ 49
Investments through Stand-Alone Direct EB-5 Projects ......................................................................... 52
Conclusion .................................................................................................................................................. 53
Bibliography................................................................................................................................................ 55
About the Authors ...................................................................................................................................... 57
Appendix ..................................................................................................................................................... 58
Appendix 1: Additional Tables ................................................................................................................ 58
Appendix 2: Congressional district weighting for household spending ................................................. 64

i | Quantitative Assessment of the EB-5 Program

Quantitative Assessment of the EB-5 Program | ii
Quantitative Assessment of the EB-5 Program: Economic Impacts and
Contributions to the U.S. Economy, 2014 & 2015
Executive Summary
Congress created the EB-5 Regional Center Program in 1992 with the goal of promoting regional
economic development through job creation and capital investment. Since the great recession in 2008,
capital investment by EB-5 investors has become an increasingly important source of funding for a
variety of economic development projects in the U.S. Although the demands for the EB-5 immigrant
visas, measured by the petitions filed by EB-5 investors, have grown over 1,000 percent from 2008 to
2015, there is not updated research to assess the economic impacts and contributions that the EB-5
Program has introduced to the U.S. economic since FY2013.
Using data from multiple sources, we developed a method to select EB-5 Regional Center projects that
were active in 2014 and 2015, and also to estimate EB-5 capital investment made through Regional
Centers over the two-year period. In addition, we assessed the related spending by EB-5 investors
throughout the immigration process in order to measure the full ripple impacts that the EB-5 Program
has generated in 2014 and 2015.
Based on our analyses, the total economic impacts and contributions – including direct, indirect, and
induced economic outputs – associated with the EB-5 Regional Center Program were as follows:
National Level Estimates • An estimate of $11.23 billion in capital investment was invested in 355 EB-5 Regional Center
projects that were active in 2014 and 2015, representing approximately of 2 percent of all
foreign direct investment (FDI) net flows to U.S. economy1 over that two-year period.
• $7.7 billion, or 69 percent, of the EB-5 capital investment made through Regional Centers in
2014 and 2015 was invested in construction-related industries. The top non-construction
industries with the highest amount of EB-5 investment over the two-year period include: hotels
1 According to World Bank, the total amount of FDI net inflows to U.S. in 2014 and 2015 was $743.82 billion. See additional information on World Bank’s website, https://data.worldbank.org/indicator/BX.KLT.DINV.CD.WD?locations=US (accessed on November 7, 2017)

iii | Quantitative Assessment of the EB-5 Program
and motels, real estate, wholesale trade, architectural engineering related services, elementary
and secondary schools, and full services restaurants (see Figure 5).
• The data indicate that EB-5 investment alone that was processed through Regional Centers in
2014 and 2015 supported more than 184,700 jobs for U.S. workers (see Table 14); while the
data on all related immigration spending by EB-5 Regional Center investors (including required
investment spending, household spending, and other related immigration expenses) indicate
that such spending supported approximately 207,000 American jobs (see Table 12),
representing roughly 4 percent of the all private sectors job growth in U.S. over the two-year
period.
• Spending associated with EB-5 Regional Center investors in 2014 and 2015is estimated to have
contributed over $33 billion to U.S. GDP and more than $4 billion to total tax revenues for
federal, state, and local governments (see Table 12).
• An estimated $2.7 billion in federal tax revenue was contributed by the spending associated
with EB-5 Regional Center investors in 2014 and 2015, an equivalent of over 630 percent of all
funding that the federal government has appropriated for local economic development
programs through U.S. Department of Commerce’s Economic Development Administration
(EDA).
• More than 54,000 American jobs in construction industry are estimated to have been created by
the spending associated with the EB-5 Regional Center Program in 2014 and 2015, accounting
for roughly 9 percent of construction job growth in the U.S. economy over that two-year period
(see Table 13).

Quantitative Assessment of the EB-5 Program | iv
Sorted by employment impacts
IndustryExpected
Job Creation*Expected Contribution to U.S.
GDP (in $million)Construction 54,079 $8,009.72Hospitality 23,305 $1,770.81Retail 21,824 $2,936.05Healthcare 20,558 $1,803.58Professional Services 20,355 $2,274.60Manufacturing 13,334 $5,838.87Real Estate 8,129 $2,854.75Finance 7,863 $1,937.31Others 7,861 $1,055.14Education 6,274 $412.13Transportation 6,010 $1,003.61Art & Sports 5,574 $449.61Enginerring 4,127 $676.11Agriculture 2,558 $297.44Communication 2,314 $1,143.78Mining 1,217 $363.25Technology 795 $130.67Energy 500 $605.08Total 206,676 $33,562.50
Table 13: Economic Impact of All EB-5 Related Spending* (Regional Center Projects Only) by Industry, 2014 and 2015
Data Source: Form I-924A (Regional Center Annual Reporting to USCIS), 2013-2015; IIUSA Regional Center Database
* Note: The results include economic impacts associated with EB-5 investment through Regional Centers, investor's household spending, and other immigration expenses.
All EB-5 Immigration Related Spending = $12.505 billion
ImpactDirect Effect
(No. of U.S. Jobs)Indirect Effect
(No. of U.S. Jobs)Induced Effect
(No. of U.S. Jobs)Total Effect
(No. of U.S. Jobs)
Employment 67,076 69,024 70,577 206,676
ImpactDirect Effect($ Billions)
Indirect Effect($ Billions)
Induced Effect($ Billions)
Total Effect($ Billions)
Contribution to GDP $9.56 $12.32 $11.68 $33.56
Tax Revenues $1.08 $1.53 $1.53 $4.14
Federal $0.79 $0.96 $0.93 $2.68
State & Local $0.29 $0.57 $0.60 $1.46
Data Source: IIUSA FOIA of USCIS Form I-924A (Regional Center Annual Reporting to USCIS), 2013-2015; IIUSA Regional Center Database
* Note: The results include economic impacts associated with EB-5 investment through Regional Centers, investor's household spending, and other immigration expenses.
Table 12: Economic Impacts of All EB-5 Related Spending* (Regional Center Projects Only), 2014 and 2015

v | Quantitative Assessment of the EB-5 Program
Data Source: IIUSA FOIA of USCIS Form I-924A (Regional Center Annual Reporting to USCIS), 2013-2015; IIUSA Regional Center Database
Hotels and motels, including casino hotels,
$769
Real estate, $404
Wholesale trade, $332
Architectural, engineering, and related services, $296
Elementary and secondary schools,
$221
Full-service restaurants, $218
Amusement parks and arcades,
$170
Offices of physicians, $138
Nursing and community care facilities,
$115
Fabricated structural metal manufacturing,
$95
Other non construction related sectors,
$732
Figure 5. Estimated EB-5 Investment in Non-Construction Related Sectors, 2014 and 2015
Total estimated EB-5 investment in 2014 and
2015 is $11.23 billion. $7.7 billion (or 69%) was
introduced to construction sectors; while $3.5 billion (or 31%) was invested in non construction sectors
EB-5 capital investment into Regional Center projects = $11.23 billion
ImpactDirect Effect
(No. of U.S. Jobs)Indirect Effect
(No. of U.S. Jobs)Induced Effect
(No. of U.S. Jobs)Total Effect
(No. of U.S. Jobs)
Employment 60,580 61,314 62,828 184,723
ImpactDirect Effect($ Billions)
Indirect Effect($ Billions)
Induced Effect($ Billions)
Total Effect($ Billions)
Contribution to GDP $8.61 $10.78 $10.40 $29.79
Tax Revenues $0.94 $1.36 $1.36 $3.66
Federal $0.71 $0.84 $0.82 $2.37
State & Local $0.24 $0.52 $0.53 $1.28
Data Source: IIUSA FOIA of USCIS Form I-924A (Regional Center Annual Reporting to USCIS), 2013-2015; IIUSA Regional Center Database
Table 14: Economic Impacts of EB-5 Capital Investment Alone (Regional Center Projects Only), 2014 and 2015

Quantitative Assessment of the EB-5 Program | vi
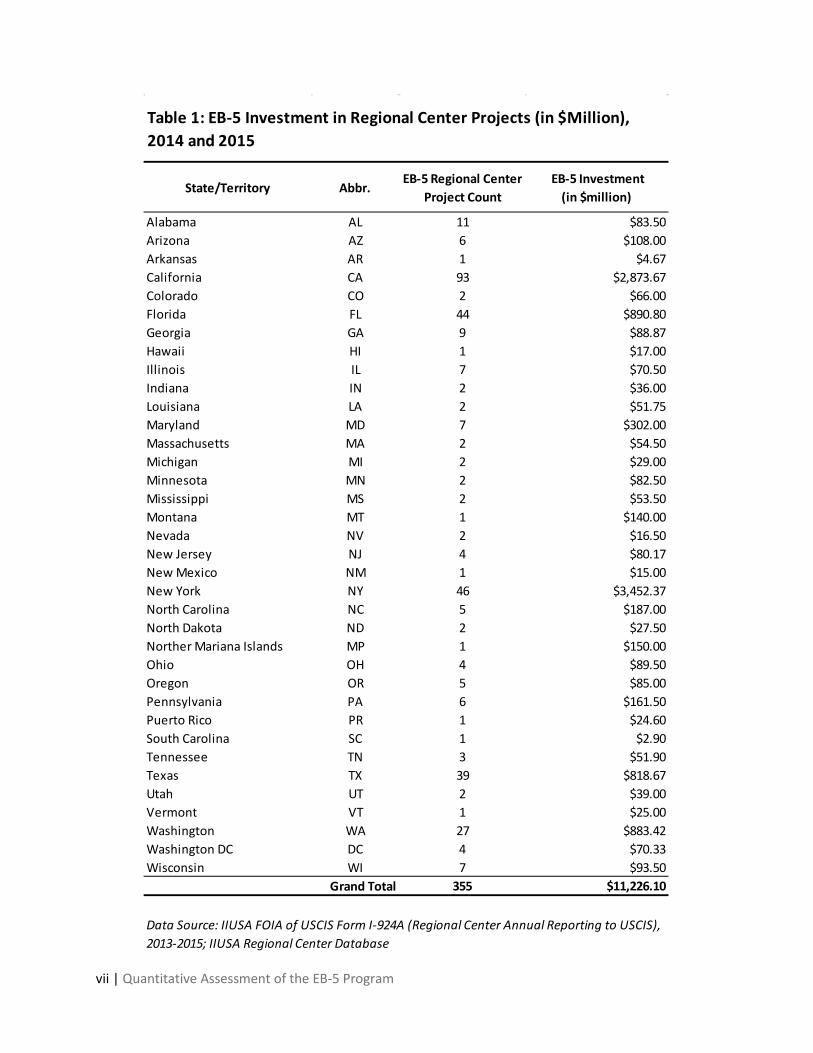
State and Congressional District Level Estimates2 • The five states with the highest amount of EB-5 investment in Regional Centers during 2014 and
2015 were New York ($3.45 billion), California ($2.87 billion), Florida ($890 million), Washington
($883 million), and Texas ($819 million), accounting for a total of $8.92 billion (or approximately
80 percent of total estimated EB-5 investment) in the two-year period (see Table 1).
• Given the distribution of the EB-5 investment that was made through Regional Centers in 2014
and 2015, the largest number of expected job creation associated with EB-5 investment
spending was in California (estimated 53,223 jobs), New York (48,231 jobs), Florida (20,261
jobs), Washington (14,708 jobs), and Texas (14,310 jobs) (see Map 1).
• EB-5 investment through Regional Centers over 2014 and 2015 was distributed in a total of 156
congressional districts in all 50 states and the District of Columbia. In particular, over 127,000
employment opportunities were expected to be created for U.S. workers in the top 30
congressional districts during the two-year period (see Table 17).
2 The impacts at state and congressional levels are associated with the investment spending by Regional Center projects alone, the impacts generated by the household spending and other related immigration expenses are not included at the results within this section.
vii | Quantitative Assessment of the EB-5 Program
State/Territory Abbr.EB-5 Regional Center
Project Count EB-5 Investment
(in $million)
Alabama AL 11 $83.50Arizona AZ 6 $108.00Arkansas AR 1 $4.67California CA 93 $2,873.67Colorado CO 2 $66.00Florida FL 44 $890.80Georgia GA 9 $88.87Hawaii HI 1 $17.00Illinois IL 7 $70.50Indiana IN 2 $36.00Louisiana LA 2 $51.75Maryland MD 7 $302.00Massachusetts MA 2 $54.50Michigan MI 2 $29.00Minnesota MN 2 $82.50Mississippi MS 2 $53.50Montana MT 1 $140.00Nevada NV 2 $16.50New Jersey NJ 4 $80.17New Mexico NM 1 $15.00New York NY 46 $3,452.37North Carolina NC 5 $187.00North Dakota ND 2 $27.50Norther Mariana Islands MP 1 $150.00Ohio OH 4 $89.50Oregon OR 5 $85.00Pennsylvania PA 6 $161.50Puerto Rico PR 1 $24.60South Carolina SC 1 $2.90Tennessee TN 3 $51.90Texas TX 39 $818.67Utah UT 2 $39.00Vermont VT 1 $25.00Washington WA 27 $883.42Washington DC DC 4 $70.33Wisconsin WI 7 $93.50
355 $11,226.10Grand Total
Table 1: EB-5 Investment in Regional Center Projects (in $Million), 2014 and 2015
Data Source: IIUSA FOIA of USCIS Form I-924A (Regional Center Annual Reporting to USCIS), 2013-2015; IIUSA Regional Center Database

Quantitative Assessment of the EB-5 Program | viii
Map 1: Estim
ated Jobs Supported by EB-5 Investment through Regional Centers, 2014 and 2015
Top Five States California -----------
52,223 N
ew York -----------
48,231 Florida
----------- 20,261
Washington ---------
14,708 Texas
----------- 14,310

ix | Quantitative Assessment of the EB-5 Program
Sacled based on the economic impact outputs from the national model
Congressional District
EB-5 Investment (in $million)
Jobs Supported Contribution to
U.S. GDP (in $million)
Contribution to Federal Tax Revenue
(in $million)
Contribution to State & Local Tax Revenue
(in $million)
NY10 $1,663.00 18,956 $4,486.27 $336.04 $190.24NY12 $1,180.20 12,570 $3,156.47 $228.14 $125.56WA7 $595.00 11,796 $1,797.27 $172.24 $71.78CA34 $548.00 10,094 $1,530.08 $108.97 $66.38CA37 $520.00 9,456 $1,511.56 $113.14 $57.66CA28 $273.00 6,562 $791.70 $69.72 $37.36TX24 $264.90 4,859 $838.31 $64.98 $18.70MD8 $234.00 4,408 $722.76 $63.33 $29.46CA12 $313.70 4,216 $837.23 $67.30 $29.48NY11 $170.00 3,505 $250.88 $19.83 $44.73MT0 $140.00 3,385 $479.41 $35.22 $14.27TX30 $163.00 2,987 $522.35 $43.02 $11.82NY14 $110.00 2,882 $282.55 $22.73 $24.79CA33 $150.00 2,760 $436.43 $41.29 $18.17WA9 $178.90 2,706 $506.22 $38.98 $33.94NC1 $117.00 2,662 $349.89 $23.84 $10.70CA21 $78.30 2,000 $214.08 $17.88 $31.45CA41 $98.00 1,987 $304.76 $22.78 $12.31CA35 $92.00 1,889 $283.08 $26.22 $11.61TX23 $97.00 1,744 $252.88 $18.29 $9.40OH11 $86.00 1,737 $230.72 $15.51 $7.67CA32 $98.20 1,674 $267.20 $23.48 $12.20WI4 $72.00 1,658 $165.01 $12.12 $8.86NY4 $90.00 1,626 $284.48 $28.60 $12.61FL18 $48.10 1,560 $135.73 $14.39 $5.83TX32 $89.20 1,555 $267.25 $21.92 $7.99AZ5 $66.00 1,512 $232.30 $25.13 $7.45OR1 $80.00 1,481 $179.40 $13.64 $9.28WA6 $66.00 1,426 $212.78 $17.25 $8.48CA42 $63.00 1,400 $183.00 $15.18 $8.67Top 30 CDs $7,744.50 127,051 $21,712.04 $1,721.15 $938.84
Data Source: IIUSA FOIA of USCIS Form I-924A (Regional Center Annual Reporting to USCIS), 2013-2015; IIUSA Regional Center Database
Table 17: Top 30 Congressional District with Highest Impacts on Expected Jobs Supported by EB-5 Investment (Regional Center Projects Only), 2014 and 2015

1 | Quantitative Assessment of the EB-5 Program
Introduction
Created by Congress in 1990,3 the EB-5 Immigration Program (the EB-5 Program) is a federal
immigration program that allows qualified foreign entrepreneurs to invest in a lawful business entity
located in the U.S. to “stimulate the U.S. economy through job creation and capital investment.” 4 In
addition to the required capital investment, each investor must also demonstrate that at least 10 full-
time positions were created or saved for U.S. citizens5 as a result of their qualifying investment in EB-5
projects. In exchange, the EB-5 Program provides a path for the principal investors and their eligible
family members (spouse and/or children) to obtain lawful permanent residence in the U.S. This program
is known as “EB-5” for the name of employment-based fifth preference visa classification that the
qualified investors and their eligible immediate family members would receive.
In 1992, under Section 610 of Public Law 102-395, Congress established the EB-5 Regional Center
Program to permit designated business entities (the Regional Centers) to aggregate EB-5 capital
investment from multiple qualified foreign investors in order to invest in economic development
projects that were approved by the U.S. Citizenship and Immigration Services (USCIS). An EB-5 Regional
Center – which can be publicly owned, privately owned, or a public-private partnership – is designed and
regulated by USCIS with the purpose of promoting economic growth in a given geographic area. To
maintain its continued eligibility, since 2010 every Regional Center is required to file Form I-924A
(Annual Certification of Regional Center) to USCIS 6 on or before December 29th every year to provide
key information on the Regional Center’s activities in a given year and demonstrate it is still in the
course of promoting regional economic growth. As of October 2017, more than 840 EB-5 Regional
Centers7 are approved by USCIS, serving all 50 states and federal controlled commonwealths, districts,
and territories across the country (see Figure 1).
3 Immigration Act of 1990, Pub. L. No. 101-649, 104 Stat. 4978 4 U.S. Citizenship and Immigration Services: https://www.uscis.gov/eb-5 5 See “Job Creation Requirements” on USCIS website, https://www.uscis.gov/working-united-states/permanent-workers/employment-based-immigration-fifth-preference-eb-5/about-eb-5-visa-classification 6 Annual Reporting Information / Filing Tips: Form I-924A, Annual Certification of Regional Center, USCIS, September 8, 2017, https://www.uscis.gov/forms/annual-reporting-information-filing-tips-form-i-924a-annual-certification-regional-center 7 Immigrant Investor Regional Centers, USCIS, https://www.uscis.gov/working-united-states/permanent-workers/employment-based-immigration-fifth-preference-eb-5/immigrant-investor-regional-centers (accessed on November 3, 2017)

Quantitative Assessment of the EB-5 Program | 2
Immigrant investors, whether through stand-alone direct EB-5 investment or a Regional Center, are
required to make a minimum capital investment of $1 million, or $500,000 if the funds are invested in a
Targeted Employment Area (“TEA”, including High Unemployment Areas or Rural Areas). 8 In addition, to
provide the required amount of qualifying capital in an EB-5 project, each foreign investor is also
required to demonstrate that their EB-5 investment will support at least 10 full-time jobs for U.S.
citizens. For direct EB-5 projects, the full-time positions must be created directly by the new commercial
enterprise (NCE)9 funded by the EB-5 investment. However, for investments through EB-5 Regional
Centers, USCIS allows job creation to be measured by direct, indirect, and induced employment10 that
can be verified based on the EB-5 project’s economic impact analyses (EIAs) submitted by the Regional
Center. According to the U.S. Department of Commerce (DOC), 96.1 percent of EB-5 investors in fiscal
year (FY) 2012 and FY2013 invested in Regional Center projects.11 Furthermore, based on the annual
8 See the “Capital Investment Requirements” section on USCIS website, September 25, 2017, https://www.uscis.gov/working-united-states/permanent-workers/employment-based-immigration-fifth-preference-eb-5/about-eb-5-visa-classification 9 See Chapter 2. C. “New Commercial Enterprise” in Volume 6, Part G of the USCIS Policy Manual, August 23, 2017, https://www.uscis.gov/policymanual/HTML/PolicyManual-Volume6-PartG-Chapter2.html#S-C 10 See Chapter 2. D. “Creation of Jobs” in Volume 6, Part G of the USCIS Policy Manual, supra note 6 11 U.S. Department of Commerce, Estimating the Investment and Job Creation Impact of the EB-5 Program, January 2017, http://www.esa.doc.gov/reports/estimating-investment-and-job-creation-impact-eb-5-program
Source: IIUSA FOIA of USICS Regional Center Designation Letters* Note: 2017 data through 11/3/2017
0
100
200
300
400
500
600
700
800
900
1992 1993 1994 1995 1996 1997 1998 1999 2000 2001 2002 2003 2004 2005 2006 2007 2008 2009 2010 2011 2012 2013 2014 2015 2016 2017
Num
ber
of E
B-5
Regi
onal
Cen
ters
Number of Regional Centers Approved Annually
Number of Regional Centers Approved since 1992
Figure 1. Number of EB-5 Regional Centers Approved Annually & Cumulatively, 1992-2017*

3 | Quantitative Assessment of the EB-5 Program
reports from the U.S. Department of State (DOS),12 since FY2012, over 90 percent of all EB-5 immigrant
visas were issued to the applicants invested in Regional Center projects located in a TEA, indicating the
vast majority of EB-5 investments were made to Regional Centers at the $500,000 level (see Figure 2).
As the first step of the EB-5 immigration process, the foreign investors, whether through direct EB-5
investment or a Regional Center, are required to petition USCIS via Form I-526 (Immigrant Petition by
Alien Entrepreneur)13 for a two-year conditional permanent residence by investing in an economic
development project in U.S. To remove the conditions, immigrant investors are required to petition
USCIS via Form I-829 (Petition by Entrepreneur to Remove Conditions on Permanent Resident Status)14
within 90 days of the end of the second year of the investor’s conditional permanent residency to
demonstrate, among other requirements, that at least 10 U.S. jobs have been created or preserved
based on their investment. If immigrant investors fail to prove that the job creation requirement is
satisfied, the conditions on permanent residence would not be removed against the investors and their
immediate family members.
12 DOS, Report of the Visa Office 2000 to 2016, https://travel.state.gov/content/visas/en/law-and-policy/statistics.html 13 See additional information on USCIS website, June 28, 2017, https://www.uscis.gov/i-526 14 See additional information on USCIS website, October 5, 2017, https://www.uscis.gov/i-829
Source: Annual Report of the Visa Office, Bureau of Consular Affairs, DOS* Note: FY2017 statistics are preliminary results provided by DOS on 10/18/2017, subject to change.
0%
10%
20%
30%
40%
50%
60%
70%
80%
90%
100%
FY2000 FY2001 FY2002 FY2003 FY2004 FY2005 FY2006 FY2007 FY2008 FY2009 FY2010 FY2011 FY2012 FY2013 FY2014 FY2015 FY2016 FY2017*
Perc
enta
ge o
f EB-
5 Vi
sa U
sage
$1M Direct $500K Direct (TEA) $1M RC $500K RC (RC-TEA)
Figure 2. Percentage of EB-5 Immigrant Visa Usage by Investment Category, FY1992-2017*

Quantitative Assessment of the EB-5 Program | 4
Furthermore, the Immigration and Nationality Act (INA) that Congress passed in 1990 established the
annual numeric limit for employment-based immigrants to 140,000,15 of which 7.10 percent, or
approximately 9,940 per year, immigrant visas are allocated to the fifth preference (the EB-5 Program).
In particular, not only principal investors (petitioner of Form I-526 and Form I-829) but also their eligible
immediate family members are counted as part of the annual EB-5 visa allocation. A total of 10,69216
and 9,76417 immigrant visas were used by the EB-5 classification respectively in FY2014 and FY2015 (see
Figure 3). According to Department of Homeland Security (DHS), 35.24 percent of the EB-5 visa holders
are principle investors, while approximately 23.79 percent are spouses and 40.82 percent are children.18
DHS Office of Inspector General (OIG) in December 2013 released a report that recommended to
“conduct comprehensive reviews” to evaluate how EB-5 capital investment stimulates the U.S.
15 INA § 201 (d)(1)(A), https://www.uscis.gov/ilink/docView/SLB/HTML/SLB/0-0-0-1/0-0-0-29/0-0-0-914.html#0-0-0-178 16 DOS, Report of the Visa Office 2014, Statistical Tables, Table V (Part 3), https://travel.state.gov/content/dam/visas/Statistics/AnnualReports/FY2014AnnualReport/FY14AnnualReport-TableV-PartIII.pdf (accessed 11/06/2017) 17 DOS, Report of the Visa Office 2015, Statistical Tables, Table V (Part 3), https://travel.state.gov/content/dam/visas/Statistics/AnnualReports/FY2015AnnualReport/FY15AnnualReport-TableV-Part3.pdf (accessed 11/06/2017) 18 DHS, Yearbook of Immigration Statistics 2015, Table 7, https://www.dhs.gov/immigration-statistics/yearbook/2015/table7 (accessed 11/06/2017)
Source: Annual Report of the Visa Office, Bureau of Consular Affairs, DOS* Note: FY2017 statistics are preliminary results provided by DOS on 10/18/2017, subject to change.
0
1,000
2,000
3,000
4,000
5,000
6,000
7,000
8,000
9,000
10,000
11,000
12,000
FY2000 FY2001 FY2002 FY2003 FY2004 FY2005 FY2006 FY2007 FY2008 FY2009 FY2010 FY2011 FY2012 FY2013 FY2014 FY2015 FY2016 FY2017*
Num
ber
of E
B-5
Visa
Use
d
Figure 3. Immigrant Visa Annual Usage by the EB-5 Program, FY2000-2017*

5 | Quantitative Assessment of the EB-5 Program
economy,19 emphasizing the importance of measuring the economic benefits of the Program in
accordance with its policy intent. In 2017, the DOC published its first-ever assessment of the investment
and job creation impact of the EB-5 Program, showing an estimated 169,760 American jobs were
expected to have been created by the total investment of $16.4 billion in FY2012 and FY2013.20
Although the EB-5 Program showed a continued growth in demand of 72.2 percent and 31.5 percent in
FY2014 and FY2015 (respectively), there is no updated research that evaluates the latest economic
impact of the EB-5 Program since FY2013 in terms of the number of filings of Form I-526 (see Figure 4)21.
To develop an updated assessment of the economic impacts and contributions that the EB-5 Program
has generated to the U.S. economy, this report adopted a combination of methodology frameworks
from previous related studies and utilized multiple data sources for economic analysis modeling. We not
only evaluated the economic benefit of the EB-5 capital investment at the national, state, and
congressional district (CD) levels, but also assessed the full economic impacts associated with the
19 DHS OIG, United States Citizenship and Immigration Services’ Employment-Based Fifth Preference (EB-5) Regional Center Program, Page 14. https://www.oig.dhs.gov/assets/Mgmt/2014/OIG_14-19_Dec13.pdf (December 2013) 20 Estimating the Investment and Job Creation Impact of the EB-5 Program, supra note 8 21 Number of I-526 Immigrant Petitions by Alien Entrepreneurs by Fiscal Year, Quarter, and Case Status, https://www.uscis.gov/tools/reports-studies/immigration-forms-data/data-set-form-i-526-immigrant-petition-alien-entrepreneur (accessed 11/02/2017)
Source: U.S. Citizenship and Immigration Services (USCIS)
0
2,000
4,000
6,000
8,000
10,000
12,000
14,000
16,000
1992 1993 1994 1995 1996 1997 1998 1999 2000 2001 2002 2003 2004 2005 2006 2007 2008 2009 2010 2011 2012 2013 2014 2015
Num
ber
of I-
526
Petit
ion
Figure 4. Number of I-526 Petitions USCIS Received by Fiscal Year, FY1992-2015

Quantitative Assessment of the EB-5 Program | 6
related activities throughout the EB-5 immigration process, including investor’s household spending and
other related immigration expenses.
In addition, it is important to note that capital investment from EB-5 investors only accounts for one
part of most EB-5 project’s capital stack. Using the data from DOC and Invest in the USA (IIUSA)22, in the
Discussions section, this report also estimates the total economic contributions associated with the full
capital stack (including EB-5 capital and funding from the other sources) of EB-5 Regional Center projects
that were active in 2014 and 2015. We also discuss the estimated investment level and job creation
impact of direct EB-5 projects in 2014 and 2015 to shed some light on the full scope of economic
contribution that the EB-5 Program has on/has to the U.S. economy.
22 Invest In the USA (IIUSA) is a national membership-based trade association of the EB-5 Regional Center Program, see additional information on IIUSA’s website, https://iiusa.org/

7 | Quantitative Assessment of the EB-5 Program
Previous Studies
A variety of independent and governmental research has been published to evaluate the economic
impacts that the EB-5 Program has introduced on the U.S. economy. Because the actual dollar amount
of EB-5 investment is not available to the general public, these studies not only evaluate the impacts of
capital investment and job creation of the Program in FY2013 and before, but also establish a
reasonable methodology framework that allows us to estimate the investment amount and assess the
economic benefit resulted by the EB-5 Program in FY2014 and FY2015.
In 2010, ICF International, commissioned by USCIS, utilized IMPLAN models to evaluate the economic
benefit associated with the EB-5 capital investment from 2001 to 2006, concluding that the Program
contributed an estimated $700 million (in 2009 dollars) to the U.S. gross domestic product (GDP), helped
create and/or save 12,000 annual jobs for U.S. workers, and generated more than $100 million in tax
revenues for the federal government and $62 million in tax revenues for state and local governments
during the six-year time period.23 Although the study only analyzed “a small convenience sample of EB-5
petitions”24 that was not necessarily representative of the population of EB-5 investors at that time, it
has established an economic analysis modeling of using IMPLAN methodology and developed a
measurement of the EB-5 Program’s economic impacts by using employment, contribution to U.S. GDP,
and contribution to tax revenues for future studies at the national level.
From 2013 to 2015, IIUSA commissioned MIG, Inc25, IMPLAN Group LLC26, and Alward Institute for
Collaborative Science27 to conduct a series of economic impact studies for the Program for 2010 to
2013, furthering the methodology to include the economic impacts associated with the immigrant
23 ICF International, Study of the United States Immigrant Investor Pilot Program (EB-5), 05/18/2010, http://www.uscis.gov/sites/default/files/USCIS/Resources/Reports percent20and percent20Studies/EB-5/EB5-Report-2010.pdf. 24 USCIS Responses to Independent Study of the EB-5 Program, 2010, https://www.uscis.gov/sites/default/files/USCIS/Resources/Reports percent20and percent20Studies/EB-5/EB5-Response-Report-2010.pdf 25 David Kay et al., MIG, Inc., Economic Impacts of the EB-5 Immigration Program 2010-2011, 06/07/2013, https://iiusa.org/blog/wp-content/uploads/2015/05/iiusa-implan-auber-eb5-economic-impact-report-_2010-2011_.pdf 26 David Kay, IMPLAN Group LLC, Economic Impacts of the EB-5 Immigration Program 2012, 01/27/2014, https://iiusa.org/blog/wp-content/uploads/2015/05/IIUSA-Economic-Impacts-of-EB-5-Immigration-Program-2012.pdf 27 David Kay, Alward Institute for Collaborative Science, The Economic Impact and Contribution of the EB-5 Immigration Program 2013, 05/2015, https://iiusa.org/blog/wp-content/uploads/2015/05/Economic-Impacts-of-the-EB-5-Immigration-Program_2013_FINAL-web.pdf

Quantitative Assessment of the EB-5 Program | 8
investors’ household spending and other immigration expenses to measure the full ripple effects of the
“EB-5 economy.” In addition, by utilizing data from Form I-924As (Regional Centers annual reporting to
USCIS),28 the studies introduced a methodology to address the problem of representativeness at the ICF
International’s 2010 report. Since the vast majority of EB-5 investment was made through Regional
Centers and all Regional Centers are required to file Form I-924As every year in order to maintain their
continued eligibility as an EB-5 Regional Center(given the fact that the total amount of EB-5 investment
is not disclosed), the data from the Form I-924As served as a better proxy to indicate the population of
EB-5 investors in a given year, and hence was able to produce a more accurate estimate of EB-5 capital
investment for the further economic analysis. As a result, the series of studies by Kay et al noted that,
from 2010 to 2013, the EB-5 investment and related spending contributed over $9.6 billion to U.S. GDP,
$1.3 billion to federal tax revenue and $769 million in state and local tax revenue.29 Furthermore, they
found that the EB-5 Program accounted for over 29,300 jobs created for U.S. workers during that four-
year time period.30
In January 2017, DOC published its first-ever assessment of the economic impact of the EB-5 program,
concluding an estimated 174,039 jobs were expected to have been created from the total investment of
$16.7 billion in FY2012 and 2013. 31 By analyzing the EIAs associated with the Regional Center projects
that were active in FY2012 and FY2013, among other key findings, the report highlighted the ratio of
total project cost to EB-5 capital investment in Regional Center projects was approximately 3:1. In
addition, based on the direct EB-5 project data provided by USCSI, DOC found that an estimated 6
percent of total EB-5 investments in FY2012 and FY2013 was associated with direct EB-5 investments.
Since DOC’s analysis was grounded by the direct access to the EB-5 project level data from USCIS, the
estimates on EB-5 capital stack and direct EB-5 investment in their report are the best indicators that we
can use to estimate the portion of EB-5 investment in the Regional Center project’s full capital stack as
well as the share of EB-5 investments that were made through stand-alone direct EB-5 projects.
28 Supra note 3 29 Page 55, supra note 25 30 Page 55, supra note 25 31 Page 11, supra note 8

9 | Quantitative Assessment of the EB-5 Program
Data and Methodology
EB-5 Investments through Regional Centers
One of the most challenging parts of this report is data scarcity. Although USCIS publishes the
performance statistics of EB-5 investor applications (petitions of Form I-526) on a quarterly basis,32 the
data doesn’t disclose the actual dollar amount of the investment associated with each I-526 petition nor
any information of the EB-5 project in which the I-526 petitioner invests. However, the aggregated
statistics of both filed and approved I-526 forms at USCIS’s dataset can still shed light on the overall
demand of the EB-5 Program. We also use the total number of EB-5 investor applications (filings of Form
I-526) in 2014 and 2015 to examine the validity of our estimates on EB-5 capital using the methodology
described at this section.
USCIS does not provide public access to the project-level EIAs that DOC utilized at their 2017 report. To
protect the Regional Centers’ “trade secrets and commercial or financial information,”33 the number of
approved EB-5 investor applications was also redacted on the Regional Center’s annual reports to USCIS
(Form I-924As) that IIUSA obtained from USCIS via a series of Freedom of Information Act (FOIA)
requests. In order to prepare the EB-5 capital investment data for use in IMPLAN economic impact
modeling, a few estimation methods are adopted to retrieve the necessary data from a combination of
available sources.
Our analysis focuses on the Regional Center projects that received the majority of their targeted EB-5
capital investment in 2014 and 2015. Therefore, we review all the projects (NCEs) listed on Regional
Center’s annual reporting to USCIS (Form I-924As) in 2013, 2014, and 2015, and only select the NCEs
that are listed on Form I-924As that were filed in 2014 and 2015 but not listed on the Form I-924As that
were submitted to USCIS in 2013. By doing so, we are able to filter the Regional Center projects that are
expected to have the most of their activity in 2014 and 2015, resulting in a conservative estimate of
32 USCIS, Data Set: Form I-526 Immigrant Petition by Alien Entrepreneur, https://www.uscis.gov/tools/reports-studies/immigration-forms-data/data-set-form-i-526-immigrant-petition-alien-entrepreneur 33 Exemption (b)(4) protects trade secrets and commercial or financial information that is privileged or confidential. The types of documents and/or information we have withheld may consist of unit pricing, business sales statistics; research data; technical designs; customer and supplier lists; profit and loss data; overhead and operating costs; and information on financial condition, 5 U.S.C. § 552 (b)(4) and (b)(6) of the FOIA.

Quantitative Assessment of the EB-5 Program | 10
overall economic impact. After eliminating duplicate project listings and aggregating the projects with
multiple stages, we include 355 Regional Center projects in our further analysis (see Table 1).
Once the project sample is selected, we use IIUSA’s proprietary database that consist of 845 active EB-5
Regional Centers and 1,073 EB-5 Regional Center projects to retrieve the estimated targeted EB-5 capital
investment associated with each Regional Center project that we identify as active in 2014 and 2015. By
matching the NCEs and job creating entities (JCEs)34 listings on Form I-924As with the NCE/JCE data from
IIUSA’s database, 35 we compile a relational dataset that includes the Regional Center, NCE/JCE, project
location, and the amount of targeted EB-5 capital investment for each one of the 355 projects in our
data sample. The investment estimation is tabulated at our dataset under a key assumption that
Regional Centers were able to raise the full targeted amount of EB-5 capital investment for their projects
that were active in 2014 and 2015. Given the fact that the demands for the EB-5 Program grew by
approximately 298 percent in 2014 and 2015 from 2013,36 it’s reasonable to assume the three-fold
growth in the supply of EB-5 investors was sufficient to satisfy the demands for EB-5 investment from
Regional Centers during that two-year period. As such, we estimate that approximately 22,452 EB-5
investors37 have invested $11.23 billion in capital to the 355 Regional Center projects active in 2014 and
2015.
Using USCIS’s aggregated statistics on I-526 petitions, we examine our estimates of the number of EB-5
investors compared to the amount of EB-5 investments in Regional Center projects in 2014 and 2015,
finding that our estimates are reasonable. According to USCIS, a total of 29,435 foreign investors filed
their I-526 petition from January 2014 to December 2015.38 The average approval rate for I-526
petitions during that two-year period was 87.9 percent.39 Using DOC’s ratio of 90 percent as the
34 A JCE is the entity that undertake the business activity and is closely responsible for job creation. In some cases, a JCE and NCE can be the same entity. See additional information on Regional Center project structure sample at USCIS Training Materials for EB-5 Adjudicators, https://www.uscis.gov/sites/default/files/USCIS/About percent20Us/Electronic percent20Reading percent20Room/Policies_and_Manuals/EB-5_Training_Materials.pdf 35 Criteria that were used to match the data from Form I-924As to IIUSA’s project database including but not limit to: the name of NCE/JCE, project location, project promotional materials, and outreach to project developers. 36 Measured by the total number of I-526 petitions that were filed in 2012, 2013, 2014, and 2015. 37 Calculated based on $500,000 investment per EB-5 investor. 38 USCIS, Data Set: Form I-526 Immigrant Petition by Alien Entrepreneur, FY2014 2nd Qtr to FY2016 1st Qtr, supra note 30 39 Supra note 35

11 | Quantitative Assessment of the EB-5 Program
percentage of EB-5 investments made in Regional Center projects in a TEA,40 we find that our estimates
match with the USCIS’s I-526 dataset at a 96 percent validity level.41
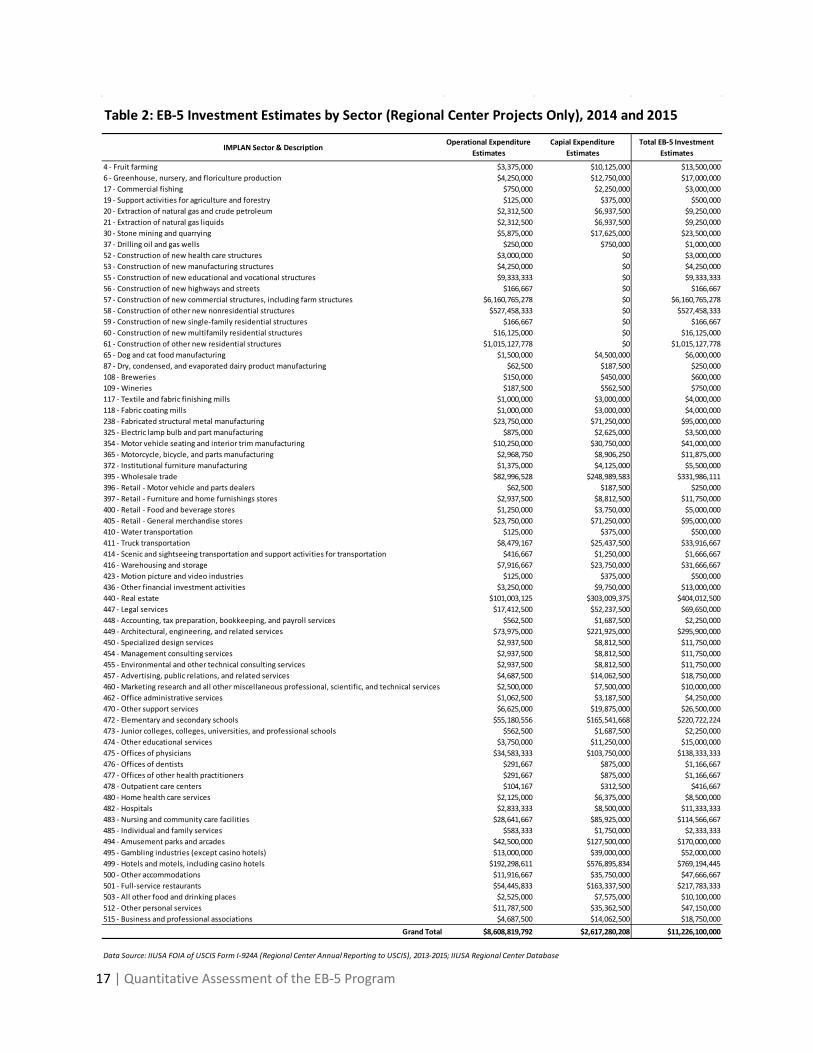
Additionally, we also allocate the total estimated EB-5 capital investment at Regional Centers in 2014
and 2015 to a variety of industry sectors based on the North American Industry Classification System
(NAICS) code(s) or descriptions associated with each project listing on Regional Center’s annual report to
USCISA (Form I-924As). If the aggregated EB-5 investment of one project is associated with multiple
sectors, we proportionately divided the estimated project spending among all sectors listing on the
Form I-924A. However, in the cases that a project is involved with construction sectors, we allocated 50
percent of the total EB-5 investment made to that project to the construction sectors and
proportionately allocated the other half (50 percent) of the project spending to the non-construction
sectors. Figure 5 illustrates the top ten non-construction sectors with the largest amount of EB-5
investments made through Regional Centers in 2014 and 2015.
40 DOS estimates, Supra note 10 41 Based on the parameters described at this paragraph, we estimated $11.65 in capital investment based on the general I-526 statistics published by USCIS.

Quantitative Assessment of the EB-5 Program | 12
Furthermore, to account for the different economic effects generated by various types of business
expenses,42 we adopt the ratio noted in the previous related studies (Kay 2015) and allocate 25 percent
of all the estimated EB-5 investment in the non-construction sectors to the JCE/NCE’s operational
expenditures, while the remaining 75 percent is attributed to capital expenditures expected to be used
to purchase capital equipment. As for the project spending in construction sectors, 100 percent is
characterized as the NCE/JCE’s operational expenditure that was used to fund construction projects (see
Table 2).
Lastly, to prepare the data for economic impact analyses at state and congressional district levels, we
aggregated the EB-5 investment made through Regional Centers in 2014 and 2015 based on the
project’s physical location by state (plus the District of Columbia) and by congressional district. Table 1
and Table 3 respectively shows the geographical distribution of the 355 EB-5 Regional Center projects
42 Not only may the EB-5 investments be used to fund the NCE/JCE’s operations but also to purchase the capital equipment that the project may require.
Data Source: IIUSA FOIA of USCIS Form I-924A (Regional Center Annual Reporting to USCIS), 2013-2015; IIUSA Regional Center Database
Hotels and motels, including casino hotels,
$769
Real estate, $404
Wholesale trade, $332
Architectural, engineering, and related services, $296
Elementary and secondary schools,
$221
Full-service restaurants, $218
Amusement parks and arcades,
$170
Offices of physicians, $138
Nursing and community care facilities,
$115
Fabricated structural metal manufacturing,
$95
Other non construction related sectors,
$732
Figure 5. Estimated EB-5 Investment in Non-Construction Related Sectors, 2014 and 2015
Total estimated EB-5 investment in 2014 and
2015 is $11.23 billion. $7.7 billion (or 69%) was
introduced to construction sectors; while $3.5 billion (or 31%) was invested in non construction sectors

13 | Quantitative Assessment of the EB-5 Program
that we include in our analysis and the aggregated amount of EB-5 investment for each state (plus
District of Columbia) and congressional district.
Once the data was prepared, we processed the model through the input-output (I/O) software, IMPLAN.
We used a nation-wide model based on IMPLAN’s 2015 social accounting matrix (SAM) data while state
and congressional district models are used to estimate their respective impacts. Since the available data
only indicate if spending was in 2014 or 2015, but not which specific year, we model all investment as if
it occurred in 2015.
Capital Expenditures are modeled as industry spending patterns, with the level set at the overall amount
of capital expenditures and coefficients assigned to each industry based on their share of overall capital
expenditures. The event year is changed to 2015, and the local purchase percentage (LPP) is set to SAM
model values. No investment spending is margined for retail sectors, as it is not representative of
consumption. This spending is used for start-up costs and capital purchases, and therefore no margins
are associated with the direct effect and all spending should be at producer prices.
Operational spending is modeled using the industry change activity in IMPLAN on the same model(s).
The event year is also set to 2015. However, the LPP is set to 100%, as we know the companies operate
within the geographical bounds of each respective model. Capital expenditures may include imports,
and therefore we set the LPP for that activity to the SAM model value. Doing so allows us to utilize
IMPLAN’s regional purchase coefficients, which designate how much capital spending can be allocated
locally.
A batching process is used to create the nationwide model, 33 state models, 1 model for Washington,
D.C., and 155 congressional district models. Please note, Puerto Rico and the Northern Mariana Islands,
while U.S. territories that received funding through the EB-5 Regional Center program, are not modelled
or analyzed in this report. This is due to the fact that IMPLAN does not currently have modelling data for
these two regions or other U.S. territories. However, the total investment in these two regions totals
roughly $175 million (see Table 1), only 1.56 percent of all EB-5 investment through Regional Centers in
2014 and 2015, making the estimated impacts in this report slightly conservative.
Once impact data is created for states and congressional districts, that data must be scaled up to
account for domestic leakage. Since these areas are small economies, and subsets of the larger U.S.
economy, the sum of all state impacts, and the sum of all congressional district impacts, will each be less
than the total impact of EB-5 investment estimated in the national model. Domestic and international

Quantitative Assessment of the EB-5 Program | 14
imports account for these leakages. To scale up impact data for these sub-economies, we divide the
total impact from the national model by the sum of impacts from state and congressional district
models, respectively. The percentage derived from the states impact is multiplied by each individual
state impact to account for domestic leakage; the same process is followed for the congressional
districts. In this way, the impact for each state and congressional district is the sum of its impact and any
associated leakage from domestic imports.
Finally, while EB-5 investment in 2014 and 2015 considerably increased from past years, it is still only a
small part of the overall investment industry. In 2014 and 2015, the Securities, Commodity Contracts,
and Investment industry generated a combined $978 billion in gross output43. This puts EB-5 investment
as roughly 3.3% of all investment in the U.S., which we consider to be a sufficiently small amount to
make crowding out of other U.S. investments negligible and not require adjustments to our IMPLAN
model.
Based on the above methodology, we develop several datasets describing the estimated EB-5 capital
investment in Regional Center projects that were active in 2014 and 2015 for further economic impact
analysis. The key highlights of this data include:
• An estimated $11.23 billion was invested in 355 EB-5 Regional Center projects that were active
in 2014 and 2015, representing approximately of 2 percent of all foreign direct investment (FDI)
net flows to U.S. economy44 during that two-year period.
• The top five states with the highest amount of EB-5 investment in Regional Centers during 2014
and 2015 include New York ($3.45 billion), California ($2.87 billion), Florida ($890 million),
Washington ($883 million), and Texas ($819 million), accounting for a total of $8.92 billion (or
79.4 percent of total estimated EB-5 investment) in the two-year period.
• The top ten congressional districts with the most EB-5 investment in 2014 and 2015 include the
10th district in New York (NY10, $1.66 billion), NY12 ($1.18 billion), WA7 ($595 million), CA34
($548 million), CA37 ($520 million), CA12 ($313 million), CA28 ($273 million), TX24 ($265
43 BEA Gross Output by Industry Table 44 According to World Bank, the total amount of FDI net inflows to U.S. in 2014 and 2015 was $743.82 billion. See additional information on World Bank’s website, https://data.worldbank.org/indicator/BX.KLT.DINV.CD.WD?locations=US (accessed on November 7, 2017)

15 | Quantitative Assessment of the EB-5 Program
million), MD8 ($234 million), and FL23 ($215 million), taking up a total of $5.81 billion (or 51.72
percent of all estimated EB-5 capital investment) occurred in 2014 and 2015.
• Approximately 69 percent ($7.74 billion) of the estimated EB-5 investment in 2014 and 2015
was invested in construction related sectors.
• The top non-construction related sectors that received the EB-5 investment in 2014 and 2015
include: hotels and motels ($769 million), real estate projects ($404 million), wholesale trade
projects ($332 million), architectural engineering and related services ($296 million),
elementary and secondary schools ($221 million), and full-service restaurants ($218 million),
see Figure 5.
Finally, it’s important to note that, on average, EB-5 investment accounts for one third (or 33%) of the
overall capital spending associated with a Regional Center project.45 This report not only evaluates the
economic impacts produced by the EB-5 investment only, which would not have happened with the EB-
5 Program, but also assess the contributions generated by the estimated full capital stack of the 355
Regional Center projects that were active in 2014 and 2015 to the U.S. economy. However, given the
fact that there is no actual data to determine whether a project that received EB-5 investment through
Regional Centers in 2014 and 2015 would have continued or have been cancelled in the absence of the
EB-5 Regional Center Program, our estimates on the economic contribution associated with the full EB-5
capital stack must be interpreted as jobs and economic outcomes supported by the existing level of
investment instead of the marginal increase generated by the new investment that would not have
occurred without the EB-5 Program.
45 Based on DOC’s report, total amount of investment spending associated with Regional Center projects was $16.69 billion in FY2012 and FY2013; while $10.92 billion was funded by non-EB-5 capital sources. Supra note 8

Quantitative Assessment of the EB-5 Program | 16
State/Territory Abbr.EB-5 Regional Center
Project Count EB-5 Investment
(in $million)
Alabama AL 11 $83.50Arizona AZ 6 $108.00Arkansas AR 1 $4.67California CA 93 $2,873.67Colorado CO 2 $66.00Florida FL 44 $890.80Georgia GA 9 $88.87Hawaii HI 1 $17.00Illinois IL 7 $70.50Indiana IN 2 $36.00Louisiana LA 2 $51.75Maryland MD 7 $302.00Massachusetts MA 2 $54.50Michigan MI 2 $29.00Minnesota MN 2 $82.50Mississippi MS 2 $53.50Montana MT 1 $140.00Nevada NV 2 $16.50New Jersey NJ 4 $80.17New Mexico NM 1 $15.00New York NY 46 $3,452.37North Carolina NC 5 $187.00North Dakota ND 2 $27.50Norther Mariana Islands MP 1 $150.00Ohio OH 4 $89.50Oregon OR 5 $85.00Pennsylvania PA 6 $161.50Puerto Rico PR 1 $24.60South Carolina SC 1 $2.90Tennessee TN 3 $51.90Texas TX 39 $818.67Utah UT 2 $39.00Vermont VT 1 $25.00Washington WA 27 $883.42Washington DC DC 4 $70.33Wisconsin WI 7 $93.50
355 $11,226.10Grand Total
Table 1: EB-5 Investment in Regional Center Projects (in $Million), 2014 and 2015
Data Source: IIUSA FOIA of USCIS Form I-924A (Regional Center Annual Reporting to USCIS), 2013-2015; IIUSA Regional Center Database
17 | Quantitative Assessment of the EB-5 Program
IMPLAN Sector & DescriptionOperational Expenditure
EstimatesCapial Expenditure
EstimatesTotal EB-5 Investment
Estimates
4 - Fruit farming $3,375,000 $10,125,000 $13,500,0006 - Greenhouse, nursery, and floriculture production $4,250,000 $12,750,000 $17,000,00017 - Commercial fishing $750,000 $2,250,000 $3,000,00019 - Support activities for agriculture and forestry $125,000 $375,000 $500,00020 - Extraction of natural gas and crude petroleum $2,312,500 $6,937,500 $9,250,00021 - Extraction of natural gas liquids $2,312,500 $6,937,500 $9,250,00030 - Stone mining and quarrying $5,875,000 $17,625,000 $23,500,00037 - Drilling oil and gas wells $250,000 $750,000 $1,000,00052 - Construction of new health care structures $3,000,000 $0 $3,000,00053 - Construction of new manufacturing structures $4,250,000 $0 $4,250,00055 - Construction of new educational and vocational structures $9,333,333 $0 $9,333,33356 - Construction of new highways and streets $166,667 $0 $166,66757 - Construction of new commercial structures, including farm structures $6,160,765,278 $0 $6,160,765,27858 - Construction of other new nonresidential structures $527,458,333 $0 $527,458,33359 - Construction of new single-family residential structures $166,667 $0 $166,66760 - Construction of new multifamily residential structures $16,125,000 $0 $16,125,00061 - Construction of other new residential structures $1,015,127,778 $0 $1,015,127,77865 - Dog and cat food manufacturing $1,500,000 $4,500,000 $6,000,00087 - Dry, condensed, and evaporated dairy product manufacturing $62,500 $187,500 $250,000108 - Breweries $150,000 $450,000 $600,000109 - Wineries $187,500 $562,500 $750,000117 - Textile and fabric finishing mills $1,000,000 $3,000,000 $4,000,000118 - Fabric coating mills $1,000,000 $3,000,000 $4,000,000238 - Fabricated structural metal manufacturing $23,750,000 $71,250,000 $95,000,000325 - Electric lamp bulb and part manufacturing $875,000 $2,625,000 $3,500,000354 - Motor vehicle seating and interior trim manufacturing $10,250,000 $30,750,000 $41,000,000365 - Motorcycle, bicycle, and parts manufacturing $2,968,750 $8,906,250 $11,875,000372 - Institutional furniture manufacturing $1,375,000 $4,125,000 $5,500,000395 - Wholesale trade $82,996,528 $248,989,583 $331,986,111396 - Retail - Motor vehicle and parts dealers $62,500 $187,500 $250,000397 - Retail - Furniture and home furnishings stores $2,937,500 $8,812,500 $11,750,000400 - Retail - Food and beverage stores $1,250,000 $3,750,000 $5,000,000405 - Retail - General merchandise stores $23,750,000 $71,250,000 $95,000,000410 - Water transportation $125,000 $375,000 $500,000411 - Truck transportation $8,479,167 $25,437,500 $33,916,667414 - Scenic and sightseeing transportation and support activities for transportation $416,667 $1,250,000 $1,666,667416 - Warehousing and storage $7,916,667 $23,750,000 $31,666,667423 - Motion picture and video industries $125,000 $375,000 $500,000436 - Other financial investment activities $3,250,000 $9,750,000 $13,000,000440 - Real estate $101,003,125 $303,009,375 $404,012,500447 - Legal services $17,412,500 $52,237,500 $69,650,000448 - Accounting, tax preparation, bookkeeping, and payroll services $562,500 $1,687,500 $2,250,000449 - Architectural, engineering, and related services $73,975,000 $221,925,000 $295,900,000450 - Specialized design services $2,937,500 $8,812,500 $11,750,000454 - Management consulting services $2,937,500 $8,812,500 $11,750,000455 - Environmental and other technical consulting services $2,937,500 $8,812,500 $11,750,000457 - Advertising, public relations, and related services $4,687,500 $14,062,500 $18,750,000460 - Marketing research and all other miscellaneous professional, scientific, and technical services $2,500,000 $7,500,000 $10,000,000462 - Office administrative services $1,062,500 $3,187,500 $4,250,000470 - Other support services $6,625,000 $19,875,000 $26,500,000472 - Elementary and secondary schools $55,180,556 $165,541,668 $220,722,224473 - Junior colleges, colleges, universities, and professional schools $562,500 $1,687,500 $2,250,000474 - Other educational services $3,750,000 $11,250,000 $15,000,000475 - Offices of physicians $34,583,333 $103,750,000 $138,333,333476 - Offices of dentists $291,667 $875,000 $1,166,667477 - Offices of other health practitioners $291,667 $875,000 $1,166,667478 - Outpatient care centers $104,167 $312,500 $416,667480 - Home health care services $2,125,000 $6,375,000 $8,500,000482 - Hospitals $2,833,333 $8,500,000 $11,333,333483 - Nursing and community care facilities $28,641,667 $85,925,000 $114,566,667485 - Individual and family services $583,333 $1,750,000 $2,333,333494 - Amusement parks and arcades $42,500,000 $127,500,000 $170,000,000495 - Gambling industries (except casino hotels) $13,000,000 $39,000,000 $52,000,000499 - Hotels and motels, including casino hotels $192,298,611 $576,895,834 $769,194,445500 - Other accommodations $11,916,667 $35,750,000 $47,666,667501 - Full-service restaurants $54,445,833 $163,337,500 $217,783,333503 - All other food and drinking places $2,525,000 $7,575,000 $10,100,000512 - Other personal services $11,787,500 $35,362,500 $47,150,000515 - Business and professional associations $4,687,500 $14,062,500 $18,750,000
Grand Total $8,608,819,792 $2,617,280,208 $11,226,100,000
Data Source: IIUSA FOIA of USCIS Form I-924A (Regional Center Annual Reporting to USCIS), 2013-2015; IIUSA Regional Center Database
Table 2: EB-5 Investment Estimates by Sector (Regional Center Projects Only), 2014 and 2015

Quantitative Assessment of the EB-5 Program | 18
Congressional District
EB-5 Regional Center Project Count
EB-5 Investment (in $million)
Congressional District
EB-5 Regional Center Project Count
EB-5 Investment (in $million)
Congressional District
EB-5 Regional Center Project Count
EB-5 Investment (in $million)
AL1 4 $12.00 FL10 1 $20.00 NY6 5 $57.25AL3 2 $54.00 FL13 1 $50.00 NY7 3 $36.00AL4 2 $6.00 FL14 4 $200.50 NY9 2 $19.58AL6 1 $3.83 FL15 2 $33.56 NY10 9 $1,662.95AL7 2 $7.67 FL16 2 $16.50 NY11 1 $170.00AR4 1 $4.67 FL18 4 $48.06 NY12 10 $1,180.17AZ5 4 $66.00 FL19 1 $7.50 NY13 2 $8.00AZ7 2 $42.00 FL20 3 $28.78 NY14 2 $110.00CA3 2 $27.50 FL21 3 $67.28 NY17 3 $19.17CA4 1 $19.50 FL22 2 $17.48 NY23 1 $10.00CA7 1 $0.50 FL23 6 $215.00 NY25 1 $1.17CA12 11 $313.67 FL24 3 $31.70 NY26 2 $50.50CA13 1 $3.00 FL26 1 $16.78 NY27 1 $1.17CA14 2 $27.33 FL27 4 $63.40 OH10 1 $3.50CA16 2 $1.50 GA5 3 $59.40 OH11 3 $86.00CA17 1 $19.50 GA6 2 $3.00 OH16 1 $13.50CA18 2 $13.00 GA11 4 $26.47 OR1 3 $80.00CA19 2 $6.33 HI2 1 $17.00 OR3 2 $5.00CA21 5 $78.25 IL4 1 $20.00 PA2 2 $110.00CA22 2 $3.42 IL5 1 $2.50 PA13 2 $1.50CA24 1 $49.50 IL7 1 $21.50 PA15 2 $50.00CA25 2 $31.33 IL10 2 $6.50 PR98 1 $24.60CA26 3 $16.67 IL17 1 $14.00 SC4 1 $2.90CA27 10 $71.00 IN7 1 $28.50 TN3 1 $2.90CA28 4 $273.00 IN9 1 $7.50 TN5 1 $46.00CA30 1 $2.50 LA1 1 $2.25 TN8 1 $3.00CA31 2 $14.33 LA2 1 $49.50 TX2 1 $4.67CA32 5 $98.17 MA7 1 $49.50 TX3 1 $2.25CA33 1 $150.00 MA9 1 $5.00 TX7 2 $13.00CA34 4 $548.00 MD3 1 $42.00 TX14 1 $7.00CA35 2 $92.00 MD7 2 $26.00 TX17 1 $49.50CA36 1 $23.00 MD8 4 $234.00 TX18 4 $82.67CA37 2 $520.00 MI6 1 $19.00 TX21 4 $20.50CA38 1 $5.00 MI12 1 $10.00 TX22 1 $6.50CA39 3 $40.50 MN4 1 $17.50 TX23 2 $97.00CA40 2 $64.00 MN6 1 $65.00 TX24 10 $264.92CA41 4 $98.00 MP98 1 $150.00 TX25 1 $18.50CA42 3 $63.00 MS3 2 $53.50 TX30 5 $163.00CA44 1 $30.00 MT0 1 $140.00 TX32 6 $89.17CA45 1 $18.00 NC1 2 $117.00 UT1 1 $20.00CA46 2 $40.33 NC5 1 $9.50 UT2 1 $19.00CA47 1 $2.33 NC11 1 $35.00 VT0 1 $25.00CA48 2 $31.00 NC12 1 $25.50 WA2 2 $21.67CA52 1 $36.00 ND0 2 $27.50 WA4 1 $1.25CA53 2 $42.50 NJ8 2 $38.17 WA5 1 $13.50CO1 1 $29.00 NJ9 1 $6.50 WA6 1 $66.00CO2 1 $37.00 NJ12 1 $35.50 WA7 8 $595.00DC98 4 $70.33 NM2 1 $15.00 WA8 1 $0.88FL5 2 $24.78 NV1 1 $4.00 WA9 10 $178.88FL7 1 $6.00 NV4 1 $12.50 WA10 3 $6.25FL8 2 $12.00 NY3 3 $36.42 WI1 1 $21.50FL9 2 $24.00 NY4 1 $90.00 WI4 6 $72.00
355 $11,226.10
Data Source: IIUSA FOIA of USCIS Form I-924A (Regional Center Annual Reporting to USCIS), 2013-2015; IIUSA Regional Center Database
Grand Total
Table 3: Estimated Regional Center Project Count and EB-5 Investment by Congressional District (in $Million), 2014 and 2015

19 | Quantitative Assessment of the EB-5 Program
EB-5 Investors Household Spending
EB-5 Investment spending does not constitute the whole of the economic impacts associated with the
EB-5 Program. We also wish to estimate and analyze the impacts of spending conducted by the families
of investors once they have relocated to the U.S. Although no direct data of the investors’ household
spending is available, we approximate the spending using a methodology established in the 2013
economic impact report (Kay 2015) and update the estimates to reflect this report’s analysis for a two-
year time periods. Due to the time-intensive nature of IMPLAN, uncertain assumptions inherent in
estimating household spending, and low overall value of household spending as part of the direct
spending associated with the EB-5 Regional Center Program (6 percent of the total impact, see Figure 6),
we instead choose to double the values of 2015 household spending on the state and national level
before scaling up to account for leakage from domestic imports to estimate the impacts of 2014
household spending. This is a conservative estimate, as Table 4 show that more visas were approved in
2014 and therefore more household spending was conducted in 2014, but the state and congressional
district estimates for 2014 are based off of doubling the slightly smaller 2015 impacts. In addition, since
they are doubled before scaling, they account for any leakages from domestic imports in 2014 as well.
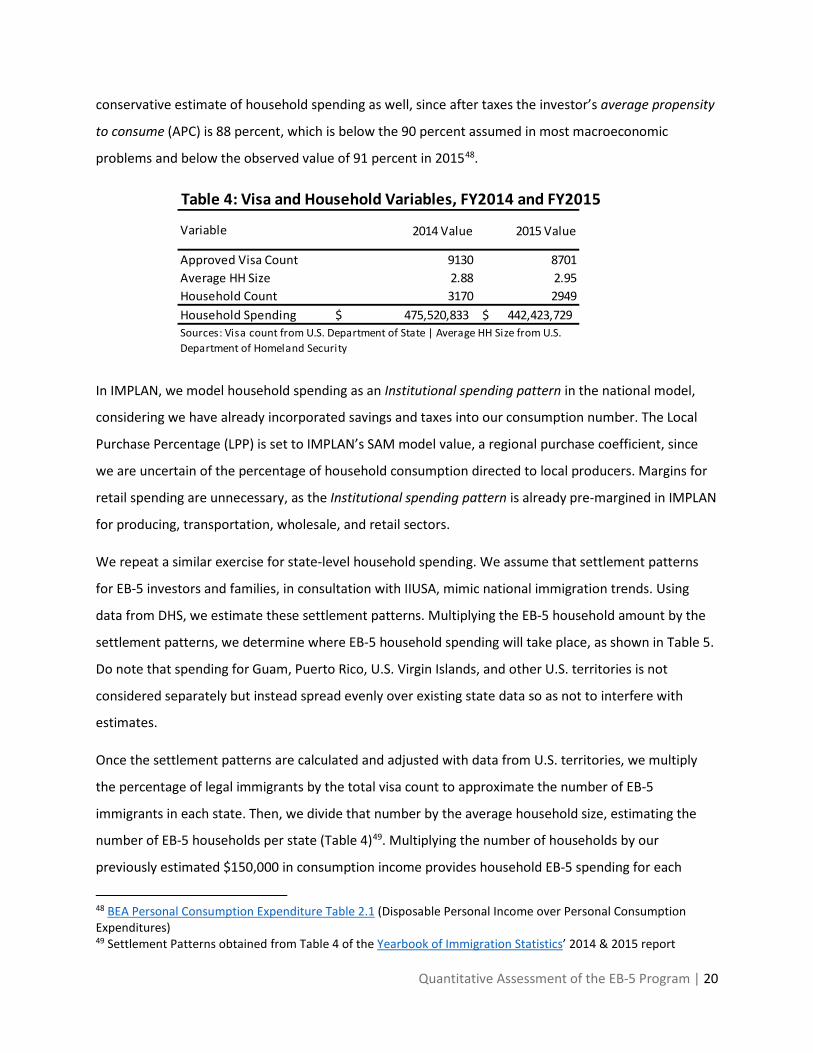
To estimate the average number of EB-5 investor households, we use the official visa count from DOS,
as well as the number of EB-5 investors from the DHS46. This information can be found in Table 4, as well
as the average household size, which was calculated by dividing the number of EB-5 individuals
(investors, spouses, and children) granted permanent residency by the number of EB-5 investors granted
permanent residency. Next, the amount of spending each household generated must be estimated.
Using information from the 2013 report as well as provided by IIUSA, we assume that all EB-5 investors
are accredited investors, as defined by the SEC. An investor is considered accredited if their annual
income is larger than $200,00047. Thus, we find it reasonable to assume that all EB-5 investors are
accredited, and that their annual investment income exceeds $200,000. Building upon this, if we
subtract capital gains tax (15 percent, $30,000) and savings (10 percent, $20,000) from the minimum
income of $200,000, we estimate that each individual EB-5 household will have $150,000 available for
consumption annually. These assumptions, again, are built off of consultation with IIUSA. This is a
46 The official Visa Count can be obtained at Table 6, Pt. 4 of the State Department’s Visa Office Report (2014 & 2015). This report only included those who participated in the Regional Center program, so only the columns titled 5th Regional Pilot Program and 5th Regional Target Area. Number of EB-5 investors and family members (I51 and R51), used for estimating average HH size, can be obtained from Table 7 of the Yearbook of Immigration Statistics’ 2014 and 2015 reports. 47 Definition of accredited investor found at the SEC’s website.
Quantitative Assessment of the EB-5 Program | 20
conservative estimate of household spending as well, since after taxes the investor’s average propensity
to consume (APC) is 88 percent, which is below the 90 percent assumed in most macroeconomic
problems and below the observed value of 91 percent in 201548.
In IMPLAN, we model household spending as an Institutional spending pattern in the national model,
considering we have already incorporated savings and taxes into our consumption number. The Local
Purchase Percentage (LPP) is set to IMPLAN’s SAM model value, a regional purchase coefficient, since
we are uncertain of the percentage of household consumption directed to local producers. Margins for
retail spending are unnecessary, as the Institutional spending pattern is already pre-margined in IMPLAN
for producing, transportation, wholesale, and retail sectors.
We repeat a similar exercise for state-level household spending. We assume that settlement patterns
for EB-5 investors and families, in consultation with IIUSA, mimic national immigration trends. Using
data from DHS, we estimate these settlement patterns. Multiplying the EB-5 household amount by the
settlement patterns, we determine where EB-5 household spending will take place, as shown in Table 5.
Do note that spending for Guam, Puerto Rico, U.S. Virgin Islands, and other U.S. territories is not
considered separately but instead spread evenly over existing state data so as not to interfere with
estimates.
Once the settlement patterns are calculated and adjusted with data from U.S. territories, we multiply
the percentage of legal immigrants by the total visa count to approximate the number of EB-5
immigrants in each state. Then, we divide that number by the average household size, estimating the
number of EB-5 households per state (Table 4)49. Multiplying the number of households by our
previously estimated $150,000 in consumption income provides household EB-5 spending for each
48 BEA Personal Consumption Expenditure Table 2.1 (Disposable Personal Income over Personal Consumption Expenditures) 49 Settlement Patterns obtained from Table 4 of the Yearbook of Immigration Statistics’ 2014 & 2015 report
Table 4: Visa and Household Variables, FY2014 and FY2015
2014 Value 2015 Value
Approved Visa Count 9130 8701Average HH Size 2.88 2.95Household Count 3170 2949Household Spending 475,520,833$ 442,423,729$
Variable
Sources: Visa count from U.S. Department of State | Average HH Size from U.S. Department of Homeland Security

21 | Quantitative Assessment of the EB-5 Program
state. These numbers are entered into IMPLAN in our state models, again using the Institutional
spending pattern for households exceeding an annual income of $150,000. The LPP is once again set to
IMPLAN’s SAM model value for each state model.
For congressional districts, we also base our analysis off of methodologies developed by IIUSA and the
previous studies (Kay 2015). State-level spending is inversely weighted against the geographic size, in
square miles, of a congressional district. This allows for an urban bias that is reflected in the generalized
settlement patterns assumed for EB-5 households. No information is available on where in each state
the EB-5 households settle, so this methodology is reasonable to account for such gaps in information.
Appendix 3 contains details on the weighting calculation.
A batching procedure is used to create the models for all 436 congressional districts and 51 state
models. Then, after running the models individually, we combine the exported data into a table with
total economic impacts for all states and congressional districts. These results are scaled up to account
for leakage from domestic imports, just as was done for the investment numbers resulting from the
state and congressional district models.

Quantitative Assessment of the EB-5 Program | 22
State Household Count Estimate Household Expenditure (in $thousand)Alabama 22.69 $3,422.86Alaska 8.82 $1,330.72Arkansas 15.79 $2,382.09Arizona 101.01 $15,234.74California 1176.21 $177,402.58Colorado 71.06 $10,717.73Connecticut 62.31 $9,398.02Delaware 12.17 $1,835.25DC 16.70 $2,519.23Florida 667.18 $100,627.85Georgia 145.47 $21,940.84Hawai'i 36.55 $5,513.36Idaho 14.21 $2,142.53Illinois 227.21 $34,268.64Indiana 48.01 $7,241.09Iowa 28.33 $4,272.36Kansas 30.41 $4,587.27Kentucky 31.69 $4,780.27Louisiana 26.36 $3,975.24Maine 8.22 $1,239.30Massachusetts 160.15 $24,155.32Maryland 127.00 $19,154.11Michigan 101.30 $15,278.76Minnesota 82.71 $12,475.10Mississippi 8.91 $1,343.42Missouri 37.78 $5,697.90Montana 2.91 $439.34Nebraska 29.38 $4,430.66North Carolina 103.80 $15,656.31North Dakota 8.98 $1,354.42New Jersey 279.51 $42,157.32New Mexico 20.35 $3,069.47Nevada 62.04 $9,356.54New Hampshire 12.12 $1,827.63New York 729.69 $110,055.49Ohio 90.08 $13,586.58Oklahoma 27.39 $4,131.00Oregon 48.58 $7,326.59Pennsylvania 140.14 $21,136.65Rhode Island 20.26 $3,055.92South Carolina 24.79 $3,739.06South Dakota 7.10 $1,070.84Tennessee 49.58 $7,477.27Texas 559.72 $84,420.46Utah 38.63 $5,826.57Vermont 4.45 $670.44Virginia 155.03 $23,382.45Washington 139.00 $20,963.96West Virginia 4.41 $665.36Wisconsin 37.35 $5,633.56Wyoming 3.03 $456.27Total 5,866.58 $884,826.74
Table 5: EB-5 Household Expenditure, FY2014-2015Estimated Distribution by State
Source: Author's calculation based on data from U.S. Department of Homeland Security
23 | Quantitative Assessment of the EB-5 Program
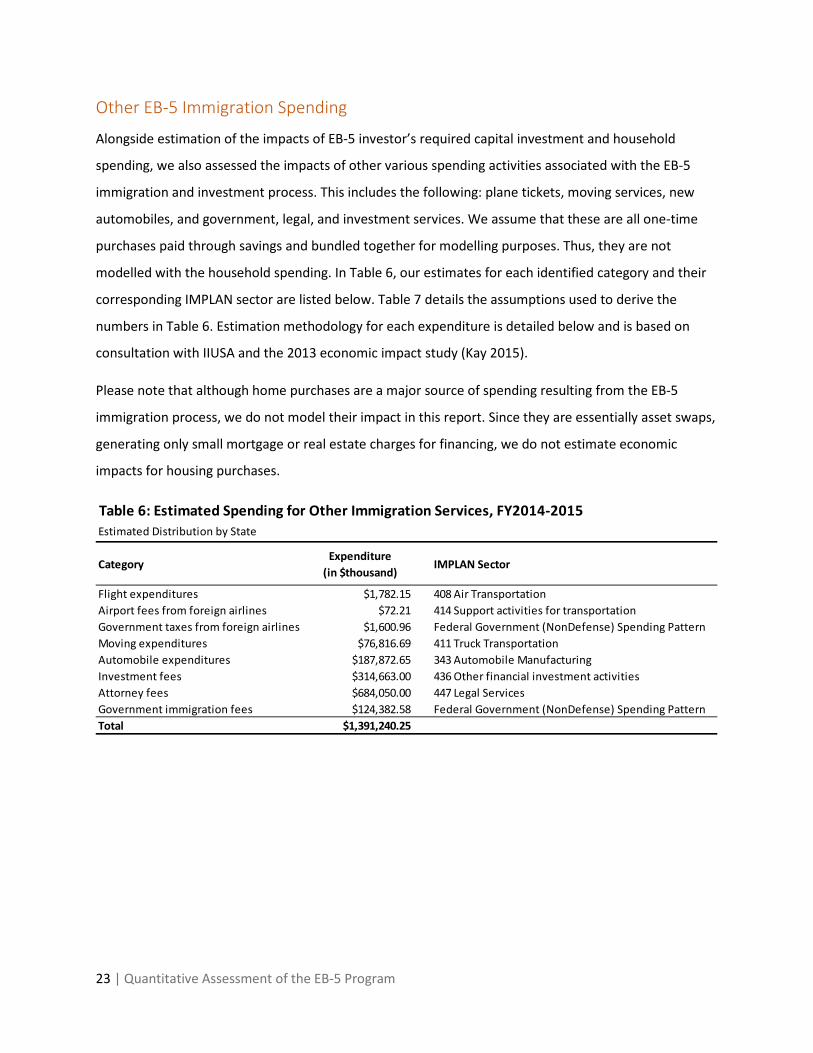
Other EB-5 Immigration Spending
Alongside estimation of the impacts of EB-5 investor’s required capital investment and household
spending, we also assessed the impacts of other various spending activities associated with the EB-5
immigration and investment process. This includes the following: plane tickets, moving services, new
automobiles, and government, legal, and investment services. We assume that these are all one-time
purchases paid through savings and bundled together for modelling purposes. Thus, they are not
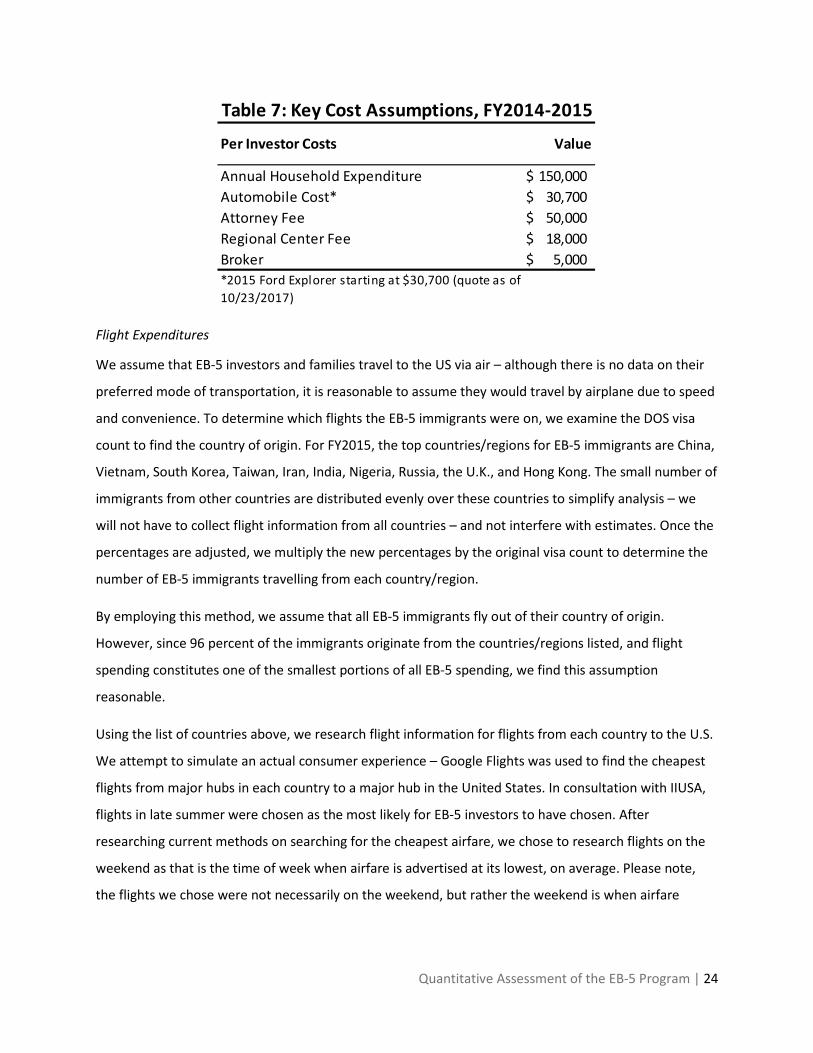
modelled with the household spending. In Table 6, our estimates for each identified category and their
corresponding IMPLAN sector are listed below. Table 7 details the assumptions used to derive the
numbers in Table 6. Estimation methodology for each expenditure is detailed below and is based on
consultation with IIUSA and the 2013 economic impact study (Kay 2015).
Please note that although home purchases are a major source of spending resulting from the EB-5
immigration process, we do not model their impact in this report. Since they are essentially asset swaps,
generating only small mortgage or real estate charges for financing, we do not estimate economic
impacts for housing purchases.
CategoryExpenditure
(in $thousand)IMPLAN Sector
Flight expenditures $1,782.15 408 Air TransportationAirport fees from foreign airlines $72.21 414 Support activities for transportationGovernment taxes from foreign airlines $1,600.96 Federal Government (NonDefense) Spending PatternMoving expenditures $76,816.69 411 Truck TransportationAutomobile expenditures $187,872.65 343 Automobile ManufacturingInvestment fees $314,663.00 436 Other financial investment activitiesAttorney fees $684,050.00 447 Legal ServicesGovernment immigration fees $124,382.58 Federal Government (NonDefense) Spending PatternTotal $1,391,240.25
Table 6: Estimated Spending for Other Immigration Services, FY2014-2015Estimated Distribution by State
Quantitative Assessment of the EB-5 Program | 24
Flight Expenditures
We assume that EB-5 investors and families travel to the US via air – although there is no data on their
preferred mode of transportation, it is reasonable to assume they would travel by airplane due to speed
and convenience. To determine which flights the EB-5 immigrants were on, we examine the DOS visa
count to find the country of origin. For FY2015, the top countries/regions for EB-5 immigrants are China,
Vietnam, South Korea, Taiwan, Iran, India, Nigeria, Russia, the U.K., and Hong Kong. The small number of
immigrants from other countries are distributed evenly over these countries to simplify analysis – we
will not have to collect flight information from all countries – and not interfere with estimates. Once the
percentages are adjusted, we multiply the new percentages by the original visa count to determine the
number of EB-5 immigrants travelling from each country/region.
By employing this method, we assume that all EB-5 immigrants fly out of their country of origin.
However, since 96 percent of the immigrants originate from the countries/regions listed, and flight
spending constitutes one of the smallest portions of all EB-5 spending, we find this assumption
reasonable.
Using the list of countries above, we research flight information for flights from each country to the U.S.
We attempt to simulate an actual consumer experience – Google Flights was used to find the cheapest
flights from major hubs in each country to a major hub in the United States. In consultation with IIUSA,
flights in late summer were chosen as the most likely for EB-5 investors to have chosen. After
researching current methods on searching for the cheapest airfare, we chose to research flights on the
weekend as that is the time of week when airfare is advertised at its lowest, on average. Please note,
the flights we chose were not necessarily on the weekend, but rather the weekend is when airfare
Annual Household Expenditure 150,000$ Automobile Cost* 30,700$ Attorney Fee 50,000$ Regional Center Fee 18,000$ Broker 5,000$
Table 7: Key Cost Assumptions, FY2014-2015
Per Investor Costs Value
*2015 Ford Explorer starting at $30,700 (quote as of 10/23/2017)

25 | Quantitative Assessment of the EB-5 Program
research was conducted. Flights were chosen based on both price and route, so more expensive flights
were chosen if cheaper flights resulted in long layover times.
In addition, a report from the International Air Transport Association (IATA) estimated that 14.4 percent
of global airline revenues are used to pay for airport infrastructure, and this information has not
changed since the 2013 report50. After consultation with IIUSA, we assume that half of those airport fees
went to foreign airports (Kay 2015), therefore, for U.S. airlines, we add the base fare and U.S. airport fee
and reduce the total by 7.2 percent for the amount that flows to foreign airports. This number is
representative of airline revenues, per flight, that will impact the U.S. economy. For taxes and fees, we
take the assumption of the 2013 report that half flows to foreign governments while the other half
enters the U.S. economy. The results of this process are in Table 8.
The U.S. portion of ticket prices is multiplied by our adjusted visa count from each country to determine
flight expenditures for each country. All revenues from foreign airlines are not included as they will not
have measurable impacts on the U.S. economy, although U.S. airport fees and tax shares are retained.
These results are summarized in Table 8.
The next step is to calculate the domestic flight expenditures. In the instance that a state does not
contain an international hub, airfare is researched (in the same method as international flights) from
major international hubs in the United States to the largest airport in each state. The shortest flights
from major U.S. airports to each state are chosen to ensure the most cost-effective airfare. Table A2 in
Appendix 1 contains information on the domestic flights chosen.
Once these flights are estimated, the prices are multiplied by state-level visa counts – obtained from the
household spending model – to determine domestic flight expenditures. The results from all states that
require a domestic flight are summed and then added to the international total to find a grand total of
flight expenditures for IMPLAN. The sector under which flight expenditures, airport fees, and airline
taxes are reported in IMPLAN can be seen in Table 6.
Please note that flight expenditures, and all other EB-5 related immigration spending, are only modeled
nationally. Airlines have large operations spread all over the country, and there is no reliable way to
track the flows of revenue within each country besides the U.S.
50 International Air Transportation Association (2013). IATA Economic Briefing: Infrastructure Costs

Quantitative Assessment of the EB-5 Program | 26
Route Price Taxes and Fees Base Fare Fare to US US Taxes* US Airport Fee Airline Stops Layover
PVG-ICN-LAX 590.71$ $209.71 $381.00 $357.74 $100.36 $4.50 Asiana 1 3 h 20 mSGN-NRT-LAX 575.36$ $165.36 $410.00 $384.66 $78.18 $4.50 JAL** 1 1 h 25 mICN-SFO-LAX 530.70$ $70.27 $460.43 $431.46 $30.64 $4.50 United 1 2 h 25 mTPE-KIX-LAX 621.86$ $87.86 $534.00 $499.73 $39.43 $4.50 JAL** 1 1 h 25 mBOM-LHR-JFK 685.18$ $309.44 $375.74 $352.86 $150.22 $4.50 British Airways** 1 1 h 40 mSVO-JFK 370.47$ $151.47 $219.00 $207.41 $71.24 $4.50 Aeroflot 0 n/aLGW-JFK 343.90$ $156.00 $187.90 $178.55 $73.50 $4.50 Norwegian 0 n/aHKG-ICN-LAX 640.89$ $76.89 $564.00 $527.57 $33.95 $4.50 Korean Air 1 1 h 15 mIKA-SVO-JFK 491.05$ $216.05 $275.00 $259.38 $103.53 $4.50 Aeroflot 1 3 h 30 mLOS-CMN-JFK 723.56$ $342.56 $381.00 $357.74 $166.78 $4.50 Royal Air Maroc 1 5 h
Table 8: International flight prices for EB-5 immigrants, 2014 and 2015Departure: August 29th, 2018 (prices as of 10/22/2017)
Economy Class
*Half of the total for taxes and fees (minus $4.50 airport fee for US taxes)
Source: Google Flights**Booked with American Airl ines
CountryVisa
Count Visa %Adjusted
Visa %Adjusted Visa
CountFlight
Expenditure*China (Mainland) 7563 86.92% 87.34% 7599 $0.00Vietnam 249 2.86% 3.28% 285 $164,092.67South Korea 89 1.02% 1.44% 125 $66,443.64China (Taiwan) 124 1.43% 1.84% 160 $99,621.97Iran 54 0.62% 1.04% 90 $0.00India 71 0.82% 1.23% 107 $73,451.30Nigeria 37 0.43% 0.84% 73 $0.00Russia 60 0.69% 1.11% 96 $0.00United Kingdom 62 0.71% 1.13% 98 $0.00Hong Kong S.A.R. 30 0.34% 0.76% 66 $0.00Sub total 8339 95.84%Other Countries 362 4.16%Total 8701 100% 100% 8,701 $403,609.58Adjustment 0.42%US airport fees from foreign airlines $36,104.40US taxes from foreign airlines $800,481.63
Table 9: EB-5 flight expenditures by country of origin, 2015**
*Revenue to foreign airl ines not included
Source: Visa statistics from U.S. Department of State**Before being used as input for IMPLAN, these numbers were doubled to include 2014 effects

27 | Quantitative Assessment of the EB-5 Program
Moving Service Expenditures
Next, we estimate expenditures on international moving services. First, we average price quotes from a
selection of international moving companies based off the companies chosen for the 2013 economic
impact report (Kay 2015). Since most immigrants originate in China, and Los Angeles is the largest West
Coast port, Shanghai is chosen as the port of origin and Los Angeles the destination. Since there is no
way to know with any specificity how much money flows to these foreign companies, we adopt the
same conservative approach as the Kay (2015) and reduce all quoted prices by half. Multiplying the
quotes by the estimated number of EB-5 households provides an estimate for EB-5 spending on
international moving services.
Domestic moving services expenditures are then estimated. Only states without a Pacific port are given
estimates for domestic moving services, as they will most likely require further travel. All domestic
moving costs are estimated using Moving.com’s online calculator, which was utilized for the 2013
report. All estimates are reported in Appendix 1, Table A3. State-level visa counts are multiplied by
moving estimates for each state, and those prices are summed and added to international moving
expenditures to derive a grand total for moving expenditures. This number is then entered into our
national model in IMPLAN (see Table 6). As with flight expenditures and all other EB-5 immigration
related spending, we only model moving expenditures nationally. Moving services have national
operations and without further information there is no concrete way to track economic impacts at a
higher resolution than national.

Quantitative Assessment of the EB-5 Program | 28
Automobile Expenditures
IIUSA suggested that upon relocation, the majority of EB-5 households are likely to purchase a new
automobile. There is no data on actual expenditures, so we make an estimation based on several
assumptions. The first assumption is that each EB-5 household will purchase one (1) new, mid-sized and
mid-priced vehicle with enough capacity for a family. The 2015 Ford Explorer was chosen for this
assessment, after consultation with IIUSA. The manufacturer’s suggested retail price (MSRP) for the
2015 Ford Explorer, the car that would have been available to EB-5 immigrants in FY2015, was
researched and the price (Table 7) was multiplied by the number of EB-5 households (Table 4) to derive
total spending on new automobiles (Table 6). This grand total is modeled according to the sector outline
in Table 6, and is only modeled nationally due to the same reasons as moving services and flight
expenditures.
Investment and Legal Fees
EB-5 investors also face extensive legal and investment fees associated with the immigration and
investment processes. Due to no substantial change in these fees from earlier years, after consultation
with IIUSA and assorted media reports, we replicate the assumptions made in the 2013 study (Kay 2015)
here (see Table 7). To reiterate those assumptions, we assume that $50,000 is paid by every EB-5
CompanyMoving
Quote**Declared Value***
Insurance (% of value)
Insurance Estimate
Total Cost
Schumacher Cargo Logistics $8,385.42 $10,614.46 $0.04 $371.51 $8,756.93International Sea and Air Shipping $9,995.00 $10,614.46 $0.03 $318.43 $10,313.43Prisma Cargo Solutions $9,494.63 $10,614.46 $0.03 $318.43 $9,813.06Cardinal International $6,952.47 $10,614.46 $0.03 $318.43 $7,270.90UniGroup Relocation $15,921.68 $10,614.46 $0.03 $286.59 $16,208.27Legends Intl Transport $7,424.81 $10,614.46 $0.03 $318.43 $7,743.25Southern Winds International $7,743.25 $10,614.46 $0.03 $265.36 $8,008.61Average Cost $9,730.64Revenue to USA (1/2 of total)**** $4,865.32
Table 10: Price Quotes for moving service from Shanghai to LA*1 - 40' shipping container (Intl Sea and Air quote from October 2017, other quotes inflated from 2013 report)
**All quotes are inflated from 2013 report, except for International Sea and Air, due to difficulty contacting moving companies***Based on recommendation from Schumacher Cargo Logistics (2013 Report)****Discount for use of foreign moving company in Shanghai
*Includes packing, unpacking, and door-to-door shipment. Does not include taxes

29 | Quantitative Assessment of the EB-5 Program
household for attorney fees and an additional $5,000 is paid for an investment broker. Finally, $18,000
of the $30,000 regional center fee (60 percent) actually impacts the U.S. economy, with the rest going to
foreign intermediary agents that help promote the EB-5 projects among potential investors. To ascertain
the final amount of related expenditures, we multiply the approved I-526 form count by all fees, as
these fees are paid early in the process (see Tables 6 & 11). As with all Other EB-5 Spending, these fees
are only entered into the national model.
Federal Immigration Fees
Lastly, there are a variety of governmental fees associated with the EB-5 process. First, prospective EB-5
investors must fill out an I-526 application form for approval from the USCIS, which has an associated
$3,675 application fee. After USCIS approval, investors and immediate family members can apply for 2-
year temporary residency permits from DOS, which has an associated $345 fee. The visa application also
has an associated $220 immigration fee from the USCIS. After two years, if the investor has proof that
their investment led to 10 full-time jobs, they can apply for permanent visas. They prove this
requirement by filling out form I-829, which has an associated $3,750 application fee. An $85 biometric
fee also applies to every member of an EB-5 investors household.
To extrapolate expenditures from these fees, we first assume that all spending took place in FY2014 and
FY2015. For the fees associated with forms, we multiply form counts by the fees to derive expenditures.
Visa counts are multiplied by relevant fees (visa application, biometric, and immigration) to derive those
expenditures. All amounts are totaled and modeled according to Table 6 in IMPLAN. All impacts are
modeled nationally. Similar to household spending, LPP is set to IMPLAN’s SAM model value to utilize
regional purchasing coefficients, so that the percentage of government spending on local producers can
be most effectively estimated.

Quantitative Assessment of the EB-5 Program | 30
Economic Impact Results
As explained in the previous section, we estimate that immigrant investors have provided a total of
$11.23 billion in capital investment to 355 Regional Center projects that were active in 2014 and 2015.
The economic impacts of the EB-5 Regional Center Program not only derive from the EB-5 investment
through Regional Centers, but also stem from the related spending throughout the immigration process
of the foreign investor’s household. This section discusses aggregated and respective economic impacts
associated with all EB-5 immigration-related spending, including capital investment through Regional
Centers, investor’s household spending, and all other related immigration expenses.
All Related Spending by EB-5 Regional Center Investors
Analyzing all related spending by EB-5 Regional Center investors throughout their immigration process,
we estimate that more than 206,000 jobs are estimated to have been created or maintained for U.S.
workers in 2014 and 2015, accounting for 4 percent of U.S. private sector job growth during January
2015 to December 2015. 51 In addition, EB-5 Regional Center investor spending also contributed $33.56
billion to U.S. GDP and $4.14 billion in tax revenues ($2.68 billion in tax revenue for the federal
government and $1.46 billion in tax revenues for state and local government across the country, see
Table 12) during the two-year period. Figure 6 also illustrates the percentage of the economic impacts
associated with each spending category throughout the immigration process of EB-5 Regional Center
investors (capital investment, household spending, and other immigration related expenses) to the U.S.
economy in 2014 and 2015.
It is important to highlight that, although $2.68 billion accounts for less than 0.05 percent of the total
federal tax revenues collected in FY2014 and FY2015,52 the contribution by EB-5 Regional Center
investors to federal tax revenue is equivalent to 634 percent of the total appropriations that the
51 U.S. Bureau of Labor Statistics (BLS) estimated 5.228 million jobs were increased in U.S. private sectors from Jan 2014 to Dec 2015, Series Title: All employees, thousands, total private, seasonally adjusted, “Employment, Hours, and Earnings from the Current Employment Statistics survey (National)” https://beta.bls.gov/dataViewer/view/timeseries/CES0500000001 (accessed on November 9, 2017) 52 Office of Management and budget, Historical Tables, Table 1.3; https://obamawhitehouse.archives.gov/omb/budget/Historicals (accessed on November 15, 2017)

31 | Quantitative Assessment of the EB-5 Program
federal government made for the economic development programs through U.S. Economic
Development Administration (EDA) during that two-year period.53
53 EDA, Annual Reports 2014 (page 65, “Statement of Appropriations for Fiscal Year 2014”), 2015 (page 72, “Statement of Appropriations for Fiscal Year 2015”); https://www.eda.gov/annual-reports/ (accessed on November 15, 2017)
All EB-5 Immigration Related Spending = $12.505 billion
ImpactDirect Effect
(No. of U.S. Jobs)Indirect Effect
(No. of U.S. Jobs)Induced Effect
(No. of U.S. Jobs)Total Effect
(No. of U.S. Jobs)
Employment 67,076 69,024 70,577 206,676
ImpactDirect Effect($ Billions)
Indirect Effect($ Billions)
Induced Effect($ Billions)
Total Effect($ Billions)
Contribution to GDP $9.56 $12.32 $11.68 $33.56
Tax Revenues $1.08 $1.53 $1.53 $4.14
Federal $0.79 $0.96 $0.93 $2.68
State & Local $0.29 $0.57 $0.60 $1.46
Data Source: IIUSA FOIA of USCIS Form I-924A (Regional Center Annual Reporting to USCIS), 2013-2015; IIUSA Regional Center Database
* Note: The results include economic impacts associated with EB-5 investment through Regional Centers, investor's household spending, and other immigration expenses.
Table 12: Economic Impacts of All EB-5 Related Spending* (Regional Center Projects Only), 2014 and 2015

Quantitative Assessment of the EB-5 Program | 32
Furthermore, our nation-wide model showed that a total of 526 industry sectors benefited from the
capital investment by EB-5 investors made through Regional Centers in 2014 and 2015. To better
summarize the employment and income impacts by industry, we categorize the 526 IMPLAN sectors into
17 industries (see Table A4, Appendix 1), and find that an estimate of over 54,000 jobs are expected to
have been created or maintained for construction workers associated with the spending by EB-5
Regional Center investors in 2014 and 2015, representing 8 percent of the job growth in U.S.
construction industry during that two-year period. 54
Other industries that saw the highest employment impacts by EB-5investment and related spending in
2014 and 2015 include: hospitality (over 23,300 estimated jobs supported), retail (over 21,800
54 BLS estimated the number of job growth in construction sector was 639,000 from Jan 2014 to Dec 2015, Series Title: All employees, thousands, construction, seasonally adjusted, “Employment, Hours, and Earnings from the Current Employment Statistics survey (National)”; https://beta.bls.gov/dataViewer/view/timeseries/CES2000000001 (accessed on November 9, 2017)
EB-5 Investment, $29,790,000,000 , 89%
Household Spending, $2,104,319,453 , 6%
Immigration Expenses, $1,670,335,401 , 5%
Figure 6. Contributions to U.S. GDP by the EB-5 Regional Center Investor Spending, 2014 and 2015
Investment and Spendingby EB-5 Regional Center
investors in 2014 and 2015 contributed $33.56 billion
to the U.S. economy

33 | Quantitative Assessment of the EB-5 Program
estimated jobs supported), healthcare (over 20,500 estimated jobs supported), and professional services
(over 20,300 estimated jobs supported).Table 13 shows the summary of all industries impacted by EB-5
Regional Center investor spending in 2014 and 2015.
Sorted by employment impacts
IndustryExpected
Job Creation*Expected Contribution to U.S.
GDP (in $million)Construction 54,079 $8,009.72Hospitality 23,305 $1,770.81Retail 21,824 $2,936.05Healthcare 20,558 $1,803.58Professional Services 20,355 $2,274.60Manufacturing 13,334 $5,838.87Real Estate 8,129 $2,854.75Finance 7,863 $1,937.31Others 7,861 $1,055.14Education 6,274 $412.13Transportation 6,010 $1,003.61Art & Sports 5,574 $449.61Enginerring 4,127 $676.11Agriculture 2,558 $297.44Communication 2,314 $1,143.78Mining 1,217 $363.25Technology 795 $130.67Energy 500 $605.08Total 206,676 $33,562.50
Table 13: Economic Impact of All EB-5 Related Spending* (Regional Center Projects Only) by Industry, 2014 and 2015
Data Source: Form I-924A (Regional Center Annual Reporting to USCIS), 2013-2015; IIUSA Regional Center Database
* Note: The results include economic impacts associated with EB-5 investment through Regional Centers, investor's household spending, and other immigration expenses.

Quantitative Assessment of the EB-5 Program | 34
EB-5 Investments through Regional Centers
This section discusses the economic impact associated with the required capital investments that were
made by foreign investors through Regional Center projects that were active in 2014 and 2015. Since
such investment spending was introduced by the EB-5 Regional Center Program, its economic impacts
are deemed as the marginal increase on job creation, GDP, and tax revenues would not have occurred in
the U.S. economy without the Regional Center Program. Please note that, as explicated in the
methodology, the impacts for EB-5 investment in Puerto Rico and the Northern Mariana Islands are not
modelled due to lack of modelling data available for IMPLAN.
National Level Impacts
Using IMPLAN’s 2015 SAM data, an estimated 184,723 jobs were created for U.S. workers due to the
$11.23 billion in EB-5 capital investment through Regional Centers in 2014 and 2015. The employment
impact associated with EB-5 capital alone represents approximately 3.5 percent of the total job growth
among all private sectors in U.S. from January 2014 to December 2015.55
In addition, the EB-5 capital investment through Regional Centers alone is also expected to contribute
approximately $29.79 billion to U.S. GDP and a total of $3.66 billion to U.S. tax revenues in 2014 and
2015 (an estimated $2.37 billion to federal tax revenue and $1.28 billion tax revenues to state and local
governments across the country). The economic impacts generated by the EB-5 investor’s capital
investment through Regional Centers are summarized in Table 14.
Table 15 summarizes the employment and GDP impacts generated by the EB-5 capital investment made
through Regional Centers in 2014 and 2015 by industry. Approximately 53,800 construction jobs and
$7.97 billion in U.S. GDP resulted from the estimated $7.1 billion EB-5 investment spending made in
construction-related sectors in 2014 and 2015. The employment impact generated by the EB-5 spending
through Regional Centers on the construction industry accounts for 8.4 percent of the entire U.S.
construction job growth during that two-year period.56
Additionally, thanks to the EB-5 investment through Regional Centers alone in 2014 and 2015, the other
top five industries that had the largest employment impacts include: hospitality (estimated job creation:
21,031), retail (estimated job creation: 18,936), healthcare (estimated job creation: 17,138),
55 Supra note 49 56 Supra note 52

35 | Quantitative Assessment of the EB-5 Program
professional services (estimated job creation: 16,781), and manufacturing (estimated job creation:
12,074).
EB-5 capital investment into Regional Center projects = $11.23 billion
ImpactDirect Effect
(No. of U.S. Jobs)Indirect Effect
(No. of U.S. Jobs)Induced Effect
(No. of U.S. Jobs)Total Effect
(No. of U.S. Jobs)
Employment 60,580 61,314 62,828 184,723
ImpactDirect Effect($ Billions)
Indirect Effect($ Billions)
Induced Effect($ Billions)
Total Effect($ Billions)
Contribution to GDP $8.61 $10.78 $10.40 $29.79
Tax Revenues $0.94 $1.36 $1.36 $3.66
Federal $0.71 $0.84 $0.82 $2.37
State & Local $0.24 $0.52 $0.53 $1.28
Data Source: IIUSA FOIA of USCIS Form I-924A (Regional Center Annual Reporting to USCIS), 2013-2015; IIUSA Regional Center Database
Table 14: Economic Impacts of EB-5 Capital Investment Alone (Regional Center Projects Only), 2014 and 2015
Sorted by employment impacts
IndustryExpected Job
Creation*Expected Contribution
to U.S. GDPConstruction 53,796 7,962,907,353$ Hospitality 21,031 1,619,943,173$ Retail 18,936 2,589,114,562$ Healthcare 17,138 1,488,058,010$ Professional Services 16,781 1,874,863,293$ Manufacturing 12,074 5,186,168,741$ Real Estate 6,946 2,366,409,252$ Finance 6,059 1,503,598,464$ Others 5,985 798,811,348$ Education 5,676 365,256,347$ Transportation 5,163 863,354,456$ Art & Sports 4,985 404,908,971$ Enginerring 3,964 651,431,903$ Agriculture 2,238 254,485,806$ Communication 1,820 908,302,565$ Mining 1,107 329,664,224$ Technology 592 97,667,571$ Energy 432 522,901,931$ Total 184,723 29,787,847,970$
Table 15: Economic Impact of EB-5 Investment (Regional Center Projects Only) by Industry, 2014 and 2015
Data Source: IIUSA FOIA of USCIS Form I-924A (Regional Center Annual Reporting to USCIS), 2013-2015; IIUSA Regional Center Database

Quantitative Assessment of the EB-5 Program | 36
State Level Impacts
Table 16 summarizes the economic impacts associated with the EB-5 investment spending through the
Regional Center projects that were active in 2014 and 2015 by state, including the District of Columbia.
It is important to note that the state-level results are scaled to match the nation-wide model in order to
account for the state’s impacts to the rest of the country because of the inter-state economic activities,
such as domestic imports.
The largest number of estimated job creation by EB-5 investments through Regional Centers are in
California (estimated 53,223 jobs in 2014 and 2015), New York (48,231 jobs), Florida (20,261 jobs),
Washington (14,708 jobs), and Texas (14,310 jobs). The top ten states with the biggest number of
employment impacts account for 89 percent of total expected job creation, or 146,755 jobs, across the
country in 2014 and 2015.
In order to demonstrate the geographic distribution of impacts generated by EB-5 investments in
Regional Center projects across all states and District of Columbia, we create Maps 1, 2, and 3 to
illustrate to the estimated number of jobs created or maintained, contribution to GDP, and federal tax
revenue at state level.

37 | Quantitative Assessment of the EB-5 Program
Sacled based on the economic impact outputs from the national model
State/Territory EB-5 Investment
(in $million) Jobs Supported
Contribution to U.S. GDP (in $million)
Contribution to Federal Tax Revenue (in $million)
Contribution to State & Local Tax Revenue (in
$million)
Alabama 83.5$ 938 135.8$ 10.1$ 5.3$ Arizona 108.0$ 1,828 272.2$ 29.6$ 14.5$ Arkansas 4.7$ 29 3.2$ 0.3$ 0.4$ California 2,873.7$ 53,223 8,609.0$ 354.6$ 11.1$ Colorado 66.0$ 1,575 191.4$ 19.3$ 9.6$ Florida 890.8$ 20,261 2,496.2$ 246.6$ 138.7$ Georgia 88.9$ 1,498 218.5$ 18.4$ 10.2$ Hawaii 17.0$ 506 44.1$ 4.9$ 3.6$ Illinois 70.5$ 1,381 155.3$ 16.3$ 12.1$ Indiana 36.0$ 633 95.2$ 8.4$ 3.8$ Louisiana 51.8$ 939 141.2$ 12.2$ 5.7$ Maryland 302.0$ 4,505 711.3$ 69.7$ 41.9$ Massachusetts 54.5$ 902 150.8$ 16.5$ 6.6$ Michigan 29.0$ 612 79.9$ 7.4$ 3.8$ Minnesota 82.5$ 1,498 246.2$ 23.4$ 12.4$ Mississippi 53.5$ 810 123.9$ 9.0$ 11.2$ Montana 140.0$ 2,627 370.8$ 31.9$ 15.0$ Nevada 16.5$ 251 42.9$ 3.8$ 1.9$ New Jersey 80.2$ 1,418 295.4$ 27.8$ 16.7$ New Mexico 15.0$ 217 28.8$ 2.4$ 2.0$ New York 3,452.4$ 48,231 8,864.8$ 850.3$ 644.0$ North Carolina 187.0$ 3,342 494.1$ 40.3$ 20.7$ North Dakota 27.5$ 303 53.5$ 5.2$ 1.8$ Norther Mariana Islands 150.0$ * * * *Ohio 89.5$ 1,600 217.2$ 18.9$ 11.0$ Oregon 85.0$ 580 70.2$ 6.2$ 4.8$ Pennsylvania 161.5$ 1,721 322.8$ 26.8$ 13.3$ Puerto Rico 24.6$ * * * *South Carolina 2.9$ 52 7.6$ 0.6$ 0.3$ Tennessee 51.9$ 1,037 146.5$ 12.7$ 5.8$ Texas 818.7$ 14,310 2,455.3$ 229.4$ 100.3$ Utah 39.0$ 612 96.2$ 8.7$ 5.6$ Vermont 25.0$ 347 49.2$ 4.2$ 4.0$ Washington 883.4$ 14,708 2,312.7$ 232.5$ 132.8$ Washington DC 70.3$ 929 142.7$ 11.6$ 5.4$ Wisconsin 93.5$ 1,301 143.0$ 12.7$ 8.3$
Grand Total 11,226.1$ 184,723 29,787.8$ 2,372.5$ 1,284.3$
* IMPLAN's state-level models do not cover U.S. territories. Data Source: IIUSA FOIA of USCIS Form I-924A (Regional Center Annual Reporting to USCIS), 2013-2015; IIUSA Regional Center Database
Table 16: Economic Impact of EB-5 Investment (Regional Center Projects Only) by State, 2014 and 2015

Quantitative Assessment of the EB-5 Program | 38
Map 1: Estimated Job Supported by EB-5 Investment through Regional Centers, 2014 and 2015
Top Five States California -------------- 52,223 New York -------------- 48,231 Florida -------------- 20,261 Washington ----------- 14,708 Texas -------------- 14,310
Map 2: Estimated GDP Contribution by EB-5 Investment through Regional Centers, 2014 and 2015
Top Five States (in $billion) New York -------------- $8.86 California -------------- $8.61 Florida -------------- $2.50 Texas ------------- $2.46 Washington ----------- $2.31

39 | Quantitative Assessment of the EB-5 Program
Congressional District Level Impacts
Table 17 displays the economic benefits generated by EB-5 investment alone in 2014 and 2015 through
Regional Center projects for the top 30 congressional districts in terms of number of expected job
supported. Similar to the state level results, the congressional district level numbers are scaled to match
the nation-wide model in order to account for the economic activity between multiple congressional
districts.
69 percent ($7.745 billion) of the EB-5 investments made through Regional Centers in 2014 and 2015 are
concentrated in the top 30 congressional districts across 12 states. As a result, over 127,000 jobs were
expected to have been created for U.S. workers in these districts during the two-year period. To
illustrate the geographic distribution of the economic impacts generated by EB-5 investments in
Regional Center projects at congressional district level, Maps 4, 5, and 6 to visualize the estimated
number of jobs created or maintained, contribution to GDP, and federal tax revenue across the 166
congressional districts that received investments for EB-5 Regional Center projects in 2014 and 2015.
Map 3: Estimated Federal Tax Contribution by EB-5 Investment through Regional Centers, 2014 and 2015
Top Five States (in $million) New York -------------- $850 California -------------- $355 Florida -------------- $247 Washington ----------- $233 Texas -------------- $229

Quantitative Assessment of the EB-5 Program | 40
Sacled based on the economic impact outputs from the national model
Congressional District
EB-5 Investment (in $million)
Jobs Supported Contribution to
U.S. GDP (in $million)
Contribution to Federal Tax Revenue
(in $million)
Contribution to State & Local Tax Revenue
(in $million)
NY10 $1,663.00 18,956 $4,486.27 $336.04 $190.24NY12 $1,180.20 12,570 $3,156.47 $228.14 $125.56WA7 $595.00 11,796 $1,797.27 $172.24 $71.78CA34 $548.00 10,094 $1,530.08 $108.97 $66.38CA37 $520.00 9,456 $1,511.56 $113.14 $57.66CA28 $273.00 6,562 $791.70 $69.72 $37.36TX24 $264.90 4,859 $838.31 $64.98 $18.70MD8 $234.00 4,408 $722.76 $63.33 $29.46CA12 $313.70 4,216 $837.23 $67.30 $29.48NY11 $170.00 3,505 $250.88 $19.83 $44.73MT0 $140.00 3,385 $479.41 $35.22 $14.27TX30 $163.00 2,987 $522.35 $43.02 $11.82NY14 $110.00 2,882 $282.55 $22.73 $24.79CA33 $150.00 2,760 $436.43 $41.29 $18.17WA9 $178.90 2,706 $506.22 $38.98 $33.94NC1 $117.00 2,662 $349.89 $23.84 $10.70CA21 $78.30 2,000 $214.08 $17.88 $31.45CA41 $98.00 1,987 $304.76 $22.78 $12.31CA35 $92.00 1,889 $283.08 $26.22 $11.61TX23 $97.00 1,744 $252.88 $18.29 $9.40OH11 $86.00 1,737 $230.72 $15.51 $7.67CA32 $98.20 1,674 $267.20 $23.48 $12.20WI4 $72.00 1,658 $165.01 $12.12 $8.86NY4 $90.00 1,626 $284.48 $28.60 $12.61FL18 $48.10 1,560 $135.73 $14.39 $5.83TX32 $89.20 1,555 $267.25 $21.92 $7.99AZ5 $66.00 1,512 $232.30 $25.13 $7.45OR1 $80.00 1,481 $179.40 $13.64 $9.28WA6 $66.00 1,426 $212.78 $17.25 $8.48CA42 $63.00 1,400 $183.00 $15.18 $8.67Top 30 CDs $7,744.50 127,051 $21,712.04 $1,721.15 $938.84
Data Source: IIUSA FOIA of USCIS Form I-924A (Regional Center Annual Reporting to USCIS), 2013-2015; IIUSA Regional Center Database
Table 17: Top 30 Congressional District with Highest Impacts on Expected Jobs Supported by EB-5 Investment (Regional Center Projects Only), 2014 and 2015

41 | Quantitative Assessment of the EB-5 Program
Map 4: Estimated Job Supported by EB-5 Investment through Regional Centers by Congressional District (CD), 2014 and 2015
Top Five CDs NY10 -------------- 18,956 NY12 -------------- 12,570 WA7 -------------- 11,796 CA34 -------------- 10,094 CA37 -------------- 9,456
Map 5: Estimated GDP Contribution by EB-5 Investment through Regional Centers by Congressional District (CD), 2014 and 2015
Top Five CDs ($billion) NY10 -------------- $4.49 NY12 -------------- $3.16 WA7 -------------- $1.80 CA34 -------------- $1.53 CA37 -------------- $1.51

Quantitative Assessment of the EB-5 Program | 42
EB-5 Investors Household Spending
In this section, we analyze economic impacts associated with EB-5 household spending at three different
levels of impact – national, state, and congressional district.
National Impacts
Household spending is an annual, permanent impact on the US economy. We could model the present
value of all EB-5 household spending and use this as an input for our EB-5 models, which would result in
a very large impact. However, these impact analyses are undertaken at fixed price and technology levels.
This does not lend itself to longer studies, where these assumptions must be flexible. Therefore, we only
estimate the present value of household spending in the years under the scope of this report: FY2014-
2015. Also note that we only use IMPLAN for National models representing the 2014 and 2015 U.S.
economies, as well as 2015 models for states and congressional districts. For 2014 state and
congressional district models, we use a simpler method of estimation, which is detailed in the
methodology for household spending. The resulting impacts of EB-5 household spending are detailed in
Table 17.
Map 6: Estimated Federal Tax Contribution by EB-5 Investment through Regional Centers by Congressional District (CD), 2014 and 2015
Top Five CDs ($million) NY10 -------------- $336 NY12 -------------- $228 WA7 -------------- $172 CA37 -------------- $113 CA34 -------------- $109

43 | Quantitative Assessment of the EB-5 Program
According to our estimates, an estimated direct household spending of $917.94 million supported over
12,000 jobs in the U.S. and contributed $2.1 billion to U.S. GDP. Household spending also contributed
$168 million to federal tax revenues and $108 million to state and local tax revenues (see Table 17).
These results are the combination of direct, indirect, and induced effects associated with EB-5
household spending. In comparison to the contributions of EB-5 Regional Center investment this is a
small portion of the overall impact of the Regional Center Program, constituting roughly 6 percent of all
jobs supported and GDP contributed (see Figure 6). However, as noted above, the compounding nature
of household spending, as it is an annual payment, indicates that the present value of all household
spending to come from the EB-5 Regional Center Program is much larger than estimated here.
Therefore, this is a conservative estimate.
Table 18 shows the top 10 industries impacted by EB-5 household spending. Full-service restaurants
have the largest impact at 580 jobs supported while hospitals have the second largest impact, at 571
jobs supported. These impacts are unsurprising, as food and health care cost occupy a large portion of
any family’s annual consumption.
Summary of National IMPLAN Model (Direct HH Spending = $917.94 million)
ImpactDirect Effect
(No. of U.S. Jobs)Indirect Effect
(No. of U.S. Jobs)Induced Effect
(No. of U.S. Jobs)Total Effect
(No. of U.S. Jobs)
Employment 5,808 2,912 4,160 12,879
ImpactDirect Effect($ Millions)
Indirect Effect($ Millions)
Induced Effect($ Millions)
Total Effect($ Millions)
Contribution to GDP $829.29 $586.60 $688.42 $2,104.32
Tax Revenues $120.17 $66.89 $89.87 $276.94
Federal $69.14 $44.44 $54.59 $168.17
State & Local $51.03 $22.45 $35.28 $108.77
Table 17: Economic Impacts of EB-5 Regional Center Investors Household Spending, 2014 and 2015

Quantitative Assessment of the EB-5 Program | 44
State-level Impacts
All state-level impacts associated with EB-5 household spending can be found in Table 19. Both the level
of direct household spending and the impacts associated are listed. All impacts are totals of direct,
indirect, and induced effects. State level models are scaled up due to leakage from domestic imports as
can be seen in the methodology for household spending. This means that all state-level impacts should
be considered as representing economic impacts in each particular state, as well as impacts to the rest
of the country from domestic imports originating in that state.
Table 19 below is lists the number of jobs supported in each state by EB-5 household spending from
largest to smallest. Unsurprisingly, the states with the largest positive employment impacts also
received the largest amount of direct household spending by EB-5 investors and their families, for the
most part. The top five states for employment are California, Alabama, Florida, New York, and Texas.
Sector DescriptionExpected Jobs
SupportedExpected Contribution to
U.S. GDP (in $million)
501 Full-service restaurants 580 $ 28.66 482 Hospitals 571 $ 88.39 502 Limited-service restaurants 538 $ 44.68 440 Real estate 494 $ 103.08 395 Wholesale trade 356 $ 92.09 405 Retail - General merchandise stores 324 $ 23.42 475 Offices of physicians 311 $ 44.59 400 Retail - Food and beverage stores 308 $ 21.12 503 All other food and drinking places 279 $ 11.96 485 Individual and family services 271 $ 9.16
Table 18: Total Economic Impacts of All EB-5 Spending, 2014 and 2015Top 10 impacted sectors by employment (2015 National Model)
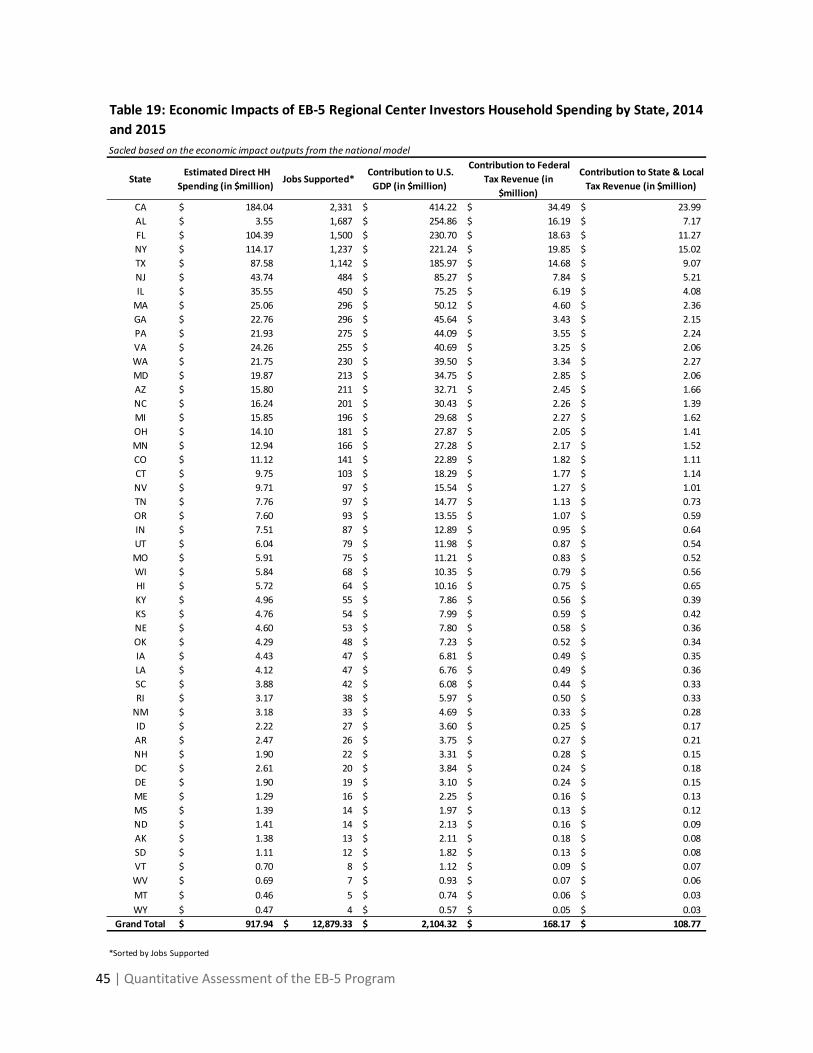
45 | Quantitative Assessment of the EB-5 Program
Sacled based on the economic impact outputs from the national model
State Estimated Direct HH
Spending (in $million) Jobs Supported*
Contribution to U.S. GDP (in $million)
Contribution to Federal Tax Revenue (in
$million)
Contribution to State & Local Tax Revenue (in $million)
CA 184.04$ 2,331 414.22$ 34.49$ 23.99$ AL 3.55$ 1,687 254.86$ 16.19$ 7.17$ FL 104.39$ 1,500 230.70$ 18.63$ 11.27$ NY 114.17$ 1,237 221.24$ 19.85$ 15.02$ TX 87.58$ 1,142 185.97$ 14.68$ 9.07$ NJ 43.74$ 484 85.27$ 7.84$ 5.21$ IL 35.55$ 450 75.25$ 6.19$ 4.08$
MA 25.06$ 296 50.12$ 4.60$ 2.36$ GA 22.76$ 296 45.64$ 3.43$ 2.15$ PA 21.93$ 275 44.09$ 3.55$ 2.24$ VA 24.26$ 255 40.69$ 3.25$ 2.06$ WA 21.75$ 230 39.50$ 3.34$ 2.27$ MD 19.87$ 213 34.75$ 2.85$ 2.06$ AZ 15.80$ 211 32.71$ 2.45$ 1.66$ NC 16.24$ 201 30.43$ 2.26$ 1.39$ MI 15.85$ 196 29.68$ 2.27$ 1.62$ OH 14.10$ 181 27.87$ 2.05$ 1.41$ MN 12.94$ 166 27.28$ 2.17$ 1.52$ CO 11.12$ 141 22.89$ 1.82$ 1.11$ CT 9.75$ 103 18.29$ 1.77$ 1.14$ NV 9.71$ 97 15.54$ 1.27$ 1.01$ TN 7.76$ 97 14.77$ 1.13$ 0.73$ OR 7.60$ 93 13.55$ 1.07$ 0.59$ IN 7.51$ 87 12.89$ 0.95$ 0.64$ UT 6.04$ 79 11.98$ 0.87$ 0.54$ MO 5.91$ 75 11.21$ 0.83$ 0.52$ WI 5.84$ 68 10.35$ 0.79$ 0.56$ HI 5.72$ 64 10.16$ 0.75$ 0.65$ KY 4.96$ 55 7.86$ 0.56$ 0.39$ KS 4.76$ 54 7.99$ 0.59$ 0.42$ NE 4.60$ 53 7.80$ 0.58$ 0.36$ OK 4.29$ 48 7.23$ 0.52$ 0.34$ IA 4.43$ 47 6.81$ 0.49$ 0.35$ LA 4.12$ 47 6.76$ 0.49$ 0.36$ SC 3.88$ 42 6.08$ 0.44$ 0.33$ RI 3.17$ 38 5.97$ 0.50$ 0.33$
NM 3.18$ 33 4.69$ 0.33$ 0.28$ ID 2.22$ 27 3.60$ 0.25$ 0.17$ AR 2.47$ 26 3.75$ 0.27$ 0.21$ NH 1.90$ 22 3.31$ 0.28$ 0.15$ DC 2.61$ 20 3.84$ 0.24$ 0.18$ DE 1.90$ 19 3.10$ 0.24$ 0.15$ ME 1.29$ 16 2.25$ 0.16$ 0.13$ MS 1.39$ 14 1.97$ 0.13$ 0.12$ ND 1.41$ 14 2.13$ 0.16$ 0.09$ AK 1.38$ 13 2.11$ 0.18$ 0.08$ SD 1.11$ 12 1.82$ 0.13$ 0.08$ VT 0.70$ 8 1.12$ 0.09$ 0.07$ WV 0.69$ 7 0.93$ 0.07$ 0.06$ MT 0.46$ 5 0.74$ 0.06$ 0.03$ WY 0.47$ 4 0.57$ 0.05$ 0.03$
Grand Total 917.94$ 12,879.33$ 2,104.32$ 168.17$ 108.77$
Table 19: Economic Impacts of EB-5 Regional Center Investors Household Spending by State, 2014 and 2015
*Sorted by Jobs Supported

Quantitative Assessment of the EB-5 Program | 46
Congressional District-level impacts
All congressional district-level impacts associated with EB-5 household spending can be found in Table
CD3. Both the level of direct household spending and the impacts associated are listed. All impacts are
totals of direct, indirect, and induced effects. Congressional district-level models are scaled up due to
leakage from domestic imports as can be seen in the methodology for household spending. This means
that impacts for each district should be considered as representing economic impacts in that district, as
well as impacts to the rest of the country from domestic imports originating in that district.
Since our weighting formula was designed to have an urban bias in settlement patterns, it is
unsurprising that many of the top districts for positive employment impacts also contain large cities.
Florida’s 24th, 27th, and 22nd District are in the top 5 and encompass portions of Miami and Ft.
Lauderdale, while California’s 34th and 12th districts fill out the top 5, encompassing parts of Los Angeles
and San Francisco.
FL24 17.03$ 609 93.99$ 2.85$ 4.21$ FL27 15.40$ 537 82.56$ 2.78$ 3.77$ CA34 14.52$ 421 70.95$ 2.05$ 3.67$ CA12 17.73$ 398 78.38$ 2.47$ 4.05$ FL22 10.43$ 353 55.38$ 1.66$ 2.52$ FL13 9.60$ 351 53.67$ 1.74$ 2.54$ CA37 12.52$ 351 56.97$ 1.73$ 3.23$ NJ8 13.01$ 345 62.92$ 2.14$ 3.55$ MA7 13.05$ 336 61.30$ 1.92$ 2.39$ NY15 12.26$ 324 50.21$ 1.42$ 3.68$ CA40 11.99$ 316 54.42$ 1.61$ 3.12$ FL23 9.27$ 311 47.53$ 1.69$ 2.19$ NY13 17.52$ 307 58.45$ 2.39$ 3.88$ NY7 11.03$ 304 53.81$ 1.95$ 3.70$ CA43 9.60$ 295 48.49$ 1.58$ 2.80$ CA46 9.65$ 293 50.55$ 1.64$ 2.68$ NY10 12.67$ 269 53.39$ 1.73$ 2.97$ NY9 11.45$ 266 39.84$ 1.21$ 2.85$ WA7 9.49$ 262 46.05$ 1.72$ 2.31$ TX9 8.74$ 262 42.93$ 1.46$ 1.99$ NV1 8.94$ 258 42.32$ 1.31$ 2.58$ TX20 7.26$ 255 38.14$ 1.14$ 1.83$ TX7 8.94$ 255 41.42$ 1.42$ 1.86$
NY12 12.03$ 251 51.07$ 1.57$ 2.68$ NJ10 9.38$ 249 44.26$ 1.51$ 2.50$
*Sorted by Jobs Supported
Contribution to Federal Tax Revenue (in $million)
Contribution to State & Local Tax Revenue (in $million)
CD3: Top 25 Employment Impacts by Congressional District, 2014 and 2015Household spending impacts scaled to match with National IMPLAN model
Congressional District
Estimated Direct HH Spending (in $million)
Jobs Supported*
Contribution to U.S. GDP (in $million)

47 | Quantitative Assessment of the EB-5 Program
Other EB-5 Immigration Spending
In this section, we summarize the economic impacts of all other spending associated with the EB-5
immigration process. These expenditures are one-time events associated with the EB-5 Regional Center
Program: flights, moving costs, automobile costs, investment fees, and legal fees. The effects are listed
in Table 20. These effects are modeled on a national level due to a lack of knowledge about specifically
how and where money was spent in the United States and the national infrastructure of many of the
industries involved. According to our estimates, spending associated with these services contributed
$1.6 billion to U.S. GDP and supported over 9,000 jobs. The expenses also created $139 million in
federal tax revenue and $67 million in state and local tax revenue (see Table 20). These represent the
totals of direct, indirect, and induced effects.
Table 21 breaks out the results of Table 20 into three categories. Investor/Legal Fees contains all legal
fees, Regional Center fees, and other assorted investment fees. Moving expenses contains automobile,
flight, and moving costs. Finally, Government Fees contains all EB-5 associated fees that go to
government, including taxes on foreign airlines. The largest category by far in terms of job employment
is the Investor/Legal Fees category, which supported roughly 5,600 jobs.
Finally, Table 22 lists the top 10 other EB-5 spending impacted sectors by employment. Surprisingly, the
real estate industry is most affected by other immigration spending, even though the spending
estimated in this report did not include home purchases. This may be due to moving expenses, but any
correlations at this point are speculation. It is interesting to note that the top affected industries for
employment do not include Legal Services, considering the prominent level of spending denoted in
Table 20 for the Investor/Legal fees category.
ImpactDirect Effect
(No. of U.S. Jobs)Indirect Effect
(No. of U.S. Jobs)Induced Effect
(No. of U.S. Jobs)Total Effect
(No. of U.S. Jobs)
Employment 688 4,798 3,588 9,074
ImpactDirect Effect($ Millions)
Indirect Effect($ Millions)
Induced Effect($ Millions)
Total Effect($ Millions)
Contribution to GDP $120.99 $955.41 $593.94 $1,670.34
Tax Revenues $20.50 $108.39 $77.52 $206.42
Federal $17.17 $75.10 $47.09 $139.36
State & Local $3.33 $33.29 $30.43 $67.05
Table 20: Economic Impacts of Other Immigration Related Expenses by EB-5 Regional Center Investors, 2014 and 2015Summary of National IMPLAN Model (Direct Other Immigration Costs = $1.39 billion)

Quantitative Assessment of the EB-5 Program | 48
Federal State & Local
Investor/Legal Fees 5,635 $958.42 $80.45 $39.26
Moving Expenses 1,870 $440.48 $29.86 $17.03
Government Fees 1,569 $271.43 $29.05 $10.77
Total 9,074 $1,670.34 $139.36 $67.05
Table 21: Total Economic Impacts of Other Related Immigration Expenses by EB-5 Investors, 2014 and 2015
Summary of National IMPLAN Model (Direct Other Immigration Costs = $1.39 billion)
Expense TypeJobs
SupportedContribution
to GDP (in $million)Tax Revenue (in $million)
Sector DescriptionJobs
SupportedContribution to GDP
(in $million)
440 Real estate 566 $118.19535 * Employment and payroll of federal govt, non-military 512 $86.72464 Employment services 372 $27.64501 Full-service restaurants 294 $14.51436 Other financial investment activities 277 $48.90395 Wholesale trade 264 $68.37465 Business support services 228 $13.53438 Insurance agencies, brokerages, and related activities 215 $40.76461 Management of companies and enterprises 213 $52.55502 Limited-service restaurants 205 $17.03
Table 22: Total Economic Impacts of Other EB-5 Spending, FY2014-2015Top 10 impacted sectors by employment (2015 National Model)

49 | Quantitative Assessment of the EB-5 Program
Discussions
Economic Contributions of EB-5 Regional Center Projects Full Capital Stack
Typically, funding from EB-5 investors represents only one part in the capital stack of a Regional Center
project. Other domestic financing sources, such as new market tax credit, developer equity, construction
loans, are also commonly utilized by Regional Centers to fund the entire development project along with
EB-5 capital. However, EB-5 investment plays an important role in allowing Regional Center operators to
raise the full amount of needed capital for the development of an EB-5 project. Since EB-5 investors are
primarily motivated by the immigration benefit rather than maximization of the financial returns, they
would accept a below market, if not minimal, return on their investment through Regional Centers.57
Thus, the low cost of EB-5 capital typically provides financial advantages for the Regional Center project
developers to raise the rest of needed funding from traditional lenders (such as banks). As the total
investment spending is associated with the full EB-5 capital stack, it’s important to assess the full scope
of economic contributions that are not only introduced by the EB-5 investments per se but also
supported by the non-EB-5 capital in a Regional Center project.
Based on DOC’s study, EB-5 investment is approximately 33 percent of the total investment spending
through Regional Center projects that were active in FY2012 and FY2013. Assuming this percentage is
representative and remains consistent among the Regional Center projects that were active in 2014 and
2015, we estimate that the total investment spending (including funding from EB-5 investors and other
domestic financing sources) through Regional Centers was $34.03 billion during that two-year period.
Using our nation-wide economic input-output model, the investment spending associated with EB-5
project center projects’ full capital stack is expected to create over 569,000 jobs for U.S. workers. In
addition, the spending by the full EB-5 capital stack also contributed an estimate of $91.81 billion in
U.S. GDP, $11.27 billion in tax revenues ($7.31 billion in federal tax revenue and $3.96 billion in tax
revenues for state and local governments). Table 23 summarizes the economic contributions generated
by the investment spending associated with the full capital stack of the EB-5 Regional Center projects
that were active 2014 and 2015.
57 Jeanne Calderon, Gary Friedland, “A Roadmap to the Use of EB-5 Capital: An Alternative Financing Tool for Commercial Real Estate Projects.” Stern School of Business, New York University, May 22, 2015, http://www.stern.nyu.edu/sites/default/files/assets/documents/EB5 percent20paper percent20final percent205.24.2015.pdf

Quantitative Assessment of the EB-5 Program | 50
EB-5 investment: $11.23 billion
Investment spending associated with the full capital stack: $34.03 billion
ImpactDirect Effect
(No. of U.S. Jobs)Indirect Effect
(No. of U.S. Jobs)Induced Effect
(No. of U.S. Jobs)Total Effect
(No. of U.S. Jobs)
Employment 186,883 188,713 193,620 569,215
ImpactDirect Effect($ Billions)
Indirect Effect($ Billions)
Induced Effect($ Billions)
Total Effect($ Billions)
Contribution to GDP $26.56 $33.21 $32.04 $91.81
Tax Revenues $2.91 $4.18 $4.18 $11.27
Federal $2.18 $2.59 $2.54 $7.31
State & Local $0.73 $1.59 $1.64 $3.96
Table 23: Economic Contributions of Full Capital Stack* (EB-5 Regional Center Projects Only), 2014 and 2015
* Note: Full capital stack refers to the total investment spending associated with a Regional Center project funded by EB-5 and non-EB-5 investments.
Data Source: IIUSA FOIA of USCIS Form I-924A (Regional Center Annual Reporting to USCIS), 2013-2015; IIUSA Regional Center Database

51 | Quantitative Assessment of the EB-5 Program
It is important to interpret the above impacts as the economic contributions associated with the EB-5
Regional Centers instead of the marginal increase (the economic impact) in employments or GDP
associated with the new investment that may not have occurred without the EB-5 Program. It’s clear
that the EB-5 portion of full capital stack represents the new investment that the EB-5 Program
introduces to the U.S. economy. However, the non-EB-5 portion of the project’s capital stack is derived
from the domestic financing sources that would have likely been invested in the U.S. economy with or
without the EB-5 Program. As the 2013 economic impact study (Kay 2015) noted, “an economic
contribution refers to jobs or income supported by existing levels of investment.” 58 Therefore, using this
terminology to interpret the impacts associated with the full EB-5 capital stack on U.S. economy would
be more accurate.
58 Page 54, supra note 25
Sorted by expected job creation
IndustryExpected
Job Creation*Expected Contribution to U.S.
GDP (in $million)Construction 166,067 24,582.20$ Hospitality 64,729 4,985.01$ Retail 58,262 7,967.26$ Healthcare 52,692 4,573.77$ Professional Services 51,700 5,776.37$ Manufacturing 37,235 15,989.40$ Real Estate 21,399 7,291.19$ Finance 18,664 4,631.99$ Others 18,442 2,461.14$ Education 17,464 1,123.85$ Transportation 15,912 2,660.99$ Art & Sports 15,360 1,247.45$ Enginerring 12,218 2,007.87$ Agriculture 6,892 783.84$ Communication 5,606 2,798.35$ Mining 3,420 1,018.11$ Technology 1,823 300.89$ Energy 1,330 1,611.19$ Total 569,215 91,810.88$
Table 24. Economic Contributions of Full Capital Stack* (EB-5 Regional Center Projects Only) by Industry, 2014 and 2015
* Note: Full capital stack refers to the total investment spending associated with a Regional Center project funded by EB-5 and non-EB-5 investments.
Data Source: Form I-924A (Regional Center Annual Reporting to USCIS), 2013-2015; IIUSA Regional Center Database

Quantitative Assessment of the EB-5 Program | 52
In addition, since DOC used project-level EIAs that projects investment and job creation impacts based
on the entire project spending (including funding from EB-5 investors and other non-EB-5 financial
sources) to assess the economic contributions of the EB-5 Program in FY2012 and FY2015, analyzing the
spending by the full capital stack associated with the Regional Center projects that were active in 2014
and 2015 allows us roughly estimate the growth of the EB-5 Regional Center project from 2012 to 2015
(see Table 25).
Investments through Stand-Alone Direct EB-5 Projects
The EB-5 Program provides two investment avenues for immigrant investors, one is through an EB-5
Regional Center and the other is through a stand-alone direct EB-5 project. Although a vast majority of
EB-5 investors choose Regional Center projects, a portion of the EB-5 investment is made through stand-
alone direct EB-5 projects. According to DOC, in FY2012 and FY2013, 226 (or 1.8 percent) EB-5 investors
invested in stand-alone projects at $1,000,000 level; while 202 (or 1.8 percent) investors chose stand-
alone projects located in TEAs that require a minimum investment of $500,000.
EB-5 investors who make their investment through stand-alone direct EB-5 projects are not allowed to
rely on an economic model to demonstrate whether or not their investment has created or maintained
10 full-time jobs for U.S. workers.59 Instead, USCIS requires employments “must be created directly by”
the NCE and requests such investors to attach documentations such as tax records, Form I-9, and/or
payroll records to the Form I-829 they submit for the removal of their conditional permanent residency.
However, since I-829 records are not available to the public, to estimate the job creation impact
resulted by direct EB-5 investments, we adopted DOC’s methodology that assumes each stand-alone
59 See Chapter 2. D. “Creation of Jobs” in Volume 6, Part G of the USCIS Policy Manual, supra note 6
Total EB-5 Non-EB-5
2012 and 2013* $16.37 $5.45 $10.92 169,759
2014 and 2015 $34.03 $11.23 $22.80 569,215
% change (two-year comparison) 108% 106% 109% 235%
* Note: 2012 and 2013 data is based on the DOC report on the EB-5 Program (published January 2017). Its estimates are based on fiscal year.Source: DOC, IIUSA FOIA of USCIS Form I-924A (Regional Center Annual Reporting to USCIS), 2013-2015; IIUSA Regional Center Database
Investment Spending ($ billions) Job Creation Estimate
Table 25: Total Investment and Job Creation from Active EB-5 Regional Center Projects, 2012-2015

53 | Quantitative Assessment of the EB-5 Program
direct EB-5 project would meet the minimum employment requirement of 10 jobs for each EB-5
investor.
Based on the Regional Center-Stand Alone investments ratio published at DOC’s report, plus the overall
statistics at USCIS’s Form I-526 dataset, we estimate that 983 foreign investors have provided
approximately $751,000,000 capital in stand-alone direct EB-5 investment in 2014 and 2015 (see Table
27), expecting to create or maintain 9,830 jobs for U.S. workers.
Conclusion
The purpose of this study is to evaluate the economic impacts and contributions associated with the EB-
5 Regional Center Program in 2014 and 2015 to the U.S. economy in terms of estimated number of jobs
supported, contribution to GDP, and contributions to tax revenues at national, state, and congressional
district level. Based on our methodology, we include a total of 355 EB-5 Regional Center projects active
in 2014 and 2015 into our analysis.
By using the IMPLAN economic impact modeling, we found that a total of $11.23 billion in capital
investment has been introduced to the U.S. economy due to the EB-5 Regional Center investors in 2014
and 2015. The EB-5 capital investment alone through Regional Centers is expected to have created over
184,700 jobs for U.S. workers over the two-year period; while all the related immigration spending by
EB-5 Investor applications (Form I-526 filings): 29,435Two-year average approval rate of I-526 petitions: 87.93%
Estimated qualifying EB-5 investors: 25,881
Investment Category
Estimated Number of EB-5 Investors
Percentage of Total EB-5 Investors
Estimated EB-5 Investment
Estimated Job Creation
$1M Stand-Alone Projects 518 2.0% $518,000,000 5,180
$500K Stand-Alone Projects 466 1.8% $233,000,000 4,660
Total 983 3.8% $751,000,000 9,830
Data Source: DOC, USCIS
Table 26: Estimates of EB-5 Investors and Investment Spending through Stand-Alone Direct EB-5 Projects, 2014 and 2015

Quantitative Assessment of the EB-5 Program | 54
EB-5 Regional Center investors is expected to have supported approximately 207,000 American jobs,
representing roughly 4 percent of the total job growth across all private sectors in U.S. from 2014 to
2015.
In addition, our analyses show that all related spending by EB-5 Regional Center investors over 2014 and
2015 was expected to contribute $33.56 billion in U.S. GDP and $4.14 billion in tax revenues for federal,
state, and local governments. As Congress established the EB-5 Program to promote regional economic
development in U.S., the estimated contribution of $2.68 billion in federal tax by EB-5 Regional Center
investors over the two-year period was equivalent to approximately 630 percent of the federal
appropriations to economic development grant programs through U.S. Department of Commerce’s
Economic Development Administration (EDA) in FY2014 and FY2015.
Lastly, we discuss the economic contributions associated with the investment spending of the full capital
stack through Regional Center projects, which was funded by both EB-5 immigrant investors and other
alternative domestic financing sources. Although EB-5 capital accounts for averaging one third of the
Regional Center project’s capital stack, we are not able to conduct a more accurate measurement but
rather a conservative estimate of the economic impacts associated with the Regional Center
development projects due to data scarcity. Using the estimates from DOC, our analyses show that an
estimate of 569,000 U.S. workers were expected to be by employed by EB-5 Regional Center’s new
commercial enterprises or job creating entities in 2014 and 2015.

55 | Quantitative Assessment of the EB-5 Program
Bibliography
Calderon J. & Friedland G. (2015). “A Roadmap to the Use of EB-5 Capital: An Alternative Financing Tool for Commercial Real Estate Projects.” New York, NY: Stern School of Business, New York University.
Economic Development Administration (EDA), U.S. Department of Commerce. (2014-2015), EDA Annual Reports, FY2014 and FY2015. Retrieved from https://www.eda.gov/annual-reports/
Henry D. et al. (2017). “Estimating the Investment and Job Creation Impact of the EB-5 Program U.S.” U.S. Department of Commerce. Retrieve from http://www.esa.doc.gov/reports/estimating-investment-and-job-creation-impact-eb-5-program
Investor.gov. (2013). “Investor Bulletin: Accredited Investors.” Retrieved 23 Sept. 2013, from www.investor.gov/additional-resources/news-alerts/alerts-bulletins/investor-bulletin-accredited-investors
International Air Transport Association. (Mar. 2013). “Infrastructure Costs.” IATA – Costs. Retrieved from www.iata.org/publications/economics/market-issues/Pages/costs.aspx.
ICF International. (2010). “Study of the United States Immigration Investor Pilot Program (EB-5).” Fairfax, VA: ICF International
International Monetary Fund. (1970-2017). “Foreign Direct Investment, Net Inflows (Bop, Current US$)” The Word Bank. Retrieve November 15, 2017 from https://data.worldbank.org/indicator/BX.KLT.DINV.CD.WD?locations=US
Kay, D et al. (2013). “Economic Impacts of the EB-5 Immigration Program, 2010-2011.” Charlotte, NC: MIG, Inc.
Kay, D. (2014). “Economic Impacts of the EB-6 Immigration Program, 2012.” Charlotte, NC: IMPLAN Group, LLC
Kay, D. (2015). “The Economic Impact and Contribution of the EB-5 Immigration Program, 2013.” Charlotte, NC: Alward Institute for Collaborative Science
United States, Congress, Bureau of Economic Analysis. (2015). “National Data: GDP and Personal Income, 2015.” U.S. Dept. of Commerce. www.bea.gov/iTable/iTable.cfm?reqid=19&step=2#reqid=19&step=3&isuri=1&1921=survey&1903=58.
United States of America, Congress, Office of Immigration Statistics. (2014-2015). “Yearbook of Immigration Statistics.” Yearbook of Immigration Statistics (2014-2015), U.S. Dept. of Homeland Security. www.dhs.gov/immigration-statistics/yearbook.
United States of America, State Department, Visa Office. (n.d.). Report of the Visa Office (2014-2016). Retrieved from https://travel.state.gov/content/visas/en/law-and-policy/statistics.html

Quantitative Assessment of the EB-5 Program | 56
U.S. Bureau of Labor Statistics. (2017). Survey Title: “Employment, Hours, and Earnings from the Current Employment Statistics survey (National).” Series Title: “All Employees, Thousands, Total Private, Seasonally Adjusted, 2014-2015.” Retrieved November 9, 2017, from https://beta.bls.gov/dataViewer/view/timeseries/CES0500000001
U.S. Bureau of Labor Statistics. (2017). Survey Title: “Employment, Hours, and Earnings from the Current Employment Statistics survey (National).” Series Title: “All Employees, Thousands, Construction, Seasonally Adjusted, 2014-2015.” Retrieved November 9, 2017, from https://beta.bls.gov/dataViewer/view/timeseries/CES2000000001
U.S. Department of Homeland Security, Office of Inspector General. (December 2013). “United States Citizenship and Immigration Services’ Employment Based Fifth Preference (EB5) Regional Center Program.” Retrieve from https://www.oig.dhs.gov/assets/Mgmt/2014/OIG_14-19_Dec13.pdf
U.S. Citizenship and Immigration Services. (August 2017). Policy Manual, Volume 6, Part G. Retrieved November 19, 2017, from https://www.uscis.gov/policymanual/HTML/PolicyManual-Volume6-PartG.html
U.S. Citizenship and Immigration Services. Immigrant Investor Regional Centers. Retrieved November 3, 2017, from https://www.uscis.gov/working-united-states/permanent-workers/employment-based-immigration-fifth-preference-eb-5/immigrant-investor-regional-centers
U.S. Citizenship and Immigration Services. Data Set: Form I-526 Immigrant Petition by Alien Entrepreneur (2012-2016). Retrieved November 3, 2017, from https://www.uscis.gov/tools/reports-studies/immigration-forms-data/data-set-form-i-526-immigrant-petition-alien-entrepreneur
U.S. Citizenship and Immigration Services. Data Set: Form I-526 Immigrant Petition by Alien Entrepreneur (2012-2016). Retrieved November 3, 2017, from https://www.uscis.gov/tools/reports-studies/immigration-forms-data/data-set-form-i-526-immigrant-petition-alien-entrepreneur
U.S. Citizenship and Immigration Services. (2010). “USCIS Responses to Independent Study of the EB-5 Program.” Washington, D.C.: USCIS
U.S. Office of Management and Budget. (2009). “Table 1.3—Summary of Receipts, Outlays, and Surpluses or Deficits (-) in Current Dollars, Constant (FY 2009) Dollars, and as Percentages of GDP: 1940–2021.” Retrieved November 15, 2017 from https://obamawhitehouse.archives.gov/omb/budget/Historicals

57 | Quantitative Assessment of the EB-5 Program
About the Authors
The Center for Economic and Business Research is an outreach center of Western Washington University
located within the College of Business and Economics. The Center connects the resources found
throughout the University to assist for-profit, non-profit, government agencies, quasi-government
entities and tribal communities in gathering and analyzing useful data. We use a number of
collaborative approaches to help inform our clients so that they are better able to hold policy
discussions and craft decisions.
The Center employs students, staff and faculty from across the University as well as outside resources to
meet the individual needs of those we work with. Our work is based on academic approaches and rigor
and not only provides a neutral analysis perspective but also provides applied learning opportunities.
We focus on developing collaborative relationships with our clients and not simply delivering an end
product.
The approaches we utilize are insightful, they are useful, and they are all a part of the debate
surrounding the topics we explore; however, none are absolutely fail-safe. Data, by nature, is challenged
by how it is collected and how it is leveraged with other data sources; following only one approach
without deviation is ill-advised. We provide a variety of insights within our work – not only on the topic
at hand but the resources (data) that inform that topic.
We are always seeking opportunities to bring the strengths of Western Washington University to
fruition within our region. If you have a need for analysis work or comments on this report, we
encourage you to contact us at 360-650-3909. To learn more about CEBR visit us online at
https://cbe.wwu.edu/cebr/center-economic-and-business-research.
The Center for Economic and Business Research is directed by Hart Hodges, PhD and James McCafferty.

Quantitative Assessment of the EB-5 Program | 58
Appendix
Appendix 1: Additional Tables
NAICS Code IMPLAN Sector IMPLAN Description
1113 4 Fruit farming1114 6 Greenhouse, nursery, and floriculture production1141 17 Commercial fishing1151 19 Support activities for agriculture and forestry
211120 20 Extraction of natural gas and crude petroleum211130 21 Extraction of natural gas liquids
2123 30 Stone mining and quarrying2131 37 Drilling oil and gas wells
236220 52 Construction of new health care structures236210 53 Construction of new manufacturing structures236220 55 Construction of new educational and vocational structures237310 56 Construction of new highways and streets236220 57 Construction of new commercial structures, including farm structures237990 58 Construction of other new nonresidential structures236115 59 Construction of new single-family residential structures236116 60 Construction of new multifamily residential structures236117 61 Construction of other new residential structures
3111 65 Dog and cat food manufacturing3115 87 Dry, condensed, and evaporated dairy product manufacturing
312120 108 Breweries312130 109 Wineries313310 117 Textile and fabric finishing mills313320 118 Fabric coating mills
3323 238 Fabricated structural metal manufacturing3351 325 Electric lamp bulb and part manufacturing3363 354 Motor vehicle seating and interior trim manufacturing3369 365 Motorcycle, bicycle, and parts manufacturing3371 372 Institutional furniture manufacturing4232 395 Wholesale trade4413 396 Retail - Motor vehicle and parts dealers4421 397 Retail - Furniture and home furnishings stores4451 400 Retail - Food and beverage stores4523 405 Retail - General merchandise stores4831 410 Water transportation4841 411 Truck transportation4871 414 Scenic and sightseeing transportation and support activities for transportation4931 416 Warehousing and storage5121 423 Motion picture and video industries5239 436 Other financial investment activities5311 440 Real estate5411 447 Legal services5412 448 Accounting, tax preparation, bookkeeping, and payroll services5413 449 Architectural, engineering, and related services5414 450 Specialized design services
541611 454 Management consulting services541620 455 Environmental and other technical consulting services
5418 457 Advertising, public relations, and related services5419 460 Marketing research and all other miscellaneous professional, scientific, and technical services5611 462 Office administrative services5619 470 Other support services6111 472 Elementary and secondary schools6113 473 Junior colleges, colleges, universities, and professional schools6115 474 Other educational services
621111 475 Offices of physicians621210 476 Offices of dentists
6213 477 Offices of other health practitioners6214 478 Outpatient care centers
621610 480 Home health care services622210 482 Hospitals
6233 483 Nursing and community care facilities6241 485 Individual and family services
713110 494 Amusement parks and arcades71312 495 Gambling industries (except casino hotels)72111 499 Hotels and motels, including casino hotels
7212 500 Other accommodations 722511 501 Full-service restaurants
7442 503 All other food and drinking places81293 512 Other personal services
8139 515 Business and professional associations
Table A1: NAICS to IMPLAN Sector Crosswalk, 2017

59 | Quantitative Assessment of the EB-5 Program
Price Airline Stops LayoverDFW-BHM 212.00$ American 0 0LAX-ANC 173.00$ Alaska 0 0DFW-LIT 124.00$ American 0 0LAX-PHX 96.00$ Delta 0 0LAX-DEN 106.00$ American 0 0JFK-DCA-BDL 221.00$ American 1 1 h 11 mLAX-HNL 299.00$ Hawaiian 0 0LAX-BOI 92.00$ United 0 0ORD-IND 85.00$ United 0 0ORD-DSM 158.00$ United 0 0ORD-MCI 102.00$ American 0 0ORD-SDF 94.00$ Delta 0 0ORD-MSY 97.00$ Spirit 0 0JFK-PWM 88.00$ Delta 0 0ORD-DTW 85.00$ Delta 0 0ORD-MSP 87.00$ Spirit 0 0DFW-JAN 197.00$ American 0 0DFW-STL 139.00$ American 0 0SEA-BIL 139.00$ Alaska 0 0ORD-OMA 102.00$ American 0 0LAX-LAS 44.00$ Alaska 0 0JFK-DCA-MHT 246.00$ American 1 2 h 34 mLAX-ABQ 108.00$ United 0 0ORD-MSP-FAR 323.00$ Delta 1 45 mORD-CVG 68.00$ United 0 0DFW-TUL 88.00$ American 0 0SEA-PDX 91.00$ Alaska 0 0JFK-DCA-PVD 183.00$ American 0 0ATL-CAE 148.00$ Delta 0 0ORD-IND-DEN-FSD 249.00$ United 2 3 h 8 mORD-DTW-BNA 152.00$ Delta 1 39 mLAX-SLC 78.00$ United 0 0JFK-DCA-BTV 211.00$ American 1 5 h 10 mDCA-CRW 233.00$ American 0 0ORD-MKE 114.00$ United 0 0LAX-DEN-CYS 190.00$ American, Great Lakes 1 12 h 27 m*If large intl airport present in stae then domestic fl ight is unnecessary
Table A2: Domestic flight prices from Google Flights, 2018Departure: September 1st, 2018 (Prices observed October 22nd, 2017)
Route*Economy Class

Quantitative Assessment of the EB-5 Program | 60
City State PriceBirmingham Alabama 10,169.00$ Little Rock Arkansas 8,982.00$ Phoenix Arizona 5,507.00$ Denver Colorado 7,158.00$ Hartford Connecticut 12,166.00$ Washington, DC DC 11,646.00$ Dover Delaware 11,567.00$ Miami Florida 11,277.00$ Atlanta Georgia 10,452.00$ Boise Idaho 6,595.00$ Chicago Illinois 9,957.00$ Indianapolis Indiana 10,137.00$ Des Moines Iowa 9,013.00$ Kansas City Kansas 8,422.00$ Lexington Kentucky 10,171.00$ New Orleans Louisiana 9,591.00$ Portland Maine 12,427.00$ Boston Massachusetts 12,238.00$ Baltimore Maryland 11,616.00$ Detroit Michigan 10,509.00$ Minneapolis Minnesota 9,350.00$ Jackson Mississippi 9,622.00$ St. Louis Missouri 9,309.00$ Billings Montana 7,671.00$ Omaha Nebraska 8,736.00$ Charlotte North Carolina 11,015.00$ Fargo North Dakota 9,065.00$ Newark New Jersey 12,112.00$ Albuqurque New Mexico 6,588.00$ Las Vegas Nevada 4,966.00$ Manchester New Hampshire 12,233.00$ New York City New York 12,247.00$ Columbus Ohio 10,429.00$ Oklahoma City Oklahoma 8,127.00$ Philadelphia Pennsylvania 11,634.00$ Providence Rhode Island 12,177.00$ Charleston South Carolina 10,981.00$ Sioux Falls South Dakota 8,763.00$ Nashville Tennessee 9,836.00$ Houston Texas 8,711.00$ Salt Lake City Utah 6,222.00$ Burlington Vermont 11,835.00$ Virginia Beach Virginia 11,561.00$ Charleston West Virginia 10,721.00$ Milwaukee Wisconsin 9,885.00$ Cheyenne Wyoming 7,299.00$
Table A3: Prices for Domestic Moving Services, 2017(Estimates obtained from Moving.com on 10/22/2017)
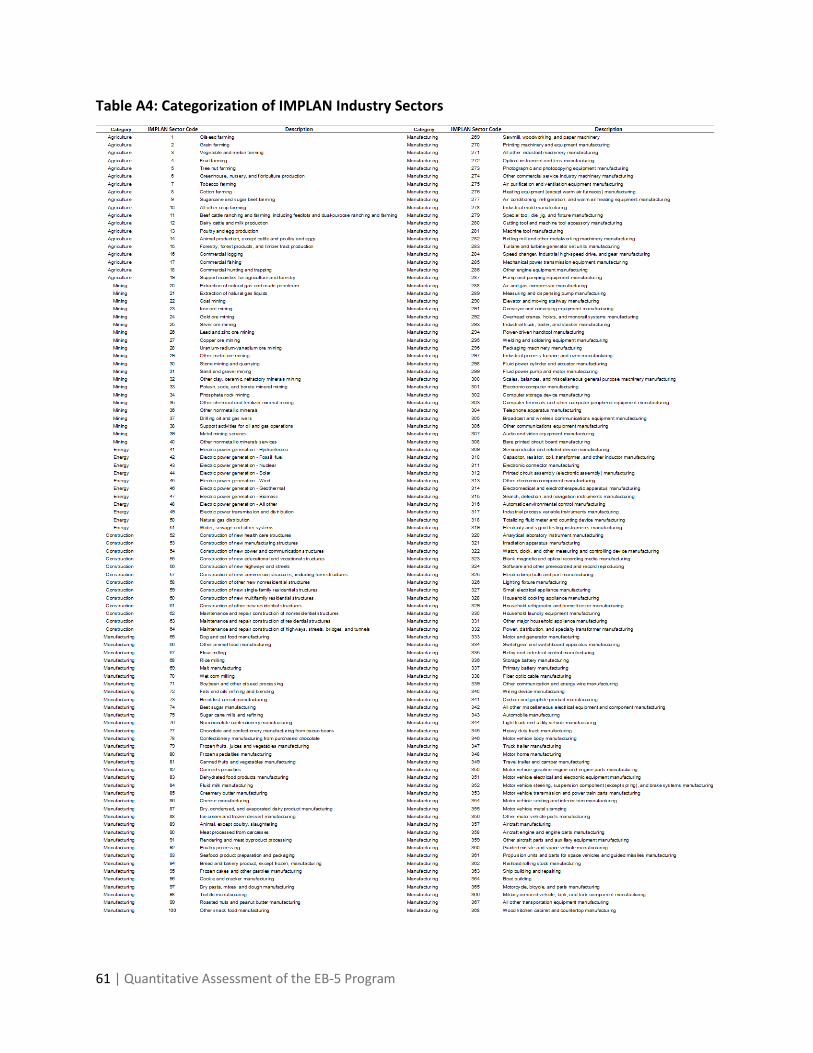
61 | Quantitative Assessment of the EB-5 Program
Table A4: Categorization of IMPLAN Industry Sectors

Quantitative Assessment of the EB-5 Program | 62
Table A4: Categorization of IMPLAN Industry Sectors (Cont.)

63 | Quantitative Assessment of the EB-5 Program
Table A4: Categorization of IMPLAN Industry Sectors (Cont.)

Quantitative Assessment of the EB-5 Program | 64
Appendix 2: Congressional district weighting for household spending In order to reflect an assumed urban bias in the settlement pattern of EB-5 households, the following weight is used to distribute a state’s household spending estimate to each of its congressional districts:
1)
Where wi is the weighting used to distribute a portion of a state’s household spending estimate to a
given congressional district i located within that state,
i – n are the congressional districts within a given state,
Ai is the area in square miles of a given congressional district i This particular weighting distributes a state’s household spending estimate to each of its congressional districts in a manner that is inversely proportional to the congressional district’s geographic size. The weighting is used to reflect an assumed urban bias in the settlement pattern of EB-5 households. The sum of weights assigned to congressional districts within a state is as follows:
2)
Where wi is the weighting used to distribute a portion of a state’s household spending estimate to a
given congressional district i located within that state,
i – n are the congressional districts within a given state Normalizing within-state weights so that they sum to 1 ensures that within-state Congressional District estimates sum to the total state spending estimate.


![How Deep Is Your Love - dreamusic7.web.fc2.com€¦ · Eb AhAAhhAh Eb maj7 Eb 6 Eb maj7 5 AAhhAh Eb Eb maj7 Eb 6 [M2] Fm7/Bb IIII know knowknow your your 9 Eb Gm7 eyesineyes iinninthe](https://img.pdfslide.us/doc/110x75/5f82817213abe7470b0fcd74/how-deep-is-your-love-eb-ahaahhah-eb-maj7-eb-6-eb-maj7-5-aahhah-eb-eb-maj7-eb.jpg)