Embed Size (px)
Citation preview

Economic Impact Study

Presented by:Name, Title
Presented to:Name
Date:October 23, 2017
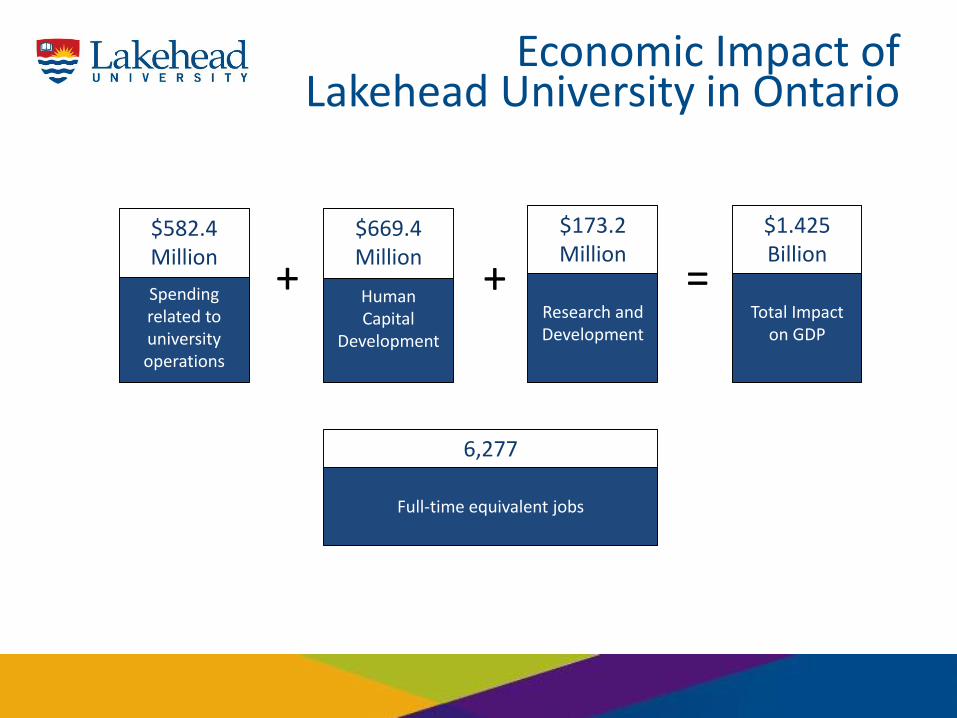
Economic Impact of Lakehead University in Ontario
Spending related to university operations
$582.4 Million
Human Capital
Development
$669.4 Million
Research and Development
$173.2 Million
Total Impact on GDP
$1.425 Billion
+ + =
Full-time equivalent jobs
6,277

BACKGROUND
Brief History
• Lakehead University evolved from the Lakehead Technical Institute, which was established in 1946.
• From LTI, Lakehead became the Lakehead College of Arts, Science and Technology in 1956.
• The Lakehead University Act was given Royal Assent by the Lieutenant Governor of Ontario and Lakehead University was established on July 1, 1965.
About Lakehead
“Dynamic, modern, and highly learner-centred, we acknowledge all of our students as valued leaders of tomorrow, whose education and success are most
paramount to our institution. Both campuses in Thunder Bayand Orillia promise the total university experience:
a blend of academic excellence and opportunity with a richvariety of social and recreational activities.”

Lakehead's Mission & Vision
Mission
To be recognized as an innovative comprehensive university that provides an education that is about how to think, not what to think.
Vision
To provide a transformative university experience that is far from ordinary.
“Lakehead University is committed to excellence in serving all those in our community including those with disabilities.”

Faculties
• Business Administration
• Education
• Engineering
• Natural Resources Management
• Graduate Studies
• Health and Behavioural Sciences
• Medical School
• Law
• Science and Environmental Studies
• Social Sciences and Humanities

Key Statistics
• Over 55,000 alumni around the world
• Top 10 in Canada’s Primarily Undergraduate Universities (Macleans 2016)
• #1 in undergraduate Research University in Canada (Research Infosource)
• Over 8,600 students, with over 1,400 on-campus
• Over 315 full-time faculty and over 1,840 staf
• 70% of full-time students come from outside the local commuting area

METHODOLOGY
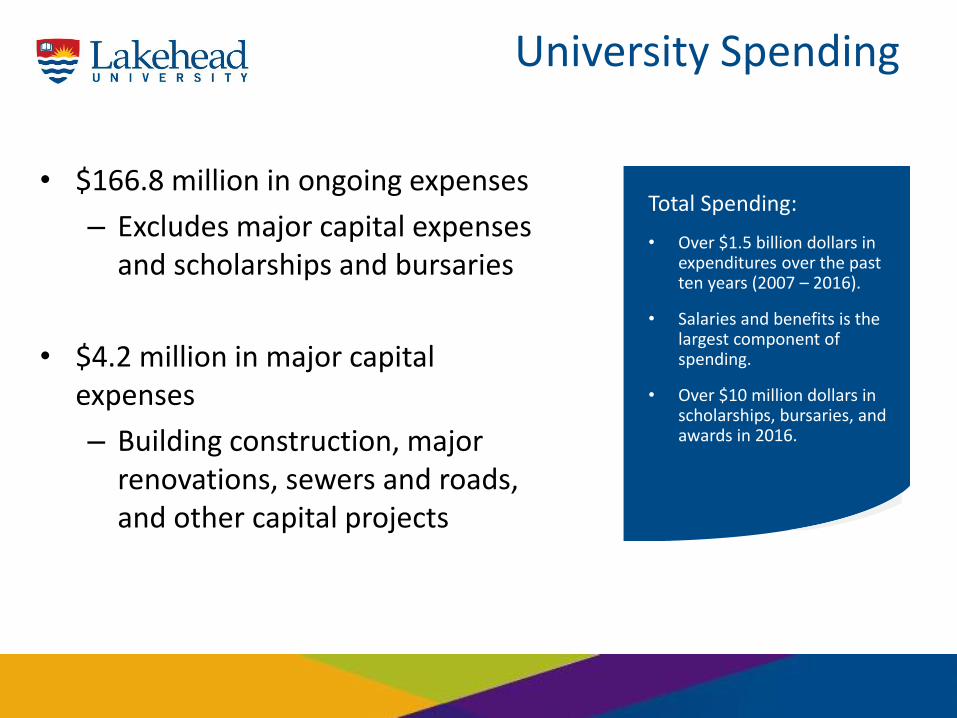
University Spending
• $166.8 million in ongoing expenses
– Excludes major capital expenses and scholarships and bursaries
• $4.2 million in major capital expenses
– Building construction, major renovations, sewers and roads, and other capital projects
Total Spending:
• Over $1.5 billion dollars in expenditures over the past ten years (2007 – 2016).
• Salaries and benefits is the largest component of spending.
• Over $10 million dollars in scholarships, bursaries, and awards in 2016.
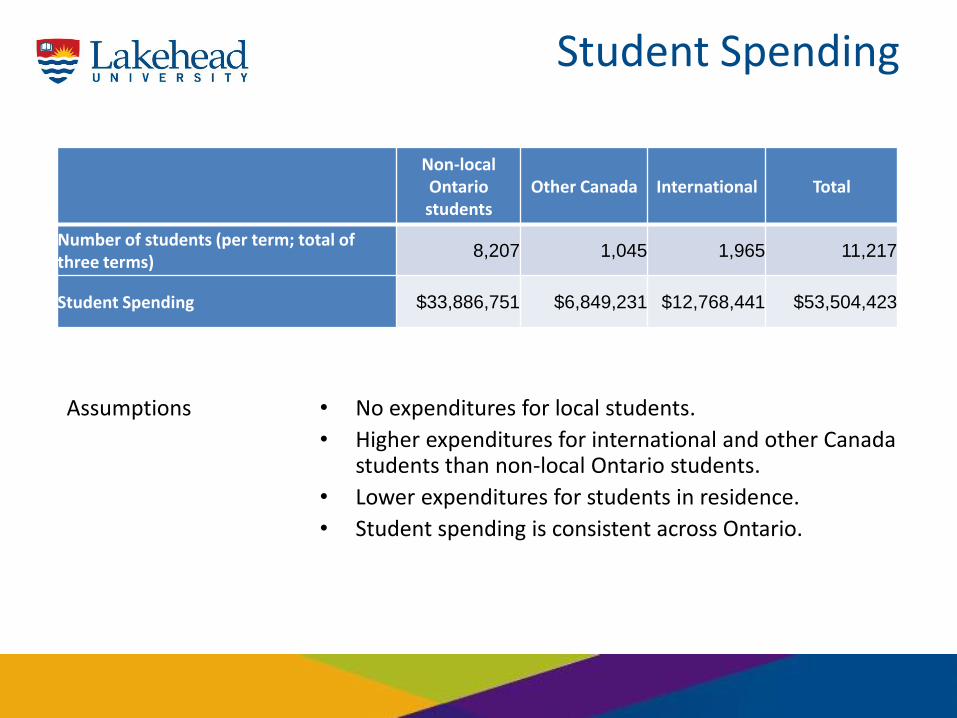
Student Spending
• No expenditures for local students.
• Higher expenditures for international and other Canada students than non-local Ontario students.
• Lower expenditures for students in residence.
• Student spending is consistent across Ontario.
Non-local Ontario students
Other Canada International Total
Number of students (per term; total of three terms)
8,207 1,045 1,965 11,217
Student Spending $33,886,751 $6,849,231 $12,768,441 $53,504,423
Assumptions
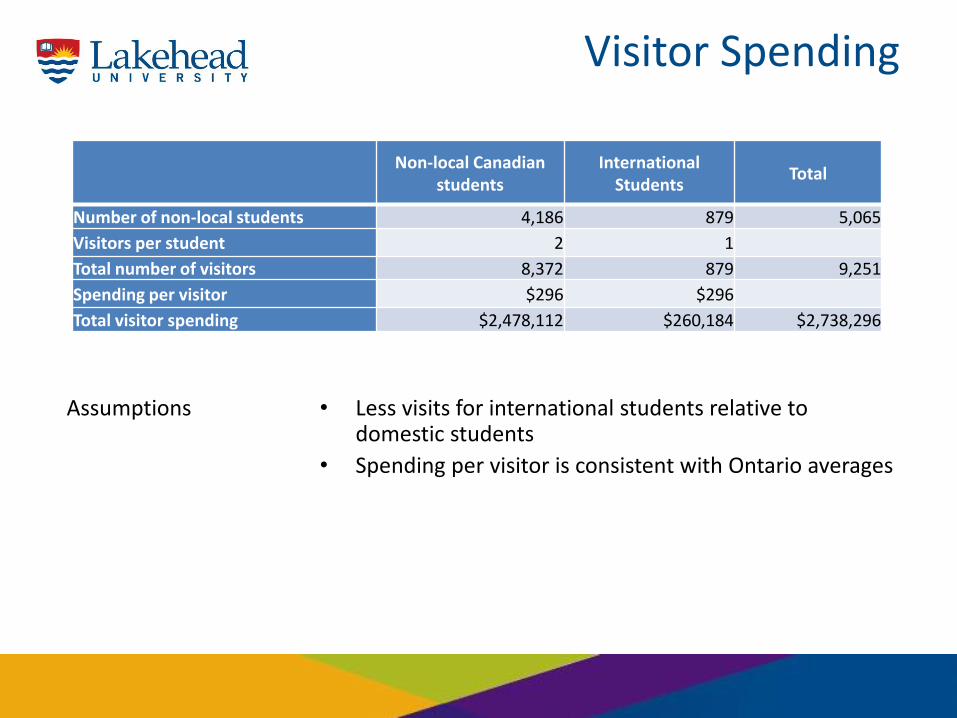
Visitor Spending
• Less visits for international students relative to domestic students
• Spending per visitor is consistent with Ontario averages
Assumptions
Non-local Canadian students
International Students
Total
Number of non-local students 4,186 879 5,065
Visitors per student 2 1
Total number of visitors 8,372 879 9,251
Spending per visitor $296 $296
Total visitor spending $2,478,112 $260,184 $2,738,296

Alumni Spending from Premium Income
• Estimated number of graduates based on Alumni Office estimates
• Employment income for Ontario university graduates and Canadian high school graduates consistent with COU's economic analysis.
Assumptions
Lakehead graduates working in Thunder Bay and Orillia A 17,900
Average employment income of Ontario university graduates B $68,194
Average employment income of Canadian high school graduates C $30,796
University employment income premium D = B-C $37,397
Premium income from a university education E = A*D $669,412,744
Estimated income taxes (at 25%) F = E*25% $167,353,186
Estimated savings (at 3%) G = E*3% $20,082,382
Alumni spending from premium wages over high school graduates H = E-(F+G) $481,977,176
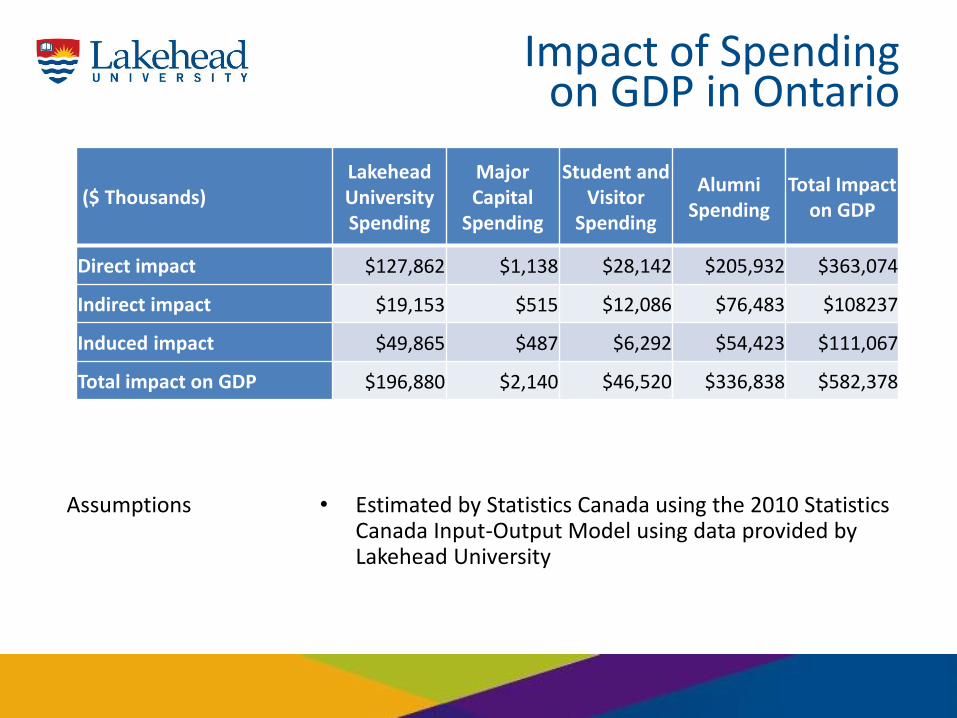
Impact of Spending on GDP in Ontario
• Estimated by Statistics Canada using the 2010 Statistics Canada Input-Output Model using data provided by Lakehead University
Assumptions
($ Thousands)LakeheadUniversity Spending
Major Capital
Spending
Student and Visitor
Spending
Alumni Spending
Total Impact on GDP
Direct impact $127,862 $1,138 $28,142 $205,932 $363,074
Indirect impact $19,153 $515 $12,086 $76,483 $108237
Induced impact $49,865 $487 $6,292 $54,423 $111,067
Total impact on GDP $196,880 $2,140 $46,520 $336,838 $582,378

Impact of Spending on FTE in Ontario
• Estimated by Statistics Canada using the 2010 Statistics Canada Input-Output Model using data provided by Lakehead University
Assumptions
Operating Spending
Major Capital
Spending
Student and Visitor
Spending
Alumni Spending
Total Employment
Direct impact 2,026 16 156 1,712 3,910
Indirect impact 268 7 129 770 1,174
Induced impact 556 6 65 566 1,193
Total impact 2,850 29 350 3,048 6,277

IMPACTS FROM HUMAN CAPITAL DEVELOPMENT & RESERACH

Background
Human Capital Development (HCD)
• The impact of the HCD of university students is the increased output (GDP) that derives from their increased productivity.
• This includes:
• Additional income attained by university graduates as a result of their higher human capital.
• Additional revenue to an organization that derives from the additional human capital of university graduates (profit and other revenues).
Research
• Research has many economic benefits (Sudmant, 2009), which includes:
• Private sector companies benefit from research conducted at universities; and
• Graduates who gain skills and knowledge then create private sector companies.
• Published knowledge is available to the public, and increases economic productivity.
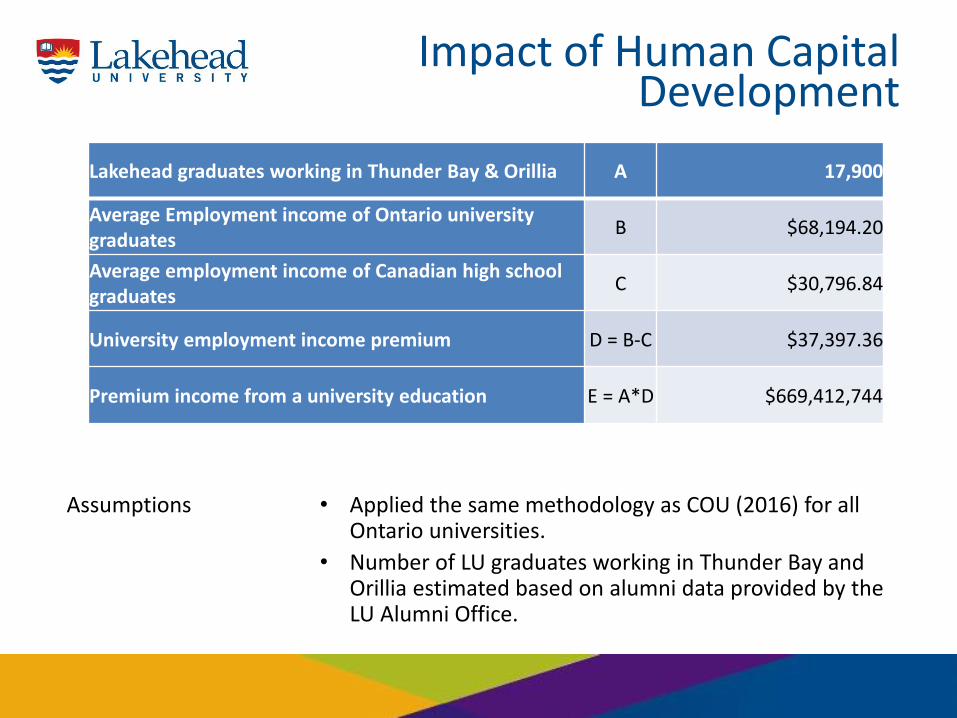
Impact of Human Capital Development
• Applied the same methodology as COU (2016) for all Ontario universities.
• Number of LU graduates working in Thunder Bay and Orillia estimated based on alumni data provided by the LU Alumni Office.
Assumptions
Lakehead graduates working in Thunder Bay & Orillia A 17,900
Average Employment income of Ontario university graduates
B $68,194.20
Average employment income of Canadian high school graduates
C $30,796.84
University employment income premium D = B-C $37,397.36
Premium income from a university education E = A*D $669,412,744

Impact of Research
• Fernand Martin (1998) methodology for calculating total factor productivity effects on GDP
• The higher education sector is responsible for 37% of all R&D in Ontario (2013).
Assumptions
Change in real GDP in Ontario since 1971 $484,503,720,000
Growth attributable to total factor productivity (TFP) 20%
TFP = 1 * 2 $96,900,744,000
Exclusion of foreign R&D effects @ 31% 69%
$66,861,513,360
Share of R&D by Ontario Universities @ 37% 37%
GDP ATTRIBUTED TO TOTAL FACTOR PRODUCTIVITY BY ONTARIO UNIVERSITIES
$24,738,759,943
Share of R&D by Lakehead Universities @ 0.7% 0.7%
GDP ATTRIBUTED TO TOTAL FACTOR PRODUCTIVITY BY LAKEHEAD UNIVERSITY
$173,171,320

ADDITIONAL ANALYSES
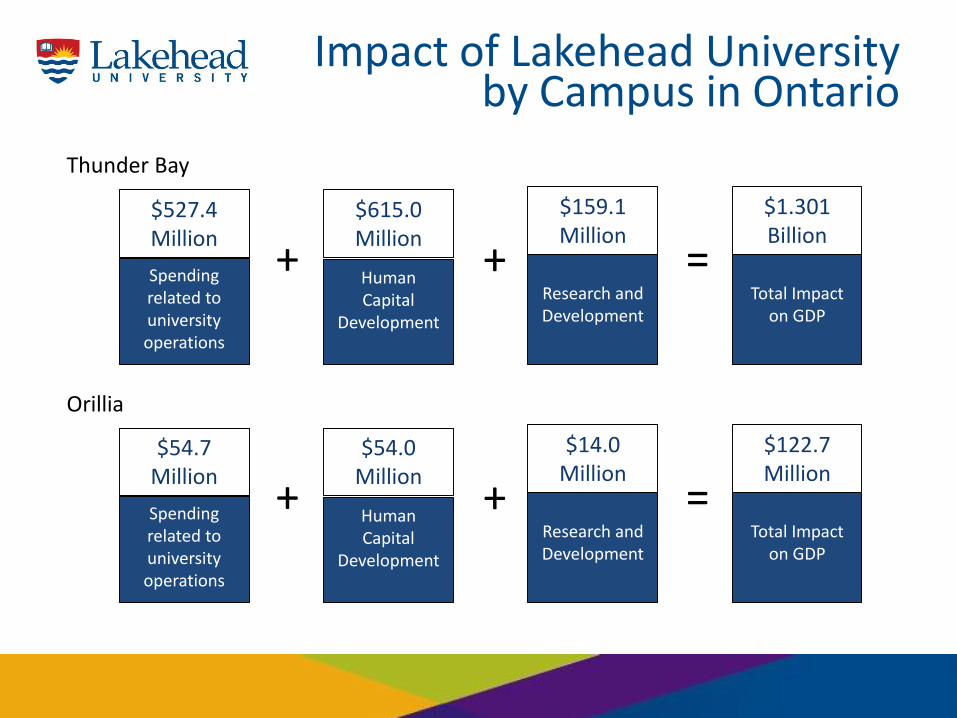
Impact of Lakehead University by Campus in Ontario
Spending related to university operations
$527.4 Million
Human Capital
Development
$615.0 Million
Research and Development
$159.1Million
Total Impact on GDP
$1.301 Billion
+ + =
Spending related to university operations
$54.7Million
Human Capital
Development
$54.0 Million
Research and Development
$14.0 Million
Total Impact on GDP
$122.7 Million
+ + =
Orillia
Thunder Bay
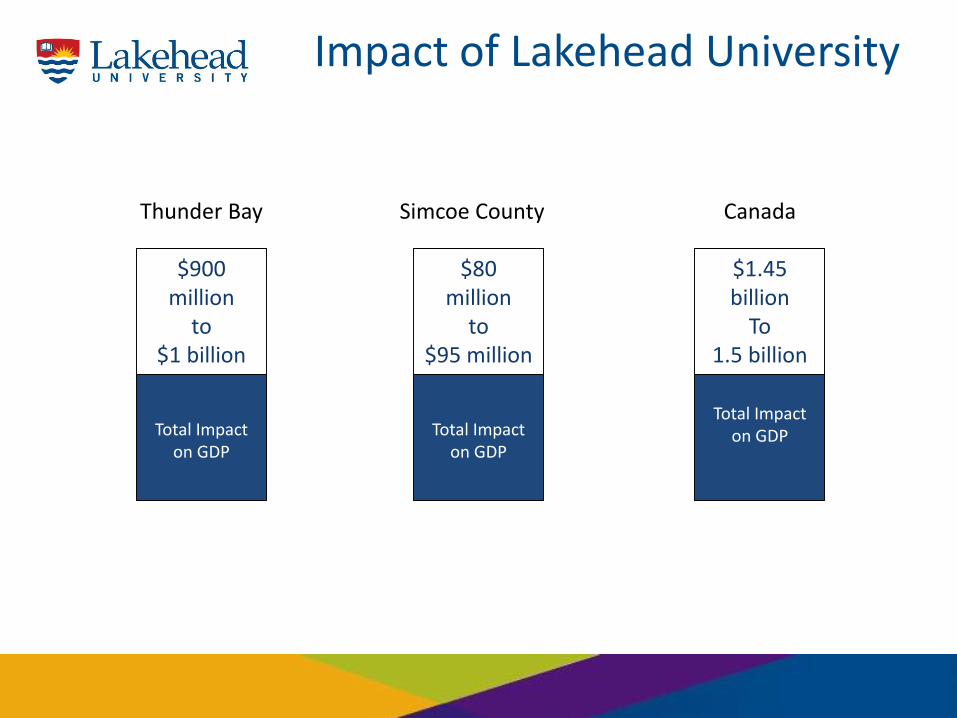
Impact of Lakehead University
Thunder Bay
Total Impact on GDP
$900 million
to $1 billion
Simcoe County Canada
Total Impact on GDP
$1.45 billion
To1.5 billion
Total Impact on GDP
$80 million
to $95 million
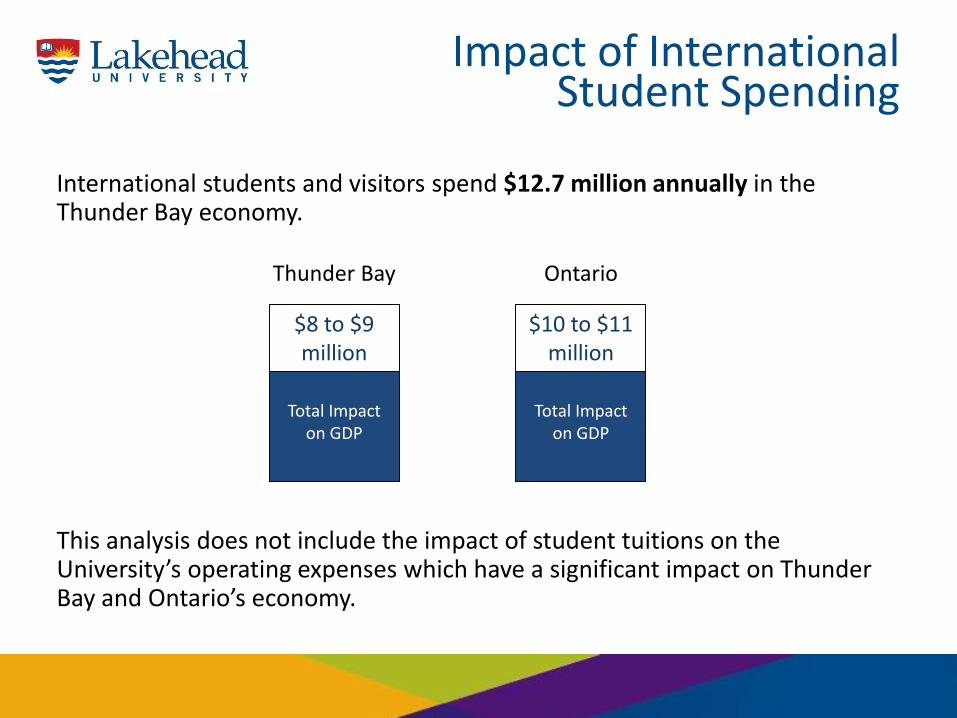
Impact of International Student Spending
International students and visitors spend $12.7 million annually in the Thunder Bay economy.
This analysis does not include the impact of student tuitions on the University’s operating expenses which have a significant impact on Thunder Bay and Ontario’s economy.
Thunder Bay
Total Impact on GDP
$8 to $9 million
Ontario
Total Impact on GDP
$10 to $11 million
References
• OCU, 2016. Future Makers: Economic Analysis of the Lasting Impact of Ontario Universities. Ontario Council of Universities. http://cou.on.ca/faq/economic-impact/
• Martin, F., 1998. The Economic Impact of Canadian University R&D, Research Policy, Vol.27, pp. 677-687.
• Sudmant, W., 2009. The Economic Impact of the University of British Columbia. Planning and Institutional Research, UBC.