Embed Size (px)
Citation preview
Economic Impact of Tourism in North Dakota
North Dakota Travel Industry Conference
April 2017
Christopher Pike
Director, Impact Studies
Tourism Economics
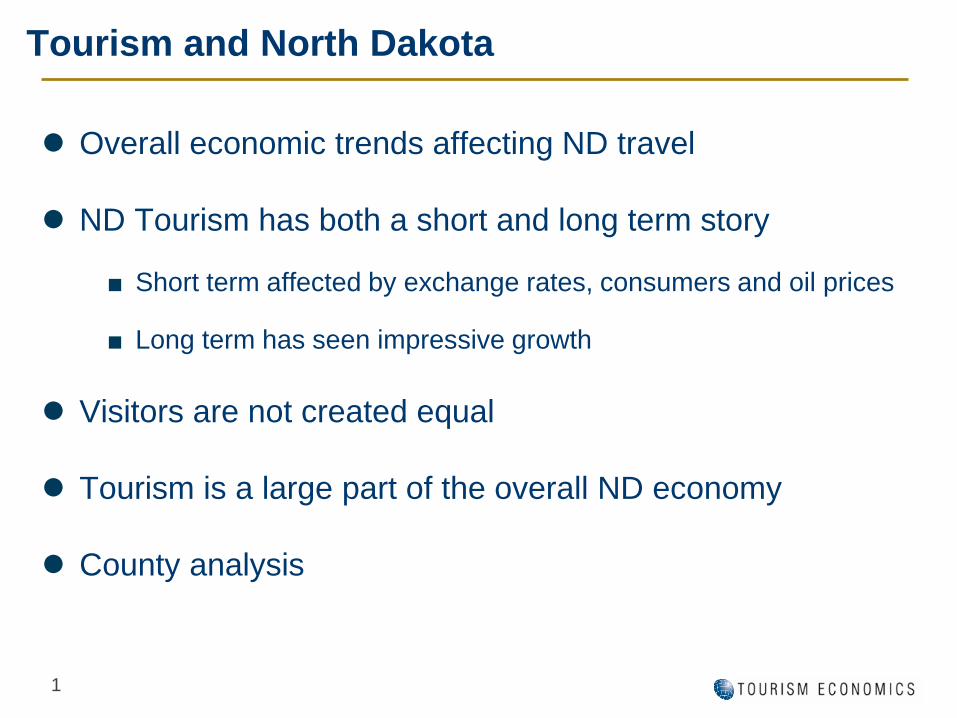
Tourism and North Dakota
Overall economic trends affecting ND travel
ND Tourism has both a short and long term story
■ Short term affected by exchange rates, consumers and oil prices
■ Long term has seen impressive growth
Visitors are not created equal
Tourism is a large part of the overall ND economy
County analysis
1
Macro trends influencing visitation
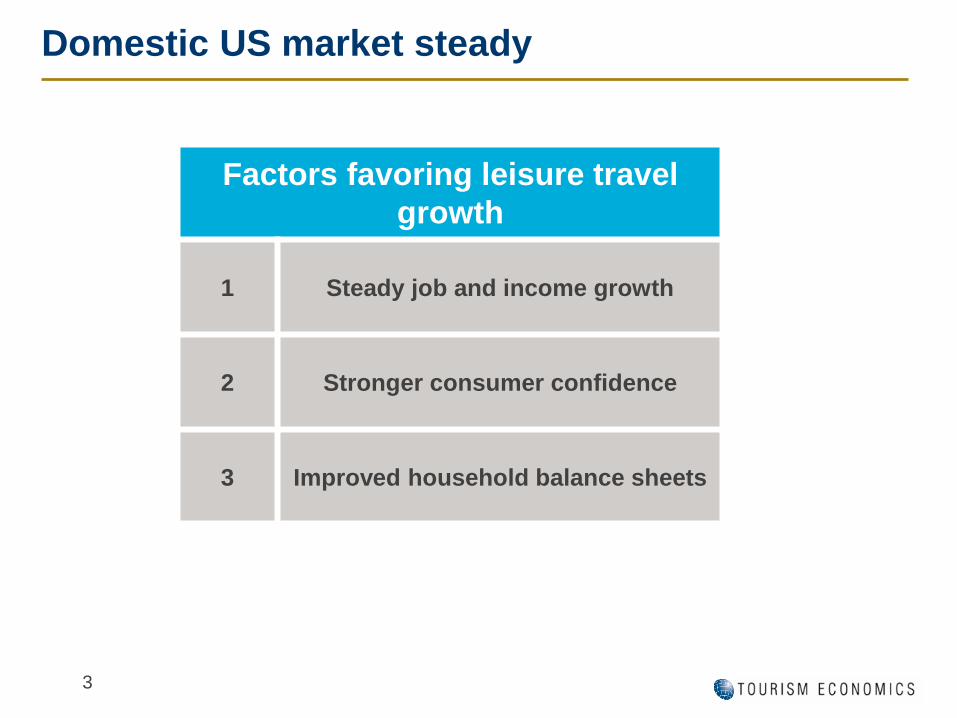
Domestic US market steady
3
Factors favoring leisure travel
growth
1 Steady job and income growth
2 Stronger consumer confidence
3 Improved household balance sheets
60
70
80
90
100
110
120
130
140
2011 2012 2013 2014 2015 2016
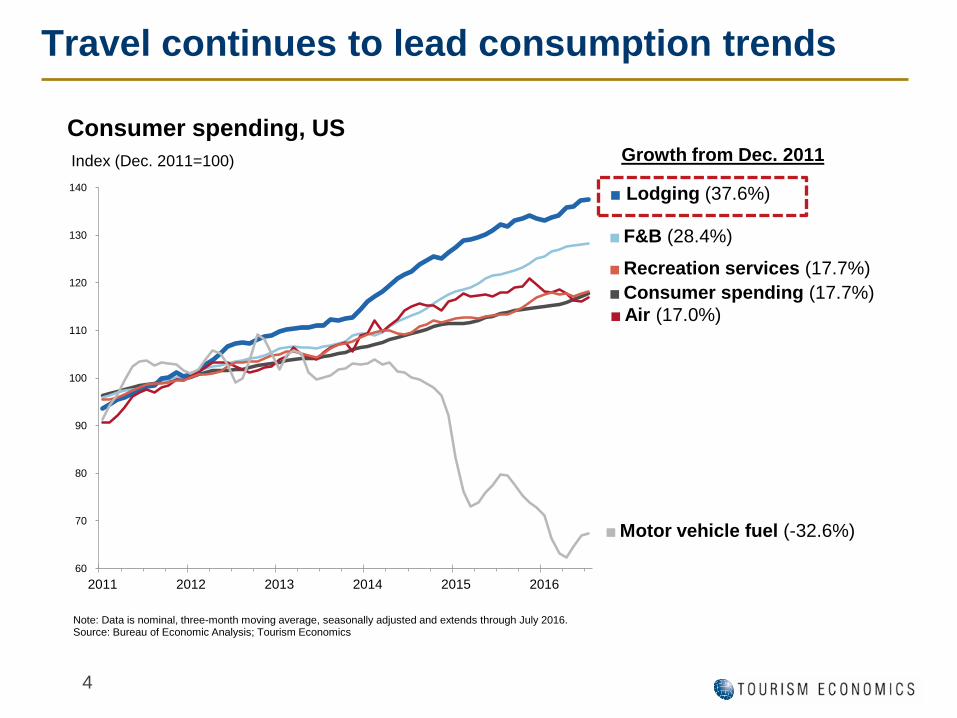
Index (Dec. 2011=100)
Consumer spending, US
Note: Data is nominal, three-month moving average, seasonally adjusted and extends through July 2016.Source: Bureau of Economic Analysis; Tourism Economics
Air (17.0%)
■ F&B (28.4%)
Lodging (37.6%)
Consumer spending (17.7%)
Recreation services (17.7%)
Motor vehicle fuel (-32.6%)
Growth from Dec. 2011
Travel continues to lead consumption trends
4
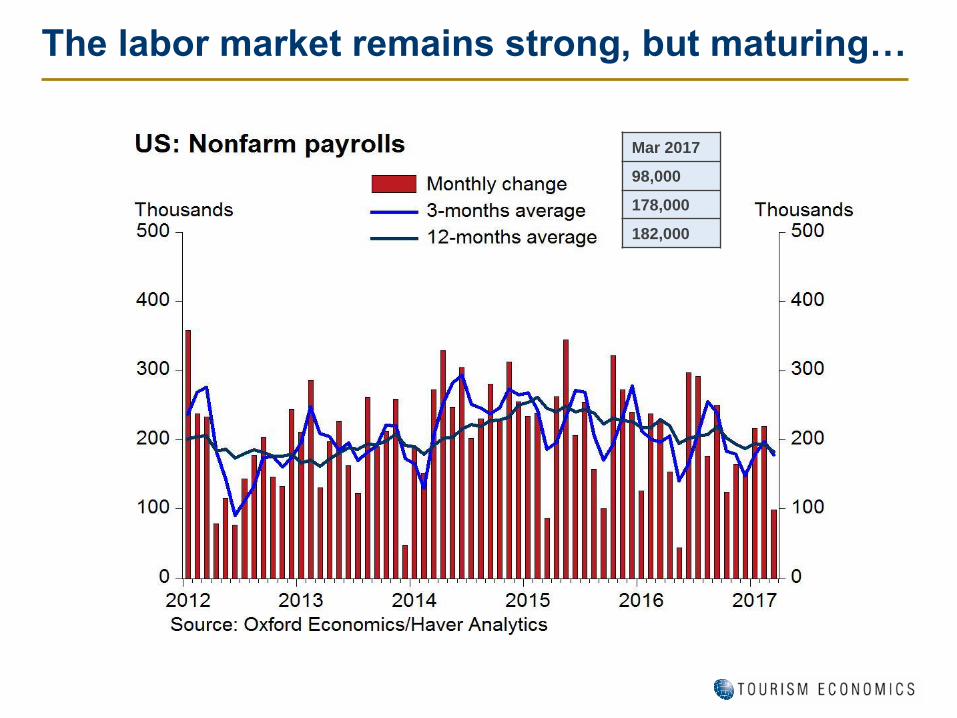
The labor market remains strong, but maturing…
Mar 2017
98,000
178,000
182,000
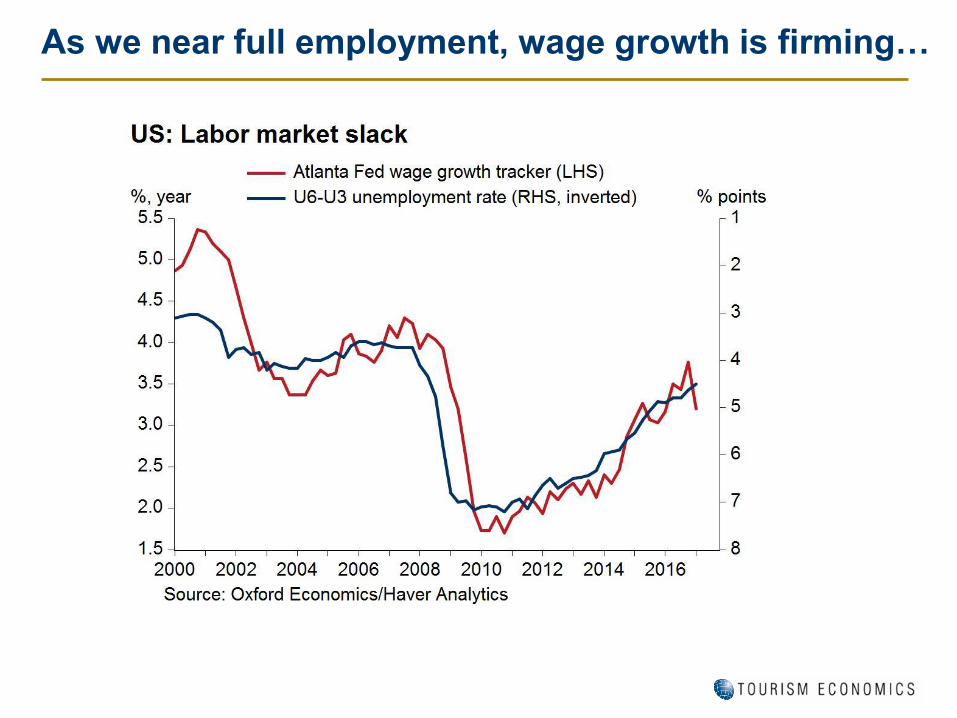
As we near full employment, wage growth is firming…
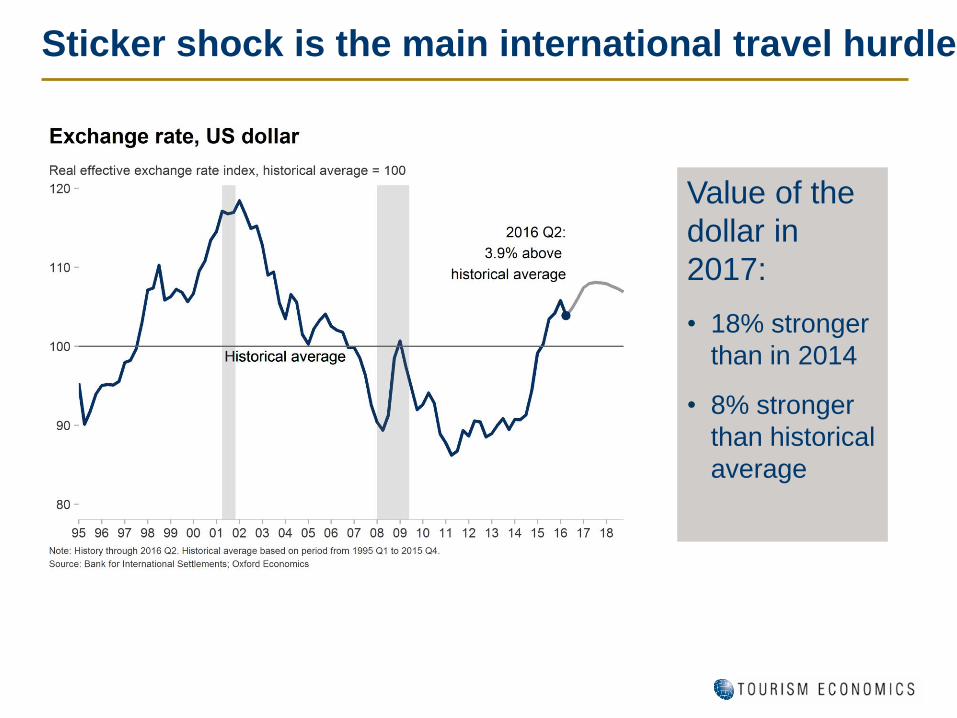
Sticker shock is the main international travel hurdle
Value of the
dollar in
2017:
• 18% stronger
than in 2014
• 8% stronger
than historical
average
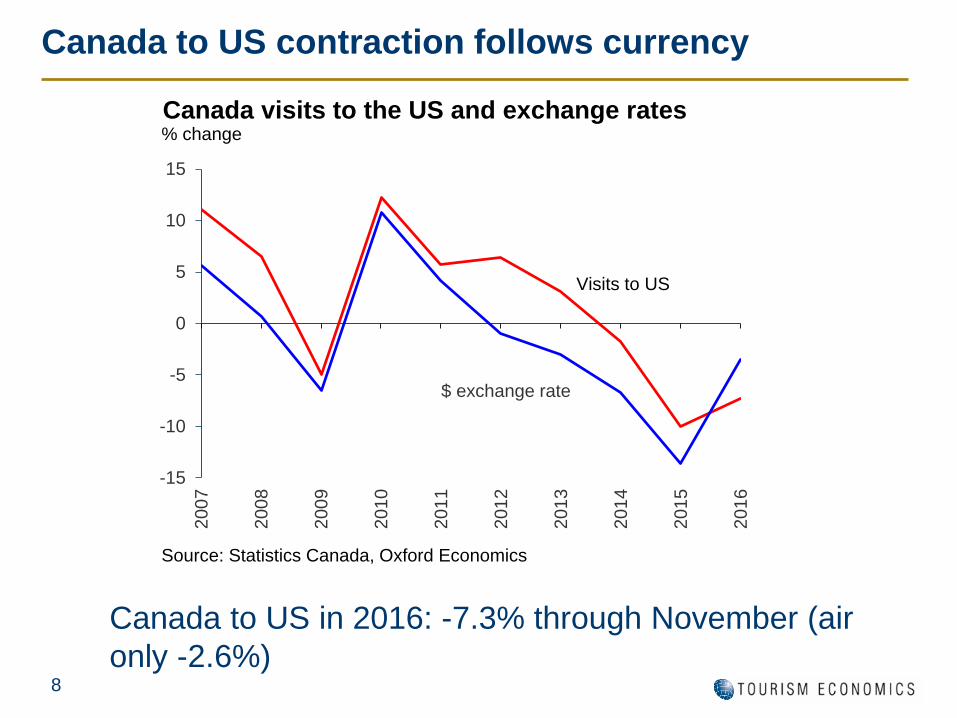
Canada to US contraction follows currency
8
Canada to US in 2016: -7.3% through November (air
only -2.6%)
-15
-10
-5
0
5
10
15
2007
2008
2009
2010
2011
2012
2013
2014
2015
2016
Canada visits to the US and exchange rates% change
Source: Statistics Canada, Oxford Economics
Visits to US
$ exchange rate
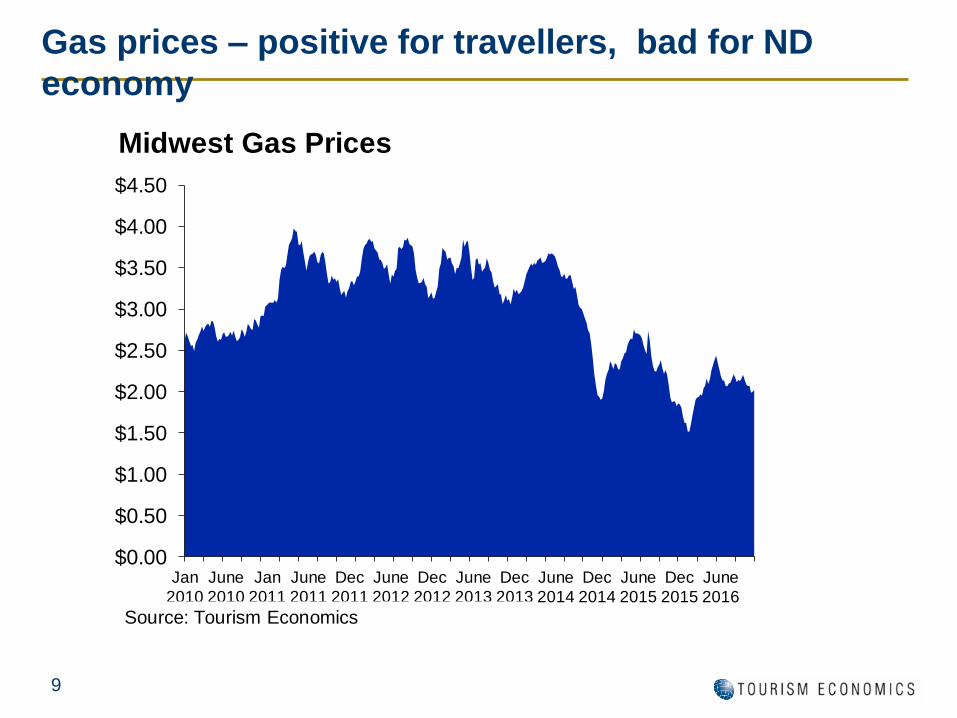
Gas prices – positive for travellers, bad for ND
economy
9
$0.00
$0.50
$1.00
$1.50
$2.00
$2.50
$3.00
$3.50
$4.00
$4.50
Jan
2010
June
2010
Jan
2011
June
2011
Dec
2011
June
2012
Dec
2012
June
2013
Dec
2013
June
2014
Dec
2014
June
2015
Dec
2015
June
2016
Midwest Gas Prices
Source: Tourism Economics
Focus on ND visitation and spending
12
2015 at a glance
Visitor Spending
Visitor spending of $3.1 billion generated $5.0 billion in
total business sales in 2015
Visitor spending grew 8.6% in 2014 before declining
9.6% in 2015
Visitor spending is still nearly $500 million higher than
in 2011 – an increase of almost 20%.
Visitor Counts
Nearly 22 million visitors.
13
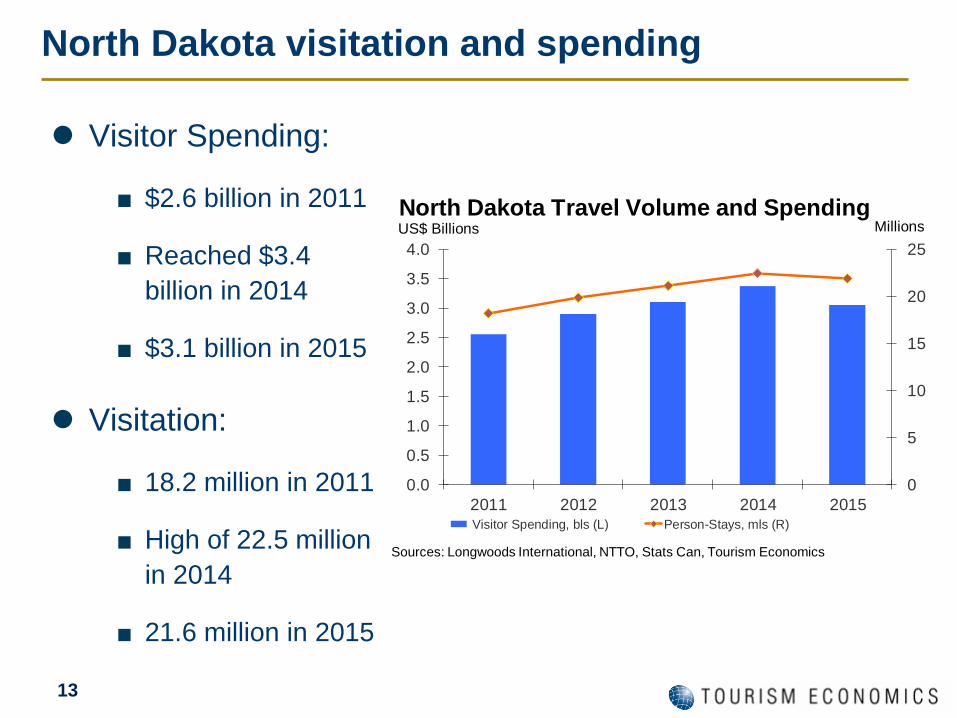
North Dakota visitation and spending
Visitor Spending:
■ $2.6 billion in 2011
■ Reached $3.4
billion in 2014
■ $3.1 billion in 2015
Visitation:
■ 18.2 million in 2011
■ High of 22.5 million
in 2014
■ 21.6 million in 2015
0
5
10
15
20
25
0.0
0.5
1.0
1.5
2.0
2.5
3.0
3.5
4.0
2011 2012 2013 2014 2015 Visitor Spending, bls (L) Person-Stays, mls (R)
$
North Dakota Travel Volume and SpendingUS$ Billions
Sources: Longwoods International, NTTO, Stats Can, Tourism Economics
Millions
15
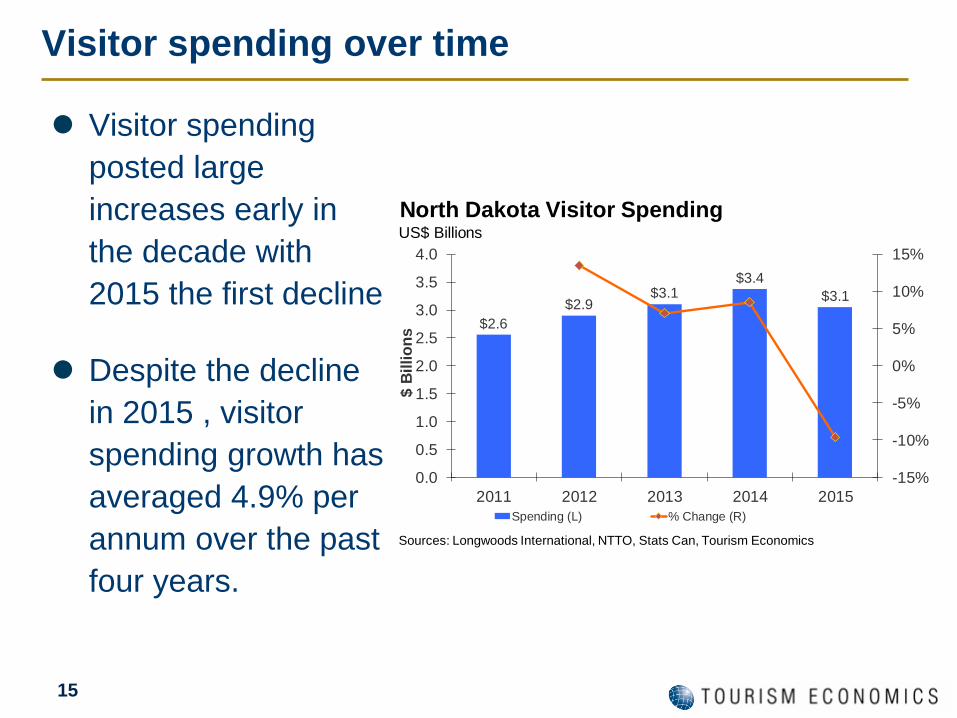
Visitor spending over time
Visitor spending
posted large
increases early in
the decade with
2015 the first decline
Despite the decline
in 2015 , visitor
spending growth has
averaged 4.9% per
annum over the past
four years.
$2.6
$2.9$3.1
$3.4
$3.1
-15%
-10%
-5%
0%
5%
10%
15%
0.0
0.5
1.0
1.5
2.0
2.5
3.0
3.5
4.0
2011 2012 2013 2014 2015
$ B
illio
ns
Spending (L) % Change (R)
$
North Dakota Visitor SpendingUS$ Billions
Sources: Longwoods International, NTTO, Stats Can, Tourism Economics
16
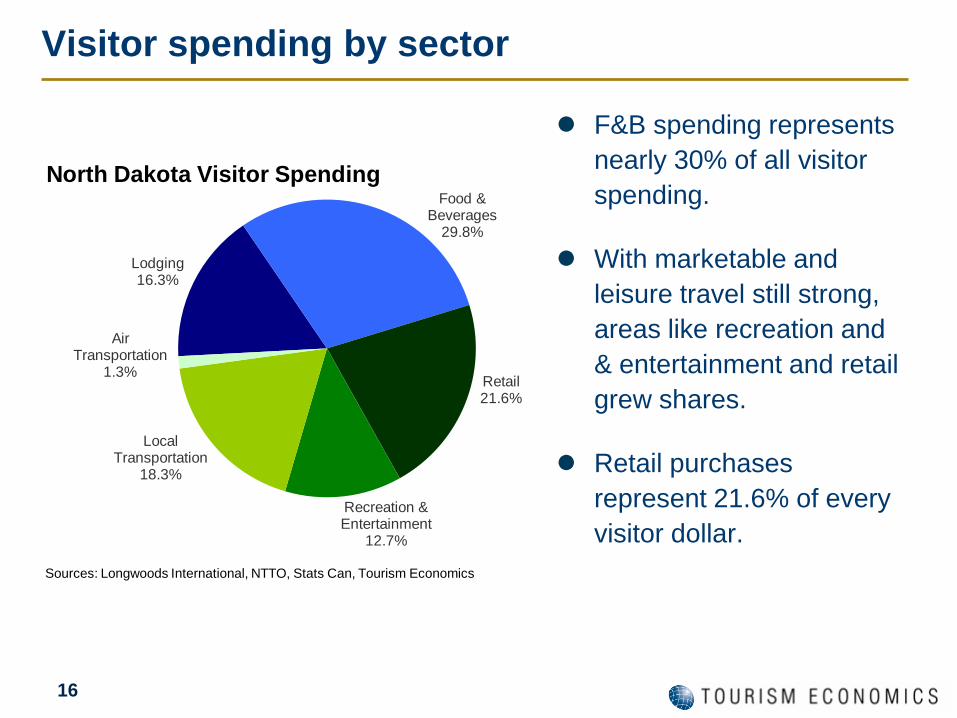
Visitor spending by sector
F&B spending represents
nearly 30% of all visitor
spending.
With marketable and
leisure travel still strong,
areas like recreation and
& entertainment and retail
grew shares.
Retail purchases
represent 21.6% of every
visitor dollar.
Lodging16.3%
Food & Beverages
29.8%
Retail21.6%
Recreation & Entertainment
12.7%
Local Transportation
18.3%
Air Transportation
1.3%
North Dakota Visitor Spending
Sources: Longwoods International, NTTO, Stats Can, Tourism Economics
17
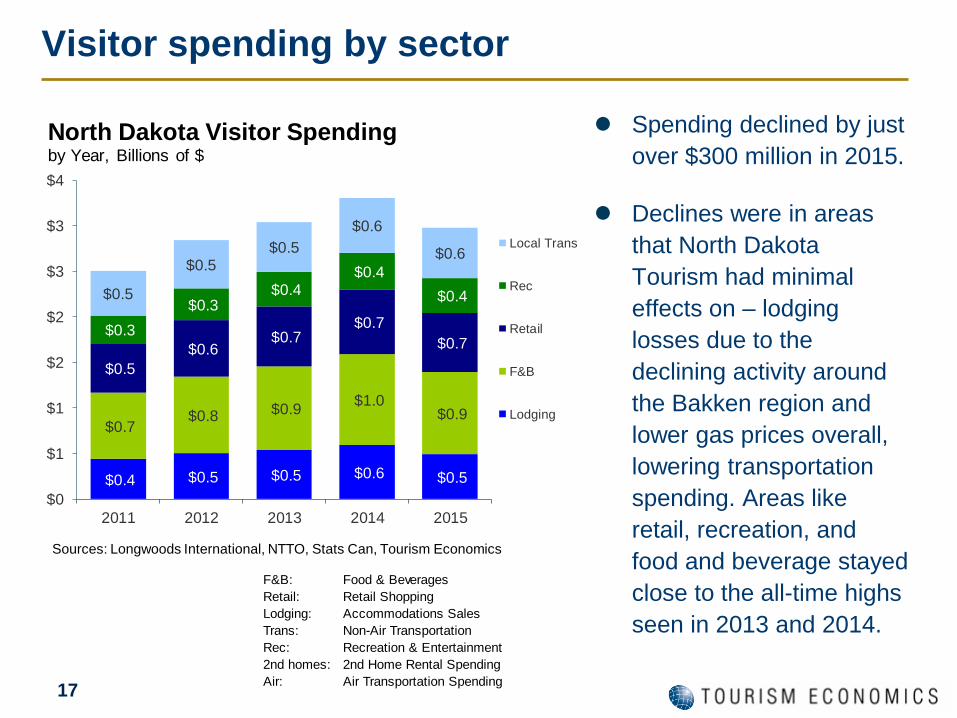
Visitor spending by sector
F&B: Food & Beverages
Retail: Retail Shopping
Lodging: Accommodations Sales
Trans: Non-Air Transportation
Rec: Recreation & Entertainment
2nd homes: 2nd Home Rental Spending
Air: Air Transportation Spending
Spending declined by just
over $300 million in 2015.
Declines were in areas
that North Dakota
Tourism had minimal
effects on – lodging
losses due to the
declining activity around
the Bakken region and
lower gas prices overall,
lowering transportation
spending. Areas like
retail, recreation, and
food and beverage stayed
close to the all-time highs
seen in 2013 and 2014.
$0.4 $0.5 $0.5 $0.6 $0.5
$0.7 $0.8 $0.9
$1.0 $0.9
$0.5
$0.6 $0.7
$0.7
$0.7 $0.3
$0.3 $0.4
$0.4
$0.4 $0.5
$0.5$0.5
$0.6
$0.6
$0
$1
$1
$2
$2
$3
$3
$4
2011 2012 2013 2014 2015
Local Trans
Rec
Retail
F&B
Lodging
Sources: Longwoods International, NTTO, Stats Can, Tourism Economics
North Dakota Visitor Spending by Year, Billions of $
18
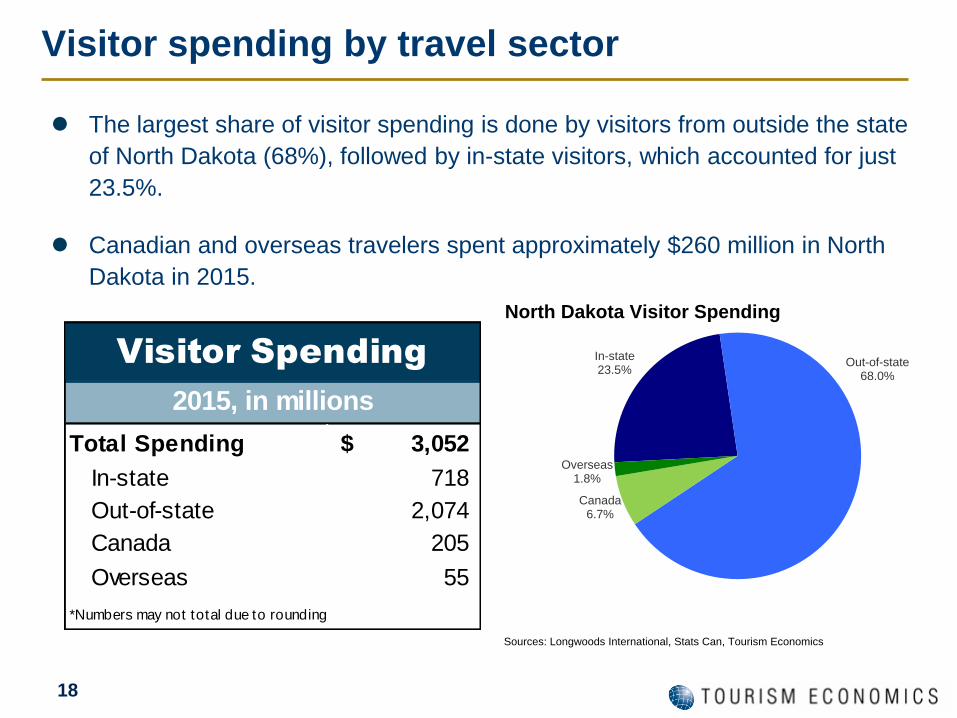
Visitor spending by travel sector
In-state23.5%
Out-of-state68.0%
Canada6.7%
Overseas 1.8%
North Dakota Visitor Spending
Sources: Longwoods International, Stats Can, Tourism Economics
The largest share of visitor spending is done by visitors from outside the state
of North Dakota (68%), followed by in-state visitors, which accounted for just
23.5%.
Canadian and overseas travelers spent approximately $260 million in North
Dakota in 2015.
Total Spending 3,052$
In-state 718
Out-of-state 2,074
Canada 205
Overseas 55
*Numbers may not total due to rounding
Visitor Spending
2015, in millions
19
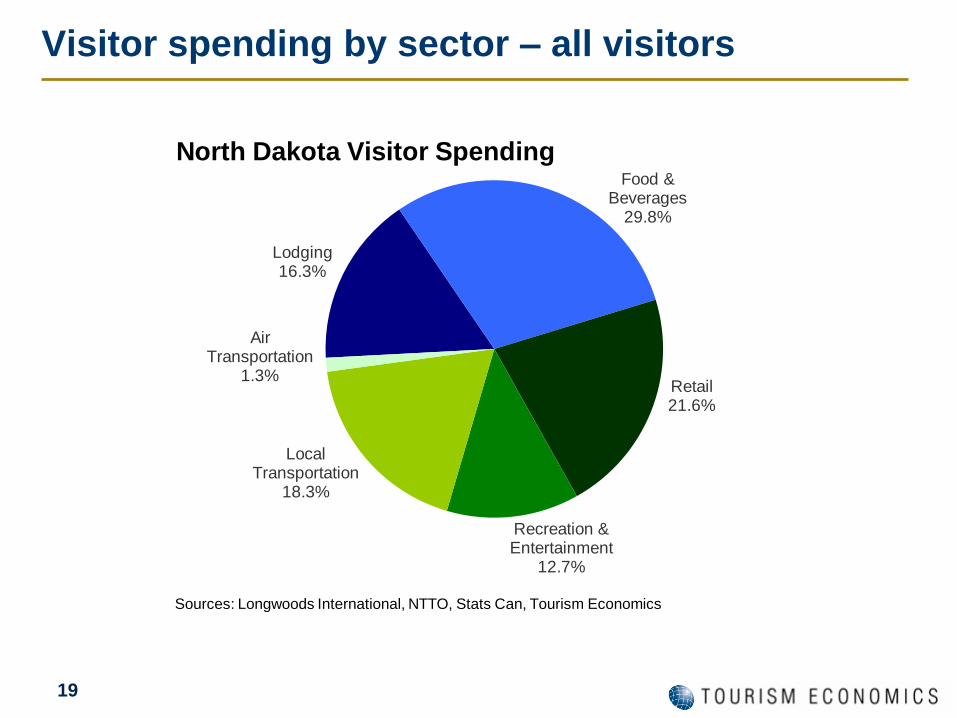
Visitor spending by sector – all visitors
Lodging16.3%
Food & Beverages
29.8%
Retail21.6%
Recreation & Entertainment
12.7%
Local Transportation
18.3%
Air Transportation
1.3%
North Dakota Visitor Spending
Sources: Longwoods International, NTTO, Stats Can, Tourism Economics
20
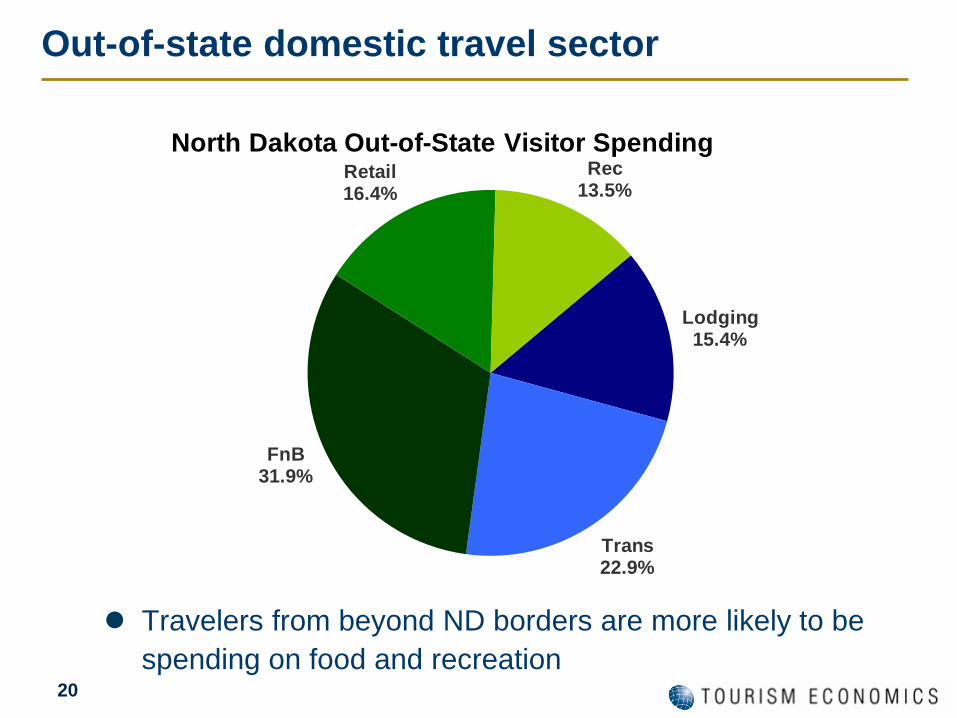
Out-of-state domestic travel sector
Lodging15.4%
Trans22.9%
FnB31.9%
Retail16.4%
Rec13.5%
North Dakota Out-of-State Visitor Spending
Sources: Longwoods International, Tourism Economics
Travelers from beyond ND borders are more likely to be
spending on food and recreation
21
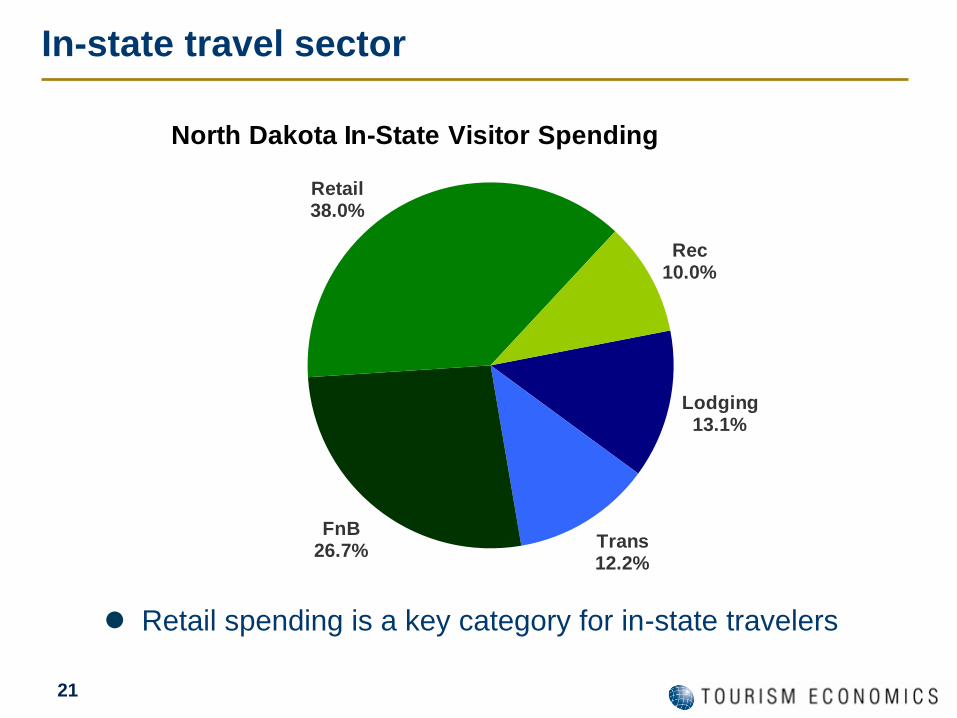
In-state travel sector
Lodging13.1%
Trans12.2%
FnB26.7%
Retail38.0%
Rec10.0%
North Dakota In-State Visitor Spending
Sources: Longwoods International, Tourism Economics
Retail spending is a key category for in-state travelers
22
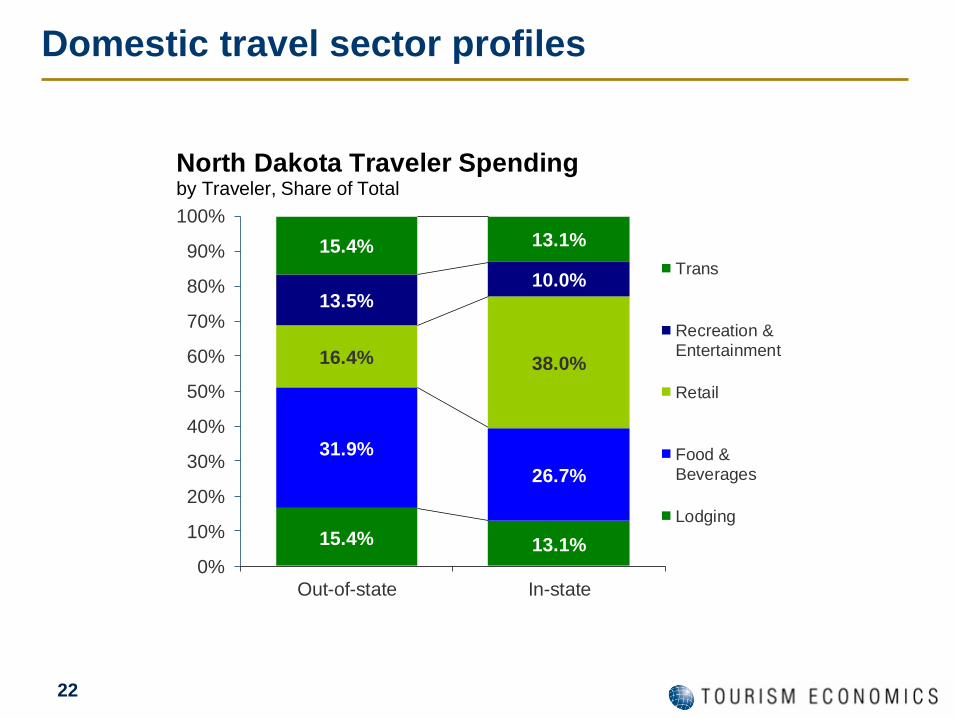
Domestic travel sector profiles
15.4% 13.1%
31.9%
26.7%
16.4% 38.0%
13.5%10.0%
15.4% 13.1%
0%
10%
20%
30%
40%
50%
60%
70%
80%
90%
100%
Out-of-state In-state
Trans
Recreation &Entertainment
Retail
Food &Beverages
Lodging
Sources: Longwoods International, Tourism Economics
North Dakota Traveler Spending by Traveler, Share of Total
23
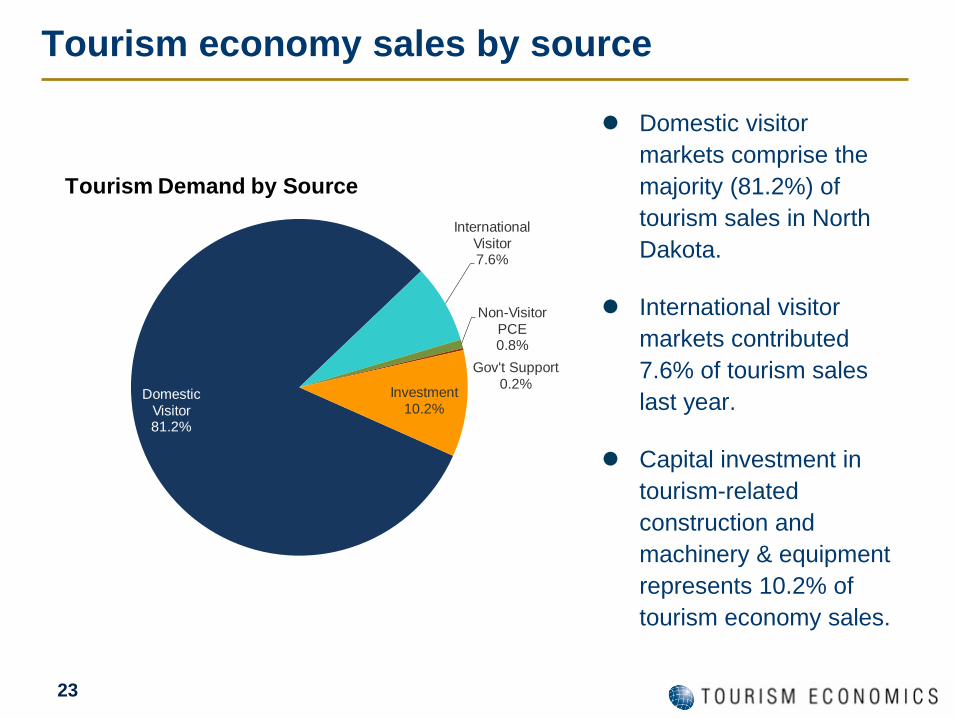
Tourism economy sales by source
Domestic visitor
markets comprise the
majority (81.2%) of
tourism sales in North
Dakota.
International visitor
markets contributed
7.6% of tourism sales
last year.
Capital investment in
tourism-related
construction and
machinery & equipment
represents 10.2% of
tourism economy sales.
Domestic Visitor81.2%
International Visitor7.6%
Non-Visitor PCE0.8%
Gov't Support0.2%
Investment10.2%
Tourism Demand by Source
24
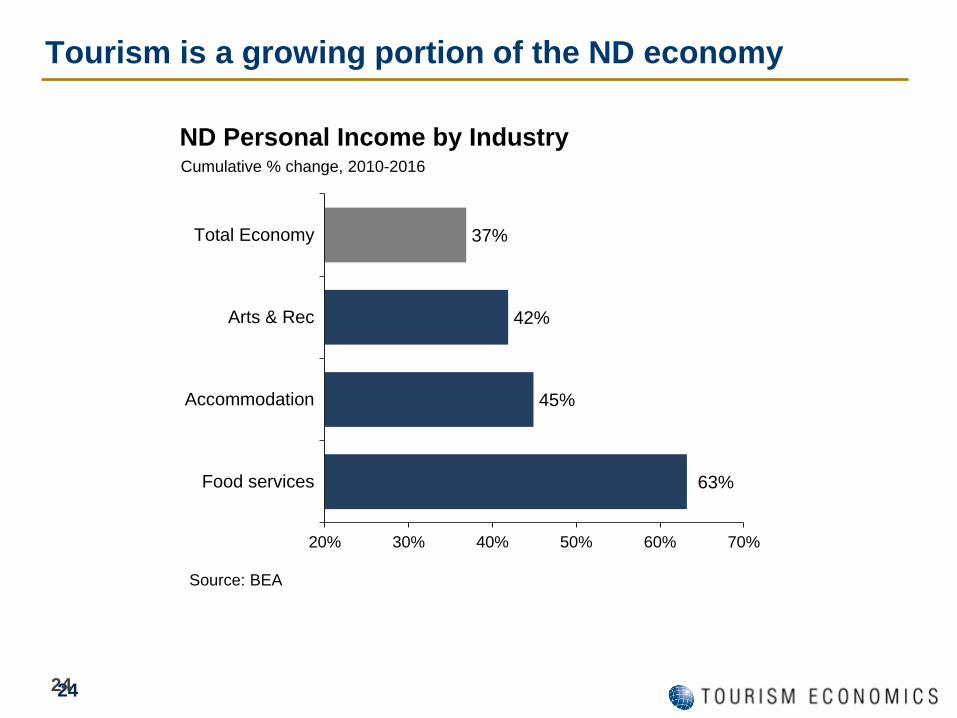
Tourism is a growing portion of the ND economy
24
63%
45%
42%
37%
20% 30% 40% 50% 60% 70%
Food services
Accommodation
Arts & Rec
Total Economy
ND Personal Income by IndustryCumulative % change, 2010-2016
Source: BEA
25
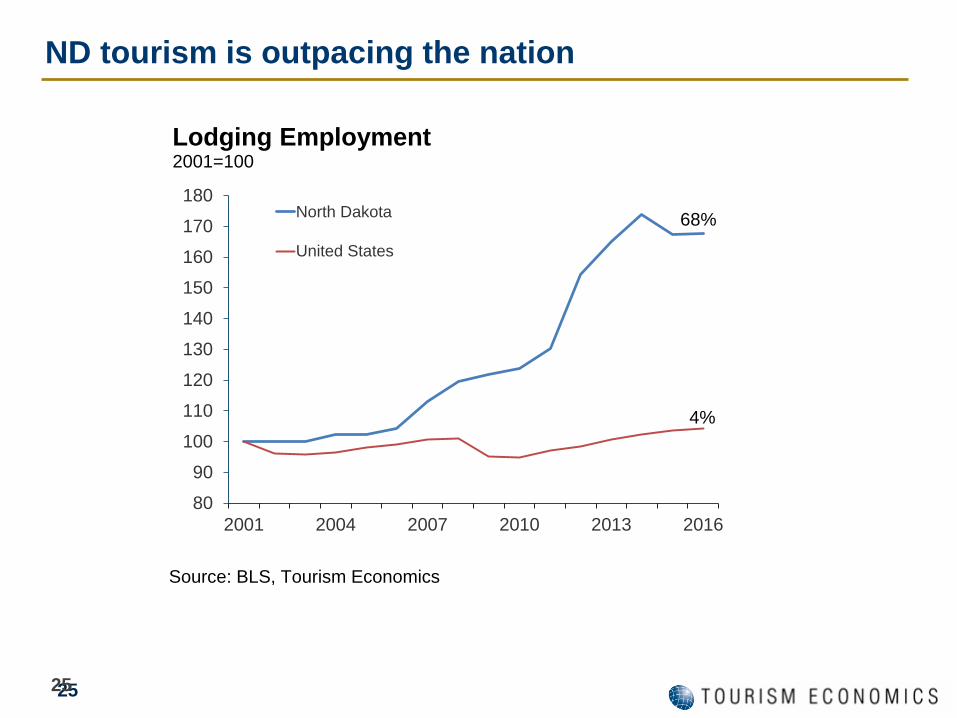
ND tourism is outpacing the nation
25
80
90
100
110
120
130
140
150
160
170
180
2001 2004 2007 2010 2013 2016
North Dakota
United States
Lodging Employment
Source: BLS, Tourism Economics
2001=100
68%
4%
Focus on the tourism impact on ND economy
27
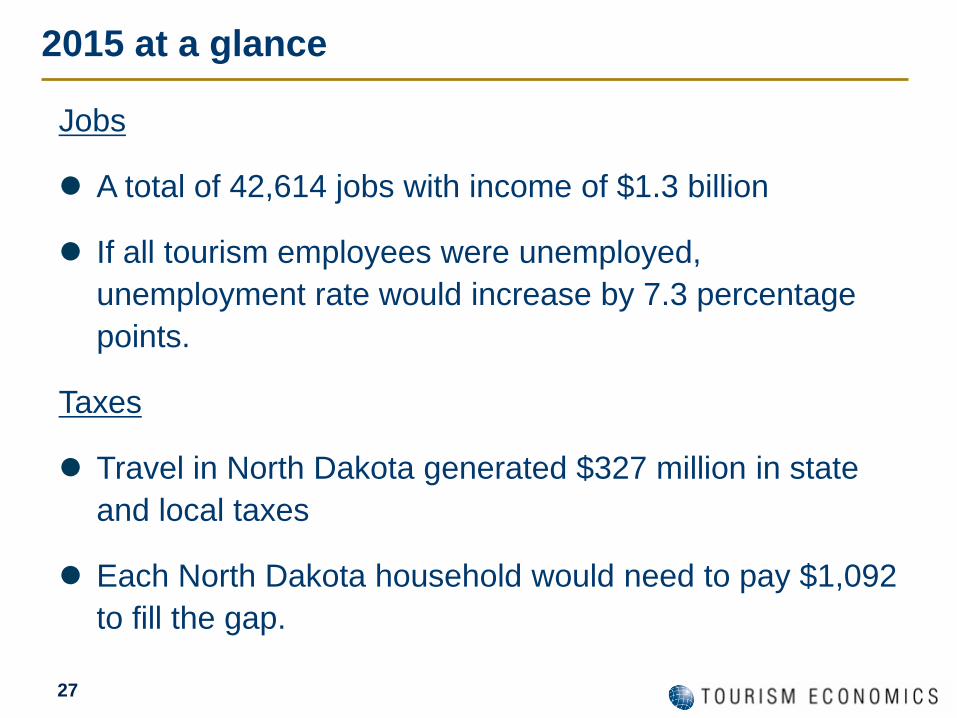
Jobs
A total of 42,614 jobs with income of $1.3 billion
If all tourism employees were unemployed,
unemployment rate would increase by 7.3 percentage
points.
Taxes
Travel in North Dakota generated $327 million in state
and local taxes
Each North Dakota household would need to pay $1,092
to fill the gap.
2015 at a glance
28
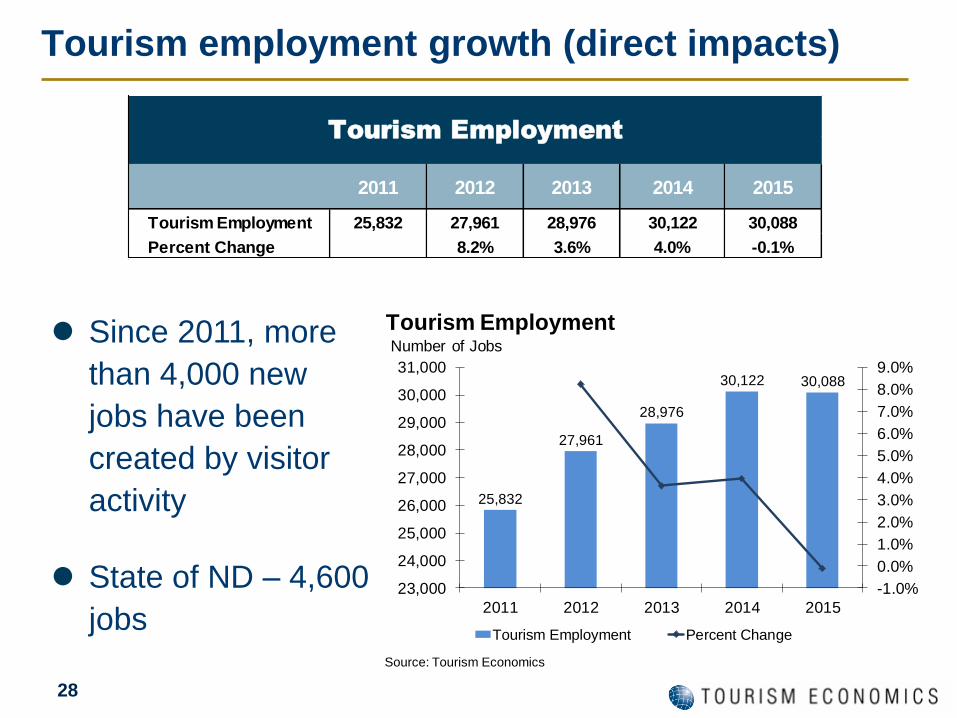
Tourism employment growth (direct impacts)
Since 2011, more
than 4,000 new
jobs have been
created by visitor
activity
State of ND – 4,600
jobs
2011 2012 2013 2014 2015
Tourism Employment 25,832 27,961 28,976 30,122 30,088
Percent Change 8.2% 3.6% 4.0% -0.1%
Tourism Employment
25,832
27,961
28,976
30,122 30,088
-1.0%
0.0%
1.0%
2.0%
3.0%
4.0%
5.0%
6.0%
7.0%
8.0%
9.0%
23,000
24,000
25,000
26,000
27,000
28,000
29,000
30,000
31,000
2011 2012 2013 2014 2015
Tourism Employment Percent Change
$
Tourism EmploymentNumber of Jobs
Source: Tourism Economics
29
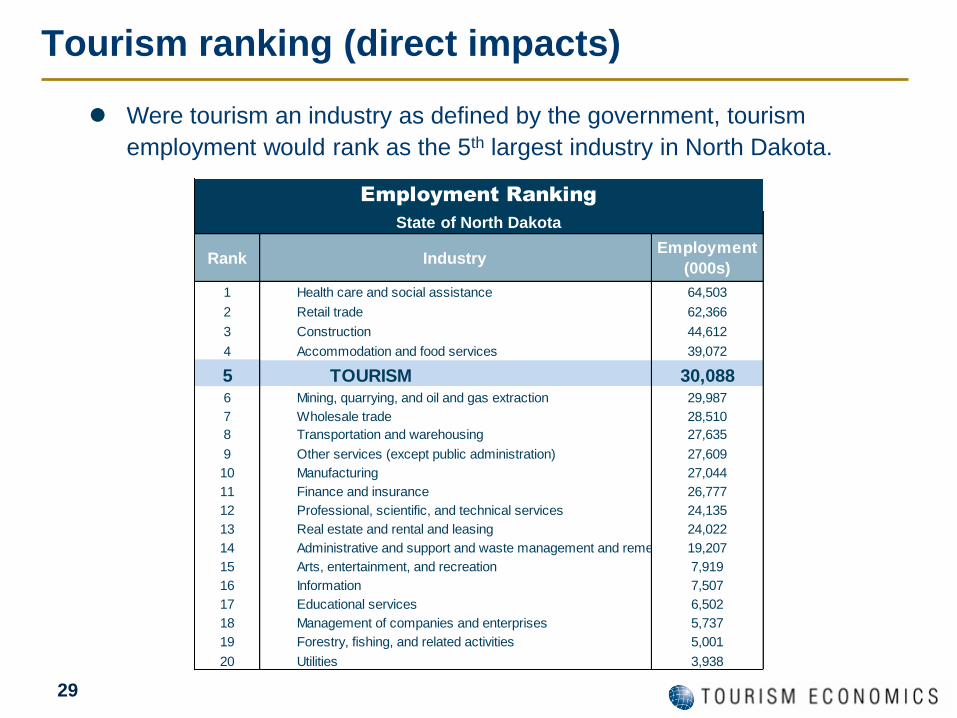
Tourism ranking (direct impacts)
Were tourism an industry as defined by the government, tourism
employment would rank as the 5th largest industry in North Dakota.
Rank IndustryEmployment
(000s)
1 Health care and social assistance 64,503
2 Retail trade 62,366
3 Construction 44,612
4 Accommodation and food services 39,072
5 TOURISM 30,0886 Mining, quarrying, and oil and gas extraction 29,987
7 Wholesale trade 28,510
8 Transportation and warehousing 27,635
9 Other services (except public administration) 27,609
10 Manufacturing 27,044
11 Finance and insurance 26,777
12 Professional, scientific, and technical services 24,135
13 Real estate and rental and leasing 24,022
14 Administrative and support and waste management and remediation services19,207
15 Arts, entertainment, and recreation 7,919
16 Information 7,507
17 Educational services 6,502
18 Management of companies and enterprises 5,737
19 Forestry, fishing, and related activities 5,001
20 Utilities 3,938
Employment Ranking
State of North Dakota
30
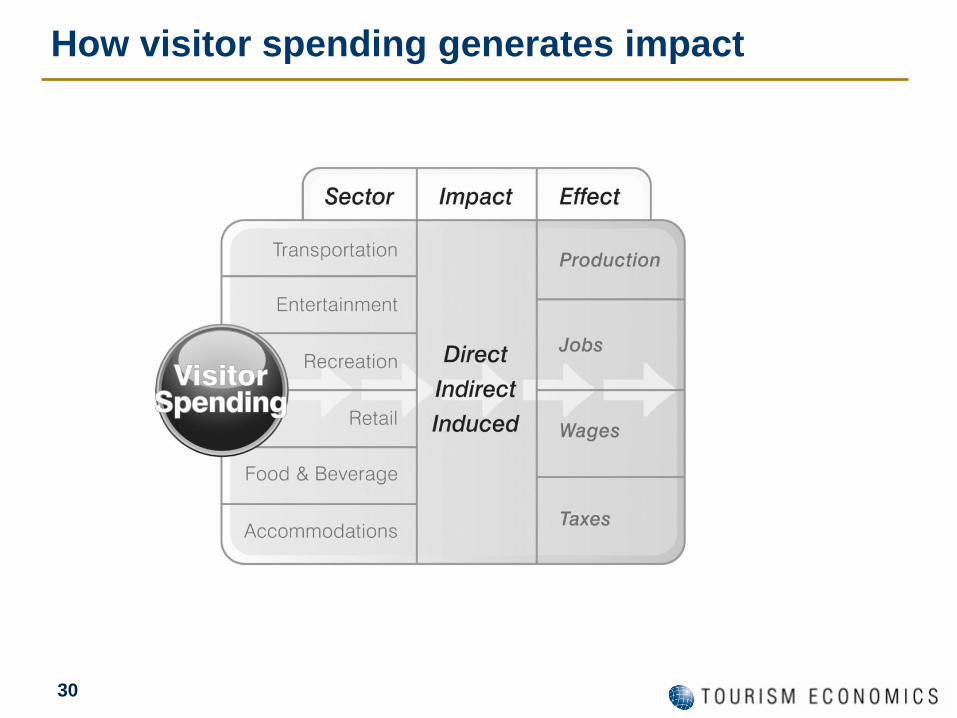
How visitor spending generates impact
31
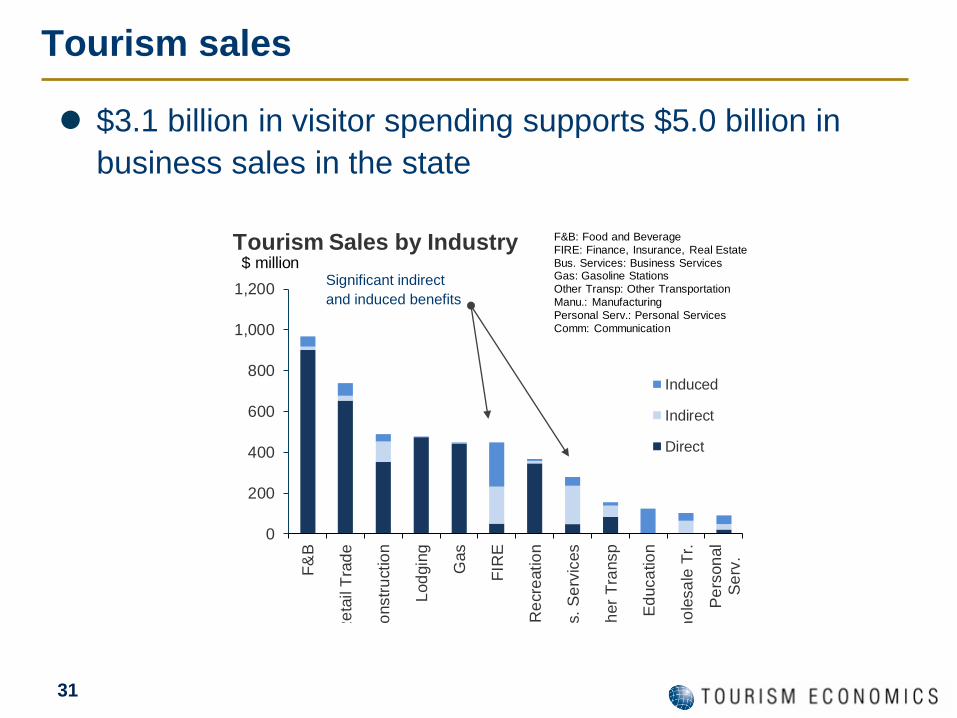
$3.1 billion in visitor spending supports $5.0 billion in
business sales in the state
Tourism sales
Significant indirect
and induced benefits
0
200
400
600
800
1,000
1,200
F&
B
Re
tail
Tra
de
Co
nstr
uctio
n
Lod
gin
g
Gas
FIR
E
Re
cre
atio
n
Bu
s.
Se
rvic
es
Oth
er
Tra
nsp
Ed
uca
tio
n
Wh
ole
sa
le T
r.
Pe
rson
al
Se
rv.
Induced
Indirect
Direct
Tourism Sales by Industry$ million
F&B: Food and Beverage
FIRE: Finance, Insurance, Real Estate
Bus. Services: Business ServicesGas: Gasoline Stations
Other Transp: Other Transportation
Manu.: Manufacturing
Personal Serv.: Personal Services
Comm: Communication
32
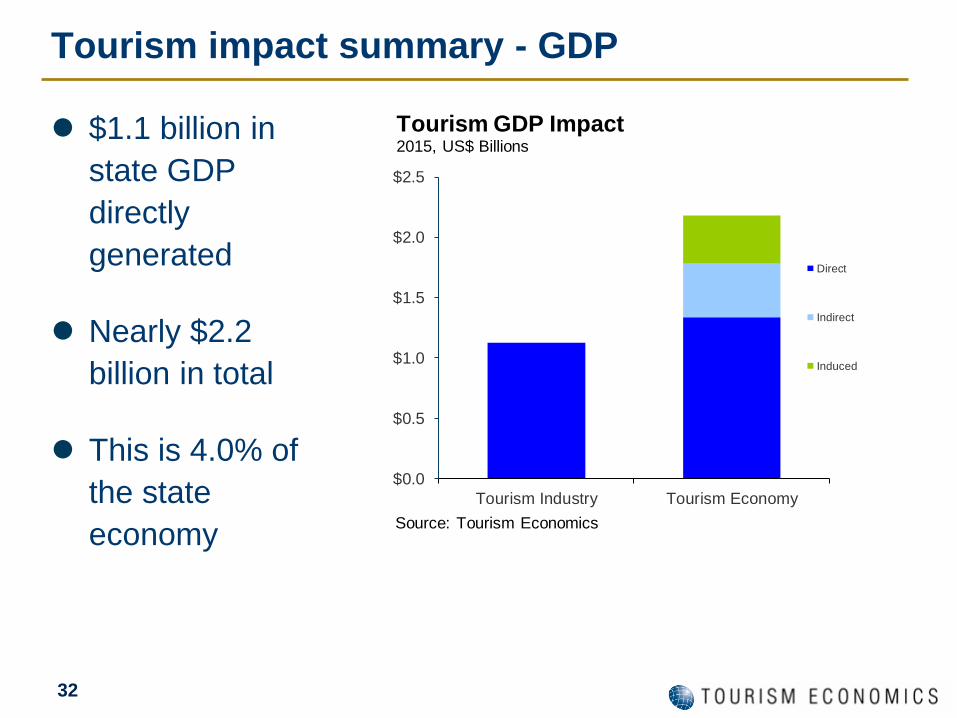
Tourism impact summary - GDP
$1.1 billion in
state GDP
directly
generated
Nearly $2.2
billion in total
This is 4.0% of
the state
economy
$0.0
$0.5
$1.0
$1.5
$2.0
$2.5
Tourism Industry Tourism Economy
Direct
Indirect
Induced
Source: Tourism Economics
Tourism GDP Impact 2015, US$ Billions
33
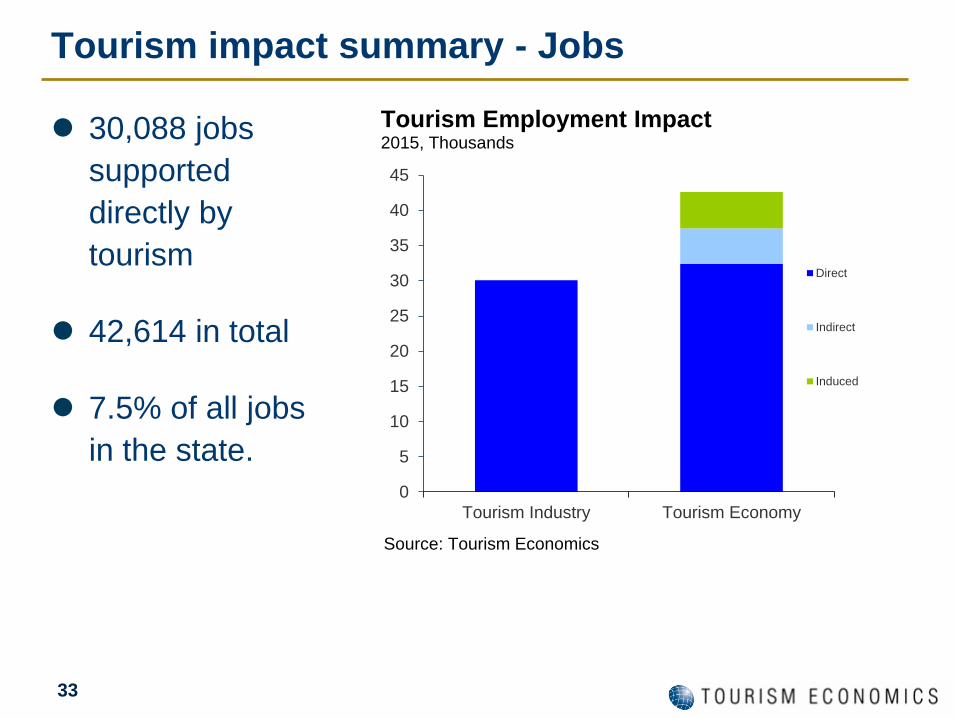
Tourism impact summary - Jobs
30,088 jobs
supported
directly by
tourism
42,614 in total
7.5% of all jobs
in the state.0
5
10
15
20
25
30
35
40
45
Tourism Industry Tourism Economy
Direct
Indirect
Induced
Source: Tourism Economics
Tourism Employment Impact 2015, Thousands
34
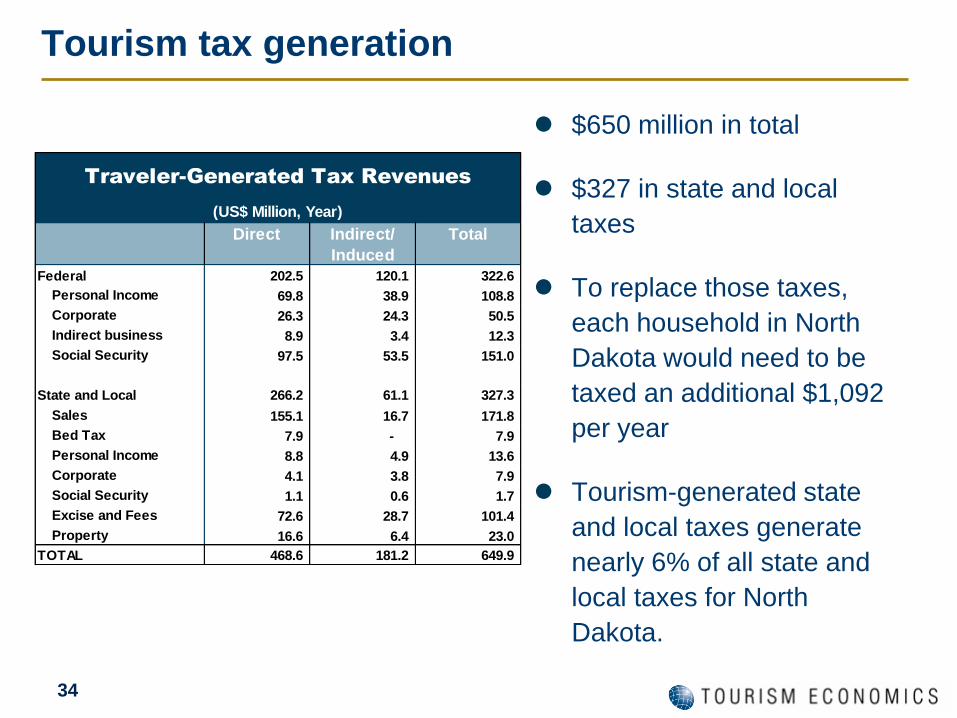
Tourism tax generation
$650 million in total
$327 in state and local
taxes
To replace those taxes,
each household in North
Dakota would need to be
taxed an additional $1,092
per year
Tourism-generated state
and local taxes generate
nearly 6% of all state and
local taxes for North
Dakota.
Direct Indirect/
Induced
Total
Federal 202.5 120.1 322.6
Personal Income 69.8 38.9 108.8
Corporate 26.3 24.3 50.5
Indirect business 8.9 3.4 12.3
Social Security 97.5 53.5 151.0
State and Local 266.2 61.1 327.3
Sales 155.1 16.7 171.8
Bed Tax 7.9 - 7.9
Personal Income 8.8 4.9 13.6
Corporate 4.1 3.8 7.9
Social Security 1.1 0.6 1.7
Excise and Fees 72.6 28.7 101.4
Property 16.6 6.4 23.0
TOTAL 468.6 181.2 649.9
(US$ Million, Year)
Traveler-Generated Tax Revenues
Tourism in Context
36
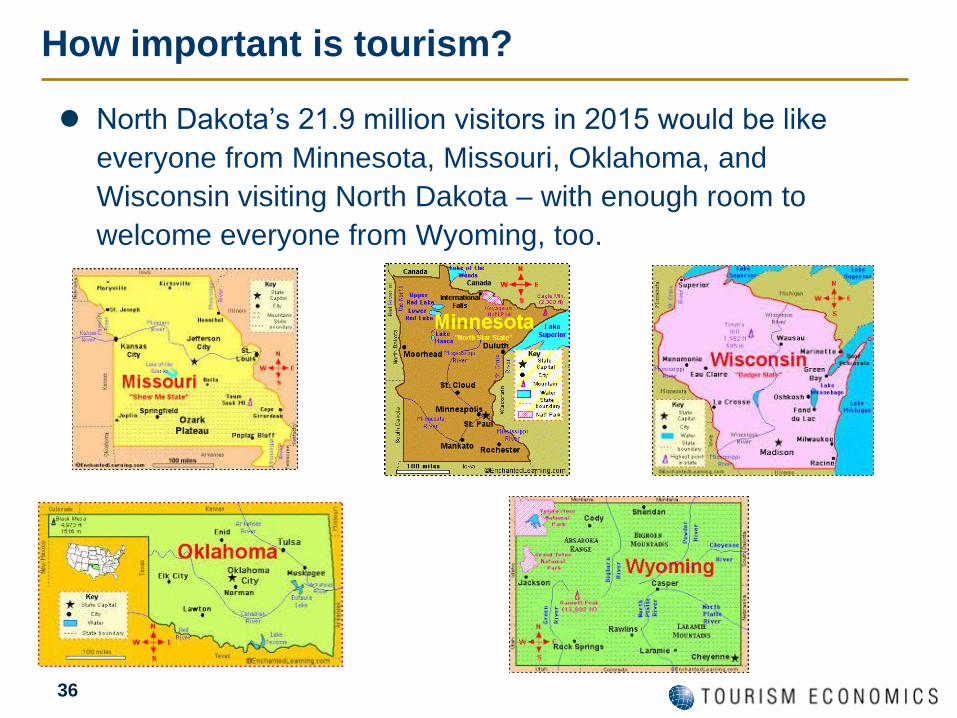
North Dakota’s 21.9 million visitors in 2015 would be like
everyone from Minnesota, Missouri, Oklahoma, and
Wisconsin visiting North Dakota – with enough room to
welcome everyone from Wyoming, too.
How important is tourism?
37
How important is tourism?
The $3.1 billion tourism industry in North Dakota
is equal to the amount Americans spent on
costumes for Halloween.
Source: http://www.self.com/story/how-much-the-average-american-spends-on-
halloween
38
The 30,088 direct tourism jobs would be
enough jobs for every resident of Morton
County – the seventh largest county in
North Dakota.
Total tourism supported employment is
three times larger than the enrollment of
North Dakota State.
How important is tourism?
39
The $327 million in state and local revenues from visitor
activity is enough to fully fund the state portion of the:
■ Highway Patrol
■ Department of Parks and Recreation
■ Game and Fish Department
■ Minot State University
■ Office of Attorney General
For the 2015-2017 budget years.
How important is tourism?
40
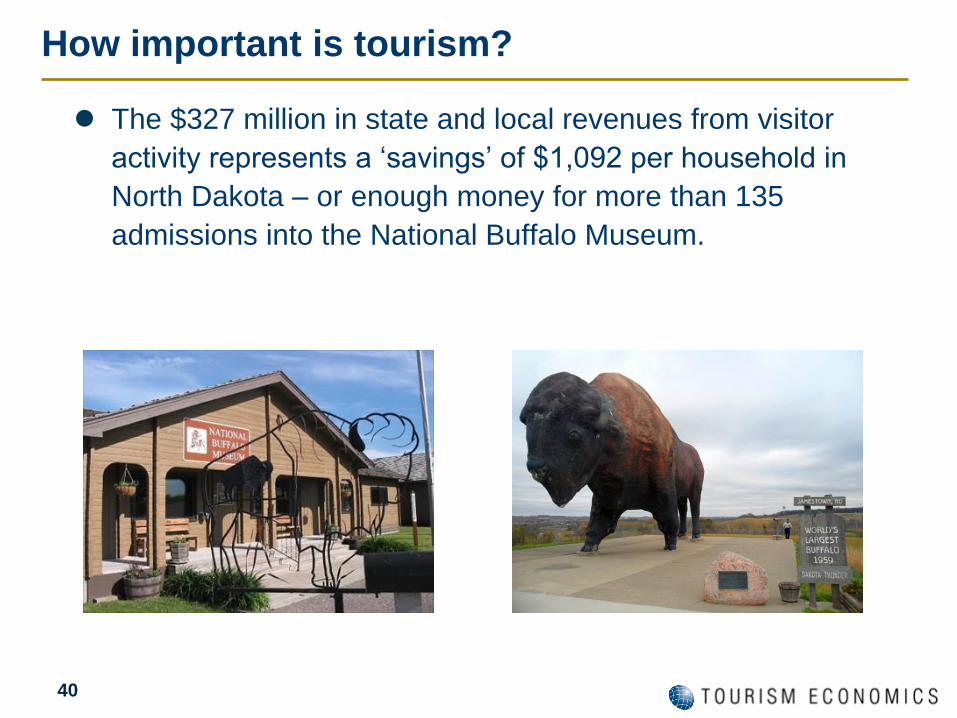
The $327 million in state and local revenues from visitor
activity represents a ‘savings’ of $1,092 per household in
North Dakota – or enough money for more than 135
admissions into the National Buffalo Museum.
How important is tourism?
41
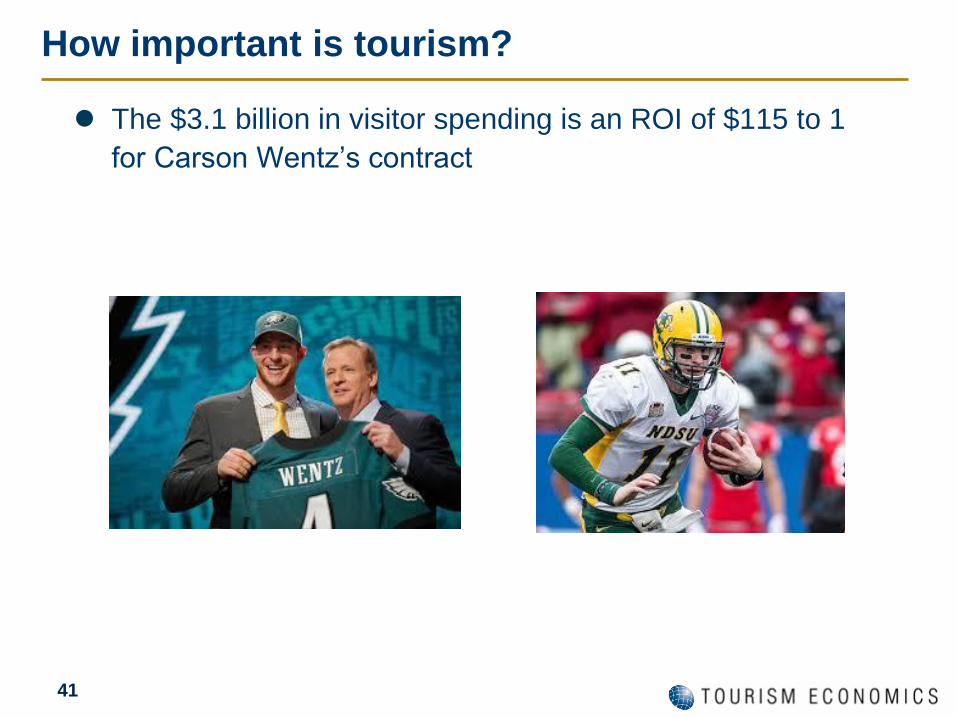
The $3.1 billion in visitor spending is an ROI of $115 to 1
for Carson Wentz’s contract
How important is tourism?
42
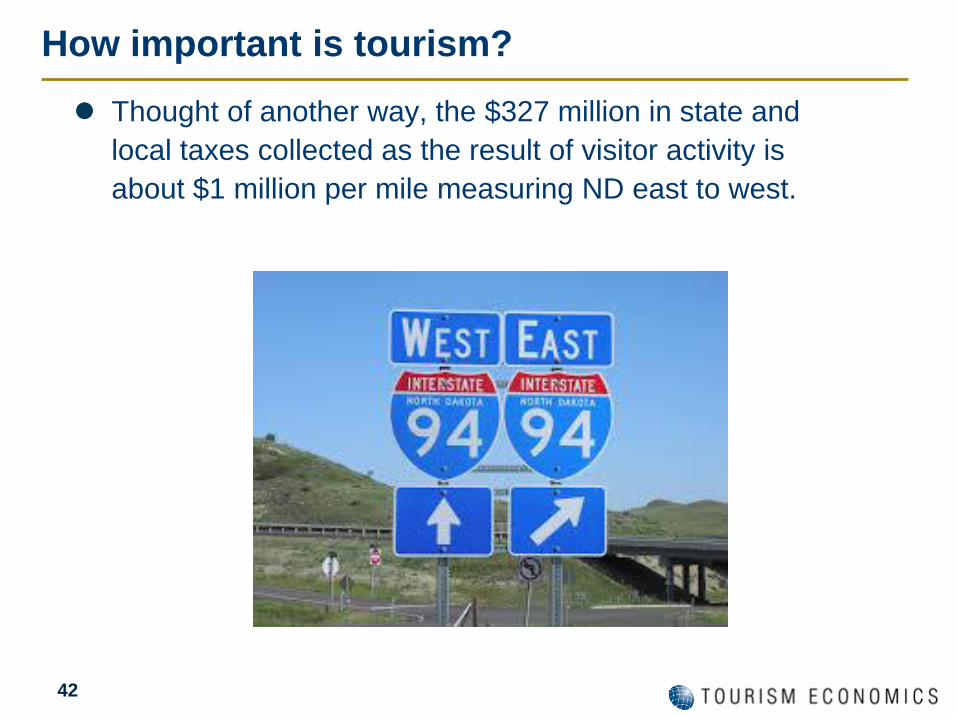
Thought of another way, the $327 million in state and
local taxes collected as the result of visitor activity is
about $1 million per mile measuring ND east to west.
How important is tourism?
Counties
45
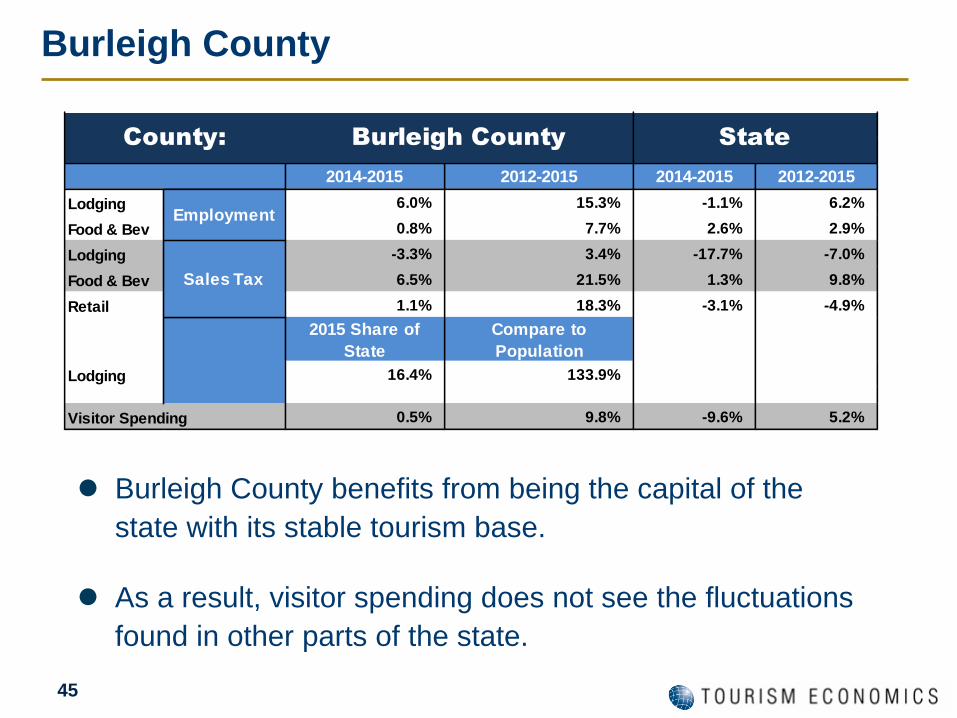
Burleigh County
2014-2015 2012-2015 2014-2015 2012-2015
Lodging 6.0% 15.3% -1.1% 6.2%
Food & Bev 0.8% 7.7% 2.6% 2.9%
Lodging -3.3% 3.4% -17.7% -7.0%
Food & Bev 6.5% 21.5% 1.3% 9.8%
Retail 1.1% 18.3% -3.1% -4.9%
2015 Share of
State
Compare to
Population
Lodging 16.4% 133.9%
Visitor Spending 0.5% 9.8% -9.6% 5.2%
County: State
Employment
Sales Tax
Burleigh County
Burleigh County benefits from being the capital of the
state with its stable tourism base.
As a result, visitor spending does not see the fluctuations
found in other parts of the state.

46
McKenzie County
2014-2015 2012-2015 2014-2015 2012-2015
Lodging -30.6% 109.5% -1.1% 6.2%
Food & Bev 2.5% 41.0% 2.6% 2.9%
Lodging -25.8% 279.6% -17.7% -7.0%
Food & Bev -10.1% 60.1% 1.3% 9.8%
Retail 15.7% -96.7% -3.1% -4.9%
2015 Share of
State
Compare to
Population
Lodging 5.3% 310.5%
Visitor Spending -17.0% 232.6% -9.6% 5.2%
County: State
Employment
Sales Tax
McKenzie County
McKenzie County is in Bakken Oil Field region.
Growth was explosive early in the decade but fell off as
oil prices fell.
47
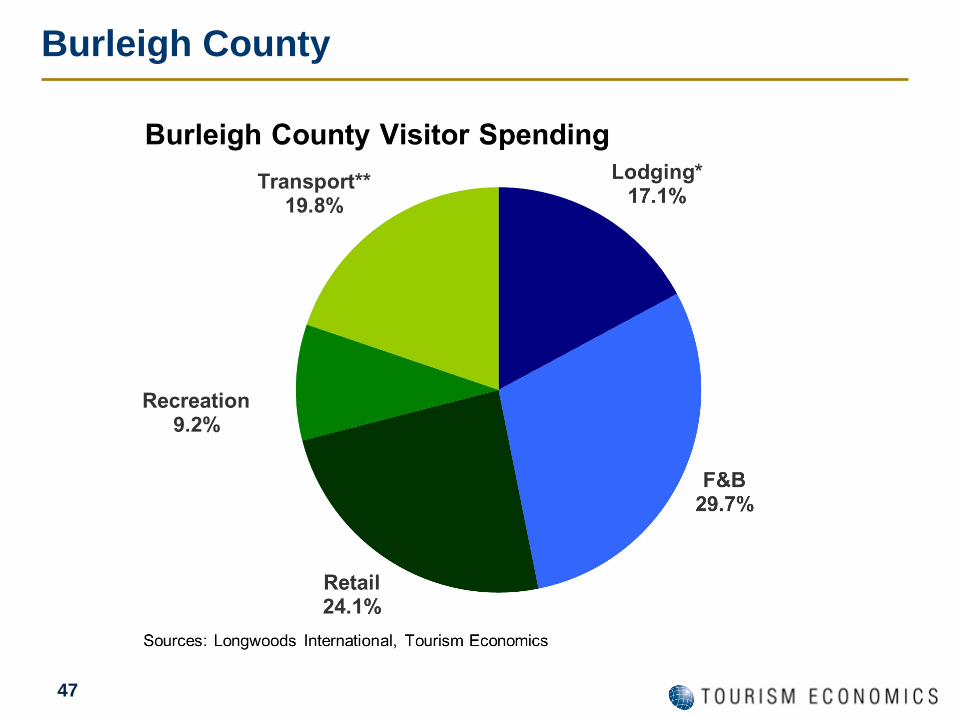
Burleigh County
48
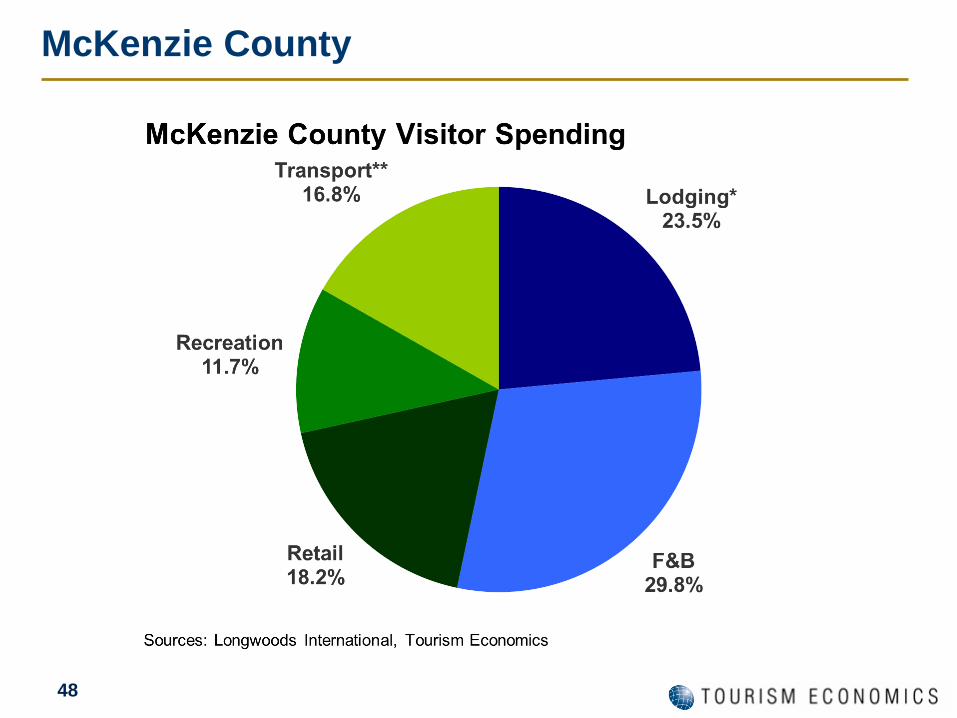
McKenzie County
49
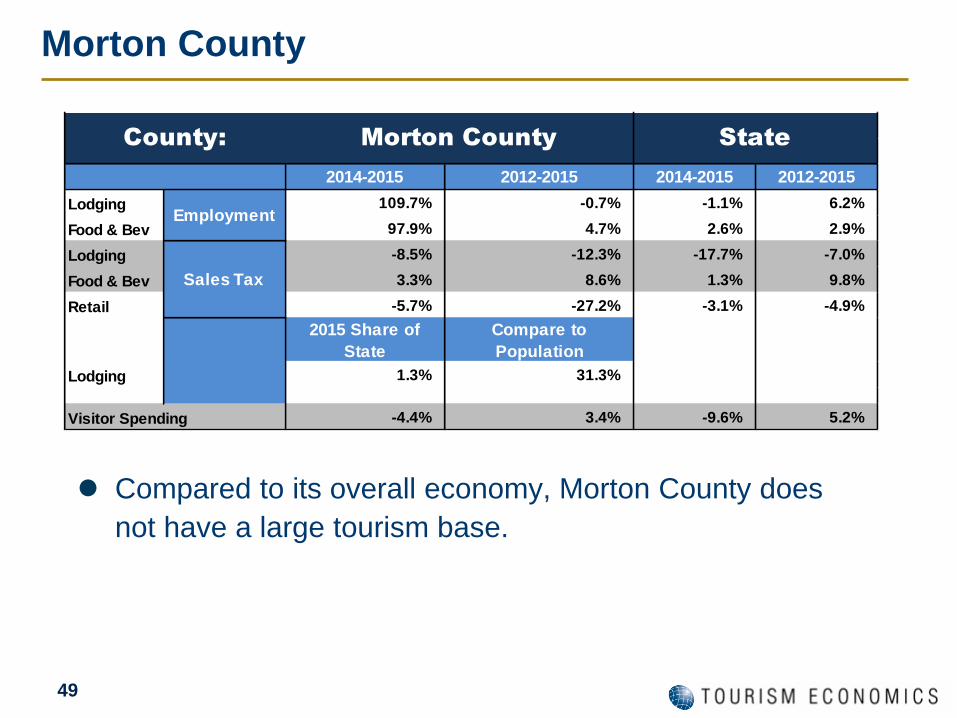
Morton County
2014-2015 2012-2015 2014-2015 2012-2015
Lodging 109.7% -0.7% -1.1% 6.2%
Food & Bev 97.9% 4.7% 2.6% 2.9%
Lodging -8.5% -12.3% -17.7% -7.0%
Food & Bev 3.3% 8.6% 1.3% 9.8%
Retail -5.7% -27.2% -3.1% -4.9%
2015 Share of
State
Compare to
Population
Lodging 1.3% 31.3%
Visitor Spending -4.4% 3.4% -9.6% 5.2%
County: State
Employment
Sales Tax
Morton County
Compared to its overall economy, Morton County does
not have a large tourism base.
50
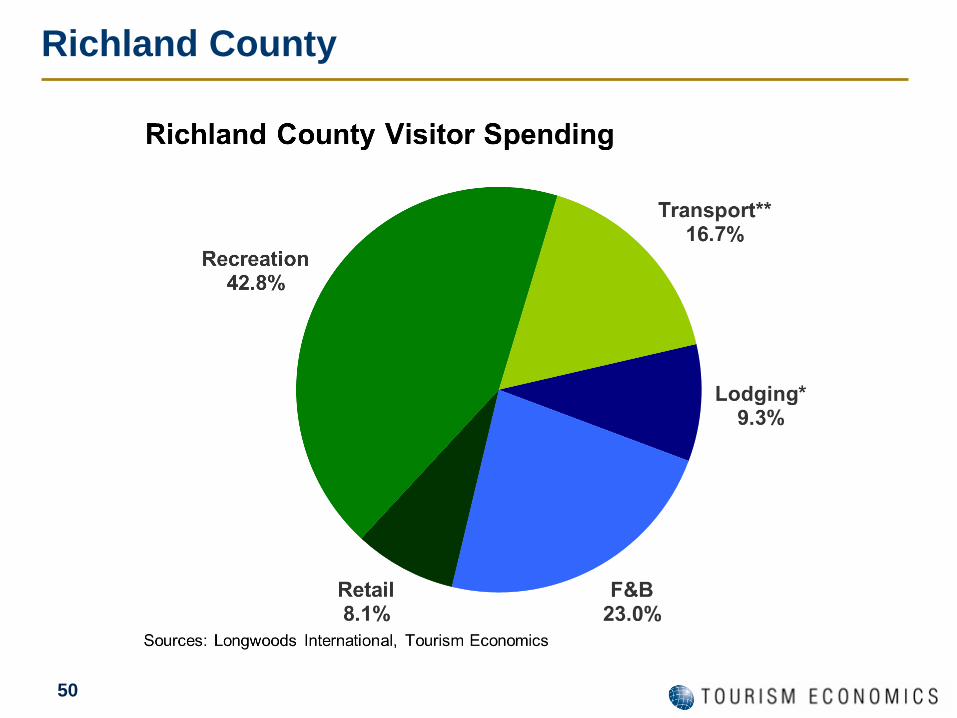
Richland County
51
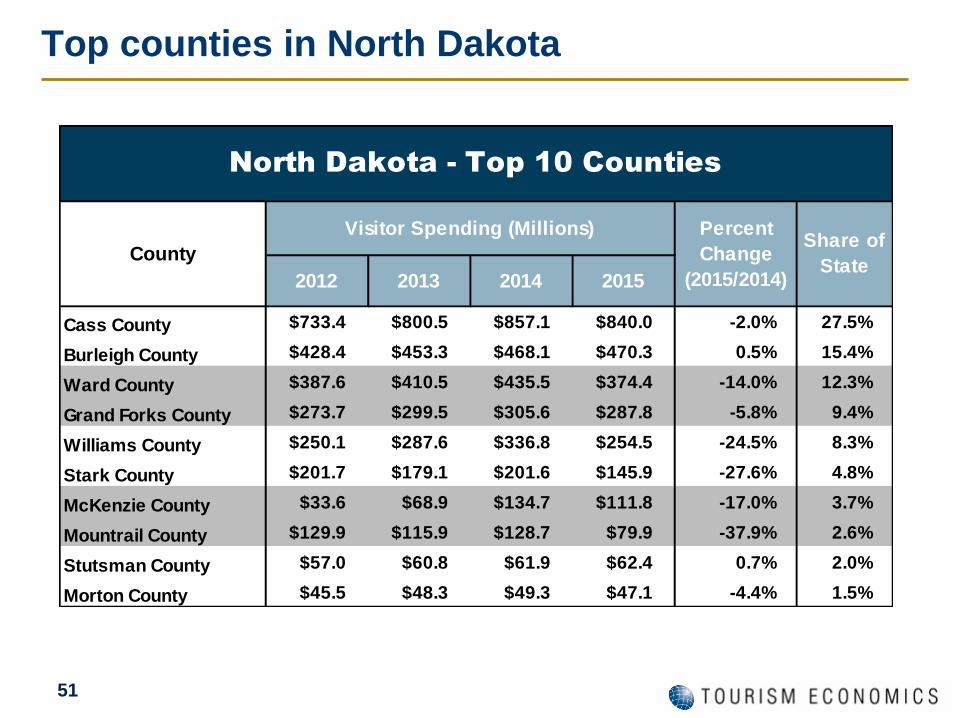
Top counties in North Dakota
2012 2013 2014 2015
Cass County $733.4 $800.5 $857.1 $840.0 -2.0% 27.5%
Burleigh County $428.4 $453.3 $468.1 $470.3 0.5% 15.4%
Ward County $387.6 $410.5 $435.5 $374.4 -14.0% 12.3%
Grand Forks County $273.7 $299.5 $305.6 $287.8 -5.8% 9.4%
Williams County $250.1 $287.6 $336.8 $254.5 -24.5% 8.3%
Stark County $201.7 $179.1 $201.6 $145.9 -27.6% 4.8%
McKenzie County $33.6 $68.9 $134.7 $111.8 -17.0% 3.7%
Mountrail County $129.9 $115.9 $128.7 $79.9 -37.9% 2.6%
Stutsman County $57.0 $60.8 $61.9 $62.4 0.7% 2.0%
Morton County $45.5 $48.3 $49.3 $47.1 -4.4% 1.5%
North Dakota - Top 10 Counties
County
Visitor Spending (Millions) Percent
Change
(2015/2014)
Share of
State
52
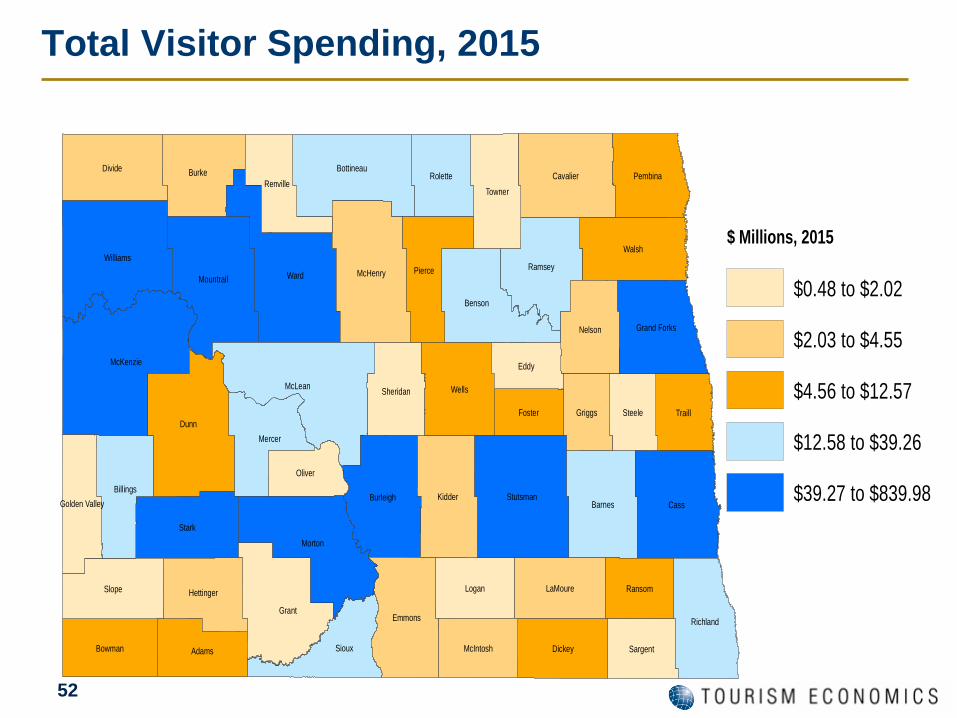
Total Visitor Spending, 2015
Ward
Dunn
Cass
McKenzie
McLean
Grant
Morton
Williams
Stark
Wells
Stutsman
McHenry
Divide
Walsh
Kidder
Mountrail
Barnes
Slope
Burke
Burleigh
Benson
Cavalier
Sioux
Bottineau
Traill
Pierce
Emmons
Ramsey
Dickey
Billings
Mercer
Richland
Logan
Towner
Nelson
Rolette
Adams
Pembina
Eddy
Bowman
LaMoure
Oliver
Hettinger
Grand Forks
Renville
Sheridan
SteeleGriggs
SargentMcIntosh
Foster
Ransom
Golden Valley
$ Millions, 2015
$0.48 to $2.02
$2.03 to $4.55
$4.56 to $12.57
$12.58 to $39.26
$39.27 to $839.98
53
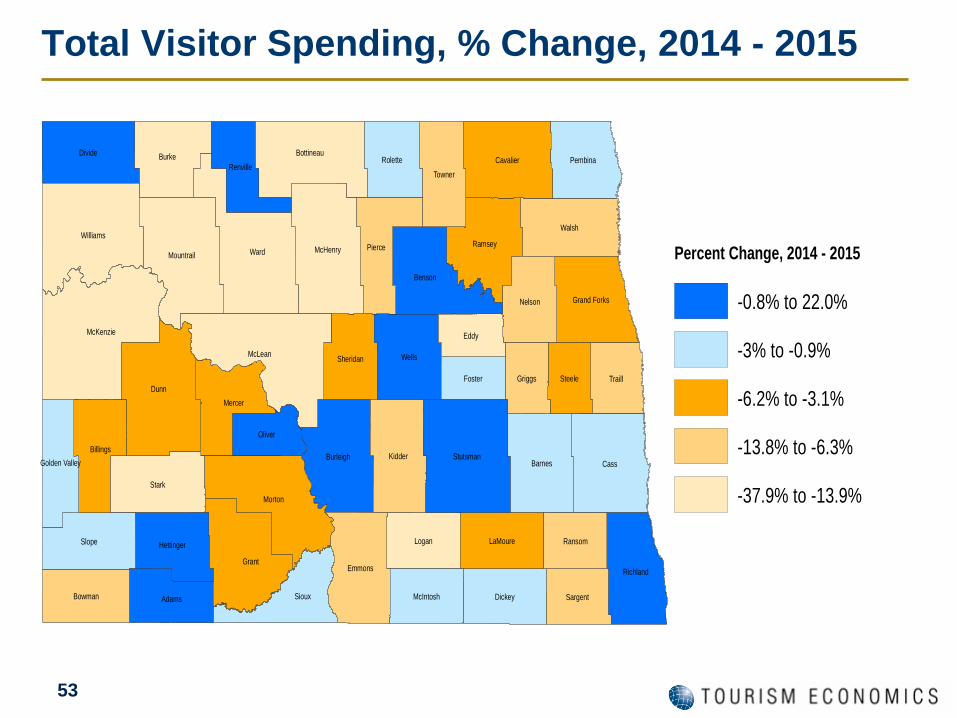
Total Visitor Spending, % Change, 2014 - 2015
Percent Change, 2014 - 2015
-0.8% to 22.0%
-3% to -0.9%
-6.2% to -3.1%
-13.8% to -6.3%
-37.9% to -13.9%
Ward
Dunn
Cass
McKenzie
McLean
Grant
Morton
Williams
Stark
Wells
Stutsman
McHenry
Divide
Walsh
Kidder
Mountrail
Barnes
Slope
Burke
Burleigh
Benson
Cavalier
Sioux
Bottineau
Traill
Pierce
Emmons
Ramsey
Dickey
Billings
Mercer
Richland
Logan
Towner
Nelson
Rolette
Adams
Pembina
Eddy
Bowman
LaMoure
Oliver
Hettinger
Grand Forks
Renville
Sheridan
SteeleGriggs
SargentMcIntosh
Foster
Ransom
Golden Valley
54
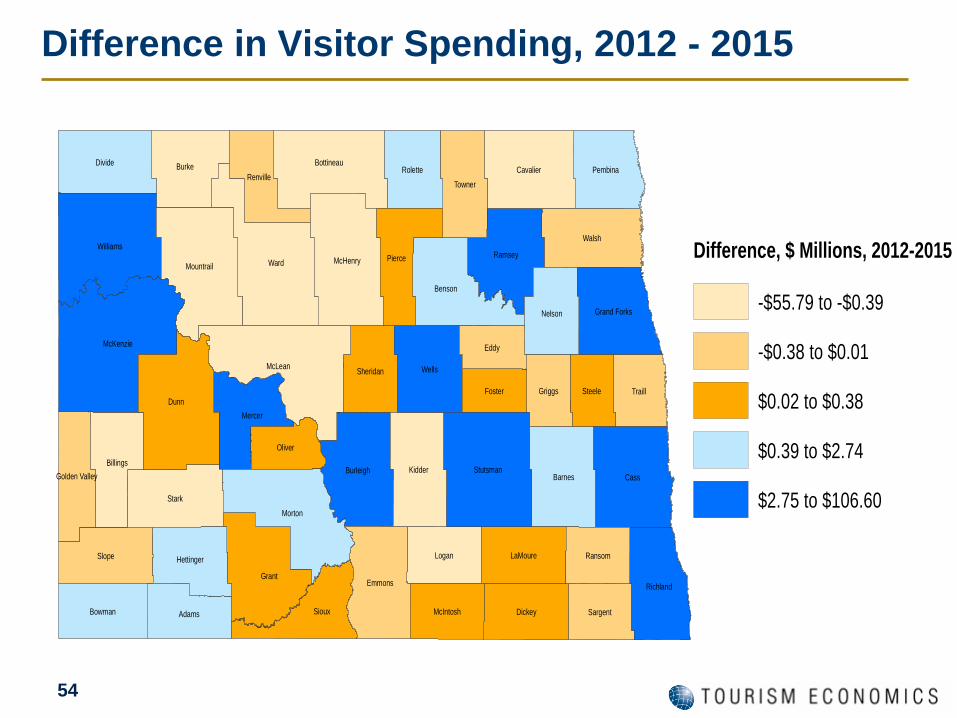
Difference in Visitor Spending, 2012 - 2015
Difference, $ Millions, 2012-2015
-$55.79 to -$0.39
-$0.38 to $0.01
$0.02 to $0.38
$0.39 to $2.74
$2.75 to $106.60
Ward
Dunn
Cass
McKenzie
McLean
Grant
Morton
Williams
Stark
Wells
Stutsman
McHenry
Divide
Walsh
Kidder
Mountrail
Barnes
Slope
Burke
Burleigh
Benson
Cavalier
Sioux
Bottineau
Traill
Pierce
Emmons
Ramsey
Dickey
Billings
Mercer
Richland
Logan
Towner
Nelson
Rolette
Adams
Pembina
Eddy
Bowman
LaMoure
Oliver
Hettinger
Grand Forks
Renville
Sheridan
SteeleGriggs
SargentMcIntosh
Foster
Ransom
Golden Valley
55
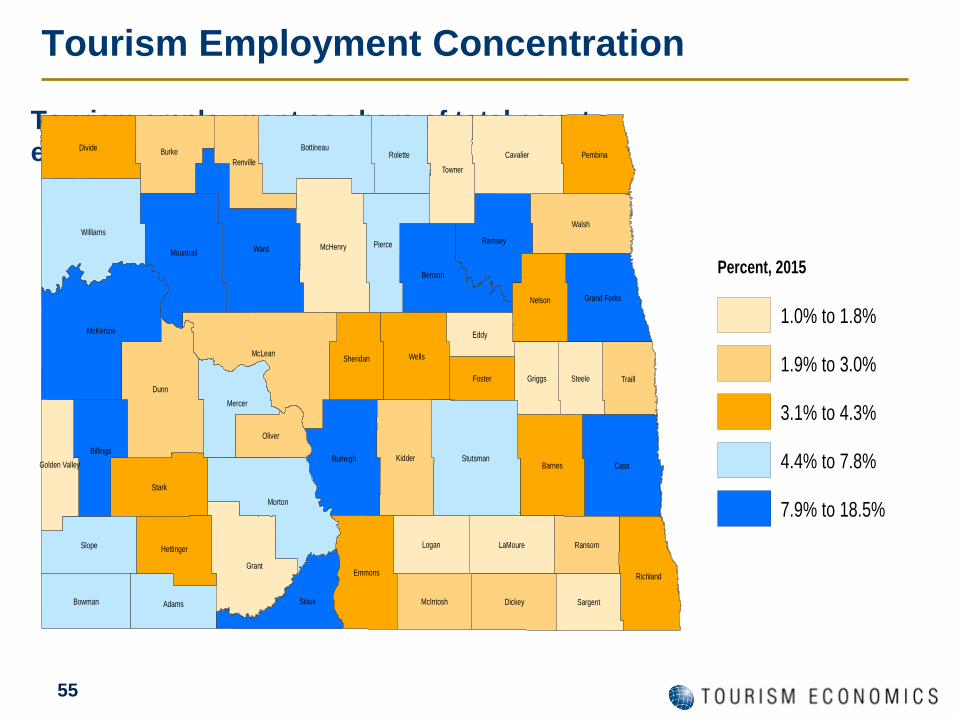
Tourism employment as share of total county
employment, 2015
Percent, 2015
1.0% to 1.8%
1.9% to 3.0%
3.1% to 4.3%
4.4% to 7.8%
7.9% to 18.5%
Ward
Dunn
Cass
McKenzie
McLean
Grant
Morton
Williams
Stark
Wells
Stutsman
McHenry
Divide
Walsh
Kidder
Mountrail
Barnes
Slope
Burke
Burleigh
Benson
Cavalier
Sioux
Bottineau
Traill
Pierce
Emmons
Ramsey
Dickey
Billings
Mercer
Richland
Logan
Towner
Nelson
Rolette
Adams
Pembina
Eddy
Bowman
LaMoure
Oliver
Hettinger
Grand Forks
Renville
Sheridan
SteeleGriggs
SargentMcIntosh
Foster
Ransom
Golden Valley
Tourism Employment Concentration

Economic Impact of Tourism in North Dakota
North Dakota Travel Industry Conference
April 2017
Christopher Pike
Director, Impact Studies
Tourism Economics