Embed Size (px)
Citation preview

ECONOMIC IMPACT OF THE PORGERA GOLD MINE
1
December 2020
DR JOHN FALLON
Institute of National AffairsDiscussion Paper No. 119
December 2020
ECONOMIC IMPACT OFTHE PORGERA GOLD MINE:1990-2019 And Loss Of IncomeFrom Suspension Of Operations

ECONOMIC IMPACT OF THE PORGERA GOLD MINE
2
Institute of National Affairs: Discussion Paper No. 119 First published: December 2020
By: Dr. John Fallon
Published by:Institute of National Affairs
PO Box 1530,Port Moresby
NCDPapua New Guinea
Copyright © 2020 Institute of National Affairs
ISBN 9980-77-202-6National Library Service – Papua New Guinea
Cover photos: …………………©Rocky Roe

ECONOMIC IMPACT OF THE PORGERA GOLD MINE
3
Economic Impact ofthe Porgera Gold Mine:
1990-2019 and Loss of Income from Suspension of Operations
Report prepared forInstitute of National Affairs, Papua New Guinea
December 2020
Dr. John Fallon

ECONOMIC IMPACT OF THE PORGERA GOLD MINE
4
CONTENTS
Foreword .................................................................................................................................... 5
Executive Summary .................................................................................................................. 7
1 Scope of work and context .................................................................................................... 13
2 The Porgera Gold Mine........................................................................................................... 14
2.1 Ownership history ..................................................................................................... 14
2.2 Brief description of the mine and lease area .......................................................... 14
3 Economic Impact .................................................................................................................... 15
3.1 Methodology and data for the economic assessment ......................................... 15
3.2 Economy-wide effects .............................................................................................. 17
3.3 Local economic development .................................................................................. 24
3.3.1 Situation at Porgera prior to mining ......................................................................... 24
3.3.2 Relocation issues ....................................................................................................... 25
3.3.3 Institutional arrangements and agreements to provide development benefits .. 26
3.3.4 Brief review of financial benefits for the Enga province and Porgera District ..... 26
3.3.5 Qualitative highlights ................................................................................................. 28
4 Impact of suspension of mining ............................................................................................ 29
5 References ............................................................................................................................... 32
ECONOMIC IMPACT OF THE PORGERA GOLD MINE
5
FOREWORD
Mining interest and activity in the Porgera valley has a long history. It commenced with the colonial government patrols and expeditions by mining prospectors in the 1930s, leading on to the alluvial extraction which commenced after the war in the late 1940s, conducted both by miners from Australia but then also by locals from the Porgera valley. There was then a very long lead-in period prior to the commencement of large scale mining by the Porgera Joint Venture in 1990, when results exceeded initial expectations. Since then there have been thirty years of production, albeit with various changes of foreign investors and alterations of government equity arrangements, and stages of both underground and open cast mining.
Fundamental to success in developing a major mine in the remote and high altitude Porgera valley was establishing a good relationship with the local Porgeran community, who’s population has grown vastly from the days of initial exploration to the present, particularly with major in-migration. Sound relations were also needed with the wider hinterland in Enga province, and down the Highlands Highway. The project has had a wide array of challenges over its life, as has the local community that has had to adapt to a major resource project with a major physical, environmental and demographic impact in their midst.
The Porgera mine has had a major economic impact locally and nationally over its life to date, with prospects for many more years ahead. During that period various ideas have been conjured up for suitable benefit sharing arrangements between the developers and the PNG Government, provincial and local authorities and landowners, particularly focusing upon equity stakes, but also using different means to spread benefits, including the innovative Infrastructure Tax Credit Scheme. Dialogue is ongoing for further arrangements going forward.
This study does not seek to examine different prospective benefit sharing options. It provides a trail of the economic impact of the mine, particularly over its more

ECONOMIC IMPACT OF THE PORGERA GOLD MINE
6
recent life, and a snapshot for 2019, and the potential economic impact of its closure for a year or longer period, under prevailing benefit sharing conditions, and with current contracting and purchasing arrangements with the wider business and local community. It shows both the major impact on the national and local economy, including revenue, but also provides a fascinating insight into the major contracting and purchases contributing to a wider multiplier effect. It also doesn’t attempt to assess externalities, such as environmental costs over the life of the mine, although these were, at least partly, incorporated within compensation payments.
Clearly, the closure of the mine at short notice in April 2020 had an immediate and potential longer term economic and social impact, especially locally, highlighting the need for better ways to plan and implement proposed policy or institutional changes that, directly or indirectly, affect investors, employees, contractors, the local community and government itself. Periodically reviewing fiscal and investment conditions and ensuring that they’re competitive and fit for purpose is an important function for all governments, while also seeking to sustain needed policy stability, confidence and engagement with business and investors.
The Institute of National Affairs was funded by the Barrick (Niugini) Ltd (BNL) to conduct an independent study. The report was written by Dr John Fallon, using data provided by BNL, as well as from government and diverse other sources. The INA has been responsible for ensuring the independence of the exercise, while the views expressed in the report are wholly those of the author. We consider that the report provides a valuable window into the role of this major resource project for the economy of PNG and the Province at an important phase of the mine’s life and that of the country.
Paul BarkerExecutive DirectorInstitute of National Affairs
ECONOMIC IMPACT OF THE PORGERA GOLD MINE
7
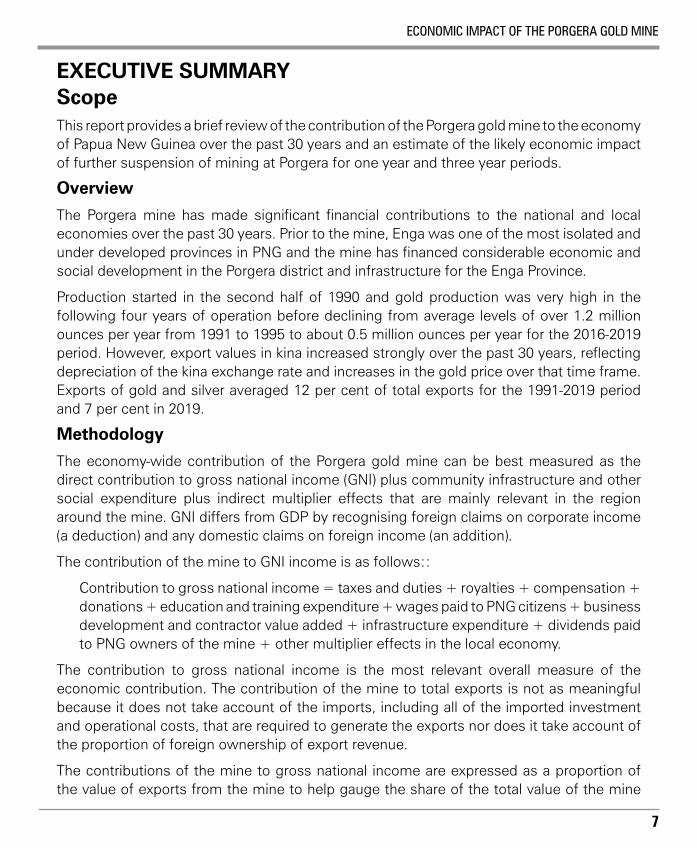
EXECUTIVE SUMMARYScopeThis report provides a brief review of the contribution of the Porgera gold mine to the economy of Papua New Guinea over the past 30 years and an estimate of the likely economic impact of further suspension of mining at Porgera for one year and three year periods.
Overview
The Porgera mine has made significant financial contributions to the national and local economies over the past 30 years. Prior to the mine, Enga was one of the most isolated and under developed provinces in PNG and the mine has financed considerable economic and social development in the Porgera district and infrastructure for the Enga Province.
Production started in the second half of 1990 and gold production was very high in the following four years of operation before declining from average levels of over 1.2 million ounces per year from 1991 to 1995 to about 0.5 million ounces per year for the 2016-2019 period. However, export values in kina increased strongly over the past 30 years, reflecting depreciation of the kina exchange rate and increases in the gold price over that time frame. Exports of gold and silver averaged 12 per cent of total exports for the 1991-2019 period and 7 per cent in 2019.
Methodology
The economy-wide contribution of the Porgera gold mine can be best measured as the direct contribution to gross national income (GNI) plus community infrastructure and other social expenditure plus indirect multiplier effects that are mainly relevant in the region around the mine. GNI differs from GDP by recognising foreign claims on corporate income (a deduction) and any domestic claims on foreign income (an addition).
The contribution of the mine to GNI income is as follows::
Contribution to gross national income = taxes and duties + royalties + compensation + donations + education and training expenditure + wages paid to PNG citizens + business development and contractor value added + infrastructure expenditure + dividends paid to PNG owners of the mine + other multiplier effects in the local economy.
The contribution to gross national income is the most relevant overall measure of the economic contribution. The contribution of the mine to total exports is not as meaningful because it does not take account of the imports, including all of the imported investment and operational costs, that are required to generate the exports nor does it take account of the proportion of foreign ownership of export revenue.
The contributions of the mine to gross national income are expressed as a proportion of the value of exports from the mine to help gauge the share of the total value of the mine

ECONOMIC IMPACT OF THE PORGERA GOLD MINE
8
that accrues to the national economy. The contributions are also expressed in real (constant price) terms by deflating by the consumer price index to show the real trend over time.
It was not possible to estimate dividends paid to PNG owners of the mine but none were paid until 1997 as it is understood that distributions to that time were used to pay for their equity in the mine. Dividends in recent years would be based on the 5% equity share held in equal parts by the Enga Provincial government and Porgera Special Mining Lease landowners
The business development and contractor value added figures were based on operational expenditure figures and would overestimate the direct contribution to gross national income because they would include various imported inputs such as fuel, however, this would likely be more than offset by multiplier effects through linkages to other businesses and consumption expenditure effects so no adjustments were made to the business development figures. Also there were no estimates of construction expenditure and associated flow-on effects.
Total financial contribution The total financial contribution of the mine for the period 1990 to 2019 was 13.2 billion kina which is equivalent to 26.6 billion kina in 2019 prices. This total comprised taxes paid to the national government, royalties, compensation and donations, infrastructure expenditure, local and national operations contracts and local and national wages (excluding expatriates). The royalties were paid to the Enga Provincial government, Porgera Development Authority, local landowners, a children’s trust and young adults.
Table E1 shows the financial benefits to PNG of the Porgera gold mine as a proportion of export values.
Period Taxes Royalties, compensation, education and infrastructure
National and Local operations contracts
PNG wages
Total
1991-2019 average
12.9% 5.3% 17.3% 5.4% 40.9%
2019 13.9% 4.4% 15.8% 6.7% 40.9%

ECONOMIC IMPACT OF THE PORGERA GOLD MINE
9
The average total financial contribution of the mine to the PNG economy relative to export values was 40.9% over the 30 years and also 40.9% in 2019. The single most important category was national and local operations contracts constituting 17.3% of export value revenue over the 1991-2019 period and 15.8% for the most recent year 2019. Taxes were the next most important category. Note that the remaining 59.1% of the share of export revenue is not profit but rather the residual sales value that must cover all the capital and business expenses of the mine not provided by PNG businesses and employees plus provide revenue to cover a return on investment and a return of the capital, in the form of depreciation expenses, that was invested.
The total financial contribution relative to non-mining GDP was 1.8% in 2019, the same as the average for the period from 2006 to 2019.
Employment for PNG nationals and locals at the mine averaged 2,578 over the 30 year period and was 3,527 in 2019.
Local economic development
The Ipili are the customary owners of the land where the Porgera mine is located. Historically the Ipili lived in scattered hamlets in a sparsely and underdeveloped area with meagre government services and infrastructure. The Porgera economy was primarily subsistence based, with agriculture and alluvial gold mining the major sources of income. There was also uneven access to cash earning activities related to alluvial mining. The mine created a lot more scope for landowners and people in nearby districts to earn cash and benefit from public infrastructure and basic social services.
The population of the Porgera Valley has since increased from approximately 4000 people in 1988 to approximately 73,000, as people migrated from other districts for work. But some people living in the area covered by the special mining lease had to be relocated and the total land area of the mine tenements has almost doubled since mining operations began. The cumulative impact of population growth, the continuing presence of tribal conflict and customary ownership and kinship arrangements have greatly complicated the process of relocation from the special mining lease area and other tenements to allow mining to occur. These problems and government capacity constraints to deal with them are a common feature of mining operations in PNG generally. Thus even though the mine has generated significant financial benefits there are a range of social and institutional factors that mean there are significant underlying tensions, social issues and dis-satisfaction about outcomes.
Various agreements and institutions were established to provide compensation and contribute to local business opportunities and local economic development. The approach at Porgera, for the first time in PNG, was to distribute the financial benefits after appropriate community based negotiations. One of the problems with the management of the financial flows to government and development bodies has been the critical lack of transparency at both the

ECONOMIC IMPACT OF THE PORGERA GOLD MINE
10
The cumulative nominal kina value for the whole period is about 5.2 billion kina which is equivalent to 10.3 billion kina in 2019 prices. The most important component is local business development comprising about half of the total, followed by local wages. There would be additional local multiplier effects as businesses servicing the mine would require other business inputs and local consumption expenditure would also create some additional
national and sub-national government levels about where the substantial financial payments ultimately go and their effectiveness in providing tangible benefits to local stakeholders. This has contributed to a frustration at the community level about the economic impact of the mine.
The main direct financial benefits for the Enga province accumulated from 1990 to 2019 are shown in Chart E1 which shows the cumulated financial benefits in kina millions in 2019 prices. The people of the Enga province have benefited from: royalties; compensation for occupation, relocation and environmental impacts; donations; external education and internal training; community projects and infrastructure; business development contracts; wages and dividends (not shown in the figures here). Infrastructure includes townships, power and water facilities, school, health and police buildings and other community infrastructure.

ECONOMIC IMPACT OF THE PORGERA GOLD MINE
11
effects. In addition there were construction contracts that would have provided some economic benefits to local companies and employees and these are not included. These considerations imply that the figures would be an under estimate of the total benefits.
In qualitative terms the infrastructure tax credit scheme is considered to have been a very effective means of ensuring good value for money from the funds that were used. Howerver, two areas of concern, in relation to economic and social development, relate to education outcomes and law and order problems. There is a concern about the quality of education which is largely related to PNG’s education system as a whole and also the need for more participation by the local community. Law and order problems also continue to persist as is the case in many parts of PNG. However, the Restoring Justice Initiative Association (RJIA) which was started as a partnership between Barrick Niugini Ltd and the local community in 2008 has made progress in peacebuilding, conflict resolution, social justice and community development in the Porgera District. Social issues, are still present, but aspects of the effort are reported to have paid off, notably in terms of women’s empowerment and engagement in economic activity.
Impact of suspension of miningThe price of gold increased substantially in 2019 and the first 10 months of 2020. The IMF forecasts some weakening of the price in 2021 but for prices from 2021 to 2024 to remain at an average of around $US 1,600 per ounce which is 23 per cent higher than the average for the 2016-2019 period.
Based on these price forecasts it is reasonable to assume that a conservative estimate of the lost income for the economy for one year would be the outcome for 2019 and would be three times that value for a three year suspension of the mine.
Based on these assumptions, the total financial contribution in 2019 prices would be at least 1.1 billion kina for one year and at least $3.3 billion kina for three years.
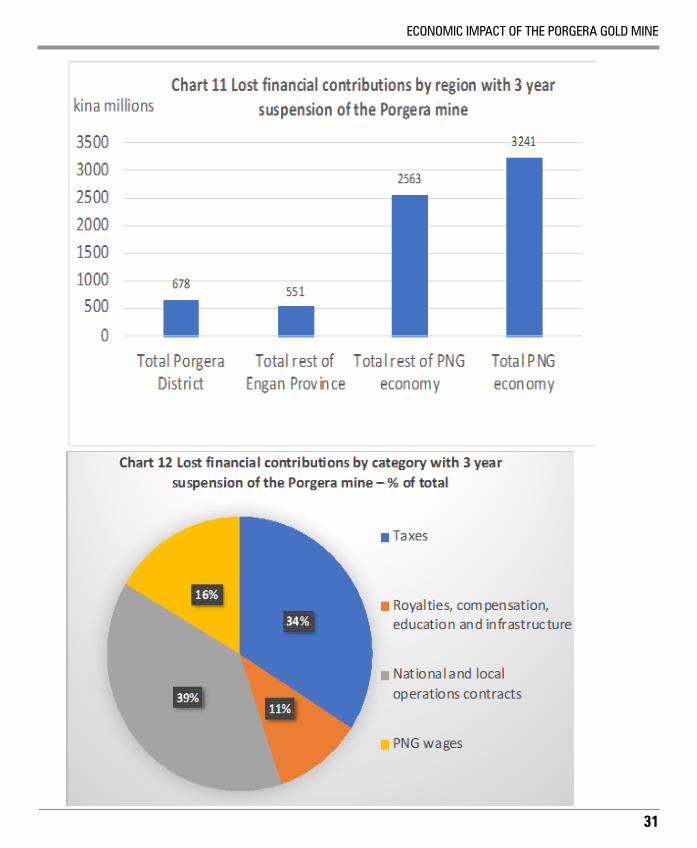
The breakdown of these figures into impacts for the Porgera District, the rest of the Enga Province and the rest of PNG is shown in Chart E2. Chart E3 shows the shares of the impacts by category. The impacts on the Porgera District and rest of the Enga Province constitute about 40 per cent of the total impact. The biggest single category impact is for national and local operations contracts comprising 39 per cent of the total loss, followed by the loss of tax revenue at the national level which constitutes about 34 per of the total foregone economic benefit.

ECONOMIC IMPACT OF THE PORGERA GOLD MINE
12

ECONOMIC IMPACT OF THE PORGERA GOLD MINE
13
1 SCOPE OF WORK AND CONTEXTThis report has been prepared at the request of Barrick New Guinea Limited (BNL). The views expressed in the report are wholly those of the author. The report provides a brief review of the contribution of the Porgera gold mine to the economy of Papua New Guinea over the past 30 years and an estimate of the likely economic impact of further suspension of mining at Porgera for one year and three year periods.
Production started at the Porgera gold mine in 1990 with a 30 year special mining lease gazetted in August 1989. A 20 year extension was applied for in June 2017. However, on 24 April 2020 the Government announced it would not extend the special mining lease at the Porgera gold mine and mining at the gold mine was immediately suspended by BNL in accordance with PNG law.
The Porgera mine has made significant financial contributions to the national and local economies over the past 30 years. Prior to the mine, Enga was one of the most isolated and under developed provinces in PNG and the mine has financed considerable economic and social development in the Porgera district and infrastructure for the Enga Province. However, even though the PJV has generated significant financial benefits there are a range of social and institutional factors that mean there are significant underlying tensions, social issues and dis-satisfaction about outcomes. This is true in relation to both relocation issues and the effectiveness of government expenditure generated by the revenues from the mine.
This report does not examine the governance arrangements for responsibilities for the expenditure of financial contributions from the mine but rather focusses on the financial contributions and their size relative to other economic and fiscal measures.
This report uses data provided by the Porgera Joint Venture but cross checks the data and presents the data relative to key macroeconomic and fiscal variables. The report also draws on a number of studies of economic and social development related to the operation of the mine. A National Research Institute study by Johnson (2012) provides a thorough review of the institutional frameworks for managing the financial contributions made by the mine and the distribution of benefits to 2009. Filer (2012) contains a compendium of papers covering the economic and social development of the mine from 1989 to 1994. Lolauve (2011) provides an assessment of educational outcomes in the Porgera district. Kemp and Owen (2015) provide a useful overview of the Porgera mine operation, relocation and lease issues and the recent situation in the mining lease area.
This report draws on key findings in these and other reports but its main contribution is to present and review the total financial contributions for the period 1990 to 2019, focusing on economy-wide impacts but with some assessment also of impacts for the Enga Province where data is available.

ECONOMIC IMPACT OF THE PORGERA GOLD MINE
14
1Burton and Banks (2017).
2 THE PORGERA GOLD MINE
2.1 Ownership historyThe mine began as the Porgera Joint Venture (PJV) in 1989 with an unincorporated joint venture ownership of Placer Pacific (30%), Highlands Pacific (30%), Renison Goldfields (30%) and the PNG government (10%). Over time ownership changes occurred and the government equity share has risen and fallen. In 1996 the government purchased an additional equity share of 15% taking its total share to 25%. 5% of the government equity share was divested in equal parts to the Enga Provincial government and special mining lease landowners and the remaining 20% equity was held in Orogen Minierals, an ASX listed company which was 51% owned by the Mineral Resources Development Company (a company fully owned by the State). Orogen Minerals was taken over by Oil Search in 2002. Placer Dome operated the mine until 2006 when it was taken over by Barrick Gold. Presently Barrick Niugini Limited (BNL) is the operator of the mine and also holds 95% of the equity, (equally split between Barrick Gold (47.5%) and Zijn Mining (47.5%)), with the remaining 5% equity held by Mineral Resources Enga and equally owned by the Enga Provincial Government (2.5%) and Porgera Special Mining Lease Landowners (2.5%).1
2.2 Brief description of the mine and lease areaThe Porgera mine is located in the Porgera Valley of the Enga Province of PNG. At the time of the mine opening, the Porgera Valley was one of the most undeveloped regions of the country but now has much infrastructure and services that are lacking in other remote areas of PNG. The mine is a combined open pit and underground gold and silver mine. It is located 140 kilometres west of Mt Hagen.
A special mining lease was granted to the PJV on the 12 May 1989. There is also a mining lease, for mining and processing lime, other leases for mining purposes, mining easements and State Leases, including an airport, power station and townships. The mine’s footprint covers the mining areas as well as communities along the Lae-Porgera Highlands Highway, the Hides (Hela Province) to Porgera electricity transmission line and the riverine tailings disposal system.
Production started in the second half of 1990 and gold production was very high in the following four years of operation before declining from average levels of over 1.2 million ounces per year from 1991 to 1995 to about 0.5 million ounces per year for the 2016-2019 period. However, export values in kina increased strongly over the past 30 years, reflecting depreciation of the kina exchange rate and increases in the gold price over that time frame despite weaknesses in the early 2000s.

ECONOMIC IMPACT OF THE PORGERA GOLD MINE
15
3 ECONOMIC IMPACT3.1 Methodology and data for the economic assessment
The economy-wide contribution of the Porgera gold mine can be measured as the direct contribution to gross national income (GNI) plus community infrastructure and other social expenditure plus indirect multiplier effects that are mainly relevant in the region around the mine. GNI differs from GDP by recognising foreign claims on corporate income (a deduction) and any domestic claims on foreign income (an addition) and it includes any net taxes not already accounted for. This means that in the case of the Porgera gold mine dividends should only be recognised to the extent they accrue to domestic owners.
The contribution of the mine to GNI income, used in this paper, can be expressed as:
Contribution to gross national income = taxes and duties + royalties + compensation + donations + education and training expenditure + wages paid to PNG citizens + business development and contractor value added + infrastructure expenditure + dividends paid to PNG owners of the mine + other multiplier effects in the local economy.
Note that the contribution to gross national income is the most relevant overall measure of the economic contribution. The contribution of the mine to total exports is not as meaningful because it does not take account of the imports that are required to generate the exports, including all of the imported investment and operational costs, nor does it take account of the foreign ownership of export revenue. However expressing the contributions relative to export values is helpful in gauging the shares of the revenues generated from the mine for each type of contribution.
Estimates were prepared for the operational phase of the mine which began in mid-1990. The figures for 1990 are excluded in some of the comparisons because they are not complete and only relate to part of the year.
It was not possible to estimate dividends paid to PNG owners of the mine but none were paid until 1997 as it is understood that distributions to that time were used to pay for their equity in the mine. Dividends in recent years would be based on the 5% equity share held in equal parts by the Enga Provincial government and Porgera Special Mining Lease landowners.
Most of the data were sourced from the Porgera Information Booklet (2019) and some data were obtained from Johnson (2012). Macroeconomic and fiscal data were obtained from IMF, National Statistics Office and Bank of Papua New Guinea publications.
For some of the variables the original data was in a cumulative form (compensation and donations to 1994, and infrastructure and business development expenditure for most of the
Exports of gold and silver averaged 12 per cent of total exports for the period 1991-2019 and 7 per cent in 2019.

ECONOMIC IMPACT OF THE PORGERA GOLD MINE
16
whole period). Annual figures were estimated such that the annual figures increased in line with the CPI while constraining the nominal sum to equal the cumulated total that was provided.
Estimates of operational expenditure for business development were available and these would likely constitute the main inter-industry linkage type I multiplier effect which recognises flow-on effects to businesses as a sector expands. Other multiplier effects would mainly arise to the extent that there was some flow-on expenditure effects from financial contributions, local wages and contractor expenditure. Other multiplier effects are not measured in this paper but studies of mines in other developing countries indicate that the additional multiplier effect beyond the inter-industry linkage effect tends to be about the same as the type I inter-industry linkage effect.2 The operational expenditure figures presented in this paper would overestimate the direct contribution to gross national income because they would include various imported inputs such as fuel, however, this would likely be more than offset by multiplier effects through linkages to other businesses and consumption expenditure effects so no adjustments were made to the business development figures. Also there were no estimates of construction expenditure and associated flow-on effects.
The contributions of the mine to gross national income are expressed as a proportion of the value of exports from the mine to help gauge the share of the total value of the mine that accrues to the national economy. The contributions are also expressed in real (constant price) terms by deflating by the consumer price index to show the real trend over time. Data on the individual components are also presented to identify the relative contributions. The contributions to gross national income are also expressed as a proportion of non-mining GDP as the latter is a proxy for gross national income. This is considered to be the most appropriate overall measure in terms of economic impact of the mine.
The contributions of taxes and infrastructure expenditure are also examined in terms of the share of government revenues. Employment numbers are also presented for reference. However, the employment impacts are already included in wages, wage taxes and multiplier effects.
Observations are also made about the impact of the mine on local economic development in the Porgera district. There have been significant expenditures on education and infrastructure over the near 30 years of mine operation and on local and national business development. Royalties, compensation and donations are the other categories that would directly benefit the Porgeran and Engan economies.
It should be recognised that mining is a highly capital intensive activity with the economic contributions varying considerably in the exploration, construction, operation and decommissioning phases. Most of the benefits to the national economy occur in the operation phase.
2See Roe and Round (2017).

ECONOMIC IMPACT OF THE PORGERA GOLD MINE
17
3.2 Economy-wide effectsThe economy-wide effects are summarised in Table 1. Charts 1 to 8 present various aspects of the contributions in terms of relative magnitudes and trends. Table 2 shows the financial benefits for several categories as a proportion of the value of mine exports. Table A1 at the end of the paper provides more detailed figures.
Table 1: Summary of financial contributions of the Porgera Gold mine, 1990-2019
Total nominal financial contribution 1990-2019 13.2 billion kinaTotal financial contribution 1990-2019 in 2019 prices 26.6 billion kinaPorgera gold & silver % of total exports – average 1991-2019 12%Porgera gold & silver % of total exports – 2019 7%Total financial contribution % of mine exports – average 1991-2019 40.9%Total financial contribution % of mine exports – 2019 40.9%Taxes, education & infrastructure expenditure % of tax receipts – average 2008-2019
3.1%
Taxes, education & infrastructure expenditure % of tax receipts – average – 2019
3.8%
Non-expatriate employment at the mine – average 1991-2019 2,342Non-expatriate employment at the mine – 2019 3,527Total financial contribution % of non-mining GDP – average 2006-2019 1.8%Total direct financial contribution % of non-mining GDP – 2019 1.8%
As shown in Table 1 the total financial contribution of the mine for the period 1990 to 2019 was 13.2 billion kina which is equivalent to 26.6 billion kina in 2019 prices. This total comprised taxes paid to the national government, royalties, compensation and donations, infrastructure expenditure, local and national operations contracts and local and national wages (excluding expatriates). The royalties were paid to the Enga Provincial government, Porgera Development Authority, local landowners, a children’s trust and young adults.
Gold and silver exports from Porgera as a share of total goods exports from PNG averaged 12% over the 30 year period and were 7% in 2019. The average total financial contribution of the mine to the PNG economy relative to export values was 40.9% over the 30 years and also 40.9% in 2019. As explained in Section 3.1 the contributions of the mine to gross national income are expressed as a proportion of the value of exports from the mine to help gauge the share of the total value of the mine that accrues to the national economy. Note that the remaining 59.1% of the share of export revenue is not profit but rather the residual sales value that must cover all the capital and business expenses of the mine not provided by PNG

ECONOMIC IMPACT OF THE PORGERA GOLD MINE
18
However, Chart 2 shows that when the financial benefits are expressed as a proportion of export values the proportion tends to be in the range of 32-44 cent since 2005. Chart 2 also shows: taxes; royalties, compensation and donations, education and infrastructure; national and local operations contracts; and PNG wages as a proportion of export values. Averages and the figures for 2019 are shown in Table 2 and Charts 3 and 4.
businesses and employees plus provide revenue to cover a return on investment and a return of the capital, in the form of depreciation expenses, that was invested.
The total financial contribution of taxes and expenditure on education and infrastructure relative to tax receipts (excluding grants) averaged 3.9% and was slightly lower in 2019.
The total financial contribution relative to non-mining GDP was 1.8% in 2019, the same as the average for the period from 2006 to 2019.
Employment for PNG nationals and locals at the mine averaged 2,578 employees over the 30 year period and was 3,527 employees in 2019.
Chart 1 plots the total export value and the total direct benefit to the PNG economy for the 1991-2019 period. There is a widening gap from about 1997.

ECONOMIC IMPACT OF THE PORGERA GOLD MINE
19
Table 2: Financial benefits to PNG of the Porgera gold mine as a proportion of export values
Period Taxes Royalties, compensation, education and infrastructure
National and local operations contracts
PNG wages Total
1991-2019average
12.9% 5.3% 17.3% 5.4% 40.9%
2019 13.9% 4.4% 15.8% 6.7% 40.9%

ECONOMIC IMPACT OF THE PORGERA GOLD MINE
20
National and local operations contracts constitute the single most important financial benefit over the whole period followed by taxes at the national level. National and local operations contracts were were lower than average in 2019, as was the contribution from royalties, com-pensation, education and infrastructure. The contributions from taxes and wages were higher than the average in 2019 and the overall contribution in 2019 was the same as the average contribution for the whole period.

ECONOMIC IMPACT OF THE PORGERA GOLD MINE
21
The contribution from taxes declined substantially below average for the 2013-2018 period before picking up in 2019 (Chart 2). However, in contrast the contribution from national and lo-cal operations contracts was above average in the 2013-18 period before declining somewhat in 2019.
Chart 5 shows the financial contributions in constant 2019 prices. Total contributions in real terms declined from the early 1990s to 2003 reflecting declines in taxes and national and local operations contracts. However total contributions then increased to 2011 mainly reflecting an increase in taxes, before, as noted, this component declined substantially in 2013 and remained below average through to 2018 before picking up markedly in 2019. The real local wage bill increased over the whole period but this largely reflected an increase in employment (see Chart 6).

ECONOMIC IMPACT OF THE PORGERA GOLD MINE
22
Chart 6 shows the employment of various groups for the whole period. The main observation is the steady growth of total employment and the strong contribution from Porgerans to 2010 which has been replaced by PNG nationals. However, it is understood that this reflects a recategorization of local employees. Expatriate employment is relatively low and has trended down over the period.

ECONOMIC IMPACT OF THE PORGERA GOLD MINE
23
Chart 7 shows taxes, education and infrastructure expenditure funded by the Porgera mine for the 2008 to 2019 period. Education and infrastructure expenditure is included as it can be considered as social expenditure that was not financed directly from the budget. Reflecting Charts 2 and 5, there was a marked decline in the contribution after 2011 through to 2018 but followed by a marked increase for 2019.

ECONOMIC IMPACT OF THE PORGERA GOLD MINE
24
Chart 8 shows the total direct benefit from the Porgera mine as a per cent of non-mining GDP for the period 2006 to 2019. As noted, the latter is more relevant than total GDP as it better represents gross national income given the large shares of mining value added that accrue to foreign investors. It was not possible to extend the series further back as consistently measured GDP was not available for earlier years.
The contribution to non-mining GDP has declined somewhat in recent years from around 2 per cent to 1.5 per cent for the period 2013-2018 but picked up again to 1.8 per cent in 2019.
3.3 Local economic development 3.3.1 Situation at Porgera prior to mining
The Ipili are the customary owners of the land where the Porgera mine is located. Historically the Ipili lived in scattered hamlets in a sparsely and underdeveloped area with meagre government services and infrastructure.
As noted by Johnson (2012, p. 7):
“Before mining began, the Porgera economy was primarily subsistence based, with agriculture and alluvial gold mining the major sources of income. The Ipili people were traditionally mobile and did not live in settlements. The population was low in 1989, with an estimated 2000 living within what is now the Special Mining Lease (SML) area and fewer than 10000 in the valley as a whole.”
ECONOMIC IMPACT OF THE PORGERA GOLD MINE
25
Although the bulk of the population in the local Porgeran economy was primarily dependent on subsistence activities at the time of the development of the mine, alluvial mining had been utilised by some Porgerans for over forty years and it was virtually the only cash-earning opportunity available (Banks 2012, pp. 96-97). Business activity was limited to small scale activities including gold buying and sawmilling and trade stores were a common. There was also uneven access to cash earning activities related to alluvial mining. The mine created a lot more scope for landowners and people in nearby districts to earn cash and benefit from public infrastructure and basic social services.
3.3.2 Relocation issues
The population of the Porgera Valley has since increased from approximately 4,000 people in 1988 to approximately 73,000, as people migrated from other districts for work opportunities (Whayman 2015, p. 2). But some people living in the area covered by the special mining lease had to be relocated and the total land area of the mine tenements has almost doubled since mining operations began.
In the early years of operation relocation appeared to be manageable. However, according to Kemp and Owen (2015, p. 13) the kinship system has facilitated significant in-migration to the Porgera Valley and the special mining lease area in particular complicated the process of relocation from the lease area to allow mining to occur.
Kemp and Owen (2015, p. vii) have also noted that the continuing presence of tribal conflict in the Porgera Valley makes it difficult to relocate people and the cumulative impact of population growth has intensified pressures on the special mining lease and other tenements. These pressures reflect the impact of customary ownership and kinship arrangements as well as weaknesses in the legislation and government capacity constraints that have limited the scope for developers of mines in PNG to effectively manage the risks of resettlement (Kemp and Owen 2015, pp.11-12).
In relation to these matters, Whayman, the CEO of the Restoring Justice Initiative (2015, p.2) makes the following succinct observation:
“The Porgera District is located in one of PNG’s most socially complex, remote and undeveloped regions. It is faced with issues such as poverty, crime, tribal conflict, gender-based violence, sorcery and illegal mining. All of these problems have been exacerbated within a context of limited law enforcement capability and access to government services.”
The point is that even though the PJV has generated significant financial benefits there are a range of social and institutional factors that mean there are significant underlying tensions, social issues and dis-satisfaction about outcomes. This is true in relation to both relocation issues and the effectiveness of government expenditure generated by the revenues from the mine as discussed further below.

ECONOMIC IMPACT OF THE PORGERA GOLD MINE
26
3.3.3 Institutional arrangements and agreements to provide development benefits
Although remote and relatively poor the Porgerans were exposed to cash income from gold for many decades and were among the first group of resource owners to negotiate land owner agreements and benefits of such an advanced level and extent and to hold equity in a mine (Loluave, p. 22).
Various agreements and institutions were established to provide compensation and contribute to local business opportunities and local economic development. The approach at Porgera, for the first time in PNG, was to distribute the financial benefits after appropriate community based negotiations (Johnson 2012, p.9). Financial benefits included royalties and taxes, equity payments, various compensation payments for occupation, relocation and the environment, community assets, education expenses, wages for PNG nationals, business and training opportunities and infrastructure.
Substantial financial flows go to the national and provincial government and development bodies in the form of taxes and royalties and Johnson (2012, p. x-xii) has demonstrated that there has been a critical lack of transparency at both the national and sub-national government levels about where the substantial financial payments ultimately go and their effectiveness. This has contributed to a frustration at the community level about the economic impact of the mine.
3.3.4 Brief review of financial benefits for the Enga province and Porgera District
The main direct financial benefits for the Enga province accumulated from 1990 to 2019 are summarised in Table 3 which shows figures in nominal kina terms as well as in kina terms in 2019 prices. Chart 9 also shows the cumulative financial benefits for the Enga province in kina millions in 2019 prices. The people of the Enga province have benefited from: royalties; compensation for occupation, relocation and environmental impacts; donations; external education and internal training; community projects and infrastructure; business development contracts; and wages. Infrastructure includes townships, power and water facilities, school, health and police buildings and other community infrastructure.

ECONOMIC IMPACT OF THE PORGERA GOLD MINE
27
Table 3: Financial benefits for the Enga Province – cumulative total from 1990 to 2019
Kina Millions KIna millions in 2019 prices
Enga Provincial Government royalties 335 630 Other Enga Province royalties 322 605Compensation and donations 326 842Education 195 411Infrastructure 492 981Enga business development (including Porgerans)1
2,493 4,949
Enga Wages (including Porgerans)2 1,019 1,834Total 5,182 10,254
1 The business development figures are gross sales figures rather than a measure of na-tional income as is the case for the other components. 2 The Enga wages are estimates that assume the average employment share of total PNG employment at the mine for the period 2011 to 2019 applied for the whole period. This recognised a substantial mis-classification of employment prior to 2011.

ECONOMIC IMPACT OF THE PORGERA GOLD MINE
28
The cumulative nominal kina value for the whole period is about 5.2 billion kina which is equivalent to 10.3 billion kina in 2019 prices. Note that for most categories the real 2019 values are around double the nominal values. A notable exception is compensation and donations and this reflects that relatively more funds were received for compensation early in the period.
The most important component is local business development comprising about half of the total followed by local wages. However, note the business development figures represent gross sales value rather than value added at the enterprise level and so would overstate the direct benefit from this source. However, there would be additional local multiplier effects as businesses servicing the mine would require other business inputs and local consumption expenditure would also create some additional effects. As noted in the discussion on the methodology, local additional multiplier effects in total would likely be no more than the direct effects. In addition there were construction contracts that would have provided some benefits to local companies and employees and these are not included. These considerations imply that the totals in Table 3 would be an under estimate of the total benefits.
3.3.5 Qualitative highlights
Infrastructure
Over half the infrastructure expenditure was financed by the national infrastructure tax credit scheme and financed various township facilities for Paiam. Other important categories paid directly by the PJV included the Wabag-Porgera highway and local roads. Banks (2012, p. 109) reports that the infrastructure tax credit scheme largely focussed on projects outside Porgera which was intentional to widen the economic development impact. The infrastructure tax credit scheme enabled the PJV to get tax deductions from the national government for infrastructure projects which it funded, as approved by the Enga provincial government and Department of National Planning with IRC endorsement.
Education
The PJV has helped build or improve dozens of schools across the province and invested in training since 1990. However there are on-going problems with PNG’s education system that impact on schools at local levels and outcomes at Porgera are assessed by Loluave as disappointing. Loluave (2015, p. 141-143), based on extensive interviews, concludes that there has been a lack of systematic ongoing support for and participation by key stakeholders in the education sector and in particular the local community.
Law and order
A detiorating law and order situation was reported in the early years of operation of the mine but tribal fighting was a long standing and pervasive feature of the Ipili clan and it was difficult to obtain data to confirm trends in that period (Bonnell, pp. 60). However, as is the case in many parts of PNG, law and order problems have continued in the Porgera district despite the efforts of the PJV, for example, through the creation of the Restoring Justice
ECONOMIC IMPACT OF THE PORGERA GOLD MINE
29
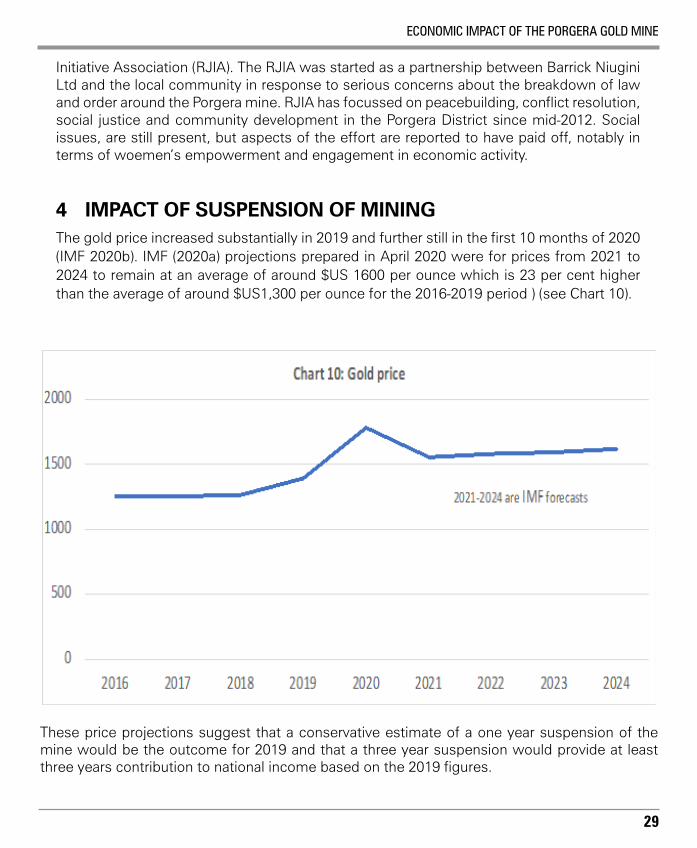
These price projections suggest that a conservative estimate of a one year suspension of the mine would be the outcome for 2019 and that a three year suspension would provide at least three years contribution to national income based on the 2019 figures.
Initiative Association (RJIA). The RJIA was started as a partnership between Barrick Niugini Ltd and the local community in response to serious concerns about the breakdown of law and order around the Porgera mine. RJIA has focussed on peacebuilding, conflict resolution, social justice and community development in the Porgera District since mid-2012. Social issues, are still present, but aspects of the effort are reported to have paid off, notably in terms of woemen’s empowerment and engagement in economic activity.
4 IMPACT OF SUSPENSION OF MININGThe gold price increased substantially in 2019 and further still in the first 10 months of 2020 (IMF 2020b). IMF (2020a) projections prepared in April 2020 were for prices from 2021 to 2024 to remain at an average of around $US 1600 per ounce which is 23 per cent higher than the average of around $US1,300 per ounce for the 2016-2019 period ) (see Chart 10).

ECONOMIC IMPACT OF THE PORGERA GOLD MINE
30
Based on these assumptions, the total financial contribution in 2019 prices would be at least 1.1 billion kina for one year and at least $3.3 billion kina for three years (see Table 4).
The breakdown of these figures into impacts for the Porgera District and the Enga Prov-ince as a whole is presented in table 4 and Charts 11 and 12. The impacts on the Porgera District and rest of the Enga Province constitute about 40 per cent of the total impact. The biggest single category impact is for national and local operations contracts comprising 39 per cent of the total loss followed by the loss of tax revenue at the national level which constitutes about 34 per of the total foregone economic benefit.
Table 4: Lost financial contributions from suspension of the mine – kina millions
Category One year suspension Three year suspensionRoyalties ENga Provincial Government 28 85Royalties Porgera District 3 8Royalties landowners 15 46Royalties other local 10 31Compensation and donations 11 32Education 11 34Infrastructure 38 113Porgeran business development 112 336Engan business development (excluding Porgerans)
76 227
National business development 230 690Porgeran wages 64 191Engan wages (excluding Porgerans) 42 126National Wages 72 217Taxes 368 1,104Total Porgera District 226 678Total Rest of Enga Province 184 551Total PNG national economy 1,080 3,241
ECONOMIC IMPACT OF THE PORGERA GOLD MINE
31
ECONOMIC IMPACT OF THE PORGERA GOLD MINE
32
5 REFERENCES
Bank of Papua New Guinea, Quarterly Economic Bulletin, various issues.Banks, G., (2012), The social and economic impact of the Porgera gold mine in Filer (2012).Bonnell, S., (2012). Social change in the Porgera Valley, in Filer (2012). Burton, J. and G. Banks (2020), The Porgera mine in PNG: some background, Devpolicy Blog, 7 May.Filer, C., (2012), Dilemmas of Development: the Social and Economic Impact of the Porgera Gold Mine, 1989-1994, ANU Press. IMF (2020a), Papua New Guinea Staff Report for the 2019 Article IV Consultation.IMF (2020b), Primary Commodity Prices, Table 3, 9 November 2020.Jackson, R. T. and G. Banks (2002), In Search of the Serpent’s Skin – the story of the Porgera Gold Project, published by Placer Niugini Ltd.Johnson, P., (2012), Lode Shedding: A Case Study of the Economic Benefits to the Landowners, the Provincial Government and the State from the Porgera Gold Mine: Background and Financial Flows from the Mine, the National Research Institute, Discussion Paper No. 124. Kemp, D., and J. Owen (2015), A third party review of the Barrick/Porgera Joint Venture off-lease resettlement pilot: Operating context and opinion on sustainability, Centre for Social Responsibility in Mining, University of Queensland, Australia. Loluave, B. J., (2011), Is Sustainable Development A Faceless Rhetoric? An Assessment of Educational Sustainability at the Porgera Mine, Papua New Guinea, Master of Philosophy Thesis, Massey University, New Zealand. Papua New Guinea National Statistics Office (2019), National Accounts 2010 to 2017.Porgera Joint Venture (2019), Porgera Information Booklet. Roe, A. R. and J. Round (2017), Framework: The channels for indirect impacts, United Nations University, WIDER Working Paper 2017/79.Whayman, J., (2015), A public-private partnership tackling law and order in PNG, Devpolicy Blog, 5 June.

ECONOMIC IMPACT OF THE PORGERA GOLD MINE
33
Table A 1 Export values and financial contributions from Porgera gold mine: 1990-2019 in kina
Note: Cumulative figures were provided for business development for the period 1990-2018, infra-structure for the whole period and compensation and donations to 1994. Annual estimates were formed for these categories by constraining the cumulative annual estimates to equal the total pro-vided but indexed by the CPI growth over the period. This was done to facilitate annual comparisons over the period 1991 to 2019. 1990 figures were not used in the annual comparisons as they were not complete and did not relate to a full year.
Gold & Silver Royalties Compenssation andEducation
Infrastruc-ture
Local business development
National Business
Wages excl. Expatriates
Taxes Total
1990 91,857,555 1,150,176 - - - - - 8,470,100 - 9,620,2761991 426,893,680 5,598,760 10,341,235 1,728,937 5,541,215 27,550,977 33,799,768 8,129,643 74,817 167,508,4971992 492,868,936 6,438,378 10,759,197 1,978,190 5,934,536 29,539,896 36,239,790 8,650,338 78,291,764 177,832,0891993 411,069,737 5,117,283 11,194,052 3,594,127 6,355,775 31,672,396 38,855,958 11,448,490 81,926,856 190,164,9371994 405,765,609 3,030,785 11,646,482 3,358,068 6,806,914 33,958,842 41,660,989 17,075,731 39,279,857 158,817,6681995 417,962,487 5,391,524 5,873,842 5,391,776 7,290,075 36,410,348 44,668,517 22,116,450 84,410,305 209,552,8371996 442,263,452 7,429,566 4,947,619 3,539,255 7,807,532 39,038,829 47,893,159 25,680,938 63,85,607 200,182,5051997 336,637,249 6,639,116 4,261,953 4,726,676 8,361,718 41,857,061 51,350,590 22,913,204 53,451,189 193,561,5071998 449,310,098 9,701,000 4,381,725 5,218,744 8,955,240 44,878,743 55,057,615 22,206,981 58,008,920 208,08,9691999 516,951181 11,547,250 6,020,639 4,260,877 9,590,892 48,118,562 59,032,252 31,443,347 73,448,919 243,462,7382000 702,753,670 14,698,079 5,460,964 3,364,476 10,271,662 51,592,265 63,293,819 33,737,562 82,584,949 265,003,7772001 701,033,252 14,552,212 18,214,762 3,436,036 11,000,755 55,316,736 67,863,032 36,650,372 70,017,256 277,051,1612002 780,464,416 15,715,840 9,043,733 4,173,149 11,781,599 59,310,079 72,762,098 42,132,884 79,716,640 294,636,0222003 1,086,612,526 21,945,267 7,045,834 4,760,623 12,617,868 63,591,703 78,014,830 41,574,60 128,110,770 357,661,4992004 1,296,237,836 25,946,925 19,439,388 3,982,400 13,513,496 68,182,420 83,646,759 48,290,530 170,370,225 433,372,1442005 1,178,606,063 23,483,964 26,186,775 7,889,855 1,472,697 73,104,543 89,685,261 58,577,137 160,616,907 454,017,1382006 915,432,548 18,308,651 15,157,966 7,139,429 15,499,982 738,381,996 96,159,684 64,077,90 101,056,838 395,782,4872007 1,050,619,029 20,953,462 17,406,994 5,428,383 16,600,186 84,040,432 103,101,500 67,359,272 148,528,500 463,418,7282008 1,465,666,202 29,945,588 19,523,497 7,011,343 17,778,483 90,107,352 110,544,449 69,972,152 200,961,704 545,844,5682009 1,510,789,753 30,349,259 18,160,465 7,729,169 19,040,416 96,612,247 118,524,707 76,820,774 203,845,916 571,0829542010 1,753,702,173 35,158,736 7,148,593 8,426,461 20,391,923 103,586,733 127,081,065 83,814,435 193,096,204 578,704,1502011 1,928,051,449 38,206,906 6,695,838 8,148,197 21,839,361 111,064,711 136,255,110 92,997,232 424,208,611 839,415,9672012 1,563,999,287 27,455,324 10,888,889 7,987,627 23,389,540 119,082,528 146,091,435 105,628,685 269,631,317 710,155,3452013 1,570,774,420 30,914,466 8,821,331 9,006,891 25,049,751 127,679,155 156,637,848 102,121,727 94,957,477 555,188,6462014 1,692,943,453 34,703,745 21,594,308 6,990,937 26,827,806 136,896,377 167,945,613 110,095,989 113,689,925 618,744,7002015 1,719,249,805 34,303,574 12,360,795 12,129,750 28,732,069 146,778,995 180,069,690 120,774,546 113,422,641 648,572,0602016 1,995,417,056 39,458,550 12,148,741 14,322,201 30,771,499 157,375,043 193,069,011 127,191,361 163,833,476 738,169,8822017 1,852,467,217 42,561,197 5,718,264 16,303,866 32,955,689 168,736,026 207,006,759 141,357,583 168,084,800 782,724,1842018 1,869,904,43 37,245,911 5,100,186 11,710,040 35,294,915 180,917,164 221,950,680 152,812,512 179,077,398 824,108,8062019 2,642,614,211 56,661,063 10,746,795 11,415,636 37,800,182 187,498,744 230,025,017 178,067,697 368,153,848 1,080,368,981
ECONOMIC IMPACT OF THE PORGERA GOLD MINE
34