Embed Size (px)
Citation preview

Economic Impact of State Infrastructure Strategy – Rebuilding NSW
November 2014

Economic Impact of State Infrastructure Strategy – Rebuilding NSW
Liability limited by a scheme approved under Professional Standards Legislation. Deloitte refers to one or more of Deloitte Touche Tohmatsu Limited, a UK private company limited by guarantee, and its network of member firms, each of which is a legally separate and independent entity. Please see www.deloitte.com/au/about for a detailed description of the legal structure of Deloitte Touche Tohmatsu Limited and its member firms. © 2014 Deloitte Access Economics Pty Ltd
Contents Glossary ..................................................................................................................................... i
About this report ...................................................................................................................... ii
Executive Summary .................................................................................................................... i
1 Introduction .................................................................................................................... 1
1.1 The partial lease of electricity network assets.................................................................... 2
1.2 The proposed reinvestment .............................................................................................. 3
1.3 Layout of this report ......................................................................................................... 4
2 Economic impact of Rebuilding NSW ............................................................................... 5
2.1 Introduction to the modelling results ................................................................................ 5
2.2 Impact on Gross State Product .......................................................................................... 6
2.3 Impact on population and employment ........................................................................... 11
3 Modelling of the partial lease of electricity assets ......................................................... 13
3.1 The partial lease of electricity network assets.................................................................. 13
3.2 Benchmarking approach used in this report .................................................................... 14
3.3 Economic impact of partial lease – modelling results ....................................................... 16
4 Modelling the infrastructure investments ..................................................................... 18
4.1 Relationship between infrastructure and economic growth ............................................. 18
4.2 Approach to modelling in this report ............................................................................... 20
4.3 Effect of investing in roads and rail .................................................................................. 20
4.4 Effect of investing in water infrastructure on agricultural and mining production ............ 26
4.5 Economic impact of Rebuilding NSW – modelling results ................................................. 27
4.6 Economic impact of ongoing investments from 2012 SIS – modelling results ................... 29
5 NSW in 2035-36 ............................................................................................................ 31
5.1 NSW economy ................................................................................................................ 32
5.2 Regions ........................................................................................................................... 33
5.3 Industries ........................................................................................................................ 35
References .............................................................................................................................. 36
Appendix A : Modelling the partial lease of electricity assets ................................................... 41
Appendix B : NSW in 2035-36 .................................................................................................. 53
Appendix C : NSW regions and industries in 2035-36 ............................................................... 61
Appendix D : Driving forces of infrastructure demand ............................................................. 69
Appendix E : CGE modelling .................................................................................................... 80
Limitation of our work ............................................................................................................... 85

Deloitte Access Economics Commercial-in-confidence
Charts Chart 2.1 : Rebuilding NSW effect on GSP over time ($2013 million) ......................................... 7
Chart 2.2 : Rebuilding NSW effect on Consumption over time ($2013 million) ........................... 9
Chart 2.3 : Rebuilding NSW effect on Household Income over time ($2013 million) ................ 10
Chart 2.4 : Effect on population (residents) ............................................................................. 12
Chart 2.5 : Effect on employment (FTE) ................................................................................... 12
Chart 3.1 : Effect on GSP over time ($2013 million) – Partial lease ........................................... 16
Chart 4.1 : Cost per lane km in recent regional road projects in NSW ...................................... 23
Chart 4.2 : Estimated increase in population ........................................................................... 24
Chart 4.3 : Rebuilding NSW Effect on GSP over time ($2013 million) ....................................... 27
Chart 4.4 : Effect on GSP over time ($2013 million) – ongoing investments from 2012 SIS ....... 30
Chart 5.1 : NSW average annual growth rates of major economic statistics 2013-14 to 2035-3632
Chart 5.2 : Average annual GRP growth, 2013-14 to 2035-36 .................................................. 33
Chart 5.3 : Average annual GRP per capita growth, 2013-14 to 2035-36 .................................. 34
Chart 5.4 : Industry structure – NSW ....................................................................................... 35
Chart A.1 : Indicative distribution business Opex ..................................................................... 45
Chart A.2 : Indicative distribution business Capex ................................................................... 45
Chart B.1 : NSW average annual growth rates 2013-14 to 2035-36 .......................................... 53
Chart B.2 : NSW GSP projections ............................................................................................. 54
Chart B.3 : Population Shares in NSW to 2035-36 .................................................................... 56
Chart B.4 : Average annual population growth rate, 2013-14 to 2035-36 ................................ 56
Chart B.5 : Labour force participation rate - NSW .................................................................... 57
Chart B.6 : Average annual employment growth, 2013-14 to 2035-36 ..................................... 58
Chart B.7 : Average annual GRP growth, 2013-14 to 2035-36 .................................................. 59
Chart B.8 : Average annual GRP per capita growth, 2013-14 to 2035-36 .................................. 60
Chart C.1 : Industry structure – NSW ....................................................................................... 62
Chart C.2 : Industry Structure – Metro NSW ........................................................................... 63
Chart C.3 : Industry structure – Non Metro NSW .................................................................... 64
Chart C.4 : Industry structure – North Coast ............................................................................ 65
Chart C.5 : Industry structure – Hunter ................................................................................... 66
Chart C.6 : Industry structure –Illawarra .................................................................................. 67
Chart C.7 : Industry structure – Murray .................................................................................. 68
Chart D.1 : Additional NSW population (millions) .................................................................... 70

Deloitte Access Economics Commercial-in-confidence
Chart D.2 : Congestion costs and population ........................................................................... 72
Chart D.3 : Historical and projected terms of trade for Australia ............................................. 75
Tables Table 2.1 : CGE modelling results- difference in GSP ($2013 million) ......................................... 6
Table 2.2 : CGE modelling results- increase in Consumption ($2013 million) .............................. 9
Table 2.3 : CGE modelling results- increase in Household Income ($2013 million) ................... 10
Table 2.4 : CGE modelling results- increase in Population (residents) ...................................... 11
Table 2.5 : CGE modelling results- increase in Employment (FTE) ............................................ 11
Table 3.1 : CGE modelling results- difference in GSP ($2013 million) ....................................... 16
Table 4.1 : Sydney urban major highway network ................................................................... 21
Table 4.2 : CGE modelling results- difference in GSP ($2013 million) ....................................... 27
Table 4.3 : CGE modelling results- increase in Employment (FTE) ............................................ 28
Table 4.4 : CGE modelling results- difference in GSP ($2013 million) ....................................... 29
Table 4.5 : CGE modelling results- increase in Employment (FTE) ............................................ 30
Table 5.1 : NSW economic snapshot........................................................................................ 32
Table A.1 : Network price changes and operating cost changes ............................................... 41
Table A.2 : estimating capex and opex savings for TransGrid ................................................... 47
Table A.3 : Cost stack projections, by element (%) ................................................................... 51
Table B.1 : NSW economic snapshot ....................................................................................... 53
Table B.2 : Real GSP – NSW (2013 prices) ................................................................................ 54
Table B.3 : Population projections ........................................................................................... 55
Table B.4 : State labour productivity index .............................................................................. 57
Table B.5 : Employment level (millions)– NSW ........................................................................ 58
Table B.6 : GRP per capita– NSW ($2013) ................................................................................ 60
Table C.1 : Industry shares and growth rates, 2013-14 to 2035-36 .......................................... 61
Deloitte Access Economics Commercial-in-confidence
Figures Figure 1.1 : Electricity network schematic ................................................................................. 2
Figure 3.1 : Map of NSW Distribution businesses..................................................................... 14
Figure 4.1 : The relationship of infrastructure investments to broader economic indicators .... 19
Figure 4.2 : Highways and arterial roads in NSW...................................................................... 22
Figure A.1 : Stylised example of opex savings .......................................................................... 49
Figure A.2 : Components of a typical electricity bill ................................................................. 51
Figure D.1 : Global economic centre of gravity ........................................................................ 73
Figure D.2 : Projected Average change in rainfall by 2050 ....................................................... 77
Figure E.1 : Key components of DAE-RGEM ............................................................................. 81

Economic Impact of State Infrastructure Strategy – Rebuilding NSW
Liability limited by a scheme approved under Professional Standards Legislation. Deloitte refers to one or more of Deloitte Touche Tohmatsu Limited, a UK private company limited by guarantee, and its network of member firms, each of which is a legally separate and independent entity. Please see www.deloitte.com/au/about for a detailed description of the legal structure of Deloitte Touche Tohmatsu Limited and its member firms. © 2014 Deloitte Access Economics Pty Ltd
Glossary ABS Australian Bureau of Statistics
AER Australian Energy Regulator
BAU Business As Usual
BITRE Bureau of Infrastructure, Transport and Regional Economics
BTS Bureau of Transport Statistics
CBD Central Business District
CESS Capital Expenditure Sharing Scheme
CGE Computable General Equilibrium
DAE Deloitte Access Economics
DNSP Distribution Network Service Provider
EBSS Efficiency Benefit Sharing Scheme
EY Ernst and Young
FTE Full Time Equivalent
FY Financial Year
GRP Gross Regional Product
GSP Gross State Product
GST Goods and Services Tax
INSW Infrastructure NSW
IRP Independent Review Panel
LRET Large-scale Renewable Energy Target
MAR Maximum Allowable Revenue
MWh Megawatt Hour
NEM National Electricity Market
NPP National Partnership payments
NSW New South Wales
PC Productivity Commission
PTRM Post Tax Revenue Model
QLD Queensland
RAB Regulatory Asset Base
RIN Regulatory Information Notice
RMS Roads and Maritime Services
SIS State Infrastructure Strategy
SRES Small-scale Renewable Energy Scheme
TNSP Transmission Network Service Provider

Deloitte Access Economics Commercial-in-confidence
About this report This report has been prepared for the Department of Premier and Cabinet, NSW Treasury and Infrastructure NSW.
In 2012, Infrastructure NSW released its first State Infrastructure Strategy (SIS). The SIS is the major way in which Infrastructure NSW provides independent advice to the NSW Government on the highest priority infrastructure projects for the State over the next 20 years. The independent advice provided by Infrastructure NSW is used to support the Government’s objective of providing the right infrastructure at the right time to keep the economy moving.
In mid-2014, the Premier requested Infrastructure NSW to update the 20-year State Infrastructure Strategy. The update was requested to take into account funds that would be made available through the Government’s Rebuilding NSW plan. Rebuilding NSW involves a long term, partial lease of 49% of the state’s electricity network assets. The funds raised from the partial lease will then be reinvested into new infrastructure such as Sydney Rapid Transit, road infrastructure, water infrastructure, schools and hospitals and sporting and cultural facilities as particular priorities for reinvestment.
The report models the economic consequences of:
Ongoing investments associated with the 2012 SIS that are not included in Rebuilding NSW;
the long term, partial lease of 49% of the state’s electricity distribution and transmission assets; and
a $20 billion investment in a broad package of productive infrastructure assets that comprise Rebuilding NSW.
The three modelling components mentioned above complement each other to boost the NSW economy. For example, productivity gains in electricity combine with improved infrastructure to create greater benefits overall than could be achieved with both individually.
i Commercial-in-Confidence
Deloitte Access Economics
Executive Summary
Rebuilding NSW will increase NSW’s Gross State Product (GSP) by $30.9 billion by 2035-36 (measured in 2013 prices); this is a real increase of 3.6% over the level of GSP that would occur without the Rebuilding NSW plan. The total increase in GSP over the period to 2035-36 is estimated to be almost $300 billion (measured in 2013 prices), roughly equivalent to 60% of current GSP.
The increase in GSP comes partially from a more efficient electricity network but largely from the reinvestment of funds from the partial lease of electricity network assets into productive infrastructure.
Reinvestment in infrastructure will allow NSW to better manage the increase in population and economic activity that will occur over the coming decades. Better infrastructure will also help attract more people and business to NSW by creating easier access to jobs and markets – boosting economic growth.
Deloitte Access Economics has been asked to model the potential economic benefits of both Rebuilding NSW and ongoing investments for the previous SIS. More specifically, we have modelled the economic consequences of:
Ongoing investments associated with the previous SIS that are not included in Rebuilding NSW;
the long term, partial lease of 49% of the state’s electricity distribution and transmission assets; and
a $20 billion investment in a broad package of productive infrastructure assets that comprise Rebuilding NSW.
Benefits for NSW
Investment in infrastructure from Rebuilding NSW will allow NSW to better manage the increase in population and economic activity that will occur over the coming decades. As a result, by 2035-36, GSP in NSW is expected to be around $30.9 billion larger (in 2013 prices) than it would be without Rebuilding NSW, this represents a 3.6% real increase. The total increase in GSP over the period to 2035-36 is estimated to be almost $300 billion, roughly equivalent to 60% of current GSP. Further, it is important to note that the expected increase in GSP and other measured benefits to the people of NSW are ongoing beyond 2035-36. Table i, below, also shows that, by 2035-36:
• There is expected to be additional employment of 122,500 full-time jobs attributable to Rebuilding NSW.
• NSW’s population is estimated to have increased by around 260,000 beyond what is expected without Rebuilding NSW. Household Income is expected to be 3.5% higher in real terms in 2035-36 than it would be without Rebuilding NSW – a $27.8 billion increase (2013 prices).
• Consumption is modelled to increase by around $21.4 billion (2013 prices), which is a 3.4% real increase due to Rebuilding NSW.

ii Commercial-in-Confidence
Deloitte Access Economics
Table i: Summary Results for 2035-36 – Rebuilding NSW
2020-21 2025-26 2030-31 2035-36
GSP
Increase ($m 2013) 5,200 13,900 22,500 30,900
Per cent increase 0.9% 2.0% 2.9% 3.6%
Consumption
Increase ($m 2013) 3,700 9,700 15,600 21,400
Per cent increase 0.8% 1.9% 2.8% 3.4%
Household Income
Increase ($m 2013) 4,800 12,700 20,400 27,800
Per cent increase 0.9% 2.0% 2.9% 3.5%
Population
Increase (residents) 13,700 100,100 193,000 260,200
Per cent increase 0.2% 1.1% 2.1% 2.7%
Employment
Increase (FTE) 6,700 48,100 91,500 122,500
Per cent increase 0.2% 1.4% 2.6% 3.3% Source: DAE Note: Table shows average results, high and low scenarios are shown in Section 2. Increase is from a baseline described in Section 5.
The positive impact of Rebuilding NSW on GSP is due to increases in capital expenditure, population and productivity, that is:
In the short run, the increase in economic activity is associated with the large capital expenditures of Rebuilding NSW and the SIS.
Over time, these benefits transition towards the population and productivity components.
• In the long run, population increases as better transport infrastructure reduces commuting time and improves freight productivity, enhancing quality of life which attracts and retains more people in Sydney and regional NSW.
• In terms of productivity, electricity and transport infrastructure are fundamental inputs into almost every sector in the economy. A reduction in the price of electricity and the cost of transporting goods and people thus leads to cost savings for a range of industries. These cost savings are then passed through to lower prices for consumers. Lower prices free up income which can then be spent on goods and services in other areas of the economy, which ultimately leads to increased economic output and higher levels of economic wellbeing.
Our estimates are conservative in terms of the overall benefit that NSW will obtain from Rebuilding NSW over the long-term. This is because broader welfare benefits are not captured in the reported increase in economic activity (i.e., GSP), and we have not attempted to put a dollar value on these broader benefits in our modelling.
Put another way, the impacts projected in this report reflect modelled financial economic outcomes. Yet many of the investments in Rebuilding NSW - schools, hospitals, sporting

iii Commercial-in-Confidence
Deloitte Access Economics
and other cultural assets – have less direct connections to financial economic outcomes than investments in sectors like transport.
However, it is nonetheless reasonable to expect that investments in schools, hospitals, sporting and other cultural facilities will lead to improvements in government service delivery and improved social outcomes. These benefits – like a more educated and healthy population or attracting tourism expenditure – are difficult to quantify reliably, but can also be expected to accrue to NSW over time.
Chart i: Rebuilding NSW effect on GSP ($m 2013)
Chart ii: Rebuilding NSW effect on employment (FTE)
Source: Deloitte Access Economics
500,000
550,000
600,000
650,000
700,000
750,000
800,000
850,000
900,000
950,000
2014 2019 2024 2029 2034
Rebuilding NSW Baseline
3,000,000
3,250,000
3,500,000
3,750,000
4,000,000
2014 2019 2024 2029 2034
Rebuilding NSW Baseline

iv Commercial-in-Confidence
Deloitte Access Economics
The approach to modelling also allows us to disaggregate the above results into those flowing from productivity gains in electricity and from reinvestment in new infrastructure:
The electricity partial lease by itself will increase NSW’s Gross State Product (GSP) by $4.3 billion by 2035-36 (2013 prices), this is a real increase of 0.5% over the level of GSP that would occur without the partial lease.
When considering the effect of the reinvestment in infrastructure associated with Rebuilding NSW by itself, investments associated with Rebuilding NSW will increase NSW’s GSP by $26.6 billion by 2035-36 over the level of GSP that would occur without Rebuilding NSW (2013 prices).
Additionally, the effect of ongoing investment in projects associated with the 2012 SIS but not included in Rebuilding NSW is expected to add an additional $13.3 billion by 2035-36 (2013 prices). This effect is discussed in more detail in Section 4.6.
Approach to modelling
As a starting point, Deloitte Access Economics developed a detailed baseline projection for the NSW economy by bringing together information from Treasury and Department of Planning and Environment. This projection is described in detail in Section 5, Appendix B and Appendix C.
Deloitte Access Economics has analysed the relationship between infrastructure investment and economic activity. The economic benefits of infrastructure investment start with capital expenditure, however, the main economic benefits of infrastructure investment are through the pathways of productivity, population and participation – the three Ps of economic growth. We have estimated the effect that the infrastructure investments associated with Rebuilding NSW and the 2012 SIS will have on productivity and population in particular.
We also modelled the expected productivity improvement of the long term partial lease on electricity prices, which have important implications for the competitiveness of NSW’s businesses as well as the quality of life for households.
To bring these two parts of the modelling together we use our Computable General Equilibrium Model (CGE model), which represents the demand and supply relationships in the economy. The CGE model allowed us to obtain outcomes for key economic variables, such as employment and GSP.
Deloitte Access Economics

Economic Impact of State Infrastructure Strategy – Rebuilding NSW
1 Commercial-in-Confidence
Deloitte Access Economics
1 Introduction In 2012 Infrastructure NSW released its first State Infrastructure Strategy (SIS). In the SIS, Infrastructure NSW provides independent advice to the NSW Government on the highest priority infrastructure projects for the State over the next 20 years. The advice provided by Infrastructure NSW is used to support the Government’s objective of providing the right infrastructure at the right time to keep the economy moving.
In mid-2014, the NSW Premier requested Infrastructure NSW to update the existing 2012 20-year State Infrastructure Strategy. The update was requested to take into account additional funds that would be made available through the Government’s Rebuilding NSW plan. Rebuilding NSW involves the long term partial lease of 49% of the state’s electricity network assets. The funds raised from the partial lease will then be reinvested into new infrastructure. It is estimated that the Rebuilding NSW package could release around $20 billion (including payments from the Australian Government). The Government has nominated Sydney Rapid Transit, road infrastructure, water infrastructure, schools and hospitals and sporting and cultural facilities as particular priorities.
As part of the 2014 SIS, Deloitte Access Economics was engaged by Infrastructure NSW and the NSW Government to provide economic modelling of the state economy under both a baseline scenario and in a scenario involving the 2012 SIS and Rebuilding NSW. The baseline modelling reflects changes to the NSW economy since 2012 (when the baseline for the previous SIS was developed) while the scenario is an estimate of the likely effects of ongoing investments from the 2012 SIS and Rebuilding NSW on the economy.
Under the Restart NSW Act (2011), funds arising from the sale of assets must go into the Restart NSW fund and may only be spent on Infrastructure. Each project funded through Restart NSW is subject to economic appraisal and must be recommended by Infrastructure NSW before funds are made available. Funds released from asset sales will, therefore, be strongly focussed around Infrastructure NSW’s priorities, which are identified in the updated 2014 SIS.

Economic Impact of State Infrastructure Strategy – Rebuilding NSW
2 Commercial-in-Confidence
Deloitte Access Economics
1.1 The partial lease of electricity network assets
At the centre of the Rebuilding NSW package is the partial lease of the NSW electricity networks. While the details of the partial lease are still being finalised, they will result in the long term partial lease of 49% of total network assets. The networks are made up of the ‘poles and wires’ that are used to transport electricity from the generator to the consumer. Poles and wires can be split into transmission and distribution networks. In broad terms, transmission networks transport high voltage electricity over the large distances between generators and population centres while distribution networks carry lower voltages within population centres.
Figure 1.1: Electricity network schematic
Generation Transmission Distribution Retail
49% long term partial lease
The assets proposed to be partially leased represent one of the NSW Government’s largest fixed assets and also deliver services that are critical to the economy and community. The nature of electricity networks means that the lessee will have a regulated natural monopoly over that section of the network.
As a result of the importance of these assets, the Government has set out a number of strict conditions to protect the public interest, including:
all net proceeds will be invested in new productive infrastructure;
electricity network prices will be discounted by 1% off regulated prices until 2019;
the jobs of employees will be protected, consistent with previous transactions;
the transaction will have no adverse impact on electricity reliability, with tight regulation by Government remaining;
the regional presence of the network businesses will be maintained; and
Essential Energy will remain in full public ownership.

Economic Impact of State Infrastructure Strategy – Rebuilding NSW
3 Commercial-in-Confidence
Deloitte Access Economics
1.2 The proposed reinvestment
The other half of Rebuilding NSW, is the reinvestment of the funds raised from the long term partial lease into new, productive infrastructure. For reasons explained earlier, this investment will align closely with the updated 2014 SIS. INSW will provide advice to the NSW Government on the productive infrastructure projects that should be supported.
It is expected that the partial lease could see around $20bn made available to be reinvested in productive infrastructure. This revenue includes the net proceeds from the long term partial lease, the interest earned on these proceeds while they are held by the Government and payments from the Commonwealth as part of its asset recycling initiative1.
The Government has proposed an allocation of funding across different types of productive infrastructure in both Metro and Regional NSW. This includes funding across a range of areas covering Sydney Roads Renewal, The Regional Roads Fund, The Regional Water Fund and the Sport and Cultural Infrastructure Fund.
Of the $20 billion in funding associated with Rebuilding NSW, around 70% of the funds are expected to be invested in Metro areas while around 30% are expected to be invested into regional areas, as committed by the Government, to ensure the benefits of Rebuilding NSW are spread across the community.
Expenditure associated with Rebuilding NSW is assumed to be spread out over roughly 10 years from commencement for each category, with expenditure for each component finishing between 2020 to 2025.
1 The Asset Recycling Initiative provides incentive payments to States for privatising government owned assets. Further information is available at: http://investment.infrastructure.gov.au/publications/reports/pdf/factsheets2014/Factsheet_The_Asset_Recycling_Initiative.pdf

Economic Impact of State Infrastructure Strategy – Rebuilding NSW
4 Commercial-in-Confidence
Deloitte Access Economics
1.3 Layout of this report
This report is set out in the following sections:
Section 2 covers the overall economic effects of the SIS and Rebuilding NSW as measured by its effect on GSP, employment, household income, consumption and other key economic indicators.
Section 3 looks in more detail at the partial lease of the electricity assets. This section briefly covers the approach to modelling the partial lease and the portion of the economic benefits associated with the partial lease. A more detailed explanation of the modelling approach and results is given in Appendix A.
Section 4 looks in more detail at the infrastructure investments associated with Rebuilding NSW and the 2012 SIS as well as presenting the respective economic benefits.
Section 5 presents an overview of the detailed economic baseline developed for the modelling in the previous sections. More detail on the baseline is provided in Appendix B and Appendix C.
Appendix D provides a description of some of the broad economic trends affecting the demand for infrastructure in NSW over the coming 20 years.
Appendix E provides some further detail on the CGE model used to generate the results in this report.

Economic Impact of State Infrastructure Strategy – Rebuilding NSW
5 Commercial-in-Confidence
Deloitte Access Economics
2 Economic impact of Rebuilding NSW
Rebuilding NSW will increase NSW’s Gross State Product (GSP) by $30.9 billion by 2035-36 (measured in 2013 prices); this is a 3.6% real increase over the level of GSP that would occur without the Rebuilding NSW plan. The total increase in GSP over the period to 2035-36 is estimated to be almost $300 billion, roughly equivalent to 60% of current GSP.
The increase in GSP comes partially from a more efficient electricity network but largely from the reinvestment of funds from the partial lease of electricity network assets into productive infrastructure.
Reinvestment in infrastructure will allow NSW to better manage the increase in population and economic activity that will occur over the coming decades. Better infrastructure will also help attract more people and business to NSW by creating easier access to jobs and markets – boosting economic growth.
2.1 Introduction to the modelling results
Taking into account the productivity improvements in the electricity networks identified in Section 3, and the infrastructure investments of both the SIS and Rebuilding NSW described in Section 4. A CGE model was used to estimate the state-wide impact of the Rebuilding NSW proposal.
A CGE model traces the connections between different industries and provides a clear way to follow the impacts of a policy decision through interlinked industries, markets and regions (this model is more fully described in Appendix E). The model allows us to identify how changes in economic conditions (such as an increase in population, an improvement in freight productivity and a decrease in electricity prices) translate to outcomes on key economic variables (such as employment and GSP). A CGE model presents the impact on relevant macroeconomic variables by comparing scenarios against a baseline or a business as usual case. Thus, the results below represent deviations in economic activity from a baseline that would occur in the absence of the SIS and Rebuilding NSW. The baseline is described in detail in Appendix B.
The low case and high case described below are broadly similar to each other. The main difference is that the high case involves: less construction of tunnels (so more roads are built for the funds available); a higher level of benefits from road pinch-point interventions; and a greater increase in regional output from increased water availability.
Although results are only reported at the state-wide level, in undertaking the modelling we have taken into consideration the implications of the Restart NSW Fund Act (2011) for differentiating Sydney, Newcastle and Wollongong from the rest of NSW.

Economic Impact of State Infrastructure Strategy – Rebuilding NSW
6 Commercial-in-Confidence
Deloitte Access Economics
2.2 Impact on Gross State Product
The modelling has been undertaken over the period to 2035-36. The results presented below reflect both the low and high cases described in Section 4 with the charts showing the average of the two scenarios.
The average of the high and low modelling scenarios results suggest that by 2035-36 the NSW economy – as measured by Gross State Product (GSP) – is expected to be around $30.9 billion larger than it would be without Rebuilding NSW (measured in 2013 prices), this represents a 3.6% real increase. The total increase in GSP over the period to 2035-36 is estimated to be almost $300 billion (measured in 2013 prices), roughly equivalent to 60% of current GSP. The main driver of this growth is better transport infrastructure attracting and retaining more workers in Sydney and regional NSW. Improvements in the efficiency of the electricity networks also add to the productive capacity of the economy. The combined impact of these two growth drivers is greater than the sum of each taken individually.
The impact on annual GSP from 2015-16 to 2035-36 is shown in Table 2.1, below.2
Table 2.1: CGE modelling results- difference in GSP ($2013 million)
2020-21 2025-26 2030-31 2035-36
Difference
Low case 5,100 13,200 21,200 29,000
High case 5,300 14,600 23,800 32,700
Average 5,200 13,900 22,500 30,900
Per cent
Low case 0.9 1.9 2.8 3.3
High case 0.9 2.1 3.1 3.8
Average 0.9 2.0 2.9 3.6
Source: Deloitte Access Economics.
Chart 2.1, below, plots the expected impact on GSP for the average result shown above. Panel b indicates that, while the partial lease of the electricity assets does generate significant economic benefits, the majority of the benefit from Rebuilding NSW is associated with the reinvestment in infrastructure assets.
2 GSP represents the economic output of a state or territory (i.e., of a subnational entity). It is the sum of all
value added by industries within the state and serves as a counterpart to the gross domestic product (GDP).

Economic Impact of State Infrastructure Strategy – Rebuilding NSW
7 Commercial-in-Confidence
Deloitte Access Economics
Chart 2.1: Rebuilding NSW effect on GSP over time ($2013 million)
a. Levels
b. Difference
Source: Deloitte Access Economics.
500,000
550,000
600,000
650,000
700,000
750,000
800,000
850,000
900,000
950,000
2014 2019 2024 2029 2034
Rebuilding NSW Baseline
-
5,000
10,000
15,000
20,000
25,000
30,000
35,000
2014 2019 2024 2029 2034
Difference
Partial Lease
Infrastructure Investment

Economic Impact of State Infrastructure Strategy – Rebuilding NSW
8 Commercial-in-Confidence
Deloitte Access Economics
The positive impact of the SIS and Rebuilding NSW on GSP is due to increases in capital expenditure, population and productivity, that is:
In the short run, the increase in economic activity is associated with the large capital expenditures of Rebuilding NSW and the SIS.
Over time, these benefits transition towards the population and productivity components.
• In the long run, population increases as better transport infrastructure reduces commuting time and improves freight productivity, enhancing quality of life which attracts and retains more people in Sydney and regional NSW.
• In terms of productivity, electricity and transport infrastructure are fundamental inputs into almost every sector in the economy. A reduction in the price of electricity and the cost of transporting goods and people thus leads to cost savings for a range of industries. These cost savings are then passed through to lower prices for consumers. Lower prices free up income which can then be spent on goods and services in other areas of the economy, which ultimately leads to increased economic output and higher levels of economic welfare.
Our estimates are conservative in terms of the overall benefit that NSW will obtain from Rebuilding NSW over the long-term. This is because broader welfare benefits such as a better educated and healthy population from investments in schools and hospitals are not captured in the reported increase in economic activity (i.e., GSP), and we have not attempted to put a dollar value on these broader benefits in our modelling.
Other measures of welfare, beside GSP, are consumption and household income. The results for these macroeconomic variables are very similar to those for GSP. For example, the modelling suggests that by 2035-36:
Consumption is expected to be around $21.4 billion larger than it would be without Rebuilding NSW (measured in 2013 prices), this represents a 3.4% real increase.
Household income is expected to be around $27.8 billion larger than it would be without Rebuilding NSW (measured in 2013 prices), this represents a 3.5% real increase.
These other measures of welfare benefits are shown in more detail in the tables and figures below. Each of these measures grows fairly steadily overtime, largely in line with GSP growth.

Economic Impact of State Infrastructure Strategy – Rebuilding NSW
9 Commercial-in-Confidence
Deloitte Access Economics
Table 2.2: CGE modelling results- increase in Consumption ($2013 million)
2020-21 2025-26 2030-31 2035-36
Difference
Low case 3,600 9,200 14,700 20,100
High case 3,700 10,100 16,500 22,600
Average 3,700 9,700 15,600 21,400
Per cent
Low case 0.8 1.9 2.6 3.2
High case 0.8 2.0 2.9 3.6
Average 0.8 1.9 2.8 3.4
Chart 2.2: Rebuilding NSW effect on Consumption over time ($2013 million)
a. Levels
b. Difference
Source: Deloitte Access Economics
300,000
350,000
400,000
450,000
500,000
550,000
600,000
650,000
700,000
2014 2019 2024 2029 2034
Rebuilding NSW Baseline
-
5,000
10,000
15,000
20,000
25,000
2014 2019 2024 2029 2034

Economic Impact of State Infrastructure Strategy – Rebuilding NSW
10 Commercial-in-Confidence
Deloitte Access Economics
Table 2.3: CGE modelling results- increase in Household Income ($2013 million)
2020-21 2025-26 2030-31 2035-36
Difference
Low case 4,800 12,100 19,200 26,200
High case 4,900 13,400 21,500 29,400
Average 4,800 12,700 20,400 27,800
Per cent
Low case 0.9 1.9 2.7 3.3
High case 0.9 2.1 3.0 3.7
Average 0.9 2.0 2.9 3.5
Chart 2.3: Rebuilding NSW effect on Household Income over time ($2013 million)
a. Levels
b. Difference
Source: Deloitte Access Economics.
400,000
500,000
600,000
700,000
800,000
900,000
2014 2019 2024 2029 2034
Rebuilding NSW Baseline
-
5,000
10,000
15,000
20,000
25,000
30,000
2014 2019 2024 2029 2034

Economic Impact of State Infrastructure Strategy – Rebuilding NSW
11 Commercial-in-Confidence
Deloitte Access Economics
In addition to the economic benefits identified above, Rebuilding NSW and the SIS will also contribute to quality of life in ways that aren’t measured in national accounts. Particularly in travel time savings, improved educational experience, better health outcomes and increased environmental water flows.
2.3 Impact on population and employment
As discussed above, one of the main drivers of the increase in GSP is the increase in population. In the long run, population increases as better transport infrastructure reduces commuting time and improves freight productivity, enhancing quality of life which attracts and retains more people in Sydney and regional NSW. More populous and dense cities are associated with deeper markets and have been found to be, generally, more productive, connected and skilled than smaller cities (Department of Infrastructure 2014).
By 2035-36 NSW’s population is estimated to increase by around 260,200 beyond what is expected in the baseline. This is also associated with an increase in employment of around 122,500 full time equivalent jobs.
Table 2.4: CGE modelling results- increase in Population (residents)
2020-21 2025-26 2030-31 2035-36
Difference
Low case 12,500 92,400 178,300 240,200
High case 14,900 107,900 207,800 280,100
Average 13,700 100,100 193,000 260,200
Per cent
Low case 0.2 1.1 1.9 2.5
High case 0.2 1.2 2.3 2.9
Average 0.2 1.1 2.1 2.7
Source: Deloitte Access Economics.
Table 2.5: CGE modelling results- increase in Employment (FTE)
2020-21 2025-26 2030-31 2035-36
Difference
Low case 6,100 44,100 84,000 112,500
High case 7,300 52,200 99,100 132,500
Average 6,700 48,100 91,500 122,500
Per cent
Low case 0.2 1.3 2.4 3.0
High case 0.2 1.5 2.8 3.6
Average 0.2 1.4 2.6 3.3 Source: Deloitte Access Economics.

Economic Impact of State Infrastructure Strategy – Rebuilding NSW
12 Commercial-in-Confidence
Deloitte Access Economics
The average modelled impact on population and employment with Rebuilding NSW over the period from 2015-16 to 2035-36 is shown in the chart below. The modelled effect on employment grows at roughly the same rate as the increase in population but is generally only around 50% of the increase in population. This is due to the demographic mix of the residents arriving in the state.
Chart 2.4: Effect on population (residents)
a. Levels b. Difference
Chart 2.5: Effect on employment (FTE)
a. Levels b. Difference
Source: Deloitte Access Economics
7,500,000
8,000,000
8,500,000
9,000,000
9,500,000
10,000,000
10,500,000
2014 2019 2024 2029 2034
Rebuilding NSW Baseline -
50,000
100,000
150,000
200,000
250,000
300,000
2014 2019 2024 2029 2034
3,000,000
3,250,000
3,500,000
3,750,000
4,000,000
2014 2019 2024 2029 2034
Rebuilding NSW Baseline -
20,000
40,000
60,000
80,000
100,000
120,000
140,000
2014 2019 2024 2029 2034

Economic Impact of State Infrastructure Strategy – Rebuilding NSW
13 Commercial-in-Confidence
Deloitte Access Economics
3 Modelling of the partial lease of electricity assets
Benchmarking of NSW electricity transmission and distribution businesses against national averages from studies undertaken by the Productivity Commission, Grattan Institute and the Independent Review Panel on Network Costs indicate that there is significant scope for efficiency improvements in NSW.
Our analysis indicates this could result in capex and opex savings in the order of 25% for each business.
It will take time for the businesses to achieve these cost reductions and, once achieved, the regulatory process will take time to fully pass these cost savings through to consumers.
When considering the effect of the electricity partial lease by itself, productivity gains will increase NSW’s Gross State Product (GSP) by $4.3 billion by 2035-36 (measured in 2013 prices), this is an increase of 0.5% over the level of GSP that would occur without the partial lease.
3.1 The partial lease of electricity network assets
NSW’s electricity transmission and distribution networks are among the most significant and economically critical infrastructure in the state. There are three main distribution networks businesses (often referred to as Distribution Network Service Providers or DNSPs) and one transmission network business (often referred to as a Transmission Network Service Provider or TNSP). Some of the key characteristics of the NSW distribution networks are that they:
transport over 55,000 GWh of power in 2013 to around 3.4 million customers;
are composed of around 266,000 km of cables and 2.2 million poles; and
covering around 856,000 square kilometres of NSW.
To fund the Rebuilding NSW program, two of the three distribution network businesses, along with the transmission network business in NSW will be included in a partial, long term lease of the NSW electricity networks. In particular, the AusGrid and Endeavour Energy distribution businesses, which are shown in Figure 3.1, are to be included in the lease, along with the Transgrid transmission business.3 The Essential Energy distribution business will remain wholly government owned.
3 Ausgrid’s transmission network will also be partially leased.

Economic Impact of State Infrastructure Strategy – Rebuilding NSW
14 Commercial-in-Confidence
Deloitte Access Economics
For the purpose of this report we have assumed that the leasing process will commence in the second half of 2015, with the three businesses to be transacted by the end of 2016. We have assumed a staging of transactions as follows: Endeavour Energy and AusGrid in FY 2016, and Transgrid in FY 2017. Our modelling suggests that any short term changes to the timing of the partial lease will not qualitatively affect the results.
Figure 3.1: Map of NSW Distribution businesses
Source: AER (2012)
The NSW government has placed a number of conditions on the partial lease to ensure that the interests of NSW residents are upheld. These conditions were outlined in the Rebuilding NSW Discussion paper released in August 2014.
3.2 Benchmarking approach used in this report
A number of recent papers have considered the relative efficiencies of electricity network businesses around Australia. Recently, Ernst and Young (2014), AGL (2014), the Independent Review Panel on Network Costs (2014), Grattan Institute (2012) and the Productivity Commission (2013) have written extensively on the topic. A detailed review of these sources is provided in Appendix A, but the reports generally find that for privately managed businesses:
Electricity network prices have increased more slowly over time (Ernst and Young, 2014);
Labour and capital productivity tends to be higher (AGL, 2014);
Opex per customer tends to be lower (Independent Review Panel on Network Costs (2014) and AGL (2014));
Opex per kilometre is lower and customer per employee tends to be higher (PC 2013); and
The Regulated Asset Base (RAB) per customer tends to be lower (Grattan Institute, 2012).

Economic Impact of State Infrastructure Strategy – Rebuilding NSW
15 Commercial-in-Confidence
Deloitte Access Economics
These reports suggest that moving business from public management to private management will therefore improve efficiency.
Overall, the available evidence suggests that there may be significant efficiency gains from the long term partial lease and that there is little evidence to suggest that reliability has been compromised as a result of similar policies in the past. This is consistent with other reports such as HoustonKemp (2014). We also note that the Australian Energy Regulator will be releasing a new benchmarking report in the coming months.
Our overarching approach to estimating the efficiency benefits from the long term partial lease has been to take the results from the benchmarking reports discussed above. More detail regarding way these reports have been analysed is set out in Appendix A. In general, the reports provide an estimate of the level of efficiencies that can be achieved. Based on these figures as input, the overall effect on customer costs can then be estimated using a customised electricity price model developed by DAE for this project.
While the consensus of previous literature generally point to savings of this magnitude, individual studies have slightly different results. Hence these results should not be interpreted as a precise measure of the efficiency gains that will be made but, rather, an indication of the possible scale of gains for the purpose of the modelling undertaken in this report.
Based on this approach, we established percentage savings for capital expenditure (capex) and operating expenditure (opex) for each of the businesses being partially leased. These results ranged from around 15-30%. In order to simplify the approach to modelling and not provide a level of false specificity we have assumed that cost savings in the order of 25% for both capex and opex for TransGrid, AusGrid and Endeavour Energy.
As a final component, the modelling also takes into account detail on how opex and capex savings translate into electricity price savings for consumers. This involved consideration of three factors:
The timing of how these efficiency gains are achieved;
How the pass-through of opex and capex savings to network charges takes place within AER determinations; and
The share of network charges in the overall electricity price.
When taken together this modelling approach results in an estimate of the overall decrease in electricity costs for residential, industrial and commercial users throughout NSW. The reduction in electricity cost is then entered into a CGE model to estimate the overall effects that the long term partial lease is expected to have on the economy.

Economic Impact of State Infrastructure Strategy – Rebuilding NSW
16 Commercial-in-Confidence
Deloitte Access Economics
3.3 Economic impact of partial lease – modelling results
The CGE modelling results set out in section 2 have been undertaken in a way so that the effect of the reinvestment associated with Rebuilding NSW and the ongoing investment from the 2012 SIS can be separately identified from the effect of the electricity partial lease. This section presents the effect of the reinvestment associated with the electricity partial lease itself.
The modelling results suggest that by 2035-36 the NSW economy – as measured by Gross State Product (GSP) – is expected to be around $4.3 billion larger than it would be without the electricity network partial lease (measured in 2013 prices), this represents a 0.5% real increase.
The impact on annual GSP from 2015-16 to 2035-36 is shown in Table 2.1, below.
Table 3.1: CGE modelling results- difference in GSP ($2013 million)
2020-21 2025-26 2030-31 2035-36
Difference 1,300 2,500 3,300 4,300
Per cent 0.2% 0.4% 0.4% 0.5%
Source: Deloitte Access Economics.
The chart below, plots the expected impact on GSP for the average result shown above. The kink in panel B reflects details of the AER’s regulatory approach, explained in detail in Appendix A.
Chart 3.1: Effect on GSP over time ($2013 million) – Partial lease
a. Levels b. Difference
Source: Deloitte Access Economics.
500,000
550,000
600,000
650,000
700,000
750,000
800,000
850,000
900,000
2014 2019 2024 2029 2034
Rebuilding NSW Baseline -
500
1,000
1,500
2,000
2,500
3,000
3,500
4,000
4,500
5,000
2014 2019 2024 2029 2034

Economic Impact of State Infrastructure Strategy – Rebuilding NSW
17 Commercial-in-Confidence
Deloitte Access Economics
Other measures of welfare, beside GSP are consumption and household income. The results for these macroeconomic variables are very similar to those for GSP. For example, the modelling suggests that by 2035-36:
Consumption is expected to be around $3.0 billion larger than it would be without the electricity partial lease (measured in 2013 prices), this represents a 0.5% real increase.
Household income is expected to be around $4.0 billion larger than it would be without the electricity partial lease (measured in 2013 prices), this represents a 0.5% real increase.

Economic Impact of State Infrastructure Strategy – Rebuilding NSW
18 Commercial-in-Confidence
Deloitte Access Economics
4 Modelling the infrastructure investments
Rebuilding NSW is estimated to result in an increase in urban roads of around 100 lane km, rural roads of around 380km and urban railways of around 30km.
By increasing the quantity and quality of transport infrastructure, these investments are associated with increases in population of around 260,000 people in NSW by 2035-36 and a reduction in the cost of transporting goods and people of around 1.9% in Sydney. Smaller reductions in transport cost are seen in regional NSW.
Rebuilding NSW is also modelled to result in water savings of around 320GL. This amount of water could support an on-going increase in agriculture and mining output in the range of $1-2 billion a year.
When considering the effect of the infrastructure by itself, investments associated with Rebuilding NSW will increase NSW’s Gross State Product (GSP) by $26.6 billion by 2035-36 (measured in 2013 prices).
4.1 Relationship between infrastructure and economic growth
As part of a report commissioned by Infrastructure NSW for the 2012 SIS, Deloitte Access Economics explored the relationship between infrastructure investments and economic growth. Figure 4.1 shows the conceptual relationship between infrastructure investment and the ‘three Ps’ of productivity, population and participation, which in turn drive economic growth.
For example, additional investments in the freight rail network will improve freight efficiency by reducing the time taken to transport goods to market, which increases freight productivity. Similarly, reducing traffic congestion will create incentives for population growth as people and firms choose to relocate to NSW, which will lead to greater demand for goods and services in the state.

Economic Impact of State Infrastructure Strategy – Rebuilding NSW
19 Commercial-in-Confidence
Deloitte Access Economics
Figure 4.1: The relationship of infrastructure investments to broader economic indicators
Source: Deloitte Access Economics.
There has been a string of recent economic research that has attempted to quantify these conceptual links. Of course, tools like cost benefit analysis are well established and focus on relating investments to final economic outcomes through measures such as productivity. However, cost benefit analysis requires detailed information on a specific project, which is often not available when undertaking strategic level economic analysis of broad infrastructure investments. The recent economic research has therefore drawn on a number of contemporary economic tools (particularly in data gathering and analysis) to objectively measure the long run effects of infrastructure investment on the economy.
Tracing the effects of investments in schools and hospitals; and sporting and cultural assets on economic activity is more challenging. These investments will lead to improvements in government service delivery and improved social outcomes, such as a more educated and healthy population, which then leads to economic benefits through, for example, greater productivity or by attracting tourism expenditure. These effects are, however, difficult to value. We have therefore not attempted to include these benefits in our modelling. As a result, our estimates are conservative in terms of the overall benefit that NSW will obtain over the long-term.
The 3Ps contribute to measured economic growth. However, in addition, there are a number of benefits from infrastructure investment that go beyond those captured in standard national accounts. These include benefits such as reduced travel time for commuters and increased water availability for environmental uses. While these undoubtedly generate significant economic benefits they are not included in measures such as GSP and so are not directly valued in our analysis.
Government objectives:
GSP growth and regional economic
growth
Infrastructure investment
Productivity
Housing affordabilityTraffic congestion
Access to workplaces
Participation
Freight efficiencyEnergy and water
costs
Social infrastructure (eg education and health facilities)
Population

Economic Impact of State Infrastructure Strategy – Rebuilding NSW
20 Commercial-in-Confidence
Deloitte Access Economics
4.2 Approach to modelling in this report
The types of infrastructure projects that may be funded as a result of Rebuilding NSW and those included in the 2012 SIS will have a range of impacts on economic welfare. Some of these benefits will be captured in national accounting measures such as Gross State Product (GSP) and employment. Other benefits such as travel time savings for non-business travel or improvements to cultural amenity will lead to broader improvements in society’s welfare but not GSP.
The focus of the CGE modelling is on estimating the impact of the infrastructure projects on GSP, consumption and employment. Thus the infrastructure modelling seeks to estimate the incremental impact of the infrastructure projects on the following inputs to the CGE model:
population;
transport costs for freight;
agricultural and mining production; and
business travel time savings.
Ideally, the information used to estimate inputs into the CGE model should be based on detailed business cases or cost-benefit analysis studies for the relevant projects. Since, at the time of modelling, most of the funds have not been allocated to particular projects, high level estimates were developed based on the findings in academic literature and benchmark information from recently completed cost-benefit analysis of road and water projects in Australia and overseas.
Note on low case and high case:
The low case and high case described below are broadly similar to each other. The main difference is that the high case involves: less construction of tunnels (so more roads are built for the funds available); a higher level of benefits from road pinch-point interventions; and a greater increase in regional output from increased water availability.
4.3 Effect of investing in roads and rail
In the absence of detailed information on the economic impact of particular infrastructure projects, the effect on population from road and rail infrastructure has been estimated based on findings from the academic literature. Intuitively, investments in transport infrastructure should lead to increases in population as better transport infrastructure makes it easier to access high quality jobs and makes a city an easier, more enjoyable place to live and work. This intuitive relationship has been confirmed and measured in economic literature. This increase in population will result in growth in the economy via the 3 Ps pathways described above.
Recent economic research has found that the growth of transport infrastructure leads to greater population growth. For example, Duranton and Turner (2012) analysed the relationship between population growth and highway infrastructure in U.S. metropolitan

Economic Impact of State Infrastructure Strategy – Rebuilding NSW
21 Commercial-in-Confidence
Deloitte Access Economics
areas between 1980 and 2000. Using data on historical transport infrastructure investments, they found that a 10% increase in the extent of the road networks in a given city results in an increase of employment in that metropolitan area of 1.5% after 20 years or population of around 2%.4
Similar results have been found for rail infrastructure. For example, Duranton and Turner (2012) found that the relationship between rail infrastructure and population growth between 1920 and 2000, holding physical geography factors constant, was that a 10% increase in rail infrastructure would result in a 3% increase in population growth.
Applying the findings from this literature requires an initial estimate of the stock of road and rail infrastructure and the percentage increase expected from the investment. This percentage increase can then be used to estimate the increase in population.
4.3.1.1 Current stock of roads and rail
The current stock of major orbital style roads was estimated for metropolitan Sydney and the stock of highway quality roads was estimated for regional NSW. The current stock of major orbital style roads in metropolitan Sydney was estimated at around 400 lane kilometres based on road lengths shown in the following table and an average of around 2.5 lanes per kilometre.
Table 4.1: Sydney urban major highway network
Road Km
M5 32
M2 21
M4 40
M7 40
Sydney Harbour Bridge 1.15
Sydney Harbour Tunnel 2.8
Lane Cove Tunnel 3.6
Eastern Distributor 6
Cross City Tunnel 2.1
Warringah Freeway/Gore Hill freeway 7
Southern Cross Drive 3.5
Total 159 Source: DAE
The stock of regional roads is more difficult to identify and was estimated based on information from a number of sources. BITRE (2013) indicates that there are around 10,249km of rural highways in NSW. This was combined with information from the Automobile Association of Australia (2013) which gives average lanes per km of road in Australia to give a final estimate of 20,600 lane km of highway in rural NSW.
4 Duranton and Turner’s regressions are largely based on employment, but regressions in their analysis using
population yielded statistically similar results.

Economic Impact of State Infrastructure Strategy – Rebuilding NSW
22 Commercial-in-Confidence
Deloitte Access Economics
This was then allocated by region based on information from Geoscience Australia on the location of the road network in NSW. This information is shown in the map below.
Figure 4.2: Highways and arterial roads in NSW
Source: Geoscience Australia
The urban rail stock was estimated at 2,101km based on information from BTS (2012). This BTS data has been superseded by data on Sydney Trains but we consider that the BTS data provides a better picture of the NSW network as it is based on the entire former CityRail network and also allows for comparison with modelling results in the 2012 SIS.
4.3.1.2 Increase in urban roads due to Rebuilding NSW
After establishing the current stock of roads, the next step in the modelling was to determine the increase in this stock that would be delivered by Rebuilding NSW. This involved converting the dollar expenditure into a potential increase in lane kilometres.
Expenditure on urban roads was assumed to total $8 billion. This assumption was adopted for the purposes of the modelling and may differ somewhat from actual expenditure made by the NSW Government.
The high case was based on a 45:55 split of Rebuilding NSW expenditure on roads involving tunnels (which are relatively costly) and surface roads, respectively. This assumption was adopted because some of the roads discussed in the Rebuilding NSW Discussion Paper may need to involve the construction of tunnels. While the Discussion Paper does not identify particular roads which will be built it does mention North and South Extension to Westconnex and the need to improve road corridors such as Military Road. The low case

Economic Impact of State Infrastructure Strategy – Rebuilding NSW
23 Commercial-in-Confidence
Deloitte Access Economics
involved a 60:40 split between tunnels and surface roads. By focussing on surface roads the high case results in a slightly greater increase in the road stock.
Estimates of the cost of building roads involving tunnels was based on the:
cost per lane kilometre for the M4 South Tunnel – outlined in the Executive Summary of the Westconnex Business Case; and the
cost per lane kilometre of the Military Road Tunnel – outlined in the Northern Beaches Bus Rapid Transit Pre-Feasibility Study.
The cost per kilometre of surface roads was estimated based on information from the Commonwealth Department of Infrastructure on the estimated cost of recently proposed road enhancements associated with the creation of a second airport at Badgery’s Creek and information on the cost of above ground extensions of other roads such as the F6 provided for the 2012 SIS.
In the low case this resulted in an increase of around 100 lane kilometres and around 115 lane kilometres in the high case.
4.3.1.3 Increase in rural roads due to Rebuilding NSW
Expenditure on rural roads was assumed to total around $3 billion from Rebuilding NSW. This assumption was adopted for the purposes of the modelling and may differ somewhat from actual expenditure made by the NSW Government.
As with urban roads, this expenditure was converted to an increase in lane kilometres by considering the cost of an average lane km in recent regional road projects in NSW. Looking at over 30 recent projects indicated that an average lane kilometre costs around $8.1 million. A summary of this data is shown in the chart below.
Chart 4.1: Cost per lane km in recent regional road projects in NSW
Source: DAE Analysis based on RMS data

Economic Impact of State Infrastructure Strategy – Rebuilding NSW
24 Commercial-in-Confidence
Deloitte Access Economics
Combining the expenditure and costs per kilometre resulted in an estimated 380 kilometres of regional road being added due to Rebuilding NSW.
4.3.1.4 Increase in rail due to Rebuilding NSW
The impact of the Sydney Rapid Transit project was estimated based on information provided in project documentation. This provided a profile of construction expenditure over time as well as details such as the length of track being constructed. The project documentation indicated that Sydney Rapid Transit would add around 30 kilometres of rail to the city’s current rail stock.
4.3.2 Population impacts from investment in roads and rail
In the case of road infrastructure, a 10% increase in the extent of the road networks in terms of lane kilometres for major interstate routes was found to increase a region’s population by 2% over 20 years based on the findings of Duranton and Turner (2012). Experience suggests that investments in transport infrastructure should lead to increases in population as better transport infrastructure makes it easier to access high quality jobs and makes a city an easier, more enjoyable place to live and work.
For rail, a 10% increase in Sydney’s rail infrastructure was assumed to increase population by 0.04% per year based on the estimates of Duranton and Turner (2012). Construction of public transport makes a city easier to move around for both work and leisure. This makes the city a more attractive place to live and do work and so leads to increases in population. Duranton and Turner were able to confirm and measure this relationship in their analysis. Results from Duranton and Turner were compared to an alternative approach based on housing supply and travel time savings. The comparison yielded similar but slightly lower population impacts over time. This could in part reflect the fact that some of the time savings also accrue to the wider rail network rather than only the stations which directly benefit from Sydney Rapid Transit.
Combining the results from Duranton and Turner (2012) with the road and rail stock increases described above gave the following changes in population:
Chart 4.2: Estimated increase in population
Source: DAE
0
50,000
100,000
150,000
200,000
250,000
300,000
2014 2019 2024 2029 2034
Low
Average
High

Economic Impact of State Infrastructure Strategy – Rebuilding NSW
25 Commercial-in-Confidence
Deloitte Access Economics
4.3.3 Transport cost impacts from investment in roads and rail
In the absence of detailed information on increased freight productivity of particular infrastructure projects, transport cost impacts were estimated based on relevant findings in the literature. Duranton and Turner (2009) analysed the mean cost of driving as a function of interstate lane kilometres, finding that a 1% increase in road provision leads to a 0.06% decrease in the time cost of driving. This finding indicates that increases in road provision only slightly reduce travel times because increased road provision encourages more driving activity. This result was further reinforced by Duranton and Turner (2011) which showed that, based on a more complex, structural model, this estimate should lie between 0.05% and 0.10%, which is consistent with the earlier elasticity estimate of 0.06%.
In addition to the difference in lane kilometres (discussed in Section 4.3.1.2), the high case involved consideration of the high cost benefit ratios expected from early pinch-point style interventions. Review of a range of results from the UK indicated that these projects could, on average, deliver cost benefit ratios in excess of 4:1 (Department for Transport 2013). The high level of benefits expected from these programs was included in the high case.
Applying the results of this research indicated that costs savings associated with transporting freight in Metropolitan NSW are expected to reach around 1.9% in the low case and 3.4% in the high case by 2035-36. Savings in the rest of NSW are expected to be around 0.4% by 2036-36 in both the low and high cases.
4.3.4 Business travel time savings
In the project documentation for Sydney Rapid Transit there are found to be travel time savings which accrue to:
new rail users;
continuing rail users, and
road users as a result of reduced congestion on the roads.
Some of these travel time savings accrue to travel for the purposes of work. For the low case, the proportion of travel time savings accruing to business travel was estimated based on the weighting of private and business travel used to estimate the value of travel time. These travel time savings for business users are, effectively, an increase in labour productivity. For the purposes of modelling we have translated them into an increase in labour supply.
For the high case, the effects of commute times on working behaviour were also taken into consideration. Travel time savings for non-business travel such as travel to and from work may lead to increased labour supply if commuters use some of the time they save to do work. This case was taken as a high case for the benefits of business travel time savings. To calculate this high case we assumed that 40% of travel time savings were used to do work. The figure of 40% was selected to be consistent with the relative share of business and commuting time in terms of distance travelled in the NSW Bureau of Transport Statistics 2011/12 Household Travel Survey, which was 41%.
There is no clear consensus in the economic literature on the relationship between commuting time and labour. Indeed some studies show a slight increase in labour supply as

Economic Impact of State Infrastructure Strategy – Rebuilding NSW
26 Commercial-in-Confidence
Deloitte Access Economics
commuting distance increased. This high case can therefore be thought of as an upper estimate to illustrate the potential value where the travel time savings do result in increased working hours.
This approach indicated that, in the low case, labour supply was expected to increase by around 400 FTE in the long run while in the high case labour supply is expected to increase by around 1,800 FTE in the long run. The large increase in the high case reflects the role of rail as a predominantly commuter, rather than business, mode of transport.
4.4 Effect of investing in water infrastructure on agricultural and mining production
Agriculture and mining are two of the largest users of water in regional NSW (ABS 2013a). Increases in agricultural and mining production were estimated based on more water being available as a result of an assumed investment of $1 billion in regional water infrastructure projects. This assumption was adopted for the purposes of the modelling and may differ from actual expenditure made by the NSW Government.
Considering the outcomes of similar investments in Victoria indicated that $1 billion of water infrastructure investment could result in around 320 GL of water loss being avoided each year (Victorian Auditor General 2010 and NVIRP 2010). Given the Victorian experience, it was assumed that around 55% of this water would be returned to environmental flows (generating no effect on GSP but creating value for society).
In the low case, the remaining 45% of water saved was assumed to be then split according to the current relative share of water use in Agriculture and Mining. This results in 5% of the 320GL being available for use in Mining with the remaining 40% being available for use in Agriculture (ABS 2013a). This additional water was then converted to revenue using the current ratio of total production to total water use in each industry (ABS 2013b and NSW Minerals Council 2013). This approach resulted in an increase in agricultural and mining production of around $1 billion a year by 2025.
In the high case, it was assumed that mining received a greater proportion of the water available than in the low case. This results in an increase in agricultural and mining production of around $2 billion a year by 2025
This approach to the modelling essentially assumes that an increase in water availability will enable an increase in output in both the agriculture and mining sectors. In this sense, water availability must be acting as a constraint to regional production. We consider that water acting as a constraint on output is likely to be case, particularly given the analysis in Appendix D which indicates a reduction in water availability in much of NSW over the coming decades. However, it may be the case that water is not a constraint on production, in this case investment in water infrastructure will result in lower water prices for agriculture and mining uses which would benefit consumers as reduced costs of production are passed through the supply chain. In this case, the approach to modelling would be different to the approach taken in this report. However, qualitatively, and from a whole of economy perspective, the nature of benefits would be similar.

Economic Impact of State Infrastructure Strategy – Rebuilding NSW
27 Commercial-in-Confidence
Deloitte Access Economics
4.5 Economic impact of Rebuilding NSW – modelling results
The CGE modelling results set out in section 2 have been undertaken so that the effect of the reinvestment associated with Rebuilding NSW can be separately identified from the effect of the electricity partial lease. This section presents the effect of the reinvestment associated with Rebuilding NSW by itself. The results presented below reflect both the low and high cases described in Section 4 with the charts showing the average of the two scenarios.
The average of the modelling results suggest that by 2035-36 the NSW economy – as measured by Gross State Product (GSP) – is expected to be around $26.6 billion larger than it would be without the reinvestment associated with Rebuilding NSW (measured in 2013 prices). The impact on annual GSP from 2015-16 to 2035-36 is shown in Table 2.1, below.
Table 4.2: CGE modelling results- difference in GSP ($2013 million)
2020-21 2025-26 2030-31 2035-36
Difference
Low case 3,800 10,600 17,900 24,700
High case 4,000 12,000 20,500 28,400
Average 3,900 11,300 19,200 26,600
Per cent
Low case 0.6 1.6 2.3 2.8
High case 0.7 1.8 2.7 3.3
Average 0.7 1.7 2.5 3.1 Source: Deloitte Access Economics.
Chart 4.3, below, plots the expected impact on GSP for the average result shown above.
Chart 4.3: Rebuilding NSW Effect on GSP over time ($2013 million)
a. Levels b. Difference
Source: Deloitte Access Economics.
500,000
550,000
600,000
650,000
700,000
750,000
800,000
850,000
900,000
950,000
2014 2019 2024 2029 2034
Policy Baseline -
5,000
10,000
15,000
20,000
25,000
30,000
2014 2019 2024 2029 2034

Economic Impact of State Infrastructure Strategy – Rebuilding NSW
28 Commercial-in-Confidence
Deloitte Access Economics
By 2035-36 employment in NSW is also expected to increase by around 122,500 full time equivalent jobs due to Rebuilding NSW.
Table 4.3: CGE modelling results- increase in Employment (FTE)
2020-21 2025-26 2030-31 2035-36
Difference
Low case 6,100 44,100 84,000 112,500
High case 7,300 52,200 99,000 132,500
Average 6,700 48,100 91,500 122,500
Per cent
Low case 0.2 1.3 2.4 3.0
High case 0.2 1.5 2.8 3.6
Average 0.2 1.4 2.6 3.3 Source: Deloitte Access Economics.
Other measures of welfare, beside GSP are consumption and household income. The results for these macroeconomic variables are very similar to those for GSP. For example, the modelling suggests that by 2035-36:
Consumption is expected to be around $18.4 billion larger due to Rebuilding NSW (measured in 2013 prices).
Household income is expected to be around $23.8 billion larger due to Rebuilding NSW (measured in 2013 prices).

Economic Impact of State Infrastructure Strategy – Rebuilding NSW
29 Commercial-in-Confidence
Deloitte Access Economics
4.6 Economic impact of ongoing investments from 2012 SIS – modelling results
To ensure consistency with previous modelling (DAE 2012), we also modelled an additional effect from ongoing investments associated with the 2012 SIS that are not included in Rebuilding NSW. The approach was largely similar to that described above for Rebuilding NSW except that the modelling included:
around 24 lane kilometres of urban motorway;
around 130 lane kilometres of regional road were modelled;
23 kilometres of heavy rail; and
30 kilometres of other public transport projects.
This section presents the effect of these specific investments alone. It should be noted that these effects are not included in the overall results reported in Section 2. The results presented below reflect both the low and high cases described in Section 4 with the charts showing the average of the two scenarios.
The average of the modelling results suggest that by 2035-36 the NSW economy – as measured by Gross State Product (GSP) – is expected to be around $13.3 billion larger than it would be without the ongoing investments associated with the 2012 SIS (measured in 2013 prices).
The impact on annual GSP from 2015-16 to 2035-36 is shown in Table 4.4, below.
Table 4.4: CGE modelling results- difference in GSP ($2013 million)
2020-21 2025-26 2030-31 2035-36
Levels
Low case 3,800 6,600 8,900 11,800
High case 3,900 7,600 11,000 14,900
Average 3,800 7,100 10,000 13,300
Per cent
Low case 0.6 1.0 1.2 1.4
High case 0.7 1.1 1.4 1.7
Average 0.6 1.0 1.3 1.5
Source: Deloitte Access Economics.
Chart 4.4, below, plots the expected impact on GSP for the average result shown above. Variations in the early years of the project period largely reflect changes in capital expenditure patterns.

Economic Impact of State Infrastructure Strategy – Rebuilding NSW
30 Commercial-in-Confidence
Deloitte Access Economics
Chart 4.4: Effect on GSP over time ($2013 million) – ongoing investments from 2012 SIS
a. Levels b. Difference
Source: Deloitte Access Economics.
Other measures of welfare, beside GSP are consumption and household income. The results for these macroeconomic variables are very similar to those for GSP. For example, the modelling suggests that by 2035-36:
Consumption is expected to be around $9.2 billion larger due to ongoing investments associated with the 2012 SIS (measured in 2013 prices).
Household income is expected to be around $11.9 billion larger due to ongoing investments associated with the 2012 SIS (measured in 2013 prices).
By 2035-36 employment in NSW is also expected to increase by around 51,300 full time equivalent jobs due to ongoing investments associated with the 2012 SIS.
Table 4.5: CGE modelling results- increase in Employment (FTE)
2020-21 2025-26 2030-31 2035-36
Levels
Low case 9,300 22,200 31,900 42,000
High case 10,400 29,900 45,900 60,600
Average 9,800 26,000 38,900 51,300
Per cent
Low case 0.3 0.7 0.9 1.1
High case 0.3 0.9 1.3 1.6
Average 0.3 0.8 1.1 1.4 Source: Deloitte Access Economics.
500,000
550,000
600,000
650,000
700,000
750,000
800,000
850,000
900,000
950,000
2014 2019 2024 2029 2034
Policy Baseline -
2,000
4,000
6,000
8,000
10,000
12,000
14,000
2014 2019 2024 2029 2034

Economic Impact of State Infrastructure Strategy – Rebuilding NSW
31 Commercial-in-Confidence
Deloitte Access Economics
5 NSW in 2035-36 To develop a baseline projection for the NSW economy in 2035-36 we have taken NSW Treasury’s Intergenerational Report projections for productivity and participation and combined these with the Department of Planning and Environment’s projections of population to give a view of overall economic growth.
We undertook a similar process in 2011. Since then the Department of Planning and Environment has released updated population projections. In addition, the NSW Government has made progress on a number of significant infrastructure projects that will help boost both population and economic activity over the projection period. In particular, the NSW Government has established Restart NSW. Restart NSW will fund a range of high priority future infrastructure projects in NSW. To help fund these initiatives, the NSW government has allocated funds from the partial lease of various publicly owned assets to Restart NSW, In particular, a number of the state’s major ports have been partially leased to various consortiums, including: Port Botany, Port Kembla and Port Waratah.
The proceeds from these partial leases have been used to finance a number of major projects such as:
the WestConnex motorway, between the M4 and airport precinct;
Bridges for the Bush program; and
an additional $100 million for projects in the Illawarra region.
In addition to the above, progress has also been made on a range of road and rail infrastructure projects, including many of those identified in the 2012 SIS update. According to the NSW Government SIS update in 2013, the major urban road works which have commenced include:
WestConnex, a combined new and enhanced motorway capacity and urban renewal project, will extend the M4 to Sydney Airport and duplicate the M5 East. The NSW Government has committed $1.8 billion from Restart NSW.
The M5 West widening to expand the motorway from two to three lanes.
The Hills M2 upgrade to widen the motorway and deliver new ramps to improve access (now completed).
Plans for the M2 to F3 link has also been approved, with construction due to start in the near future.
Progress has also been made on a number of rail and light rail projects including planning a new light rail network from Circular Quay to Randwick and Kingsford, while construction has begun on both the North West and South West Rail links. Further, the decision to approve a second airport at Badgery’s Creek will mean that over the next twenty years additional infrastructure will need to be developed to support activity at the airport and related transport and logistics firms operating outside the airport precinct as the airport develops.
Taking into account new population projections which reflect progress on infrastructure, the following sections set out a revised economic outlook for NSW and its regions.

Economic Impact of State Infrastructure Strategy – Rebuilding NSW
32 Commercial-in-Confidence
Deloitte Access Economics
5.1 NSW economy
Overall, our modelling indicates that, between 2013-14 and 2035-36 NSW real GSP is projected to grow from around $490 billion (in 2013 prices) to around $870 billion (in 2013 prices), this represents an average annual growth rate of 2.6%. Some other key economic results are presented in the table and chart below with further detail provided in Appendix B and Appendix C.
Table 5.1: NSW economic snapshot
2013-14 2031-32 2035-36 CAGR
GSP ($bn) 493.3 786.1 867.7 2.6%
Population (million) 7.5 9.3 9.7 1.2%
GSP per capita 65,785 84,371 89,452 1.4%
Employment (number) 3,659,379 4,435,405 4,594,648 1.0% Source: Deloitte Access Economics
Chart 5.1: NSW average annual growth rates of major economic statistics 2013-14 to 2035-36
Source: Deloitte Access Economics
0.0%
0.5%
1.0%
1.5%
2.0%
2.5%
3.0%
GSP ($bn) Population(million)
GSP per capita Employment(Headcount)

Economic Impact of State Infrastructure Strategy – Rebuilding NSW
33 Commercial-in-Confidence
Deloitte Access Economics
5.2 Regions
The coastal regions of NSW are expected to grow more strongly than inland areas in terms of Gross Regional Product (GRP) over the period to 2035-36. The South East and North Coast, for example, are expected to grow by 2.0% and 1.8% a year respectively compared to growth of 1.3% a year in the Murray region and 0.5% a year in the Far West region. The lower than average growth in inland regions is largely a result of lower than average population growth. As shown in the following section, these two factors tend to balance out to result in fairly similar GRP per capita growth throughout the state.
Chart 5.2: Average annual GRP growth, 2013-14 to 2035-36
Source: Deloitte Access Economics
0.0%
0.5%
1.0%
1.5%
2.0%
2.5%
3.0%

Economic Impact of State Infrastructure Strategy – Rebuilding NSW
34 Commercial-in-Confidence
Deloitte Access Economics
Chart 5.3: Average annual GRP per capita growth, 2013-14 to 2035-36
Source: Deloitte Access Economics
0.0%
0.2%
0.4%
0.6%
0.8%
1.0%
1.2%
1.4%
1.6%

Economic Impact of State Infrastructure Strategy – Rebuilding NSW
35 Commercial-in-Confidence
Deloitte Access Economics
5.3 Industries
As is shown in the charts below, the structure of the NSW economy is expected to change slowly over the period to 2035-36. The finance and insurance industry is expected to maintain its position as the largest industry in NSW, as it is expected to grow at an average annual rate of 2.9% a year over the period to 2035-36. The role of finance reflects the strong presence of the industry in Sydney and the significant role of the Sydney economy in the state. Other service based industries – including professional, scientific and technical services, health care and social assistance and education – are also expected to experienced growth slightly above the level seen in the economy overall in this period.
Chart 5.4: Industry structure – NSW
Source: Deloitte Access Economics
0% 5% 10% 15% 20%
Other Services
Arts and Recreation Services
Health Care and Social Assistance
Education and Training
Public Administration and Safety
Administrative and Support Services
Professional, Scientific and Technical Services
Rental, Hiring and Real Estate Services
Financial and Insurance Services
Information Media and Telecommunications
Transport, Postal and Warehousing
Accommodation and Food Services
Retail Trade
Wholesale Trade
Construction
Electricity, Gas, Water and Waste Services
Manufacturing
Mining
Agriculture, Forestry and Fishing
2013-14 2024-25 2031-32 2035-36

Economic Impact of State Infrastructure Strategy – Rebuilding NSW
36 Commercial-in-Confidence
Deloitte Access Economics
References ABS 2013, ‘Births, Australia, 2012’, Cat. No. 3301.0, available from:
http://www.abs.gov.au/AUSSTATS/[email protected]/Latestproducts/3301.0Main%20Features42012?opendocument&tabname=Summary&prodno=3301.0&issue=2012&num=&view
ABS (2013a), “4610.0 - Water Account, Australia, 2011–12”
ABS (2013b), “4610.0.55.008 - Gross Value of Irrigated Agricultural Production, 2011-12”
ABS (2013c), “Population Projections, Australia, 2012 (base) to 2101”
ABS, (2013), “Australian Demographic Statistics, Dec 2013” <http://www.abs.gov.au/AUSSTATS/[email protected]/DetailsPage/3101.0Dec%202013?OpenDocument>
ABS, (2013a), “Australian National Accounts: State Accounts” <http://www.abs.gov.au/AUSSTATS/[email protected]/DetailsPage/5220.02012-13?OpenDocument>
AAP, (2013) “Congestion charge would cut Sydney traffic”, <http://www.theaustralian.com.au/news/latest-news/congestion-charge-would-cut-sydney-traffic/story-fn3dxiwe-1226633746985?nk=ec9c6626d62168ed868307f490512425>
AAP,(2013a), “NSW Ports Privatised in $5 Billion Deal”, http://news.smh.com.au/breaking-news-national/nsw-ports-privatised-in-5-billion-deal-20130412-2hq0z.html
AEMC (2014), “AEMC annual price trends report”, Accessed: 17/09/2014 <http://www.aemc.gov.au/getattachment/fe3d2519-026d-4f01-bdd4-d65ddfae51c3/2013-Residential-Electricity-Price-Trends-Final-Re.aspx>
AER (2014), “AER incentive regulation factsheet”, Accessed: 17/09/2014, <http://www.aer.gov.au/node/18869>
AGL (2014), “NSW Electricity Distribution Networks Regulatory Proposals: 2014- 19 AGL submission to the Australian Energy Regulator” Accessed, 16/09/2014, <https://www.nsw.gov.au/sites/default/files/miscellaneous/electricity_network_services.pdf>
Ausgrid (2013), “Electricity network performance report”, Accessed: 17/09/2014, http://www.ausgrid.com.au/~/media/Files/Network/Regulations%20and%20Reports/Ausgrid%20NPR%20201213%20FINAL.pdf
Automobile Association of Australia (2013), “Road Length and Use by Road Type”, http://www.aaa.asn.au/issues/statistics.htm#system

Economic Impact of State Infrastructure Strategy – Rebuilding NSW
37 Commercial-in-Confidence
Deloitte Access Economics
BBC, (2013), “Has London's congestion charge worked?”, <http://www.bbc.com/news/uk-england-london-21451245>
BITRE (2013), “Yearbook 2013”, accessed 22/9/2014, http://www.bitre.gov.au/publications/2013/yearbook_2013.aspx
BITRE (2007), “Estimating urban traffic and congestion cost trends for Australian cities”, < http://www.bitre.gov.au/publications/2007/wp_071.aspx>
Bureau of Transport Statistics (2012), “NSW and Sydney Transport Fact”, accessed 22/9/2014, http://www.bts.nsw.gov.au/ArticleDocuments/112/BR2012_04_transport_facts.pdf.aspx?Embed=Y
CIA, (2014), “Australia”, <https://www.cia.gov/library/publications/the-world-factbook/geos/as.html>
CIA, (2014), “China”, https://www.cia.gov/library/publications/the-world-factbook/geos/ch.html
Department for Transport (2014), “Local Pinch Point Fund”,https://www.gov.uk/government/collections/local-pinch-point-fund#guidance
Department of Environment, Climate Change and Water (2010), “NSW Climate Impact Profile”, < http://www.environment.nsw.gov.au/resources/climatechange/10171climateimpactprof.pdf>
Department of Foreign Affairs and Trade, (2014), “China” <https://www.dfat.gov.au/geo/fs/chin.pdf>
Department of Infrastructure (2014), “State of Australian Cities”, <http://www.infrastructure.gov.au/infrastructure/pab/soac/>
Department of Planning (2010), “State and regional population projections: 2010 interim revision”, < http://www.planning.nsw.gov.au/en-au/deliveringhomes/populationandhouseholdprojections/preliminary2013populationprojections/projectionsarchive.aspx>
Department of Planning and Environment (2014a), “Population, Housing and Dwelling Projections”, < http://www.planning.nsw.gov.au/en-au/deliveringhomes/populationandhouseholdprojections/data.aspx>
Department of Planning and Environment (2014b), “Comparison With Previous Population Projections”, <http://www.planning.nsw.gov.au/Portals/0/DeliveringHomes/PopulationProjections/Docs/NSW_Population_Report_-_Comparison_with_previous_population_projections.pdf >

Economic Impact of State Infrastructure Strategy – Rebuilding NSW
38 Commercial-in-Confidence
Deloitte Access Economics
Department of Planning and Environment (2014), “Population, Household and Dwelling Projections”, available from: http://www.planning.nsw.gov.au/en-us/deliveringhomes/populationandhouseholdprojections/data.aspx.
Duranton, G. and Turner. M, (2012), “Urban growth and transportation”, Review of Economic Studies, 79 (4), pp.1407-1440
Duranton, G. and Turner. M, (2009), “Fundamental law of road congestion: Evidence from US cities”, Working paper series: University of Toronto.
Duranton, G. and Turner. M, (2007), “Urban growth and transportation”, Working paper series: University of Toronto.
Endeavour Energy (2013), “Electricity network performance report”, Accessed: 17/09/2014, http://www.endeavourenergy.com.au/wps/wcm/connect/964ff6804dc4c821b044b9d4aa6b58cc/Final+ENPR_2012-2013.pdf?MOD=AJPERES
Ernst and Young (2014), “Electricity network services long-term trends in price and costs” Accessed, 16/09/2014, <https://www.nsw.gov.au/sites/default/files/miscellaneous/electricity_network_services.pdf>
Essential Energy (2013), “Electricity network performance report”, Accessed: 17/09/2014, http://www.essentialenergy.com.au/asset/cms/pdf/electricitynetwork/NPR2012-13.pdf
Gitelman and Otto (2010), “Supply Elasticity in the Sydney Housing Market”
HoustonKemp, (2014), “Electricity networks service standards: An overview” < http://www.nsw.gov.au/sites/default/files/initiatives/houstonkemp-final_report_2_september_2014.pdf>
Index Mundi, (2014), “GDP Real Growth Rate - Australia” <http://www.indexmundi.com/g/g.aspx?v=66&c=as&l=en>
Independent Review Panel on Network Costs (2014), “Electricity Network Costs Review Final Report” Accessed, 16/09/2014, <http://www.dews.qld.gov.au/__data/assets/pdf_file/0010/78544/irp-final-report.pdf>
Index Mundi, (2014), “GDP Real Growth Rate - China” <http://www.indexmundi.com/g/g.aspx?c=ch&v=66>
Mckinsey (2012), “Urban world: Cities and the rise of the consuming class”, Accessed: 24/10/2014 < http://www.mckinsey.com/insights/urbanization/urban_world_cities_and_the_rise_of_the_consuming_class>

Economic Impact of State Infrastructure Strategy – Rebuilding NSW
39 Commercial-in-Confidence
Deloitte Access Economics
NSW department of resource and energy, (2014), “NSW distribution network service providers’ distribution districts”, Accessed: 17/09/2014, http://www.resourcesandenergy.nsw.gov.au/__data/assets/pdf_file/0004/312637/NSW_DNSP_Distribution-Districts-map.pdf
NSW Government, 2013, “State Infrastructure Strategy”, <http://www.nsw.gov.au/sites/default/files/initiatives/state-infrastructure-strategy.pdf>
NSW Government, 2013, “Community Guide: Draft Metropolitan Strategy for Sydney to 2031” <http://strategies.planning.nsw.gov.au/Portals/0/Documents/MetroCommunityGuide.pdf>
NSW Government, (2013), “State Infrastructure Plan Update” <http://www.nsw.gov.au/sites/default/files/initiatives/november_sip_update_report_1.pdf>
NSW Minerals Council (2012), “NSW Mining 2012: A Snapshot”, Accessed 17/9/2014, < http://www.nswmining.com.au/NSWMining/media/NSW-Mining/Publications/NSW-Mining-2012-A-Snapshot-FINAL.pdf>
NVIRP (2010), Letter to Productivity Commission dated 4 February 2010.
Onthehouse.com.au (2014), “Postcode Sales Report”, < http://www.onthehouse.com.au/reports/sold_info/postcode_sales_history/>
Ports Australia, (2014), “Port Statistics”, < http://www.portsaustralia.com.au/aus-ports-industry/trade-statistics/>
Productivity Commission (2013), “Electricity Network Regulatory Frameworks”, Report No. 62, Canberra. Accessed, 16/09/2014, <http://www.pc.gov.au/__data/assets/pdf_file/0016/123037/electricity-volume1.pdf>
Sydney Ports, (2013), “Trade Statistics”, http://www.sydneyports.com.au/__data/assets/pdf_file/0011/29387/GRAPHS_FY_201213.pdf
Transgrid (2013), “Electricity network performance report”, Accessed: 17/09/2014, http://www.transgrid.com.au/aboutus/pr/Documents/Electricity%20Network%20Performance%20Report%202013.pdf
Transport for NSW 2012, ‘Northern Beaches Bus Rapid Transit Pre-Feasibility Study’, available from: http://www.transport.nsw.gov.au/sites/default/files/b2b/bus/northern-beaches-brt-pre-feasibility-study.pdf
Treasury (2014), “Long-Run Forecasts of Australia’s Terms of Trade”, < http://www.treasury.gov.au/~/media/Treasury/Publications%20and%20Media/Publi

Economic Impact of State Infrastructure Strategy – Rebuilding NSW
40 Commercial-in-Confidence
Deloitte Access Economics
cations/2014/Long%20run%20forecasts%20of%20Australias%20terms%20of%20trade/Documents/PDF/long_run_tot.ashx>
Treasury (2010), “Australia to 2050: future challenges”, available from: http://archive.treasury.gov.au/igr/igr2010/report/pdf/IGR_2010.pdf
Treasury (2014) “Budget 2014-15”, available from: http://www.budget.gov.au/2014-15/index.htm.
Victorian Auditor General (2010), “Irrigation Efficiency Programs”
Westconnex (2013), WestConnex Business Case Executive Summary, September 2013.
Wood, T., Hunter, A., O’Toole, M., Venkataraman, P. & Carter, L. (2012), “Putting the customer back in front: How to make electricity cheaper, Grattan Institute” Accessed, 16/09/2014, <http://grattan.edu.au/wp-content/uploads/2014/04/178_energy_putting_the_customer_back_in_front.pdf>

Economic Impact of State Infrastructure Strategy – Rebuilding NSW
41 Commercial-in-Confidence
Deloitte Access Economics
Appendix A: Modelling the partial lease of electricity assets Previous studies into potential efficiency gains
Ernst and Young (2014)
In 2014, Ernst and Young was commissioned by NSW Treasury to analyse long-term trends in electricity prices faced by consumers and costs of providing electricity network services. The report found that:
Network prices for typical residential customers in Victoria and South Australia fell, in real terms, since privatisation in 1995-1996 and 1999-2000 respectively.
Network prices in NSW and Queensland have increased in real terms by over 100% in the same period.
The privately-owned businesses in Victoria and South Australia reduced their real operating costs over the period and they were able to keep their spending within the regulatory allowances.
Government-owned businesses did not reduce their real operating costs over the period and they were not often able to keep their spending within the regulatory allowances. Thus overspend could not be recouped (Ernst and Young, 2014).
These results are summarised below:
Table A.1: Network price changes and operating cost changes
NSW QLD Victoria South Australia
Network prices +122%* +140%* -18%** -17%***
Change in operating costs per MWh +71%† +96%†† -23%††† -3%†††† Source: Ernst and Young (2014) *Period between 1996-97 and 2012-13 ** Period between 1996-97 and 2012-13 ***Period between 1998-99 and 2010-11 †Period between 1999 to 2010 ††Period between 2002 and 2010 †††Period between 1996 to 2010 ††††Period between 2000 and 2010
Ernst and Young recognise the possibility that reduced costs have come at the expense of reliability or service levels. On this front, the Ernst and Young report finds that service levels across the states were similar – although some factors may not be fully taken into account in the dataset available. The report finds that reliability and service levels had improved in Victoria and South Australia as measured by SAIDI. Ernst and Young states that this finding is consistent with the AER’s 2013 State of the Energy Market report and the AER and ESC’s Electricity Distribution Business Performance Report for the Victorian businesses amongst others.
This suggests that the efficiency improvements in privatised states have not been made at the expense of reliability.

Economic Impact of State Infrastructure Strategy – Rebuilding NSW
42 Commercial-in-Confidence
Deloitte Access Economics
In sum, the evidence in this report suggests that there may be significant potential cost savings and efficiency gains should the long term partial lease of the networks proceed. However, the report also notes that there are also other factors which may have influenced network prices. These are not explicitly listed in the report, but are likely to include changes in peak demand, distributed generation, and changes to demand-side participation.
AGL (2014)
In 2014, AGL, an energy retailer, drafted a submission in response to the AER’s request for submissions on the NSW distribution network service providers Regulatory Proposals for the period from 1 July 2014 to 30 June 2019.5
AGL submits that the increase in network prices may be explained by the inefficient use of assets, and substantiates this claim by comparing, NSW DNSPs RAB/MWh to Victorian DNSPs. AGL considers that the results indicate that, in NSW, the value of the distribution assets is around 60% higher than in Victoria.
This cross-sectional analysis is not sufficient to suggest that the assets are inefficiently utilised and so, AGL also examines capital and labour productivity over time. AGL considers that their analysis suggests that capital and labour productivity in the NSW distribution network has declined substantially by around 62.7% for capital and around 27.5% for labour since 2004-05. Overall, they consider that this suggests that the assets are not efficiently utilised. AGL also finds that the average cost of opex for NSW DNSPs is 70% higher than that of their Victorian counterparts.
In conclusion, this analysis suggests that the DNSPs in NSW are not as efficiently run and those in Victoria. It should be noted that AGL does not allude to the privatisation of the Victorian DNSPs as an explanatory factor in lower network prices.
Productivity Commission (2013)
In 2013, the Productivity Commission (PC) completed its inquiry into electricity network regulatory frameworks. As part of the report, the efficiency of the networks was benchmarked and analysed. Some of the key findings of the report was that the efficiency of some network businesses could be improved - with a particularly large improvement possible for state-owned corporations relative to privately operated businesses.
To substantiate this claim the PC has noted three key features from their analysis:
The change in RAB is larger than the change in network capacity in states where the networks are owned by the government e.g. NSW, Queensland and Tasmania. The converse is true for states which have privatised their networks i.e. Victoria and South Australia.
After controlling for customer density, opex per kilometre for state owned DNSPs is higher than for privately owned DNSPs.
5 The NSW distribution network service providers are Ausgrid, Endeavour Energy and Essential Energy and are wholly owned by the NSW state government. As part of their obligations to the government these distributors are required to submit their revenue proposals (to the AER) for a five year period. The previous submission was in 2008.
Economic Impact of State Infrastructure Strategy – Rebuilding NSW
43 Commercial-in-Confidence
Deloitte Access Economics
State owned networks had a lower customer to employee ratio after controlling for customer density.
Given the findings above, the PC made recommendations for privatisation of state owned DNSPs. This recommendation recognised the requirements for reform of governance, clear communication, oversight and accountability to accompany privatisation.
Independent Review Panel on Network Costs (2013)
In 2013, the Independent Review Panel on Network Costs delivered its final report on the Electricity Network Costs Review in Queensland. The Independent Review Panel on Network Costs was established in response to the recent history of rising electricity prices. The purpose of the Review Panel was to develop options to address the impact of network costs on electricity prices in Queensland. The report makes a number of recommendations aimed at delivering price reductions to customers.
One key recommendation was that the government give consideration to the privatisation of the Network Service Providers, i.e. both transmission and distribution businesses. (Independent Review Panel on Network Costs, 2013)
In making this recommendation, the panel noted that data from the AER and findings of the Energy Users Association of Australia indicated that the privately owned DNSPs in Victoria and South Australia have been consistently more efficient than the government-owned DNSPs in Queensland and New South Wales. The panel further noted that these efficiency gains have not come at the cost of reliability.
This recommendation was supported by comparing the performance of the DNSPs in Queensland and New South Wales (government-owned) to that of South Australia and Victoria (privately-owned). Generally speaking, the analysis showed that:
Per customer operating expenditure relative to customer density was higher for government owned DNSPs than privately owned DNSPs in Victoria and South Australia; and
Corporate overhead costs and support costs were highest for NSW and Queensland.
Grattan Institute (2012)
In 2012, the Grattan Institute wrote a report examining the increase in electricity prices in Australia and gave some recommendations on how electricity prices rises could be contained. As part of the research, the authors found that ownership was a factor in explaining why consumers in states such as NSW and Queensland were paying more for electricity.
The analysis suggests that government-owned companies are inefficiently investing in their networks resulting in larger regulated asset bases (or physical infrastructure) per customer. The report also finds that although, the RAB has significantly grown in NSW and QLD, there is no compelling evidence that the government owned networks have become more reliable relative to their private counterparts.
In addition to the larger Capex, the Grattan Institute also notes that government-owned networks spend more Opex than their private counterparts. More precisely, they find that,
Economic Impact of State Infrastructure Strategy – Rebuilding NSW
44 Commercial-in-Confidence
Deloitte Access Economics
after controlling for customer density, government-owned companies tend to spend more on operational expenses than their private counterparts.
The report also finds similar results on other metrics such as customers per employee and the cost of labour, materials and contractors.
Benchmarking for distribution businesses
The best guide to the scale of efficiency gains that could be made are the experience of the Victorian and South Australian NSPs. As summarised in the previous section, the literature suggests that there is the potential for significant efficiencies from the long term partial lease. The magnitude of these gains is then used to model the measure the overall efficiency impact to the economy.
For this report, we have used the data from the IRP (2013) report to benchmark distribution business efficiencies. We used this report because it allowed business-specific efficiency gains to be identified. The results in IRP are, however, similar to those reported in the PC (2013), Grattan Institute (2012), Ernst and Young (2014) and AGL (2014) reports. These reports suggest that moving business from public management to private management will improve efficiency. We also note that the Australian Energy Regulator will be releasing a new benchmarking report in the coming months.
From the data in the IRP report, we were able to perform a regression to determine the relationship between opex per customer and customers per kilometre for a number of distributors. This line of best fit enabled us to estimate the expected gains from the long term partial lease. The analysis suggests that there is the potential for a:
17% improvement in Opex and a 29% improvement in Capex for AusGrid; and
32% improvement in Opex and a 18% improvement in Capex for Endeavour Energy.
In order to simplify the approach to modelling and not provide a level of false specificity, for the purposes of modelling we have assumed that cost savings could be in the order of 25% for each business in both capex and opex. While the consensus of previous literature generally point to savings of this magnitude, individual studies have slightly different results. Hence these results should not be interpreted as a precise measure of the efficiency gains that will be made but, rather, an indication of the scale of gains that are possible and have been developed for the purpose of the modelling undertaken in this report.
Further details of the distribution benchmarking exercise can be found in the charts below.

Economic Impact of State Infrastructure Strategy – Rebuilding NSW
45 Commercial-in-Confidence
Deloitte Access Economics
Chart A.1: Indicative distribution business Opex
Source: Deloitte Access Economics based on Independent Review Panel on Network Costs
A similar process was followed for the capital expenditure benchmarking exercise.
Chart A.2: Indicative distribution business Capex
Source: Deloitte Access Economics, Independent Review Panel on Network Costs
To arrive at these results we made a number of simplifying assumptions:
customer numbers are assumed to be the same regardless of ownership. This implies that a percentage change in Opex per customer is equivalent to a percentage change in Opex overall.
The distribution businesses are assumed to reach NEM-average efficiency in terms of Opex per customer.
Economic Impact of State Infrastructure Strategy – Rebuilding NSW
46 Commercial-in-Confidence
Deloitte Access Economics
From a modelling perspective, the first assumption suggests that any increase in power use resulting from lower prices is assumed to be an increase in average power per user, rather than an increase in the number of users. It is worth noting that trend of declining power use by consumers is most likely to affect all providers, regardless of ownership.
For the second assumption, we believe that this is a reasonable estimate. On the one hand, there may be the possibility of exceeding average levels of efficiency since the average includes relatively less efficient comparator businesses. On the other hand, there may be factors, such as topography which have not been taken into account, which may limit the potential efficiency gains from privatisation, relative to other states.
Benchmarking for TransGrid
Transmission businesses have not been the focus of previous analysis in the area. As a result we have undertaken a benchmarking approach similar to the distribution business analysis to estimate the likely capital and operating expenditure efficiencies from the long term partial lease. We have assumed a 15% reduction in capex and a 17% reduction in opex costs over time could be achieved by TransGrid.
Benchmarking transmission businesses is more difficult than distribution businesses, because there are fewer comparator businesses in the NEM. The process we have used to benchmark TransGrid is detailed below:
First, we performed a linear regression analysis of capex and opex as a function of line length and ownership structure, based on capex, opex and line length data for the five transmission businesses in the NEM. This data was gathered from the Regulatory Information Notices submitted by these businesses to the AER. Table A.2 summarises the actual capex and opex for the years 2006-2013, under the state-owned structure.
The regression results were used to generate estimates of expenditure results under a leasing scenario for 2006-2013. It is worth noting that the size of the estimated reduction varies over the time period.
To estimate the long term reduction and minimise any cyclical effects, the average capex and opex deviation over the seven years was used to estimate potential savings from the long term partial lease. The timeframe of this analysis was constrained by readily available data. We note that many electricity network assets have a useful life of over 30 years, and so cycles in expenditure may be longer than the times series used here.

Economic Impact of State Infrastructure Strategy – Rebuilding NSW
47 Commercial-in-Confidence
Deloitte Access Economics
Table A.2: estimating capex and opex savings for TransGrid
Year Real Capex ($m)
Real Opex ($m)
State-owned
Partial Lease (fitted)
% deviation State-owned
Partial Lease (fitted)
% deviation
2006 190 333 75% 153 123 -19%
2007 262 338 29% 151 125 -17%
2008 421 340 -19% 154 125 -19%
2009 657 340 -48% 144 125 -13%
2010 459 352 -23% 162 129 -21%
2011 400 357 -11% 151 130 -14%
2012 383 362 -6% 164 132 -20%
2013 509 372 -27% 150 135 -10%
Average 410 349 -15% 154 128 -17%
Source: Deloitte Access Economics, NSP submissions to AER. Dollars are in 2014-15 real terms.
There are a number of different ways that this cost reduction could be estimated. We could, for example:
include other control variables, such as power served, and variability of demand, that will influence capex and opex; and
vary the functional form, for instance by using the logarithm of line length.
A number of different approaches were trialled that included combinations of the above options. These factors had a significant influence on the size of the estimated capex saving. We selected controlling for line length only as it was the only statistic that was readily available for the time period for all transmission businesses. The functional form was chosen because it provided the most reasonable results.
Pass through of cost savings to consumers
To determine how opex and capex savings translate into electricity price savings for consumers requires three steps:
The timing of how these efficiency gains are achieved must be defined;
the pass-through of opex and capex to network charges must take place through AER determinations; and
The share of network charges in the overall electricity price must be taken into account.
Phase in of efficiency gains
The cost efficiencies estimated in the previous section will not be realised fully and immediately at the time of transaction, rather they will be achieved over time. Any employment guarantees, as well as natural limits on the rate of business change, will mean that efficiencies are realised over a number of years. For the purposes of this modelling exercise, we have assumed the capex and opex efficiency will be phased in progressively over 10 years.
Economic Impact of State Infrastructure Strategy – Rebuilding NSW
48 Commercial-in-Confidence
Deloitte Access Economics
Pass through from Opex and Capex savings to reductions in network charges
The network charges that consumers face will not follow the same decline as the reduction in capex and opex expenditure, this is due to the regulatory process between the AER and the individual businesses.
The regulatory determination process is quite complex, involving a number of considerations, including the following:
taxation;
the capital base;
the cost of capital;
depreciation; and
incentive mechanism payments.
We model future Maximum Allowable Revenue (MAR) determinations by the AER under 1) the business as usual scenario and 2) in the long term partial lease scenario. This is achieved by first constructing a Post-Tax Revenue Model (PRTM) for each business, which enables us to estimate the potential savings pass-through in capex and opex for future years. This approach means that, for example, the reduction in capex identified above is treated as a reduction in additions to the regulatory asset base. That is, each year’s capital expenditure is a contribution to the overall capital stock of the business. The cost associated with this capital stock is then spread over the lifetime of the asset. This means that, in our modelling, rather than writing down assets, efficiencies are achieved as the capital stock will decrease relative to the baseline over time. This means that a 15% efficiency improvement for capex will only fully translate into a 15% reduction in the size of the capital base once all existing assets have been replaced.
The use of the PTRM to calculate the MAR results in a complex transition over time. Figure A.1 illustrates a simplified version of the pass-through mechanism showing cost savings being passed through to consumers over a number of regulatory periods:
Period 1
First, given the MAR for the period to 2019 will be set ahead of any sale, no savings will be passed on to consumers until at least July 2019, apart from the price guarantee. The allowable revenue will remain at baseline levels, while the cost to serve will decline as operating efficiencies are brought in. This is shown in the Period 1 section of Figure A.1.
Period 2
The subsequent AER revenue determination will incorporate part of these savings. This is shown in period 2 in Figure A.1. During this period, there will still be some margin between revenue and expenditure; this is due to two factors:
• The base year for the AER to determine expenditure in future regulatory periods is year four of the current regulatory period, which is the basis for setting the MAR albeit with an adjustment and appeals process; and
• The Efficiency Benefit Sharing Scheme (EBSS), which ensures that businesses have similar incentives to make sustainable savings regardless of the timing within a given regulatory period. Further details on the EBSS have been provided in Box 2 and are available on the AER website.
The margin between expenditure and revenue is shown as the blue bars in Chart 3.4.

Economic Impact of State Infrastructure Strategy – Rebuilding NSW
49 Commercial-in-Confidence
Deloitte Access Economics
Period 3
Once the savings from the long term partial lease have been fully realised, the MAR set for period 3 will be just sufficient to cover expenses. Thus there will effectively be zero revenue above expenditure. This new ‘steady state’ is shown in period 3 of Figure A.1.
Figure A.1: Stylised example of opex savings
Source: Deloitte Access Economics
The pass-through mechanism of Capex savings works in a similar way to the opex savings as described in the previous three paragraphs. Our model suggests that the efficiency gains from opex and capex will be fully passed through to consumers within 15 years of the long term partial lease.
Since the opportunity to generate revenue in excess of costs will be captured by the Government in the price paid by lessees, this revenue (shown as the blue bars in Figure A.1) can therefore be thought of as a transfer from the lessees to the government. For the purposes of the CGE modelling we have therefore treated the reduction in expenditure as a positive productivity shock, while the transfer between lessees and the Government is treated as a tax payment. Further details on how we modelled this is provided in the next section.
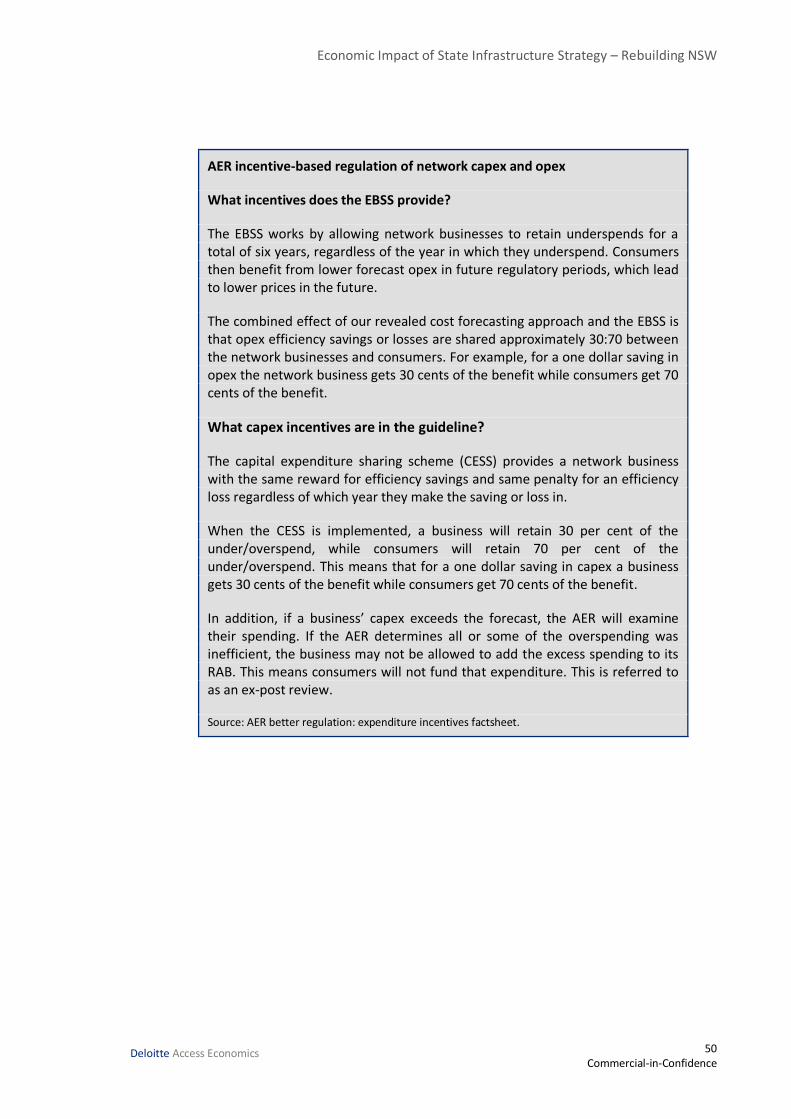
Economic Impact of State Infrastructure Strategy – Rebuilding NSW
50 Commercial-in-Confidence
Deloitte Access Economics
AER incentive-based regulation of network capex and opex
What incentives does the EBSS provide?
The EBSS works by allowing network businesses to retain underspends for a total of six years, regardless of the year in which they underspend. Consumers then benefit from lower forecast opex in future regulatory periods, which lead to lower prices in the future.
The combined effect of our revealed cost forecasting approach and the EBSS is that opex efficiency savings or losses are shared approximately 30:70 between the network businesses and consumers. For example, for a one dollar saving in opex the network business gets 30 cents of the benefit while consumers get 70 cents of the benefit.
What capex incentives are in the guideline?
The capital expenditure sharing scheme (CESS) provides a network business with the same reward for efficiency savings and same penalty for an efficiency loss regardless of which year they make the saving or loss in.
When the CESS is implemented, a business will retain 30 per cent of the under/overspend, while consumers will retain 70 per cent of the under/overspend. This means that for a one dollar saving in capex a business gets 30 cents of the benefit while consumers get 70 cents of the benefit.
In addition, if a business’ capex exceeds the forecast, the AER will examine their spending. If the AER determines all or some of the overspending was inefficient, the business may not be allowed to add the excess spending to its RAB. This means consumers will not fund that expenditure. This is referred to as an ex-post review.
Source: AER better regulation: expenditure incentives factsheet.

Economic Impact of State Infrastructure Strategy – Rebuilding NSW
51 Commercial-in-Confidence
Deloitte Access Economics
Pass through from network charge reductions to reductions in consumer prices of electricity
Once reductions in network charges have been established, following the process outlined above, these are translated into consumer price savings based on the share of consumer prices that are attributable to network charges.
Network charges are only one component of the total bill received by electricity consumers. Network charges cover the cost of transporting electricity from electricity generators to consumers. The bill therefore includes costs to cover the generation of the electricity, the administrative cost to serve customers and other charges related to green energy schemes. This is shown in the figure below.
Figure A.2: Components of a typical electricity bill
Source: EY (2014)
Our analysis indicates that, between 2015-16 and 2035-36, the share of average network prices is expected to be in the range of 54-62% for residential customers. Further details of the future projections of consumer prices can be found in Table A.3 below.
Table A.3: Cost stack projections, by element (%)
Residential Commercial Industrial
2015-16
2025-26
2035-36
2015-16
2025-26
2035-36
2015-16
2025-26
2035-36
NSW average wholesale cost
27% 33% 39% 33% 39% 47% 43% 49% 59%
Average network charges (T&D)
62% 56% 54% 60% 53% 52% 48% 40% 40%
Retail cost to serve 7% 6% 6% 2% 1% 1% 1% 1% 1%
Other charges (SRES & LRET)
4% 4% 0% 5% 6% 0% 7% 9% 0%
Total 100% 100% 100% 100% 100% 100% 100% 100% 100%
Source: Deloitte Access Economics
Due to the different efficiency gains possible in distribution and transmission, there is also the need to differentiate average network charges into a transmission and distribution component. The split of network charges between transmission and distribution is taken

Economic Impact of State Infrastructure Strategy – Rebuilding NSW
52 Commercial-in-Confidence
Deloitte Access Economics
from the AEMC annual publication on trends of prices. This shows transmission is 23% of overall network charge for residential users, with distribution comprising the remaining 77% of network charges (AEMC, 2014). For the purposes of modelling, this share is projected to be constant over time. In any case, this is not a sensitive assumption for the overall reductions in consumer price, as it only marginally changes the relative importance of transmission savings to distribution savings.
There is very little publicly available information on network cost composition for commercial and industrial uses. As a result, we have assumed that distribution makes up a smaller component of network charges for commercial and industrial users than it does for residential users, on the basis that:
overall network costs are lower as a share of total cost, as shown in Table 3.5;
the network cost per kWh delivered is lower for high-volume, steady-demand, commercial users, relative to peaky, small volume residential users; and
these differences in costs are most distinct for the ‘last mile’ of delivery in the distribution network, where power is being delivered to small number of users.
Approach to modelling the flow-on effects for the wider economy
The flow-on effects for the wider economy of the long term partial lease can be broken into primary effects related to the leasing of the network businesses (productivity gains) with a minor effect related to the nature of capital investment.
Primary effect – productivity gains arising from the partial lease
As discussed in the previous sections, the efficiency gains from the long term partial lease will phase in over time from the projected partial lease date. These efficiency gains are modelled as a positive productivity shock that reduces the cost of electricity for consumers which enables consumers to spend more of their disposable income on good and services.
Considering the lagged pass-through mechanism of reductions in network cost to reductions in consumer prices. The lags are modelled as taxes or subsides (dependent on whether the impact is positive or negative). For example:
initially, the 1% discount price control mechanism acts as a transfer from government to consumers; and
then as the efficiency gains exceed the 1% reduction price control, and after the price control period is completed, the lag between reductions in costs to serve and costs to consumers is modelled as a retained saving, because the full benefit of the efficiency gain is not received immediately.

Economic Impact of State Infrastructure Strategy – Rebuilding NSW
53 Commercial-in-Confidence
Deloitte Access Economics
Appendix B: NSW in 2035-36 To develop a projection for the NSW economy in 2035-36 we have taken NSW Treasury’s Intergenerational Report projections for productivity and participation and combined these with the Department of Planning and Environment’s projections of population to give a view of overall economic growth.
Overall, our modelling indicates that, between 2013-14 and 2035-36 NSW real GSP is projected to grow from $495 billion (in 2013 prices) to around $868 billion (in 2013 prices), this represents an average annual growth rate of 2.6%. Some other key economic results are presented in the chart below:
Table B.1: NSW economic snapshot
2013-14 2031-32 2035-36 CAGR
GSP ($bn) 493.3 786.1 867.7 2.6%
Population (million) 7.5 9.3 9.7 1.2%
GSP per capita 65,785 84,371 89,452 1.4%
Employment (number) 3,659,379 4,435,405 4,594,648 1.0%
Source: Deloitte Access Economics
Chart B.1: NSW average annual growth rates 2013-14 to 2035-36
0.0%
0.5%
1.0%
1.5%
2.0%
2.5%
3.0%
GSP ($bn) Population(million)
GSP per capita Employment(Headcount)

Economic Impact of State Infrastructure Strategy – Rebuilding NSW
54 Commercial-in-Confidence
Deloitte Access Economics
Gross State Product
Our modelling indicates that the NSW economy will grow by approximately 2.6% a year over the period from 2013-14 to 2035-36. This figure is slightly higher than that reported in the previous SIS report due to changes in the size and composition of the population projections used.
Table B.2: Real GSP – NSW (2013 prices)
2013-14 2024-25 2031-32 2035-36
Real GSP ($ billion) 493 660 786 868
Ten year average annual growth (%) 2.69% 2.52% 2.50% NSW Treasury, 2014, DAE modelling results
Chart B.2: NSW GSP projections
Source: DAE
This projection is marginally below the NSW 20 year average growth rate (2.8%) and is also below the national average growth rate (3.2%). Lower economic growth rates should be expected in projections for advanced economies and, in this case, the main driver of lower future growth is the ageing population. Over the period productivity tends to account for slightly more of the growth rate than population and participation effects (this is discussed in more detail below).
-
100,000
200,000
300,000
400,000
500,000
600,000
700,000
800,000
900,000
1,000,000
2012 2016 2020 2024 2028 2032 2036
$m

Economic Impact of State Infrastructure Strategy – Rebuilding NSW
55 Commercial-in-Confidence
Deloitte Access Economics
Population
Population projections from the Department of Planning and Environment have been used in this baseline model. The NSW population is expected to grow at an average annual rate of 1.2% (similar to the last 30 years), rising from 7.5 million people in 2013-14 to 9.7 million people in 2035-36. A summary of these statistics is provided in the table below.
Table B.3: Population projections
2013-14 2024-25 2031-32 2035-36 Growth
2013-14 to 2035-36
Average Annual growth
NSW 7,499,323 8,631,335 9,317,649 9,700,651 29% 1.2%
Sydney 4,500,281 5,382,053 5,936,590 6,253,954 39% 1.5%
Non-metro 2,999,041 3,249,282 3,381,059 3,446,697 15% 0.6%
Central Coast 331,599 368,159 391,214 409,576 24% 1.0%
Central West 280,481 294,085 299,985 302,465 8% 0.3%
Far West 47,368 44,866 42,679 41,308 -13% -0.6%
Hunter 624,180 697,209 738,555 754,703 21% 0.9%
Illawarra 395,296 432,402 452,689 463,151 17% 0.7%
Murray 267,871 273,960 274,406 273,607 2% 0.1%
New England 185,127 193,927 197,312 198,587 7% 0.3%
North Coast 597,875 647,426 672,185 683,850 14% 0.6%
South East 269,243 297,249 312,034 319,451 19% 0.8% Source: Department of Planning and Infrastructure, 2013
These projections indicate that there is expected to be a wide range of growth rates among the regions of NSW. Sydney is expected to experience the highest level of population growth in NSW and is expected to increase in size by 39% between 2013-14 and 2035-36 (average growth across the state is 29%). The average annual growth rate for Sydney, as shown in Chart B.3 is greater than the overall growth expected in NSW as a whole due to lower growth in the non-metropolitan regions.
Of the non-metropolitan regions, Coastal NSW and the Hunter region are expected to experience population growth higher than the non-metropolitan NSW average. Inland NSW is expected to experience very low levels of population growth with the Murray and Far West NSW experiencing particularly poor growth.

Economic Impact of State Infrastructure Strategy – Rebuilding NSW
56 Commercial-in-Confidence
Deloitte Access Economics
Chart B.3: Population Shares in NSW to 2035-36
Source: DAE
Chart B.4: Average annual population growth rate, 2013-14 to 2035-36
Source: Department of Planning and Infrastructure, 2013
-
2,000,000
4,000,000
6,000,000
8,000,000
10,000,000
12,000,000
2012 2016 2020 2024 2028 2032 2036
South East
North Coast
New England
Murray
Illawarra
Hunter
Far West
Central West
Central Coast
Metro Sydney
-1.0%
-0.5%
0.0%
0.5%
1.0%
1.5%
2.0%
NS
W
Me
tro S
yd
ney
No
n-m
etr
o
Ce
ntr
al C
oa
st
Ce
ntr
al W
est
Fa
r W
est
Hu
nte
r
Illa
wa
rra
Mu
rra
y
Ne
w E
ng
land
No
rth
Co
ast
So
uth
Ea
st

Economic Impact of State Infrastructure Strategy – Rebuilding NSW
57 Commercial-in-Confidence
Deloitte Access Economics
Productivity and employment
Productivity is a crucial driver of economic growth. Over the period to 2035-36, productivity is expected to increase by around 40% across the state.
Table B.4: State labour productivity index
2013-14 2024-25 2031-32 2035-36
Index (2005-06 = 100) 110 129 144 153
Average annual growth (%) 1.48% 1.60% 1.60% Source: NSW Treasury, 2011
As part of the Intergenerational Report, NSW Treasury has projected labour force participation in NSW to peak at around 64% in 2014-15 and steadily fall through the projection period. This is driven by demographic trends – namely the ageing of the population. Updating this projection to take into account the Department of Planning and Environment’s recent projections of population results in a minor decrease in the projected participation rate; both projections are shown in the chart below.
Chart B.5: Labour force participation rate - NSW
Source: NSW Treasury, 2013
60%
61%
62%
63%
64%
65%
2012 2016 2020 2024 2028 2032 2036
Baseline 2011
Baseline 2014

Economic Impact of State Infrastructure Strategy – Rebuilding NSW
58 Commercial-in-Confidence
Deloitte Access Economics
Between 2010-11 and 2035-36 the level of employment in NSW is expected to grow at an average annual rate of 1.0%, from 3.0 million workers to 3.7 million workers. These employment projections are based on population projections from the Department of Planning and Environment and participation and unemployment projections from the NSW Treasury’s intergenerational report
Table B.5: Employment level (millions)– NSW
2013-14 2024-25 2031-32 2035-36 Growth
2013-14 to 2035-36
Average Annual growth
NSW 2,954,118 3,352,982 3,577,515 3,708,162 26% 1.0%
Metro Sydney 1,926,007 2,262,215 2,466,684 2,586,230 34% 1.3%
Non-metro 1,028,111 1,090,767 1,110,831 1,121,932 9% 0.4%
Central Coast 88,558 96,648 100,542 104,705 18% 0.8%
Central West 112,460 116,088 116,295 116,357 3% 0.2%
Far West 17,648 15,956 14,763 14,145 -20% -1.0%
Hunter 245,047 269,896 281,524 285,761 17% 0.7%
Illawarra 119,988 129,037 132,291 134,209 12% 0.5%
Murray 109,230 109,584 107,071 105,629 -3% -0.2%
New England 71,629 73,725 73,738 73,735 3% 0.1%
North Coast 178,862 188,341 190,767 192,236 7% 0.3%
South East 84,690 91,492 93,839 95,154 12% 0.5%
Source: NSW Treasury, 2013: Forecast average annual employment growth rates 2013-14 to 2035-36
Chart B.6: Average annual employment growth, 2013-14 to 2035-36
Source: Deloitte Access Economics -1.5%
-1.0%
-0.5%
0.0%
0.5%
1.0%
1.5%
NS
W
Me
tro S
yd
ney
No
n-m
etr
o
Ce
ntr
al C
oa
st
Ce
ntr
al W
est
Far
West
Hu
nte
r
Illa
warr
a
Mu
rra
y
Ne
w E
ngla
nd
No
rth
Coa
st
South
East

Economic Impact of State Infrastructure Strategy – Rebuilding NSW
59 Commercial-in-Confidence
Deloitte Access Economics
Gross Regional Product
The differences in GRP across the regions mainly reflect differences in population growth and demographic composition. For example, population in metro Sydney is expected to grow at an average annual rate of around 1.5% a year over the period to 2035-36 (compared to the state average of 1.2%) this results in Metro Sydney’s GRP growing at around 2.9% a year compared to state-wide growth of about 2.6% a year.
Average annual GRP growth The coastal regions of NSW are expected to grow more strongly than inland areas in terms of GRP over the period to 2035-36. The South East and North Coast, for example, are expected to grow by 2.0% and 1.8% a year respectively compared to growth of 1.3% a year in the Murray region and 0.5% a year in the Far West region. The lower than average growth in inland regions is largely a result of lower than average population growth. As shown in the following section, these two factors tend to balance out to result in fairly similar GRP per capita growth throughout the state.
Chart B.7: Average annual GRP growth, 2013-14 to 2035-36
Source: Deloitte Access Economics
0.0%
0.5%
1.0%
1.5%
2.0%
2.5%
3.0%
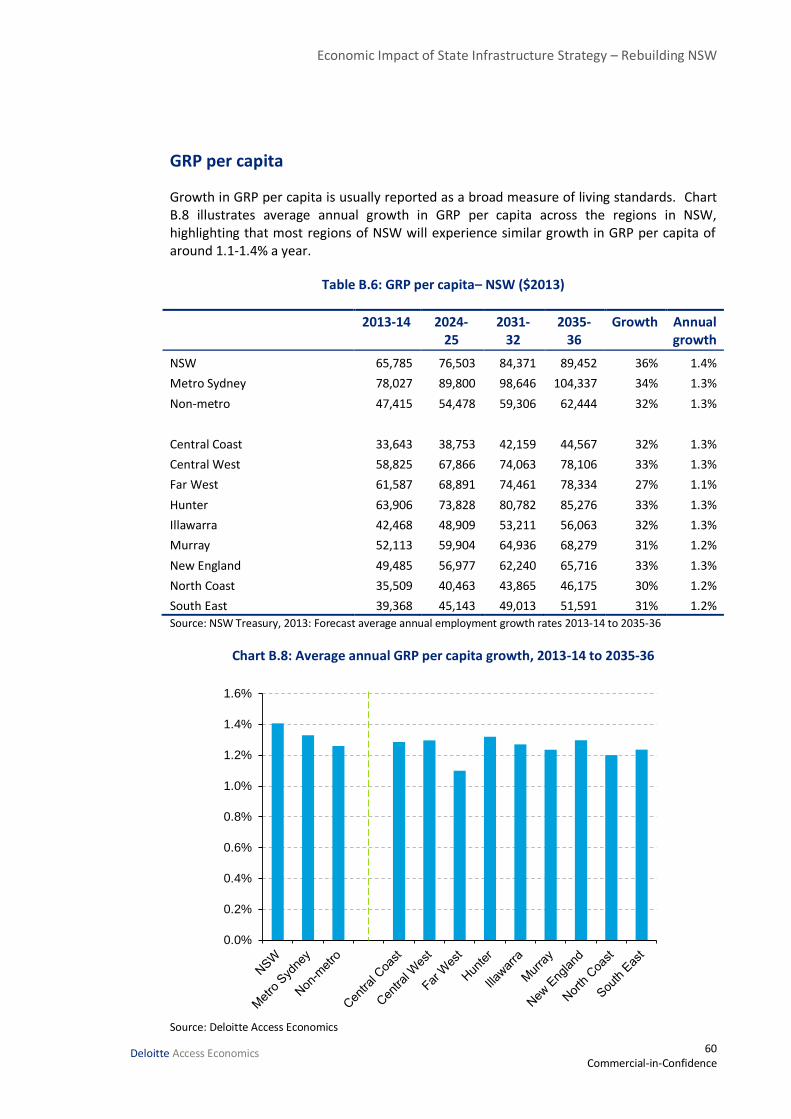
Economic Impact of State Infrastructure Strategy – Rebuilding NSW
60 Commercial-in-Confidence
Deloitte Access Economics
GRP per capita
Growth in GRP per capita is usually reported as a broad measure of living standards. Chart B.8 illustrates average annual growth in GRP per capita across the regions in NSW, highlighting that most regions of NSW will experience similar growth in GRP per capita of around 1.1-1.4% a year.
Table B.6: GRP per capita– NSW ($2013)
2013-14 2024-25
2031-32
2035-36
Growth Annual growth
NSW 65,785 76,503 84,371 89,452 36% 1.4%
Metro Sydney 78,027 89,800 98,646 104,337 34% 1.3%
Non-metro 47,415 54,478 59,306 62,444 32% 1.3%
Central Coast 33,643 38,753 42,159 44,567 32% 1.3%
Central West 58,825 67,866 74,063 78,106 33% 1.3%
Far West 61,587 68,891 74,461 78,334 27% 1.1%
Hunter 63,906 73,828 80,782 85,276 33% 1.3%
Illawarra 42,468 48,909 53,211 56,063 32% 1.3%
Murray 52,113 59,904 64,936 68,279 31% 1.2%
New England 49,485 56,977 62,240 65,716 33% 1.3%
North Coast 35,509 40,463 43,865 46,175 30% 1.2%
South East 39,368 45,143 49,013 51,591 31% 1.2%
Source: NSW Treasury, 2013: Forecast average annual employment growth rates 2013-14 to 2035-36
Chart B.8: Average annual GRP per capita growth, 2013-14 to 2035-36
Source: Deloitte Access Economics
0.0%
0.2%
0.4%
0.6%
0.8%
1.0%
1.2%
1.4%
1.6%

Economic Impact of State Infrastructure Strategy – Rebuilding NSW
61 Commercial-in-Confidence
Deloitte Access Economics
Appendix C: NSW regions and industries in 2035-36 As is shown in the table below, the structure of the NSW economy is expected to change slowly over the period to 2035-36 with most industries expected to grow within the region of 1.1-2.9% a year.
Table C.1: Industry shares and growth rates, 2013-14 to 2035-36
Industry Average annual growth rate Share in 2036-36
Financial and Insurance Services 2.9% 15.3%
Professional, Scientific and Technical Services
2.7% 9.3%
Manufacturing 2.1% 7.9%
Health Care and Social Assistance 2.8% 7.9%
Construction 2.8% 6.5%
Public Administration and Safety 2.8% 6.2%
Education and Training 2.5% 5.6%
Transport, Postal and Warehousing 2.4% 5.3%
Wholesale Trade 2.9% 5.5%
Retail Trade 2.8% 5.3%
Information Media and Telecommunications
2.5% 4.8%
Administrative and Support Services 2.7% 4.0%
Accommodation and Food Services 2.7% 3.2%
Rental, Hiring and Real Estate Services 2.7% 3.2%
Electricity, Gas, Water and Waste Services 2.3% 2.7%
Mining 1.1% 2.3%
Other Services 2.9% 2.3%
Agriculture, Forestry and Fishing 1.2% 1.4%
Arts and Recreation Services 2.8% 1.2%
The finance and insurance industry is expected to maintain its position as the largest industry in NSW, as it is expected to grow at an average annual rate of 2.9%. Other service based industries – including professional, scientific and technical services, health care and social assistance and education – are also expected to experienced growth slightly above the level seen in the economy overall in this period.
The following sections provide a more detailed, regional view of the expected composition of NSW’s economy over the period to 2035-36. For this analysis, we first examine NSW, Metro NSW, and Non-Metro NSW. Given that our modelling has encompassed nine sub regions, we will examine four key sub regions: North Coast, Hunter, Illawarra, and Murray. The other eight regions have been aggregated as “rest of NSW”.

Economic Impact of State Infrastructure Strategy – Rebuilding NSW
62 Commercial-in-Confidence
Deloitte Access Economics
NSW
The growth projected for the NSW economy is expected to be driven by growth in service industries particularly in advancements in technology (information media and telecommunications) and health care. Continuing the downward trend of the last decade, manufacturing is expected to decline as a share of the state’s economy over the next 20 years, as will agriculture, forestry and fishing. Mining is also expected to decline over the projection period as prices continue to moderate from their recent historically high levels.
Finance and insurance is expected to remain the largest industry (by share of value add) in 2035-36.
Chart C.1: Industry structure – NSW
Source: Deloitte Access Economics
0% 5% 10% 15% 20%
Other Services
Arts and Recreation Services
Health Care and Social Assistance
Education and Training
Public Administration and Safety
Administrative and Support Services
Professional, Scientific and Technical Services
Rental, Hiring and Real Estate Services
Financial and Insurance Services
Information Media and Telecommunications
Transport, Postal and Warehousing
Accommodation and Food Services
Retail Trade
Wholesale Trade
Construction
Electricity, Gas, Water and Waste Services
Manufacturing
Mining
Agriculture, Forestry and Fishing
2013-14 2024-25 2031-32 2035-36
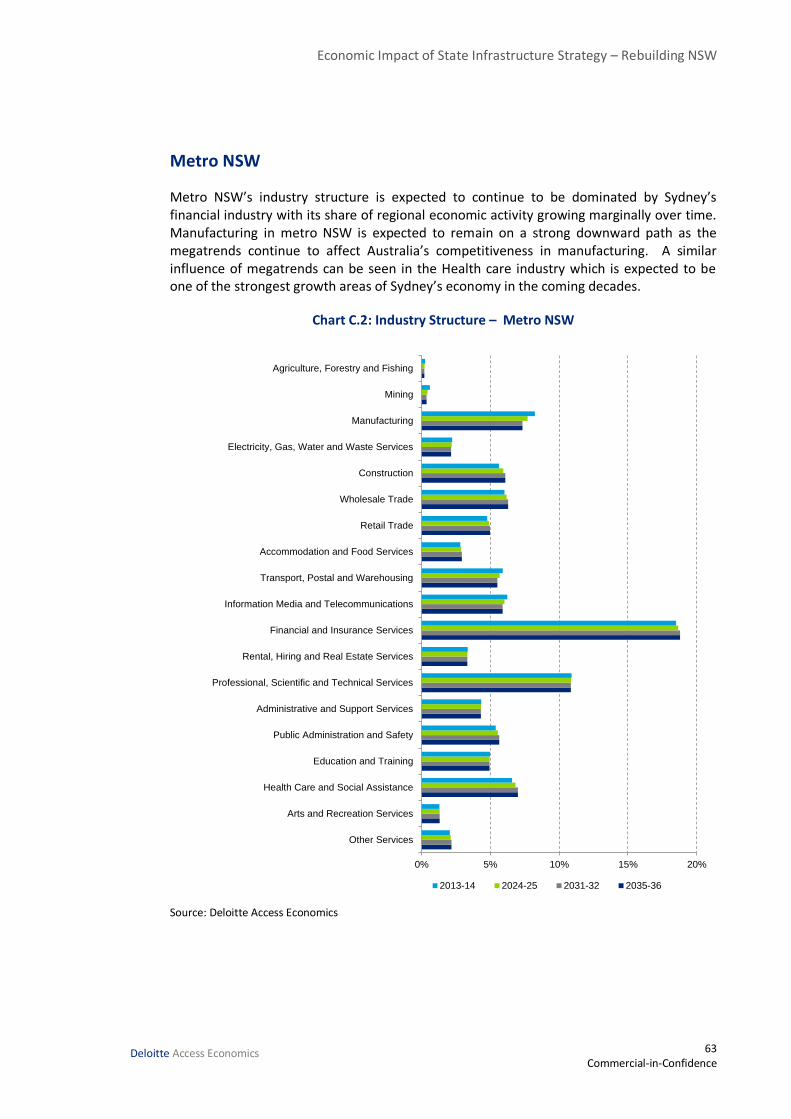
Economic Impact of State Infrastructure Strategy – Rebuilding NSW
63 Commercial-in-Confidence
Deloitte Access Economics
Metro NSW
Metro NSW’s industry structure is expected to continue to be dominated by Sydney’s financial industry with its share of regional economic activity growing marginally over time. Manufacturing in metro NSW is expected to remain on a strong downward path as the megatrends continue to affect Australia’s competitiveness in manufacturing. A similar influence of megatrends can be seen in the Health care industry which is expected to be one of the strongest growth areas of Sydney’s economy in the coming decades.
Chart C.2: Industry Structure – Metro NSW
Source: Deloitte Access Economics
0% 5% 10% 15% 20%
Other Services
Arts and Recreation Services
Health Care and Social Assistance
Education and Training
Public Administration and Safety
Administrative and Support Services
Professional, Scientific and Technical Services
Rental, Hiring and Real Estate Services
Financial and Insurance Services
Information Media and Telecommunications
Transport, Postal and Warehousing
Accommodation and Food Services
Retail Trade
Wholesale Trade
Construction
Electricity, Gas, Water and Waste Services
Manufacturing
Mining
Agriculture, Forestry and Fishing
2013-14 2024-25 2031-32 2035-36

Economic Impact of State Infrastructure Strategy – Rebuilding NSW
64 Commercial-in-Confidence
Deloitte Access Economics
Non Metro NSW
Non Metro NSW displays some common characteristics with metro NSW as service sectors grow while Manufacturing is expected to continue to decline as a share of the region’s economy. The traditional sectors of the urban components of regional economies (construction and retail) largely maintain their industry shares over the projection period.
Chart C.3: Industry structure – Non Metro NSW
Source: Deloitte Access Economics
0% 2% 4% 6% 8% 10% 12%
Other Services
Arts and Recreation Services
Health Care and Social Assistance
Education and Training
Public Administration and Safety
Administrative and Support Services
Professional, Scientific and Technical Services
Rental, Hiring and Real Estate Services
Financial and Insurance Services
Information Media and Telecommunications
Transport, Postal and Warehousing
Accommodation and Food Services
Retail Trade
Wholesale Trade
Construction
Electricity, Gas, Water and Waste Services
Manufacturing
Mining
Agriculture, Forestry and Fishing
2013-14 2024-25 2031-32 2035-36

Economic Impact of State Infrastructure Strategy – Rebuilding NSW
65 Commercial-in-Confidence
Deloitte Access Economics
Subregions
The following sections focus on the regions of the North Coast, Hunter, Illawarra and Murray before providing a summary for the rest of NSW. These regions have been selected as they present some notable departures from the more highly aggregated results above.
North Coast The North Coast’s economy will continue to be dominated by Health Care and Social Assistance. This is consistent with the demographic profile of the North Coast and the megatrend of ageing, health care and social assistance will increase as a share of industry value add over the coming decades.
Chart C.4: Industry structure – North Coast
Source: Deloitte Access Economics
0% 5% 10% 15% 20%
Other Services
Arts and Recreation Services
Health Care and Social Assistance
Education and Training
Public Administration and Safety
Administrative and Support Services
Professional, Scientific and Technical Services
Rental, Hiring and Real Estate Services
Financial and Insurance Services
Information Media and Telecommunications
Transport, Postal and Warehousing
Accommodation and Food Services
Retail Trade
Wholesale Trade
Construction
Electricity, Gas, Water and Waste Services
Manufacturing
Mining
Agriculture, Forestry and Fishing
2013-14 2024-25 2031-32 2035-36

Economic Impact of State Infrastructure Strategy – Rebuilding NSW
66 Commercial-in-Confidence
Deloitte Access Economics
Hunter
Over the next 20 years, economic growth in the Hunter region will lead to a reduction in the importance of mining and manufacturing as the region continues to diversify into areas such as health care, finance and professional services.
Chart C.5: Industry structure – Hunter
Source: Deloitte Access Economics
0% 5% 10% 15% 20%
Other Services
Arts and Recreation Services
Health Care and Social Assistance
Education and Training
Public Administration and Safety
Administrative and Support Services
Professional, Scientific and Technical Services
Rental, Hiring and Real Estate Services
Financial and Insurance Services
Information Media and Telecommunications
Transport, Postal and Warehousing
Accommodation and Food Services
Retail Trade
Wholesale Trade
Construction
Electricity, Gas, Water and Waste Services
Manufacturing
Mining
Agriculture, Forestry and Fishing
2013-14 2024-25 2031-32 2035-36
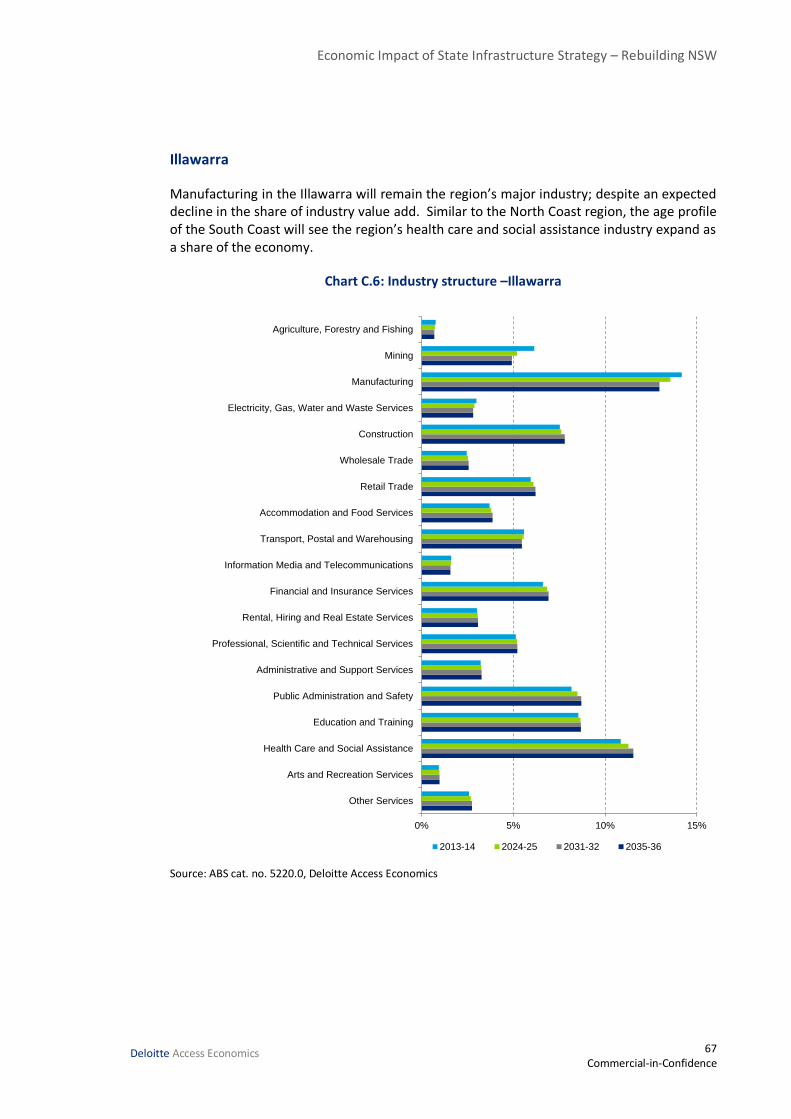
Economic Impact of State Infrastructure Strategy – Rebuilding NSW
67 Commercial-in-Confidence
Deloitte Access Economics
Illawarra
Manufacturing in the Illawarra will remain the region’s major industry; despite an expected decline in the share of industry value add. Similar to the North Coast region, the age profile of the South Coast will see the region’s health care and social assistance industry expand as a share of the economy.
Chart C.6: Industry structure –Illawarra
Source: ABS cat. no. 5220.0, Deloitte Access Economics
0% 5% 10% 15%
Other Services
Arts and Recreation Services
Health Care and Social Assistance
Education and Training
Public Administration and Safety
Administrative and Support Services
Professional, Scientific and Technical Services
Rental, Hiring and Real Estate Services
Financial and Insurance Services
Information Media and Telecommunications
Transport, Postal and Warehousing
Accommodation and Food Services
Retail Trade
Wholesale Trade
Construction
Electricity, Gas, Water and Waste Services
Manufacturing
Mining
Agriculture, Forestry and Fishing
2013-14 2024-25 2031-32 2035-36

Economic Impact of State Infrastructure Strategy – Rebuilding NSW
68 Commercial-in-Confidence
Deloitte Access Economics
Murray
The decline in the manufacturing industry’s share of regional industry value added is also reflected in the Murray region. Of the four sub-regions analysed, the Murray region has the greatest share of its industry value add derived from agriculture. Industries anticipating growth include health care and social assistance and public administration and safety.
Chart C.7: Industry structure – Murray
Source: Deloitte Access Economics
0% 5% 10% 15%
Other Services
Arts and Recreation Services
Health Care and Social Assistance
Education and Training
Public Administration and Safety
Administrative and Support Services
Professional, Scientific and Technical Services
Rental, Hiring and Real Estate Services
Financial and Insurance Services
Information Media and Telecommunications
Transport, Postal and Warehousing
Accommodation and Food Services
Retail Trade
Wholesale Trade
Construction
Electricity, Gas, Water and Waste Services
Manufacturing
Mining
Agriculture, Forestry and Fishing
2013-14 2024-25 2031-32 2035-36

Economic Impact of State Infrastructure Strategy – Rebuilding NSW
69 Commercial-in-Confidence
Deloitte Access Economics
Appendix D: Driving forces of infrastructure demand Over the period to 2036, the NSW economy will be heavily influenced by a number of megatrends which are largely beyond the control of any level of Australian Government. These trends are not temporary phenomena but will exert continuing pressure on the economy. It is therefore critical that long term investments, such as infrastructure, are made in light of the effect that these megatrends will have on the economy and society.
Of particular relevance for infrastructure investments in NSW are the effects of:
Population growth and demographics;
Economic development in Asia;
Environmental change; and
The digital economy.
Population growth and demographics
The shifting demographics of NSW, both in terms of population growth and ageing, is one of the most fundamental long term economic drivers for the state. Population changes are of particular importance for infrastructure investment decisions. Changes in population and demographics will initially affect the economy by changing the relative size of the workforce. Second round effects of population on the economy will come through demand for age specific infrastructure (such as schools and aged care) as well as through congestion and housing.
Since 2000-01 Australia’s population has increased by around 3.8 million (which is over 296,000 people per year). This has been the highest level of growth in Australia’s history and, with population growth rates since 2008 averaging around 1.7% a year; it has also been the highest rate of population increase since the early 1970s (ABS, 2008).
However, population growth in NSW (being around 1.3% a year) has been below the national average due to relatively high net interstate migration losses (ABS, 2014). Despite this, NSW’s population has still increased by around 880,000 since 2000-01 (ABS, 2011a).
Baseline population projection
Population growth rates for NSW’s regions are projected by the Department of Planning and Environment. Since our previous report for Infrastructure NSW, the Department of Planning and Environment has updated their population projections (DP&E 2014a). The updated projections are used in this report, with comparisons to the 2010 population projections used in the previous report.
Comparing the two projections over the period from 2011-12 to 2031-32 (as 2031-32 was the final year reported in the last report), the newer population projections from the Department of Planning and Environment indicate
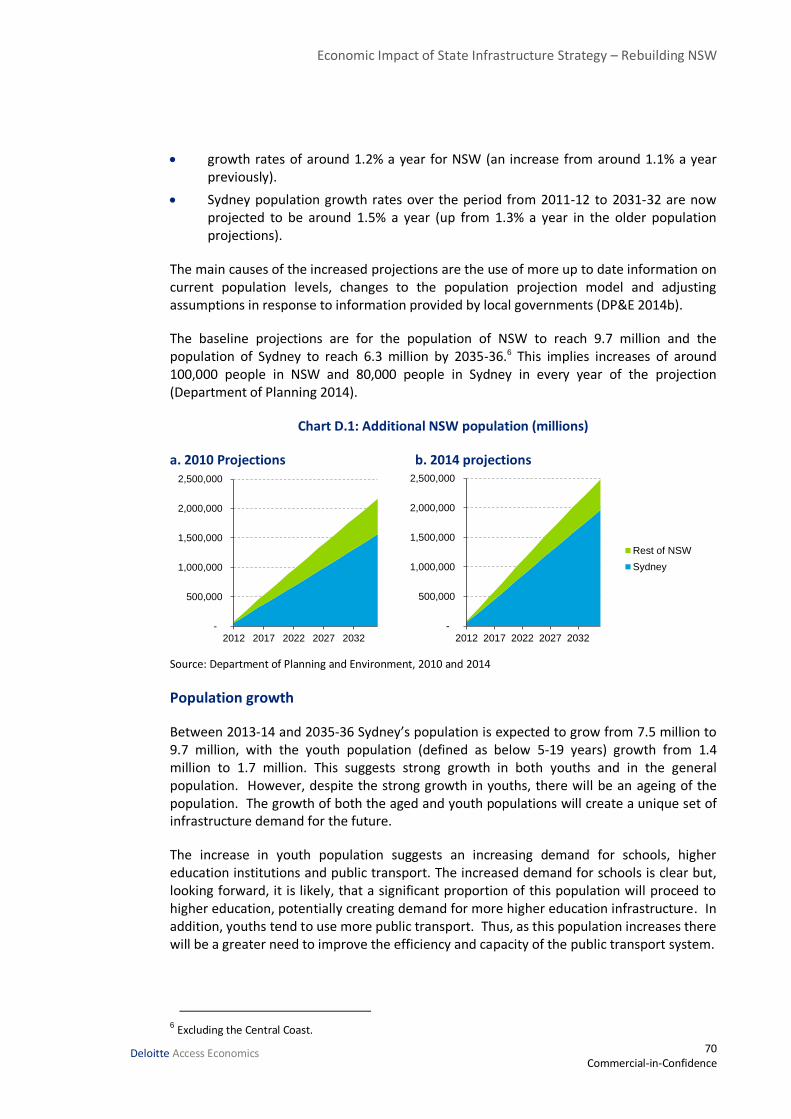
Economic Impact of State Infrastructure Strategy – Rebuilding NSW
70 Commercial-in-Confidence
Deloitte Access Economics
growth rates of around 1.2% a year for NSW (an increase from around 1.1% a year previously).
Sydney population growth rates over the period from 2011-12 to 2031-32 are now projected to be around 1.5% a year (up from 1.3% a year in the older population projections).
The main causes of the increased projections are the use of more up to date information on current population levels, changes to the population projection model and adjusting assumptions in response to information provided by local governments (DP&E 2014b).
The baseline projections are for the population of NSW to reach 9.7 million and the population of Sydney to reach 6.3 million by 2035-36.6 This implies increases of around 100,000 people in NSW and 80,000 people in Sydney in every year of the projection (Department of Planning 2014).
Chart D.1: Additional NSW population (millions)
a. 2010 Projections b. 2014 projections
Source: Department of Planning and Environment, 2010 and 2014
Population growth
Between 2013-14 and 2035-36 Sydney’s population is expected to grow from 7.5 million to 9.7 million, with the youth population (defined as below 5-19 years) growth from 1.4 million to 1.7 million. This suggests strong growth in both youths and in the general population. However, despite the strong growth in youths, there will be an ageing of the population. The growth of both the aged and youth populations will create a unique set of infrastructure demand for the future.
The increase in youth population suggests an increasing demand for schools, higher education institutions and public transport. The increased demand for schools is clear but, looking forward, it is likely, that a significant proportion of this population will proceed to higher education, potentially creating demand for more higher education infrastructure. In addition, youths tend to use more public transport. Thus, as this population increases there will be a greater need to improve the efficiency and capacity of the public transport system.
6 Excluding the Central Coast.
-
500,000
1,000,000
1,500,000
2,000,000
2,500,000
2012 2017 2022 2027 2032
-
500,000
1,000,000
1,500,000
2,000,000
2,500,000
2012 2017 2022 2027 2032
Rest of NSW
Sydney

Economic Impact of State Infrastructure Strategy – Rebuilding NSW
71 Commercial-in-Confidence
Deloitte Access Economics
A second major demographic change impacting Sydney and, indeed, the rest of Australia and much of the developed world is the ageing of the population. The ageing of the population is a function of both the mid-20th Century baby boom and steady increases in life expectancy. The Australian Government’s Intergenerational Report indicates that life expectancy for Australians is currently around 80 years for men and 84 years for women and that life expectancy is expected to increase over the coming decades (Australian Government, 2010). Similarly, fertility rates steadily declined from 3.5 in 1961 to 1.9 in 1980 and have been largely stable over the last three decades, with fertility rates in 2012 also being 1.9 babies per woman (ABS 2013).
Overall, the ageing of the population can be seen in changes in the aged dependency ratio (those over 65 compared to those within working age). The aged dependency ratio in NSW is expected to increase from around 24.4% in 2015-16 to around 34.5% by 2035-36 (NSW Treasury, 2011). The more recent population projections from the Department of Planning and Environment (2014) indicate results very similar to those from Treasury (2011) for NSW with rates increasing to around 34.3% by 2036.
Our modelling suggests that the proportion of people above 65 years old will increase from 15% in 2013-14 to 21% in 2035-36. The aging population is expected to increase demand for hospitals and associated aged care facilities and change the demand for housing and the composition of the existing housing stock. As the population ages, there is a reduced demand for large houses, since dependents are likely to have established their own houses. Thus there will be a need to redevelop housing to enable downsizing.
In sum, population growth affects all areas of infrastructure demand. Two particular trends likely to affect NSW are associated with growing youth and aged populations. Increased youth populations are likely to result in greater demand for schools and public transport while an ageing population raises issues of housing stock, hospitals and aged care facilities.
Congestion
Congestion is not a fundamental economic driver; rather, it is a sign of mismatches between past planning and infrastructure decisions and population increases. These mismatches create congestion which can have serious effects on economic activity and reduce the desirability of living in Sydney and NSW.
The economic effects of congestion include reduced productivity for road transport (the higher costs then flow on through the economy), lost leisure time for individuals and distortion of housing, work and transport decisions. Congestion also affects the desirability of Sydney overall and so makes it difficult to attract and retain highly skilled, mobile workers.
Projections from BITRE (2007) indicate that congestion costs are expected to increase significantly in Sydney over the coming years from around $6.5 billion a year in 2016 to around $7.8 billion a year in 2020 (a 20% increase). Applying the relationship between population and congestion costs seen in the BITRE projections suggests that these congestion costs could reach around $29 billion a year by 2036.
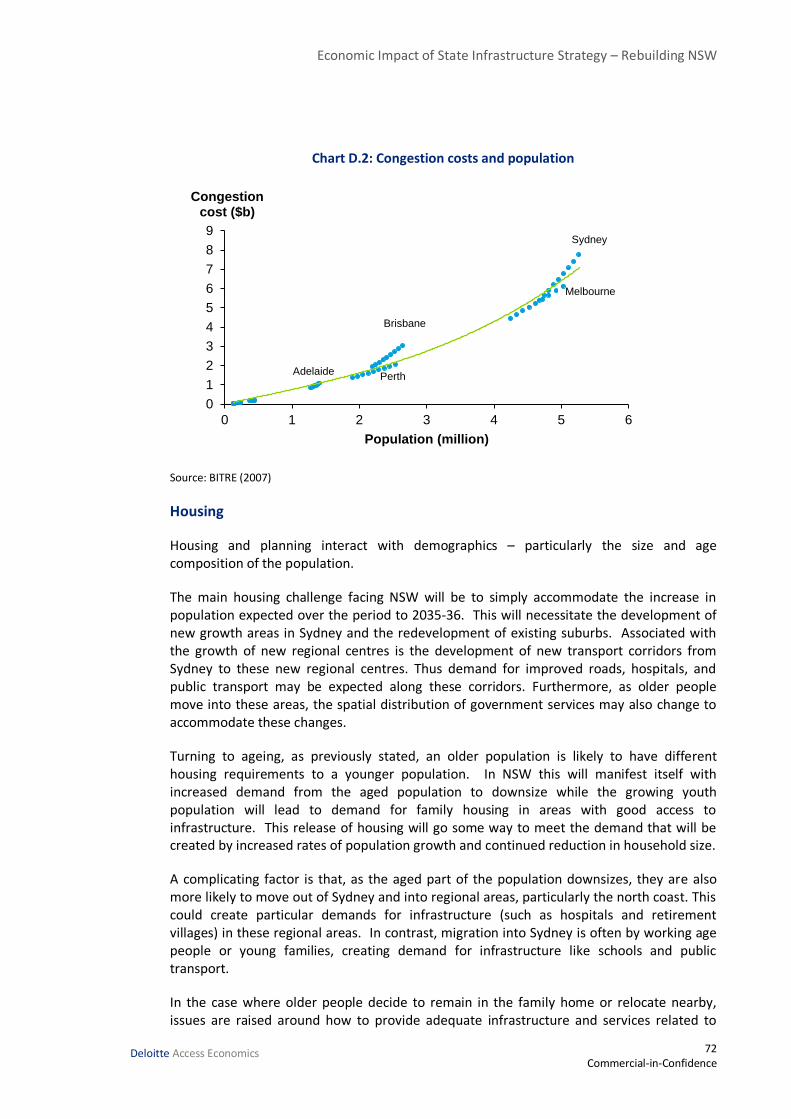
Economic Impact of State Infrastructure Strategy – Rebuilding NSW
72 Commercial-in-Confidence
Deloitte Access Economics
Chart D.2: Congestion costs and population
Source: BITRE (2007)
Housing
Housing and planning interact with demographics – particularly the size and age composition of the population.
The main housing challenge facing NSW will be to simply accommodate the increase in population expected over the period to 2035-36. This will necessitate the development of new growth areas in Sydney and the redevelopment of existing suburbs. Associated with the growth of new regional centres is the development of new transport corridors from Sydney to these new regional centres. Thus demand for improved roads, hospitals, and public transport may be expected along these corridors. Furthermore, as older people move into these areas, the spatial distribution of government services may also change to accommodate these changes.
Turning to ageing, as previously stated, an older population is likely to have different housing requirements to a younger population. In NSW this will manifest itself with increased demand from the aged population to downsize while the growing youth population will lead to demand for family housing in areas with good access to infrastructure. This release of housing will go some way to meet the demand that will be created by increased rates of population growth and continued reduction in household size.
A complicating factor is that, as the aged part of the population downsizes, they are also more likely to move out of Sydney and into regional areas, particularly the north coast. This could create particular demands for infrastructure (such as hospitals and retirement villages) in these regional areas. In contrast, migration into Sydney is often by working age people or young families, creating demand for infrastructure like schools and public transport.
In the case where older people decide to remain in the family home or relocate nearby, issues are raised around how to provide adequate infrastructure and services related to
0
1
2
3
4
5
6
7
8
9
0 1 2 3 4 5 6
Congestion cost ($b)
Population (million)
Perth
Brisbane
Sydney
Melbourne
Adelaide

Economic Impact of State Infrastructure Strategy – Rebuilding NSW
73 Commercial-in-Confidence
Deloitte Access Economics
health, community support and transport. This scenario would also have implications for the supply of larger residential properties in established areas and the spatial distribution of other government services including education. More precisely, what may be expected is a greater development of smaller properties e.g. apartments to accommodate the demands of older people. Associated with this may be the shrinkage in the stock of large family homes, since property developers’ may develop these properties into new smaller residences.
The two speed economy and the rise of Asia
Australia’s two speed economy is fundamentally being caused by economic development in emerging economies. This development has created increased demand for inputs to industrial production (particularly iron and coal) which has benefited mineral exports. Increased demand for Australian minerals has not only drawn real economic resources into these industries but has also increased the value of the Australian dollar. This creates pressures in other industries, which must cope with higher input costs and a deterioration of international competitiveness.
The role of emerging economies
Over the past 10 years the geographical centre of global economic activity has been shifting rapidly towards Asia (McKinsey 2012). This has been driven by fast paced economic development in east and south east Asia. Arising from this, there have been significant changes in Australia’s main export and import partners, with countries in Asia now playing a much larger role in Australia’s trade relationships.
Figure D.1: Global economic centre of gravity
Source: McKinsey (2012)
Over the last ten years, China has dominated global growth. Since 2000, Chinese GDP per person has grown at an average rate of around 9.0% a year, in real terms, which means that wealth per person, would be expected to double in size about every 8 years. This could be compared to Australia, a relatively successful developed country, which has seen real GDP per capita grow at around 3.0% a year over the same period, implying a doubling tie of around 23 years.

Economic Impact of State Infrastructure Strategy – Rebuilding NSW
74 Commercial-in-Confidence
Deloitte Access Economics
There are other countries in Asia which, although they have been developing strongly, still have considerable potential for further economic development. Primary among these is India but also countries like Indonesia and Vietnam, which have large populations and are achieving high rates of economic growth.
Overall, development in emerging economies has driven a significant increase in volumes traded through Australia’s ports. Since 2000-01 the containerised volume being traded through ports operated by Sydney Ports Corporation has increased by around 6.6% a year, on average (Ports Australia 2014), while NSW GSP has increased by only around 2.0% a year on average (ABS, 2013a). That is, for every million dollars of GSP in 2000-01 there were around 3 TEUs moved through Sydney’s Ports, while by 2012-13 this had increased to 4.5 TEUs.
This growing importance of trade with countries near Australia has, of course, been driven by patterns with individual trading partners. Australia’s trade tends to be concentrated on a small number of markets, trade with our top five partners accounts for around 50% of total trade over the past 20 years. Changes in the pattern of trade with these top five partners are therefore important in determining the composition of Australia’s trade.
As our trading partners develop, they demand different exports from us and supply different imports to us. For example, Australian exports to China in 1990 tended to be relatively low value food and fibre products. On the import side, imports tended to be dominated by clothes and other products produced from textiles. In this sense Australia was tending to export the material for clothes production and import the finished goods. By 2013, the pattern of trade between Australia and China had completely changed. The role for iron ore and coal increased dramatically. This reflects the industrialisation of China over the past 25 years and the strong demand for steel that goes along with that. Other inputs to industrial production, gold and copper, have also entered the top five. An even greater change occurred in imports where, by 2013, the top import categories were dominated by information technology.
Over the next 20 years the development of our trading partners will likely mean that demand for Australia’s mineral exports increases in line with continued industrialisation in China and other developing countries such as India and Vietnam (Australian Government, 2011).
In terms of direct infrastructure effects, the continued presence of emerging markets mean a continued increase in the sheer volume of goods that must be moved through NSW’s ports, the need to distribute goods efficiently within our cities and a potential shift in the mix of bulk and containerised freight. Indirectly, emerging markets will also continue to foster the two-speed economy in Australia and so will have further effects, discussed below.

Economic Impact of State Infrastructure Strategy – Rebuilding NSW
75 Commercial-in-Confidence
Deloitte Access Economics
Influence on industry structure
The two-speed economy is likely to be mostly felt in terms of the state’s sectoral composition. The effects of the two-speed economy will be complex and will create growth in some industries, wealth for some consumers and while constraining other industries.
On one side, higher prices and increased demand for output from industries in which Australia has a competitive advantage, such as mining and agriculture, will lead to growth in these sectors (Hogan & Morris, 2010) and will create significant wealth for Australians.
An example of increased infrastructure pressure resulting from the positive side of the two speed economy is in the black coal sector, which is mostly transported by rail. NSW accounts for around 47 per cent of Australia’s black coal production, and production is expected to rise over coming years (DRET, 2011b). Projections of demand for port capacity at Newcastle have indicated that infrastructure investment will likely need to take place over the next 5 years or so in order to avoid reaching capacity constraints.
Increased demand for these exports will help maintain a historically high terms of trade, this will constrain growth in other trade-exposed sectors where Australia does not have a clear competitive advantage (such as basic manufacturing). Other states have seen this effect through booms in the mining sector and contractions in heavy industry. The presence of an increased exchange rate and strong competition in labour and capital markets is generally known as the “Dutch Disease”. The classic formulation of the Dutch Disease involves an expansion in the mining sector which then draws away economic resources from other industries, potentially leading to the long term decline of these other industries.
Considering the terms of trade in more detail, the chart below from Treasury (2014) indicates that Australia’s terms of trade have strengthened significantly since 2000. The projection for the terms of trade indicates that they are likely to decline substantially but to remain above the long term average rate. The expected decline in the terms of trade will have mixed effects on the economy. On the consumption side it will result in reduced real incomes as the price of imports increases. On the production side of the economy there will, however, be benefits as Australian goods become relatively cheaper and more competitive in export markets.
Chart D.3: Historical and projected terms of trade for Australia
Source: Treasury (2014)

Economic Impact of State Infrastructure Strategy – Rebuilding NSW
76 Commercial-in-Confidence
Deloitte Access Economics
The other effect of the two speed economy will come through the increase in wealth in Asia. This will create demand for the export of Australian services such as finance and tourism. By 2035-36, the finance industry will likely remain the largest industry in Sydney, as Asia emerges residents of these countries will increasingly seek to invest capital overseas. Australia will be an attractive destination to park some of these funds due to our geographic proximity and our developed rule of law. Sydney would be one of the key destinations to channel these funds since it has a well-established finance industry compared to all other Australian cities. The demand for financial services will also increase and with a greater demand for infrastructure such as telecommunications lines and other ICT related infrastructure. This raises questions of the ability of state’s infrastructure to enable NSW to capture this increased demand.
The balance between these various effects of the two-speed economy will change over time. In the medium term, it is unclear whether the net effects of the two speed economy will be positive or negative for NSW. The potential benefits for NSW in terms of energy, tourism, education and financial exports are strong but with a number of factors affecting the state’s overall economic performance (particularly relative to other Australian states):
Tourism: NSW is losing its dominance in the share of international travellers, but with China having overtaken Japan as the main source of tourists, it may be that a declining share will still see large increases in total tourist numbers. The main implication is for transport with capacity at airports being a particular concern.
Manufacturing: is expected to decline in relative terms, but imported goods will still put pressure on existing transport networks.
Over the longer run, however, the pressures of the two speed economy will likely shift as developing nations in Asia begin to demand services such as education and tourism. This increased demand will likely see a reverse of the short run trends (where tourism and education were particularly affected) as the positive influence of demand increases swamp the negative influences of foreign exchange appreciation. At the same time, substitution of Australian produced services for domestic services may lead to declines in some other service sectors.

Economic Impact of State Infrastructure Strategy – Rebuilding NSW
77 Commercial-in-Confidence
Deloitte Access Economics
Environmental change
From an infrastructure perspective, over the period to 2036, the most important environmental change is likely to be a reduction in the availability of water for use in production. This is likely to be a result of both a reduction in rainfall as well as an increase in environmental uses of water.
Considering the rainfall side first, in the decades ahead, climate change may begin to have an effect on the availability of water in NSW. There will be reduced and more variable water supplies for agriculture, particularly in the Murray-Darling Basin and along the north coast.
Figure D.2: Projected Average change in rainfall by 2050
Source: Department of Environment, Climate Change and Water (2010)
Having said this, a critical factor affecting the Murray-Darling Basin, agriculture west of the Great Dividing Range, and overall regional economic and population growth in coming years will be decisions over water entitlements and allocations.
To minimise the potential impact of reduced water supplies it will be important that productivity improvements in irrigation areas are pursued. This could involve efficiency-enhancing investments in water delivery infrastructure, which also aim to improve

Economic Impact of State Infrastructure Strategy – Rebuilding NSW
78 Commercial-in-Confidence
Deloitte Access Economics
environmental flows, as well as fostering new businesses in water management (Roberts, Mitchell, & Douglas, 2006).
The effects of climate change, particularly when combined with population growth in some regional centres also raise critical questions for the security of town water supplies in regional NSW. Improvements in urban water supply necessary to account for population growth and reduced water availability will need to incorporate both increases in the capacity to supply town water (through improvements in water collection) and the ability to transport town water through renewing and maintaining town water infrastructure.
Digital Economy
The digital economy and information and communications technology (ICT) have a somewhat unique role to play among the drivers considered so far:
Development of the digital economy will require ICT infrastructure investment in its own right.
The digital economy will potentially drive changes in the patterns of demand for infrastructure, e.g. reducing demand for transport in the CBD whilst increasing demand in other centres and increasing needs for smart infrastructure.
The digital economy will allow workers to be more productive somewhat offsetting costs associated with poor access to other forms of infrastructure.
The digital economy will affect industry structures and competitiveness throughout the economy.
For example, businesses in Australia are currently investing in a number of high speed internet networks, these network upgrades will initially involve significant physical infrastructure. Once complete, this infrastructure investment will create a multitude of flow on effects in other industries: improved ability to telework will affect demand for travel, potentially reducing congestion in the CBD, telehealth will allow for reduced investment in physical hospital infrastructure and better machine to machine communications may allow for improved maintenance of other significant built infrastructure (such as bridges and pipelines).
Technology has also made the cost of travel lower since employees can be productive whilst they are travelling. As ICT improves, their productivity will improve. The improvement in technology will also reduce the importance of location, thus a lesser need to locate in major metropolitan areas. This will create demand for space in other areas outside the CBD and lead to clustering in those areas. Hence, the demand for improved infrastructure in these agglomerations will increase as they develop.
A combination of trends are now converging which will drive a major behavioural change. For example, after some years of anticipated change to retail, we are now seeing extensive reshaping of who the major retailers are and how they deliver their product. The key converging trends are greater broadband capacity through high speed internet networks, more convenient devices such as smart phones and tablets, and the growth of effective online platforms for conducting business.

Economic Impact of State Infrastructure Strategy – Rebuilding NSW
79 Commercial-in-Confidence
Deloitte Access Economics
Growth in the digital economy is being led by individuals, as consumers and employees, changing their approaches to work and leisure. This bottom up change will have implications for business and government service delivery.
Smart infrastructure
One of the major trends affecting the infrastructure sector in coming demand will be smart infrastructure that is enabled with machine-to-machine digital technologies.
Intelligent Transportation Systems (ITS) technologies encompass a range of information technologies that can be integrated into transportation system infrastructure. ITS technologies have the potential to address a range of transport issues and can help in improving safety, improving efficiency, improving competitiveness and reducing environmental impacts of transport.
In particular, technologies such as diagnostic traffic tools can help to improve the efficiency of traffic flows and save time and money. For example, NICTA is currently installing hardware on the Sydney Harbour Bridge that will allow for real-time monitoring of the condition of the structures supporting the roadway. This will allow for earlier intervention and prevent the need for closure of lanes of the bridge.
Smart networks can also provide real-time public transport information, to improve their operations and performance. This can encourage the shift towards the use of public transport, reducing congestion and environmental impacts. There is scope to provide the consumer with information about times based on congestion levels rather than timetable estimates. The introduction of a range of real time public transport apps is an example of greater use of smart networks.
Another major area in which the digital economy can affect the efficiency with which road infrastructure is used is through the implementation of road user charging including strategies such as congestion pricing. Examples of cities which have implemented this include London, Singapore and Milan. There are proposals in countries such as the US, China and Brazil to implement this in their major cities to reduce congestion.
Congestion charges have been shown to be quite effective in alleviating congestion in the city of London. According to the BBC, they report that traffic levels over the past decade had decreased by 10.2%. In Sydney, a survey by the University of Sydney shows that:
“A five cent per kilometre "congestion charge" on major roads at peak hour would shift 13 per cent of commuters to public transport” (The Australian, 2013)
As the cost of implementation (of ICT enabling congestion pricing) decreases, the case for using congestion pricing to alleviate congestion becomes stronger, thus reducing the demand for new infrastructure.
Economic Impact of State Infrastructure Strategy – Rebuilding NSW
80 Commercial-in-Confidence
Deloitte Access Economics
Appendix E: CGE modelling Background on the DAE CGE model
A Computable General Equilibrium (CGE) model is a stylised representation of the real world economy which allows for analysis of how the economy might react to changes in external factors such as policy, technology, environment and population.
CGE models are based on real world economic data. The fundamental building block is a database which reconciles how goods and services flow from one industry to another. For example, this database could show how much road transport is used by the food and beverage industry or how much output from agricultural industries is used in food manufacturing. This database covers the entire economy. From this real world data information on key variables such as GDP can be calculated.
The second main component of the model is an extensive set of information on the preferences of consumers and producers. These preferences cover details such as how consumption of an item changes as its price increases, how likely consumers are to switch their consumption between different goods and how producers are best able to produce their output.
The model therefore represents a static picture of the economy (how goods and services are currently used) and a framework for measuring how changes to this picture will flow through the economy.
The Deloitte Access Economics – Regional General Equilibrium Model (DAE-RGEM) is a large scale, dynamic, multi-region, multi-commodity computable general equilibrium model of the world economy. The model allows policy analysis in a single, robust, integrated economic framework. This model projects changes in macroeconomic aggregates such as GDP, employment, export volumes, investment and private consumption. At the sectoral level, detailed results such as output, exports, imports and employment are also produced.
The model is based upon a set of key underlying relationships between the various components of the model, each which represent a different group of agents in the economy. These relationships are solved simultaneously, and so there is no logical start or end point for describing how the model actually works.
Figure E.1 shows the key components of the model for an individual region. The components include a representative household, producers, investors and international (or linkages with the other regions in the model, including other Australian States and foreign regions). Below is a description of each component of the model and key linkages between components. Some additional, somewhat technical, detail is also provided.

Economic Impact of State Infrastructure Strategy – Rebuilding NSW
81 Commercial-in-Confidence
Deloitte Access Economics
Figure E.1: Key components of DAE-RGEM
DAE-RGEM is based on a substantial body of accepted microeconomic theory. Key assumptions underpinning the model are:
The model contains a ‘regional consumer’ that receives all income from factor payments (labour, capital, land and natural resources), taxes and net foreign income from borrowing (lending).
Income is allocated across household consumption, government consumption and savings so as to maximise a Cobb-Douglas (C-D) utility function.
Household consumption for composite goods is determined by minimising expenditure via a CDE (Constant Differences of Elasticities) expenditure function. For most regions, households can source consumption goods only from domestic and imported sources. In the Australian regions, households can also source goods from interstate. In all cases, the choice of commodities by source is determined by a CRESH (Constant Ratios of Elasticities Substitution, Homothetic) utility function.
Government consumption for composite goods, and goods from different sources (domestic, imported and interstate), is determined by maximising utility via a C-D utility function.
All savings generated in each region are used to purchase bonds whose price movements reflect movements in the price of creating capital.
Producers supply goods by combining aggregate intermediate inputs and primary factors in fixed proportions (the Leontief assumption). Composite intermediate inputs are also combined in fixed proportions, whereas individual primary factors are combined using a CES production function.
Producers are cost minimisers, and in doing so, choose between domestic, imported and interstate intermediate inputs via a CRESH production function.
The model contains a more detailed treatment of the electricity sector that is based on the ‘technology bundle’ approach for general equilibrium modelling developed by ABARE (1996).

Economic Impact of State Infrastructure Strategy – Rebuilding NSW
82 Commercial-in-Confidence
Deloitte Access Economics
The supply of labour is positively influenced by movements in the real wage rate governed by an elasticity of supply.
Investment takes place in a global market and allows for different regions to have different rates of return that reflect different risk profiles and policy impediments to investment. A global investor ranks countries as investment destinations based on two factors: global investment and rates of return in a given region compared with global rates of return. Once the aggregate investment has been determined for Australia, aggregate investment in each Australian sub-region is determined by an Australian investor based on: Australian investment and rates of return in a given sub-region compared with the national rate of return.
Once aggregate investment is determined in each region, the regional investor constructs capital goods by combining composite investment goods in fixed proportions, and minimises costs by choosing between domestic, imported and interstate sources for these goods via a CRESH production function.
Prices are determined via market-clearing conditions that require sectoral output (supply) to equal the amount sold (demand) to final users (households and government), intermediate users (firms and investors), foreigners (international exports), and other Australian regions (interstate exports).
For internationally-traded goods (imports and exports), the Armington assumption is applied whereby the same goods produced in different countries are treated as imperfect substitutes. But, in relative terms, imported goods from different regions are treated as closer substitutes than domestically-produced goods and imported composites. Goods traded interstate within the Australian regions are assumed to be closer substitutes again.
The model accounts for greenhouse gas emissions from fossil fuel combustion. Taxes can be applied to emissions, which are converted to good-specific sales taxes that impact on demand. Emission quotas can be set by region and these can be traded, at a value equal to the carbon tax avoided, where a region’s emissions fall below or exceed their quota.

Economic Impact of State Infrastructure Strategy – Rebuilding NSW
83 Commercial-in-Confidence
Deloitte Access Economics
The representative household
Each region in the model has a so-called representative household that receives and spends all income. The representative household allocates income across three different expenditure areas: private household consumption; government consumption; and savings.
Going clockwise around Figure B, the representative household interacts with producers in two ways. First, in allocating expenditure across household and government consumption, this sustains demand for production. Second, the representative household owns and receives all income from factor payments (labour, capital, land and natural resources) as well as net taxes. Factors of production are used by producers as inputs into production along with intermediate inputs. The level of production, as well as supply of factors, determines the amount of income generated in each region.
The representative household’s relationship with investors is through the supply of investable funds – savings. The relationship between the representative household and the international sector is twofold. First, importers compete with domestic producers in consumption markets. Second, other regions in the model can lend (borrow) money from each other.
Some detail:
The representative household allocates income across three different expenditure areas – private household consumption; government consumption; and savings – to maximise a Cobb-Douglas utility function.
Private household consumption on composite goods is determined by minimising a CDE (Constant Differences of Elasticities) expenditure function. Private household consumption on composite goods from different sources is determined is determined by a CRESH (Constant Ratios of Elasticities Substitution, Homothetic) utility function.
Government consumption on composite goods, and composite goods from different sources, is determined by maximising a Cobb-Douglas utility function.
All savings generated in each region are used to purchase bonds whose price movements reflect movements in the price of generating capital.
Producers
Apart from selling goods and services to households and government, producers sell products to each other (intermediate usage) and to investors. Intermediate usage is where one producer supplies inputs to another’s production. For example, coal producers supply inputs to the electricity sector.
Capital is an input into production. Investors react to the conditions facing producers in a region to determine the amount of investment. Generally, increases in production are accompanied by increased investment. In addition, the production of machinery, construction of buildings and the like that forms the basis of a region’s capital stock, is undertaken by producers. In other words, investment demand adds to household and government expenditure from the representative household, to determine the demand for goods and services in a region.

Economic Impact of State Infrastructure Strategy – Rebuilding NSW
84 Commercial-in-Confidence
Deloitte Access Economics
Producers interact with international markets in two main ways. First, they compete with producers in overseas regions for export markets, as well as in their own region. Second, they use inputs from overseas in their production.
Some detail:
Sectoral output equals the amount demanded by consumers (households and government) and intermediate users (firms and investors) as well as exports.
Intermediate inputs are assumed to be combined in fixed proportions at the composite level. As mentioned above, the exception to this is the electricity sector that is able to substitute different technologies (brown coal, black coal, oil, gas, hydropower and other renewables) using the ‘technology bundle’ approach developed by ABARE (1996).
To minimise costs, producers substitute between domestic and imported intermediate inputs is governed by the Armington assumption as well as between primary factors of production (through a CES aggregator). Substitution between skilled and unskilled labour is also allowed (again via a CES function).
The supply of labour is positively influenced by movements in the wage rate governed by an elasticity of supply is (assumed to be 0.2). This implies that changes influencing the demand for labour, positively or negatively, will impact both the level of employment and the wage rate. This is a typical labour market specification for a dynamic model such as DAE-RGEM. There are other labour market ‘settings’ that can be used. First, the labour market could take on long-run characteristics with aggregate employment being fixed and any changes to labour demand changes being absorbed through movements in the wage rate. Second, the labour market could take on short-run characteristics with fixed wages and flexible employment levels.
Investors
Investment takes place in a global market and allows for different regions to have different rates of return that reflect different risk profiles and policy impediments to investment. The global investor ranks countries as investment destination based on two factors: current economic growth and rates of return in a given region compared with global rates of return.
Some detail
Once aggregate investment is determined in each region, the regional investor constructs capital goods by combining composite investment goods in fixed proportions, and minimises costs by choosing between domestic, imported and interstate sources for these goods via a CRESH production function.
International
Each of the components outlined above operate, simultaneously, in each region of the model. That is, for any simulation the model forecasts changes to trade and investment flows within, and between, regions subject to optimising behaviour by producers, consumers and investors. Of course, this implies some global conditions must be met such as global exports and global imports are the same and that global debt repayment equals global debt receipts each year.

Limitation of our work
General use restriction
This report is prepared solely for the use of the NSW Government. This report is not
intended to and should not be used or relied upon by anyone else and we accept no duty of
care to any other person or entity. The report has been prepared for the purpose of
analysing the economic impact of Rebuilding NSW and the Sate Infrastructure Strategy
based on the information on the program provided to Deloitte Access Economics. You should not refer to or use our name or the advice for any other purpose.

Contact us
Deloitte Access Economics ACN: 149 633 116 225 George Street Sydney, NSW 2000 PO Box N250 Grosvenor Place Sydney NSW 1220 Australia
Tel: +61 2 9322 7000 Fax: +61 9322 7001 www.deloitteaccesseconomics.com.au
Deloitte Access Economics is Australia’s pre-eminent economics advisory practice and a member of Deloitte's global economics group. The Directors and staff of Access Economics joined Deloitte in early 2011.
Deloitte refers to one or more of Deloitte Touche Tohmatsu Limited, a UK private company limited by guarantee, and its network of member firms, each of which is a legally separate and independent entity. Please see www.deloitte.com/au/about for a detailed description of the legal structure of Deloitte Touche Tohmatsu Limited and its member firms.
About Deloitte
Deloitte provides audit, tax, consulting, and financial advisory services to public and private clients spanning multiple industries. With a globally connected network of member firms in more than 150 countries, Deloitte brings world-class capabilities and deep local expertise to help clients succeed wherever they operate. Deloitte's approximately 170,000 professionals are committed to becoming the standard of excellence.
About Deloitte Australia
In Australia, the member firm is the Australian partnership of Deloitte Touche Tohmatsu. As one of Australia’s leading professional services firms. Deloitte Touche Tohmatsu and its affiliates provide audit, tax, consulting, and financial advisory services through approximately 5,400 people across the country. Focused on the creation of value and growth, and known as an employer of choice for innovative human resources programs, we are dedicated to helping our clients and our people excel. For more information, please visit our web site at www.deloitte.com.au.
Liability limited by a scheme approved under Professional Standards Legislation.
Member of Deloitte Touche Tohmatsu Limited
© 2014 Deloitte Access Economics Pty Ltd