Embed Size (px)
Citation preview
February 2000
Economic Impact of StandardReference Materials for Sulfur
in Fossil Fuels
Final Report
Prepared for
Strategic Planning and Economic Analysis GroupNational Institute of Standards and Technology
Bldg. 101, Room A1013Gaithersburg, MD 20899-1060
Prepared by
Sheila A. Martin, Ph.D.Michael P. Gallaher, Ph.D.
Alan C. O’ConnorResearch Triangle Institute
Center for Economics ResearchResearch Triangle Park, NC 27709
RTI Project Number 7007-006
RTI Project Number7007-006
Economic Impact of StandardReference Materials for Sulfur
in Fossil Fuels
Final Report
February 2000
Prepared for
Strategic Planning and Economic Analysis GroupNational Institute of Standards and Technology
Bldg. 101, Room A1013Gaithersburg, MD 20899-1060
Prepared by
Sheila A. Martin, Ph.D.Michael P. Gallaher, Ph.D.
Alan C. O’ConnorResearch Triangle Institute
Center for Economics ResearchResearch Triangle Park, NC 27709

iii
Acknowledgments
We wish to acknowledge Dr. Gregory C. Tassey, Dr. W. RobertKelly, Bruce S. Macdonald, Dr. John D. Fassett, and Ellyn S. Bearyfor helpful comments and suggestions on earlier versions of thisreport.
v
Contents
Executive Summary ES-1
1. Introduction 1-1
1.1 NIST’s SRM Program for Sulfur in Fossil Fuels.................... 1-3
1.2 Project Objectives and Scope............................................ 1-4
1.3 Summary of Analytical Approach and ReportOrganization..................................................................... 1-6
2. Overview of Affected Industries 2-1
2.1 Sulfur Measurement Industry ............................................. 2-3
2.1.1 Instrument Manufacturers ...................................... 2-3
2.1.2 Manufacturers of Certified Reference Materials ...... 2-3
2.1.3 Independent Sulfur Testing Laboratories................. 2-4
2.2 Coal Industry .................................................................... 2-5
2.2.1 Coal Cleaning and Processing................................ 2-5
2.3 Petroleum Industry ............................................................ 2-6
2.3.1 Petroleum Processing and Desulfurization ............. 2-7
3. SRMs and Sulfur Measurement 3-1
3.1 Uncertainty in the Measurement of Sulfur in FossilFuels ............................................................................. 3-1
3.1.1 Sources of Variability in Measurement ................... 3-2
3.1.2 Quantifying the Uncertainty of a MeasurementProcess.................................................................. 3-4
3.2 Methods for Measuring Sulfur in Fossil Fuels ..................... 3-6
3.2.1 Sulfur in Coal ........................................................ 3-6
vi
3.2.2 Sulfur in Petroleum Products.................................. 3-9
3.2.3 Reference and Sulfur Measurement...................... 3-10
3.3 Impact of NIST SRMs on the Measurement of Sulfur inFossil Fuels ..................................................................... 3-12
3.3.1 SRM Development Process .................................. 3-12
3.3.2 History of NIST’s SRM Program for Sulfur inFossil Fuels .......................................................... 3-17
3.3.3 Counterfactual Scenarios ..................................... 3-23
4. Valuing Improved Sulfur Information 4-1
4.1 Sulfur Information and Economic Behavior........................ 4-1
4.1.1 Use of SRMs and Sulfur Information toImprove R&D Efficiency ........................................ 4-3
4.1.2 Use of Sulfur SRMs to Support the ProductionProcess.................................................................. 4-4
4.1.3 Use of Sulfur Information to ReduceTransactions Costs in the Purchase and Sale ofFuels and Other Products....................................... 4-6
4.2 Hypotheses ....................................................................... 4-8
4.2.1 Impact of SRMs on the Sulfur MeasurementIndustry ................................................................. 4-8
4.2.2 Impact on the Fossil Fuel Production andCombustion Industries ......................................... 4-11
4.2.3 Impact on Regulatory Agencies and theEnvironment ........................................................ 4-12
4.3 Valuing Economic Outcomes .......................................... 4-12
4.3.1 Benefits of Improvements in Product Quality(H1)..................................................................... 4-15
4.3.2 Changes in R&D Costs (H2) ................................. 4-17
4.3.3 Changes in Transactions Costs (H3) ..................... 4-18
4.3.4 Improvements in Production Efficiency (H4) ........ 4-20
4.3.5 Changes in Regulatory Penalties (H5)................... 4-23
4.3.6 Benefits to the Environment (H6) ......................... 4-23
4.4 Data Collection............................................................... 4-24
4.4.1 Data Requirements .............................................. 4-25
4.4.2 Sample Selection ................................................. 4-25
4.4.3 Data Collection Procedures ................................. 4-30
vii
5. Results 5-1
5.1 Improvements in Product Quality (H1) .............................. 5-4
5.1.1 Instrument Industry................................................ 5-4
5.1.2 CRM Industry ........................................................ 5-5
5.1.3 Laboratories........................................................... 5-6
5.2 Reductions in the Cost of R&D (H2) .................................. 5-8
5.2.1 Sulfur Measurement Industry ................................. 5-8
5.2.2 Fossil Fuel Industry ................................................ 5-8
5.3 Reductions due to Transactions Costs (H3) ........................ 5-9
5.4 Increases in Production Efficiency (H4)............................ 5-11
5.4.1 Petroleum Industry .............................................. 5-11
5.4.2 Coal Industry ....................................................... 5-12
5.5 Reductions in Regulatory Penalties (H5) .......................... 5-13
5.6 Benefits to the Environment (H6) ..................................... 5-14
5.7 Industry Costs ................................................................. 5-16
5.8 NIST Expenditures........................................................... 5-17
5.9 Calculating Measures of Economic Return....................... 5-19
5.10 Conclusions .................................................................... 5-20
References R-1
Appendixes
A SRMs’ Impact on Sulfur Measurement Accuracy ................A-1
B Survey Form...................................................................... B-1
C Profiles of Affected Industries ............................................C-1
viii
Figures
Figure 1-1 Analytical Approach to Assessing the Impact of NIST’sTechnical Laboratories Sulfur in Fossil Fuel SRMs ...................... 1-7
Figure 2-1 Industries Affected by Measurement of Sulfur in Fossil Fuels....... 2-2
Figure 3-1 Bias and Precision in Test Methods ............................................ 3-4
Figure 3-2 Difference “Two” Standard Deviation Limit (d2s) ....................... 3-6
Figure 3-3 Classical Linear Calibration Model........................................... 3-11
Figure 3-4 Impact of IDMS Method on the Relative Uncertainty of NISTSRMs for Sulfur in Fossil Fuels.................................................. 3-22
Figure 4-1 Change in Consumers’ Surplus for Products and ServicesProduced with NIST SRMs ....................................................... 4-16
Figure 4-2 Impact of SRMs on Disputes due to Measurement Error............ 4-19
Figure 4-3 Impact of NIST SRMs on Buffers............................................... 4-21
Figure 4-4 Impact of NIST SRMs on Regulatory Compliance Activities ...... 4-24
ix
Tables
Table 1-1 NIST SRMs Covered by this Study .............................................. 1-5
Table 3-1 Characteristics of ASTM Testing Methods Used Most Oftenfor Testing Sulfur in Fossil Fuels ................................................. 3-8
Table 3-2 Trends in Confidence Intervals for Certified Values of NISTSRMs ....................................................................................... 3-18
Table 4-1 Potential Impact of SRMs on Stages of Production in theSulfur Measurement Supply Chain ............................................. 4-3
Table 4-2 Hypotheses About the Impact of NIST SRMs .............................. 4-9
Table 4-3 Technical and Economic Measures of the Impact of NISTSRMs ....................................................................................... 4-14
Table 4-4 Data Elements Required to Populate the Analytical Model ....... 4-26
Table 4-5 Number of Interviews by Industry Segment .............................. 4-27
Table 4-6 Companies Interviewed ........................................................... 4-28
Table 5-1 Impact of NIST SRMs ................................................................. 5-2
Table 5-2 Annual Net Benefits to Society and NIST Expenditure................. 5-3
Table 5-3 Net Present Value of Benefits Hypothesis ................................... 5-4
Table 5-4 Estimated Annual Impacts of NIST Sulfur SRMs ($1998) ............. 5-7
Table 5-5 Benefits to the Environment ($1998)......................................... 5-15
Table 5-6 Time Series of NIST Expenditures for Sulfur SRMs ($1998)........ 5-18
Table 5-7 Economic Impact of NIST SRMs............................................... 5-20
ES-1
Executive Summary
The National Institute of Standards and Technology (NIST)promotes U.S. economic growth by working with industry todevelop and apply technology, measurements, and standards.Through its Office of Standard Reference Materials, NIST isauthorized to certify and sell standard reference materials (SRMs)that help users engaged in commerce or research link theirmeasurements to NIST. Developed by NIST’s TechnicalLaboratories, SRMs are materials certified for their chemicalcomposition or physical properties. As emerging regulationsincrease the importance of the sulfur content of fossil fuels, NIST isexpanding its SRM program to include SRMs for measuring sulfur inthe low-sulfur fuels required to meet these regulations. Thedevelopment of an SRM employs NIST’s unique expertise inmeasurement. A NIST-certified SRM carries with it the full weightand authority of NIST and the U.S. Department of Commerce. Thisstudy estimates the economic impact of NIST SRMs for sulfur infossil fuels.
SRMs play a key role in the National Measurement System forAnalytical Chemistry. They serve as national primary chemicalstandards and are used as calibrants and as quality assurancematerials to evaluate measurement accuracy, to intercalibratelaboratories in a measurement program, and to providecompatibility of measurement data (Taylor, 1993). The absence ofSRMs as primary chemical standards would weaken the entiremeasurement system.
SRMs help users verify the accuracy of measurement methods orcalibrate measurement systems. NIST SRMs greatly improvemeasurement accuracy by reducing the uncertainty of
Economic Impact of Standard Reference Materials for Sulfur in Fossil Fuels
ES-2
measurement. These improvements enhance the products andservices of the measurement industry, such as testing laboratoriesand analytical equipment manufacturers. More accurate sulfurcontent information also reduces the likelihood of disputes betweensellers and purchasers of fossil fuels, such as coal companies andelectric utilities. Other benefits include better production efficiencyfor the petroleum industry and lower sulfur emissions to theenvironment.
This study quantifies a portion of the economic benefits associatedwith sulfur SRMs. Included in the measures of economic benefitsare improvements in product quality, production efficiency, andreductions in transaction costs and sulfur dioxide emissions to theenvironment. In addition, the study identifies and qualitativelydescribes the impact of NIST SRMs on other less tangible areas,such as research and development programs.
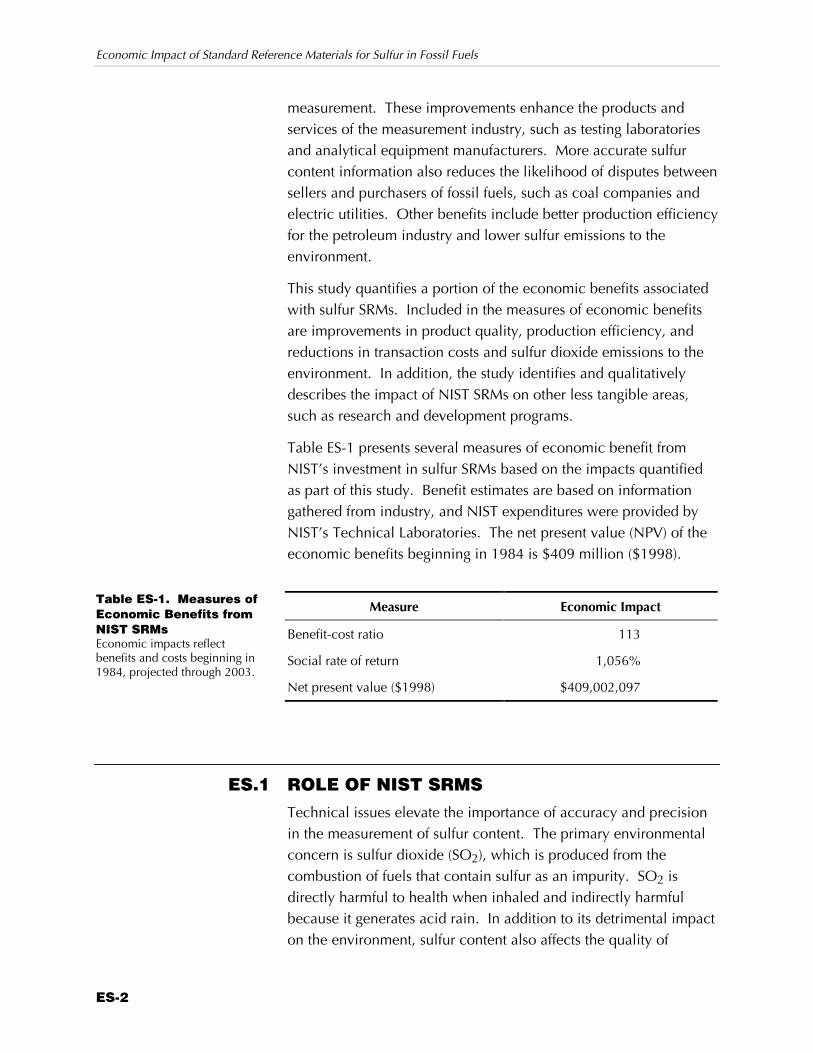
Table ES-1 presents several measures of economic benefit fromNIST’s investment in sulfur SRMs based on the impacts quantifiedas part of this study. Benefit estimates are based on informationgathered from industry, and NIST expenditures were provided byNIST’s Technical Laboratories. The net present value (NPV) of theeconomic benefits beginning in 1984 is $409 million ($1998).
Measure Economic Impact
Benefit-cost ratio 113
Social rate of return 1,056%
Net present value ($1998) $409,002,097
ES.1 ROLE OF NIST SRMSTechnical issues elevate the importance of accuracy and precisionin the measurement of sulfur content. The primary environmentalconcern is sulfur dioxide (SO2), which is produced from thecombustion of fuels that contain sulfur as an impurity. SO2 isdirectly harmful to health when inhaled and indirectly harmfulbecause it generates acid rain. In addition to its detrimental impacton the environment, sulfur content also affects the quality of
Table ES-1. Measures ofEconomic Benefits fromNIST SRMsEconomic impacts reflectbenefits and costs beginning in1984, projected through 2003.
Executive Summary
ES-3
products and processes that use fossil fuels. For example, catalystsfor low-emissions vehicles are sensitive to the sulfur content ofgasoline and diesel fuel. Similarly, the catalysts used in petroleumprocessing can be “poisoned” by sulfur; sulfur affects the technicalquality of other petroleum products as well. Fuel oils used in heat-treating metals or in firing glass-melting furnaces must be low insulfur to avoid damaging the product. The sulfur content of cokehas an impact on the quality of the steel it is used to produce.
NIST’s SRM program for sulfur in fossil fuels uses a definitivemethod, developed at NIST, that virtually eliminates bias andsignificantly reduces the uncertainty of the SRMs. Without thedevelopment of the isotope dilution thermal ionization massspectrometry (IDMS) method, sulfur measurement in industrywould be subject to greater bias and uncertainty. Because of theIDMS’s complexity and the skill and equipment required, it isunlikely that any other laboratories developing certified referencematerials (CRMs) would have pursued such a sophisticated methodin the absence of NIST. Therefore, without NIST, the level ofuncertainty associated with measuring sulfur in fossil fuels wouldtoday be similar to what it was prior to the introduction of IDMS inthe early 1980s.
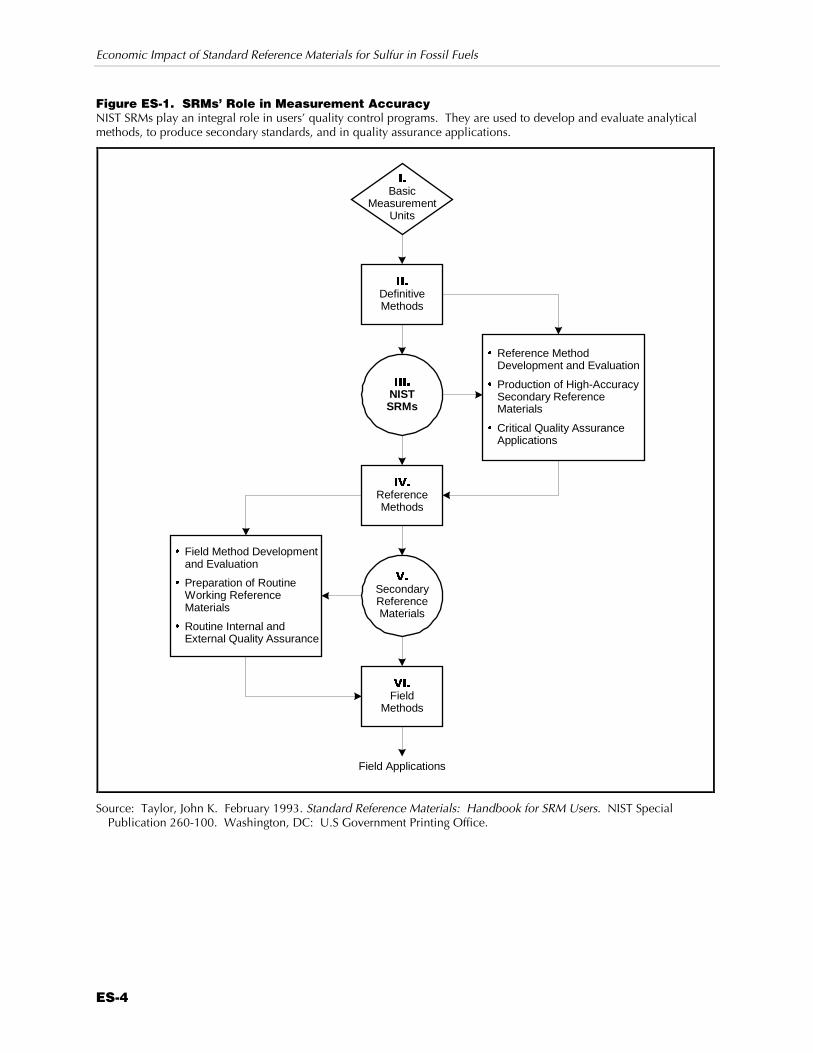
Figure ES-1 illustrates the role that NIST SRMs play in the integrityof the measurement system. SRMs, which are tied to the basicmeasurement units maintained at NIST, are developed using IDMS.Many organizations use SRMs to develop and evaluate referencemethods, to ensure the accuracy of secondary reference materials,and to ensure accuracy in critical quality assurance applications.Secondary reference materials and reference methods are then usedto develop and evaluate field methods to prepare working referencematerials, such as calibrants, and to perform routine qualityassurance activities. The integrity of this system is based on thequality of NIST SRMs and their traceability to the basicmeasurement units.
Many companies and individuals benefit from the measurementimprovements provided by NIST’s sulfur in fossil fuels SRMs. Wefocused on those industries that make most extensive use of theseSRMs and benefit most directly from their use. These companiesuse NIST SRMs in a variety of production stages, including
Without NIST, thelevel of uncertaintyassociated withmeasuring sulfur infossil fuels wouldtoday be similar towhat it was prior tothe introduction ofIDMS in the early1980s.
Economic Impact of Standard Reference Materials for Sulfur in Fossil Fuels
ES-4
Figure ES-1. SRMs’ Role in Measurement AccuracyNIST SRMs play an integral role in users’ quality control programs. They are used to develop and evaluate analyticalmethods, to produce secondary standards, and in quality assurance applications.
,�
BasicMeasurement
Units
,,,�
NISTSRMs
,9�
ReferenceMethods
9�
SecondaryReferenceMaterials
9,�
FieldMethods
,,�
DefinitiveMethods
é Reference MethodDevelopment and Evaluation
é Production of High-AccuracySecondary ReferenceMaterials
é Critical Quality AssuranceApplications
é Field Method Developmentand Evaluation
é Preparation of RoutineWorking ReferenceMaterials
é Routine Internal andExternal Quality Assurance
Field Applications
Source: Taylor, John K. February 1993. Standard Reference Materials: Handbook for SRM Users. NIST SpecialPublication 260-100. Washington, DC: U.S Government Printing Office.
Executive Summary
ES-5
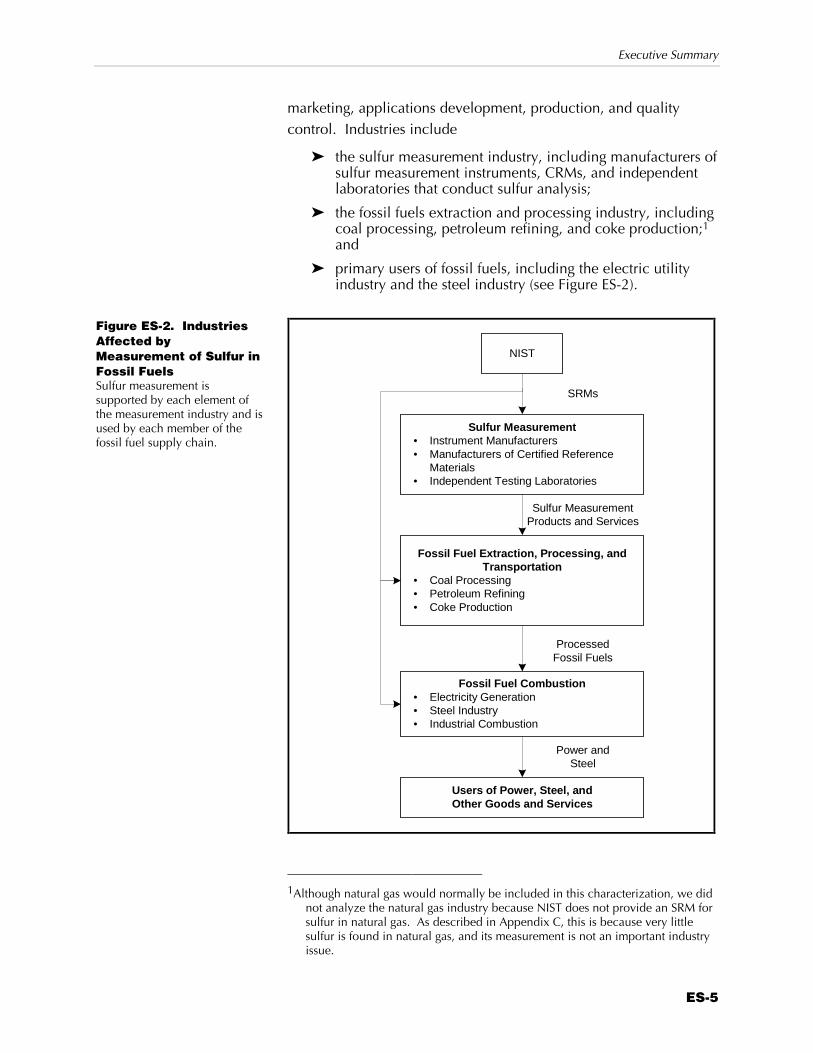
marketing, applications development, production, and qualitycontrol. Industries include
Z the sulfur measurement industry, including manufacturers ofsulfur measurement instruments, CRMs, and independentlaboratories that conduct sulfur analysis;
Z the fossil fuels extraction and processing industry, includingcoal processing, petroleum refining, and coke production;1and
Z primary users of fossil fuels, including the electric utilityindustry and the steel industry (see Figure ES-2).
NIST
ProcessedFossil Fuels
Fossil Fuel Combustion• Electricity Generation• Steel Industry• Industrial Combustion
Users of Power, Steel, andOther Goods and Services
Power andSteel
SRMs
Sulfur MeasurementProducts and Services
Fossil Fuel Extraction, Processing, andTransportation
• Coal Processing• Petroleum Refining• Coke Production
Sulfur Measurement• Instrument Manufacturers• Manufacturers of Certified Reference
Materials• Independent Testing Laboratories
1Although natural gas would normally be included in this characterization, we did
not analyze the natural gas industry because NIST does not provide an SRM forsulfur in natural gas. As described in Appendix C, this is because very littlesulfur is found in natural gas, and its measurement is not an important industryissue.
Figure ES-2. IndustriesAffected byMeasurement of Sulfur inFossil FuelsSulfur measurement issupported by each element ofthe measurement industry and isused by each member of thefossil fuel supply chain.
Economic Impact of Standard Reference Materials for Sulfur in Fossil Fuels
ES-6
The potential impacts of these uses for sulfur information fall withinthe three categories of infratechnology impact discussed by Tassey(1997):
Z Infratechnologies improve the efficiency of R&D. SulfurSRMs reduce the cost of developing new products andprocesses in the sulfur measurement industry and in thefossil fuel industry.
Z Infratechnologies support the production process andenhance product characteristics. Sulfur SRMs supportquality control during the manufacturing and laboratoryprocesses.
Z Infratechnologies reduce transactions costs. SRMs allowthese measurements to be made accurately and enablecomparability among the results, thus promoting efficientand low-cost transactions.
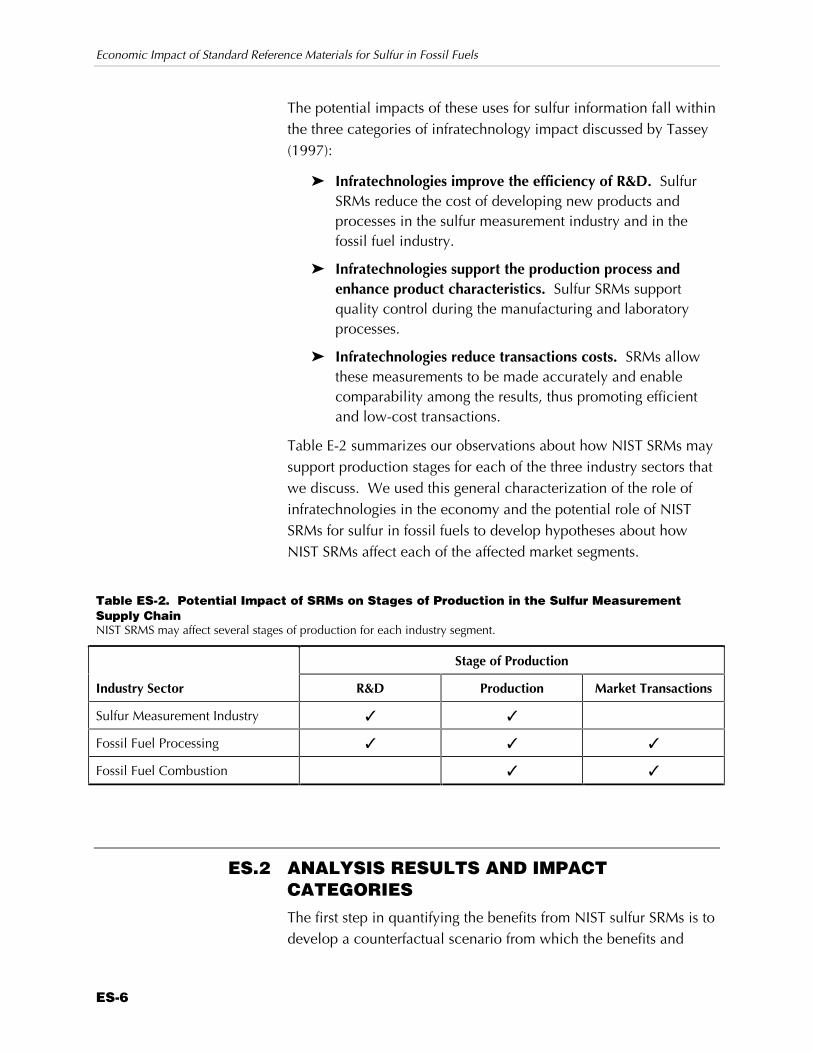
Table E-2 summarizes our observations about how NIST SRMs maysupport production stages for each of the three industry sectors thatwe discuss. We used this general characterization of the role ofinfratechnologies in the economy and the potential role of NISTSRMs for sulfur in fossil fuels to develop hypotheses about howNIST SRMs affect each of the affected market segments.
Table ES-2. Potential Impact of SRMs on Stages of Production in the Sulfur MeasurementSupply ChainNIST SRMS may affect several stages of production for each industry segment.
Stage of Production
Industry Sector R&D Production Market Transactions
Sulfur Measurement Industry ✓ ✓
Fossil Fuel Processing ✓ ✓ ✓
Fossil Fuel Combustion ✓ ✓
ES.2 ANALYSIS RESULTS AND IMPACTCATEGORIESThe first step in quantifying the benefits from NIST sulfur SRMs is todevelop a counterfactual scenario from which the benefits and
Executive Summary
ES-7
costs can be measured. Our counterfactual scenario is that, in theabsence of NIST, the level of uncertainty associated with measuringsulfur in fossil fuels would today be similar to what it was prior tothe introduction of IDMS in the early 1980s. Based on thiscounterfactual assumption, we are able to express the impact ofNIST SRMs in terms of a change in the standard error (SE) ofAmerican Society for Testing and Materials (ASTM) sulfurmeasurement tests. Using the ratio of the old standard error to thenew standard error and taking into account the percentage ofmeasurement error associated with sampling, we estimate that NISTSRMs improve measurement accuracy by a factor of about 1.75 forpetroleum and 1.25 for coal. These estimates allowed us toestimate possible economic impacts of sulfur SRMs.
We interviewed several members of each of the affected industries.Thirty-eight interviews were conducted with technical experts at 24companies. The interviews were conducted in two stages: scopinginterviews and technical interviews. During the scoping interviews,we learned about sulfur-content testing, methods and practices, andthe importance of accurate sulfur-content information. We thenused this information to develop and refine the questionnaire forthe technical interviews. During the technical interviews,respondents were asked about sulfur testing and SRMs, theirimpressions of the impact of SRMs, and their use of the sulfur-content information.
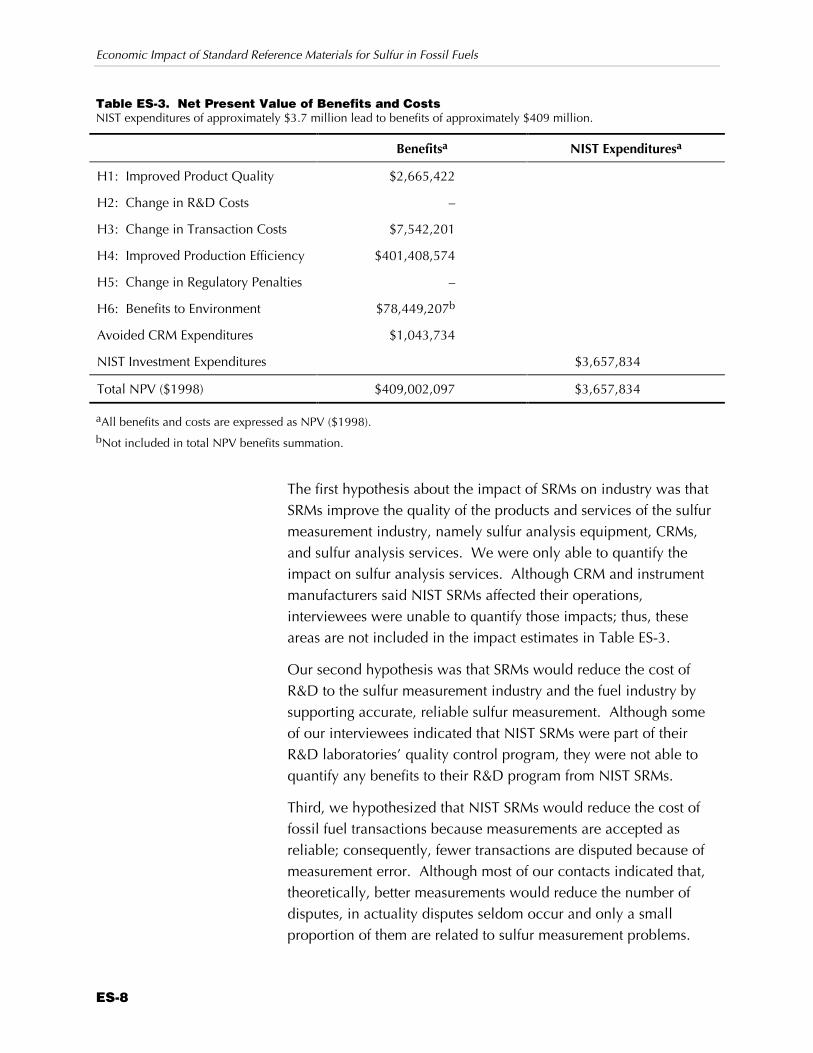
We developed six hypotheses about the impact of NIST SRMs onindustry, regulatory agencies, and the environment, and weevaluated them using data collected from primary and secondarysources. Table ES-3 summarizes the NPV of the benefits associatedwith the six hypotheses identified in this study. Of the sixhypotheses, we were able to partially quantify the benefits for fourhypotheses. Although we found anecdotal information to supportthe remaining hypotheses, little concrete evidence was available.Therefore, the potential benefits associated with these remaininghypotheses are discussed qualitatively, but they are not included inthe estimates of economic return. In addition, industries’ avoidedexpenditures on CRMs are included in the total benefit estimates.
Economic Impact of Standard Reference Materials for Sulfur in Fossil Fuels
ES-8
Table ES-3. Net Present Value of Benefits and CostsNIST expenditures of approximately $3.7 million lead to benefits of approximately $409 million.
Benefitsa NIST Expendituresa
H1: Improved Product Quality $2,665,422
H2: Change in R&D Costs –
H3: Change in Transaction Costs $7,542,201
H4: Improved Production Efficiency $401,408,574
H5: Change in Regulatory Penalties –
H6: Benefits to Environment $78,449,207b
Avoided CRM Expenditures $1,043,734
NIST Investment Expenditures $3,657,834
Total NPV ($1998) $409,002,097 $3,657,834
aAll benefits and costs are expressed as NPV ($1998).bNot included in total NPV benefits summation.
The first hypothesis about the impact of SRMs on industry was thatSRMs improve the quality of the products and services of the sulfurmeasurement industry, namely sulfur analysis equipment, CRMs,and sulfur analysis services. We were only able to quantify theimpact on sulfur analysis services. Although CRM and instrumentmanufacturers said NIST SRMs affected their operations,interviewees were unable to quantify those impacts; thus, theseareas are not included in the impact estimates in Table ES-3.
Our second hypothesis was that SRMs would reduce the cost ofR&D to the sulfur measurement industry and the fuel industry bysupporting accurate, reliable sulfur measurement. Although someof our interviewees indicated that NIST SRMs were part of theirR&D laboratories’ quality control program, they were not able toquantify any benefits to their R&D program from NIST SRMs.
Third, we hypothesized that NIST SRMs would reduce the cost offossil fuel transactions because measurements are accepted asreliable; consequently, fewer transactions are disputed because ofmeasurement error. Although most of our contacts indicated that,theoretically, better measurements would reduce the number ofdisputes, in actuality disputes seldom occur and only a smallproportion of them are related to sulfur measurement problems.
Executive Summary
ES-9
We used information provided by industry to estimate the total costof measurement disputes and assumed that 5 percent of that figureis the cost associated with measurement error.
Our fourth hypothesis was that NIST SRMs increase the efficiencyof fuel blending, desulfurization, and equipment operationsbecause the reliability of the measurement allows users to reducethe buffer they employ to ensure compliance with technicalspecifications. Petroleum refineries and coal companies are theprimary beneficiaries of this impact because better sulfurmeasurement allows them to reduce the amount of desulfurizationthey conduct on fuels, which provides cost savings. Avoideddesulfurization accounted for approximately 97 percent of the totalbenefits used to calculate measures of economic return.
Our fifth hypothesis was that improvements in the measurement ofsulfur may reduce the incidence and quantity of penalties imposedby regulatory agencies. Thus, improved information on the sulfurcontent of products may lower the cost of production by loweringthe cost of fines. Although industry experts agreed with thishypothesis, it was determined that fines paid by industry were infact transfer payments and did not represent in themselves changesin social welfare. Thus, changes in regulatory penalties were notincluded in the benefit analysis.
The final hypothesis was that SRMs reduce the total amount ofsulfur entering the environment by providing industry greatercontrol over the sulfur content of its fuels and by allowingcompliance officials greater authority in enforcing the regulatorylimits. These benefits are not included in the total benefitspresented in Table ES-3 or in the measures of economic returnpresented in Table ES-1 because they do not directly accrue to thesulfur measurement supply chain. As with the productionefficiency hypothesis, the benefits to the environment associatedwith NIST SRMs are limited to petroleum products. With NISTSRMs, the reproducibility interval around the target sulfur contentvalue is smaller, which means that batches of diesel fuel andgasoline are released with less sulfur. Lower sulfur fuels reduce theamount of SO2 emitted to the environment. To estimate theeconomic impact, we valued the additional amount of SO2 thatwould have been emitted to the environment in the absence ofNIST SRMs.
Economic Impact of Standard Reference Materials for Sulfur in Fossil Fuels
ES-10
In the absence of NIST SRMs, industry would likely purchaseCRMs. Thus, avoided expenditures on CRMs are included as abenefit, offsetting NIST program expenditures.
The NPV of NIST’s expenditures—including development,production, operation, overhead, and administrative costs—is$3,657,834. Based on the benefits we were able to quantify andNIST expenditures, the benefit-to-cost ratio associated withNIST/Technical Laboratories sulfur SRMs since 1984 is 113.
1-1
1 Introduction
The combustion of fossil fuels provides the majority of energyconsumed in the U.S. This inexpensive and abundant source ofenergy is an integral part of the U.S. economy. Energy from fossilfuels has been and continues to be a key contributor to U.S.economic growth and productivity.
While the combustion of fossil fuels allows us to heat our homes,fuel our industries, and transport people and goods, it also has anegative effect on the quality of our environment. Sulfur dioxide(SO2) gas and other sulfur compounds are emitted duringcombustion of fossil fuels that contain sulfur. These sulfurcompounds have a detrimental effect on human health, wildlife,agricultural productivity, and quality of life and are a majorcontributor to acid rain. Sulfur compounds also reduce catalystefficiency, increasing nitrogen oxide (NOx) and hydrocarbonemissions from automobile engines. These negative environmentalimpacts have prompted the development of regulations that limitsulfur compound emissions from some sources and the sulfurcontent of some fuels. These regulations have evolved over timeand have become more strict with respect to both sulfur contentand sulfur compound emissions.
Sulfur in fossil fuels also affects the quality of a number of products.For example, catalysts for low-emissions vehicles are sensitive tothe sulfur content of gasoline and diesel fuel. Similarly, thecatalysts used in petroleum processing can be “poisoned” by sulfur;sulfur affects the technical quality of other petroleum products aswell. Fuel oils used in heat-treating metals or in firing glass-meltingfurnaces must be low in sulfur to avoid damaging the product. The
Economic Impact of Standard Reference Materials for Sulfur in Fossil Fuels
1-2
sulfur content of coke has an impact on the quality of the steel it isused to produce.
Because sulfur has a negative effect on both the environment andon the quality of products, low-sulfur fuels are more desirable thanhigh-sulfur fuels. However, because low-sulfur fuels are scarce andremoving sulfur from fossil fuels is expensive, low-sulfur fuels aremore valuable than high-sulfur fuels. The sulfur content of fossilfuels has become increasingly important to the value of these fuelsas environmental regulations gradually lower the sulfur contentlimits for fossil fuels and restrict the emission of sulfur from fossilfuel combustion. These regulations have encouraged thedevelopment of technologies that remove sulfur from fossil fuelsand the design of transportation and power generation equipmentthat operate on low-sulfur fuel.
Because sulfur is a key characteristic of fossil fuels and animportant factor in determining their value, information about thesulfur content of fossil fuels is important to industry Thisinformation is used by industry in three ways:
Z Sulfur content information is used to write and executefossil fuel purchase contracts. It supports the millions offuel transactions that occur in the U.S. every year.
Z Sulfur content information is used during fuel extraction,blending, and processing operations to improve theirefficiency. An accurate measure of the sulfur contentallows companies to meet strict product specifications.
Z Sulfur content information is used by industry and by theregulatory community to ensure that fuels meet sulfurcontent regulations and that their combustion will notviolate an emissions permit.
The National Institute of Standards and Technology (NIST)promotes U.S. economic growth by working with industry todevelop and apply technology, measurements, and standards.NIST, through its Office of Standard Reference Materials, isauthorized to certify and sell standard reference materials (SRMs).SRMs are materials certified for their chemical composition orphysical properties; they are developed by various laboratories atNIST. SRMs help users verify the accuracy of measurementmethods or calibrate measurement systems by linking theirmeasurements to NIST. The development of SRMs employs NIST’sunique experience in measurement. A NIST-certified SRM carries
Section 1 — Introduction
1-3
with it the full weight and authority of NIST and the U.S.Department of Commerce.
Among the approximately 1,300 SRMs available from NIST, 27 areSRMs for measuring sulfur in fossil fuels. These SRMs and themethods used to certify them are developed by NIST’s TechnicalLaboratories. As emerging regulations increase the importance ofthe sulfur content of fossil fuels, NIST is expanding its suite of fossilfuel SRMs to include SRMs for measuring sulfur in the low-sulfurfuels that are required to meet these regulations.
To provide input to NIST’s program planning and evaluationprocess, Research Triangle Institute (RTI) conducted a study toidentify, characterize, and quantitatively estimate the economicimpact of NIST’s SRMs for sulfur in fossil fuels. This reportdescribes the study and discusses our conclusions.
1.1 NIST’S SRM PROGRAM FOR SULFUR INFOSSIL FUELSAll measurements depend on standards. Chemical measurements,such as the measurement of sulfur in fossil fuels, depend on bothphysical standards and chemical standards. Although earlychemical analytical measurements depended almost entirely onphysical standards, modern techniques rely more heavily onchemical standards. This is because most modern chemicalmeasurements rely on comparative techniques by which aninstrument is used to compare an unknown sample with one ofknown composition (Taylor, 1993).
SRMs play a key role in the National Measurement System forAnalytical Chemistry. They serve as national primary chemicalstandards and are used as calibrants and as quality assurancematerials to evaluate measurement accuracy, to intercalibratelaboratories in a measurement program, and to providecompatibility of measurement data (Taylor, 1993). If SRMs asprimary chemical standards did not exist, the entire nationalmeasurement infrastructure would be weakened.
NIST’s SRM program for sulfur in fossil fuels began in 1968 with thecertification of two residual fuel oil standards, SRMs 1621 and1622, which contain 1 and 2 percent sulfur, respectively. The
Economic Impact of Standard Reference Materials for Sulfur in Fossil Fuels
1-4
sulfur content for both of these SRMs was certified using agravimetric method similar to American Society for Testing andMaterials (ASTM) D-129 (General Bomb Method). In the early1980s, scientists at NIST (in particular, Paulsen and Kelly [1984])began developing an application of isotope dilution massspectrometry (IDMS) to the certification of sulfur in fossil fuels.IDMS is now considered a definitive method that virtuallyeliminates bias in the certified value. It has significantly reducedthe uncertainty associated with the certified values, providing amore reliable standard for all laboratories testing the sulfur contentof fossil fuels.
Today, the importance of sulfur content measurement for fossilfuels is growing as the U.S. Environmental Protection Agency (EPA)continues to reduce the allowable sulfur in fuels and the autoindustry moves toward lower emissions vehicles that use catalyststhat are even more sensitive to sulfur in fuels. NIST SRMs willcontinue to play an important role in the measurement system forsulfur in fossil fuels. For example, NIST recently developed SRMsfor sulfur in reformulated gasoline (RFG). RFG is required in ninemetropolitan areas of the U.S. as part of the 1990 Clean Air Act.Two of these SRMs are certified at very low sulfur levels, consistentwith the low sulfur content currently required in California and onthe horizon nationally. NIST will continue to issue SRMs asindustry expresses the need for standards that support the analysisof sulfur content in ultra-low sulfur fuels.
1.2 PROJECT OBJECTIVES AND SCOPEThe objective of this project is to identify, characterize, andquantitatively estimate the economic impact of NIST’s SRMs forsulfur in fossil fuels on the relevant industries. We need tounderstand how the sulfur content of fossil fuels affects theeconomy and how information about sulfur content affects theeconomic decisions of agents in the economy. By modeling thosedecisions, we can quantify how the world would be different in theabsence of the NIST SRMs that improve the accuracy and precisionof these measurements.
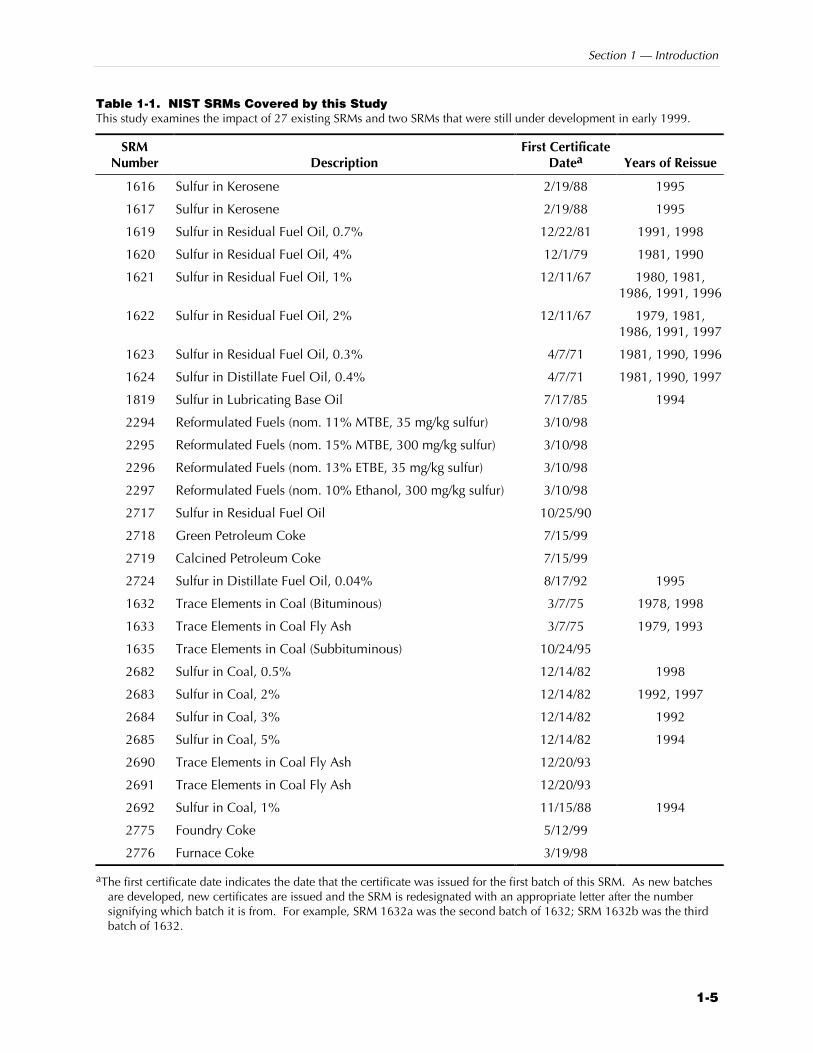
NIST’s SRM program includes over 1,300 SRMs. For this project,we examined only the 29 SRMs shown in Table 1-1. Each of theseSRMs supports measurement methods used to determine the sulfurcontent of fossil fuels.
Section 1 — Introduction
1-5
Table 1-1. NIST SRMs Covered by this StudyThis study examines the impact of 27 existing SRMs and two SRMs that were still under development in early 1999.
SRMNumber Description
First CertificateDatea Years of Reissue
1616 Sulfur in Kerosene 2/19/88 1995
1617 Sulfur in Kerosene 2/19/88 1995
1619 Sulfur in Residual Fuel Oil, 0.7% 12/22/81 1991, 1998
1620 Sulfur in Residual Fuel Oil, 4% 12/1/79 1981, 1990
1621 Sulfur in Residual Fuel Oil, 1% 12/11/67 1980, 1981,1986, 1991, 1996
1622 Sulfur in Residual Fuel Oil, 2% 12/11/67 1979, 1981,1986, 1991, 1997
1623 Sulfur in Residual Fuel Oil, 0.3% 4/7/71 1981, 1990, 1996
1624 Sulfur in Distillate Fuel Oil, 0.4% 4/7/71 1981, 1990, 1997
1819 Sulfur in Lubricating Base Oil 7/17/85 1994
2294 Reformulated Fuels (nom. 11% MTBE, 35 mg/kg sulfur) 3/10/98
2295 Reformulated Fuels (nom. 15% MTBE, 300 mg/kg sulfur) 3/10/98
2296 Reformulated Fuels (nom. 13% ETBE, 35 mg/kg sulfur) 3/10/98
2297 Reformulated Fuels (nom. 10% Ethanol, 300 mg/kg sulfur) 3/10/98
2717 Sulfur in Residual Fuel Oil 10/25/90
2718 Green Petroleum Coke 7/15/99
2719 Calcined Petroleum Coke 7/15/99
2724 Sulfur in Distillate Fuel Oil, 0.04% 8/17/92 1995
1632 Trace Elements in Coal (Bituminous) 3/7/75 1978, 1998
1633 Trace Elements in Coal Fly Ash 3/7/75 1979, 1993
1635 Trace Elements in Coal (Subbituminous) 10/24/95
2682 Sulfur in Coal, 0.5% 12/14/82 1998
2683 Sulfur in Coal, 2% 12/14/82 1992, 1997
2684 Sulfur in Coal, 3% 12/14/82 1992
2685 Sulfur in Coal, 5% 12/14/82 1994
2690 Trace Elements in Coal Fly Ash 12/20/93
2691 Trace Elements in Coal Fly Ash 12/20/93
2692 Sulfur in Coal, 1% 11/15/88 1994
2775 Foundry Coke 5/12/99
2776 Furnace Coke 3/19/98
aThe first certificate date indicates the date that the certificate was issued for the first batch of this SRM. As new batchesare developed, new certificates are issued and the SRM is redesignated with an appropriate letter after the numbersignifying which batch it is from. For example, SRM 1632a was the second batch of 1632; SRM 1632b was the thirdbatch of 1632.
Economic Impact of Standard Reference Materials for Sulfur in Fossil Fuels
1-6
Many companies and individuals benefit from the availability ofSRMs that improve the measurement of the sulfur content of fossilfuels. We focused on those industries that make the most extensiveuse of these SRMs and benefit most directly from their use. Theseindustries include
Z the sulfur measurement industry, including manufacturers ofsulfur measurement instruments, certified referencematerials (CRM), and independent laboratories that conductsulfur analysis;
Z the fossil fuels extraction, processing, and transportationindustry, including coal processing, petroleum refining, andcoke production;1 and
Z primary users of fossil fuels, including the electric utilityindustry and the steel industry. Industrial combustion alsoaccounts for a large percentage of the fossil fuels consumedin the U.S. However, because of the difficulty ofcharacterizing the diverse set of industries that engage inindustrial combustion, we did not address industrialcombustion in this study.2
1.3 SUMMARY OF ANALYTICAL APPROACH ANDREPORT ORGANIZATIONNIST SRMs support the measurement of sulfur in fossil fuels. Thesemeasurements are provided by a sulfur measurement industry andsupport economic activity in the entire fossil fuel supply chain. Toestimate the economic impact of SRMs for sulfur in fossil fuels onthese industries, we employed a methodology that allowed us tovalue the economic outcomes resulting from decisions that use theimproved information provided by NIST SRMs. Figure 1-1 providesan overview of this method. First, we examined how NIST SRMsaffect the measurement of sulfur in fossil fuels, including theaccuracy of these estimates and the cost of conducting these tests.Second, we evaluated how improvements in measurement qualityprovided by NIST SRMs affect the behavior of people and
1Although natural gas would normally be included in this characterization, we did
not analyze the natural gas industry because NIST does not provide an SRM forsulfur in natural gas. As described in Section 2, this is because very little sulfuris found in natural gas, and its measurement is not an important industry issue.
2Industrial combustion refers to the use of industrial, commercial, and institutional(ICI) boilers whose primary use is for process heating, electrical or mechanicalpower generation, and/or space heating.
Section 1 — Introduction
1-7
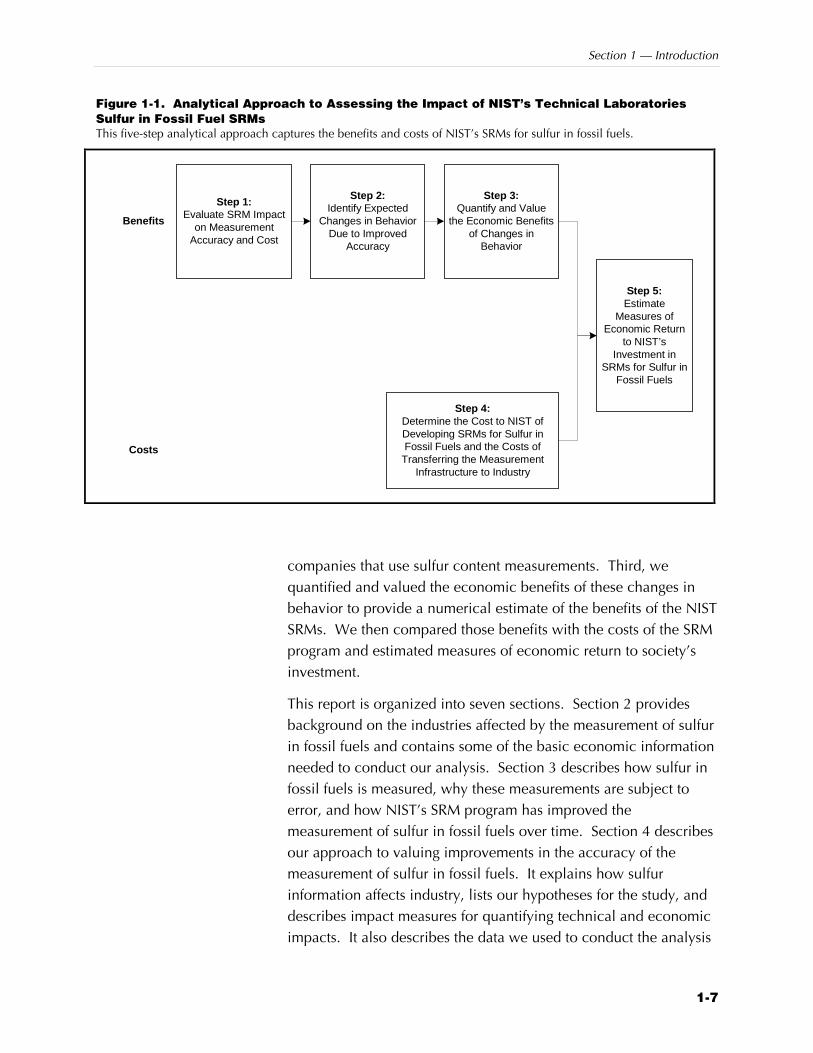
Figure 1-1. Analytical Approach to Assessing the Impact of NIST’s Technical LaboratoriesSulfur in Fossil Fuel SRMsThis five-step analytical approach captures the benefits and costs of NIST’s SRMs for sulfur in fossil fuels.
Step 1:Evaluate SRM Impact
on MeasurementAccuracy and Cost
Step 2:Identify Expected
Changes in BehaviorDue to Improved
Accuracy
Step 3:Quantify and Value
the Economic Benefitsof Changes in
Behavior
Step 4:Determine the Cost to NIST ofDeveloping SRMs for Sulfur inFossil Fuels and the Costs of
Transferring the MeasurementInfrastructure to Industry
Step 5:Estimate
Measures ofEconomic Return
to NIST’sInvestment in
SRMs for Sulfur inFossil Fuels
Benefits
Costs
companies that use sulfur content measurements. Third, wequantified and valued the economic benefits of these changes inbehavior to provide a numerical estimate of the benefits of the NISTSRMs. We then compared those benefits with the costs of the SRMprogram and estimated measures of economic return to society’sinvestment.
This report is organized into seven sections. Section 2 providesbackground on the industries affected by the measurement of sulfurin fossil fuels and contains some of the basic economic informationneeded to conduct our analysis. Section 3 describes how sulfur infossil fuels is measured, why these measurements are subject toerror, and how NIST’s SRM program has improved themeasurement of sulfur in fossil fuels over time. Section 4 describesour approach to valuing improvements in the accuracy of themeasurement of sulfur in fossil fuels. It explains how sulfurinformation affects industry, lists our hypotheses for the study, anddescribes impact measures for quantifying technical and economicimpacts. It also describes the data we used to conduct the analysis

Economic Impact of Standard Reference Materials for Sulfur in Fossil Fuels
1-8
and the data collection process. Section 5 describes the results ofthe study, carefully reviewing the evidence to support or refuteeach of the hypotheses developed in Section 4. Section 6 explainswhy NIST has played, and will continue to play, such an importantrole in the development of these SRMs. Section 7 offersconclusions based on our analysis and observations about the roleof NIST SRMs in industry.
2-1
Overview of2 Affected Industries
The combustion of fossil fuels provides 85 percent of the energyconsumed in the U.S. Each year U.S. households and industryconsume 1 billion tons of coal, 7 billion barrels of oil, and 20,000cubic feet of natural gas (U.S. DOE, 1998a). Fossil fuels affectvirtually every sector of the U.S. economy because they provide thepower required to manufacture goods; heat and cool homes,offices, and factories; provide services; and transport people andgoods.
Sulfur is an important factor in determining the value of fossil fuels.Increasingly strict environmental regulations limit the sulfur contentof some fuels and also limit sulfur compound emissions that resultfrom its combustion. Sulfur also has a negative impact on thequality of some products and processes. Removing sulfur fromfossil fuels is expensive, and the natural sulfur content of these fuelsis increasing.
Because sulfur is an important determinant of the value of fossilfuels, an accurate measurement of the sulfur content of fossil fuelsand of downstream products is essential to support commerce.These measurements also help industry demonstrate regulatorycompliance and control the quality of their products.
NIST SRMs facilitate measurements and standards throughout thefossil fuel supply chain. The measurement industry uses NIST SRMsto verify the quality of their instruments’ calibration, referencematerials, and measurement procedures. The fossil fuel extractioncompanies and their customers use NIST SRMs similarly to verifythe quality and reliability of the measurements they make fortransactions, process control, and environmental compliance. The
Economic Impact of Standard Reference Materials for Sulfur in Fossil Fuels
2-2
regulatory community uses SRMs to ensure environmentalcompliance by the regulated industries.
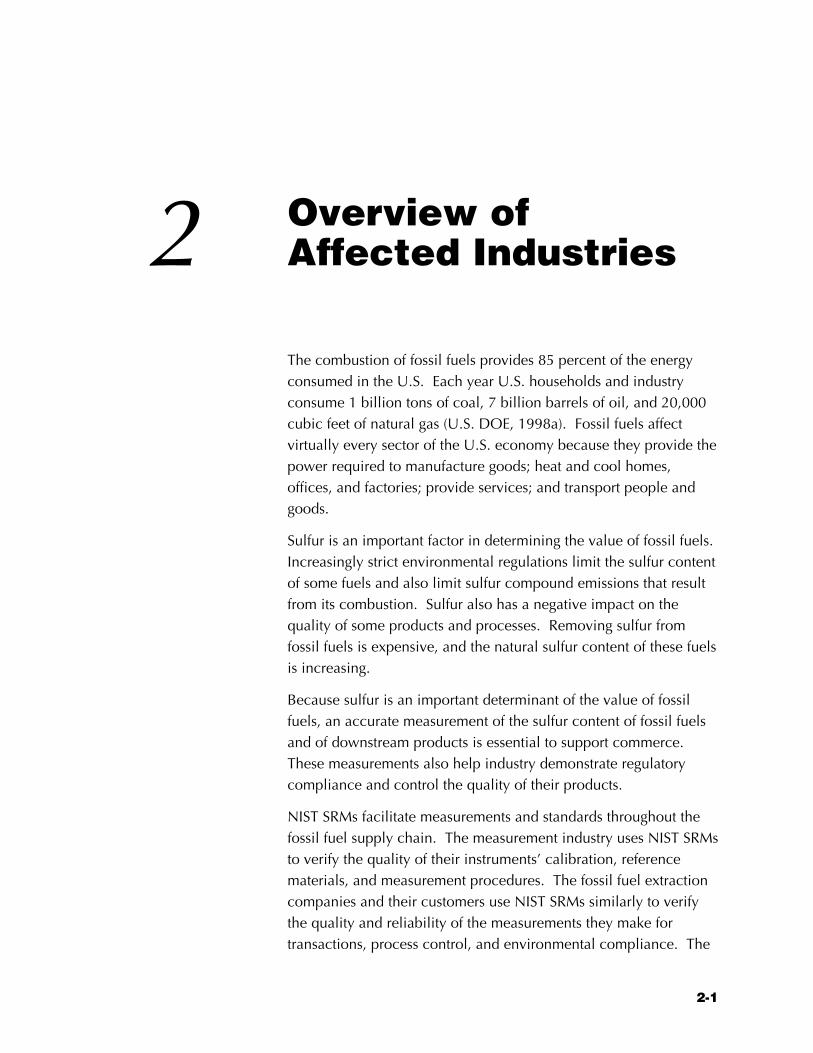
Figure 2-1 illustrates the relationships among the industries in thesupply chain. Appendix C contains profiles of the industries thatuse SRMs to measure sulfur content. It describes the importance ofsulfur as a characteristic of fossil fuels; includes a profile of theaffected industries; and describes how NIST SRMs support theseindustries.
NIST
ProcessedFossil Fuels
Fossil Fuel Combustion• Electricity Generation• Steel Industry• Industrial Combustion
Users of Power, Steel, andOther Goods and Services
Power andSteel
SRMs
Sulfur MeasurementProducts and Services
Fossil Fuel Extraction, Processing, andTransportation
• Coal Processing• Petroleum Refining• Coke Production
Sulfur Measurement• Instrument Manufacturers• Manufacturers of Certified Reference
Materials• Independent Testing Laboratories
Figure 2-1. IndustriesAffected byMeasurement of Sulfur inFossil FuelsSulfur measurement issupported by each element ofthe measurement industry and isused by each member of thefossil fuel supply chain.
Section 2 — Overview of Affected Industries
2-3
This section provides an overview of the key industries discussed inAppendix C. Although many industries engage in the measurementof sulfur content, we concentrated on three sectors—sulfurmeasurement industry, coal processing, and petroleum refining—because they are primary users of SRMs for their in-house sulfurmeasurement activities.1
2.1 SULFUR MEASUREMENT INDUSTRYThe industry that supports the measurement of sulfur in fossil fuelsincludes the manufacturers of instruments, suppliers of CRMs, andindependent laboratories that conduct sulfur analysis.
2.1.1 Instrument Manufacturers
Determinators, spectrometers, elemental analyzers, andchromatographers are measurement equipment used to determinethe elemental composition of organic and inorganic samples.Manufacturers and consumers of these measurement instrumentsuse NIST’s sulfur SRMs to test and calibrate their equipment. Theseinstruments must be properly calibrated to provide qualitylaboratory results. Sulfur SRMs allow technicians to test aninstrument’s accuracy and inform them of any need foradjustments. Equipment technicians may use NIST’s sulfur SRMsdirectly, or they may use NIST-traceable CRMs from a secondarymanufacturer to calibrate laboratory equipment.
2.1.2 Manufacturers of Certified Reference Materials
A certified reference material (CRM) is defined by the InternationalStandards Organization (ISO) as “a reference material one or moreof whose property values are certified by a technically validprocedure, accompanied by or traceable to a certificate or otherdocumentation which is issued by a certifying body” (AmericanNational Standards Institute [ANSI], 1981). CRMs are used in thesame way as NIST SRMs for equipment calibration, developmentof other standards, and quality control for analyzing sulfur in fossilfuels. CRMs are often used in conjunction with NIST SRMs. Inmany laboratories, CRMs are used on a daily basis while NISTSRMs are used only occasionally. 1Appendix C also contains an overview of the coke, electricity, and steel industries
and discusses sulfur measurement issues related to these industries.
Economic Impact of Standard Reference Materials for Sulfur in Fossil Fuels
2-4
CRMs are generally prepared using NIST SRMproducts (when available) and ASTM procedures.However, none of the CRM producers duplicate theprocedures followed by NIST. NIST SRMs for sulfurin fossil fuels are certified using a technique knownas IDMS. As explained in Section 3, IDMS is adefinitive method that virtually eliminates bias andsignificantly reduces the relative uncertaintyassociated with reference materials. No commercialCRM manufacturers use IDMS; instead, they employASTM methods and/or interlaboratory testing forcertification. The less rigorous process used by theCRM manufacturers can sometimes lead to significantdifferences between the accuracy and precision ofthe certified values provided by NIST and thoseprovided by a CRM manufacturer.
2.1.3 Independent Sulfur Testing Laboratories
Independent sulfur testing laboratories fall within SIC 8734, TestingLaboratories. In 1992, the U.S. had over 4,500 commercial testinglaboratories generating almost $5 billion in revenue and $2 billionin payroll each year (U.S. DOC, 1994).2 A small subset of theselaboratories conducts sulfur analysis of fossil fuels. Theselaboratories provide inspection, sampling, and analytical servicesfor fossil fuel producers and consumers.
Independent laboratories are an important link in the supply chainaffected by SRMs. Although many mines, coking plants, coalpreparation plants, utilities, and refineries have their ownlaboratories for these analyses, independent laboratories arebecoming more important, particularly for contractual matters.Third-party independent laboratory results are routinely used tosatisfy contractual requirements for buyers and sellers in the coalindustry, and this arrangement is increasing in the petroleumindustry as well. To cut costs, some firms also hire independentlaboratories rather than operate their own.
2These figures include taxable firms only. Noncommercial research organizations
are not included.
Traceability ensures that secondary standards,such as CRMs, can be linked to nationalstandards. However, the length of the pathwayfrom the user of a measurement back throughintermediate calibration to national standardsor fundamental constants has an importanteffect on the level of uncertainty of themeasurement. With each transfer point alongthe traceability pathway, the accuracy of themeasurement degrades because eachlaboratory introduces its own measurementerror to the process. Furthermore, it is notalways a simple matter to interpret theuncertainty measurements provided byintermediate laboratories. For this reason, it isgenerally presumed that a shorter traceabilitypathway is preferred when uncertainty must beminimized or when knowledge of uncertaintyis important (Garner and Rasberry, 1993).
Section 2 — Overview of Affected Industries
2-5
2.2 COAL INDUSTRYThe U.S. coal industry produces and distributes 1.1. billion shorttons of coal per year. The industry consists of a few very largecompanies that produce more than 50 percent of total coalproduction and many mid-size and small companies. Informationabout the sulfur content of coal is very important to this industrybecause the price of coal is a function of its sulfur content amongother attributes. Removing sulfur from coal is expensive, and thesulfur content of coal determines whether an electric utility plantthat burns it can meet its regulatory emissions requirements forSO2.
Coal is generally classified into four sulfur categories: compliance,low sulfur, medium sulfur, and high sulfur. Compliance coal hasthe lowest sulfur content—0.6 pounds per million Btus or less. Itnaturally falls within federal emissions regulations and thereforerequires less cleaning before combustion. Low-sulfur coal hasbetween 0.61 and 1.25 pounds of sulfur per million Btus, mediumsulfur coal between 1.26 and 1.67 pounds per million Btus, andhigh-sulfur coal more than 1.67 pounds per million Btus.
Coal’s sulfur content varies by the location from which it is mined.Generally, western coal (from Colorado, North Dakota, andWyoming, for example) is lowest in sulfur; Appalachian coal (fromPennsylvania, West Virginia, and Kentucky, for example) is eitherlow or medium sulfur; and interior coal (from Indiana, Illinois,Ohio, for example) is medium and high sulfur.
2.2.1 Coal Cleaning and Processing
Coal processing entails the mining, cleaning, and distribution ofcoal from underground and surface mines. Figure C-4 inAppendix C provides an overview of activities, inputs, and outputsof the coal processing industry.
Coal is extracted from two categories of mines: underground andsurface mines. Underground coal mining entails cutting a slot,known as a kerf, at the bottom of a face; drilling holes in the facefor explosives or compressed air; blasting the coal; and loading andhauling it out of the working area to a conveyor belt or mine cars(Pennsylvania Department of Environmental Protection, 1999).Surface mining refers to the removal of dirt and rock on top of a
Economic Impact of Standard Reference Materials for Sulfur in Fossil Fuels
2-6
coal seam so that it can be excavated, placed on conveyors, andsent to preparation plants. Strip mining is the most popular surfacemining method in the U.S.
On-site coal preparation plants make coal more valuable throughsize reduction, desulfurization, and removal of moisture andinorganic impurities. Nearly 50 percent of the coal mined in theU.S. passes through coal preparation plants; east of the MississippiRiver this number increases to 80 percent (Fonseca, 1995). Coalpreparations, which “clean” coal by removing impurities, mayaccount for 5 to 15 percent of the cost of coal production (Hortonand Bloom, 1993).
Coal preparation plants remove coal mechanically by takingadvantage of differences between the impurities and the coal’sdensity. Water is used to fluidize a bed of crushed coal and itscontaminants. As the lighter coal particles float to the top, theimpurities are separated. The coal is then skimmed off the top ofthe bed and dried using a combination of hot gases. Coal is alsoblended to meet customer specifications. For example, high- andlow-sulfur coal can be mixed together as part of the preparationand cleaning process to ensure the sulfur content of the deliveredcoal meets sulfur levels specified in contracts.
2.3 PETROLEUM INDUSTRYThe U.S. petroleum industry supplies over 6 billion barrels ofpetroleum products per year. The industry is dominated by a smallnumber of large, vertically integrated companies. This structure isdriven by the large capital costs associated with the petroleumrefining technology.
The main determinants of crude oil prices are sulfur content (sweetversus sour) and API gravity (light versus heavy). High API gravity,or light crude, is more valuable because it is used in more high-endproducts when distilled and has fewer impurities. Sulfurinformation allows refineries to control the sulfur content of outputstreams and emissions. Both are required for regulatorycompliance
The composition of crude oil varies greatly from field to fieldthroughout the world. For example, Alaskan crude typically has alow sulfur content (sweet), and South American crude typically has
Section 2 — Overview of Affected Industries
2-7
a high sulfur content (sour). Crude oil with a high sulfur content ismore expensive to refine because it is difficult to separate sulfurcompounds from pure hydrogen/carbon compounds (Leffler, 1985).
2.3.1 Petroleum Processing and Desulfurization
Petroleum refining is the physical, thermal, and chemicalseparation of crude oil into its major distillation fractions, which arethen further processed through a series of separation andconversion steps into finished petroleum products and chemicalindustry feedstocks.
Sulfur is removed from petroleum products by reacting it withhydrogen gas in the presence of a catalyst at a moderately hightemperature and pressure. This process is referred to ashydrodesulfurization or hydrofinishing. In addition todesulfurization of final products, sulfur recovery for sale ofelemental sulfur is also conducted for refinery process off-gasstreams as part of emissions reduction activities. The sulfur isconverted to hydrogen sulfide, which is then absorbed throughdesulfurization of stack gases.
Desulfurization of petroleum output streams can be very expensive.As part of background research for the development of its newsulfur content in gasoline regulations, EPA developed estimates ofthe cost of removing sulfur from gasoline. As shown in Table C-16in Appendix C, for example, reducing the sulfur content of gasolinefrom 330 ppm to 40 ppm costs about 1.6 cents per gallon.3
Maintaining specific sulfur levels in output streams and process off-gas streams is difficult because of the varying content of sulfur incrude oil. Accurate information about the sulfur content of thecrude oil and the output streams is essential to maintaining productspecifications and maximizing the efficiency of the processingequipment.
3The American Petroleum Institute (API) believes that EPA underestimated the
added cost of reducing the sulfur content of gasoline below current levels. Thetrade association funded a series of studies conducted by MathPro thatestimated the cost to be 2.3 to 2.6 cents per gallon (Octane Week, 1999).Although API’s estimates are provided in Table C-16, the economic estimatespresented in this study are based on the more conservative EPA estimates ofapproximately 1 cent per gallon.
3-1
SRMs and Sulfur3 Measurement
To assess the economic impact of SRMs on the affected industries,we must first assess the impact of NIST SRMs on the accuracy ofsulfur content measurement. In this section, we demonstrate thatNIST SRMs are responsible for reducing the bias and improving theprecision of sulfur content measurement in industry. We quantifythe relationship between NIST SRMs and sulfur measurementaccuracy and use this relationship in the next stage of the analysis.
We begin by describing the sources of variability in measurementand how this variability is quantified. Then we describe the ASTMmethods used most frequently to measure the sulfur content offossil fuels, including the role of reference materials in thesemethods. We explain how bias and uncertainty in a referencematerial introduce bias and uncertainty into the measurementprocess. In Section 3.3, we describe the process of SRMdevelopment and the history of the NIST SRM program for sulfur infossil fuels. We demonstrate the relationship between NIST’smethodology development and the reduction in uncertainty andbias associated with the certified values of NIST SRMs. Finally, weconclude that, in the absence of the NIST SRM program, theaccuracy of measurements of sulfur in fossil fuels would today besimilar to what it was prior to the introduction of new NISTmethods in the early 1980s.
3.1 UNCERTAINTY IN THE MEASUREMENT OFSULFUR IN FOSSIL FUELSAll measurements, including measurements of the sulfur content offossil fuels, are subject to some uncertainties. The measured value
Economic Impact of Standard Reference Materials for Sulfur in Fossil Fuels
3-2
of a variable is a function of both its true value and themeasurement system. The measurement system contains a numberof elements that contribute to uncertainty in measurement (Taylor,1997; Bentley, 1983). Uncertainties of analytical measurementsmust be quantified so that decision-makers can understand thedegree of reliability of the result. NIST SRMs play a role in bothreducing and quantifying the uncertainty of field laboratorymeasurements.
3.1.1 Sources of Variability in Measurement
A number of factors contribute to uncertainty in measurement.NIST defines accuracy as the closeness of a measured value to thetrue value. Accuracy is a “relative” measure and includes both theconcepts of precision and bias. Precision refers to the variability ofindividual results of replicate measurements. Bias is the differencebetween the observed mean of those measurements and the truemean (Taylor, 1993).
The ASTM defines the sources of variability of a measurementmethod, each of which belongs to one of the following categories:1
Z the operator
Z the apparatus
Z the environment
Z the sample
Z time
The operator must interpret the test method and execute it. Thegreater the clarity of the test method, the less it is open to incorrectinterpretation. Different operators (and the same operator atdifferent times) introduce variability into the process because ofdifferences in dexterity, reaction time, color sensitivity, ability tointerpolate scale readings, and so forth.
Apparatus typically allow variations in measurements due tospecification tolerances. Because no apparatus can be built thathas zero tolerance, these variations are one source of variabilitybetween test results from different test equipment. Apparatuscalibration is also a potential source of error. An instrument that isnot calibrated correctly or is calibrated to an incorrect standard
1This section is taken from ASTM Method E 177.
Section 3 — SRMs and Sulfur Measurement
3-3
may introduce bias into the measurement process. NIST SRMs forsulfur in fossil fuels directly impact this potential source of bias.
The environment also contributes to measurement uncertainty.Although test methods typically specify the standard environmentalconditions for testing, these factors cannot be controlled perfectly.Thus, slight differences in environment yield differences in testresults.
Another source of uncertainty is sampling. A batch or lot ofmaterial to be tested (such as a shipment of coal or tank of fuel) israrely perfectly uniform. Sampling methods are typically employedto ensure that the sample is representative of the lot; however,sampling is often (especially in the case of coal, which is typicallyvery heterogeneous) a large source of measurement uncertainty.
All of the above sources of uncertainty in measurement can changeover time, and this contributes to variability in measurement. Forexample, the environment in a laboratory may changesystematically over time. Thus, the longer the amount of timebetween different realizations of a test method, the greater thepotential variability in the results.
These sources of uncertainty suggest strategies to reduceuncertainty in the measurement process. Variability due to theoperator can be reduced by providing clear, complete instructionsto operators regarding the proper methodology. Careful trainingand quality control in the execution of the method might alsoreduce the uncertainty associated with the test method.
Uncertainty due to the apparatus can be reduced by improving theinstrument’s tolerances, by more careful (or more frequent)calibration and quality control of the instrument, or by calibrationto a more reliable standard. Calibration to a more reliable standardand the ability to perform quality control against a known isperhaps the primary contribution of NIST SRMs to reducinguncertainty in measurement. They also allow the bias andprecision of a measurement process to be quantified.
Variability due to the environment can be reduced by carefullycontrolling the conditions under which measurements are made.Uncertainty due to the sample can be reduced by taking moresamples or by taking more composites of a sample.
Economic Impact of Standard Reference Materials for Sulfur in Fossil Fuels
3-4
3.1.2 Quantifying the Uncertainty of a MeasurementProcess
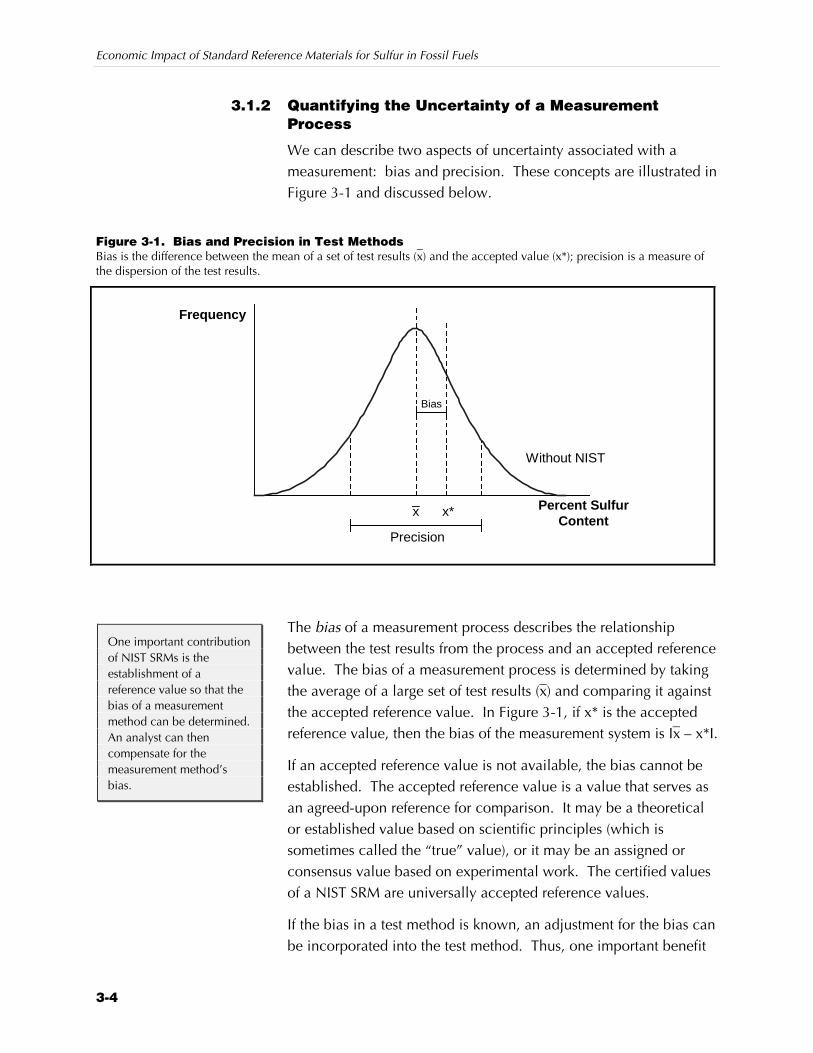
We can describe two aspects of uncertainty associated with ameasurement: bias and precision. These concepts are illustrated inFigure 3-1 and discussed below.
Figure 3-1. Bias and Precision in Test MethodsBias is the difference between the mean of a set of test results (x
–) and the accepted value (x*); precision is a measure of
the dispersion of the test results.
Frequency
Without NIST
Percent SulfurContent
_x
Precision
Bias
x*
The bias of a measurement process describes the relationshipbetween the test results from the process and an accepted referencevalue. The bias of a measurement process is determined by takingthe average of a large set of test results (x–) and comparing it againstthe accepted reference value. In Figure 3-1, if x* is the acceptedreference value, then the bias of the measurement system is Ix– – x*I.
If an accepted reference value is not available, the bias cannot beestablished. The accepted reference value is a value that serves asan agreed-upon reference for comparison. It may be a theoreticalor established value based on scientific principles (which issometimes called the “true” value), or it may be an assigned orconsensus value based on experimental work. The certified valuesof a NIST SRM are universally accepted reference values.
If the bias in a test method is known, an adjustment for the bias canbe incorporated into the test method. Thus, one important benefit
One important contributionof NIST SRMs is theestablishment of areference value so that thebias of a measurementmethod can be determined.An analyst can thencompensate for themeasurement method’sbias.
Section 3 — SRMs and Sulfur Measurement
3-5
of having an accepted reference value is the ability to assess andadjust for the bias.
The precision of a test method refers to the closeness of agreementamong multiple test results obtained under similar conditions. Thegreater the dispersion of the results, the poorer the precision. Twodifferent types of precision are commonly determined for a testmethod. Repeatability (r) is determined by conducting the methodrepeated times under similar conditions within a single laboratory,by the same operator, with the same equipment, in the shortestpractical period of time. Reproducibility (R) is determined from theresults of tests obtained in different (independent) laboratoriesunder similar conditions.
Precision is often expressed as an index in the same units as the testresult. These indexes are related to the estimate of the samplestandard deviation, s, of a random set of test results. The twoindexes of precision used most commonly by the ASTM for sulfur infossil fuels are as follows:
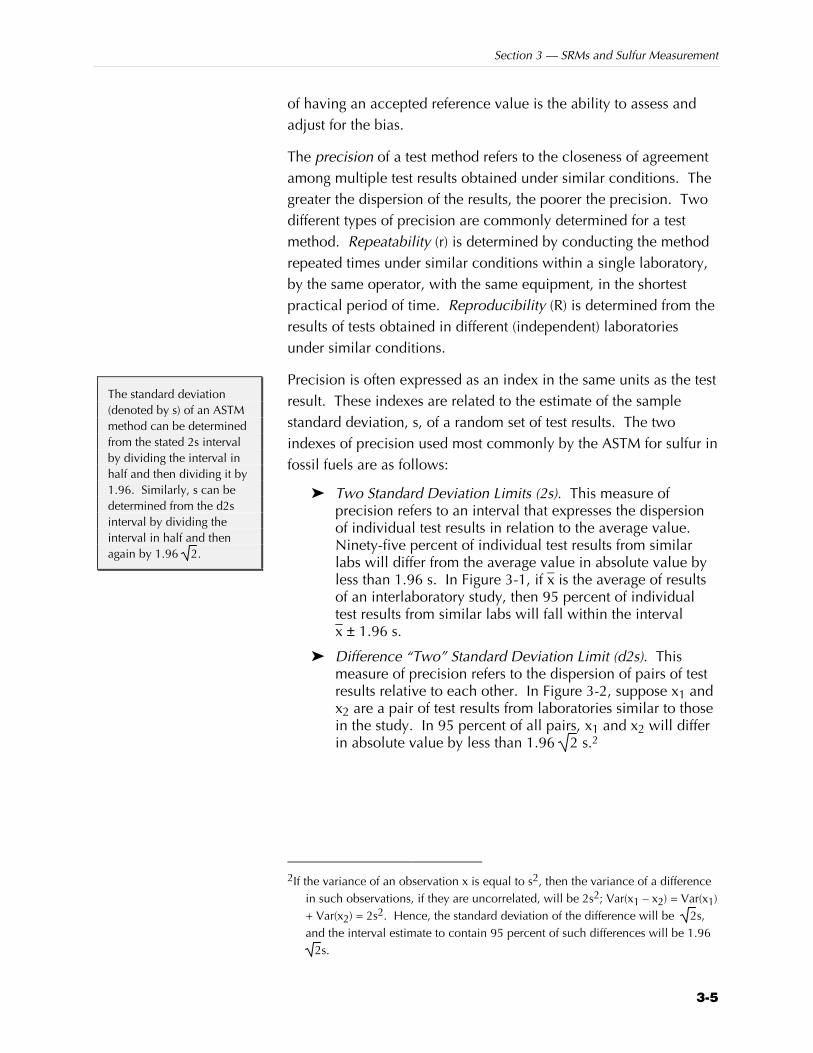
Z Two Standard Deviation Limits (2s). This measure ofprecision refers to an interval that expresses the dispersionof individual test results in relation to the average value.Ninety-five percent of individual test results from similarlabs will differ from the average value in absolute value byless than 1.96 s. In Figure 3-1, if x– is the average of resultsof an interlaboratory study, then 95 percent of individualtest results from similar labs will fall within the intervalx– ± 1.96 s.
Z Difference “Two” Standard Deviation Limit (d2s). Thismeasure of precision refers to the dispersion of pairs of testresults relative to each other. In Figure 3-2, suppose x1 andx2 are a pair of test results from laboratories similar to thosein the study. In 95 percent of all pairs, x1 and x2 will differin absolute value by less than 1.96 2 s.2
2If the variance of an observation x is equal to s2, then the variance of a difference
in such observations, if they are uncorrelated, will be 2s2; Var(x1 – x2) = Var(x1)+ Var(x2) = 2s2. Hence, the standard deviation of the difference will be 2s,and the interval estimate to contain 95 percent of such differences will be 1.96
2s.
The standard deviation(denoted by s) of an ASTMmethod can be determinedfrom the stated 2s intervalby dividing the interval inhalf and then dividing it by1.96. Similarly, s can bedetermined from the d2sinterval by dividing theinterval in half and thenagain by 1.96 2.
Economic Impact of Standard Reference Materials for Sulfur in Fossil Fuels
3-6
Frequencyof x2
PercentSulfur
Contentd2s Interval
x1x1 – 1.96 2 s x1 + 1.96 2 s
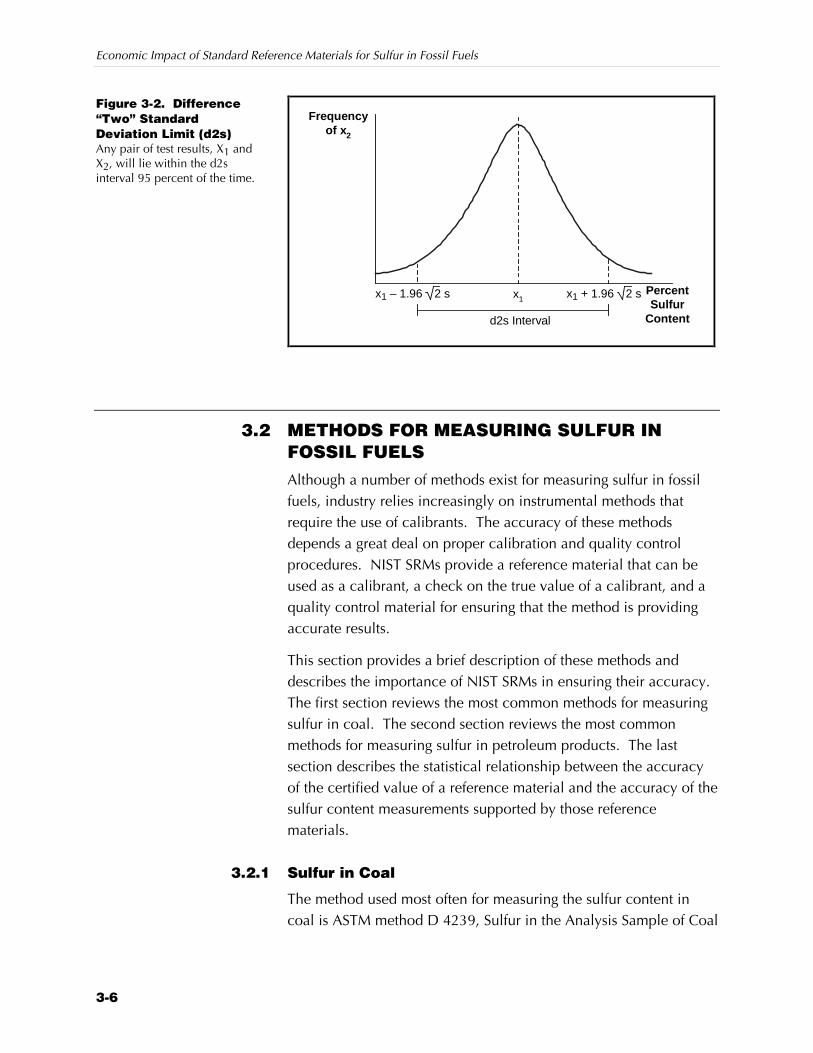
3.2 METHODS FOR MEASURING SULFUR INFOSSIL FUELSAlthough a number of methods exist for measuring sulfur in fossilfuels, industry relies increasingly on instrumental methods thatrequire the use of calibrants. The accuracy of these methodsdepends a great deal on proper calibration and quality controlprocedures. NIST SRMs provide a reference material that can beused as a calibrant, a check on the true value of a calibrant, and aquality control material for ensuring that the method is providingaccurate results.
This section provides a brief description of these methods anddescribes the importance of NIST SRMs in ensuring their accuracy.The first section reviews the most common methods for measuringsulfur in coal. The second section reviews the most commonmethods for measuring sulfur in petroleum products. The lastsection describes the statistical relationship between the accuracyof the certified value of a reference material and the accuracy of thesulfur content measurements supported by those referencematerials.
3.2.1 Sulfur in Coal
The method used most often for measuring the sulfur content incoal is ASTM method D 4239, Sulfur in the Analysis Sample of Coal
Figure 3-2. Difference“Two” StandardDeviation Limit (d2s)Any pair of test results, X1 andX2, will lie within the d2sinterval 95 percent of the time.
Section 3 — SRMs and Sulfur Measurement
3-7
and Coke Using High-Temperature Tube Furnace CombustionMethods. This method actually comprises three different methods:
Z High-Temperature Combustion Method with Acid BaseTitration Detection Procedures
Z High-Temperature Combustion Method with IodimetricTitration Detection Procedures
Z High-Temperature Combustion Method with InfraredAbsorption Detection Procedures
Among these three methods, the most common is the last. Thismethod uses an infrared (IR) absorption detector to measure theamount of sulfur dioxide present in a sample of coal that is burnedin a tube furnace. The method is based on the fact that sulfurdioxide absorbs IR energy at a precise wavelength within the IRspectrum. The amount of sulfur dioxide in the sample isproportional to the change in energy at the detector. Because thismethod is empirical, the apparatus must be calibrated.
The infrared detection system must be calibrated using SRMs,reference coals, or calibrating agents with known dry-basis sulfurvalues in the range of the samples to be analyzed. These SRMs,reference coals, or calibrating agents must have precision values ofless than or equal to method repeatability.3 They must be stablewith respect to moisture and pulverized to pass 100 percentthrough a 0.250 mm (no. 60) USA Sieve.
Precision and Bias
ASTM reports the precision for the IR method as both the 2s methodand the “d2s” measure described above. The precision intervalsare reported in Table 3-1. These precision statements are valid fordetermining sulfur in the concentration range from 0.28 to 5.61percent. The ASTM notes that this method has no bias if theinstrument is properly calibrated against certified referencestandards. This underscores the importance of unbiased SRMs inusing this method.
3NIST SRMs meet this criterion. For example, the NIST SRM for sulfur in coal,
2 percent (2683b), has a 95 percent confidence interval of ±0.041 percent, or0.082 (NIST, 1997). At 2 percent sulfur, the repeatability interval for ASTM4239 is about the same [0.02 + 0.03(2)] = 0.08 (ASTM, 1998).
Economic Im
pact of Standard Reference M
aterials for Sulfur in Fossil Fuels
3-8
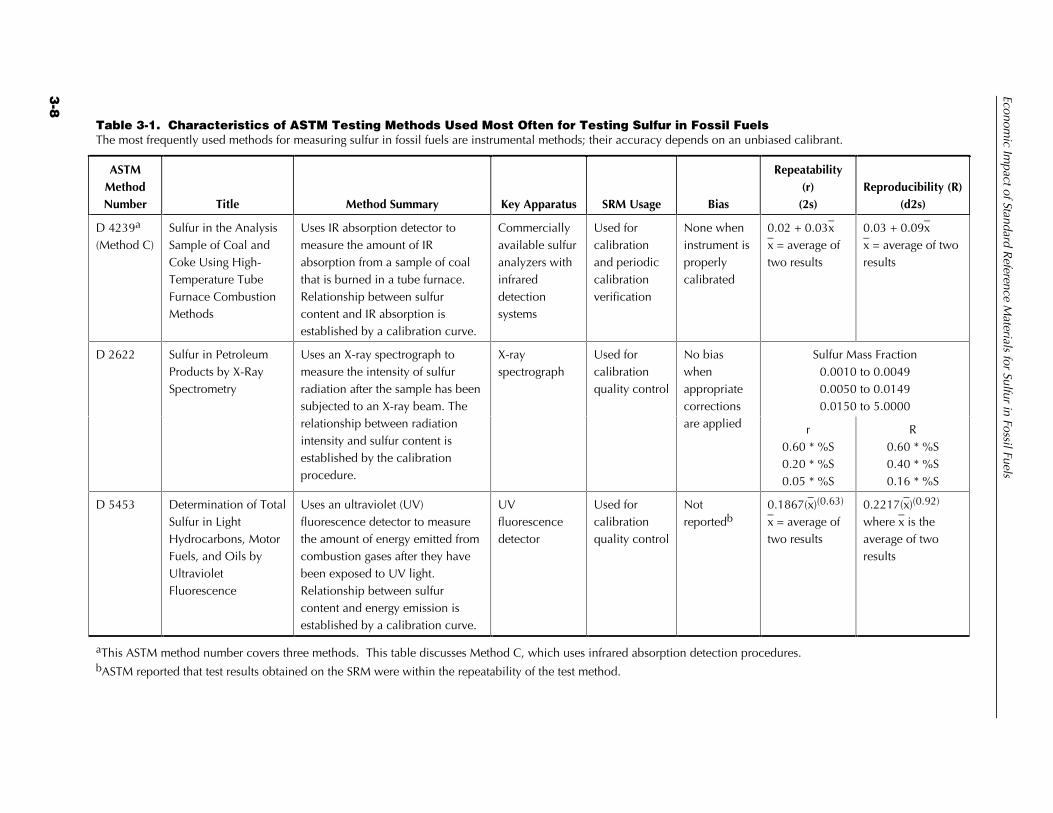
Table 3-1. Characteristics of ASTM Testing Methods Used Most Often for Testing Sulfur in Fossil FuelsThe most frequently used methods for measuring sulfur in fossil fuels are instrumental methods; their accuracy depends on an unbiased calibrant.
ASTMMethodNumber Title Method Summary Key Apparatus SRM Usage Bias
Repeatability(r)
(2s)Reproducibility (R)
(d2s)
D 4239a
(Method C)Sulfur in the AnalysisSample of Coal andCoke Using High-Temperature TubeFurnace CombustionMethods
Uses IR absorption detector tomeasure the amount of IRabsorption from a sample of coalthat is burned in a tube furnace.Relationship between sulfurcontent and IR absorption isestablished by a calibration curve.
Commerciallyavailable sulfuranalyzers withinfrareddetectionsystems
Used forcalibrationand periodiccalibrationverification
None wheninstrument isproperlycalibrated
0.02 + 0.03x–
x– = average of
two results
0.03 + 0.09x–
x– = average of two
results
Sulfur Mass Fraction0.0010 to 0.00490.0050 to 0.01490.0150 to 5.0000
D 2622 Sulfur in PetroleumProducts by X-RaySpectrometry
Uses an X-ray spectrograph tomeasure the intensity of sulfurradiation after the sample has beensubjected to an X-ray beam. Therelationship between radiationintensity and sulfur content isestablished by the calibrationprocedure.
X-rayspectrograph
Used forcalibrationquality control
No biaswhenappropriatecorrectionsare applied r
0.60 * %S0.20 * %S0.05 * %S
R0.60 * %S0.40 * %S0.16 * %S
D 5453 Determination of TotalSulfur in LightHydrocarbons, MotorFuels, and Oils byUltravioletFluorescence
Uses an ultraviolet (UV)fluorescence detector to measurethe amount of energy emitted fromcombustion gases after they havebeen exposed to UV light.Relationship between sulfurcontent and energy emission isestablished by a calibration curve.
UVfluorescencedetector
Used forcalibrationquality control
Notreportedb
0.1867(x–)(0.63)
x– = average of
two results
0.2217(x–)(0.92)
where x– is the
average of tworesults
aThis ASTM method number covers three methods. This table discusses Method C, which uses infrared absorption detection procedures.bASTM reported that test results obtained on the SRM were within the repeatability of the test method.
Section 3 — SRMs and Sulfur Measurement
3-9
Before coal can be analyzed for sulfur content, it must be sampledand prepared for analysis. Sampling and sample preparation are asignificant source of uncertainty in coal sulfur contentmeasurement. Two ASTM methods cover the procedures used forsampling coal:
Z ASTM D 2234, Standard Practice for Collection of a GrossSample of Coal
Z ASTM D 2013, Standard Method of Preparing Coal Samplesfor Analysis
As described below, one way to improve the precision of themeasurement of sulfur in fossil fuels is to increase the number ofsamples taken, analyze them separately, and report the average ofthe results. As described in ASTM D 2234, the control limits theorydefines the relationship between the number of samples andprecision. For example, to reduce the uncertainty by one-half(double the precision), four times as many gross samples must betaken. Similarly, to reduce errors to one-third (triple the precision),nine times as many gross samples must be taken. Increasing thenumber of increments in a gross sample can also increase themeasurement’s precision.
3.2.2 Sulfur in Petroleum Products
The methods used most often for measuring the sulfur content ofpetroleum products are ASTM D 2622, Sulfur in PetroleumProducts by X-Ray Spectrometry, and ASTM D 5453, Determinationof Total Sulfur in Light Hydrocarbons, Motor Fuels, and Oils byUltraviolet (UV) Fluorescence.
D 2622 is required by EPA for verifying sulfur in diesel fuel. It isalso required by the California Air Resources Board (CARB) fordetermining the sulfur content of high-sulfur fuels (exceeding 1,000ppm). ASTM Method D 5453 is required by CARB to determinesulfur levels in low-sulfur fuels (1 to 8,000 ppm). D 5453 is muchmore sensitive than D 2622.
In ASTM D 2622, the sample is placed in an X-ray beam, and theintensity of the sulfur radiation is measured by an X-rayspectrograph. The calibration procedure establishes therelationship between radiation intensity and sulfur content. Themeasured intensity is then compared to the previously establishedcalibration curve to obtain the concentration of sulfur.

Economic Impact of Standard Reference Materials for Sulfur in Fossil Fuels
3-10
The precision of this method is a function of the sulfur content ofthe sample. As shown in Table 3-1, the repeatability andreproducibility intervals, as a percentage of sulfur content, fall asthe sulfur content grows.
In ASTM D 5453, a sample of a hydrocarbon is oxidized to SO2.The sample combustion gases are exposed to ultraviolet light. AUV fluorescence detector is used to measure the light emitted bySO2. The sulfur contained in the sample is a function of emittedlight. The calibration procedure establishes the relationshipbetween emitted light and sulfur content.
The precision of this method is shown in Table 3-1. As in the caseof Method D 2622, the intervals become smaller (as a percentage ofthe concentration) as the concentration rises.
Both of these methods depend entirely on establishing a calibrationcurve, which, in turn, depends on a reliable calibration standard. Ifthe calibration standard used to establish the calibration curve isbiased, then the estimate of the sulfur content will be biased aswell.
Petroleum products must also be sampled prior to analysis.Sampling of petroleum products is not as problematic as samplingof coal, because the product tends to be more homogeneous.ASTM Method D 4057 addresses practices for manual sampling ofpetroleum and petroleum products. Sampling crude petroleum andresidual fuel oils is generally more difficult than sampling gasolineand distillate products because they are less homogeneous thangasoline and distillate products.
3.2.3 Reference and Sulfur Measurement
The instrumental methods used most often to measure the sulfurcontent of coal and petroleum products described above are basedon the classic linear calibration model shown in Figure 3-3. Theyrely heavily on the use of standards and calibrants. As shown in thefigure, if bias exists in the calibration standard used to calibrate theinstrument this will translate to bias in the instrument’s sulfurmeasurements.4
4Bias in the calibration standard is one potential counterfactual in the absence of
NIST SRMs.
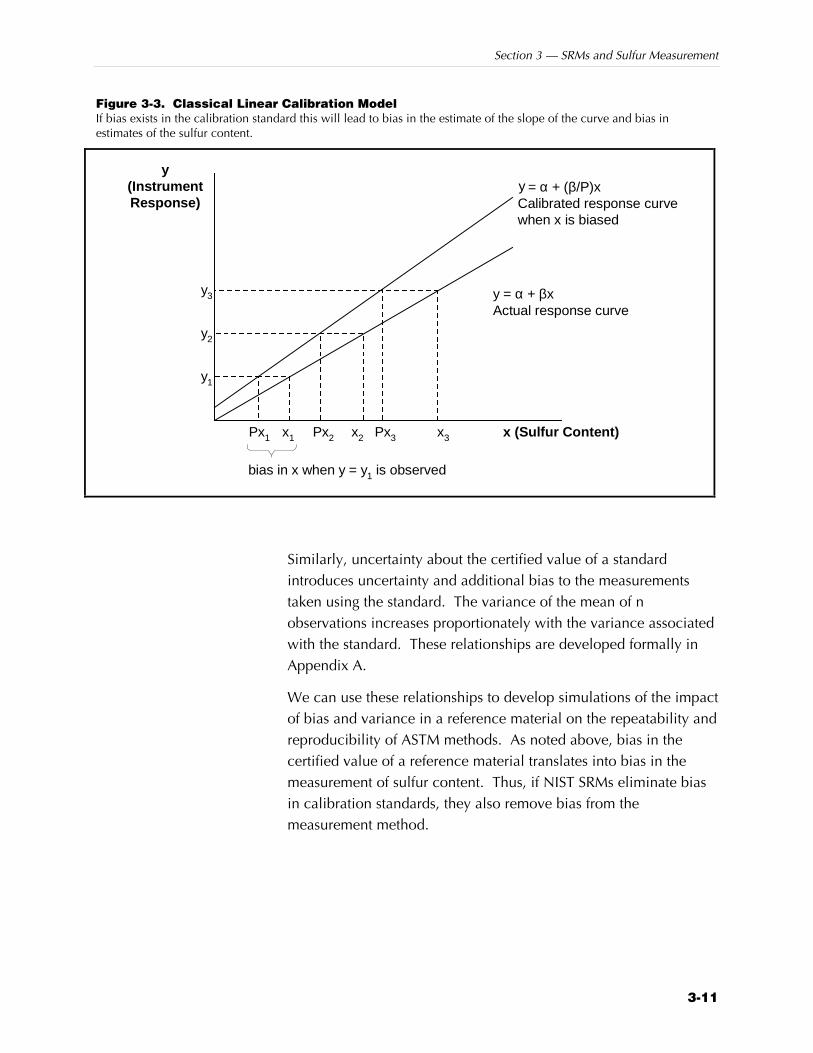
Section 3 — SRMs and Sulfur Measurement
3-11
Figure 3-3. Classical Linear Calibration ModelIf bias exists in the calibration standard this will lead to bias in the estimate of the slope of the curve and bias inestimates of the sulfur content.
y(InstrumentResponse)
x (Sulfur Content)
y = α + (β/P)xCalibrated response curvewhen x is biased
y1
x1Px1 Px2 Px3x2 x3
y = α + βxActual response curve
bias in x when y = y1 is observed
y
y3
y2
Similarly, uncertainty about the certified value of a standardintroduces uncertainty and additional bias to the measurementstaken using the standard. The variance of the mean of nobservations increases proportionately with the variance associatedwith the standard. These relationships are developed formally inAppendix A.
We can use these relationships to develop simulations of the impactof bias and variance in a reference material on the repeatability andreproducibility of ASTM methods. As noted above, bias in thecertified value of a reference material translates into bias in themeasurement of sulfur content. Thus, if NIST SRMs eliminate biasin calibration standards, they also remove bias from themeasurement method.
Economic Impact of Standard Reference Materials for Sulfur in Fossil Fuels
3-12
3.3 IMPACT OF NIST SRMS ON THEMEASUREMENT OF SULFUR IN FOSSILFUELSNIST’s SRM Program for sulfur in fossil fuels has improved theaccuracy of the measurement of sulfur in fossil fuels. NIST’s SRMdevelopment process is designed to provide a reference materialthat is unbiased and traceable to the System Internationale (SI)units. NIST’s SRM program for sulfur in fossil fuels uses a definitivemethod, developed at NIST, that virtually eliminates bias andsignificantly reduces the uncertainty of the SRMs. Without thedevelopment of this method, sulfur measurement in industry wouldbe subject to greater bias and uncertainty.
3.3.1 SRM Development Process
SRMs are developed in response to the measurement needs ofindustry and other NIST customers. Funding for research to supportSRM development can come from NIST internal research funds,other government agencies, as well as from industry. Theincremental costs associated with producing SRMs and maintainingthe SRM program are recovered through sales. NIST must balancethe application of its available resources versus the expressed needand projected impact in its SRM projects prioritization process,whether for new or renewal materials.
After identifying an SRM need, NIST conducts a careful analysis ofthe necessary properties of a useful reference material. Minimumspecifications for a candidate SRM are drafted, and a material isobtained, usually from a naturally occurring source. Thenmeasurements are made to evaluate the material’s compliance withthe specifications, and NIST begins the process of certifying theSRM.
SRM Certification: Basic Principles5
In certifying SRMs, the goal at NIST is to give a true value at astated level of uncertainty for each property or constituent certified.Four major considerations are involved in certifying an SRM byNIST.
5Much of this section is based on Taylor (1993).
Section 3 — SRMs and Sulfur Measurement
3-13
Homogeneity. It is essential that every subportion of a given lot bethe same within the overall uncertainty limits provided. This isnecessary so that each user obtains a portion that agrees with thecertified values. NIST conducts statistical assessments of thehomogeneity of the material. The degree of homogeneitycontributes to the uncertainty of the certified value.
Stability. If the material changes with time, it will eventually havetrue values that no longer agree with the certified values. NISTestablishes the long-term stability of the material and includes anycritical information concerning long-term storage or special stabilityrequirements. In the case where this long-term stability has notbeen established, the certificate provides this information (e.g.,“long-term [greater than one year] stability of this SRM has notbeen rigorously established. NIST will continue to monitor thismaterial and any substantive change will be reported topurchasers”). Increasingly, SRMs are provided with expirationdates after which their certificate is not valid.
Handling Procedures. Special procedures, such as cold storage,drying, and other preparation may be necessary for the proper useof the SRM. In the case of some SRMs, segregation on standing is apotential problem. The certificate will instruct the user to shake,rotate, stir, or otherwise reconstitute the material. Failure to do sonot only invalidates the present measurement but jeopardizesfurther measurement from the same container because of thedisproportionate withdrawal of the contents.
Certified Values. The certificate must state the best possible levelof accuracy for the certification. Sometimes this factor is stated as atolerance interval; more often than not, it is simply given as anestimated uncertainty. NIST tries to provide conservatively stateduncertainties to allow for unknown systematic errors. The certifiedvalue is not expected to deviate from the true value by more thanthe uncertainty stated on the certificate. This uncertainty is morethan a precision statement and includes the systematic error of themeasurements, method imprecision, and material heterogeneity.
Certification: Hierarchy of Measurement Methods
Several techniques are especially helpful in the quest forcertification accuracy. The quality of an SRM’s assigned value isbased on the existence and application of sound measurement
Economic Impact of Standard Reference Materials for Sulfur in Fossil Fuels
3-14
principles and practices (May et al., 1999). Definitive, or primary,methods (methods of highest accuracy) are most closely linked tobasic measurement units and thus reduce opportunities for error.Agreement of several independent laboratories using the same ordifferent methods provides additional reason for confidence. Twoapproaches are used by NIST for fossil fuel SRM certification. Inorder of preference they are:
1. Single primary method approach: measurement by adefinitive or primary method of known and demonstratedaccuracy having essentially zero systematic errors. Themeasurements may then be confirmed using an additionaltechnique.
2. Multiple independent method approach: measurement bytwo or more highly reliable independent critically evaluatedmethods, designated as reference methods having estimatedinaccuracies (including systematic errors) that are smallrelative to the required certification accuracy.
In general, NIST uses approaches 1 or 2 to develop and certifySRMs such as sulfur content in fossil fuels. Below, we describe thehierarchy of measurement methods and how it is applied in thecertification of an SRM.
Primary Methods. A primary method is a method of known anddemonstrable accuracy. To understand the use of primary methodsfor SRM certification, one must also understand the SI system ofunits. The SI system of units includes the seven base units: mass,length, time, electric current, thermodynamic temperature,luminous intensity, and the amount of substance (i.e., the mole).Using the basic equations of physics, one can describe theapproximately 50 derived units (e.g., volume, density, frequency,and viscosity) in terms of the base units. The derived units, togetherwith the base units, form the basis for the other experimentalmeasurement parameters that are normally determined in physicsand chemistry laboratories (e.g., absorbance, nuclear cross-section,spectral intensity, pH). It is not always possible to relate theexperimentally determined parameters to the basic units withoutusing extensive approximations or inexact equations. Theseapproximations may lead to large uncertainties in determining theexperimental parameters by introducing systematic errors.
Section 3 — SRMs and Sulfur Measurement
3-15
A primary method is one in which all significant parameters havebeen related by a direct or solid chain of evidence to the base orderived units of the SI. These definitive methods have a valid andwell-described theoretical foundation, have been experimentallyevaluated so that reported results have negligible systematic errors,and have high levels of precision. Such methods with highreliability give true values and are the most accurate methodsavailable to measure a given chemical property. They provide thefundamental basis for accuracy in chemical analysis. Allpotentially significant sources of error are evaluated explicitly foreach application and investigated matrix (May et al., 1999).
Primary methods are generally uneconomical for general use. Theyusually require highly skilled personnel and are time consuming aswell as expensive to perform. An example is the use of IDMS todetermine the concentration of an element in a sample. In IDMSthe concentration of unknown samples is related directly to theactual weights of spikes of isotopes or isotopically labeledcompounds. In terms of accuracy, the IDMS technique is powerfulbecause chemical manipulations are carried out on a direct weightbasis, and the mass spectrometric determinations involve isotopicratios rather than absolute isotope determinations, obviating theneed for instrumental corrections. Thus, systematic errors areessentially eliminated. This technique automatically and directlyresults in determining experimental parameters in terms of baseunits of measurement. Examples of other definitive techniques aregravimetry and coulometry.
Once a value has been assigned to a reference material, thatmeasurement is confirmed using an additional technique.Confirmation may be accomplished using one of the followingthree possibilities: a second NIST technique, interlaboratorytesting, or determination of the certified constituents in other SRMsof similar matrix and constituent concentration (May et al., 1999).
Multitechnique Approach. Because primary methods aresometimes not available for use in certifying SRMs, NIST maysometimes use two or more independent critically evaluatedmethods for certification. Independent means that the basicprinciples used for the analysis must be entirely different. Reliablemeans that the method must have been successfully used in similaranalytical situations (same concentration range, similar
Although definitivemethods are the mostaccurate methodsavailable, they are noteconomical for general usebecause they require highlyskilled personnel andspecialized equipment andare time consuming.
Economic Impact of Standard Reference Materials for Sulfur in Fossil Fuels
3-16
interferences) as that expected in certifying the SRM. The methodsmust be accompanied by a confident statement concerning theestimated systematic errors. To use a method, the estimatedsystematic errors must be small. The methods are chosen that havesignificantly different sources of error and variability. Thisapproach is based on the rationale that the likelihood of twoindependent methods being biased by the same amount and in thesame direction is small. A special kind of independent method is areference method. This is a method of proven accuracy, based ontesting versus a definitive method. Reference methods are generallyarrived at by consensus.
SRM Certification
The actual testing of a material to be marketed as an SRM involvesnumerous stages of testing. The material must be tested todetermine its homogeneity and stability. The certification analysesare conducted using critically evaluated methods. A statisticalanalysis is conducted to determine method imprecision and methodbiases, which are combined and reported as the uncertainty of thecertified values.
The homogeneity of materials is usually relatively easy to establishonce an adequate statistical sampling plan has been designed.Thus, analysts can use highly precise, rapid instrumental techniquessuch as x-ray fluorescence (XRF) or neutron activation analysis(NAA) to evaluate material variability without being concernedwith the evaluation of systematic errors.
Materials with significant, but usable, levels of heterogeneity maybe certified as a batch, in which case the statistical tolerance limitsare given. A statement on the statistical tolerance limits includesthe average value of all samples in the batch and limits withinwhich most individual samples are expected to lie, with statedconfidence. Because only a small number of samples will havebeen analyzed, the limits for a given percentage of samples cannotbe stated with certainty. Rather, there is only a probability that thelimits are valid. Thus, for example, it can be said with 95 percentconfidence that these statistical tolerance limits cover the truevalues of 95 percent of the samples of the batch.
The final product of the certification of a NIST SRM is the SRM itselfand the certificate of analysis accompanying it. The certificate
Section 3 — SRMs and Sulfur Measurement
3-17
presents the certified value the best estimate of the value for aconstituent or property of the SRM. This value is usually thearithmetic or weighted mean of the determinations made usingdefinitive methods, independent methods, or from interlaboratorytesting. A detailed discussion of alternative uncertaintymeasurements is provided in Taylor (1993).
3.3.2 History of NIST’s SRM Program for Sulfur in FossilFuels
NIST’s SRM program for sulfur in fossil fuels was motivated byanticipated needs due to the regulation of sulfur content in residualfuel oil. In 1967, NIST (then NBS) issued SRM 1621, Sulfur inResidual Fuel Oil, 1 %, and 1622, Sulfur in Residual Fuel Oil 2 %.The technical objective of the SRM work order for these two SRMsstated that
The problem of air pollution from large industrialorganization burning residual fuel oil containing sulfurhas reached a point where legal limitations on thesulfur content of oils is a certainty. Out of these lawswill arise considerable litigation, the outcome ofwhich will depend on the ability to accurately analyzefor the sulfur. The NBS sulfur in oil standard referencematerials will supply a generally accepted, accuratestandard against which the buyer and seller can checktheir oil for sulfur content as well as a standard forreferee work in legal action.
The sulfur content for both of these SRMs was certified using agravimetric method similar to ASTM D-129 (General BombMethod). The relative uncertainty (95 percent confidence interval)of the certified value was about 2 percent of the certified value inthe case of 1621, and about 0.5 percent of the certified value forthe case of 1622. In the early 1970s, NIST added SRMs for otherconcentrations of residual fuel oil (SRM 1623) and also developedan SRM for distillate fuel oil (SRM 1624). Both of these werecertified with the same gravimetric method used earlier, and therelative uncertainties were about 1.5 and 2 percent of the certifiedvalues, respectively.
Then NIST began the practice of using several independentmethods to certify the standards. The independent methods usuallyincluded a gravimetric method, ion chromatography,microcoulometry, and X ray fluorescence. As shown in Table 3-2,
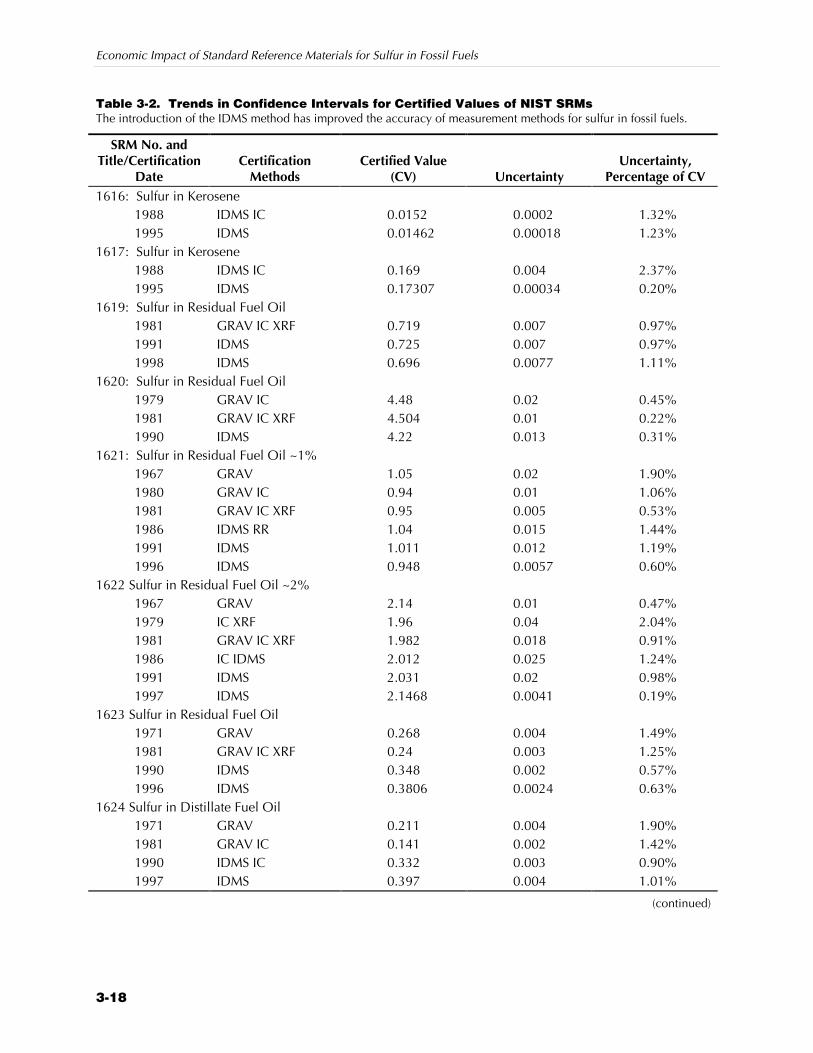
Economic Impact of Standard Reference Materials for Sulfur in Fossil Fuels
3-18
Table 3-2. Trends in Confidence Intervals for Certified Values of NIST SRMsThe introduction of the IDMS method has improved the accuracy of measurement methods for sulfur in fossil fuels.
SRM No. andTitle/Certification
DateCertification
MethodsCertified Value
(CV) UncertaintyUncertainty,
Percentage of CV1616: Sulfur in Kerosene
1988 IDMS IC 0.0152 0.0002 1.32%1995 IDMS 0.01462 0.00018 1.23%
1617: Sulfur in Kerosene1988 IDMS IC 0.169 0.004 2.37%1995 IDMS 0.17307 0.00034 0.20%
1619: Sulfur in Residual Fuel Oil1981 GRAV IC XRF 0.719 0.007 0.97%1991 IDMS 0.725 0.007 0.97%1998 IDMS 0.696 0.0077 1.11%
1620: Sulfur in Residual Fuel Oil1979 GRAV IC 4.48 0.02 0.45%1981 GRAV IC XRF 4.504 0.01 0.22%1990 IDMS 4.22 0.013 0.31%
1621: Sulfur in Residual Fuel Oil ~1%1967 GRAV 1.05 0.02 1.90%1980 GRAV IC 0.94 0.01 1.06%1981 GRAV IC XRF 0.95 0.005 0.53%1986 IDMS RR 1.04 0.015 1.44%1991 IDMS 1.011 0.012 1.19%1996 IDMS 0.948 0.0057 0.60%
1622 Sulfur in Residual Fuel Oil ~2%1967 GRAV 2.14 0.01 0.47%1979 IC XRF 1.96 0.04 2.04%1981 GRAV IC XRF 1.982 0.018 0.91%1986 IC IDMS 2.012 0.025 1.24%1991 IDMS 2.031 0.02 0.98%1997 IDMS 2.1468 0.0041 0.19%
1623 Sulfur in Residual Fuel Oil1971 GRAV 0.268 0.004 1.49%1981 GRAV IC XRF 0.24 0.003 1.25%1990 IDMS 0.348 0.002 0.57%1996 IDMS 0.3806 0.0024 0.63%
1624 Sulfur in Distillate Fuel Oil1971 GRAV 0.211 0.004 1.90%1981 GRAV IC 0.141 0.002 1.42%1990 IDMS IC 0.332 0.003 0.90%1997 IDMS 0.397 0.004 1.01%
(continued)
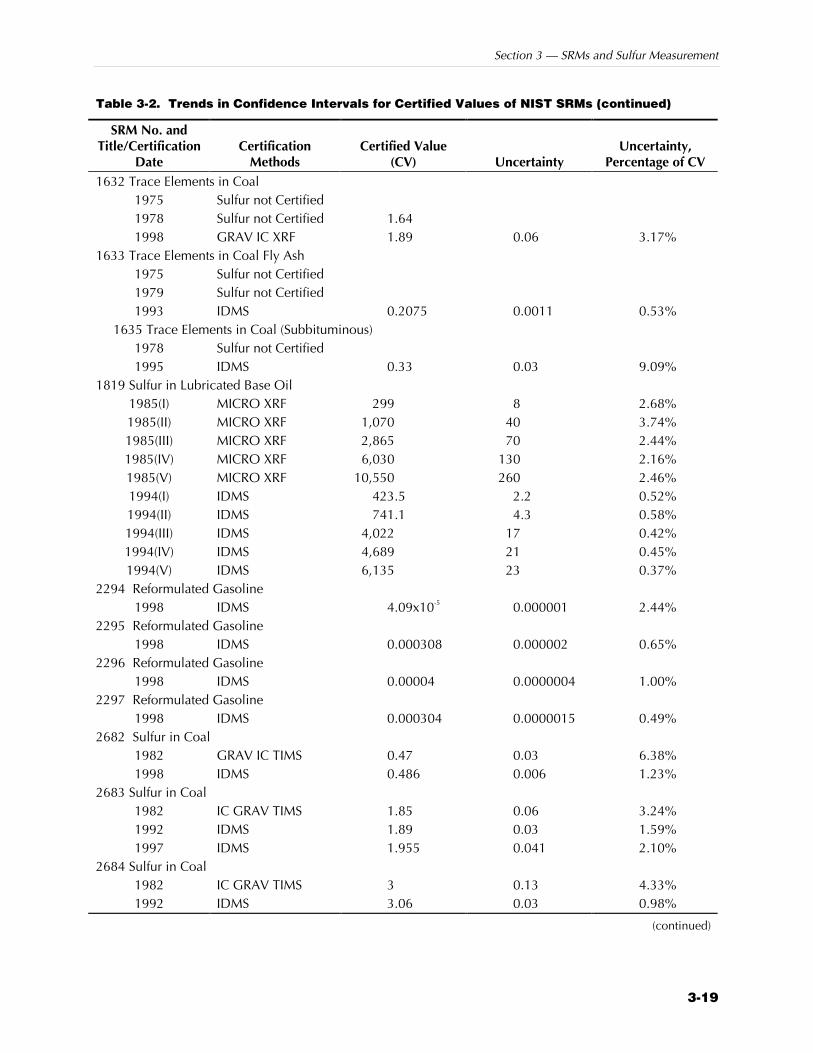
Section 3 — SRMs and Sulfur Measurement
3-19
Table 3-2. Trends in Confidence Intervals for Certified Values of NIST SRMs (continued)
SRM No. andTitle/Certification
DateCertification
MethodsCertified Value
(CV) UncertaintyUncertainty,
Percentage of CV1632 Trace Elements in Coal
1975 Sulfur not Certified1978 Sulfur not Certified 1.641998 GRAV IC XRF 1.89 0.06 3.17%
1633 Trace Elements in Coal Fly Ash1975 Sulfur not Certified1979 Sulfur not Certified1993 IDMS 0.2075 0.0011 0.53%
1635 Trace Elements in Coal (Subbituminous)1978 Sulfur not Certified1995 IDMS 0.33 0.03 9.09%
1819 Sulfur in Lubricated Base Oil1985(I) MICRO XRF 299 8 2.68%1985(II) MICRO XRF 1,070 40 3.74%1985(III) MICRO XRF 2,865 70 2.44%1985(IV) MICRO XRF 6,030 130 2.16%1985(V) MICRO XRF 10,550 260 2.46%1994(I) IDMS 423.5 2.2 0.52%1994(II) IDMS 741.1 4.3 0.58%1994(III) IDMS 4,022 17 0.42%1994(IV) IDMS 4,689 21 0.45%1994(V) IDMS 6,135 23 0.37%
2294 Reformulated Gasoline1998 IDMS 4.09x10⁻⁵ 0.000001 2.44%
2295 Reformulated Gasoline1998 IDMS 0.000308 0.000002 0.65%
2296 Reformulated Gasoline1998 IDMS 0.00004 0.0000004 1.00%
2297 Reformulated Gasoline1998 IDMS 0.000304 0.0000015 0.49%
2682 Sulfur in Coal1982 GRAV IC TIMS 0.47 0.03 6.38%1998 IDMS 0.486 0.006 1.23%
2683 Sulfur in Coal1982 IC GRAV TIMS 1.85 0.06 3.24%1992 IDMS 1.89 0.03 1.59%1997 IDMS 1.955 0.041 2.10%
2684 Sulfur in Coal1982 IC GRAV TIMS 3 0.13 4.33%1992 IDMS 3.06 0.03 0.98%
(continued)
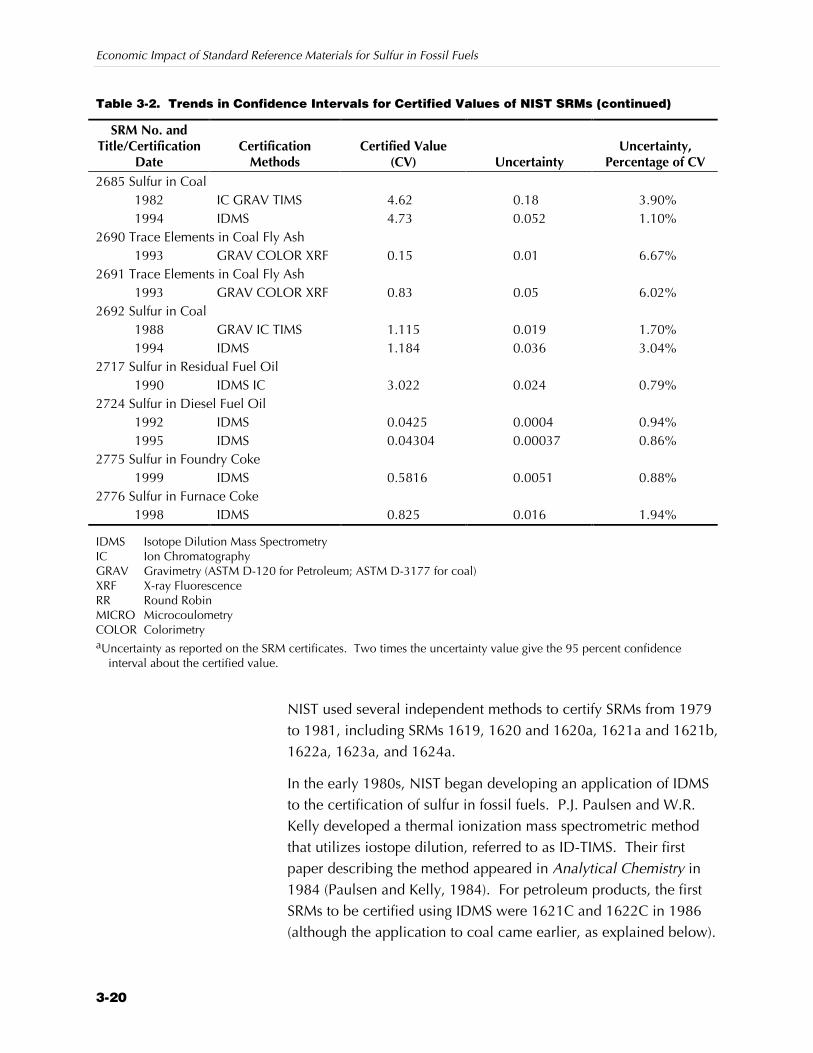
Economic Impact of Standard Reference Materials for Sulfur in Fossil Fuels
3-20
Table 3-2. Trends in Confidence Intervals for Certified Values of NIST SRMs (continued)
SRM No. andTitle/Certification
DateCertification
MethodsCertified Value
(CV) UncertaintyUncertainty,
Percentage of CV2685 Sulfur in Coal
1982 IC GRAV TIMS 4.62 0.18 3.90%1994 IDMS 4.73 0.052 1.10%
2690 Trace Elements in Coal Fly Ash1993 GRAV COLOR XRF 0.15 0.01 6.67%
2691 Trace Elements in Coal Fly Ash1993 GRAV COLOR XRF 0.83 0.05 6.02%
2692 Sulfur in Coal1988 GRAV IC TIMS 1.115 0.019 1.70%1994 IDMS 1.184 0.036 3.04%
2717 Sulfur in Residual Fuel Oil1990 IDMS IC 3.022 0.024 0.79%
2724 Sulfur in Diesel Fuel Oil1992 IDMS 0.0425 0.0004 0.94%1995 IDMS 0.04304 0.00037 0.86%
2775 Sulfur in Foundry Coke1999 IDMS 0.5816 0.0051 0.88%
2776 Sulfur in Furnace Coke1998 IDMS 0.825 0.016 1.94%
IDMS Isotope Dilution Mass SpectrometryIC Ion ChromatographyGRAV Gravimetry (ASTM D-120 for Petroleum; ASTM D-3177 for coal)XRF X-ray FluorescenceRR Round RobinMICRO MicrocoulometryCOLOR ColorimetryaUncertainty as reported on the SRM certificates. Two times the uncertainty value give the 95 percent confidence
interval about the certified value.
NIST used several independent methods to certify SRMs from 1979to 1981, including SRMs 1619, 1620 and 1620a, 1621a and 1621b,1622a, 1623a, and 1624a.
In the early 1980s, NIST began developing an application of IDMSto the certification of sulfur in fossil fuels. P.J. Paulsen and W.R.Kelly developed a thermal ionization mass spectrometric methodthat utilizes iostope dilution, referred to as ID-TIMS. Their firstpaper describing the method appeared in Analytical Chemistry in1984 (Paulsen and Kelly, 1984). For petroleum products, the firstSRMs to be certified using IDMS were 1621C and 1622C in 1986(although the application to coal came earlier, as explained below).
Section 3 — SRMs and Sulfur Measurement
3-21
In general, NIST developed the certification statement using onlythe results from the IDMS, but NIST used other independentmethods to confirm the results. Today, IDMS is considered adefinitive method that virtually eliminates bias in the certified valueand significantly reduces uncertainty.
NIST began certifying SRMs for sulfur in coal in the early 1980swith SRM 2682, 2683, 2684, and 2685. Although 1632 and 1635were developed earlier, the sulfur levels for these SRMs were notcertified until later. One of the earliest applications of the IDMSmethod for certifying sulfur in fossil fuels was in SRMs 2682, 2683,2684, and 2685. At this early stage, IDMS was used in conjunctionwith other methods to confirm the certified value. IDMS is nowused to certify virtually all SRMs for sulfur in fossil fuels.
The application of IDMS has had a significant impact on theuncertainty associated with SRMs. Figure 3-4 compares the relativeuncertainty for several SRMs over time. Part a shows relativeuncertainties for SRMs for residual fuel oil and lubricating base oil.The first bar shows the relative uncertainty before the introductionof IDMS; the second shows the relative uncertainty of the mostrecently issued batches. For all petroleum products, the ratio of therelative uncertainty for the earliest SRMs to that of the most recentSRMs averages about 2.3.
A similar trend can be seen for the coal SRMs. The IDMS methodhas improved over the years. In 1982, the relative uncertainty ofcoal SRMs ranged from about 3 percent to about 6 percent. Today,the relative uncertainties range from 1 percent of the certified valueto about 3 percent. For all coal SRMs the ratio of the relativeuncertainty for the earliest SRMs to that of the most recent SRMs isabout 1.6. Note, however, that these comparisons are moredifficult for coal than for petroleum products because theheterogeneity of the material contributes a great deal to the SRMuncertainty.
However, the uncertainty associated with NIST SRMs is only onecomponent of the total uncertainty of the sulfur measurementmethods. For example, in the analysis of coal, materialheterogeneity is the primary source of uncertainty. Interviews withanalysts at coal testing labs indicated that sample variability is
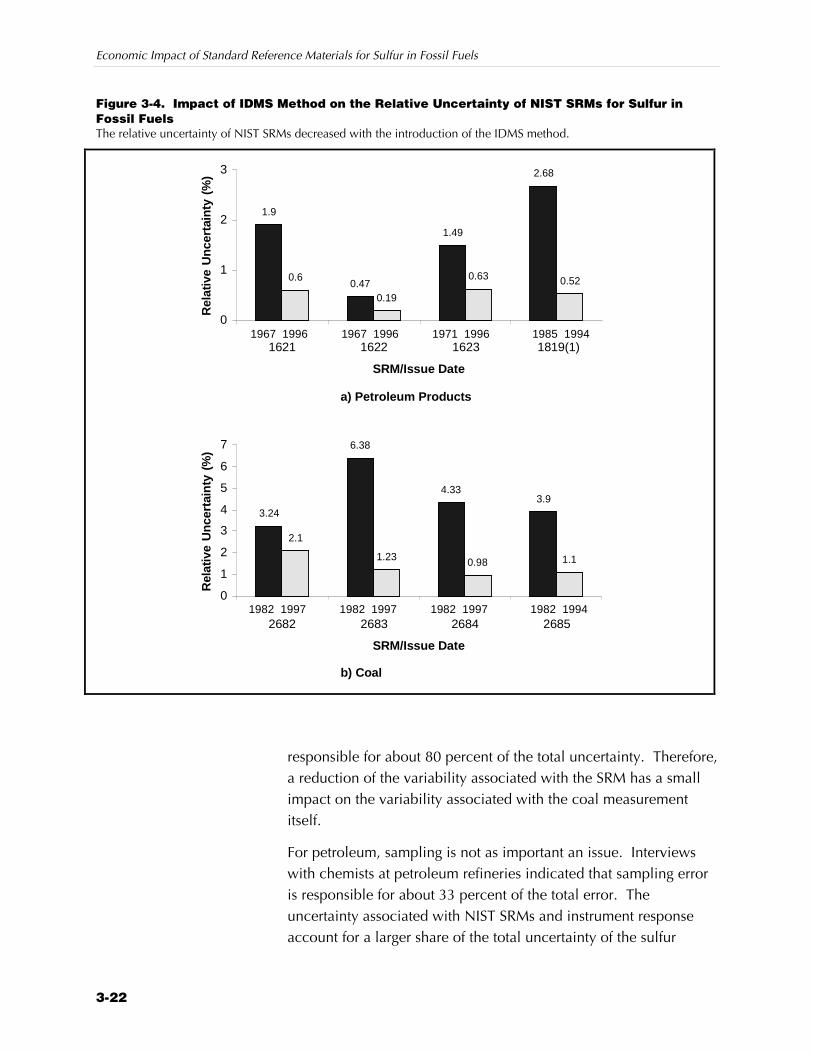
Economic Impact of Standard Reference Materials for Sulfur in Fossil Fuels
3-22
Figure 3-4. Impact of IDMS Method on the Relative Uncertainty of NIST SRMs for Sulfur inFossil FuelsThe relative uncertainty of NIST SRMs decreased with the introduction of the IDMS method.
1.9
0.47
1.49
2.68
0.6
0.19
0.63 0.52
0
1
2
3
1621 1622 1623 1819(1)
SRM/Issue Date
Rel
ativ
e U
nce
rtai
nty
(%
)
1967 1996
3.24
6.38
4.333.9
2.1
1.23 0.98 1.1
0
1
2
3
4
5
6
7
2682 2683 2684 2685
SRM/Issue Date
Rel
ativ
e U
nce
rtai
nty
(%
)
a) Petroleum Products
b) Coal
1967 1996 1971 1996 1985 1994
1982 1997 1982 1997 1982 1997 1982 1994
responsible for about 80 percent of the total uncertainty. Therefore,a reduction of the variability associated with the SRM has a smallimpact on the variability associated with the coal measurementitself.
For petroleum, sampling is not as important an issue. Interviewswith chemists at petroleum refineries indicated that sampling erroris responsible for about 33 percent of the total error. Theuncertainty associated with NIST SRMs and instrument responseaccount for a larger share of the total uncertainty of the sulfur
Section 3 — SRMs and Sulfur Measurement
3-23
measurement method. Therefore, we assumed that decreases inNIST SRMs’ uncertainty may have a greater impact on sulfur testingin petroleum than in coal.
3.3.3 Counterfactual Scenarios
To analyze the impact of NIST’s SRM program, we must develop acounterfactual scenario—that is, if NIST SRMs were not available,then what would be the state of the science for measuring sulfur infossil fuels. For the counterfactual, we assume that, in the absenceof NIST, the level of uncertainty associated with the measurementof sulfur in fossil fuels would today be similar to what it was priorto the introduction of IDMS in the early 1980s.
Because of the complexity of the method and the skill andequipment required to apply IDMS, it is unlikely that any otherlaboratories developing CRMs would have pursued this method inthe absence of NIST. This hypothesis was confirmed by ourinterviews with several CRM manufacturers who said that theytypically do not engage in fundamental research targeted at newtechniques for developing sulfur reference materials.
We assume that the impact associated with SRMs developed usingthe IDMS method began in 1986 and will continue at least through2003. In 1986, NIST began selling SRMs developed using theIDSM method. However, not all benefits categories (described inSection 4) realized economic impacts beginning in 1986. Forexample, the decreased level of measurement uncertaintyassociated with SRMs using the IDMS method did not affectpetroleum production until the mid-1990s when California beganregulating the sulfur content of gasoline and diesel fuels.
We assume that, inthe absence of NIST,the level ofuncertaintyassociated with themeasurement ofsulfur in fossil fuelswould today besimilar to what itwas prior to theintroduction ofIDMS in the early1980s.
4-1
Valuing Improved4 Sulfur Information
What is the value of improved information about the sulfur contentof fossil fuels? Economic principles define information as“valuable” if it supports decisions that lead to improved economicoutcomes. Information is then valued by comparing the outcomesobtained with and without the information (Preckel, Loehman, andKaylen, 1987).
In this section, we apply this basic definition of the value ofinformation to develop methods for valuing the benefits of NISTSRMs for sulfur in fossil fuels. First, we describe how sulfurinformation is used to support decisions in the fossil fuel industry.Second, we provide a set of hypotheses and a list of technical andeconomic metrics. Third, we discuss how the impact of NIST SRMson measurement accuracy can be combined with primary andsecondary data to test these hypotheses and value economicimpacts. The last section describes how we collected the requireddata.
4.1 SULFUR INFORMATION AND ECONOMICBEHAVIORInformation about the sulfur content of fossil fuels is used in anumber of industries to make decisions about productdevelopment, pricing, resource use, and production. Morespecifically, sulfur content measurements are used
Z by the sulfur measurement industry to develop and producesulfur measurement equipment, to prepare CRMs, and toconduct laboratory testing;
Information is“valuable” if itsupports decisionsthat lead toimproved economicoutcomes.Information is thenvalued bycomparing theoutcomes obtainedwith and withoutthe information(Preckel, Loehman,and Kaylen, 1987).
Economic Impact of Standard Reference Materials for Sulfur in Fossil Fuels
4-2
Z by the fossil fuel supply chain to determine the appropriateprice for fuels;
Z by the fossil fuel supply chain for setting operatingspecifications for equipment to meet technical or regulatorycriteria;
Z by the fossil fuel supply chain for R&D aimed at developingnew products and processes, including low-sulfur fuels andlubricants and desulfurization processes; and
Z by the fossil fuel supply chain and the regulatorycommunity (EPA and CARB) to verify compliance withenvironmental regulations.
The potential impacts of these uses for sulfur information fall withinthe three categories of infratechnology impact discussed by Tassey(1997):
Z Infratechnologies improve the efficiency of R&D. NISTSRMs for sulfur in fossil fuels may reduce the cost ofdeveloping new products and processes in the sulfurmeasurement industry and in the fossil fuel industry. Theyallow for the calibration and testing of sulfur measurementinstruments, improve the quality of CRMs, and may improvethe efficiency of research aimed at reducing the sulfurcontent of fossil fuels. SRMs allow for the replication andverification of research results.
Z Infratechnologies support the production process and canenhance product characteristics. NIST SRMs support theproduction of the products and services of the sulfurmeasurement industry by providing quality control duringthe manufacturing and laboratory processes. For thepetroleum refining and coal processing industries, NISTSRMs provide information that can improve theirproduction processes, their products, and theirenvironmental compliance. Improved sulfur informationallows these companies to adjust the sulfur content of theirinputs and outputs to more precisely meet technical andenvironmental specifications. For the electric powergeneration industry, higher-quality information can improveproductive efficiency as well as reduce the risk of regulatoryviolations. For steel manufacturers, the quality of the steelis driven, in part, by the sulfur content of the coke that isused in this process; thus, more accurate informationresulting from the use of NIST SRMs improves the qualityand reliability of the product.
Infratechnologies impactthe economy byZ improving the
efficiency of R&D,
Z supporting theproduction processand enhancingproduct characteristics,and
Z reducing transactionscosts.
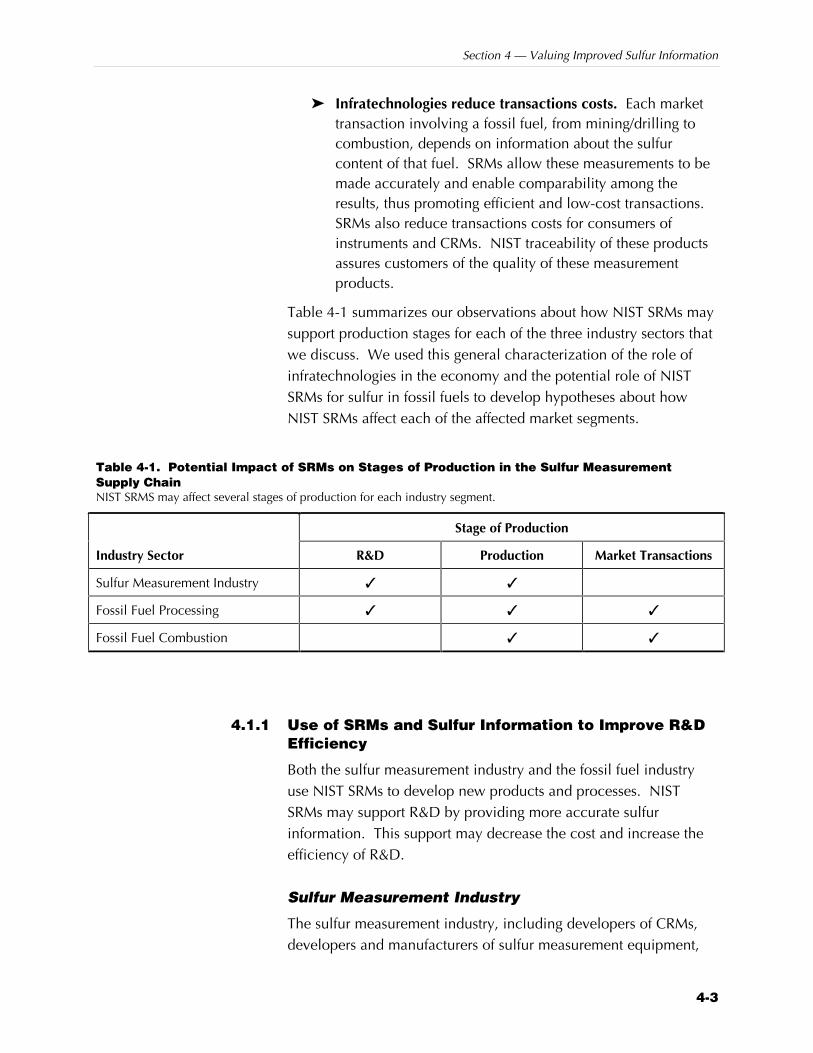
Section 4 — Valuing Improved Sulfur Information
4-3
Z Infratechnologies reduce transactions costs. Each markettransaction involving a fossil fuel, from mining/drilling tocombustion, depends on information about the sulfurcontent of that fuel. SRMs allow these measurements to bemade accurately and enable comparability among theresults, thus promoting efficient and low-cost transactions.SRMs also reduce transactions costs for consumers ofinstruments and CRMs. NIST traceability of these productsassures customers of the quality of these measurementproducts.
Table 4-1 summarizes our observations about how NIST SRMs maysupport production stages for each of the three industry sectors thatwe discuss. We used this general characterization of the role ofinfratechnologies in the economy and the potential role of NISTSRMs for sulfur in fossil fuels to develop hypotheses about howNIST SRMs affect each of the affected market segments.
Table 4-1. Potential Impact of SRMs on Stages of Production in the Sulfur MeasurementSupply ChainNIST SRMS may affect several stages of production for each industry segment.
Stage of Production
Industry Sector R&D Production Market Transactions
Sulfur Measurement Industry ✓ ✓
Fossil Fuel Processing ✓ ✓ ✓
Fossil Fuel Combustion ✓ ✓
4.1.1 Use of SRMs and Sulfur Information to Improve R&DEfficiency
Both the sulfur measurement industry and the fossil fuel industryuse NIST SRMs to develop new products and processes. NISTSRMs may support R&D by providing more accurate sulfurinformation. This support may decrease the cost and increase theefficiency of R&D.
Sulfur Measurement Industry
The sulfur measurement industry, including developers of CRMs,developers and manufacturers of sulfur measurement equipment,
Economic Impact of Standard Reference Materials for Sulfur in Fossil Fuels
4-4
and independent labs, is prominent among the customers of NIST’sSRMs for sulfur in fossil fuels. These organizations use NIST SRMsduring the product development process to test alternative productdesigns and to develop new applications for their products. Theavailability of a standard for product testing may decrease the costand increase the efficiency of product development.
Fossil Fuel Processing Industry
Petroleum and coal companies also use SRMs to conduct R&D toreduce the sulfur content of fuels and to improve sulfur testingmethodologies. For example, fuel companies that would like betterreal-time information about the sulfur content of their products aredeveloping in-line sulfur testing methods. NIST’s SRMs improvethe efficiency of these R&D processes by providing a standard forquality control and testing of new products and processes.However, these benefits are difficult to quantify.
4.1.2 Use of Sulfur SRMs to Support the ProductionProcess
Sulfur content information is used throughout the sulfurmeasurement industry and the fossil fuel supply chain to supportproduction activities. The improved information can raise thequality of the products and services provided as well as makeproduction processes more efficient.
Sulfur Measurement Industry
In addition to supporting the development of sulfur testinginstruments and CRMs, SRMs support their production and theprovision of sulfur testing services. NIST SRMs may improve thequality of these products and services because they support qualitycontrol. Improvements in the quality of these instruments, CRMs,and laboratory services in turn may increase their value to thecustomers of these companies because of the more accurateinformation they provide.
Fossil Fuel Processing Industry
The fossil fuel processing industry may use SRMs to support its fuelblending and fuel desulfurization activities. These companiesblend coals and crudes of different characteristics, including sulfur
Improved sulfurcontent informationcan raise the qualityof the products andservices provided aswell as makeproductionprocesses moreefficient.
Section 4 — Valuing Improved Sulfur Information
4-5
content, to meet contract specifications regarding sulfur content.They may also conduct desulfurization processes for raw or finalproducts to meet final sulfur specifications. If information about thesulfur content of the fuel is not accurate, the blend may be too highor too low in sulfur content. If it is too high in sulfur content, thebuyer may not accept the shipment, or the seller may violateenvironmental regulations. If the sulfur content is below productspecifications, the seller is essentially giving away product thatcould have been sold.
Because of the uncertainty involved in measuring sulfur in fossilfuels, companies may include a “buffer” in their shipments. That is,they may ship fuel that measures lower in sulfur content than isspecified in the contract. This buffer reduces the probability thatthe shipment will be rejected because it does not meet the terms ofthe contract. However, buffers are expensive because low-sulfurfuel commands a higher price than high-sulfur fuel and becausedesulfurization is expensive. Reducing the amount of the buffermay reduce the cost of meeting contract specifications.
Uncertainty about the sulfur content of finished petroleum productsalso affects the companies’ decisions regarding how to ensureenvironmental compliance of their finished petroleum products.Companies may use a “buffer” similar to that used in fuel blendingand desulfurization processes described above to ensurecompliance with sulfur content regulations.
Fossil Fuel Combustion Industry
Electricity generation equipment, especially environmental controlequipment, is affected by the sulfur content of the coal that is used.Electrostatic precipitators remove particulates (fly ash) usingelectrically charged plates. The resistivity of the ash particles to theelectric charges is adversely affected if the sulfur content becomestoo high. Thus, if the sulfur content of the fuel is not known withcertainty, technical specifications of this equipment may be setincorrectly. Process inefficiencies may result, increasingproduction costs.
Unknown sulfur content can also affect productivity by forcing thecompany to take action to prevent an environmental complianceviolation. If the sulfur content of the coal is higher than expected,
Accurate sulfur contentinformation is important tofossil fuel producersbecause they conductcostly desulfurizaitonprocesses on raw or finalproducts to meetcontractual obligations.
Economic Impact of Standard Reference Materials for Sulfur in Fossil Fuels
4-6
the company may be alerted to a potential violation by theinformation provided by the SRMs. The company may take actionby reducing the fuel input in the boiler (reducing the productivity ofthe unit) or purchasing sulfur credits in emissions markets.
4.1.3 Use of Sulfur Information to Reduce TransactionsCosts in the Purchase and Sale of Fuels and OtherProducts
Recall that sulfur content normally is specified as part of a purchasecontract. SRMs can reduce transactions costs between buyers andsellers of fuels and other products by reducing the cost of acquiringthe information (such as sulfur content) needed to set prices andfinalize the transaction. The primary characteristics of fossil fuelpurchase contracts are explained below.
Sulfur Content Specifications
Coal purchase contracts generally specify a minimum andmaximum sulfur content. Most long-term contracts will specify arange in which the coal’s sulfur content must fall. The range isgenerally centered around a guaranteed value. The actual pricepaid for the shipment of coal may increase or decrease if the coal’sactual sulfur content is above or below the guaranteed value.However, a buyer may reject a shipment if the sulfur content fallsoutside the specified range. Even then, the contract is notterminated if the seller makes reasonable assurances that it willremedy the situation. Similar negotiations occur for crude oil.
For finished petroleum products, the primary specification that mustbe met with respect to sulfur content is the sulfur limit imposed byeither EPA or, in California, the CARB. The refineries test eachbatch of fuel produced. Pipeline companies may test the fuelbefore transporting it and prohibit the sulfur content from exceedinga set maximum limit related to the regulatory limit.
Pricing Based on Sulfur Content
A purchase contract for coal generally specifies a base price withprice adjustments for differences in quality or changes in marketprice. A quality adjustment is almost always made for heat content(Btu/lb). A contract may have a quality adjustment for sulfur aslong as the sulfur content is still within a specified range. For
SRMs can reducetransactions costsbetween buyers andsellers of fuels andother products byreducing the cost ofacquiring theinformation (such assulfur content)needed to set pricesand finalize thetransaction.
Section 4 — Valuing Improved Sulfur Information
4-7
example, if the coal’s sulfur content is lower than the guaranteedvalue, then the buyer pays a premium. The calculation of such apremium or penalty differs by contract.
Coal quality and price adjustments are typically applied toindividual shipments, although some contracts will aggregate coalquality information on the basis of multiple shipments or for a givenperiod. In the case of rail shipments, usually one composite sampleapplies for an individual shipment, and payment is based on thatsample. In the case of truck deliveries, price and payment may bebased on the average of samples taken from shipments over aperiod of time (all truck deliveries for a bimonthly or monthlybasis). For barge deliveries, the price may apply to individual bargeloads (1,500 tons each) or barge tows (nine barges or more).
The price of a crude oil shipment may be revised if the sulfurcontent varies from the guaranteed value. For refined petroleum,price is generally set for a specific type or grade of fuel, regardlessof sulfur content, as long as it meets the (regulatory andperformance) specifications. Although the price of a product mightnot change, lowering the sulfur content to meet a regulatorystandard generally raises manufacturing costs.
Testing and Resolution of Disputes
Most coal contracts outline a general sampling procedure, whichincludes how many splits of each sample will be taken, who isresponsible for sampling, and what procedure to follow if there is adispute. Most specify that the testing facility must employ ASTMmethods. The sampling plan and the testing site vary by contract.Usually they are not specified other than to mention that these mustbe carried out as agreed upon by the buyer and seller. Generally asample is split into three portions. The seller (or the seller’sdesignated laboratory) tests one portion, the buyer (or the buyer’sdesignated laboratory) tests the other, and the third is kept in caseof a dispute. In the event of a dispute, the third split is tested by anindependent laboratory. Additional costs may be incurred by bothparties to the transaction as they review the circumstances of thedispute and examine the data provided by the independentlaboratory in comparison to their own test data.
For crude and refined petroleum, test methods are specified inregulations and contract and product specifications. The type (not
Economic Impact of Standard Reference Materials for Sulfur in Fossil Fuels
4-8
brand) of equipment or instrumentation is usually described in thetest method. Test methods include specific procedures forcalibration. Most calibration procedures do not specify the use ofNIST SRMs. SRMs or secondary standards based on SRMs can beused as part of a laboratory’s quality control/quality assurance(QC/QA) program to check the test bias.
Intercompany contracts generally do not specify what happens inthe case of a dispute regarding the sulfur content of petroleumproducts. In the case of EPA, an independent contractor collectsand stores retained samples. EPA decides which 10 percent of thesamples the independent laboratory must test. Results should agreewith the refinery laboratory (within the reproducibility interval). Inthe case of a violation detected by EPA or CARB testing, a companycould use its QC/QA data in defense. Test data on SRMs also arehelpful in such cases.
4.2 HYPOTHESESAs described above, NIST SRMs affect each segment of the fossilfuel measurement industry and the fossil fuel supply chain. Thissection frames the discussion in Section 4.1 as a set of hypothesesabout the impact of NIST SRMs on each sector. These hypothesesare summarized in Table 4-2.
4.2.1 Impact of SRMs on the Sulfur Measurement Industry
We expect that NIST SRMs have technical and economic impactson the sulfur measurement industry (Table 4-2). SRMs reduce thecost of R&D by providing better information during the productdevelopment process. During the production process, SRMsimprove the quality of products and services by providing betterquality control and a standard against which to calibrateinstruments. The technical impact is higher-quality equipment,more accurate CRMs, more accurate analytical results, and lessproduct testing required. The hypothesized economic impact isconsumers’ higher valuation of products and services that providegreater accuracy of sulfur content information. To the extent thatSRMs also reduce the need for product testing, they also may lowerR&D costs.
SRMs improve thequality of productsand services byproviding betterquality control anda standard againstwhich to calibrateinstruments.
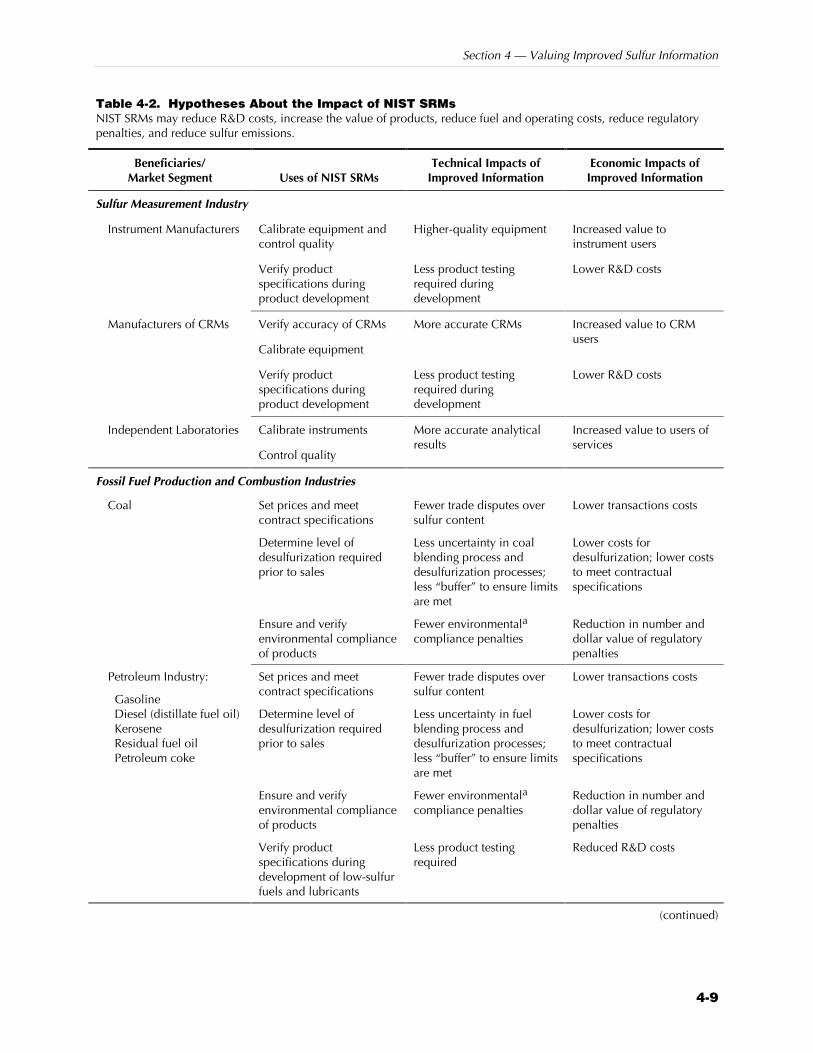
Section 4 — Valuing Improved Sulfur Information
4-9
Table 4-2. Hypotheses About the Impact of NIST SRMsNIST SRMs may reduce R&D costs, increase the value of products, reduce fuel and operating costs, reduce regulatorypenalties, and reduce sulfur emissions.
Beneficiaries/Market Segment Uses of NIST SRMs
Technical Impacts ofImproved Information
Economic Impacts ofImproved Information
Sulfur Measurement Industry
Instrument Manufacturers Calibrate equipment andcontrol quality
Higher-quality equipment Increased value toinstrument users
Verify productspecifications duringproduct development
Less product testingrequired duringdevelopment
Lower R&D costs
Manufacturers of CRMs Verify accuracy of CRMs
Calibrate equipment
More accurate CRMs Increased value to CRMusers
Verify productspecifications duringproduct development
Less product testingrequired duringdevelopment
Lower R&D costs
Independent Laboratories Calibrate instruments
Control quality
More accurate analyticalresults
Increased value to users ofservices
Fossil Fuel Production and Combustion Industries
Coal Set prices and meetcontract specifications
Fewer trade disputes oversulfur content
Lower transactions costs
Determine level ofdesulfurization requiredprior to sales
Less uncertainty in coalblending process anddesulfurization processes;less “buffer” to ensure limitsare met
Lower costs fordesulfurization; lower coststo meet contractualspecifications
Ensure and verifyenvironmental complianceof products
Fewer environmentala
compliance penaltiesReduction in number anddollar value of regulatorypenalties
Set prices and meetcontract specifications
Fewer trade disputes oversulfur content
Lower transactions costs
Determine level ofdesulfurization requiredprior to sales
Less uncertainty in fuelblending process anddesulfurization processes;less “buffer” to ensure limitsare met
Lower costs fordesulfurization; lower coststo meet contractualspecifications
Petroleum Industry:
Gasoline Diesel (distillate fuel oil) Kerosene Residual fuel oil Petroleum coke
Ensure and verifyenvironmental complianceof products
Fewer environmentala
compliance penaltiesReduction in number anddollar value of regulatorypenalties
Verify productspecifications duringdevelopment of low-sulfurfuels and lubricants
Less product testingrequired
Reduced R&D costs
(continued)
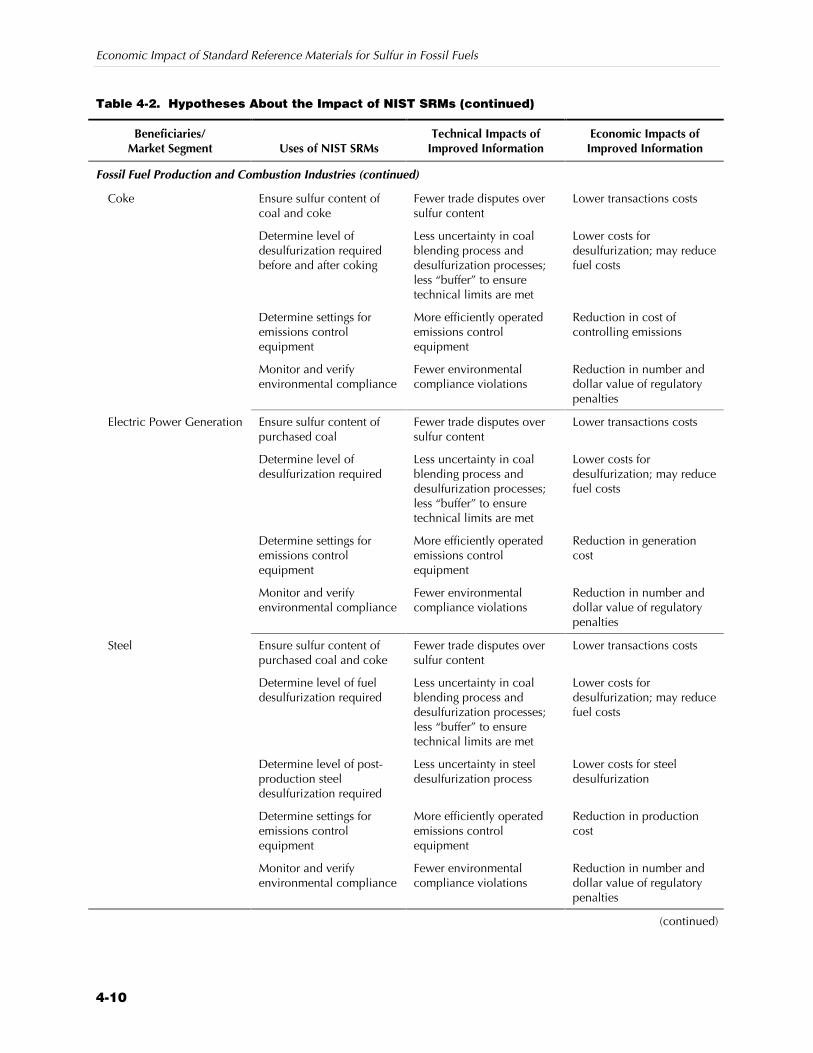
Economic Impact of Standard Reference Materials for Sulfur in Fossil Fuels
4-10
Table 4-2. Hypotheses About the Impact of NIST SRMs (continued)
Beneficiaries/Market Segment Uses of NIST SRMs
Technical Impacts ofImproved Information
Economic Impacts ofImproved Information
Fossil Fuel Production and Combustion Industries (continued)
Coke Ensure sulfur content ofcoal and coke
Fewer trade disputes oversulfur content
Lower transactions costs
Determine level ofdesulfurization requiredbefore and after coking
Less uncertainty in coalblending process anddesulfurization processes;less “buffer” to ensuretechnical limits are met
Lower costs fordesulfurization; may reducefuel costs
Determine settings foremissions controlequipment
More efficiently operatedemissions controlequipment
Reduction in cost ofcontrolling emissions
Monitor and verifyenvironmental compliance
Fewer environmentalcompliance violations
Reduction in number anddollar value of regulatorypenalties
Electric Power Generation Ensure sulfur content ofpurchased coal
Fewer trade disputes oversulfur content
Lower transactions costs
Determine level ofdesulfurization required
Less uncertainty in coalblending process anddesulfurization processes;less “buffer” to ensuretechnical limits are met
Lower costs fordesulfurization; may reducefuel costs
Determine settings foremissions controlequipment
More efficiently operatedemissions controlequipment
Reduction in generationcost
Monitor and verifyenvironmental compliance
Fewer environmentalcompliance violations
Reduction in number anddollar value of regulatorypenalties
Steel Ensure sulfur content ofpurchased coal and coke
Fewer trade disputes oversulfur content
Lower transactions costs
Determine level of fueldesulfurization required
Less uncertainty in coalblending process anddesulfurization processes;less “buffer” to ensuretechnical limits are met
Lower costs fordesulfurization; may reducefuel costs
Determine level of post-production steeldesulfurization required
Less uncertainty in steeldesulfurization process
Lower costs for steeldesulfurization
Determine settings foremissions controlequipment
More efficiently operatedemissions controlequipment
Reduction in productioncost
Monitor and verifyenvironmental compliance
Fewer environmentalcompliance violations
Reduction in number anddollar value of regulatorypenalties
(continued)
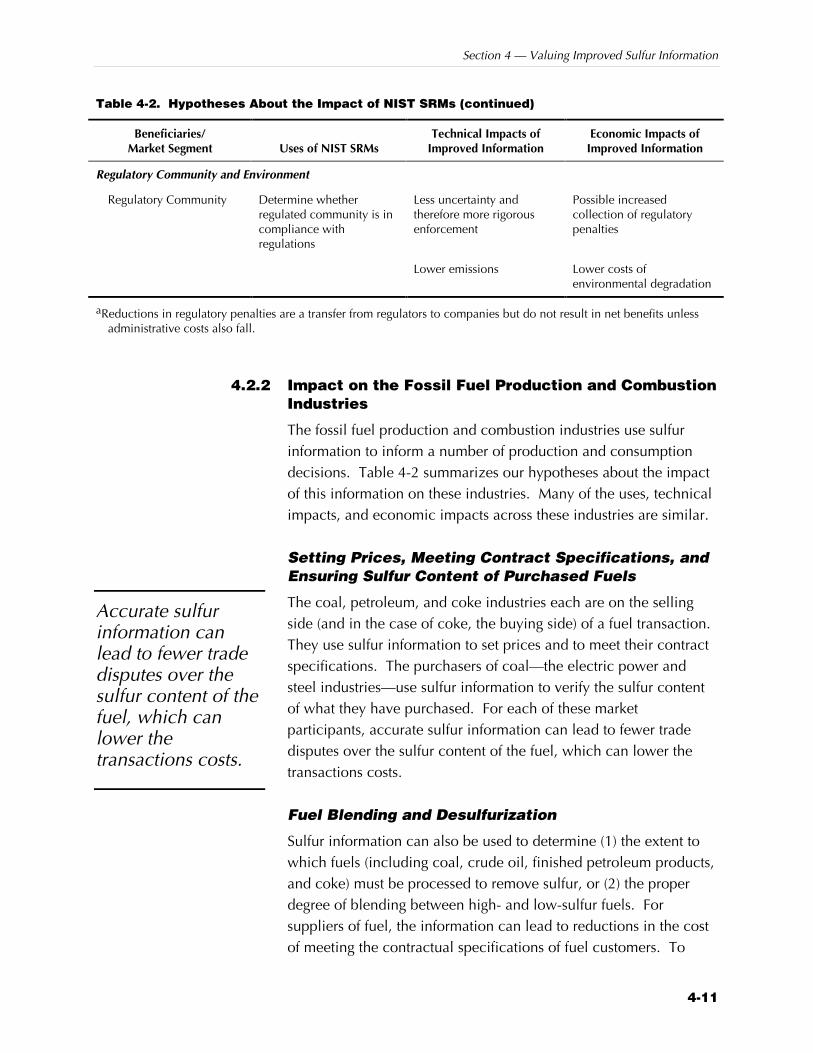
Section 4 — Valuing Improved Sulfur Information
4-11
Table 4-2. Hypotheses About the Impact of NIST SRMs (continued)
Beneficiaries/Market Segment Uses of NIST SRMs
Technical Impacts ofImproved Information
Economic Impacts ofImproved Information
Regulatory Community and Environment
Regulatory Community Determine whetherregulated community is incompliance withregulations
Less uncertainty andtherefore more rigorousenforcement
Possible increasedcollection of regulatorypenalties
Lower emissions Lower costs ofenvironmental degradation
aReductions in regulatory penalties are a transfer from regulators to companies but do not result in net benefits unlessadministrative costs also fall.
4.2.2 Impact on the Fossil Fuel Production and CombustionIndustries
The fossil fuel production and combustion industries use sulfurinformation to inform a number of production and consumptiondecisions. Table 4-2 summarizes our hypotheses about the impactof this information on these industries. Many of the uses, technicalimpacts, and economic impacts across these industries are similar.
Setting Prices, Meeting Contract Specifications, andEnsuring Sulfur Content of Purchased Fuels
The coal, petroleum, and coke industries each are on the sellingside (and in the case of coke, the buying side) of a fuel transaction.They use sulfur information to set prices and to meet their contractspecifications. The purchasers of coal—the electric power andsteel industries—use sulfur information to verify the sulfur contentof what they have purchased. For each of these marketparticipants, accurate sulfur information can lead to fewer tradedisputes over the sulfur content of the fuel, which can lower thetransactions costs.
Fuel Blending and Desulfurization
Sulfur information can also be used to determine (1) the extent towhich fuels (including coal, crude oil, finished petroleum products,and coke) must be processed to remove sulfur, or (2) the properdegree of blending between high- and low-sulfur fuels. Forsuppliers of fuel, the information can lead to reductions in the costof meeting the contractual specifications of fuel customers. To
Accurate sulfurinformation canlead to fewer tradedisputes over thesulfur content of thefuel, which canlower thetransactions costs.
Economic Impact of Standard Reference Materials for Sulfur in Fossil Fuels
4-12
those processing fuel for their own use, it may decrease the cost ofcoal and petroleum processing.
Process Control
The electric power generation industry and the steel industry usesulfur content information to determine the proper fuel mix and todetermine the settings required for emissions control. Moreaccurate information can improve the efficiency of these processes.
Environmental Compliance
Sulfur information is also used by the regulated industries tomonitor and verify their environmental compliance with sulfurcontent and sulfur emissions regulations. Improvements in theirinformation about their compliance status may lead to fewerviolations and regulatory penalties.
4.2.3 Impact on Regulatory Agencies and the Environment
Table 4-2 also summarizes our hypotheses regarding the impact ofNIST SRMs on the regulatory agencies and the environment. EPAand CARB use sulfur SRMs to determine whether sulfur contentregulations for gasoline and diesel fuel are being met. As theaccuracy of sulfur content measurement improves, the enforcementof these regulations can also improve. For example, as statedearlier, CARB regulations for sulfur content of diesel fuel andgasoline state that enforcement will occur only if the sulfur content,as measured by CARB, is higher than the upper-boundreproducibility interval for the ASTM method specified in theregulation. Thus, as the reproducibility intervals of these methodsnarrow, the regulatory community can better enforce compliancewith these regulations. This enforcement can lead to loweremissions, which reduces the economic damage to theenvironment.
4.3 VALUING ECONOMIC OUTCOMESIn the previous section, six main hypotheses were described:
H1: SRMs improve the quality of the products of the sulfurmeasurement industry. This quality improvement leads toa shift in demand and an increase in customers’willingness to pay (WTP) for these products and services.
Section 4 — Valuing Improved Sulfur Information
4-13
H2: SRMs reduce the cost of R&D in the sulfur measurementindustry and in the fuel industry by supporting accurate,reliable sulfur measurement.
H3: SRMs reduce the cost of fossil fuel transactions becausemeasurements are accepted as reliable and fewertransactions are disputed because of measurement error.
H4: SRMs improve the efficiency of a number of productionoperations, including fuel blending, desulfurization, andequipment operations because the reliability of themeasurement allows users to reduce the “buffer” theyemploy to ensure compliance with technicalspecifications.
H5: SRMs reduce the fines paid by industry due toenvironmental noncompliance because industry and theregulatory community have accurate and reliable sulfurcontent information.
H6: SRMs reduce the total amount of sulfur entering theenvironment by providing industry greater control overthe sulfur content of its fuels and by allowing complianceofficials greater authority in enforcing the regulatorylimits.
These hypotheses suggest a number of economic impact measuresfor this study. Table 4-3 summarizes the technical and economicimpacts developed and quantified through our interviews withmembers of the affected industries. Following the methodologyillustrated in Figure 1-1, these technical and economic metrics arederived from the primary technical impact of NIST SRMs:improvement in the accuracy of sulfur content measurement.
This section describes how we valued the technical and economicimpacts noted in Table 4-3. In particular, it focuses on quantifyingsix types of technical and economic impacts:
Z benefits of improvements in product quality (H1);
Z changes in R&D costs (H2);
Z changes in transactions costs (H3);
Z improvements in production efficiency (including changesin fuel costs, operating costs, and desulfurization costs)(H4);
Z changes in regulatory penalties (H5); and
Z benefits to the environment (H6).
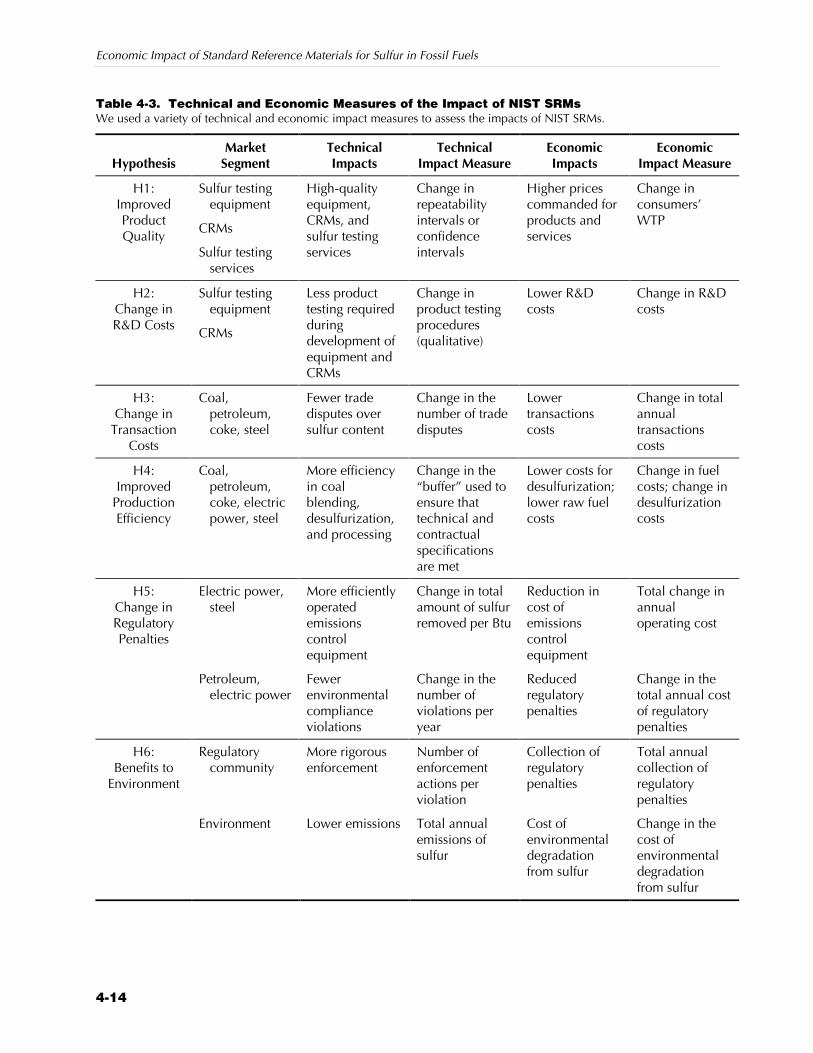
Economic Impact of Standard Reference Materials for Sulfur in Fossil Fuels
4-14
Table 4-3. Technical and Economic Measures of the Impact of NIST SRMs We used a variety of technical and economic impact measures to assess the impacts of NIST SRMs.
Hypothesis Market
Segment TechnicalImpacts
TechnicalImpact Measure
EconomicImpacts
EconomicImpact Measure
H1:ImprovedProductQuality
Sulfur testingequipment
CRMs
Sulfur testingservices
High-qualityequipment,CRMs, andsulfur testingservices
Change inrepeatabilityintervals orconfidenceintervals
Higher pricescommanded forproducts andservices
Change inconsumers’WTP
H2:Change inR&D Costs
Sulfur testingequipment
CRMs
Less producttesting requiredduringdevelopment ofequipment andCRMs
Change inproduct testingprocedures(qualitative)
Lower R&Dcosts
Change in R&Dcosts
H3:Change in
TransactionCosts
Coal,petroleum,coke, steel
Fewer tradedisputes oversulfur content
Change in thenumber of tradedisputes
Lowertransactionscosts
Change in totalannualtransactionscosts
H4:Improved
ProductionEfficiency
Coal,petroleum,coke, electricpower, steel
More efficiencyin coalblending,desulfurization,and processing
Change in the“buffer” used toensure thattechnical andcontractualspecificationsare met
Lower costs fordesulfurization;lower raw fuelcosts
Change in fuelcosts; change indesulfurizationcosts
Electric power,steel
More efficientlyoperatedemissionscontrolequipment
Change in totalamount of sulfurremoved per Btu
Reduction incost ofemissionscontrolequipment
Total change inannualoperating cost
H5:Change inRegulatoryPenalties
Petroleum,electric power
Fewerenvironmentalcomplianceviolations
Change in thenumber ofviolations peryear
Reducedregulatorypenalties
Change in thetotal annual costof regulatorypenalties
Regulatorycommunity
More rigorousenforcement
Number ofenforcementactions perviolation
Collection ofregulatorypenalties
Total annualcollection ofregulatorypenalties
H6:Benefits to
Environment
Environment Lower emissions Total annualemissions ofsulfur
Cost ofenvironmentaldegradationfrom sulfur
Change in thecost ofenvironmentaldegradationfrom sulfur
Section 4 — Valuing Improved Sulfur Information
4-15
4.3.1 Benefits of Improvements in Product Quality (H1)
The value of an improvement in the quality of a good or service canbe measured by a change in the sum of producers’ and consumers’surplus. Consumers’ surplus is a measure of the net benefitreceived by consumers from the purchase of a good or service. It isthe difference between what the good or service is worth to thebuyer and what they actually pay for it (the price). Producers’surplus is the difference between what producers receive for a good(the price) and what it costs to produce it. The total welfare createdby a market transaction is equal to the sum of producers’ andconsumers’ surplus.
To simplify our analysis, we assumed that marginal cost is constantand equals price. This implies that producers’ surplus is zero; allnet benefits created by a market transaction accrue to consumers.This assumption does not affect our estimate of the total benefits ofimprovements in product quality; however, it does mean that wecannot describe the distribution of these benefits among buyers andsellers.
The value of a good or service to any given consumer can bequantified by his or her WTP for this good or service. WTP is anobservable measure of utility that is typically used in benefit-costanalyses. It is a measure of the maximum dollar amount theindividual would be willing to pay for the welfare improvement wewould expect from the quality changes. Although WTP is not aperfect surrogate for utility changes, the consensus amongeconomists is that WTP does provide the best available utilitysurrogate (Haddix et al., 1996; Sloan, 1995; Tolley, Kenkel, andFabian, 1994).
In some cases, WTP is revealed in markets. When an individualpurchases a commodity in a market, the monetary sacrifice is theprice of the commodity. In such cases, price is the appropriateWTP value of the welfare change associated with a one-unitincrease in the individual’s consumption rate of the commodity.
A demand curve is a representation of the relationship betweenquantity and consumers’ WTP. Figure 4-1 demonstrates thisrelationship and how it might be affected by changes in productquality. Assume the current (with-NIST) demand curve for a CRM,for example, is
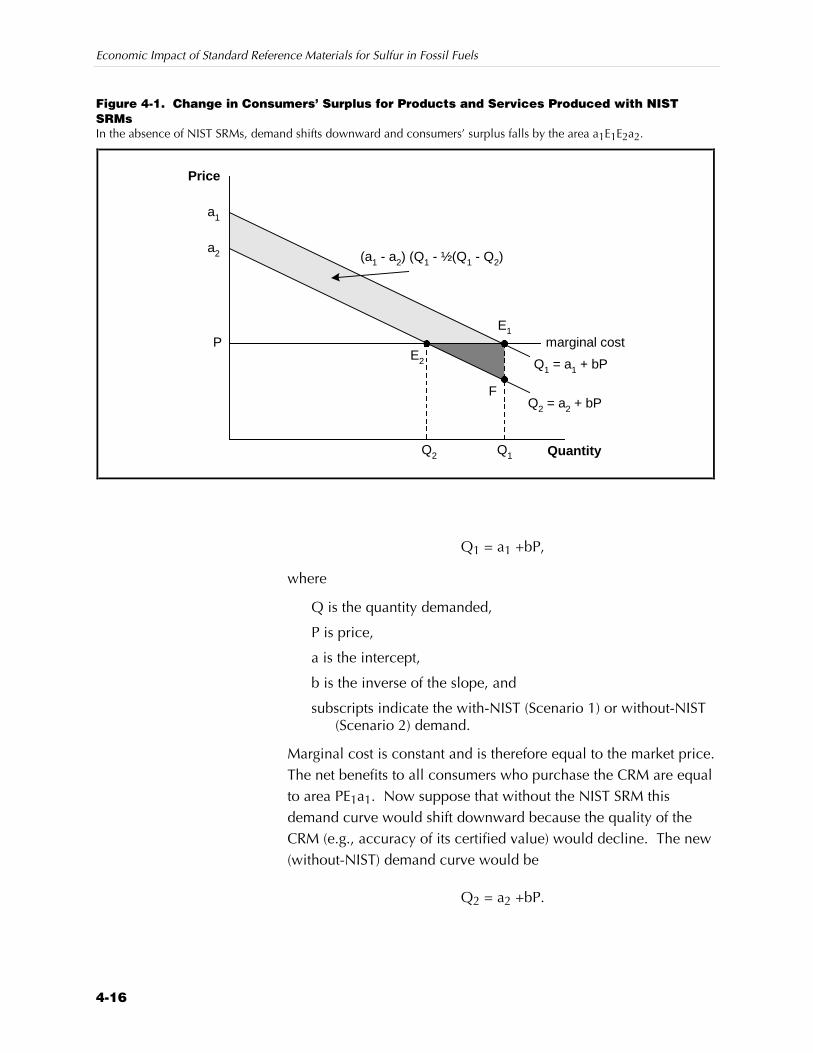
Economic Impact of Standard Reference Materials for Sulfur in Fossil Fuels
4-16
Figure 4-1. Change in Consumers’ Surplus for Products and Services Produced with NISTSRMsIn the absence of NIST SRMs, demand shifts downward and consumers’ surplus falls by the area a1E1E2a2.
marginal cost
(a1 - a2) (Q1 - ½(Q1 - Q2)
P
Q2
F
Q1
E2
E1
a2
a1
Q1 = a1 + bP
Q2 = a2 + bP
Price
Quantity
Q1 = a1 +bP,
where
Q is the quantity demanded,
P is price,
a is the intercept,
b is the inverse of the slope, and
subscripts indicate the with-NIST (Scenario 1) or without-NIST(Scenario 2) demand.
Marginal cost is constant and is therefore equal to the market price.The net benefits to all consumers who purchase the CRM are equalto area PE1a1. Now suppose that without the NIST SRM thisdemand curve would shift downward because the quality of theCRM (e.g., accuracy of its certified value) would decline. The new(without-NIST) demand curve would be
Q2 = a2 +bP.
Section 4 — Valuing Improved Sulfur Information
4-17
We assume that the elasticity of demand does not change. Thus, asshown in Figure 4-1, the change in quality causes a parallel shift inthe demand curve. Consumers’ per-unit WTP for this product fallsby the amount (a1 – a2). This decline leads to a reduction in theequilibrium quantity demanded from Q1 to Q2 and a reduction inconsumers’ surplus. In this case, the consumers’ surplus falls toarea PE2a2. The loss in consumers’ surplus is equal to a1E1a2E2.This is the appropriate measure of the change in welfare due to theuse of NIST SRMs.
The change in consumers’ surplus (CS), using the simplifyingassumptions stated earlier (linear demand, constant marginal cost),can be expressed as
∆ CS = (a1 – a2) * [Q1 – ½(Q1 – Q2)]
To implement our methodology for estimating the benefit of animprovement in the quality of goods and services due to NISTSRMs, we needed to collect variables for each good and servicethat is manufactured with the assistance of NIST SRMs for sulfur infossil fuels. These variables are
Z annual quantities sold,
Z prices, and
Z estimates of change in consumers’ in WTP for each product.
Table 4-2 provides an example of the type of data we collected toimplement the measurement plan. As shown in Appendix B, wedesigned survey questions that elicit this information. Note that weassumed that the manufacturers of these products can estimate thechange in their customers’ WTP. Ideally, we would ask thecustomers for this information; however, this population is too largeand difficult to identify to make this a reasonable task within theresources allowed for this study.
4.3.2 Changes in R&D Costs (H2)
We hypothesized that the manufacturers of instruments and CRMs,as well as fuel companies, benefit from accuracy in themeasurement of sulfur via reductions in the cost of R&D. Toquantify these changes, we collected and analyzed the followinginformation:
Economic Impact of Standard Reference Materials for Sulfur in Fossil Fuels
4-18
Z total R&D budget for industrial sector (B);
Z percentage of R&D budget allocated to sulfur-relatedresearch (D);
Z percentage of R&D costs consumed by measurement andtesting of sulfur content (T); and
Z potential percentage increase in R&D costs due tounavailability of NIST SRMs for sulfur in fossil fuels (M).
The decrease in R&D cost to industry is then
∆C = B * D * T * M.
4.3.3 Changes in Transactions Costs (H3)
We hypothesized that increases in the precision of themeasurement of sulfur in fossil fuels decrease the transactions costsfor buyers and sellers of fossil fuels. To quantify the extent of thesechanges, we need to know
Z the number of fossil fuel transactions that take place eachyear;
Z the number of transactions that currently involve some typeof dispute over the sulfur content of the fuel;
Z the impact of NIST SRMs on the number of transactions indispute; and
Z the cost of resolving a dispute.
From our analysis of the impact of SRMs on the repeatability ofsulfur measurements, we estimated the change in the number ofdisputes. This estimate depends on the degree to which the SRMimproves the precision of the measurement of sulfur in fossil fuels.As this precision increases, fewer shipments are disputed becauseof measurement error. Our approach is illustrated in Figure 4-2.
As previously described, many fuel purchase contracts specify asulfur content and a range within which the shipment will beaccepted. Assume that the acceptance range is C1 to C2—that is,the purchaser of the fuel will accept the shipment as long as theestimated sulfur content lies [above C1 or] below C2. Forsimplicity, assume that this acceptance range is equal to the95 percent confidence interval for the measurement of sulfur infossil fuels, and that a NIST SRM is used for calibration and/orquality control. These assumptions imply that if one measurementis within the acceptance range, a second measurement will be
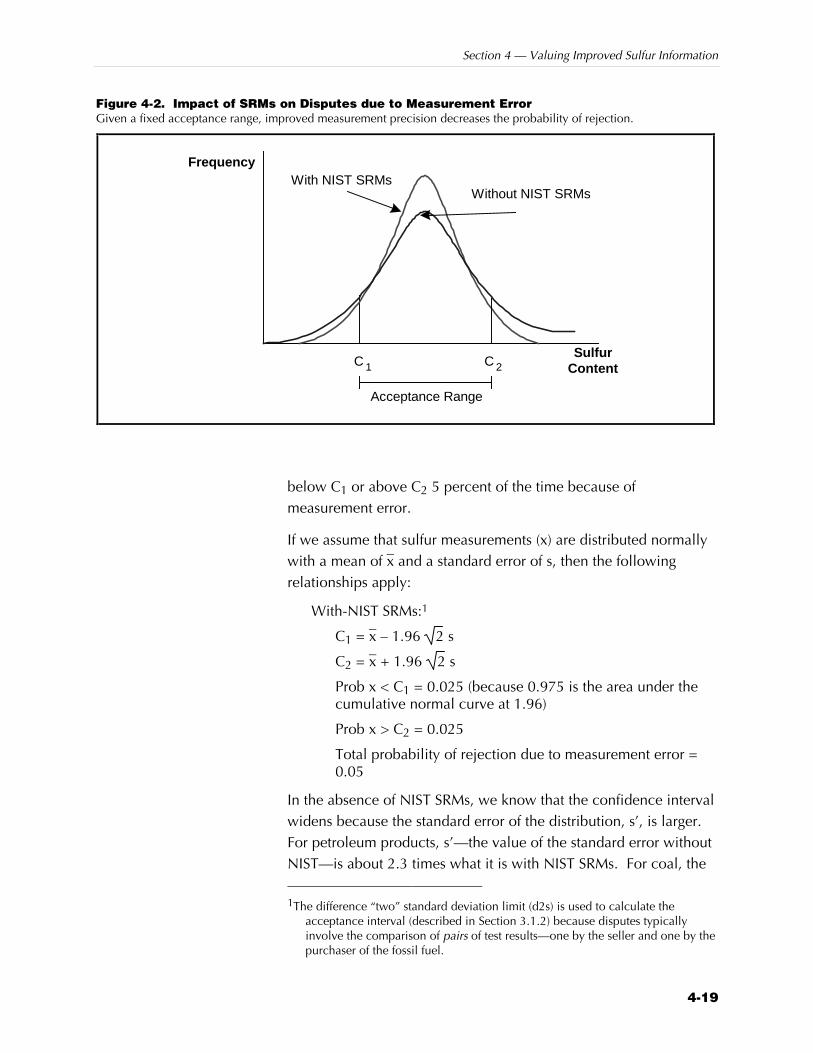
Section 4 — Valuing Improved Sulfur Information
4-19
Figure 4-2. Impact of SRMs on Disputes due to Measurement ErrorGiven a fixed acceptance range, improved measurement precision decreases the probability of rejection.
Frequency
Without NIST SRMs
SulfurContent
Acceptance Range
With NIST SRMs
2C1C
below C1 or above C2 5 percent of the time because ofmeasurement error.
If we assume that sulfur measurements (x) are distributed normallywith a mean of x– and a standard error of s, then the followingrelationships apply:
With-NIST SRMs:1
C1 = x– – 1.96 2 s
C2 = x– + 1.96 2 s
Prob x < C1 = 0.025 (because 0.975 is the area under thecumulative normal curve at 1.96)
Prob x > C2 = 0.025
Total probability of rejection due to measurement error =0.05
In the absence of NIST SRMs, we know that the confidence intervalwidens because the standard error of the distribution, s’, is larger.For petroleum products, s’—the value of the standard error withoutNIST—is about 2.3 times what it is with NIST SRMs. For coal, the
1The difference “two” standard deviation limit (d2s) is used to calculate the
acceptance interval (described in Section 3.1.2) because disputes typicallyinvolve the comparison of pairs of test results—one by the seller and one by thepurchaser of the fossil fuel.
Economic Impact of Standard Reference Materials for Sulfur in Fossil Fuels
4-20
without-NIST s is about 1.6 times what it is with NIST SRMs.2
Taking coal as an example, the following relationships hold:
s = s’/1.6
C1 = x– –
1.96 2s’
1.6 = x– – 1.255 2 s
Prob x < C1 = 1 – 0.8897 (area under the cumulative normalcurve at 1.225) = 0.0951
Prob x > C2 = 0.1103
Total probability of rejection due to measurement error is about0.22
Thus, the probability that a shipment will be disputed changes from0.05 in the with-NIST case to about 0.22 in the without-NIST case.If the total number of transactions per year sold on the basis ofsulfur content is equal to 1 million, the number of transactions indispute climbs from 50,000 in the with-NIST case to 220,000 in thewithout-NIST case. (This is an extreme example. The real numbersare much smaller.)
To implement this analysis, we collected information on thenumber of transactions that specify sulfur content, the percentagethat currently are disputed, and the cost of resolving a dispute.Information about the impact of NIST SRMs on the distribution ofsulfur measurements was determined as described in Section 3.
4.3.4 Improvements in Production Efficiency (H4)
We hypothesize that by improving the quality of the measurementof sulfur in fossil fuels NIST SRMs assist the coal, petroleum, steel,and electric utility industries in improving the productivity of manyof their operations. These operations include fuel blending,desulfurization, and operation of equipment. In this section, wedescribe how we quantified and valued these changes inproductivity.
2These factors represent the average ratio of SRM standard errors before and after
introducing the IDMS methodology.
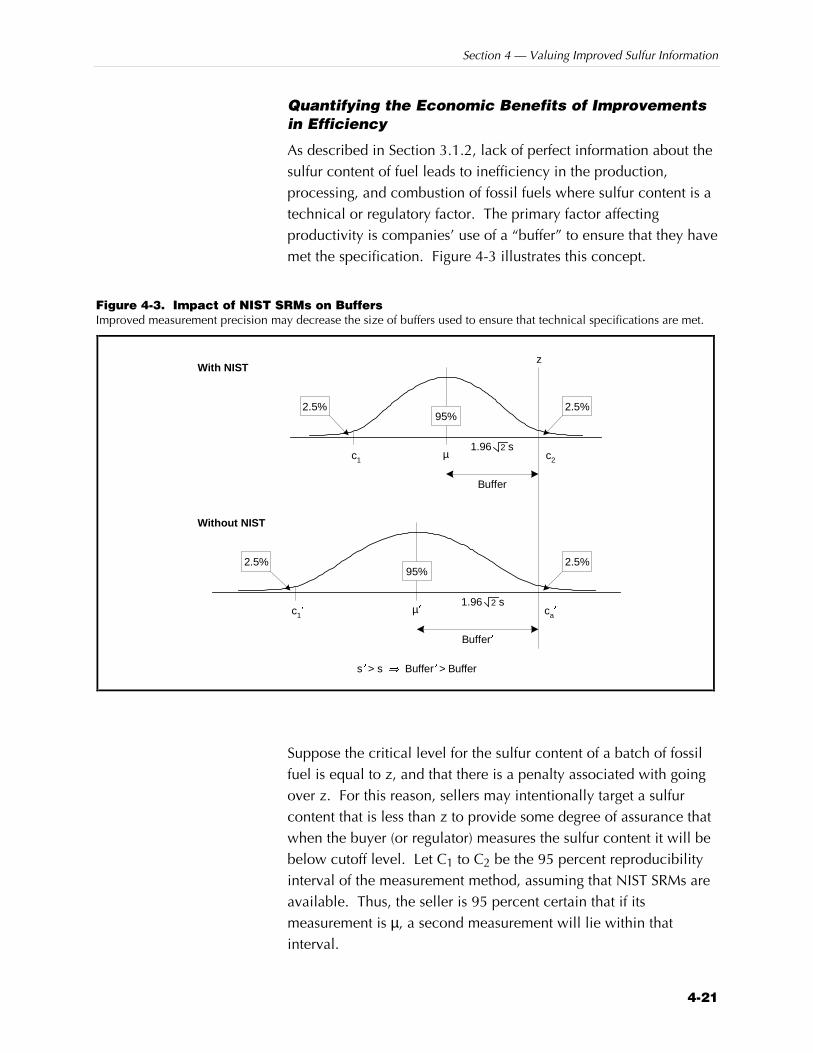
Section 4 — Valuing Improved Sulfur Information
4-21
Quantifying the Economic Benefits of Improvementsin Efficiency
As described in Section 3.1.2, lack of perfect information about thesulfur content of fuel leads to inefficiency in the production,processing, and combustion of fossil fuels where sulfur content is atechnical or regulatory factor. The primary factor affectingproductivity is companies’ use of a “buffer” to ensure that they havemet the specification. Figure 4-3 illustrates this concept.
Figure 4-3. Impact of NIST SRMs on BuffersImproved measurement precision may decrease the size of buffers used to ensure that technical specifications are met.
1.96 2 s
µ
Buffer
With NIST
95%2.5% 2.5%
1.96 2 s
z
µ¢
Buffer¢
Without NIST
2.5% 2.5%95%
s¢ > s Þ Buffer¢ > Buffer
c1¢
c1 c2
ca¢
Suppose the critical level for the sulfur content of a batch of fossilfuel is equal to z, and that there is a penalty associated with goingover z. For this reason, sellers may intentionally target a sulfurcontent that is less than z to provide some degree of assurance thatwhen the buyer (or regulator) measures the sulfur content it will bebelow cutoff level. Let C1 to C2 be the 95 percent reproducibilityinterval of the measurement method, assuming that NIST SRMs areavailable. Thus, the seller is 95 percent certain that if itsmeasurement is µ, a second measurement will lie within thatinterval.
Economic Impact of Standard Reference Materials for Sulfur in Fossil Fuels
4-22
The following relationships hold:
C1 = µ – 1.96 2 s
z = C2 = µ + 1.96 2 s
For example, suppose the critical sulfur level for diesel fuel is500 ppm and the oil company wants to be 95 percent certain thatthe fuel will test at or below 500 ppm. If the reproducabilityinterval is equal to 50 ppm, then the oil company would set thetarget value at 475 ppm to be 95 percent certain that the fuel wouldtest at or below 500 ppm. The buffer would be equal to 25 ppm,about half of the reproducability interval.
Now consider the impact of a wider interval (e.g., the impact of awider interval due to the absence of a NIST SRM). For petroleumproducts, that standard error in the absence of NIST SRMs is about2.3 times the size it is, given the availability of NIST SRMs. Thisimplies the buffer increases to approximately 57 ppm and the newtarget value (µ′) is equal to about 443 ppm.3
To value the impact of the change in the buffer, we must considerthe relative cost of low-sulfur versus high-sulfur fuels. Forpetroleum products, we used the unit desulfurization costs ofgasoline and diesel fuel ($0.0001 per gallon to remove 1 ppm ofsulfur—see Section 4). For coal, we conducted a similar analysis;the value of reducing the sulfur buffer is based on the unit cost ofcleaning and blending coal to remove sulfur (approximately $0.03per ton per 0.01 percent sulfur reduction—see Section 4).
To complete the analysis, we multiplied the per-unit savings due tothe reduction of the buffer by the annual quantity of fuel subject toeach type of constraint. For example, we needed to know theannual quantity of diesel fuels subject to the 500-ppm sulfur limitimposed by EPA, the quantity of gasoline subject to the sulfurlimits, and the quantity of fuels subject to sulfur limits in purchasecontracts and for technical operating criteria.
3We have simplified this example. Actually, the reproducibility interval function
changes with changes in the mean sulfur concentration.
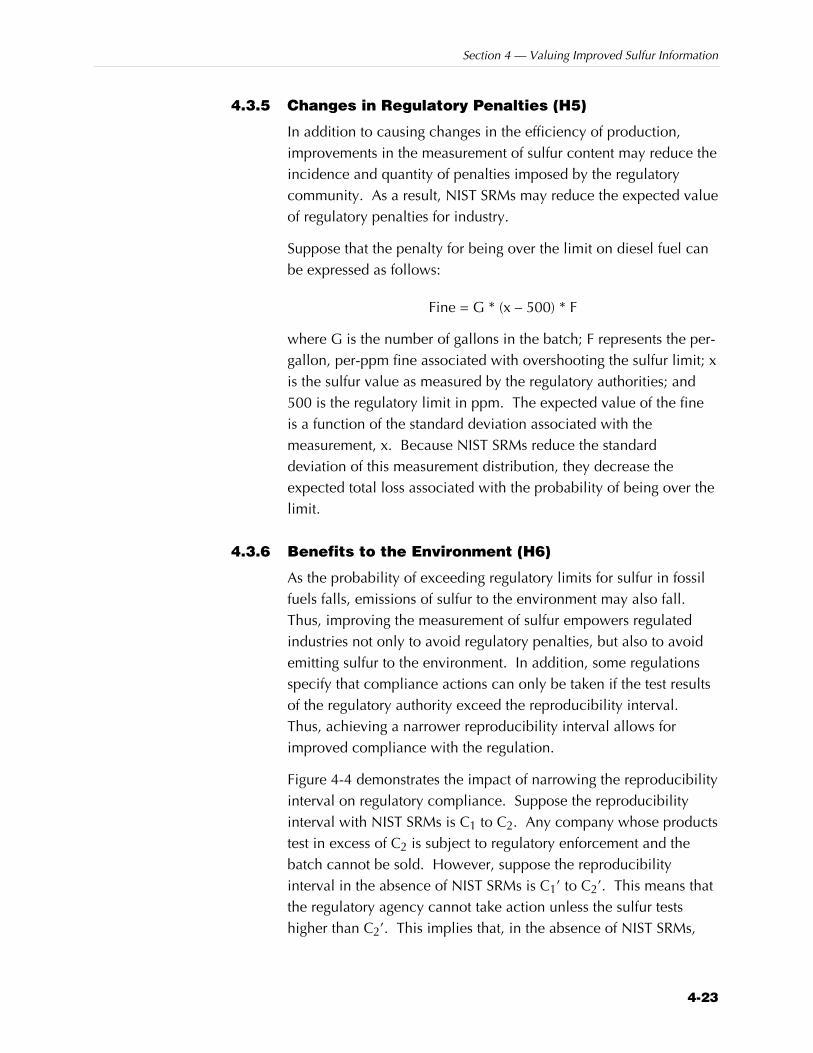
Section 4 — Valuing Improved Sulfur Information
4-23
4.3.5 Changes in Regulatory Penalties (H5)
In addition to causing changes in the efficiency of production,improvements in the measurement of sulfur content may reduce theincidence and quantity of penalties imposed by the regulatorycommunity. As a result, NIST SRMs may reduce the expected valueof regulatory penalties for industry.
Suppose that the penalty for being over the limit on diesel fuel canbe expressed as follows:
Fine = G * (x – 500) * F
where G is the number of gallons in the batch; F represents the per-gallon, per-ppm fine associated with overshooting the sulfur limit; xis the sulfur value as measured by the regulatory authorities; and500 is the regulatory limit in ppm. The expected value of the fineis a function of the standard deviation associated with themeasurement, x. Because NIST SRMs reduce the standarddeviation of this measurement distribution, they decrease theexpected total loss associated with the probability of being over thelimit.
4.3.6 Benefits to the Environment (H6)
As the probability of exceeding regulatory limits for sulfur in fossilfuels falls, emissions of sulfur to the environment may also fall.Thus, improving the measurement of sulfur empowers regulatedindustries not only to avoid regulatory penalties, but also to avoidemitting sulfur to the environment. In addition, some regulationsspecify that compliance actions can only be taken if the test resultsof the regulatory authority exceed the reproducibility interval.Thus, achieving a narrower reproducibility interval allows forimproved compliance with the regulation.
Figure 4-4 demonstrates the impact of narrowing the reproducibilityinterval on regulatory compliance. Suppose the reproducibilityinterval with NIST SRMs is C1 to C2. Any company whose productstest in excess of C2 is subject to regulatory enforcement and thebatch cannot be sold. However, suppose the reproducibilityinterval in the absence of NIST SRMs is C1’ to C2’. This means thatthe regulatory agency cannot take action unless the sulfur testshigher than C2’. This implies that, in the absence of NIST SRMs,
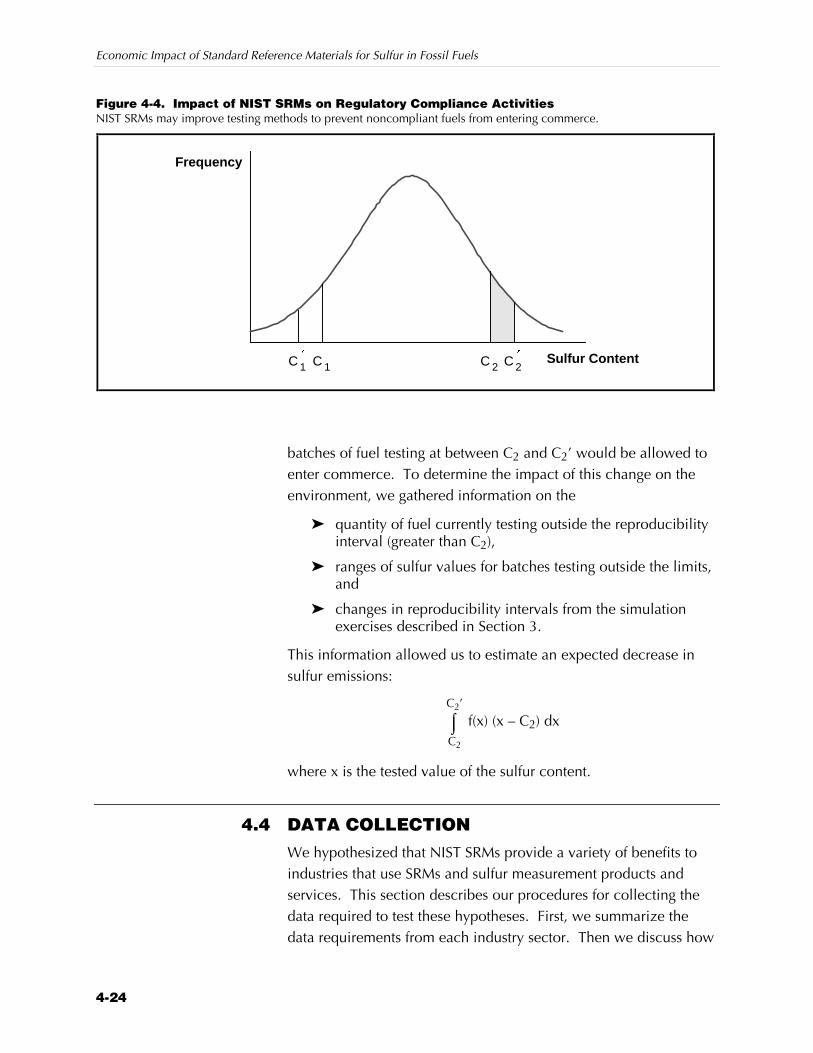
Economic Impact of Standard Reference Materials for Sulfur in Fossil Fuels
4-24
Figure 4-4. Impact of NIST SRMs on Regulatory Compliance ActivitiesNIST SRMs may improve testing methods to prevent noncompliant fuels from entering commerce.
Frequency
Sulfur Content2C1C
¢
2C¢
1C
batches of fuel testing at between C2 and C2’ would be allowed toenter commerce. To determine the impact of this change on theenvironment, we gathered information on the
Z quantity of fuel currently testing outside the reproducibilityinterval (greater than C2),
Z ranges of sulfur values for batches testing outside the limits,and
Z changes in reproducibility intervals from the simulationexercises described in Section 3.
This information allowed us to estimate an expected decrease insulfur emissions:
⌡⌠C2
C2’
f(x) (x – C2) dx
where x is the tested value of the sulfur content.
4.4 DATA COLLECTIONWe hypothesized that NIST SRMs provide a variety of benefits toindustries that use SRMs and sulfur measurement products andservices. This section describes our procedures for collecting thedata required to test these hypotheses. First, we summarize thedata requirements from each industry sector. Then we discuss how
Section 4 — Valuing Improved Sulfur Information
4-25
we chose the sample of companies from among the manycompanies likely to be affected by NIST SRMs. Finally, we discussour data collection procedures, including the procedures we usedto pretest the instruments, contact participants, and record theirresponses.
4.4.1 Data Requirements
A variety of data are needed to test the hypotheses we developedearlier in this chapter. We also developed technical and economicimpact measures and described the data that would be needed toconstruct each measure. Table 4-4 summarizes these datarequirements.
The final column in Table 4-4 indicates the source of the data. Wecollected items marked “secondary” from publicly availablesecondary data sources. Many of these data items were availablefrom EPA, CARB, the American Petroleum Institute, and the ElectricPower Research Institute. When possible, we verified these dataduring the interviews. For data elements for which the source ismarked “primary,” we collected these data directly from interviewparticipants. Appendix B contains the questionnaire used to guidethe interviews.
4.4.2 Sample Selection
We interviewed several members of each of the affected industries.The interview contact list was developed using information andcontacts provided by our consultants, industry trade associations,the SRM sales database, and the ASTM online directory of testinglaboratories. Table 4-5 shows the number of interviews conductedby industry segment. Although we spoke with many of ourrespondents on multiple occasions over the course of the study,each respondent was counted as one interview. Occasionally, itwas necessary to conduct interviews with multiple contacts withinone company, because of the range of activities conducted indifferent divisions of larger companies.
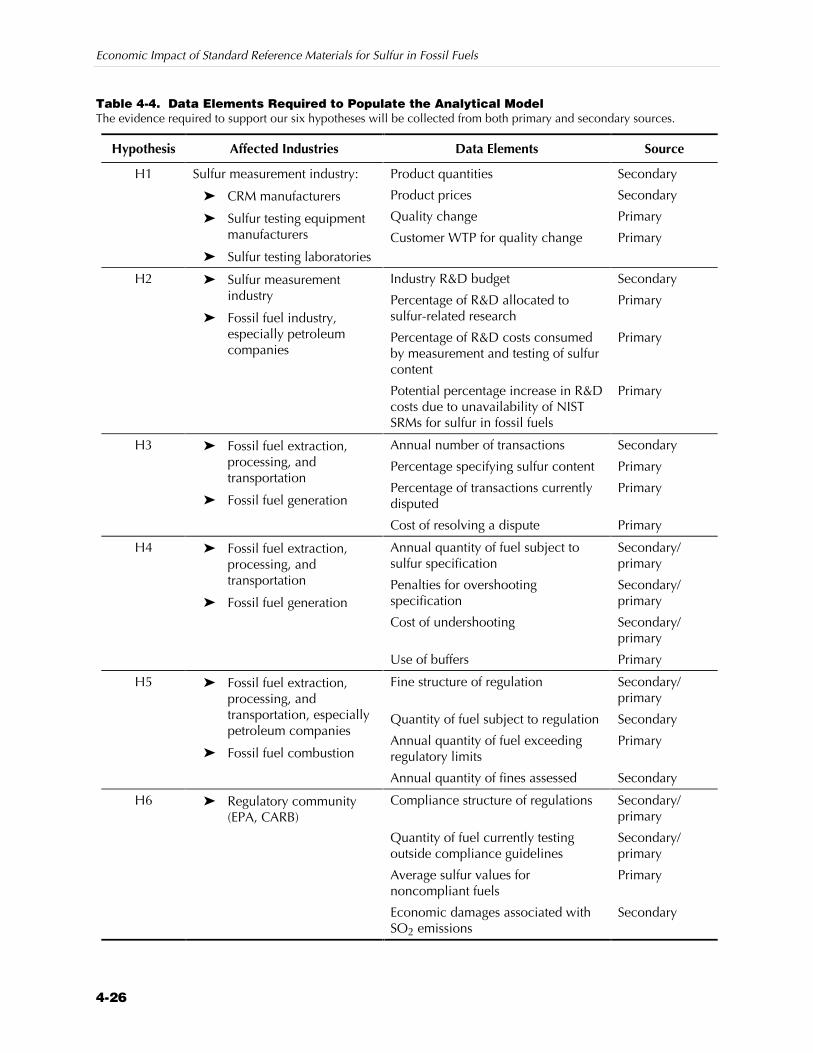
Economic Impact of Standard Reference Materials for Sulfur in Fossil Fuels
4-26
Table 4-4. Data Elements Required to Populate the Analytical ModelThe evidence required to support our six hypotheses will be collected from both primary and secondary sources.
Hypothesis Affected Industries Data Elements Source
H1 Product quantities Secondary
Product prices Secondary
Quality change Primary
Sulfur measurement industry:
Z CRM manufacturers
Z Sulfur testing equipmentmanufacturers
Z Sulfur testing laboratoriesCustomer WTP for quality change Primary
H2 Industry R&D budget Secondary
Percentage of R&D allocated tosulfur-related research
Primary
Percentage of R&D costs consumedby measurement and testing of sulfurcontent
Primary
Z Sulfur measurementindustry
Z Fossil fuel industry,especially petroleumcompanies
Potential percentage increase in R&Dcosts due to unavailability of NISTSRMs for sulfur in fossil fuels
Primary
H3 Annual number of transactions Secondary
Percentage specifying sulfur content Primary
Percentage of transactions currentlydisputed
Primary
Z Fossil fuel extraction,processing, andtransportation
Z Fossil fuel generation
Cost of resolving a dispute Primary
H4 Annual quantity of fuel subject tosulfur specification
Secondary/primary
Penalties for overshootingspecification
Secondary/primary
Cost of undershooting Secondary/primary
Z Fossil fuel extraction,processing, andtransportation
Z Fossil fuel generation
Use of buffers Primary
H5 Fine structure of regulation Secondary/primary
Quantity of fuel subject to regulation Secondary
Annual quantity of fuel exceedingregulatory limits
Primary
Z Fossil fuel extraction,processing, andtransportation, especiallypetroleum companies
Z Fossil fuel combustion
Annual quantity of fines assessed Secondary
H6 Compliance structure of regulations Secondary/primary
Quantity of fuel currently testingoutside compliance guidelines
Secondary/primary
Average sulfur values fornoncompliant fuels
Primary
Z Regulatory community(EPA, CARB)
Economic damages associated withSO2 emissions
Secondary
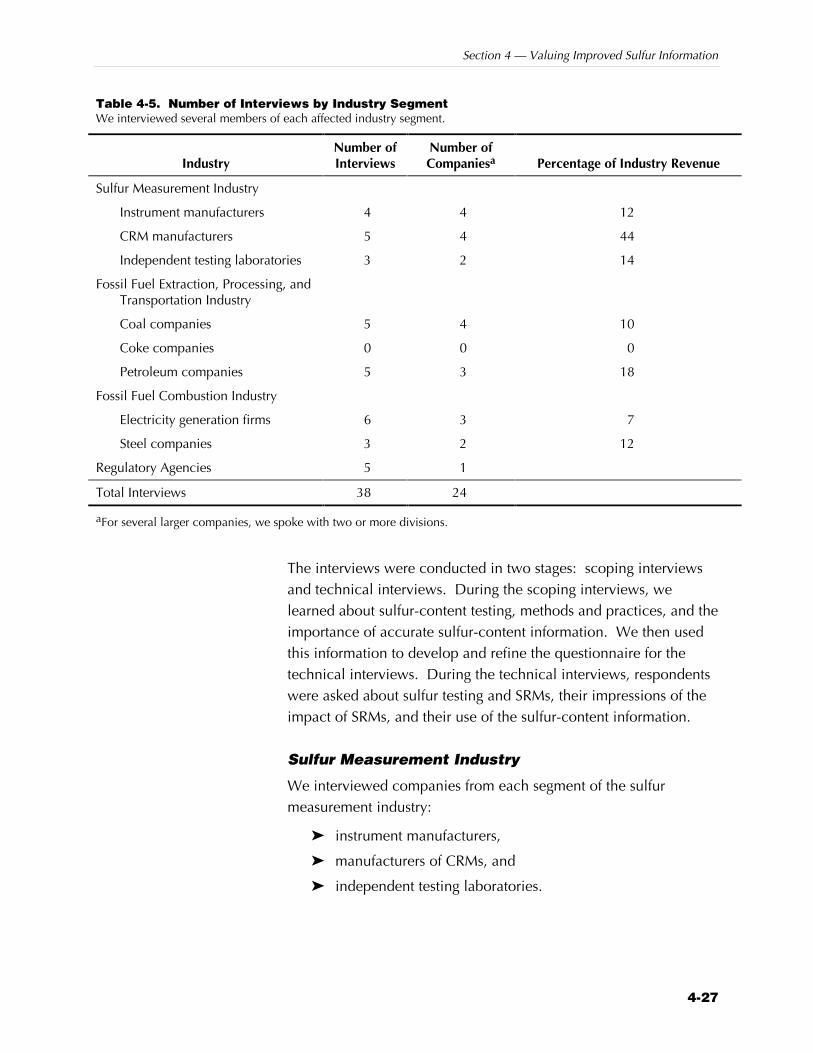
Section 4 — Valuing Improved Sulfur Information
4-27
Table 4-5. Number of Interviews by Industry SegmentWe interviewed several members of each affected industry segment.
IndustryNumber ofInterviews
Number ofCompaniesa Percentage of Industry Revenue
Sulfur Measurement Industry
Instrument manufacturers 4 4 12
CRM manufacturers 5 4 44
Independent testing laboratories 3 2 14
Fossil Fuel Extraction, Processing, andTransportation Industry
Coal companies 5 4 10
Coke companies 0 0 0
Petroleum companies 5 3 18
Fossil Fuel Combustion Industry
Electricity generation firms 6 3 7
Steel companies 3 2 12
Regulatory Agencies 5 1
Total Interviews 38 24
aFor several larger companies, we spoke with two or more divisions.
The interviews were conducted in two stages: scoping interviewsand technical interviews. During the scoping interviews, welearned about sulfur-content testing, methods and practices, and theimportance of accurate sulfur-content information. We then usedthis information to develop and refine the questionnaire for thetechnical interviews. During the technical interviews, respondentswere asked about sulfur testing and SRMs, their impressions of theimpact of SRMs, and their use of the sulfur-content information.
Sulfur Measurement Industry
We interviewed companies from each segment of the sulfurmeasurement industry:
Z instrument manufacturers,
Z manufacturers of CRMs, and
Z independent testing laboratories.
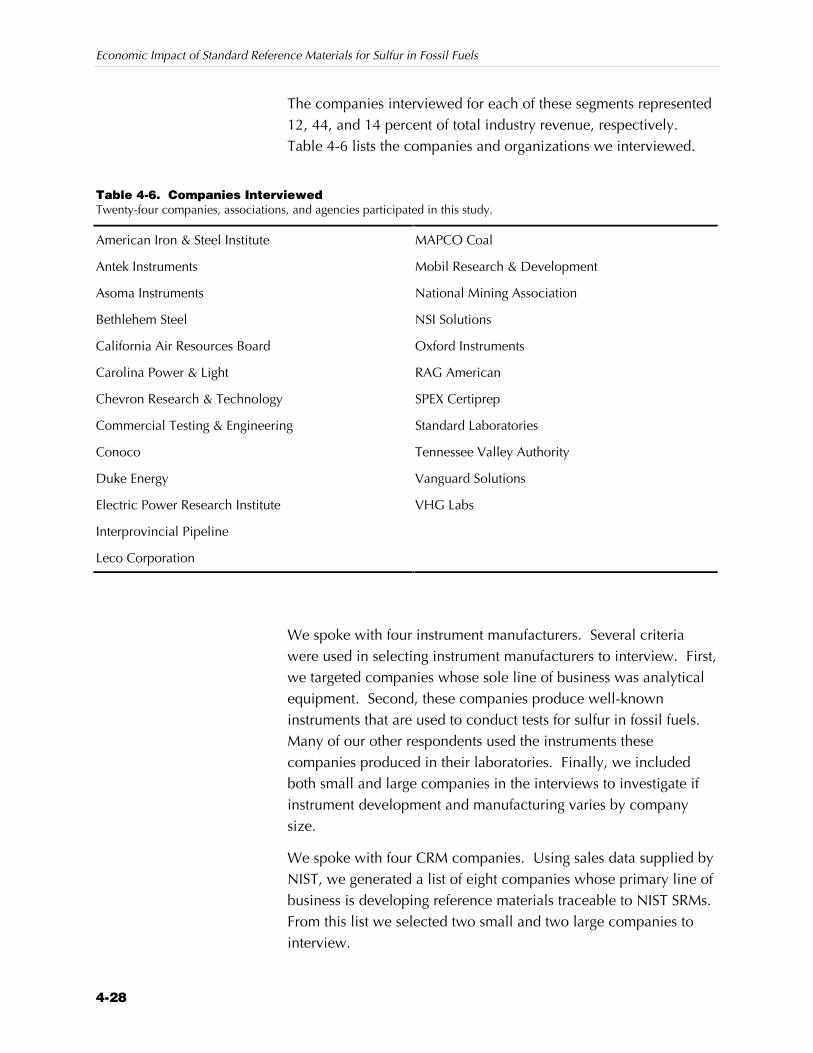
Economic Impact of Standard Reference Materials for Sulfur in Fossil Fuels
4-28
The companies interviewed for each of these segments represented12, 44, and 14 percent of total industry revenue, respectively.Table 4-6 lists the companies and organizations we interviewed.
Table 4-6. Companies InterviewedTwenty-four companies, associations, and agencies participated in this study.
American Iron & Steel Institute MAPCO Coal
Antek Instruments Mobil Research & Development
Asoma Instruments National Mining Association
Bethlehem Steel NSI Solutions
California Air Resources Board Oxford Instruments
Carolina Power & Light RAG American
Chevron Research & Technology SPEX Certiprep
Commercial Testing & Engineering Standard Laboratories
Conoco Tennessee Valley Authority
Duke Energy Vanguard Solutions
Electric Power Research Institute VHG Labs
Interprovincial Pipeline
Leco Corporation
We spoke with four instrument manufacturers. Several criteriawere used in selecting instrument manufacturers to interview. First,we targeted companies whose sole line of business was analyticalequipment. Second, these companies produce well-knowninstruments that are used to conduct tests for sulfur in fossil fuels.Many of our other respondents used the instruments thesecompanies produced in their laboratories. Finally, we includedboth small and large companies in the interviews to investigate ifinstrument development and manufacturing varies by companysize.
We spoke with four CRM companies. Using sales data supplied byNIST, we generated a list of eight companies whose primary line ofbusiness is developing reference materials traceable to NIST SRMs.From this list we selected two small and two large companies tointerview.
Section 4 — Valuing Improved Sulfur Information
4-29
Two companies dominate the market for independent sulfur testingfor the coal industry. We spoke with one of these testingcompanies in-depth and on numerous occasions. We also spokewith the second major coal testing company (briefly) to verify thattheir testing activities and procedures were similar.
Unlike the coal industry, which regularly hires independentlaboratories to conduct sulfur tests for contracts, the majority ofsulfur tests for petroleum products are conducted in-house. Assuch, independent petroleum-testing laboratories were not includedin the interviews, and petroleum testing activities were investigatedduring our discussion with refineries.
Fossil Fuel Extraction and Processing
This industry consists of the coal processing industry, the petroleumrefining industry, and the coke industry. We interviewed two coalcompanies. These companies represent 10 percent of total coalproduction. We found that the testing activities and proceduresemployed by this coal processing company were basically identicalto those used by the coal testing laboratories.
We also interviewed three petroleum companies. Together, thesecompanies account for 18 percent of U.S. revenues from petroleumproducts. Two of these companies are among the largest petroleumcompanies domestically and internationally. The third companywe interviewed was a relatively smaller domestic producer. All ofthe respondents worked in research, development, and technologydivisions.
We interviewed one integrated coke and steel company to obtaininformation on sulfur testing associated with coke production. Theintegrated coke and steel company interviewed produces andconsumes in-house 11 percent of the total amount of cokeproduced domestically.
Fossil Fuel Combustion Industry
We interviewed three electricity-generating companies and onesteel company. We selected companies that varied by size and thathad purchased NIST SRMs.
From the same coke and steel company discussed earlier, weobtained information on the use of coke (and sulfur testing) in the
Economic Impact of Standard Reference Materials for Sulfur in Fossil Fuels
4-30
production of steel. The steel company interviewed represents12 percent of total national steel production. We also spoke withthis industry’s trade association, the American Iron & Steel Institute.
4.4.3 Data Collection Procedures
Our data were gathered from both primary and secondary sources.We used an interview guide to collect information fromrespondents via telephone interviews. Appendix B contains theinterview guide. These guides were customized for each industrybased on the hypotheses that we were testing for each industry.After we field-tested these questions, we collected data fromrespondents in four steps:
1. Make initial telephone contact.
2. Send respondent an overview of the project and theinterview guide.
3. Conduct telephone interview.
4. Write-up interview and contact respondent again to askclarifying questions if necessary.
We initially contacted a person at the target company who wasreferred by NIST or our consultants. If we determined that theinitial contact was not qualified to address the issues of the survey,we contacted another individual recommended by the first contact.In some cases, we spoke with more than one person at a particularcompany. This was often necessary given the broad scope of thequestions we asked.
We also gathered secondary information to support our analysis.This information was collected from government informationagencies, trade associations, and industry literature.
5-1
5 Results
In Section 3, NIST’s improvements in the methodology formeasuring the sulfur content of fossil fuels and for certifying SRMswere discussed. These improvements increased the accuracy ofavailable sulfur content information. In this section, we presentdata that documents the social benefits and cost associated with theuse of NIST SRMs. Beginning in 1984, we quantifiedapproximately $409 million in net benefits to society (NPV $1998)associated with the NIST sulfur SRMs.
The first step in quantifying the benefits from NIST sulfur SRMs, isto develop a counterfactual scenario from which the benefits andcosts can be measured. As discussed in Section 3, ourcounterfactual scenario is that in the absence of NIST, the level ofuncertainty associated with the measurement of sulfur in fossil fuelswould today be similar to what it was prior to the introduction ofIDMS in the middle 1980s. Based on this counterfactualassumption, we are able to express the impact of NIST SRMs interms of a change in the standard error (SE) of sulfur measurementtests.
Table 5-1 shows the average ratio of SRM standard errors beforeand after the introduction of the IDMS methodology. Taking intoaccount the percentage of measurement error associated withsampling, we determined that NIST SRMs improve measurementaccuracy by a factor of about 1.75 for petroleum and 1.25 for coal.These factors represent the ratio of the counterfactual measurementerrors to the NIST SRM measurement errors.
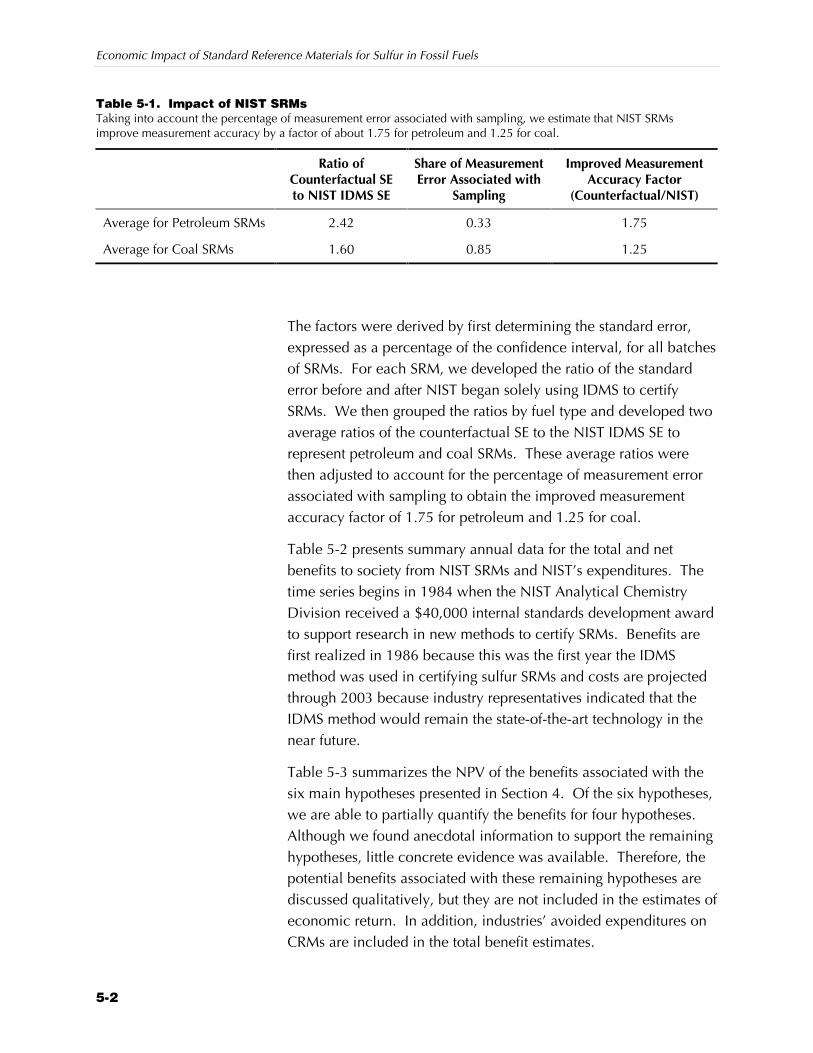
Economic Impact of Standard Reference Materials for Sulfur in Fossil Fuels
5-2
Table 5-1. Impact of NIST SRMsTaking into account the percentage of measurement error associated with sampling, we estimate that NIST SRMsimprove measurement accuracy by a factor of about 1.75 for petroleum and 1.25 for coal.
Ratio ofCounterfactual SEto NIST IDMS SE
Share of MeasurementError Associated with
Sampling
Improved MeasurementAccuracy Factor
(Counterfactual/NIST)
Average for Petroleum SRMs 2.42 0.33 1.75
Average for Coal SRMs 1.60 0.85 1.25
The factors were derived by first determining the standard error,expressed as a percentage of the confidence interval, for all batchesof SRMs. For each SRM, we developed the ratio of the standarderror before and after NIST began solely using IDMS to certifySRMs. We then grouped the ratios by fuel type and developed twoaverage ratios of the counterfactual SE to the NIST IDMS SE torepresent petroleum and coal SRMs. These average ratios werethen adjusted to account for the percentage of measurement errorassociated with sampling to obtain the improved measurementaccuracy factor of 1.75 for petroleum and 1.25 for coal.
Table 5-2 presents summary annual data for the total and netbenefits to society from NIST SRMs and NIST’s expenditures. Thetime series begins in 1984 when the NIST Analytical ChemistryDivision received a $40,000 internal standards development awardto support research in new methods to certify SRMs. Benefits arefirst realized in 1986 because this was the first year the IDMSmethod was used in certifying sulfur SRMs and costs are projectedthrough 2003 because industry representatives indicated that theIDMS method would remain the state-of-the-art technology in thenear future.
Table 5-3 summarizes the NPV of the benefits associated with thesix main hypotheses presented in Section 4. Of the six hypotheses,we are able to partially quantify the benefits for four hypotheses.Although we found anecdotal information to support the remaininghypotheses, little concrete evidence was available. Therefore, thepotential benefits associated with these remaining hypotheses arediscussed qualitatively, but they are not included in the estimates ofeconomic return. In addition, industries’ avoided expenditures onCRMs are included in the total benefit estimates.
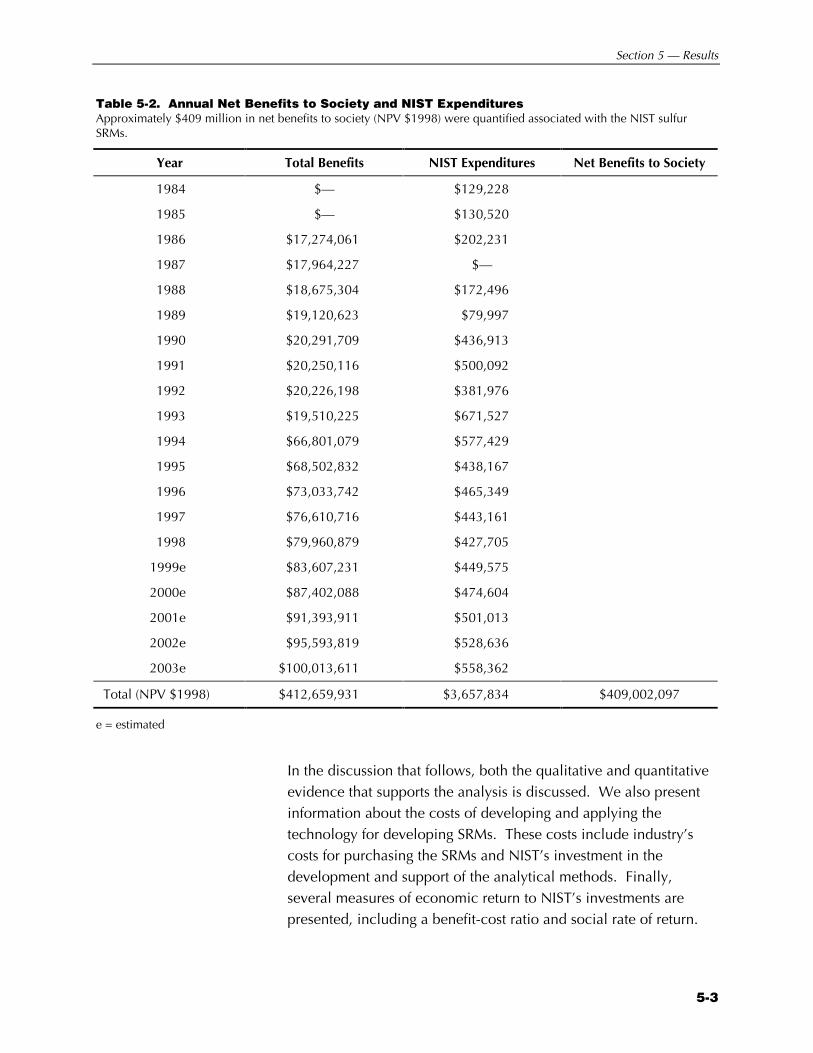
Section 5 — Results
5-3
Table 5-2. Annual Net Benefits to Society and NIST ExpendituresApproximately $409 million in net benefits to society (NPV $1998) were quantified associated with the NIST sulfurSRMs.
Year Total Benefits NIST Expenditures Net Benefits to Society
1984 $— $129,228
1985 $— $130,520
1986 $17,274,061 $202,231
1987 $17,964,227 $—
1988 $18,675,304 $172,496
1989 $19,120,623 $79,997
1990 $20,291,709 $436,913
1991 $20,250,116 $500,092
1992 $20,226,198 $381,976
1993 $19,510,225 $671,527
1994 $66,801,079 $577,429
1995 $68,502,832 $438,167
1996 $73,033,742 $465,349
1997 $76,610,716 $443,161
1998 $79,960,879 $427,705
1999e $83,607,231 $449,575
2000e $87,402,088 $474,604
2001e $91,393,911 $501,013
2002e $95,593,819 $528,636
2003e $100,013,611 $558,362
Total (NPV $1998) $412,659,931 $3,657,834 $409,002,097
e = estimated
In the discussion that follows, both the qualitative and quantitativeevidence that supports the analysis is discussed. We also presentinformation about the costs of developing and applying thetechnology for developing SRMs. These costs include industry’scosts for purchasing the SRMs and NIST’s investment in thedevelopment and support of the analytical methods. Finally,several measures of economic return to NIST’s investments arepresented, including a benefit-cost ratio and social rate of return.
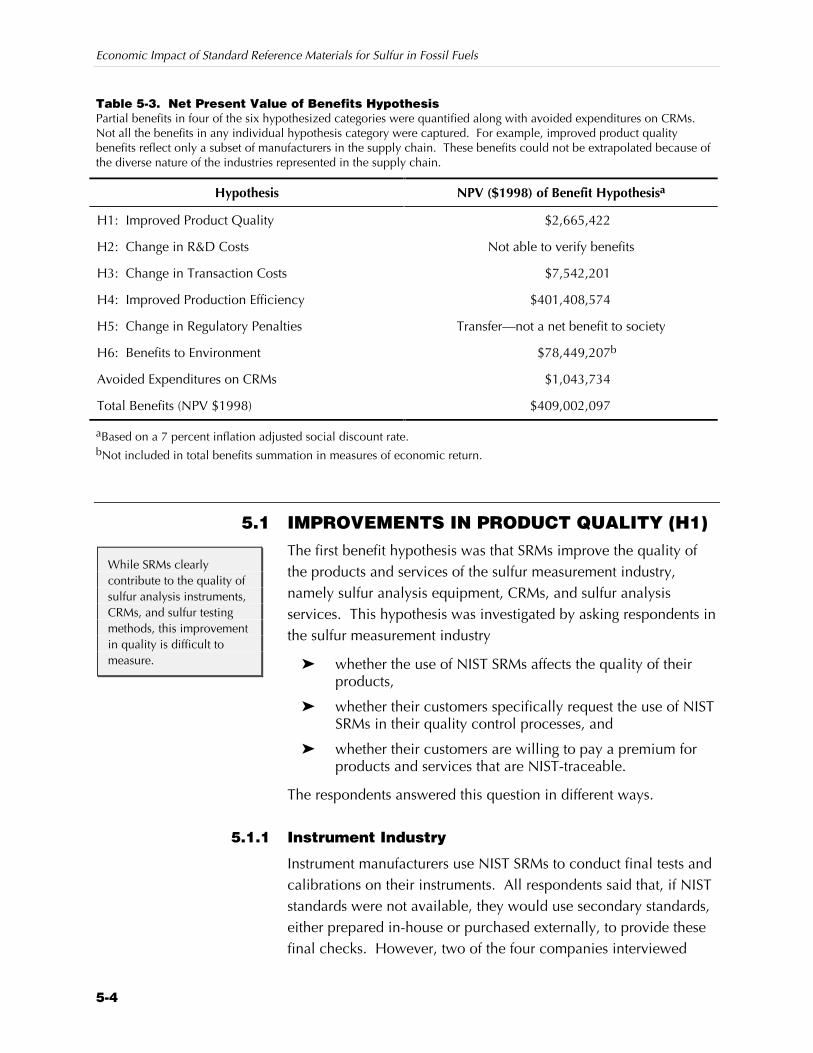
Economic Impact of Standard Reference Materials for Sulfur in Fossil Fuels
5-4
Table 5-3. Net Present Value of Benefits HypothesisPartial benefits in four of the six hypothesized categories were quantified along with avoided expenditures on CRMs.Not all the benefits in any individual hypothesis category were captured. For example, improved product qualitybenefits reflect only a subset of manufacturers in the supply chain. These benefits could not be extrapolated because ofthe diverse nature of the industries represented in the supply chain.
Hypothesis NPV ($1998) of Benefit Hypothesisa
H1: Improved Product Quality $2,665,422
H2: Change in R&D Costs Not able to verify benefits
H3: Change in Transaction Costs $7,542,201
H4: Improved Production Efficiency $401,408,574
H5: Change in Regulatory Penalties Transfer—not a net benefit to society
H6: Benefits to Environment $78,449,207b
Avoided Expenditures on CRMs $1,043,734
Total Benefits (NPV $1998) $409,002,097
aBased on a 7 percent inflation adjusted social discount rate.bNot included in total benefits summation in measures of economic return.
5.1 IMPROVEMENTS IN PRODUCT QUALITY (H1)The first benefit hypothesis was that SRMs improve the quality ofthe products and services of the sulfur measurement industry,namely sulfur analysis equipment, CRMs, and sulfur analysisservices. This hypothesis was investigated by asking respondents inthe sulfur measurement industry
Z whether the use of NIST SRMs affects the quality of theirproducts,
Z whether their customers specifically request the use of NISTSRMs in their quality control processes, and
Z whether their customers are willing to pay a premium forproducts and services that are NIST-traceable.
The respondents answered this question in different ways.
5.1.1 Instrument Industry
Instrument manufacturers use NIST SRMs to conduct final tests andcalibrations on their instruments. All respondents said that, if NISTstandards were not available, they would use secondary standards,either prepared in-house or purchased externally, to provide thesefinal checks. However, two of the four companies interviewed
While SRMs clearlycontribute to the quality ofsulfur analysis instruments,CRMs, and sulfur testingmethods, this improvementin quality is difficult tomeasure.
Section 5 — Results
5-5
acknowledged that unavailability of a NIST standard to provide auniversally accepted benchmark against which to test theirinstruments could affect the accuracy of their instruments, althoughthey were not able to quantify this difference. Another respondentstated that he thought that in-house gravimetrically preparedstandards were sufficient to meet the company’s needs for qualitycontrol and calibration.
Of the four companies, two said that, if they did not use NISTSRMs, there could be an impact on customers’ willingness to pay(WTP) for their products. Most CRM and instrument manufacturersmentioned their use of NIST SRMs in their marketing materials.Respondents noted that the use of NIST SRMs for quality control isexpected and that NIST SRMs are generally treated as tacit industrystandards for quality control programs. However, none of thecompanies we interviewed were able to quantify the impact of notusing NIST SRMs on their customers’ purchase decisions. Theythought that the impact on customers’ WTP would be minimal,particularly if no SRMs were available and all manufacturers used asubstitute material. Thus, we were not able to quantify any benefitsto the instrument industry from improved product quality orsubsequent WTP.
5.1.2 CRM Industry
In the market for CRMs, NIST traceability is an important issue.Virtually all companies that manufacture or market sulfur standardsfor fossil fuels claim NIST traceability. This is an important sellingpoint and a company trying to sell standards that are not certified asNIST-traceable would likely lose sales if competitors were sellingNIST-traceable materials at a comparable price. We asked CRMcompanies if their customers’ WTP for their products would changeif they did not have an independent national standard againstwhich to verify the quality of their products. Of the four companieswe interviewed, three companies were not able to quantifypotential sales if their products were not NIST-traceable. However,one company estimated that their customers’ WTP would fall byabout 25 percent if NIST standards were not available to verify theaccuracy of their standards.
Using the formula presented in Section 4, we estimate the loss inconsumer surplus from this company’s products alone at about
Economic Impact of Standard Reference Materials for Sulfur in Fossil Fuels
5-6
$54,000 per year. Because the other companies we interviewedcould not quantify the potential losses in WTP, we have notextrapolated these results to the remainder of the industry. Thisparticular company positions itself in the high-quality end of theCRM market. Thus, although its customers may be willing to payextra for the improved quality that NIST traceability provides, thismay not be true for the customers of the other CRM companies.
5.1.3 Laboratories
Laboratories that conduct sulfur testing of coal, coke, andpetroleum products routinely use NIST SRMs as part of their qualitycontrol program to verify the calibration of their instruments.While commercially prepared CRMs may be adequate for thesepurposes, some customers specifically request that NIST SRMs beused for these checks. Otherwise, laboratories typically use NISTSRMs once or twice per quarter. The customers that request NISTSRMs to be used for all calibration checks may be willing to pay apremium for their use in the quality control program.
One coal laboratory representative estimated the WTP premiumassociated with SRMs was about 5 percent. This companyaccounts for approximately 33 percent of sulfur coal testingindustry revenues, which are approximately $2,220,000. Applyingthe 5 percent premium to industry coal testing revenue, weestimate that in 1998 the change in consumer surplus was about$313,000 for the entire coal testing industry. Table 5-4 presents thestream of benefits estimated for each hypothesis from when theIDMS method for sulfur was first introduced in 1986 and projecteduntil 2003. To project benefits into the future, we used the averageannual rate of sales growth. All data are presented in 1998 dollars.
Although we believe the change in consumer surplus for thepetroleum testing industry to be proportional to that of the coaltesting laboratories, we were unable to quantify that change.Because of the large number of firms that provide independentpetroleum testing services and the wide range of other services theyprovide, we could not get an accurate estimate of the percentage ofindustry revenue generated by testing for sulfur in petroleum.Without these data, we could not determine a reliable estimate ofthe change in consumer surplus associated with using NIST SRMsin quality control programs.
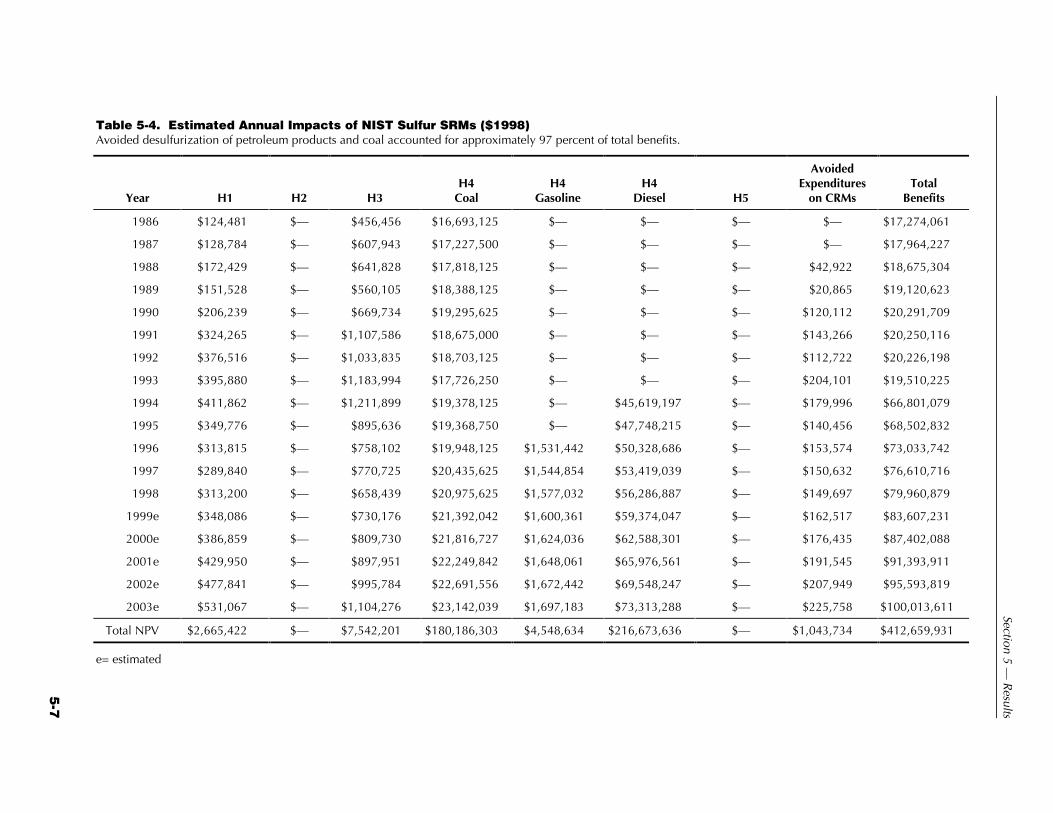
5-7
Section 5 — R
esults
Table 5-4. Estimated Annual Impacts of NIST Sulfur SRMs ($1998)Avoided desulfurization of petroleum products and coal accounted for approximately 97 percent of total benefits.
Year H1 H2 H3H4
CoalH4
GasolineH4
Diesel H5
AvoidedExpenditures
on CRMsTotal
Benefits
1986 $124,481 $— $456,456 $16,693,125 $— $— $— $— $17,274,061
1987 $128,784 $— $607,943 $17,227,500 $— $— $— $— $17,964,227
1988 $172,429 $— $641,828 $17,818,125 $— $— $— $42,922 $18,675,304
1989 $151,528 $— $560,105 $18,388,125 $— $— $— $20,865 $19,120,623
1990 $206,239 $— $669,734 $19,295,625 $— $— $— $120,112 $20,291,709
1991 $324,265 $— $1,107,586 $18,675,000 $— $— $— $143,266 $20,250,116
1992 $376,516 $— $1,033,835 $18,703,125 $— $— $— $112,722 $20,226,198
1993 $395,880 $— $1,183,994 $17,726,250 $— $— $— $204,101 $19,510,225
1994 $411,862 $— $1,211,899 $19,378,125 $— $45,619,197 $— $179,996 $66,801,079
1995 $349,776 $— $895,636 $19,368,750 $— $47,748,215 $— $140,456 $68,502,832
1996 $313,815 $— $758,102 $19,948,125 $1,531,442 $50,328,686 $— $153,574 $73,033,742
1997 $289,840 $— $770,725 $20,435,625 $1,544,854 $53,419,039 $— $150,632 $76,610,716
1998 $313,200 $— $658,439 $20,975,625 $1,577,032 $56,286,887 $— $149,697 $79,960,879
1999e $348,086 $— $730,176 $21,392,042 $1,600,361 $59,374,047 $— $162,517 $83,607,231
2000e $386,859 $— $809,730 $21,816,727 $1,624,036 $62,588,301 $— $176,435 $87,402,088
2001e $429,950 $— $897,951 $22,249,842 $1,648,061 $65,976,561 $— $191,545 $91,393,911
2002e $477,841 $— $995,784 $22,691,556 $1,672,442 $69,548,247 $— $207,949 $95,593,819
2003e $531,067 $— $1,104,276 $23,142,039 $1,697,183 $73,313,288 $— $225,758 $100,013,611
Total NPV $2,665,422 $— $7,542,201 $180,186,303 $4,548,634 $216,673,636 $— $1,043,734 $412,659,931
e= estimated
Economic Impact of Standard Reference Materials for Sulfur in Fossil Fuels
5-8
5.2 REDUCTIONS IN THE COST OF R&D (H2)Our second hypothesis about the impact of NIST SRMs was thatSRMs would reduce the cost of R&D to the sulfur measurementindustry and the fuel industry by supporting accurate, reliable sulfurmeasurement. Although some of our interviewees indicated thatNIST SRMs were part of their R&D laboratories’ quality controlprogram, they were not able to quantify any benefits to their R&Dprogram from NIST SRMs. We have no evidence to support thishypothesis and cannot quantify any economic benefits due toreductions in the cost of R&D attributable to NIST SRMs.
5.2.1 Sulfur Measurement Industry
The companies that develop and manufacture instruments thatmeasure sulfur content in fossil fuels use NIST SRMs in applicationsdevelopment and to verify their prototype instruments. Although allthree of the instrument manufacturers we interviewed said thatSRMs are used in the quality control process in these R&Dlaboratories, only one company stated that SRMs have any impacton the cost of conducting R&D. Furthermore, this companyindicated that the R&D impact was minimal. The only savings thecompany representative could identify was the savings in terms ofthe labor required to gravimetrically prepare and verify in-housestandards if NIST standards were not available. He could notquantify the associated cost savings.
5.2.2 Fossil Fuel Industry
The impact of NIST SRMs in the R&D sector of the fuel industry isminimal. Most petroleum companies conduct R&D in thedevelopment of lower sulfur fuels, but there is no evidence thatNIST SRMs reduce the cost of this research. One representativementioned that the primary reason that NIST SRMs are not animportant factor in R&D is because a quick turnaround time forsulfur results is not as imperative in R&D as it is in productionoperations and purchase/sales situations. Because NIST SRMssupport instrumental analytical methods that are used inquick-turnaround situations, they are much more important in thesesituations than they are in an R&D context.
Section 5 — Results
5-9
5.3 REDUCTIONS DUE TO TRANSACTIONSCOSTS (H3)We hypothesized that NIST SRMs would reduce the cost of fossilfuel transactions because measurements are accepted as reliable;consequently, fewer transactions are disputed because ofmeasurement error. Most of our contacts indicated that,theoretically, better measurements would reduce the number ofdisputes. However, they emphasized that, in actuality, disputesseldom occur and only a small proportion of them are related tosulfur measurement problems. To estimate the benefits attributableto NIST SRMs, we have to ask the question: what would be theincrease in the number of disputes if sulfur measurements were lessaccurate in the absence of NIST?
To quantify this benefit, we first estimated the total cost to industryof measurement disputes and assumed that 5 percent of thesedisputes were associated with measurement error. We then usedthe change in the standard deviation of sulfur content measurementassociated with and without the IDMS method to estimate thedecrease in disputes attributable to NIST SRMs.
In the coal industry, the sulfur content of coal is specified incontracts. The acceptance levels are typically specified in poundssulfur per million Btu or as the sulfur percent weight of coal. Thecontract generally details two sulfur specifications: a guaranteedmonthly weighted average for sulfur content and a rejection limitsulfur content for individual shipments. For example, one industryrepresentative indicated that a typical contact may specify that theaverage monthly sulfur content of their coal shipments cannotexceed 2.87 percent, and that if any individual shipment testedover 3.175 percent sulfur content, the shipment would be disputedand could be rejected pending the resolution of the dispute.
Disputes rarely occur. One coal laboratory respondent stated thatless than 1 percent of all transactions are disputed. According tothis estimate because there are roughly six million coal shipmentseach year in the United States, fewer than 60,000 shipments peryear are disputed. A coal company respondent indicated that only“a few” shipments per year from her company are disputed. Oneelectric utility told us that they handled five disputes per month, orabout 120 disputes over coal shipments per year. Using the firm’s
Economic Impact of Standard Reference Materials for Sulfur in Fossil Fuels
5-10
share of annual electricity generation from coal, we canconservatively estimate the number of disputes per year to be about2,200.
To estimate the benefits attributable to NIST SRMs, we have to askthe question, how much would this number rise if sulfurmeasurements were less accurate in the absence of NIST SRMs? Asdemonstrated in Section 4, if rejection criteria are constant, anincrease in the size of the standard deviation associated with sulfurcontent measurement would increase the probability that ashipment may be disputed simply due to measurement error. Forcoal, the standard deviation today is only about 62 percent of whatit was before the introduction of IDMS. Thus, we assume that thestandard deviation of a sulfur measurement estimate would be 1.25times as large without NIST SRMs as it would be with NIST SRMs.
Our model predicts that increasing the standard deviation by afactor of 1.25 increases the dispute probability from 0.035 percentto about 0.344 percent, meaning that about 18,800 more disputesoccur due to measurement error. One electric utility respondentsaid the cost of resolving a dispute, inclusive of person-hours andlaboratory expenses, is about $700. Using these estimates, for thecoal supply chain, we estimate the cost of the additional disputes inthe absence of NIST SRMs to be $13.2 million per year.
However, most of our respondents party to coal contracts said thatusually when there is a dispute, it is because of human error. Thus,only a handful of the disputes that occur can be attributed tomeasurement error. No respondents were able to estimate thepercentage of disputes attributable to measurement error.Assuming that 5 percent of the disputes are a result of measurementerror, we estimate that the reduction in transactions costs becauseof increased measurement error is about $660,000 in 1998.Table 5-3 presents our estimates from 1986 until 2003. The datawere weighted by the annual average percentage growth in sulfurSRM sales to coal companies, petroleum companies, electricutilities, and steel companies.
Section 5 — Results
5-11
5.4 INCREASES IN PRODUCTION EFFICIENCY(H4)Our fourth hypothesis is that NIST SRMs increase the efficiency offuel blending, desulfurization, and equipment operations becausethe reliability of the measurement allows users to reduce the bufferthey employ to ensure compliance with technical specifications.Information obtained during the interviews indicates that both thepetroleum industry and the coal industry are beneficiaries of thisbenefit. In contrast, the interviews indicated that coke producersand electric utilities burning coal rarely adjust their buffers to takeadvantage of incremental gains in measurement accuracy becauseof the difficulty and cost of physically mixing coal.
5.4.1 Petroleum Industry
Petroleum refineries use buffers in their production processes toreduce the possibility of producing fuels that are found byregulatory agencies to be off-specification, which carries regulatorypenalties for diesel nationally and gasoline in California. WithNIST SRMs, refineries have more accurate information about thesulfur content of their products. The improved measurementaccuracy allows refineries to reduce the buffer between their targetsulfur content and the legal limit.
One petroleum industry respondent said that a typical refineryoperates with a buffer of about 5 percent. For on-highway dieselfuel, which has a per-gallon sulfur content limit of 500 ppm, thetargeted sulfur content is 475 ppm. This 475 ppm target sulfurcontent assures the refinery that, if the diesel fuel it produced istested by a regulatory agency, it will most likely not have a sulfurcontent exceeding the 500 ppm critical limit.
The accuracy of NIST SRMs allow refineries to reduce their buffer,thereby saving on desulfurization costs. In the absence of NISTSRMs, the confidence interval around the target value widensbecause the standard error is larger—about 1.75 times what it iswith NIST SRMs. Based on the approach outlined in Section 4, weestimate that to achieve the same level of confidence without NISTSRMs as with them, the target sulfur content would be 456.3 ppm,rather than 475 ppm. Thus, refineries would remove an additional18.7 ppm from each gallon of on-highway diesel fuel if they did nothave NIST SRMs. EPA estimates that the average cost of removing
Economic Impact of Standard Reference Materials for Sulfur in Fossil Fuels
5-12
1 ppm of sulfur from diesel and gasoline costs $0.0001 per gallon.Our petroleum industry contacts agreed with this estimate.
In 1998, over 30 billion gallons of on-highway diesel fuel wereconsumed in the United States. The cost of removing an additional18.7 ppm sulfur from each gallon would have been approximately$56 million. Table 5-4 presents estimates beginning in 1994because it was the first complete year in which on-highway dieselhad a legal limit of 500 ppm. Estimates for 1999 until 2003 weregenerated using the average annual percentage growth in dieselsales from 1994 to 1998.
For gasoline, we limited our investigation to California reformulatedgasoline. Currently, California is the only state where the sulfurcontent of gasoline is regulated. The regulation has been in effectsince 1996.
Elsewhere, refineries may limit the amount of sulfur in gasoline toavoid damaging sensitive equipment, but they do not alter theirproduction processes to conform to a legal limit, thereby avoidingregulatory penalties. Because these refineries alter their sulfurcontent levels at their discretion, it is difficult to determine theirbuffer and target sulfur content, and non-California reformulatedgasoline was not included in the benefits calculations.
California Air Resources Board (CARB) limits the sulfur content ofgasoline in California to an average of 30 ppm. Incorporating the5 percent buffer, refineries producing gasoline for that market aretargeting a 28.50 ppm sulfur content. In the absence of NIST SRMs,the refinery would have to revise its target limit downward toachieve the same level of confidence that they would not be caughtoff-specification. Refineries would target 27.38 ppm, removing anadditional 1.12 ppm. In 1998, California consumed over 14 billiongallons of reformulated gasoline. If refineries had removed theadditional sulfur, the additional cost would have been $1.6 million(see Table 5-4).
5.4.2 Coal Industry
The coal industry also uses buffers in their production process toensure that delivered coal meets the sulfur content specified incontracts. Cleaning and blending of coal are used to remove sulfurprior to shipment.
Section 5 — Results
5-13
One respondent from the coal industry estimates that coalprocessors typically use a buffer of 0.05 percent sulfur content.This buffer allows room for “spikes” in sulfur content but keeps therunning average below the contract maximum. The coal cleaningprocess costs approximately $0.03 per ton per to remove0.01 percent of sulfur.1
The accuracy of NIST SRMs allows refineries to reduce their buffer,thereby saving on coal cleaning costs. In the absence of NISTSRMs, the confidence interval around the target value widensbecause the standard error is larger—about 1.25 times what it iswith NIST SRMs. Based on the approach outlined in Section 4, weestimate that, to achieve the same level of confidence without NISTSRMs as with them, the buffer would increase to 0.0625 percentsulfur content. Thus, coal processors would need to remove anadditional 0.0125 percent sulfur from each ton of coal that theyclean. This yields a cost savings of $0.0375 per ton associated withthe increased accuracy of NIST SRMs.
It is estimated that the coal industry cleans approximately50 percent of the 1.118 billion tons (1998) of coal mined in theU.S.2 This yields an annual benefit of approximately $21 million in1998 (see Table 5-4).
5.5 REDUCTIONS IN REGULATORY PENALTIES(H5)Our fifth hypothesis was that NIST SRMs reduce the fines paid byindustry due to environmental noncompliance because industryand the regulatory community have accurate and reliable sulfurcontent information. We hypothesized that improvements in themeasurement of sulfur may reduce the incidence and quantity ofpenalties imposed by regulatory agencies.
As with coal transactions, the number of disputes betweenregulatory agencies and regulated entities, such as electric utilitiesand refineries, would probably rise in the absence of NIST SRMs. 1Note that many factors influence the actual cost of removing sulfur from coal,
such as whether the sulfur is in the coal or in the rock, aerability of the sulfurcontent, type of mine (underground or surface), type of cleaning process, andraw and clean coal storage capacity.
2A large share of western coal has a low enough sulfur content that it does notrequire cleaning.
Economic Impact of Standard Reference Materials for Sulfur in Fossil Fuels
5-14
Although this may be the case, the fines paid by industry toregulatory agencies constitute transfers payments. Therefore, wedid not quantify the increase in the number of fines in the absenceof NIST SRMs because no net social benefits are associated withtransfer payments.
5.6 BENEFITS TO THE ENVIRONMENT (H6)Our final hypothesis was that SRMs reduce the amount of sulfurentering the environment by providing industry greater control overthe sulfur content of its fuels and by allowing compliance officialsgreater authority in enforcing the regulatory limits. Quantifiedbenefits to the environment are not included in the total benefitspresented in Table 5-4 or in the measures of economic returncalculated in Section 5.9. These benefits are presented separatelybecause they do not directly affect the sulfur measurement supplychain. However, they are estimated and shown in Table 5-5.
As with the production efficiency hypothesis, the benefits to theenvironment associated with NIST SRMs are limited to petroleumproducts. With NIST SRMs, the reproducibility interval around thetarget sulfur content value is smaller, which means that batches ofdiesel fuel and gasoline are released with less sulfur. Lower sulfurfuels reduce the amount of sulfur dioxide (SO2) emitted to theenvironment.
Nationally, refineries produce diesel fuel with an average sulfurcontent target of 475 ppm. The reproducibility interval, in terms ofppm, is 64.32; the upper limit is the target plus half thereproducibility interval, or 507.16 ppm. If the refinery tests thesulfur content of the fuel and it is below this upper limit, they willrelease the fuel because they are confident that their fuel fallswithin the regulatory agency’s reproducibility interval around the500 ppm legal limit. If the sulfur content exceeds the upper limit,the refinery will reblend the fuel rather than risk the regulatorsfinding their product off-specification. In the absence of NIST, thereproducibility interval increases to 112.35 ppm because thestandard error increases. The upper limit would be 531.17 ppm asopposed to 507.16 ppm. Thus, with NIST SRMs, gasoline isreleased with 24.01 ppm, or 5.06 percent, less sulfur.
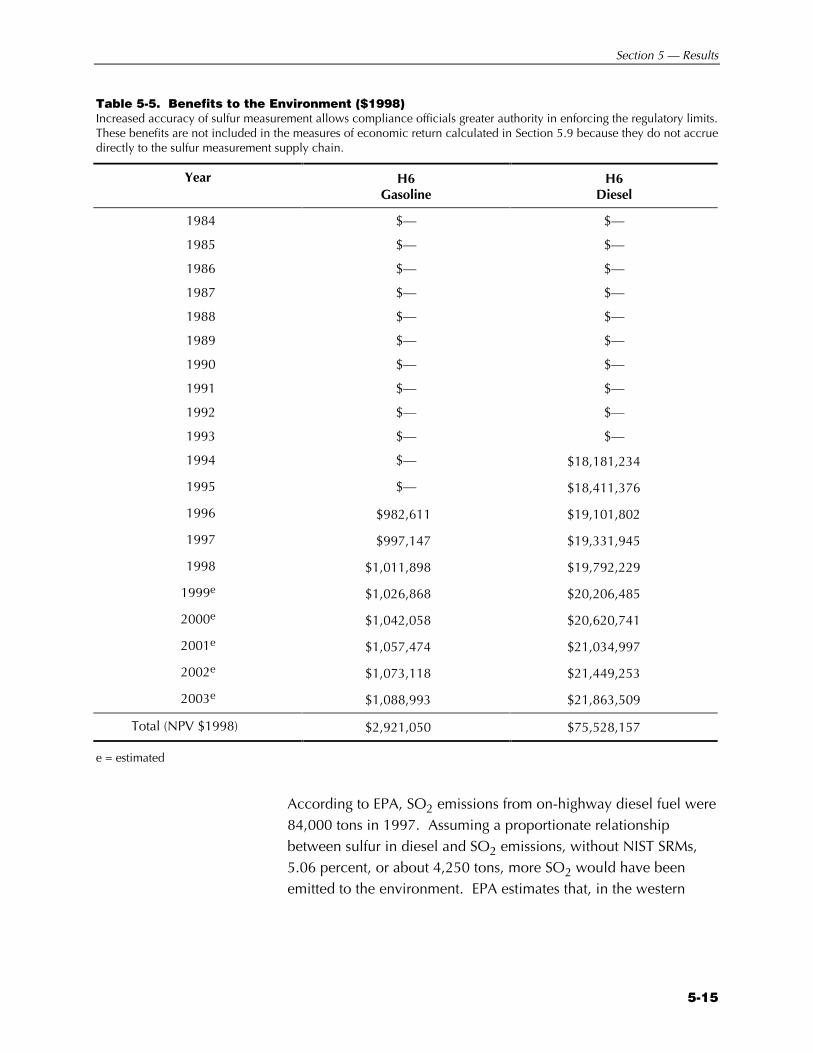
Section 5 — Results
5-15
Table 5-5. Benefits to the Environment ($1998)Increased accuracy of sulfur measurement allows compliance officials greater authority in enforcing the regulatory limits.These benefits are not included in the measures of economic return calculated in Section 5.9 because they do not accruedirectly to the sulfur measurement supply chain.
Year H6Gasoline
H6Diesel
1984 $— $—
1985 $— $—
1986 $— $—
1987 $— $—
1988 $— $—
1989 $— $—
1990 $— $—
1991 $— $—
1992 $— $—
1993 $— $—
1994 $— $18,181,234
1995 $— $18,411,376
1996 $982,611 $19,101,802
1997 $997,147 $19,331,945
1998 $1,011,898 $19,792,229
1999e $1,026,868 $20,206,485
2000e $1,042,058 $20,620,741
2001e $1,057,474 $21,034,997
2002e $1,073,118 $21,449,253
2003e $1,088,993 $21,863,509
Total (NPV $1998) $2,921,050 $75,528,157
e = estimated
According to EPA, SO2 emissions from on-highway diesel fuel were84,000 tons in 1997. Assuming a proportionate relationshipbetween sulfur in diesel and SO2 emissions, without NIST SRMs,5.06 percent, or about 4,250 tons, more SO2 would have beenemitted to the environment. EPA estimates that, in the western
Economic Impact of Standard Reference Materials for Sulfur in Fossil Fuels
5-16
United States, the average environmental impact of a ton of SO2 tobe approximately $4,400 (1997).3
We estimate the benefits to the environment from NIST SRMs to be$19.8 million for diesel fuel in 1998. The same analysis forCalifornia gasoline yields approximately $1 million in benefits in1998 (see Table 5-5). Benefits for both fuels begin in the first yearin which there is a legislated sulfur content limit. Our benefitsprojections for 1999 to 2003 were based on the estimated growthin sulfur dioxide emissions associated with those fuels (EPA,1997b).
5.7 INDUSTRY COSTSWhen measuring the benefits of NIST SRMs, it is important to alsotake into account industry’s avoided expenditures on CRMs.4 It isassumed that in the absence of NIST SRMs industry would havebeen purchased commercially available CRMs to support theirsulfur measurement needs. Thus, from society’s perspective, theseavoided CRM expenditures are treated as a benefit and included inthe total benefit time series shown in Table 5-4.
CRMs are approximately 35 percent of the cost of NIST SRMs.5
Based on this percentage, we assumed that expenditures byindustry to produce CRMs would have been approximately 35percent of NIST’s production, operations, overhead, andadministration expenditures.6 Thus, in 1998 it is estimated thatincreased expenditures for CRMs in 1998 would have beenapproximately $150,000 in the absence of SRMs.
3We believe this particular estimate to be more conservative because most
estimates range from $2,000 to $13,000.4Industry representatives said that no additional operational costs (pull costs) were
associated with using SRMs compared to using CRMs.5Excluding the prices for isooctane and lubricating oil standards, the average price
of a NIST sulfur SRM is about $170. The pricing schedule for CRMs is based onthe number of units purchased. Assuming that customers purchase CRMs insimilar quantities as they purchase NIST SRMS, the average price is about $60.The $60 price was determined by averaging the prices for CRMs comparable toNIST SRMs from VHG Labs, Alpha Resources, AccuStandards, and NSISolutions Thus, society’s increased expenditures on sulfur CRMs is estimated tobe approximately 170/60 = 35 percent of NIST’s expenditures on sulfur SRMs.
6Research and development costs incurred by CRM manufacturers were assumedto be sunk costs and are not included in the industry’s avoided CRMexpenditures.
Avoided expenditures onCRMs are modeled as abenefit and included in thetotal benefit calculation
Section 5 — Results
5-17
5.8 NIST EXPENDITURESBeginning in 1984, NIST began incurring expenditures to supportthe Analytical Chemistry Division’s development and use of IDMSsulfur SRMs. NIST expenditures are ongoing and cover SRMdevelopment, production, operations, overhead, and administrativecosts for SRMs.
NIST’s program expenditures over time for sulfur SRMs developedusing the IDMS method are shown in Table 5-6. Expenditures werecalculated from NIST’s Standard Reference Market Transfer (SRMT)notices. The time series was developed using the followingguidelines:
Z SRM development costs are incurred in the first year of thetime series.
Z SRM production costs are incurred in the year in which theSRM “batch” was produced.
Z SRM operating, overhead, and administration costs aredistributed over time and are assumed to be incurred whenindividual SRMs are sold.
SRM development costs: NIST’s Analytical Chemistry Divisionreceived a $40,000 internal standards development (SD) award in1984 to support research in new methods to certify SRMs.Although this SD research was targeted toward certifying futuremetals SRMs, the methodology was directly transferable to fossilfuel analysis. Thus, 50 percent of this funding is ascribed to thefossil fuel standards certification program. This investment(adjusted for inflation) is shown in the NIST investment cost timeseries shown in Table 5-6.7
SRM production costs: Production costs were obtained from theSRMT notices and were available for 85 percent of the sulfur SRM“batches” (including new and reissued SRMs) produced between1984 and 1998. Average unit production costs were $56 ($1998).Average unit production costs were used to estimate expenditures
7Past NIST research conducted in related areas was also important to the
development of sulfur SRMs. Sulfur SRMs have benefited from previousresearch in areas such as thermal ionization mass spectrometry (TIMS)developed for nuclear standards program and atomic weight research, samplepreparation methods for TIMS, and sample preparation methods for isotopedilution. Costs associated with related/supporting research are not included inthe NIST expenditure estimates presented in Table 5-6 used to calculateeconomic returns.
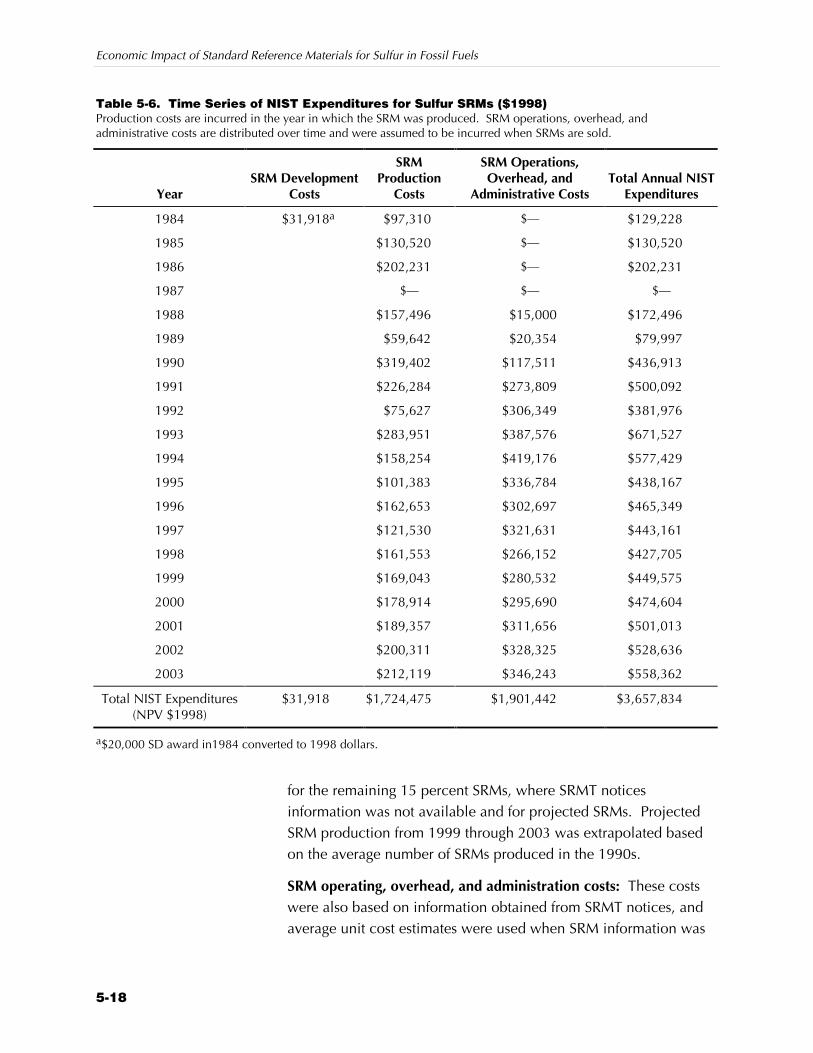
Economic Impact of Standard Reference Materials for Sulfur in Fossil Fuels
5-18
Table 5-6. Time Series of NIST Expenditures for Sulfur SRMs ($1998)Production costs are incurred in the year in which the SRM was produced. SRM operations, overhead, andadministrative costs are distributed over time and were assumed to be incurred when SRMs are sold.
YearSRM Development
Costs
SRMProduction
Costs
SRM Operations,Overhead, and
Administrative CostsTotal Annual NIST
Expenditures
1984 $31,918a $97,310 $— $129,228
1985 $130,520 $— $130,520
1986 $202,231 $— $202,231
1987 $— $— $—
1988 $157,496 $15,000 $172,496
1989 $59,642 $20,354 $79,997
1990 $319,402 $117,511 $436,913
1991 $226,284 $273,809 $500,092
1992 $75,627 $306,349 $381,976
1993 $283,951 $387,576 $671,527
1994 $158,254 $419,176 $577,429
1995 $101,383 $336,784 $438,167
1996 $162,653 $302,697 $465,349
1997 $121,530 $321,631 $443,161
1998 $161,553 $266,152 $427,705
1999 $169,043 $280,532 $449,575
2000 $178,914 $295,690 $474,604
2001 $189,357 $311,656 $501,013
2002 $200,311 $328,325 $528,636
2003 $212,119 $346,243 $558,362
Total NIST Expenditures(NPV $1998)
$31,918 $1,724,475 $1,901,442 $3,657,834
a$20,000 SD award in1984 converted to 1998 dollars.
for the remaining 15 percent SRMs, where SRMT noticesinformation was not available and for projected SRMs. ProjectedSRM production from 1999 through 2003 was extrapolated basedon the average number of SRMs produced in the 1990s.
SRM operating, overhead, and administration costs: These costswere also based on information obtained from SRMT notices, andaverage unit cost estimates were used when SRM information was
Section 5 — Results
5-19
not available. SRM operating costs are approximately $90 per unitand account for approximately 95 percent of the operating,overhead, and administration category shown in column 4 ofTable 5-6.
The total NPV ($1998) of NIST expenditures, including SRMdevelopment, production, operations, overhead, and administrativecosts, is $3.4 million.8 Production costs account for approximately47 percent of NIST total expenditures.
5.9 CALCULATING MEASURES OF ECONOMICRETURNTo determine the returns from NIST’s investment in thedevelopment and operation of the sulfur SRM program, wecompared the net benefits to industry described above with NISTsulfur SRM expenditures. We calculated three summary measuresof the net benefits of the program: the benefit-cost ratio, the netpresent value (NPV), and the social rate of return.
If Bt is the total net benefits to industry (H1 through H5 plusavoided CRM expenditures) accrued to all beneficiaries in year t,and Ct is the cost to NIST of the program in year t, then the benefit-cost ratio for the program is given by
(B/C) =
∑i=0
n B(t+i)(1+r)i
∑i=0
n C(t+i)(1+r)i
(5.1)
where t is the first year in which benefits or costs occur, n is thenumber of years the benefits or costs occur, and r is the social rateof discount. Because benefits and program costs may occur atdifferent time periods, both are expressed in present-value termsbefore the ratio is calculated.
The NPV of the NIST SRMs program can be computed as
8NIST recovers the majority of its SRM development, production, operations,
overhead, and administrative expenditures by selling SRMs to industry.However, because we are estimating the benefits and costs of SRMs to society(not to individual organizations or economic sectors), the selling price of SRMsdoes not enter our analysis; the revenue recovered by NIST is a transferpayment.
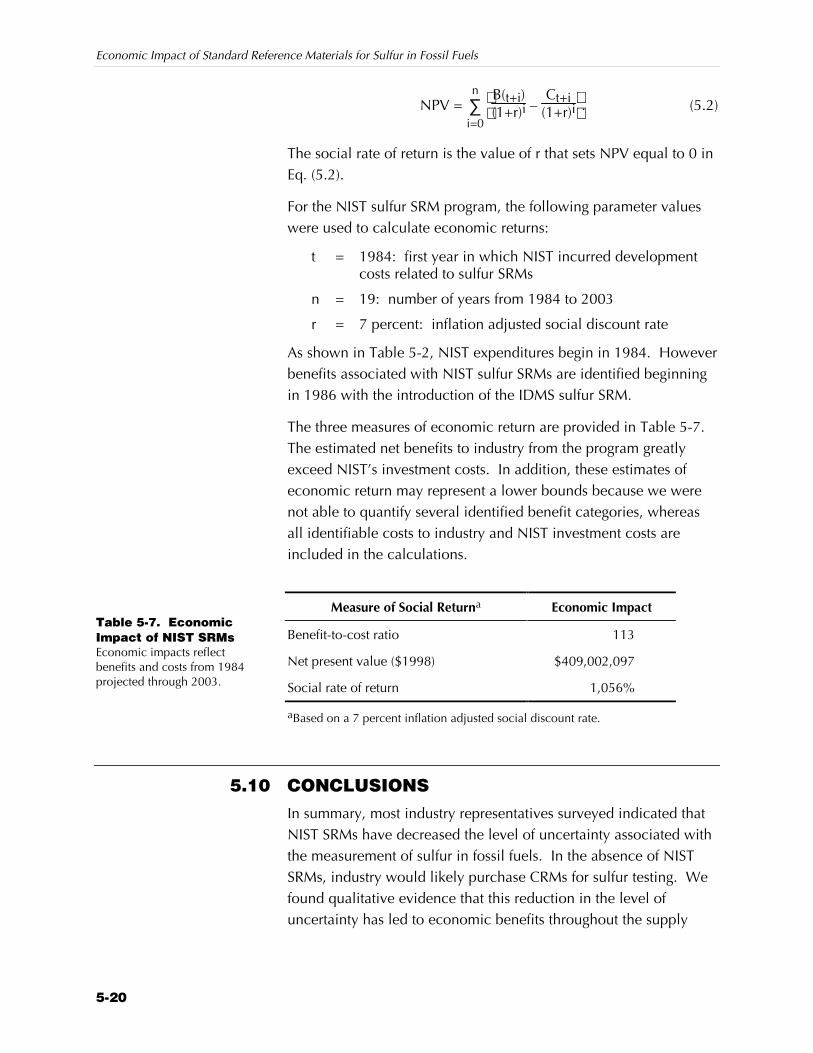
Economic Impact of Standard Reference Materials for Sulfur in Fossil Fuels
5-20
NPV = ∑i=0
n
B(t+i)
(1+r)i – Ct+i
(1+r)i . (5.2)
The social rate of return is the value of r that sets NPV equal to 0 inEq. (5.2).
For the NIST sulfur SRM program, the following parameter valueswere used to calculate economic returns:
t = 1984: first year in which NIST incurred developmentcosts related to sulfur SRMs
n = 19: number of years from 1984 to 2003
r = 7 percent: inflation adjusted social discount rate
As shown in Table 5-2, NIST expenditures begin in 1984. Howeverbenefits associated with NIST sulfur SRMs are identified beginningin 1986 with the introduction of the IDMS sulfur SRM.
The three measures of economic return are provided in Table 5-7.The estimated net benefits to industry from the program greatlyexceed NIST’s investment costs. In addition, these estimates ofeconomic return may represent a lower bounds because we werenot able to quantify several identified benefit categories, whereasall identifiable costs to industry and NIST investment costs areincluded in the calculations.
Measure of Social Returna Economic Impact
Benefit-to-cost ratio 113
Net present value ($1998) $409,002,097
Social rate of return 1,056%
aBased on a 7 percent inflation adjusted social discount rate.
5.10 CONCLUSIONSIn summary, most industry representatives surveyed indicated thatNIST SRMs have decreased the level of uncertainty associated withthe measurement of sulfur in fossil fuels. In the absence of NISTSRMs, industry would likely purchase CRMs for sulfur testing. Wefound qualitative evidence that this reduction in the level ofuncertainty has led to economic benefits throughout the supply
Table 5-7. EconomicImpact of NIST SRMsEconomic impacts reflectbenefits and costs from 1984projected through 2003.
Section 5 — Results
5-21
chain, as described in the impact hypotheses presented in thissection.
The majority of the economic benefits we were able to quantify areassociated with using SRMs in petroleum refineries’ and coalcompanies’ production processes. Improved sulfur measurementallows these industries to reduce the amount of desulfurization theyconduct on fuels, which yields substantial cost savings. Avoideddesulfurization accounted for approximately 97 percent of the totalbenefits used to calculate measures of economic return.
R-1
References
Air Compliance Alert (ACA). July 3, 1998. “Clean Air Reports AirCompliance Alert.” 2(14).
American Business Information, Inc. 1998. The American BusinessDisk [computer file]. Omaha, NE: American BusinessInformation.
American Iron and Steel Institute (AISI). 1998. AISI Directory ofIron and Steel Plants. Washington, DC: AISI.
American National Standards Institute (ANSI). 1981. ISO Guide30—Terms and Definitions Used in Connection withReference Materials. New York: ANSI.
American Society for Testing and Measurement (ASTM). 1999.1999 Directory of Testing Laboratories. <http://www.astm.org/labs/>. As obtained on February 16, 1999.
Association of Iron and Steel Engineers (AISE). 1998. 1998Directory of Iron and Steel Plants: Volume 1 Plants andFacilities. Pittsburgh, PA: AISE.
American Society for Testing and Measurement (ASTM). 1998.Annual Book of ASTM Standards.
Bentley, John P. 1983. Principles of Measurement Systems.London: Longman.
Bohi, Douglas R. 1994. “Utilities and State Regulators are Failingto Take Advantage of Emission Allowance Trading.” TheElectricity Journal 7(2):20-27.
Cantor Fitzgerald, Inc., Environmental Brokerage Services. 1999.“Cantor Fitzgerald EBS, Market Price Index, SO2, NOx, SOx,RTC, ERC, DER, VOC.” <http://www.cantor.com/ebs/marketp.htm>. As obtained on April 5, 1999.
Economic Impact of Standard Reference Materials for Sulfur in Fossil Fuels
R-2
Commercial Testing & Engineering Company. 1998. “SamplingServices.” <http://www.comteco.com/sampleserv.htm>. Asobtained on December 2, 1998.
Dun & Bradstreet. 1997. D&B Million Dollar Directory:America’s Leading Public and Private Companies.Bethlehem, PA: Dun & Bradstreet, Inc.
Dun & Bradstreet. 1999. D&B Million Dollar Directory:America’s Leading Public and Private Companies.Bethlehem, PA: Dun & Bradstreet, Inc.
Fonseca, A. 1995. The Challenge of Coal Preparation. Library,PA: Consol, Inc. <http://www.concentrators.net/pdf/tccp.pdf>. As obtained on December 10, 1999.
Garner, E.L., and S.D. Rasberry. 1993. “What’s New inTraceability.” Journal of Testing and Evaluation 21(6):505-509. <http://ts.nist.gov/ts/htdocs/230/newtrace.htm>.
Glasstone, Samuel. 1980. “Energy Deskbook.” Washington, DC:National Technical Information Services, U.S. Departmentof Commerce. DE82013966 (DOE/IR/05114-1).
Haddix, Anne C., Steven M. Teutsch, Phaedra A. Shaffer, and DianeO. Duñet (eds.). 1996. Prevention Effectiveness: A Guideto Decision Analysis and Economic Evaluation. New York:Oxford University Press.
Hart’s Fuel Technology & Management’s Sulfur 2000. 1998.“Sulfur Emerges as Key Fuel Issue for Next Decade.”
Horton, A.T., and M.A. Bloom. 1993. “Prep Plant Census, 1993.”Coal Magazine September:48-55.
Information Access Corporation. 1998. Business Index [computerfile]. Foster City, CA: Information Access Corporation.
Lankford, William T., Norman L. Samways, Robert F. Craven, andHarold E. McGannon, eds. 1985. The Making, Shapingand Treating of Steel. Pittsburgh: United States Steel,Herbick & Held.
Leffler, William L. 1985. Petroleum Refining for the Non-Technical Person. Tulsa, OK: PennWell Books.
Maddala, G.S. 1988. Introduction to Econometrics. New York:Macmillan.
References
R-3
Mandel, John. 1984. “Fitting Straight Lines when Both Variablesare Subject to Error.” Journal of Quality Technology16(1):1-14.
May, W., R. Parris, C. Beck, J. Fassett, R. Greenberg, F. Guenther,G. Kramer, S. Wise, T. Gillis, J. Colbert, R. Gettings, andB. MacDonald. 1999. Definitions of Terms and ModesUsed at NIST for Value Assignment of Reference Materialsfor Chemical Measurements. NIST Special PublicationNo. 136. Washington, DC: U.S. Government PrintingOffice.
Modern Marvels. “Engineering Disasters.” Produced by TheHistory Channel, Inc. Aired February 22, 1999, at 10 p.m.
National Mining Association. “Coal Statistics, 1992-1997.”<http://www.nma.org/coalstats.html>. As obtained onNovember 18, 1998.
News and Observer. January 26, 1999. “New Gasoline to CutPollution.” Raleigh, NC: News and Observer.<http://search.news-observer.com>.
National Institute of Standards and Technology (NIST). 1997.Certificate of Analysis: Standard Reference Material 2683b.<http://www.ois.nist.gov/srmcatalog/certificates/srm-2683b.htm>. As obtained on April 5, 1999.
Octane Week. 1999. “API Updates Desulfurization Costs:Estimates 2.3-2.6 Cents per Gallon.” Octane Week 14(25).
Paulsen, P.J., and W. R. Kelly. 1984. “Determination of Sulfur asArsenic Monosulfide Ion by Isotope Dilution ThermalIonization Mass Spectometry.” Analytical Chemistry56:708-713.
Pennsylvania Department of Environmental Protection. 1999.“Glossary of Mining Terms.” <http://www.dep.state.pa.us/dep/deputate/minres/dms/website/training/glossary.html.>As obtained on February 17, 1999.
Preckel, Paul V; Edna T. Loehman, and Michael S. Kaylen. 1987.“The Value of Public Information for MicroeconomicProduction Decisions.” Western Agricultural EconomicsAssociation 12(2):193-197.
Economic Impact of Standard Reference Materials for Sulfur in Fossil Fuels
R-4
Resources for the Future (RFF). November 1996. An Assessment ofthe EPA’s SO2 Emission Allowance Tracking System.Discussion Paper 97-21. Washington, DC: Resources forthe Future
Sloan, Frank A., ed. 1995. Valuing Health Care: Costs, Benefitsand Effectiveness of Pharmaceuticals and Other MedicalTechnologies. New York, NY: Cambridge University Press.
Société Générale de Surveillance Holding S.A. 1988. 1997 AnnualReport. Geneva: Société Générale de Surveillance S.A.
Standard Laboratories (SL). 1998. “Contract Laboratory Services—Standard Labs—Coal Test.” <http://www.coaltest.com/CONTLABS.htm>. As obtained on December 2, 1998.
Tassey, Gregory. 1997. The Economics of R&D Policy. London:Quorum Books.
Taylor, John K. February 1993. Standard Reference Materials:Handbook for SRM Users. NIST Special Publication 260-100. Washington, DC: U.S Government Printing Office.
Taylor, John R. 1997. An Introduction to Error Analysis. 2nd Ed.Sausilito: University Science Books.
Tolley, George, Donald Kenkel, and Robert Fabian, eds. 1994.Valuing Health for Policy: An Economic Approach.Chicago, IL: University of Chicago.
U.S. Department of Energy, Energy Information Administration.1997. Coal Industry Annual, 1996. Washington, DC: U.S.Department of Energy.
U.S. Department of Energy, Energy Information Administration.1998a. Annual Energy Review, 1997. DOE/EIA-0384(97).Washington, DC: Department of Energy.
U.S. Department of Energy, Energy Information Administration.1998b. Cost and Quality of Fuels for Electric Utility Plants1997 Tables. Washington, DC: U.S. Department of Energy.
U.S. Department of Energy, Energy Information Administration.1998c. Petroleum Supply Annual. Volume 1. Washington,DC: U.S. Department of Energy.
U.S. Department of Energy, Energy Information Administration.1998d. Electric Power Annual. Volumes I & 2.Washington, DC: U.S. Department of Energy.
References
R-5
U.S. Department of Energy, Energy Information Administration.Petroleum Marketing Monthly. 1998e. Haverly/ChevronAssay Library. <http://www.haverly.com.chevfram.htm>.
U.S. Department of Energy, Energy Information Administration.1998f. Coal Industry Annual, 1997. Washington, DC: U.S.Department of Energy.
U.S. Department of Commerce, Bureau of the Census. December1994. 1992 Census of Service Industries. Geographic AreaSeries. SC92-A-52.
U.S. Environmental Protection Agency, Office of ComplianceSector Notebook Project. 1995. Profile of the PetroleumRefining Industry. Washington, DC: U.S. EnvironmentalProtection Agency.
U.S. Environmental Protection Agency. September 1997a. Profileof the Fossil Fuel Electric Power Generation Industry.EPA/310-R97-007. Washington, DC: U.S. EnvironmentalProtection Agency, Office of Compliance.
U.S. Environmental Protection Agency. December 1997b.National Air Pollution Emissions Trends, 1990-1996.Research Triangle Park, NC: U.S. Environmental ProtectionAgency, Office of Air Quality Planning and Standards.
U.S. Environmental Protection Agency. 1998a. Update ofIntegrated Iron and Steel Industry Responses to InformationCollection Request (ICR) Survey. Database prepared forEPA’s Office of Air Quality Planning and Standards.Research Triangle Park, NC.
U.S. Environmental Protection Agency. May 1998b. “EPA StaffPaper on Gasoline Sulfur Issues.” EPA420-R-98-005.Washington, DC: U.S. Environmental Protection Agency,Office of Mobile Sources.
U.S. Environmental Protection Agency. 1998c. Coke IndustryResponses to Information Collection Request (ICR) Survey.Database prepared for EPA’s Office of Air Quality Planningand Standards. Research Triangle Park, NC.
U.S. Environmental Protection Agency. April 1999. Draft RIA forControl of Air Pollution from New Motor Vehicles: Tier 2Motor Vehicle Emissions Standards and Gasoline SulfurControl Requirements.
Vaninetti, Jerry. November 21, 1998. Personal communicationwith Sheila Martin, Research Triangle Institute.

Economic Impact of Standard Reference Materials for Sulfur in Fossil Fuels
R-6
Zaino, Gabriel, and Noel Brousseau. 1983. “Ladle DesulfurizationImproves Properties of Steel.” Foundry Management andTechnology 111:22-27.
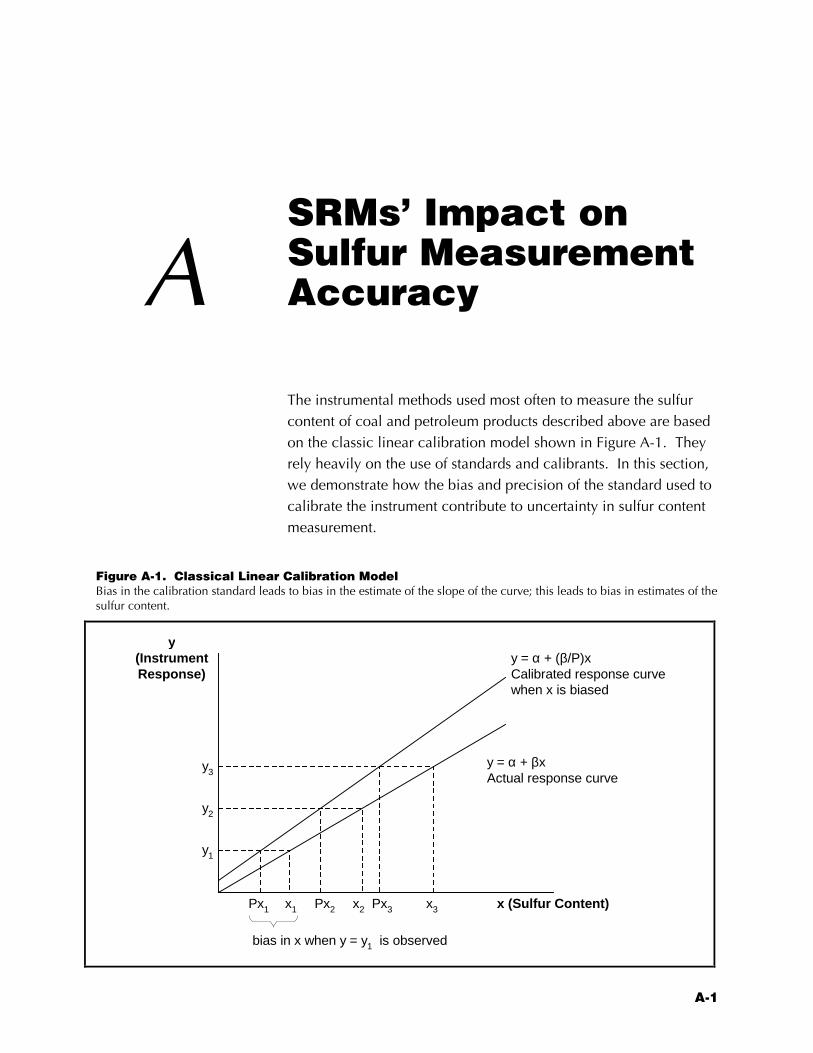
A-1
SRMs’ Impact onSulfur MeasurementA Accuracy
The instrumental methods used most often to measure the sulfurcontent of coal and petroleum products described above are basedon the classic linear calibration model shown in Figure A-1. Theyrely heavily on the use of standards and calibrants. In this section,we demonstrate how the bias and precision of the standard used tocalibrate the instrument contribute to uncertainty in sulfur contentmeasurement.
Figure A-1. Classical Linear Calibration ModelBias in the calibration standard leads to bias in the estimate of the slope of the curve; this leads to bias in estimates of thesulfur content.
y(InstrumentResponse)
x (Sulfur Content)
y1
x1Px1 Px2 Px3x2 x3
y = α + βxActual response curve
bias in x when y = y1 is observed
y3
y2
y = α + (β/P)xCalibrated response curvewhen x is biased
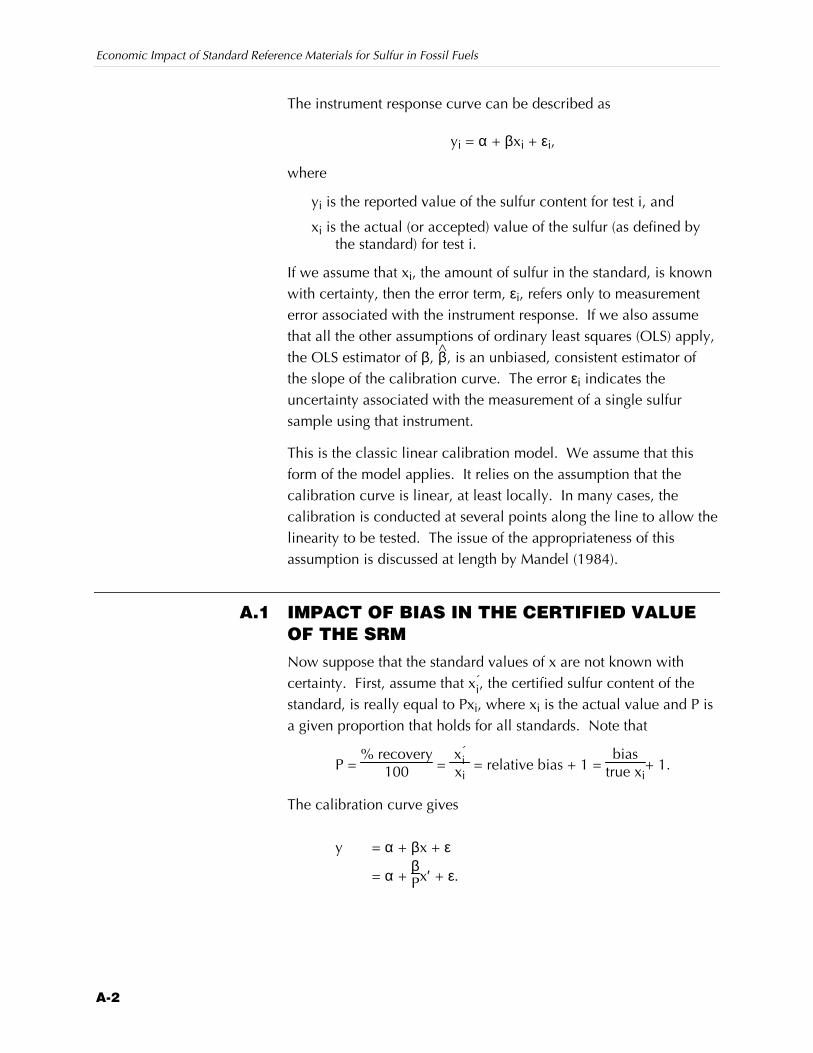
Economic Impact of Standard Reference Materials for Sulfur in Fossil Fuels
A-2
The instrument response curve can be described as
yi = α + βxi + εi,
where
yi is the reported value of the sulfur content for test i, and
xi is the actual (or accepted) value of the sulfur (as defined bythe standard) for test i.
If we assume that xi, the amount of sulfur in the standard, is knownwith certainty, then the error term, εi, refers only to measurementerror associated with the instrument response. If we also assumethat all the other assumptions of ordinary least squares (OLS) apply,the OLS estimator of β, β̂, is an unbiased, consistent estimator ofthe slope of the calibration curve. The error εi indicates theuncertainty associated with the measurement of a single sulfursample using that instrument.
This is the classic linear calibration model. We assume that thisform of the model applies. It relies on the assumption that thecalibration curve is linear, at least locally. In many cases, thecalibration is conducted at several points along the line to allow thelinearity to be tested. The issue of the appropriateness of thisassumption is discussed at length by Mandel (1984).
A.1 IMPACT OF BIAS IN THE CERTIFIED VALUEOF THE SRMNow suppose that the standard values of x are not known withcertainty. First, assume that xi
´, the certified sulfur content of thestandard, is really equal to Pxi, where xi is the actual value and P isa given proportion that holds for all standards. Note that
P = % recovery
100 = xi
´ xi
= relative bias + 1 = bias
true xi+ 1.
The calibration curve gives
y = α + βx + ε
= α + βPx′ + ε.
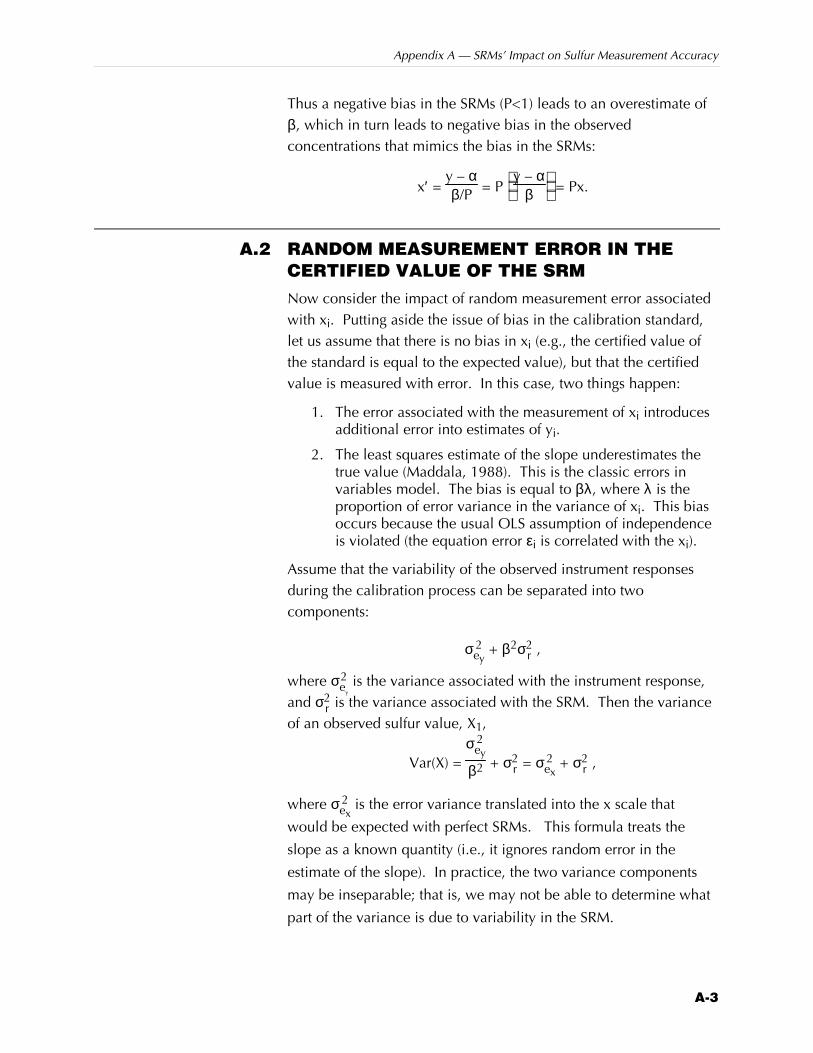
Appendix A — SRMs’ Impact on Sulfur Measurement Accuracy
A-3
Thus a negative bias in the SRMs (P<1) leads to an overestimate ofβ, which in turn leads to negative bias in the observedconcentrations that mimics the bias in the SRMs:
x′ = y – αβ/P = P
y – α
β = Px.
A.2 RANDOM MEASUREMENT ERROR IN THECERTIFIED VALUE OF THE SRMNow consider the impact of random measurement error associatedwith xi. Putting aside the issue of bias in the calibration standard,let us assume that there is no bias in xi (e.g., the certified value ofthe standard is equal to the expected value), but that the certifiedvalue is measured with error. In this case, two things happen:
1. The error associated with the measurement of xi introducesadditional error into estimates of yi.
2. The least squares estimate of the slope underestimates thetrue value (Maddala, 1988). This is the classic errors invariables model. The bias is equal to βλ, where λ is theproportion of error variance in the variance of xi. This biasoccurs because the usual OLS assumption of independenceis violated (the equation error εi is correlated with the xi).
Assume that the variability of the observed instrument responsesduring the calibration process can be separated into twocomponents:
σey2 + β
2σr2 ,
where σey
2 is the variance associated with the instrument response,and σr
2 is the variance associated with the SRM. Then the varianceof an observed sulfur value, X1,
Var(X) = σey
2
β2 + σr2 = σex
2 + σr2 ,
where σex2 is the error variance translated into the x scale that
would be expected with perfect SRMs. This formula treats the
slope as a known quantity (i.e., it ignores random error in the
estimate of the slope). In practice, the two variance components
may be inseparable; that is, we may not be able to determine what
part of the variance is due to variability in the SRM.
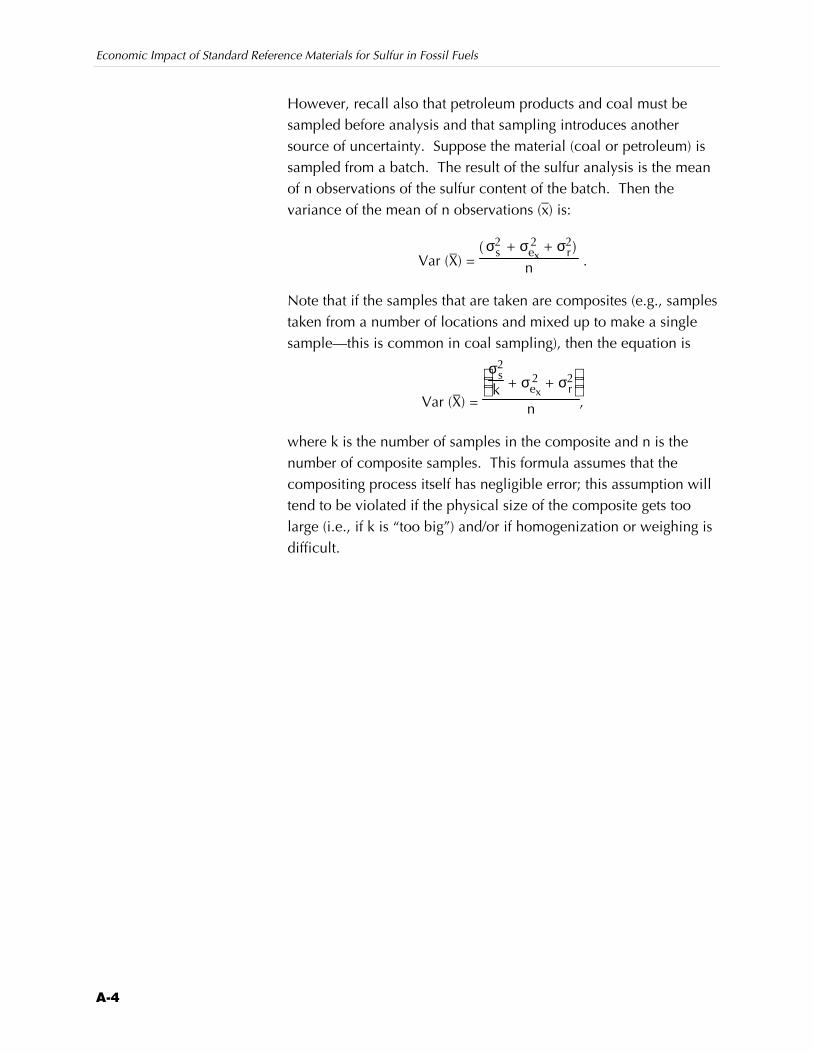
Economic Impact of Standard Reference Materials for Sulfur in Fossil Fuels
A-4
However, recall also that petroleum products and coal must besampled before analysis and that sampling introduces anothersource of uncertainty. Suppose the material (coal or petroleum) issampled from a batch. The result of the sulfur analysis is the meanof n observations of the sulfur content of the batch. Then thevariance of the mean of n observations (x–) is:
Var (X–) = ( )σs
2 + σex2 + σr
2
n .
Note that if the samples that are taken are composites (e.g., samplestaken from a number of locations and mixed up to make a singlesample—this is common in coal sampling), then the equation is
Var (X–) =
σs
2
k + σex2 + σr
2
n ,
where k is the number of samples in the composite and n is thenumber of composite samples. This formula assumes that thecompositing process itself has negligible error; this assumption willtend to be violated if the physical size of the composite gets toolarge (i.e., if k is “too big”) and/or if homogenization or weighing isdifficult.
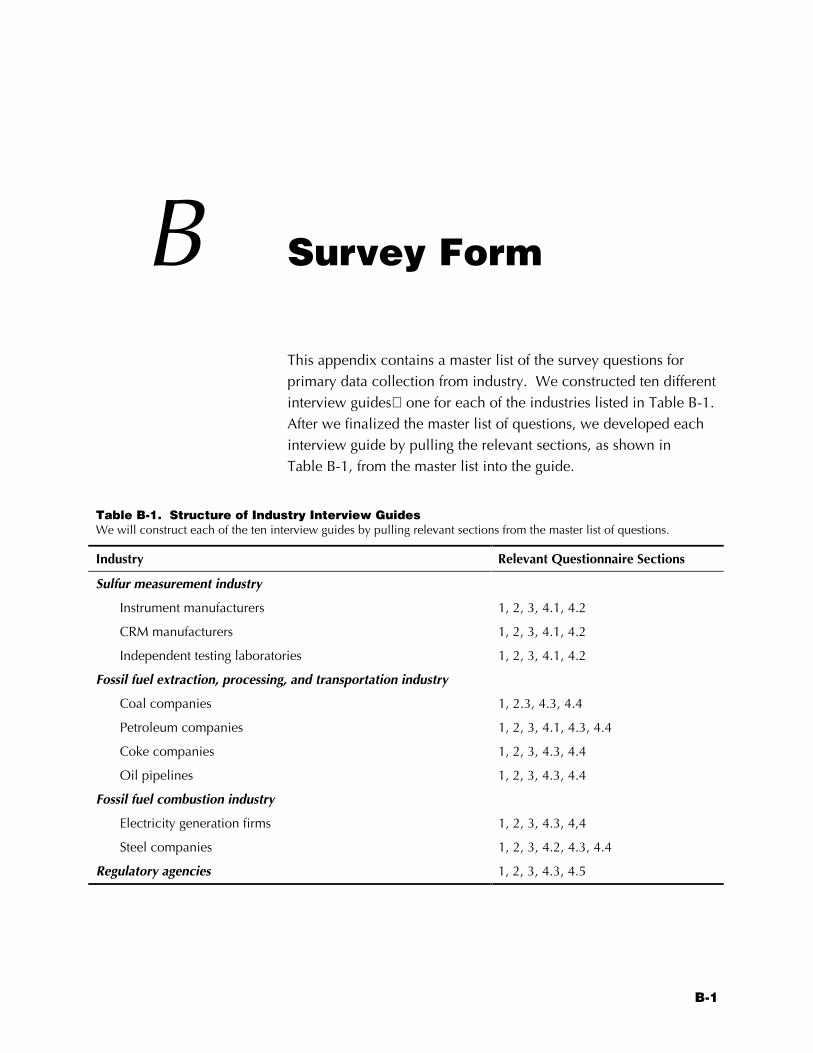
B-1
B Survey Form
This appendix contains a master list of the survey questions forprimary data collection from industry. We constructed ten differentinterview guides one for each of the industries listed in Table B-1.After we finalized the master list of questions, we developed eachinterview guide by pulling the relevant sections, as shown inTable B-1, from the master list into the guide.
Table B-1. Structure of Industry Interview GuidesWe will construct each of the ten interview guides by pulling relevant sections from the master list of questions.
Industry Relevant Questionnaire Sections
Sulfur measurement industry
Instrument manufacturers 1, 2, 3, 4.1, 4.2
CRM manufacturers 1, 2, 3, 4.1, 4.2
Independent testing laboratories 1, 2, 3, 4.1, 4.2
Fossil fuel extraction, processing, and transportation industry
Coal companies 1, 2.3, 4.3, 4.4
Petroleum companies 1, 2, 3, 4.1, 4.3, 4.4
Coke companies 1, 2, 3, 4.3, 4.4
Oil pipelines 1, 2, 3, 4.3, 4.4
Fossil fuel combustion industry
Electricity generation firms 1, 2, 3, 4.3, 4,4
Steel companies 1, 2, 3, 4.2, 4.3, 4.4
Regulatory agencies 1, 2, 3, 4.3, 4.5
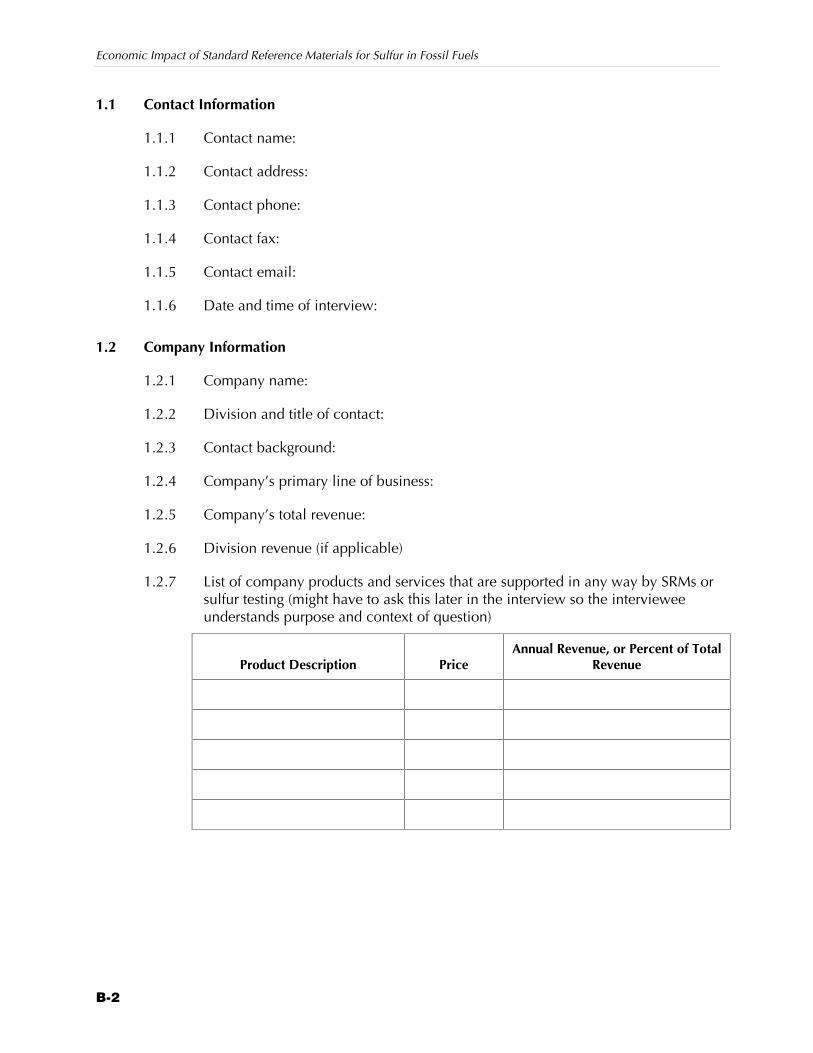
Economic Impact of Standard Reference Materials for Sulfur in Fossil Fuels
B-2
1.1 Contact Information
1.1.1 Contact name:
1.1.2 Contact address:
1.1.3 Contact phone:
1.1.4 Contact fax:
1.1.5 Contact email:
1.1.6 Date and time of interview:
1.2 Company Information
1.2.1 Company name:
1.2.2 Division and title of contact:
1.2.3 Contact background:
1.2.4 Company’s primary line of business:
1.2.5 Company’s total revenue:
1.2.6 Division revenue (if applicable)
1.2.7 List of company products and services that are supported in any way by SRMs orsulfur testing (might have to ask this later in the interview so the intervieweeunderstands purpose and context of question)
Product Description PriceAnnual Revenue, or Percent of Total
Revenue
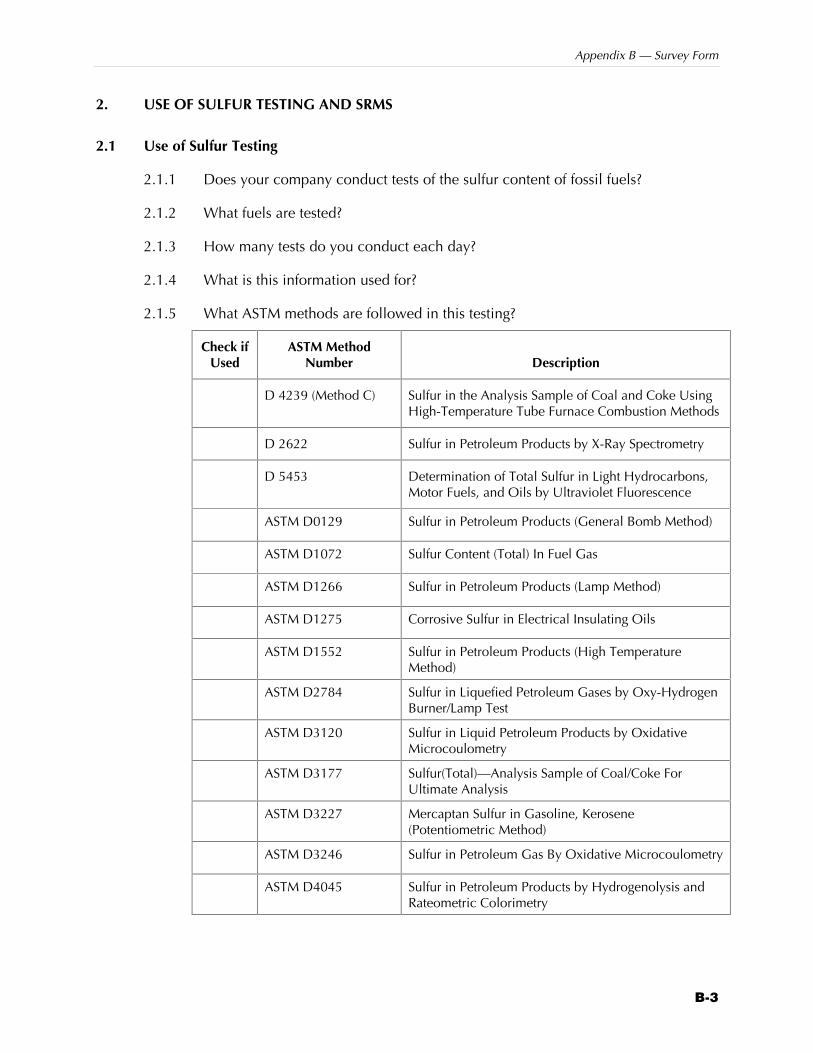
Appendix B — Survey Form
B-3
2. USE OF SULFUR TESTING AND SRMS
2.1 Use of Sulfur Testing
2.1.1 Does your company conduct tests of the sulfur content of fossil fuels?
2.1.2 What fuels are tested?
2.1.3 How many tests do you conduct each day?
2.1.4 What is this information used for?
2.1.5 What ASTM methods are followed in this testing?
Check ifUsed
ASTM MethodNumber Description
D 4239 (Method C) Sulfur in the Analysis Sample of Coal and Coke UsingHigh-Temperature Tube Furnace Combustion Methods
D 2622 Sulfur in Petroleum Products by X-Ray Spectrometry
D 5453 Determination of Total Sulfur in Light Hydrocarbons,Motor Fuels, and Oils by Ultraviolet Fluorescence
ASTM D0129 Sulfur in Petroleum Products (General Bomb Method)
ASTM D1072 Sulfur Content (Total) In Fuel Gas
ASTM D1266 Sulfur in Petroleum Products (Lamp Method)
ASTM D1275 Corrosive Sulfur in Electrical Insulating Oils
ASTM D1552 Sulfur in Petroleum Products (High TemperatureMethod)
ASTM D2784 Sulfur in Liquefied Petroleum Gases by Oxy-HydrogenBurner/Lamp Test
ASTM D3120 Sulfur in Liquid Petroleum Products by OxidativeMicrocoulometry
ASTM D3177 Sulfur(Total)—Analysis Sample of Coal/Coke ForUltimate Analysis
ASTM D3227 Mercaptan Sulfur in Gasoline, Kerosene(Potentiometric Method)
ASTM D3246 Sulfur in Petroleum Gas By Oxidative Microcoulometry
ASTM D4045 Sulfur in Petroleum Products by Hydrogenolysis andRateometric Colorimetry
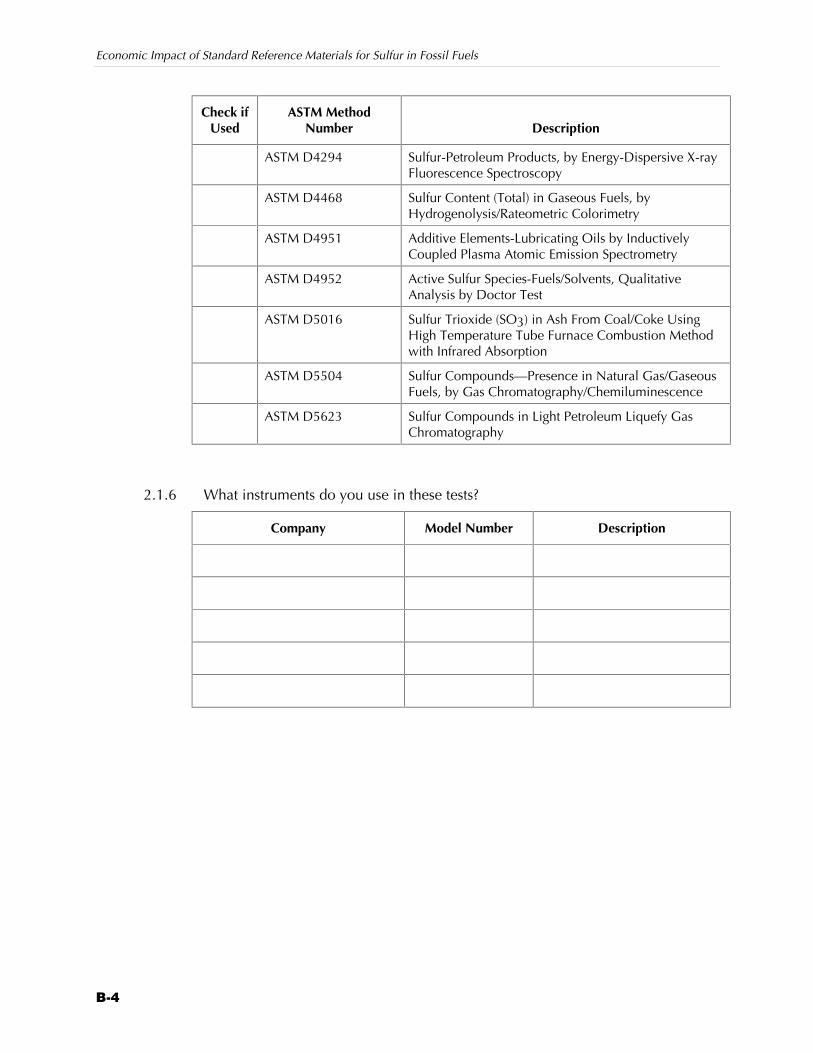
Economic Impact of Standard Reference Materials for Sulfur in Fossil Fuels
B-4
Check ifUsed
ASTM MethodNumber Description
ASTM D4294 Sulfur-Petroleum Products, by Energy-Dispersive X-rayFluorescence Spectroscopy
ASTM D4468 Sulfur Content (Total) in Gaseous Fuels, byHydrogenolysis/Rateometric Colorimetry
ASTM D4951 Additive Elements-Lubricating Oils by InductivelyCoupled Plasma Atomic Emission Spectrometry
ASTM D4952 Active Sulfur Species-Fuels/Solvents, QualitativeAnalysis by Doctor Test
ASTM D5016 Sulfur Trioxide (SO3) in Ash From Coal/Coke UsingHigh Temperature Tube Furnace Combustion Methodwith Infrared Absorption
ASTM D5504 Sulfur Compounds—Presence in Natural Gas/GaseousFuels, by Gas Chromatography/Chemiluminescence
ASTM D5623 Sulfur Compounds in Light Petroleum Liquefy GasChromatography
2.1.6 What instruments do you use in these tests?
Company Model Number Description
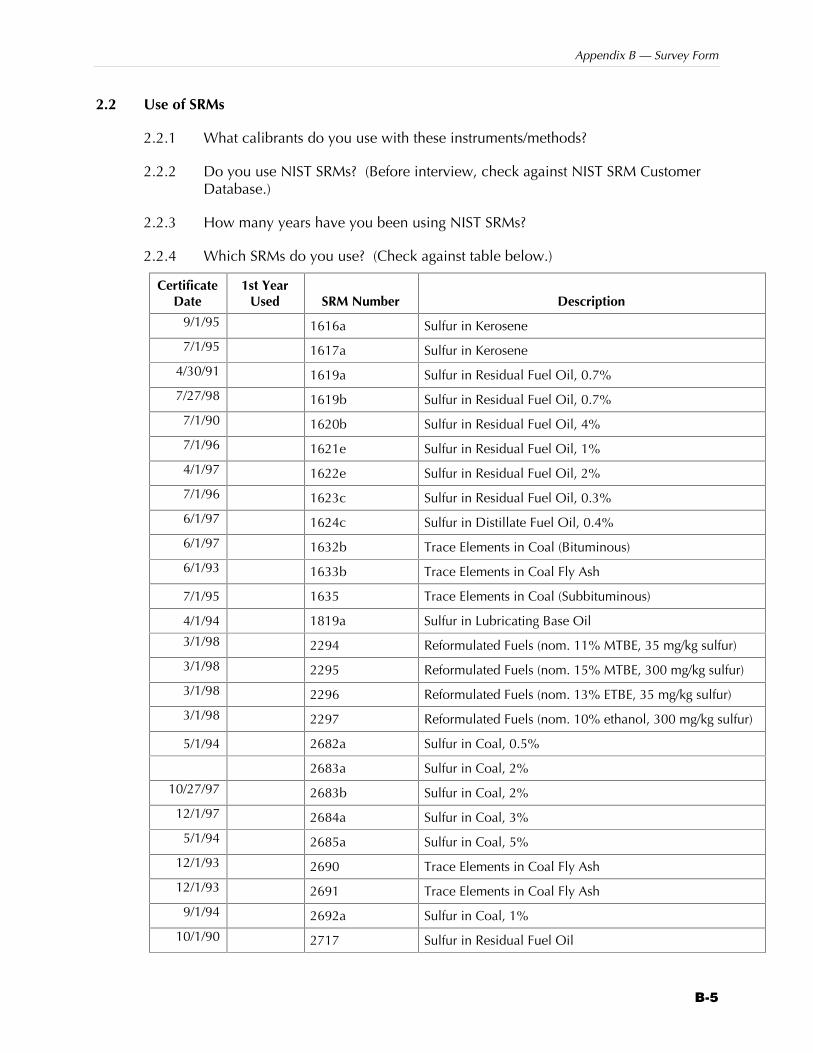
Appendix B — Survey Form
B-5
2.2 Use of SRMs
2.2.1 What calibrants do you use with these instruments/methods?
2.2.2 Do you use NIST SRMs? (Before interview, check against NIST SRM CustomerDatabase.)
2.2.3 How many years have you been using NIST SRMs?
2.2.4 Which SRMs do you use? (Check against table below.)
CertificateDate
1st YearUsed SRM Number Description
9/1/95 1616a Sulfur in Kerosene
7/1/95 1617a Sulfur in Kerosene
4/30/91 1619a Sulfur in Residual Fuel Oil, 0.7%
7/27/98 1619b Sulfur in Residual Fuel Oil, 0.7%
7/1/90 1620b Sulfur in Residual Fuel Oil, 4%
7/1/96 1621e Sulfur in Residual Fuel Oil, 1%
4/1/97 1622e Sulfur in Residual Fuel Oil, 2%
7/1/96 1623c Sulfur in Residual Fuel Oil, 0.3%
6/1/97 1624c Sulfur in Distillate Fuel Oil, 0.4%
6/1/97 1632b Trace Elements in Coal (Bituminous)
6/1/93 1633b Trace Elements in Coal Fly Ash
7/1/95 1635 Trace Elements in Coal (Subbituminous)
4/1/94 1819a Sulfur in Lubricating Base Oil
3/1/98 2294 Reformulated Fuels (nom. 11% MTBE, 35 mg/kg sulfur)
3/1/98 2295 Reformulated Fuels (nom. 15% MTBE, 300 mg/kg sulfur)
3/1/98 2296 Reformulated Fuels (nom. 13% ETBE, 35 mg/kg sulfur)
3/1/98 2297 Reformulated Fuels (nom. 10% ethanol, 300 mg/kg sulfur)
5/1/94 2682a Sulfur in Coal, 0.5%
2683a Sulfur in Coal, 2%
10/27/97 2683b Sulfur in Coal, 2%
12/1/97 2684a Sulfur in Coal, 3%
5/1/94 2685a Sulfur in Coal, 5%
12/1/93 2690 Trace Elements in Coal Fly Ash
12/1/93 2691 Trace Elements in Coal Fly Ash
9/1/94 2692a Sulfur in Coal, 1%
10/1/90 2717 Sulfur in Residual Fuel Oil
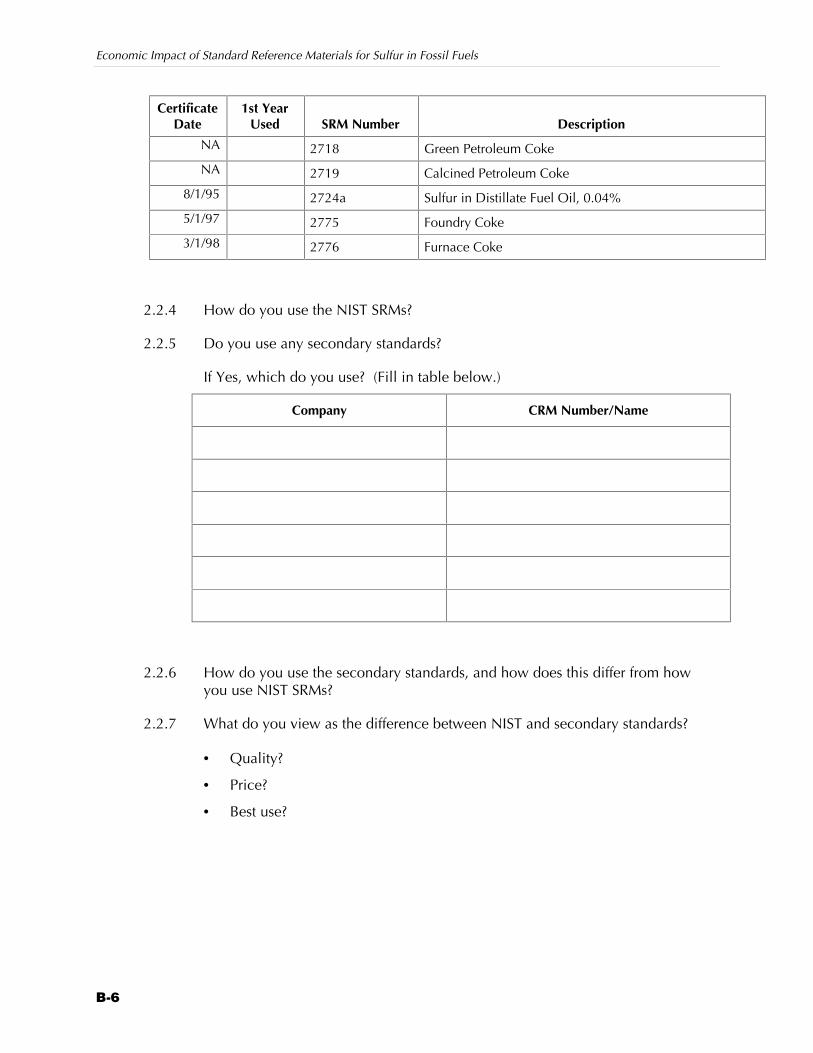
Economic Impact of Standard Reference Materials for Sulfur in Fossil Fuels
B-6
CertificateDate
1st YearUsed SRM Number Description
NA 2718 Green Petroleum Coke
NA 2719 Calcined Petroleum Coke
8/1/95 2724a Sulfur in Distillate Fuel Oil, 0.04%
5/1/97 2775 Foundry Coke
3/1/98 2776 Furnace Coke
2.2.4 How do you use the NIST SRMs?
2.2.5 Do you use any secondary standards?
If Yes, which do you use? (Fill in table below.)
Company CRM Number/Name
2.2.6 How do you use the secondary standards, and how does this differ from howyou use NIST SRMs?
2.2.7 What do you view as the difference between NIST and secondary standards?
• Quality?
• Price?
• Best use?
Appendix B — Survey Form
B-7
3 IMPACT OF SRMS
3.1 Suppose NIST SRMs were not available for the uses described above. Whatwould you use as a substitute?
3.2 Given that you would have to substitute a different material or process, do youthink the methods you use to measure sulfur in fossil fuels would change?
• By what percentage do you think the repeatability of ASTM methods wouldchange?
• Do you think the level of bias would change?
4 USE OF SULFUR TESTING INFORMATION
4.1 R&D
4.1.1 Does your company conduct R&D related to sulfur content of fuels or thedevelopment of sulfur measurement instruments and methods?
4.1.2 What is your company’s total R&D budget?
4.1.3 What percentage of your company’s total R&D budget is allocated to sulfurtesting or sulfur content issues?
4.1.4 How do NIST SRMs support this R&D?
4.1.5 In the absence of NIST SRMs, do you think your R&D costs in this area would behigher?
• By what percentage?
• Why?
4.2 Quality of Products and Services
4.2.1 Do you use NIST SRMs for quality control or for any other reason in theproduction of your products and services?
4.2.2 If NIST SRMs were not available, what changes would you make in theseprocesses?
4.2.3 How do you think this would affect the quality of your products?
4.2.4 Do you think your customers would value your products less if they were notproduced with the support of or traceability to NIST SRMs?
4.2.5 Given the current prices of your goods and services, by what percentage do youthink the prices your customers would be willing to pay for your goods andservices would fall?
Economic Impact of Standard Reference Materials for Sulfur in Fossil Fuels
B-8
4.3 Transactions Costs
4.3.1 What percentage of the transactions (sales or purchases) of fossil fuels are basedon contracts that specify sulfur content?
4.3.2 How are these contracts structured?
4.3.3 What happens if the contract specifications are not met?
• What happens if the sulfur content is too high?
• What if it is too low?
4.3.4 How often are shipments disputed due to sulfur content?
4.3.5 Are these disputes usually resolved?
4.3.6 How are they resolved?
4.3.7 How are SRMs used in the dispute settlement process?
4.3.8 What is your estimate of the cost of resolving a dispute?
• What are the most costly parts of the process?
4.3.9 How often are shipments totally rejected (i.e., no resolution of dispute)?
4.3.10 What could help to decrease the incidence of these disputes?
4.3.11 Do you think these disputes or rejections are ever caused by measurement error?
4.3.12 What percentage of disputes do you think could be avoided if the measurementprocess was more accurate?
4.4 Productivity
4.4.1 What operations at your facility are affected by sulfur content?
• Fuel blending
• Desulfurization
• Boiler operations
• Emissions control
• Coking
• Others?
4.4.2 How are they affected by sulfur content?
4.4.3 What are the technical specifications regarding sulfur content of fuels for theseprocesses?
Appendix B — Survey Form
B-9
4.4.4 Do you feel that the information you have about sulfur content is sufficient toensure that you meet the technical specifications for sulfur?
4.4.5 How often are the technical specifications not met?
4.4.6 What is the impact of going over technical limits?
• What are the technical impacts?
• What are the economic impacts?
4.4.7 What is the impact of going under technical limits?
• What are the technical impacts?
• What are the economic impacts?
4.4.8 What is your strategy for ensuring that you meet the technical limits?
4.4.9 Do you use a “buffer,” i.e., shoot for some lower level to ensure that, givenmeasurement error, you will not test over the limit?
4.5 Regulatory Penalties
4.5.1 How are sulfur content limits monitored?
4.5.2 What is the structure of enforcing these limits?
• Under what conditions are regulatory penalties imposed?
• What is the size of the regulatory penalties?
• How many companies are fined per year, and what is the annual amount oftotal fines?
4.5.3 What is the role of NIST SRMs in imposing regulatory penalties?
4.5.4 How would enforcement be affected if NIST SRMs were not available to supportthe measurement process?
C-1
Profiles ofC Affected Industries
This appendix provides the background required to understand theimportance of NIST SRMs to this supply chain. Section C.1provides brief profiles of the affected industries: the sulfurmeasurement industry, the fossil fuel extraction and processingindustry, and the fossil fuel combustion industry. Section C.2describes the importance of sulfur as a characteristic of fossil fuels,including the regulations affecting the industries that produce anduse fossil fuels in the U.S., and why these regulations increase theimportance of accurate information about the sulfur content offossil fuels. Section C.3 describes how NIST SRMs support theseindustries, including information about who buys NIST SRMs forsulfur in fossil fuels and how they are used.
C.1 INDUSTRY PROFILEMany industries depend on NIST SRMs to support the measurementof sulfur in fossil fuels. Figure C-1 provides a graphicalrepresentation of the relationships among these industries. Thesulfur measurement industry includes manufacturers of sulfurmeasurement instruments and CRMs and independent laboratoriesthat conduct sulfur analysis. These companies use NIST SRMs indeveloping their instruments, preparing their CRMs, and providingquality control in their sulfur measurement laboratories. Theysupply instruments, reference materials, and analytical services tothe fossil fuels industry.
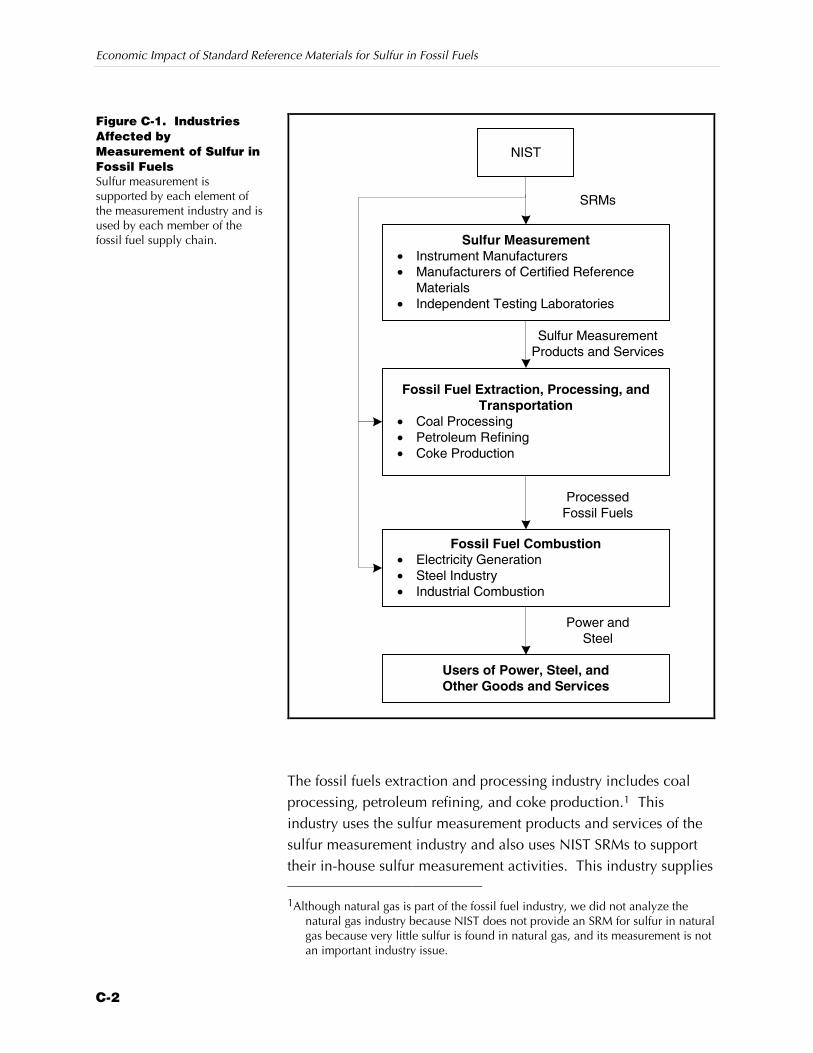
Economic Impact of Standard Reference Materials for Sulfur in Fossil Fuels
C-2
NIST
ProcessedFossil Fuels
Fossil Fuel Combustion• Electricity Generation• Steel Industry• Industrial Combustion
Users of Power, Steel, andOther Goods and Services
Power andSteel
SRMs
Sulfur MeasurementProducts and Services
Fossil Fuel Extraction, Processing, andTransportation
• Coal Processing• Petroleum Refining• Coke Production
Sulfur Measurement• Instrument Manufacturers• Manufacturers of Certified Reference
Materials• Independent Testing Laboratories
The fossil fuels extraction and processing industry includes coalprocessing, petroleum refining, and coke production.1 Thisindustry uses the sulfur measurement products and services of thesulfur measurement industry and also uses NIST SRMs to supporttheir in-house sulfur measurement activities. This industry supplies 1Although natural gas is part of the fossil fuel industry, we did not analyze the
natural gas industry because NIST does not provide an SRM for sulfur in naturalgas because very little sulfur is found in natural gas, and its measurement is notan important industry issue.
Figure C-1. IndustriesAffected byMeasurement of Sulfur inFossil FuelsSulfur measurement issupported by each element ofthe measurement industry and isused by each member of thefossil fuel supply chain.
Appendix C — Profiles of Affected Industries
C-3
processed fossil fuels to the industries that engage in fossil fuelscombustion.
Although many industries engage in the combustion of fossil fuels,we concentrated on three sectors—sulfur measurment industry,petroleum refining, and coal processing—because they are primaryusers of fossil fuels. These industries use NIST SRMs for their in-house sulfur measurement activities. Industrial combustion alsoaccounts for a large percentage of the fossil fuels consumed in theU.S. However, because of the difficulty of characterizing thisdiverse set of industries, we focus primarily on the electricityindustry and the steel industry in this study.2
The final link in the supply chain is the users of power, steel, andother goods and services that are produced with fossil fuels. Thislink includes essentially the entire U.S. economy. Thus, we limitedour analysis by focusing on the upstream components of the supplychain.
Environmental regulatory agencies, including EPA and stateagencies, affect the operations of the second and third tier ofindustries. They develop, monitor, and enforce sulfur contentregulations for the petroleum industry and develop, monitor, andenforce sulfur compound emissions limits for industries engaging infossil fuel combustion. We discuss the role of the regulatorycommunity and their use of NIST SRMs in Section C.2.
C.1.1 Sulfur Measurement Industry
The industry that supports the measurement of sulfur in fossil fuelsincludes the manufacturers of instruments, suppliers of CRMs, andindependent laboratories that conduct sulfur analysis.
Instrument Manufacturers
Determinators, spectrometers, elemental analyzers, andchromatographers are measurement equipment used to determinethe elemental composition of organic and inorganic samples. Fueland chemical manufacturers for whom knowledge of a sample’ssulfur content is important use these devices. For example, the 2Industrial combustion refers to the use of industrial, commercial, and institutional
(ICI) boilers whose primary use is for process heating, electrical or mechanicalpower generation, and/or space heating. Industrial boilers are used in all majorindustrial sectors.
Economic Impact of Standard Reference Materials for Sulfur in Fossil Fuels
C-4
petroleum industry uses sulfur analyzers to determine the sulfurcontent of the fuels they produce.
Manufacturers and consumers of these measurement instrumentsuse NIST’s sulfur SRMs to test and calibrate their equipment. Theseinstruments must be properly calibrated to provide qualitylaboratory results. Sulfur SRMs allow technicians to test aninstrument’s accuracy and inform them of any need foradjustments. Equipment technicians may use NIST’s sulfur SRMsdirectly, or they may use NIST-traceable CRMs from a secondarymanufacturer to calibrate laboratory equipment.
Although many companies manufacture laboratory equipment,relatively few manufacture the type of equipment used to determinethe sulfur content of coal and petroleum products. Table C-1 listscompanies that produce these instruments at manufacturingfacilities in the U.S. Together, these companies generate over$1 billion in revenue, although a significant percentage of thisrevenue is from equipment other than sulfur analysis equipment.Smaller firms generally produce a single product or several modelsof a single product, such as a line of analyzers. Many larger firmsalso manufacture other laboratory equipment, such as analyzers fornitrogen or other elements.
Manufacturers of Certified Reference Materials
A CRM is defined by the International Standards Organization (ISO)as “a reference material one or more of whose property values arecertified by a technically valid procedure, accompanied by ortraceable to a certificate or other documentation which is issued bya certifying body” (American National Standards Institute [ANSI],1981). CRMs are used in the same way as NIST SRMsforequipment calibration, development of other standards, and qualitycontrol for analyzing sulfur in fossil fuels. CRMs are often used inconjunction with NIST SRMs. In many laboratories, CRMs are usedon a daily basis while NIST SRMs are used only occasionally.
Table C-2 lists the companies that market CRMs for sulfur in fossilfuels in the U.S. Each company’s role in the production of theirCRMs varies. Some companies produce and certify CRMs at theirown facilities and laboratories, whereas other companies producethe standards but hire an outside laboratory to certify the sulfur
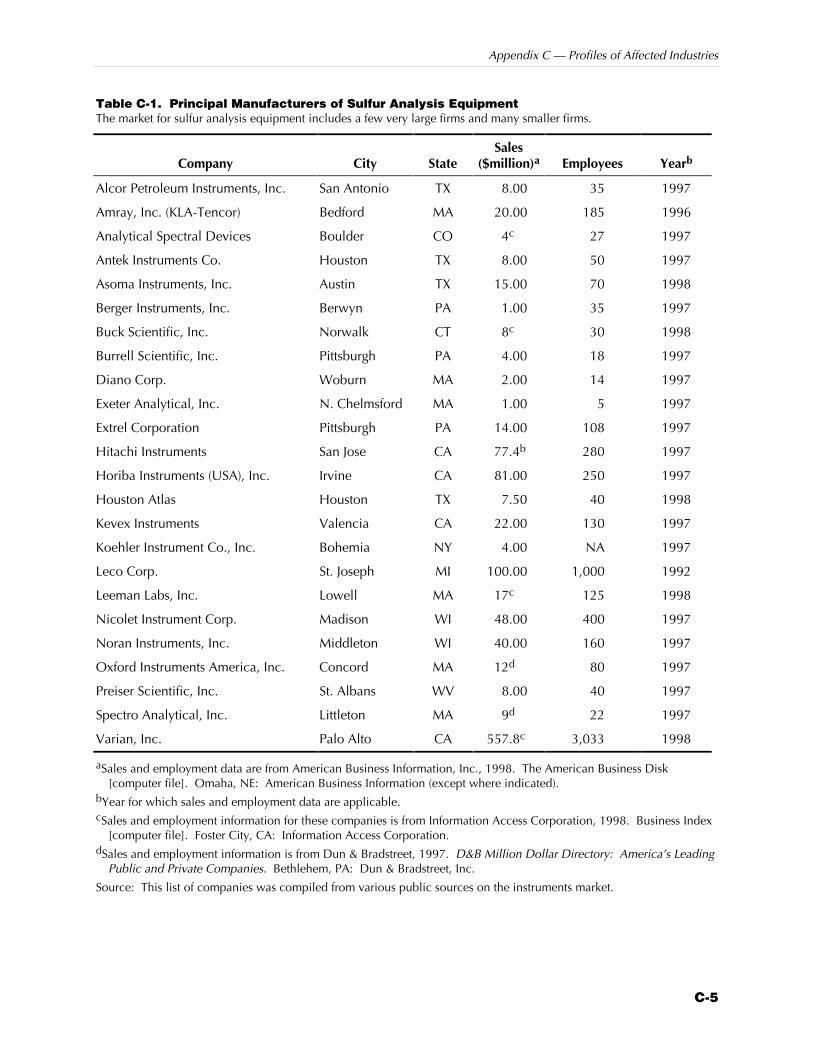
Appendix C — Profiles of Affected Industries
C-5
Table C-1. Principal Manufacturers of Sulfur Analysis EquipmentThe market for sulfur analysis equipment includes a few very large firms and many smaller firms.
Company City StateSales
($million)a Employees Yearb
Alcor Petroleum Instruments, Inc. San Antonio TX 8.00 35 1997
Amray, Inc. (KLA-Tencor) Bedford MA 20.00 185 1996
Analytical Spectral Devices Boulder CO 4c 27 1997
Antek Instruments Co. Houston TX 8.00 50 1997
Asoma Instruments, Inc. Austin TX 15.00 70 1998
Berger Instruments, Inc. Berwyn PA 1.00 35 1997
Buck Scientific, Inc. Norwalk CT 8c 30 1998
Burrell Scientific, Inc. Pittsburgh PA 4.00 18 1997
Diano Corp. Woburn MA 2.00 14 1997
Exeter Analytical, Inc. N. Chelmsford MA 1.00 5 1997
Extrel Corporation Pittsburgh PA 14.00 108 1997
Hitachi Instruments San Jose CA 77.4b 280 1997
Horiba Instruments (USA), Inc. Irvine CA 81.00 250 1997
Houston Atlas Houston TX 7.50 40 1998
Kevex Instruments Valencia CA 22.00 130 1997
Koehler Instrument Co., Inc. Bohemia NY 4.00 NA 1997
Leco Corp. St. Joseph MI 100.00 1,000 1992
Leeman Labs, Inc. Lowell MA 17c 125 1998
Nicolet Instrument Corp. Madison WI 48.00 400 1997
Noran Instruments, Inc. Middleton WI 40.00 160 1997
Oxford Instruments America, Inc. Concord MA 12d 80 1997
Preiser Scientific, Inc. St. Albans WV 8.00 40 1997
Spectro Analytical, Inc. Littleton MA 9d 22 1997
Varian, Inc. Palo Alto CA 557.8c 3,033 1998
aSales and employment data are from American Business Information, Inc., 1998. The American Business Disk[computer file]. Omaha, NE: American Business Information (except where indicated).
bYear for which sales and employment data are applicable.cSales and employment information for these companies is from Information Access Corporation, 1998. Business Index
[computer file]. Foster City, CA: Information Access Corporation.dSales and employment information is from Dun & Bradstreet, 1997. D&B Million Dollar Directory: America’s Leading
Public and Private Companies. Bethlehem, PA: Dun & Bradstreet, Inc.
Source: This list of companies was compiled from various public sources on the instruments market.
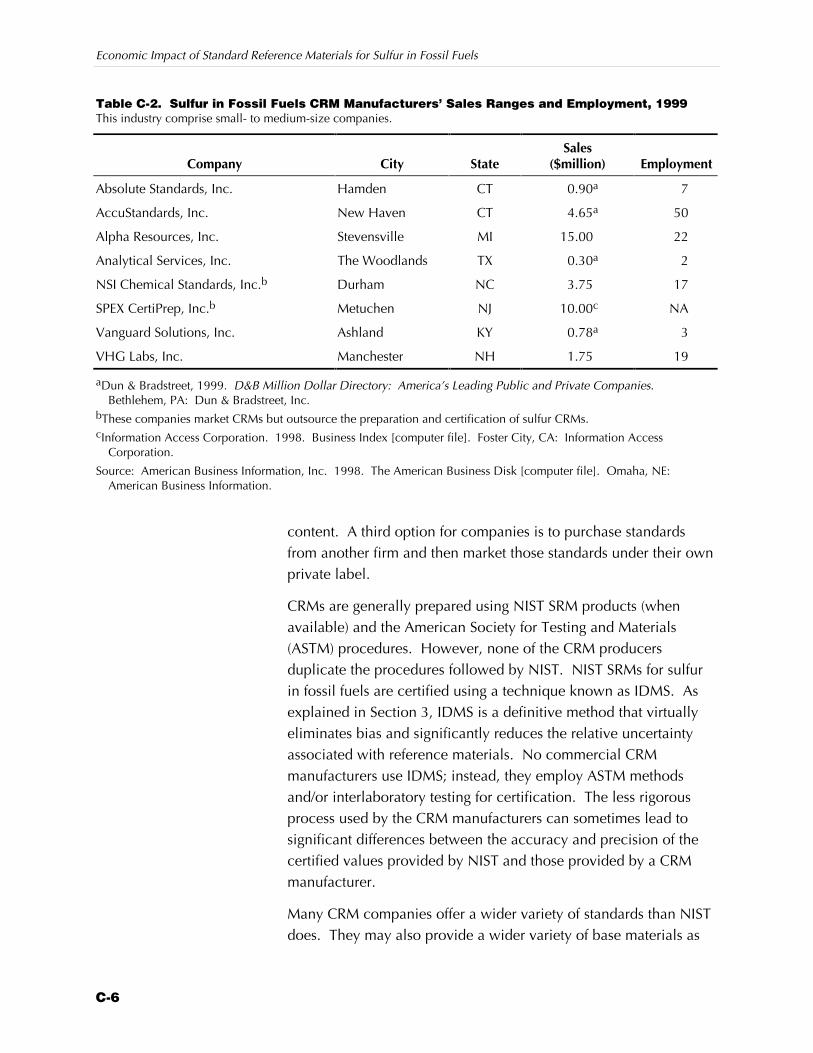
Economic Impact of Standard Reference Materials for Sulfur in Fossil Fuels
C-6
Table C-2. Sulfur in Fossil Fuels CRM Manufacturers’ Sales Ranges and Employment, 1999This industry comprise small- to medium-size companies.
Company City StateSales
($million) Employment
Absolute Standards, Inc. Hamden CT 0.90a 7
AccuStandards, Inc. New Haven CT 4.65a 50
Alpha Resources, Inc. Stevensville MI 15.00 22
Analytical Services, Inc. The Woodlands TX 0.30a 2
NSI Chemical Standards, Inc.b Durham NC 3.75 17
SPEX CertiPrep, Inc.b Metuchen NJ 10.00c NA
Vanguard Solutions, Inc. Ashland KY 0.78a 3
VHG Labs, Inc. Manchester NH 1.75 19
aDun & Bradstreet, 1999. D&B Million Dollar Directory: America’s Leading Public and Private Companies.Bethlehem, PA: Dun & Bradstreet, Inc.
bThese companies market CRMs but outsource the preparation and certification of sulfur CRMs.cInformation Access Corporation. 1998. Business Index [computer file]. Foster City, CA: Information Access
Corporation.
Source: American Business Information, Inc. 1998. The American Business Disk [computer file]. Omaha, NE:American Business Information.
content. A third option for companies is to purchase standardsfrom another firm and then market those standards under their ownprivate label.
CRMs are generally prepared using NIST SRM products (whenavailable) and the American Society for Testing and Materials(ASTM) procedures. However, none of the CRM producersduplicate the procedures followed by NIST. NIST SRMs for sulfurin fossil fuels are certified using a technique known as IDMS. Asexplained in Section 3, IDMS is a definitive method that virtuallyeliminates bias and significantly reduces the relative uncertaintyassociated with reference materials. No commercial CRMmanufacturers use IDMS; instead, they employ ASTM methodsand/or interlaboratory testing for certification. The less rigorousprocess used by the CRM manufacturers can sometimes lead tosignificant differences between the accuracy and precision of thecertified values provided by NIST and those provided by a CRMmanufacturer.
Many CRM companies offer a wider variety of standards than NISTdoes. They may also provide a wider variety of base materials as
Appendix C — Profiles of Affected Industries
C-7
well as a larger selection of concentrations. Those CRMs that dohave a NIST SRM counterpart usually cost less than the comparableNIST SRM. The price difference probably reflects differences in thecost of instruments and procedures used to certify the referencematerials and economies of scale associated with CRMs’ largerproduction volume.
NIST SRMs are an important input in the CRM production process.CRM manufacturers use NIST SRMs to verify product quality and tocertify that their products are NIST-traceable. It is possible thatCRMs would be more expensive to produce and would not be ofthe same quality if NIST SRMs were not available. Many CRMmanufacturers use the fact that their products are NIST-traceable asa key selling point.
Eight small- to medium-sized companies market CRMs for sulfur infossil fuels (see Table C-2). The smallest companies have annualrevenues as low as $300,000; the largest have annual revenues ashigh as $15 million. As a group, these companies had combinedannual revenues of about $37 million in 1997. Only twocompanies employ more than 20 people: Alpha Resources andAccuStandards.
Independent Sulfur Testing Laboratories
Independent sulfur testing laboratories fall within SIC 8734, testinglaboratories. In 1992, the U.S. had over 4,500 commercial testinglaboratories generating almost $5 billion in revenue and $2 billionin payroll each year (U.S. DOC, 1994).3 A small subset of theselaboratories conduct sulfur analysis of fossil fuels. Theselaboratories conduct inspection, sampling, and analytical servicesfor fossil fuel producers and consumers.
Independent laboratories are an important link in the supply chainaffected by SRMs. Although many mines, coking plants, coalpreparation plants, utilities, and refineries have their ownlaboratories for these analyses, independent laboratories arebecoming more important, particularly for contractual matters.Third-party independent laboratory results are routinely used tosatisfy contractual requirements for buyers and sellers in the coal
3These figures include taxable firms only. Noncommercial research organizations
are not included.
Independent laboratoriesare an important link in thesupply chain because theyprovide independenttesting results to satisfycontractual requirementsfor fossil fuel transactions.
Economic Impact of Standard Reference Materials for Sulfur in Fossil Fuels
C-8
industry, and this arrangement is increasing in the petroleumindustry as well. To cut costs some firms also hire independentlaboratories rather than operate their own.
Independent testing laboratories offer coal and petroleum samplingand testing services. They also offer an array of other services:
Z the running of contract laboratories;
Z coal preparation plant services: consulting on preparationplant development, operation, equipment, washability, andbest practices;
Z power plant services: consulting on fuel combustion,performance testing, fuel selection, materials handling,training, and fuel switching;
Z coal and mineral round robin services: ensuring qualitylaboratory results and procedures;
Z stockpile inventory services: determining the quantity andquality of coal and coke in storage; and
Z other environmental services.
Two firms dominate the market for coal testing: CommercialTesting and Engineering Company (CT&E), headquartered inLombard, IL, and Standard Laboratories (SL) of South Charleston,WV. CT&E is a wholly owned subsidiary of SGS North America,Inc., the North American division of the world’s largest inspectionand testing company, Société Générale de Surveillance (SGS). Asshown in Table C-3, CT&E had revenues of $57.0 million in 1997and employed 600 professionals at more than 50 locations in thecontiguous U.S. SL’s revenues were $37.0 million in 1996. SLemploys approximately 500 people at more than 50 locations in theU.S. and abroad. Both companies together control over 90 percentof the contractual coal testing market (Vaninetti, 1998).
Most of the laboratories owned by SL and CT&E are located eitherin coal-producing states or at main ports for imported and exportcoal (see Figure C-2). Laboratories are primarily concentrated inkey coal areas, mainly West Virginia, Kentucky, Colorado, andWyoming. Coastal laboratories analyze samples for the coalimport-export market. For example, CT&E’s San Pedro, CA, facilityserves the ports of Long Beach, Los Angeles, and San Francisco.The Norfolk, VA, facility serves the ports of Norfolk Southern Coal,
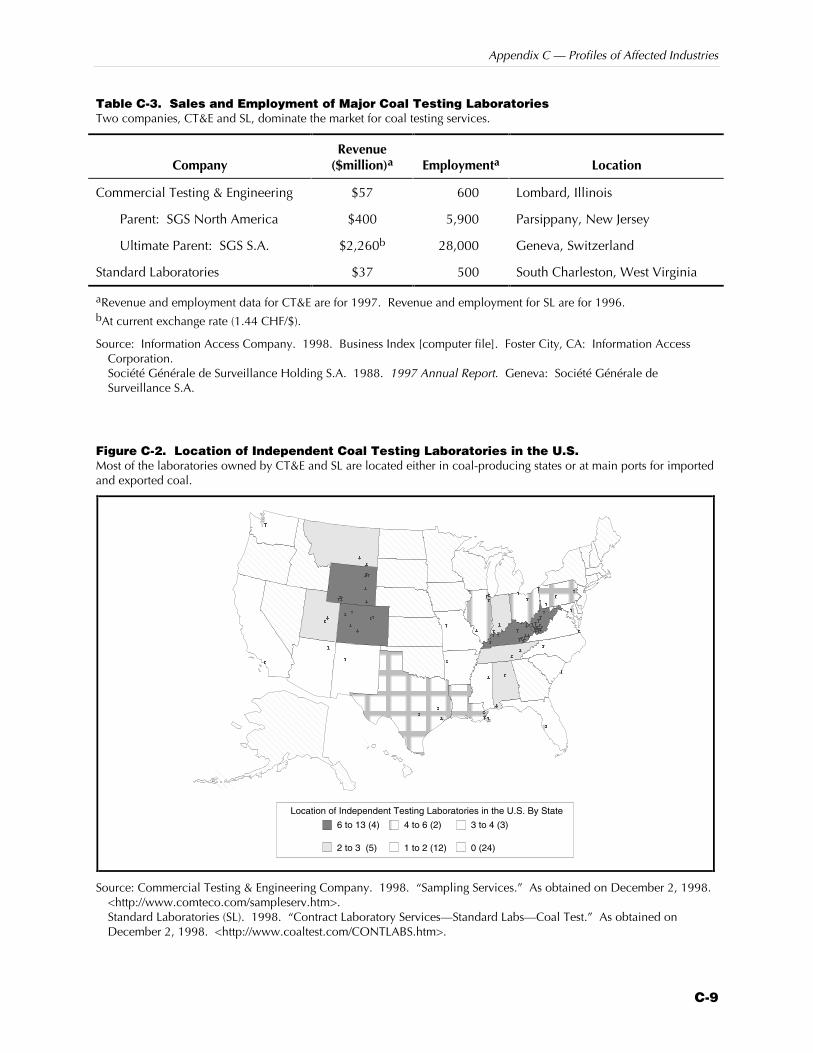
Appendix C — Profiles of Affected Industries
C-9
Table C-3. Sales and Employment of Major Coal Testing LaboratoriesTwo companies, CT&E and SL, dominate the market for coal testing services.
CompanyRevenue
($million)a Employmenta Location
Commercial Testing & Engineering $57 600 Lombard, Illinois
Parent: SGS North America $400 5,900 Parsippany, New Jersey
Ultimate Parent: SGS S.A. $2,260b 28,000 Geneva, Switzerland
Standard Laboratories $37 500 South Charleston, West Virginia
aRevenue and employment data for CT&E are for 1997. Revenue and employment for SL are for 1996.bAt current exchange rate (1.44 CHF/$).
Source: Information Access Company. 1998. Business Index [computer file]. Foster City, CA: Information AccessCorporation.Société Générale de Surveillance Holding S.A. 1988. 1997 Annual Report. Geneva: Société Générale deSurveillance S.A.
Figure C-2. Location of Independent Coal Testing Laboratories in the U.S.Most of the laboratories owned by CT&E and SL are located either in coal-producing states or at main ports for importedand exported coal.
(
(
(
((
((
(
(
(
((
(((((
(((
(
(
(
((
((
(
((
((
(
(
(
(
(
(
(
((
((
(
(
((
(
(
(
(
(
(
(
((
(
((
(
(
((
(
(
(
((
(
(
((
(
(
(
(
(
Location of Independent Testing Laboratories in the U.S. By State
6 to 13 (4) 4 to 6 (2) 3 to 4 (3)
2 to 3 (5) 1 to 2 (12) 0 (24)
Source: Commercial Testing & Engineering Company. 1998. “Sampling Services.” As obtained on December 2, 1998.<http://www.comteco.com/sampleserv.htm>.Standard Laboratories (SL). 1998. “Contract Laboratory Services—Standard Labs—Coal Test.” As obtained onDecember 2, 1998. <http://www.coaltest.com/CONTLABS.htm>.
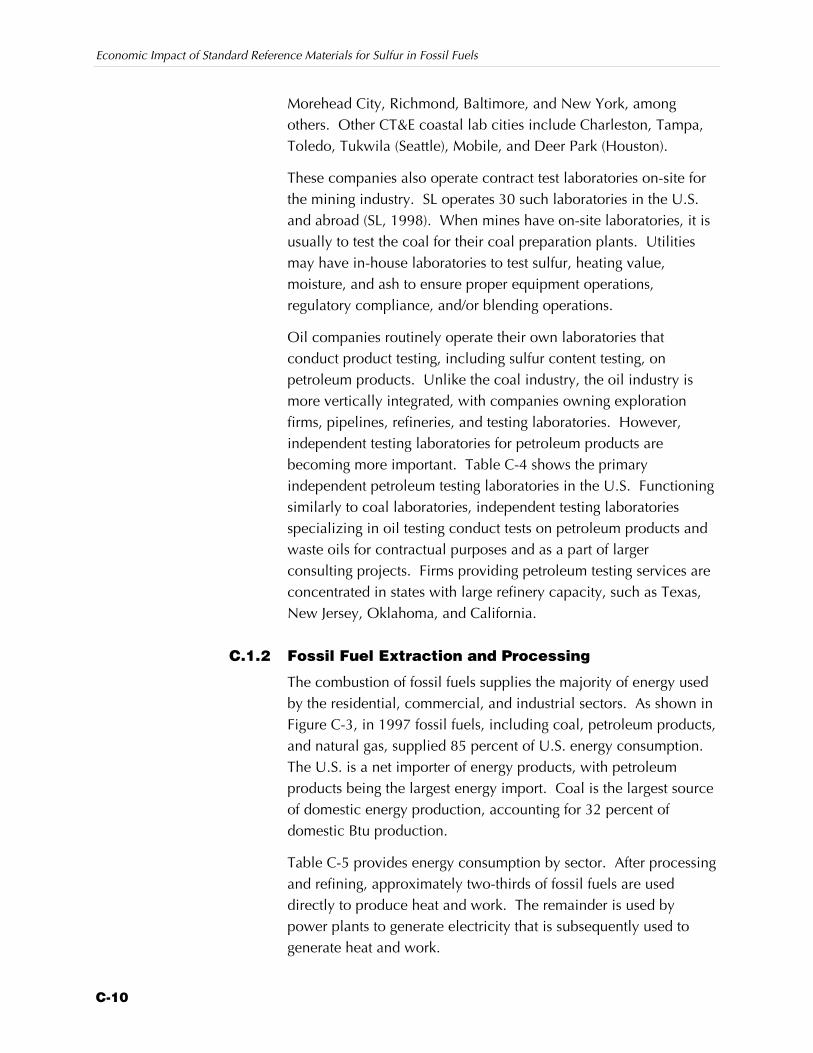
Economic Impact of Standard Reference Materials for Sulfur in Fossil Fuels
C-10
Morehead City, Richmond, Baltimore, and New York, amongothers. Other CT&E coastal lab cities include Charleston, Tampa,Toledo, Tukwila (Seattle), Mobile, and Deer Park (Houston).
These companies also operate contract test laboratories on-site forthe mining industry. SL operates 30 such laboratories in the U.S.and abroad (SL, 1998). When mines have on-site laboratories, it isusually to test the coal for their coal preparation plants. Utilitiesmay have in-house laboratories to test sulfur, heating value,moisture, and ash to ensure proper equipment operations,regulatory compliance, and/or blending operations.
Oil companies routinely operate their own laboratories thatconduct product testing, including sulfur content testing, onpetroleum products. Unlike the coal industry, the oil industry ismore vertically integrated, with companies owning explorationfirms, pipelines, refineries, and testing laboratories. However,independent testing laboratories for petroleum products arebecoming more important. Table C-4 shows the primaryindependent petroleum testing laboratories in the U.S. Functioningsimilarly to coal laboratories, independent testing laboratoriesspecializing in oil testing conduct tests on petroleum products andwaste oils for contractual purposes and as a part of largerconsulting projects. Firms providing petroleum testing services areconcentrated in states with large refinery capacity, such as Texas,New Jersey, Oklahoma, and California.
C.1.2 Fossil Fuel Extraction and Processing
The combustion of fossil fuels supplies the majority of energy usedby the residential, commercial, and industrial sectors. As shown inFigure C-3, in 1997 fossil fuels, including coal, petroleum products,and natural gas, supplied 85 percent of U.S. energy consumption.The U.S. is a net importer of energy products, with petroleumproducts being the largest energy import. Coal is the largest sourceof domestic energy production, accounting for 32 percent ofdomestic Btu production.
Table C-5 provides energy consumption by sector. After processingand refining, approximately two-thirds of fossil fuels are useddirectly to produce heat and work. The remainder is used bypower plants to generate electricity that is subsequently used togenerate heat and work.
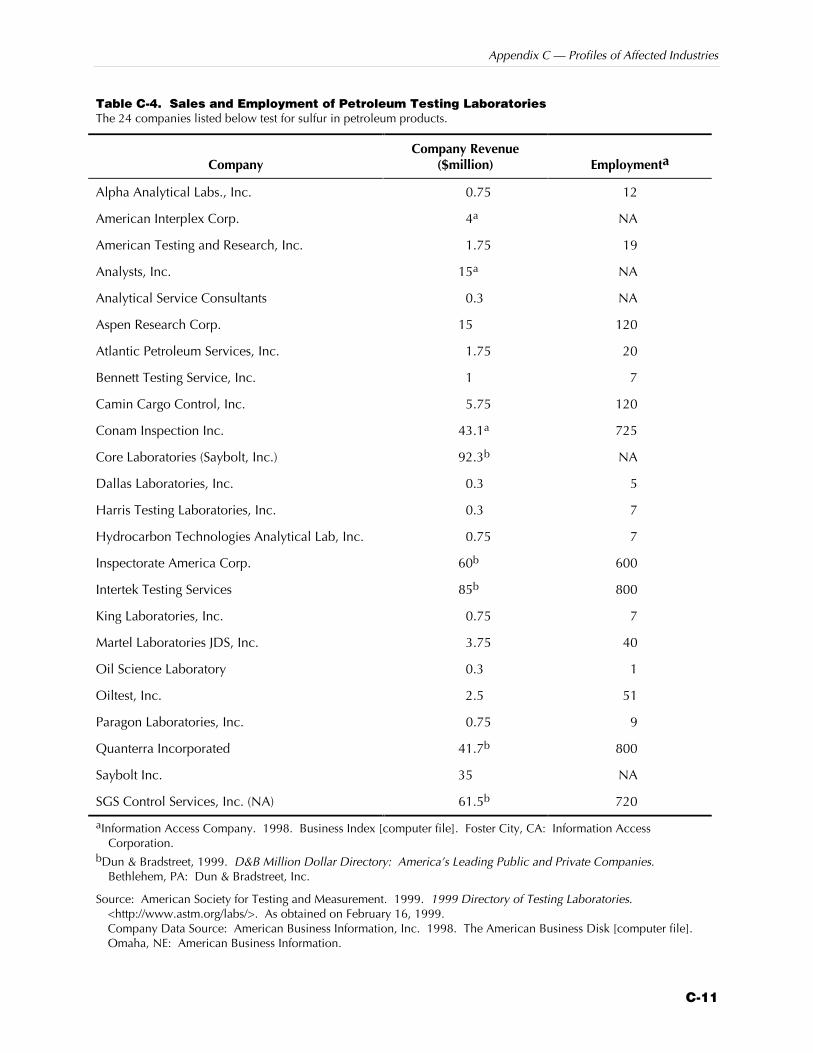
Appendix C — Profiles of Affected Industries
C-11
Table C-4. Sales and Employment of Petroleum Testing LaboratoriesThe 24 companies listed below test for sulfur in petroleum products.
CompanyCompany Revenue
($million) Employmenta
Alpha Analytical Labs., Inc. 0.75 12
American Interplex Corp. 4a NA
American Testing and Research, Inc. 1.75 19
Analysts, Inc. 15a NA
Analytical Service Consultants 0.3 NA
Aspen Research Corp. 15 120
Atlantic Petroleum Services, Inc. 1.75 20
Bennett Testing Service, Inc. 1 7
Camin Cargo Control, Inc. 5.75 120
Conam Inspection Inc. 43.1a 725
Core Laboratories (Saybolt, Inc.) 92.3b NA
Dallas Laboratories, Inc. 0.3 5
Harris Testing Laboratories, Inc. 0.3 7
Hydrocarbon Technologies Analytical Lab, Inc. 0.75 7
Inspectorate America Corp. 60b 600
Intertek Testing Services 85b 800
King Laboratories, Inc. 0.75 7
Martel Laboratories JDS, Inc. 3.75 40
Oil Science Laboratory 0.3 1
Oiltest, Inc. 2.5 51
Paragon Laboratories, Inc. 0.75 9
Quanterra Incorporated 41.7b 800
Saybolt Inc. 35 NA
SGS Control Services, Inc. (NA) 61.5b 720
aInformation Access Company. 1998. Business Index [computer file]. Foster City, CA: Information AccessCorporation.
bDun & Bradstreet, 1999. D&B Million Dollar Directory: America’s Leading Public and Private Companies.Bethlehem, PA: Dun & Bradstreet, Inc.
Source: American Society for Testing and Measurement. 1999. 1999 Directory of Testing Laboratories.<http://www.astm.org/labs/>. As obtained on February 16, 1999.Company Data Source: American Business Information, Inc. 1998. The American Business Disk [computer file].Omaha, NE: American Business Information.
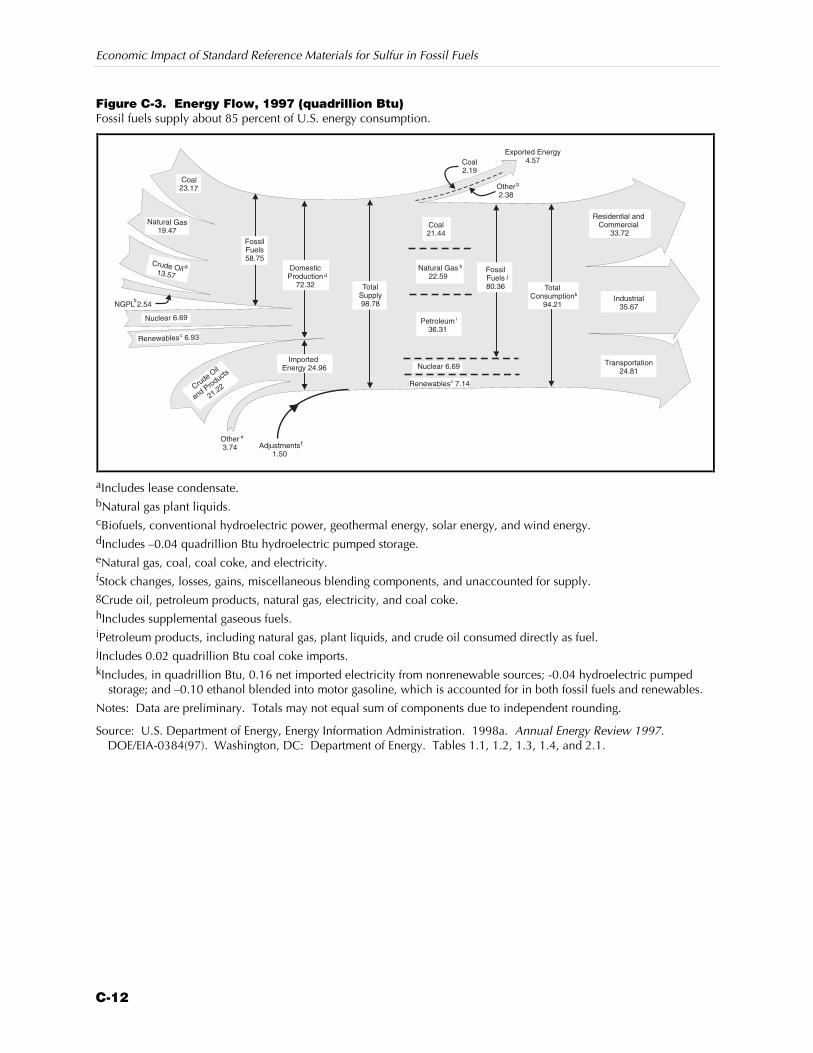
Economic Impact of Standard Reference Materials for Sulfur in Fossil Fuels
C-12
Figure C-3. Energy Flow, 1997 (quadrillion Btu)Fossil fuels supply about 85 percent of U.S. energy consumption.
TotalConsumption
94.21
TotalSupply98.78
Exported Energy4.57Coal
2.19
Other2.38
Coal23.17
Natural Gas19.47
Crude Oil13.57
NGPL 2.54
Nuclear 6.69
Renewables 6.93
CrudeOil
andProducts
21.22
Other3.74 Adjustments
1.50
FossilFuels80.36
Renewables 7.14
DomesticProduction
72.32
Industrial35.67
Transportation24.81
Residential andCommercial
33.72Coal21.44
Natural Gas22.59
Petroleum36.31
Nuclear 6.69Imported
Energy 24.96
FossilFuels58.75
b
c
a
d
e
f
h
i
j
c
k
aIncludes lease condensate.bNatural gas plant liquids.cBiofuels, conventional hydroelectric power, geothermal energy, solar energy, and wind energy.dIncludes –0.04 quadrillion Btu hydroelectric pumped storage.eNatural gas, coal, coal coke, and electricity.fStock changes, losses, gains, miscellaneous blending components, and unaccounted for supply.gCrude oil, petroleum products, natural gas, electricity, and coal coke.hIncludes supplemental gaseous fuels.iPetroleum products, including natural gas, plant liquids, and crude oil consumed directly as fuel.jIncludes 0.02 quadrillion Btu coal coke imports.kIncludes, in quadrillion Btu, 0.16 net imported electricity from nonrenewable sources; -0.04 hydroelectric pumped
storage; and –0.10 ethanol blended into motor gasoline, which is accounted for in both fossil fuels and renewables.
Notes: Data are preliminary. Totals may not equal sum of components due to independent rounding.
Source: U.S. Department of Energy, Energy Information Administration. 1998a. Annual Energy Review 1997.DOE/EIA-0384(97). Washington, DC: Department of Energy. Tables 1.1, 1.2, 1.3, 1.4, and 2.1.
Appendix C — Profiles of Affected Industries
C-13
Table C-5. End-Use Energy Consumption, 1996 (quadrillion Btu)Energy consumption is roughly equally divided among residential and commercial, industrial, and transportation uses.
Sector Gas CoalPetroleumProducts Electricitya
Other (Coke, Breeze,Biofuels, Net Steam,and Raw Materials) Lossesb Total
Residential andCommercial
8.63 0.14 2.18 7.04 0.72 14.98 33.69
Industrial 10.39 2.42 9.07 3.52 2.63 7.48 35.51
Transportation — — 23.89 — 1.00 — 24.89
Total 19.02 2.56 35.14 10.56 4.35 22.46 94.09
aElectricity generation: 50.5 percent coal, 15.3 percent gas, 1.9 percent oil, and 32.3 percent nonfossil fuel (nuclear,hydroelectric, and renewables).
bTotal losses are calculated as the sum of energy consumed at electric utilities to generate electricity, utility purchases ofelectricity from nonutility power producers, and imported electricity, minus exported electricity and electricityconsumed by end users. Total losses are allocated to the end-use sectors in proportion to each sector’s share of totalelectricity use.
Source: U.S. Department of Energy, Energy Information Administration. 1998a. Annual Energy Review, 1997.Washington, DC: Department of Energy.
The industries accounting for the majority of fossil fuel combustionare electrical power, petroleum, iron and steel, and trucking. Asshown in Table C-6, power plants use approximately 90 percent ofcoal to generate electricity. The trucking industry consumesapproximately 65 percent of all petroleum products used in theU.S. in the form of diesel fuel.4
National trends in coal consumption are an environmental concernbecause the combustion of coal is a major source of sulfur releasedto air. Table C-7 shows the trend of coal consumption from 1992to 1997. The consumption of coal by electric utilities increasedfrom 1992 to 1997. However, coal consumption by electricutilities is expected to decrease as new gas-fired generation unitsare bought online and older coal units are retired.
Coal Industry
The U.S. coal industry produces and distributes 1.1. billion shorttons of coal per year. The industry consists of a few very largecompanies that produce more than 5 percent of total coalproduction and many mid-size and small companies. Informationabout the sulfur content of coal is very important to this industry
4The trucking industry accounts for approximately 78 percent of freight bills, and
fuel expenditures represent a large share of the trucking industry’s expenditures.
The industriesaccounting for themajority of fossilfuel combustion areelectrical power,petroleum, iron andsteel, and trucking.
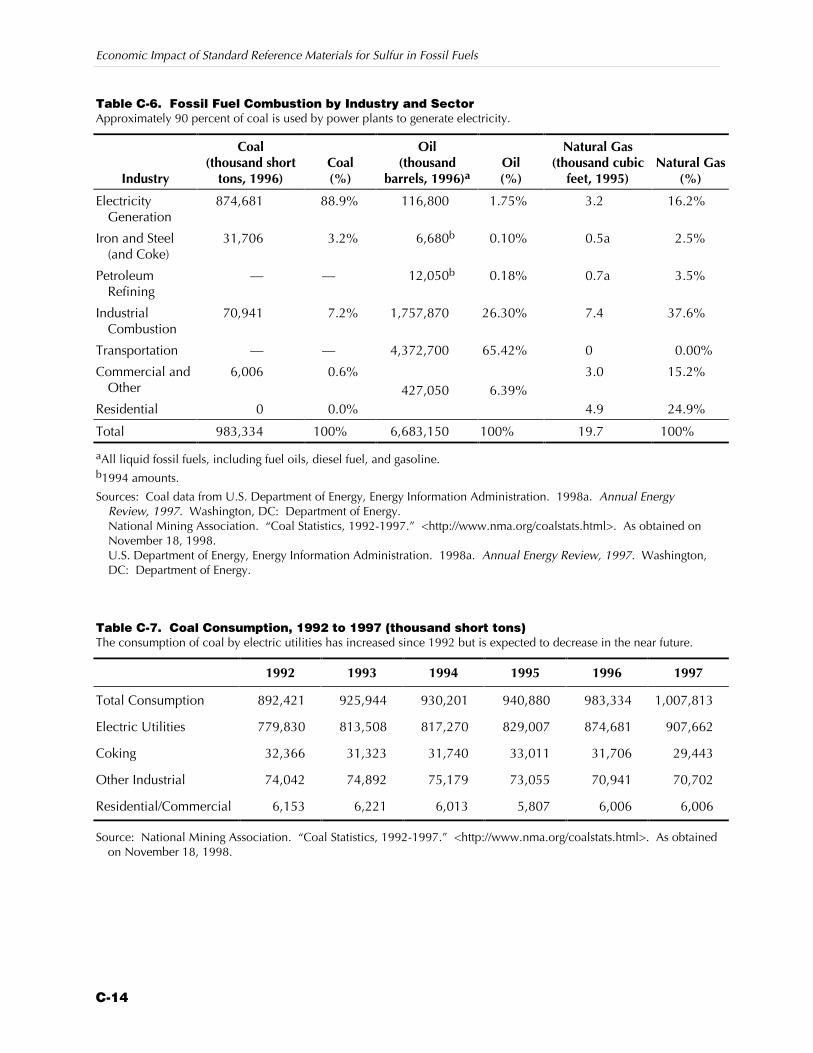
Economic Impact of Standard Reference Materials for Sulfur in Fossil Fuels
C-14
Table C-6. Fossil Fuel Combustion by Industry and SectorApproximately 90 percent of coal is used by power plants to generate electricity.
Industry
Coal(thousand short
tons, 1996)Coal(%)
Oil(thousand
barrels, 1996)aOil(%)
Natural Gas(thousand cubic
feet, 1995)Natural Gas
(%)
ElectricityGeneration
874,681 88.9% 116,800 1.75% 3.2 16.2%
Iron and Steel(and Coke)
31,706 3.2% 6,680b 0.10% 0.5a 2.5%
PetroleumRefining
— — 12,050b 0.18% 0.7a 3.5%
IndustrialCombustion
70,941 7.2% 1,757,870 26.30% 7.4 37.6%
Transportation — — 4,372,700 65.42% 0 0.00%
Commercial andOther
6,006 0.6% 3.0 15.2%
Residential 0 0.0%427,050 6.39%
4.9 24.9%
Total 983,334 100% 6,683,150 100% 19.7 100%
aAll liquid fossil fuels, including fuel oils, diesel fuel, and gasoline.b1994 amounts.
Sources: Coal data from U.S. Department of Energy, Energy Information Administration. 1998a. Annual EnergyReview, 1997. Washington, DC: Department of Energy.National Mining Association. “Coal Statistics, 1992-1997.” <http://www.nma.org/coalstats.html>. As obtained onNovember 18, 1998.U.S. Department of Energy, Energy Information Administration. 1998a. Annual Energy Review, 1997. Washington,DC: Department of Energy.
Table C-7. Coal Consumption, 1992 to 1997 (thousand short tons)The consumption of coal by electric utilities has increased since 1992 but is expected to decrease in the near future.
1992 1993 1994 1995 1996 1997
Total Consumption 892,421 925,944 930,201 940,880 983,334 1,007,813
Electric Utilities 779,830 813,508 817,270 829,007 874,681 907,662
Coking 32,366 31,323 31,740 33,011 31,706 29,443
Other Industrial 74,042 74,892 75,179 73,055 70,941 70,702
Residential/Commercial 6,153 6,221 6,013 5,807 6,006 6,006
Source: National Mining Association. “Coal Statistics, 1992-1997.” <http://www.nma.org/coalstats.html>. As obtainedon November 18, 1998.
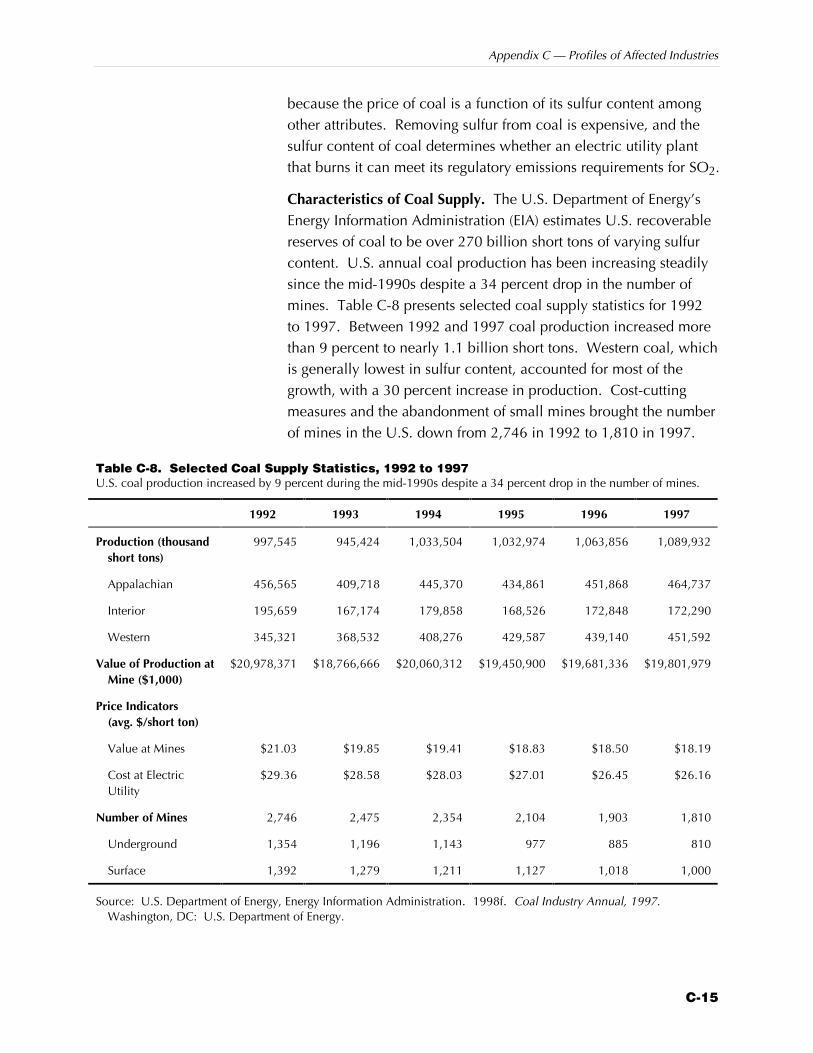
Appendix C — Profiles of Affected Industries
C-15
because the price of coal is a function of its sulfur content amongother attributes. Removing sulfur from coal is expensive, and thesulfur content of coal determines whether an electric utility plantthat burns it can meet its regulatory emissions requirements for SO2.
Characteristics of Coal Supply. The U.S. Department of Energy’sEnergy Information Administration (EIA) estimates U.S. recoverablereserves of coal to be over 270 billion short tons of varying sulfurcontent. U.S. annual coal production has been increasing steadilysince the mid-1990s despite a 34 percent drop in the number ofmines. Table C-8 presents selected coal supply statistics for 1992to 1997. Between 1992 and 1997 coal production increased morethan 9 percent to nearly 1.1 billion short tons. Western coal, whichis generally lowest in sulfur content, accounted for most of thegrowth, with a 30 percent increase in production. Cost-cuttingmeasures and the abandonment of small mines brought the numberof mines in the U.S. down from 2,746 in 1992 to 1,810 in 1997.
Table C-8. Selected Coal Supply Statistics, 1992 to 1997U.S. coal production increased by 9 percent during the mid-1990s despite a 34 percent drop in the number of mines.
1992 1993 1994 1995 1996 1997
Production (thousandshort tons)
997,545 945,424 1,033,504 1,032,974 1,063,856 1,089,932
Appalachian 456,565 409,718 445,370 434,861 451,868 464,737
Interior 195,659 167,174 179,858 168,526 172,848 172,290
Western 345,321 368,532 408,276 429,587 439,140 451,592
Value of Production atMine ($1,000)
$20,978,371 $18,766,666 $20,060,312 $19,450,900 $19,681,336 $19,801,979
Price Indicators(avg. $/short ton)
Value at Mines $21.03 $19.85 $19.41 $18.83 $18.50 $18.19
Cost at ElectricUtility
$29.36 $28.58 $28.03 $27.01 $26.45 $26.16
Number of Mines 2,746 2,475 2,354 2,104 1,903 1,810
Underground 1,354 1,196 1,143 977 885 810
Surface 1,392 1,279 1,211 1,127 1,018 1,000
Source: U.S. Department of Energy, Energy Information Administration. 1998f. Coal Industry Annual, 1997.Washington, DC: U.S. Department of Energy.
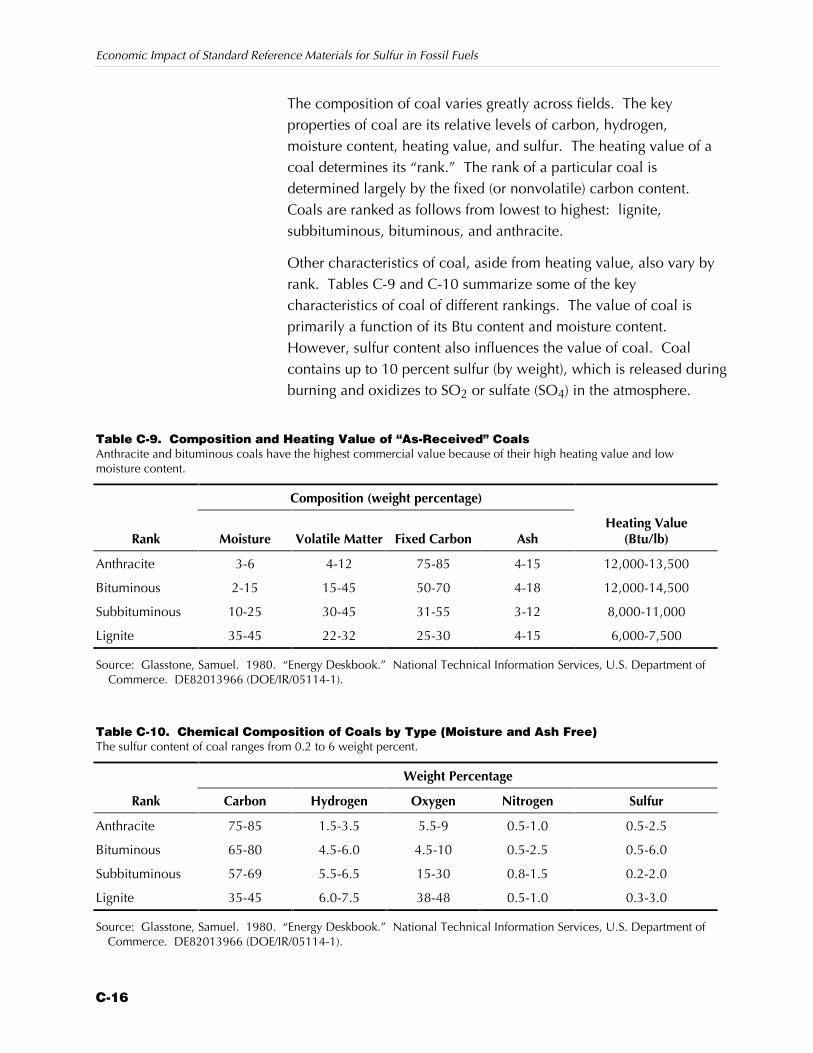
Economic Impact of Standard Reference Materials for Sulfur in Fossil Fuels
C-16
The composition of coal varies greatly across fields. The keyproperties of coal are its relative levels of carbon, hydrogen,moisture content, heating value, and sulfur. The heating value of acoal determines its “rank.” The rank of a particular coal isdetermined largely by the fixed (or nonvolatile) carbon content.Coals are ranked as follows from lowest to highest: lignite,subbituminous, bituminous, and anthracite.
Other characteristics of coal, aside from heating value, also vary byrank. Tables C-9 and C-10 summarize some of the keycharacteristics of coal of different rankings. The value of coal isprimarily a function of its Btu content and moisture content.However, sulfur content also influences the value of coal. Coalcontains up to 10 percent sulfur (by weight), which is released duringburning and oxidizes to SO2 or sulfate (SO4) in the atmosphere.
Table C-9. Composition and Heating Value of “As-Received” CoalsAnthracite and bituminous coals have the highest commercial value because of their high heating value and lowmoisture content.
Composition (weight percentage)
Rank Moisture Volatile Matter Fixed Carbon AshHeating Value
(Btu/lb)
Anthracite 3-6 4-12 75-85 4-15 12,000-13,500
Bituminous 2-15 15-45 50-70 4-18 12,000-14,500
Subbituminous 10-25 30-45 31-55 3-12 8,000-11,000
Lignite 35-45 22-32 25-30 4-15 6,000-7,500
Source: Glasstone, Samuel. 1980. “Energy Deskbook.” National Technical Information Services, U.S. Department ofCommerce. DE82013966 (DOE/IR/05114-1).
Table C-10. Chemical Composition of Coals by Type (Moisture and Ash Free)The sulfur content of coal ranges from 0.2 to 6 weight percent.
Weight Percentage
Rank Carbon Hydrogen Oxygen Nitrogen Sulfur
Anthracite 75-85 1.5-3.5 5.5-9 0.5-1.0 0.5-2.5
Bituminous 65-80 4.5-6.0 4.5-10 0.5-2.5 0.5-6.0
Subbituminous 57-69 5.5-6.5 15-30 0.8-1.5 0.2-2.0
Lignite 35-45 6.0-7.5 38-48 0.5-1.0 0.3-3.0
Source: Glasstone, Samuel. 1980. “Energy Deskbook.” National Technical Information Services, U.S. Department ofCommerce. DE82013966 (DOE/IR/05114-1).
Appendix C — Profiles of Affected Industries
C-17
Coal is generally classified into four sulfur categories: compliance,low sulfur, medium sulfur, and high sulfur. Compliance coal hasthe lowest sulfur content of 0.6 pounds per million Btus or less. Itnaturally falls within federal emissions regulations and thereforerequires less cleaning before combustion. Low-sulfur coal hasbetween 0.61 and 1.25 pounds of sulfur per million Btus, mediumsulfur coal between 1.26 and 1.67 pounds per million Btus, andhigh-sulfur coal more than 1.67 pounds per million Btus.
Coal’s sulfur content varies by the location from which it is mined.Generally, western coal (from Colorado, North Dakota, andWyoming, for example) is lowest in sulfur; Appalachian coal (fromPennsylvania, West Virginia, and Kentucky, for example) is eitherlow or medium sulfur; and interior coal (from Indiana, Illinois,Ohio, for example) is medium and high sulfur.
Many variables affect the price of coal. The price a utility pays pershort ton of coal is a function of quantity purchased, heating value,sulfur and ash content, distance from the mine, and the supplier’scosts. Coal from surface mines is less expensive than coal fromunderground mines because surface mines operate using lesscapital and labor, all other things held equal. For a utility, theprices paid for coals of varying sulfur content may differsignificantly precisely because so many factors affect prices (seeTable C-11). A utility may pay a higher price for higher-sulfurcontent coal because that coal has a greater healthy value than alower-sulfur content coal. All other things held equal, however,high-sulfur coal is less expensive than low-sulfur coal.
Coal Industry Structure. The coal industry consists of a few largecompanies and many smaller companies. In 1997, the U.S. hadover 1,800 coal mines employing about 83,000 people (EIA, 1997).Table C-12 lists the top 40 coal producers in the U.S in 1996. Thelargest coal producer, Peabody Holding Co., Inc., produces13.4 percent of total U.S. coal production. The top four companiesgenerate about 33 percent of total production; the top tencompanies produce about 51 percent, and the top 20 produceabout 66 percent (EIA, 1997). Many companies that own coalmines are engaged primarily in another industry that requires alarge quantity of coal. For example, many power companiesproduce coal, as do Aluminum Company of America and GeneralDynamics Corporation.
Of the three primary typesof fossil fuels, coal has thehighest sulfur content bypercent weight and heatcontent. It contains up to10 percent sulfur (byweight).
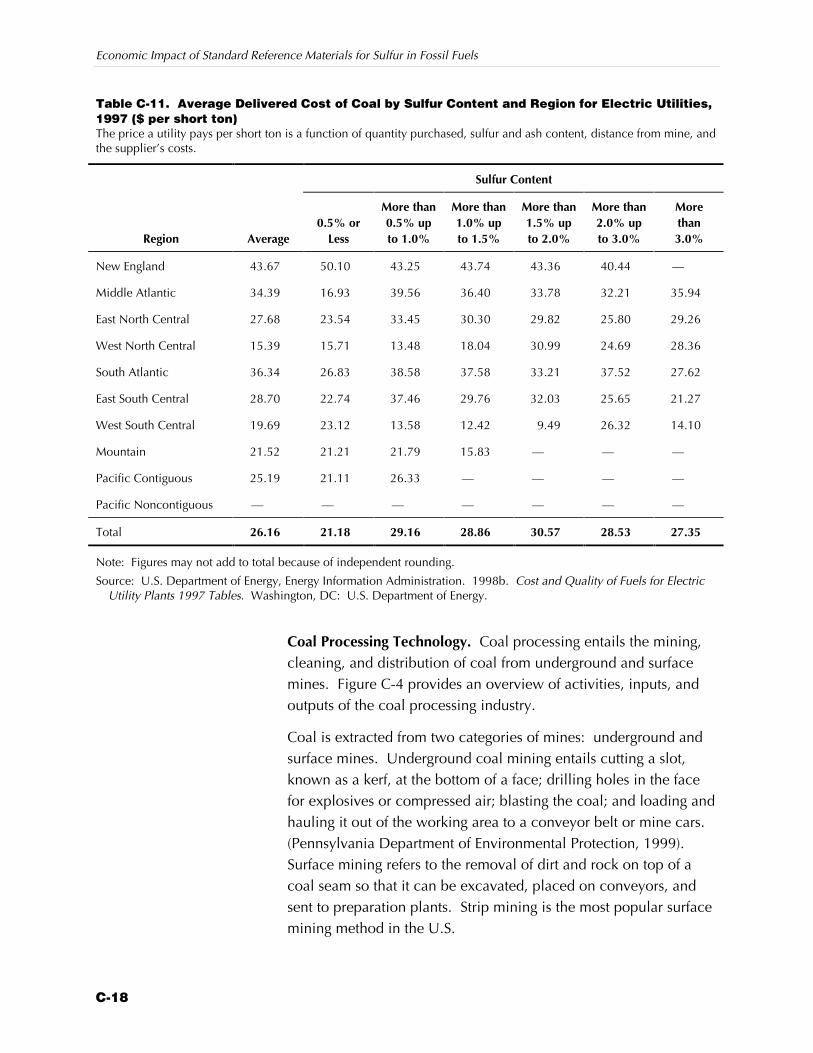
Economic Impact of Standard Reference Materials for Sulfur in Fossil Fuels
C-18
Table C-11. Average Delivered Cost of Coal by Sulfur Content and Region for Electric Utilities,1997 ($ per short ton)The price a utility pays per short ton is a function of quantity purchased, sulfur and ash content, distance from mine, andthe supplier’s costs.
Sulfur Content
Region Average0.5% or
Less
More than0.5% upto 1.0%
More than1.0% upto 1.5%
More than1.5% upto 2.0%
More than2.0% upto 3.0%
Morethan3.0%
New England 43.67 50.10 43.25 43.74 43.36 40.44 —
Middle Atlantic 34.39 16.93 39.56 36.40 33.78 32.21 35.94
East North Central 27.68 23.54 33.45 30.30 29.82 25.80 29.26
West North Central 15.39 15.71 13.48 18.04 30.99 24.69 28.36
South Atlantic 36.34 26.83 38.58 37.58 33.21 37.52 27.62
East South Central 28.70 22.74 37.46 29.76 32.03 25.65 21.27
West South Central 19.69 23.12 13.58 12.42 9.49 26.32 14.10
Mountain 21.52 21.21 21.79 15.83 — — —
Pacific Contiguous 25.19 21.11 26.33 — — — —
Pacific Noncontiguous — — — — — — —
Total 26.16 21.18 29.16 28.86 30.57 28.53 27.35
Note: Figures may not add to total because of independent rounding.
Source: U.S. Department of Energy, Energy Information Administration. 1998b. Cost and Quality of Fuels for ElectricUtility Plants 1997 Tables. Washington, DC: U.S. Department of Energy.
Coal Processing Technology. Coal processing entails the mining,cleaning, and distribution of coal from underground and surfacemines. Figure C-4 provides an overview of activities, inputs, andoutputs of the coal processing industry.
Coal is extracted from two categories of mines: underground andsurface mines. Underground coal mining entails cutting a slot,known as a kerf, at the bottom of a face; drilling holes in the facefor explosives or compressed air; blasting the coal; and loading andhauling it out of the working area to a conveyor belt or mine cars.(Pennsylvania Department of Environmental Protection, 1999).Surface mining refers to the removal of dirt and rock on top of acoal seam so that it can be excavated, placed on conveyors, andsent to preparation plants. Strip mining is the most popular surfacemining method in the U.S.
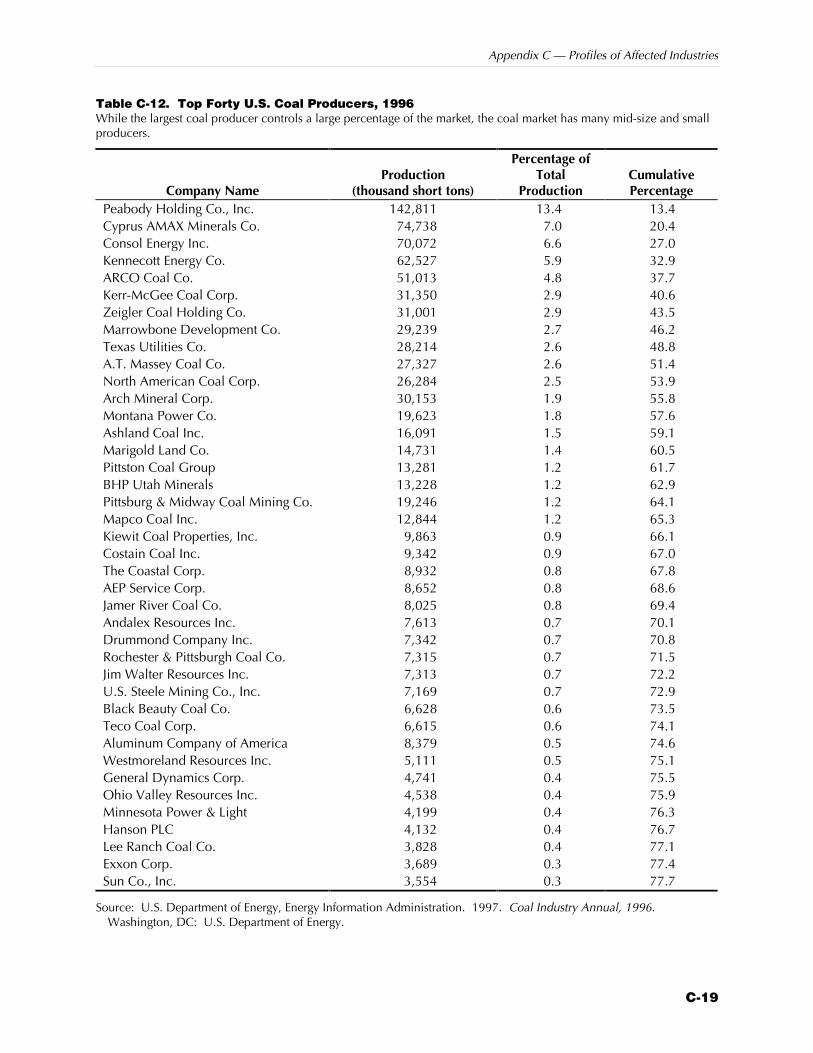
Appendix C — Profiles of Affected Industries
C-19
Table C-12. Top Forty U.S. Coal Producers, 1996While the largest coal producer controls a large percentage of the market, the coal market has many mid-size and smallproducers.
Company NameProduction
(thousand short tons)
Percentage ofTotal
ProductionCumulativePercentage
Peabody Holding Co., Inc. 142,811 13.4 13.4Cyprus AMAX Minerals Co. 74,738 7.0 20.4Consol Energy Inc. 70,072 6.6 27.0Kennecott Energy Co. 62,527 5.9 32.9ARCO Coal Co. 51,013 4.8 37.7Kerr-McGee Coal Corp. 31,350 2.9 40.6Zeigler Coal Holding Co. 31,001 2.9 43.5Marrowbone Development Co. 29,239 2.7 46.2Texas Utilities Co. 28,214 2.6 48.8A.T. Massey Coal Co. 27,327 2.6 51.4North American Coal Corp. 26,284 2.5 53.9Arch Mineral Corp. 30,153 1.9 55.8Montana Power Co. 19,623 1.8 57.6Ashland Coal Inc. 16,091 1.5 59.1Marigold Land Co. 14,731 1.4 60.5Pittston Coal Group 13,281 1.2 61.7BHP Utah Minerals 13,228 1.2 62.9Pittsburg & Midway Coal Mining Co. 19,246 1.2 64.1Mapco Coal Inc. 12,844 1.2 65.3Kiewit Coal Properties, Inc. 9,863 0.9 66.1Costain Coal Inc. 9,342 0.9 67.0The Coastal Corp. 8,932 0.8 67.8AEP Service Corp. 8,652 0.8 68.6Jamer River Coal Co. 8,025 0.8 69.4Andalex Resources Inc. 7,613 0.7 70.1Drummond Company Inc. 7,342 0.7 70.8Rochester & Pittsburgh Coal Co. 7,315 0.7 71.5Jim Walter Resources Inc. 7,313 0.7 72.2U.S. Steele Mining Co., Inc. 7,169 0.7 72.9Black Beauty Coal Co. 6,628 0.6 73.5Teco Coal Corp. 6,615 0.6 74.1Aluminum Company of America 8,379 0.5 74.6Westmoreland Resources Inc. 5,111 0.5 75.1General Dynamics Corp. 4,741 0.4 75.5Ohio Valley Resources Inc. 4,538 0.4 75.9Minnesota Power & Light 4,199 0.4 76.3Hanson PLC 4,132 0.4 76.7Lee Ranch Coal Co. 3,828 0.4 77.1Exxon Corp. 3,689 0.3 77.4Sun Co., Inc. 3,554 0.3 77.7
Source: U.S. Department of Energy, Energy Information Administration. 1997. Coal Industry Annual, 1996.Washington, DC: U.S. Department of Energy.
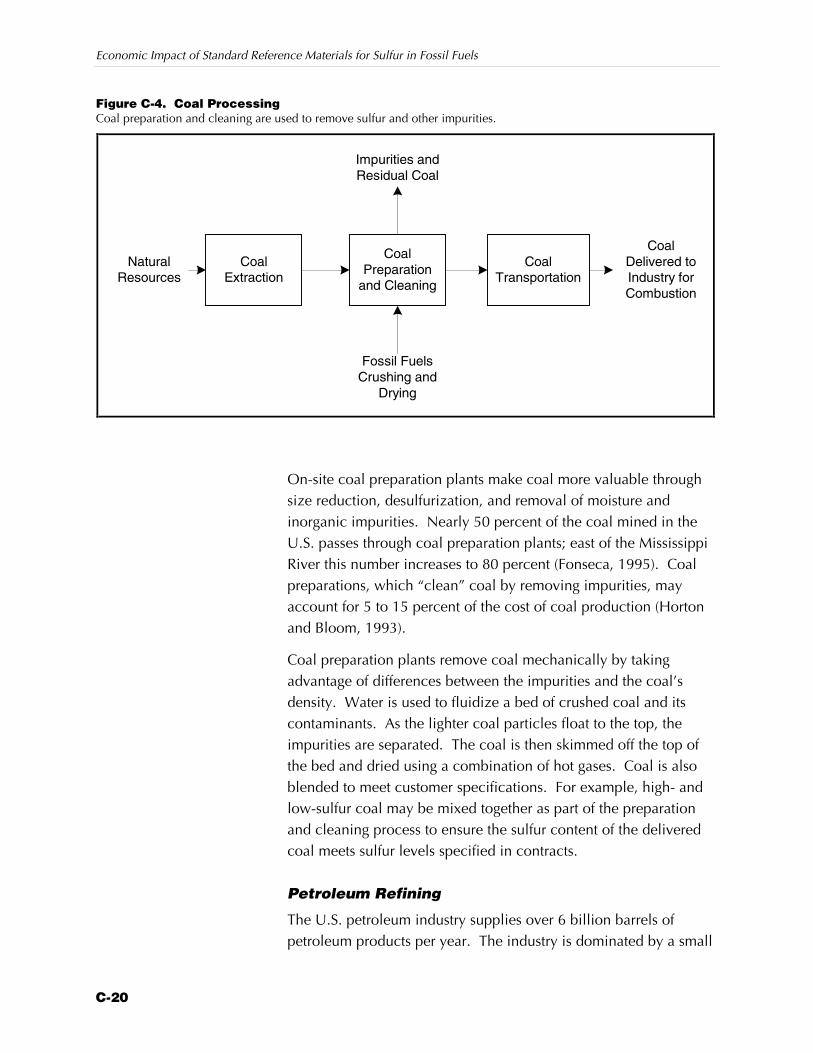
Economic Impact of Standard Reference Materials for Sulfur in Fossil Fuels
C-20
Figure C-4. Coal ProcessingCoal preparation and cleaning are used to remove sulfur and other impurities.
CoalExtraction
CoalPreparation
and Cleaning
CoalTransportation
NaturalResources
CoalDelivered toIndustry forCombustion
Impurities andResidual Coal
Fossil FuelsCrushing and
Drying
On-site coal preparation plants make coal more valuable throughsize reduction, desulfurization, and removal of moisture andinorganic impurities. Nearly 50 percent of the coal mined in theU.S. passes through coal preparation plants; east of the MississippiRiver this number increases to 80 percent (Fonseca, 1995). Coalpreparations, which “clean” coal by removing impurities, mayaccount for 5 to 15 percent of the cost of coal production (Hortonand Bloom, 1993).
Coal preparation plants remove coal mechanically by takingadvantage of differences between the impurities and the coal’sdensity. Water is used to fluidize a bed of crushed coal and itscontaminants. As the lighter coal particles float to the top, theimpurities are separated. The coal is then skimmed off the top ofthe bed and dried using a combination of hot gases. Coal is alsoblended to meet customer specifications. For example, high- andlow-sulfur coal may be mixed together as part of the preparationand cleaning process to ensure the sulfur content of the deliveredcoal meets sulfur levels specified in contracts.
Petroleum Refining
The U.S. petroleum industry supplies over 6 billion barrels ofpetroleum products per year. The industry is dominated by a small
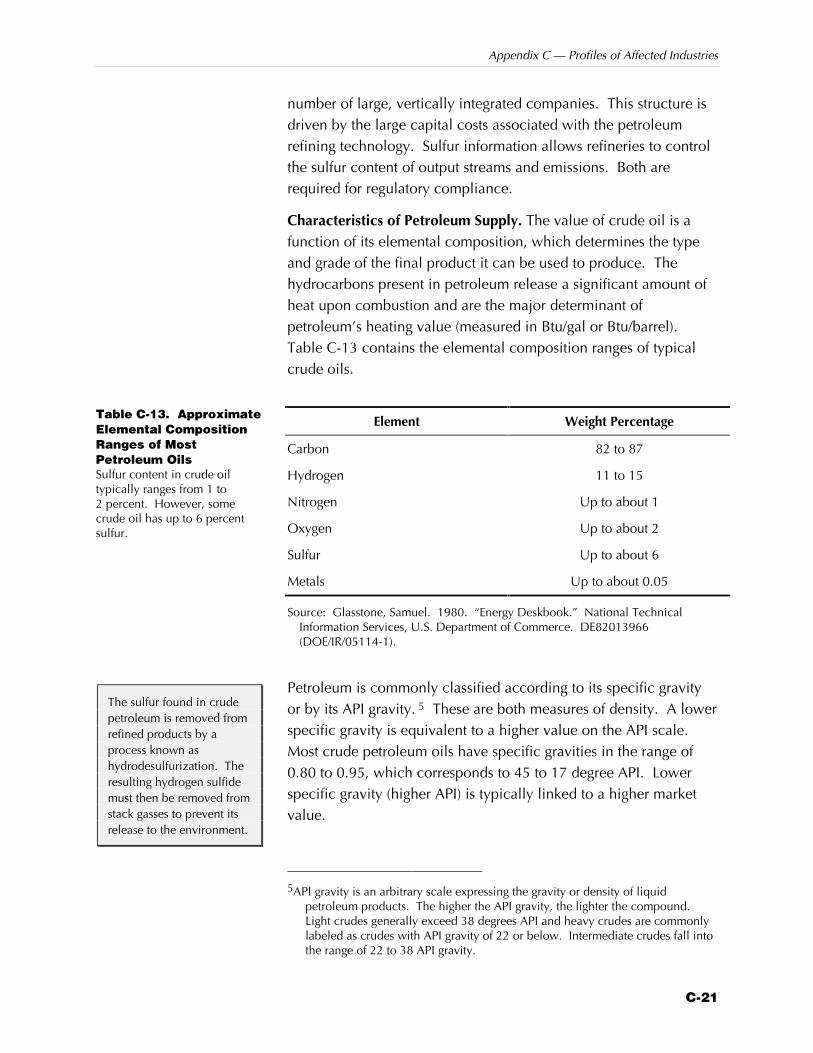
Appendix C — Profiles of Affected Industries
C-21
number of large, vertically integrated companies. This structure isdriven by the large capital costs associated with the petroleumrefining technology. Sulfur information allows refineries to controlthe sulfur content of output streams and emissions. Both arerequired for regulatory compliance.
Characteristics of Petroleum Supply. The value of crude oil is afunction of its elemental composition, which determines the typeand grade of the final product it can be used to produce. Thehydrocarbons present in petroleum release a significant amount ofheat upon combustion and are the major determinant ofpetroleum’s heating value (measured in Btu/gal or Btu/barrel).Table C-13 contains the elemental composition ranges of typicalcrude oils.
Element Weight Percentage
Carbon 82 to 87
Hydrogen 11 to 15
Nitrogen Up to about 1
Oxygen Up to about 2
Sulfur Up to about 6
Metals Up to about 0.05
Source: Glasstone, Samuel. 1980. “Energy Deskbook.” National TechnicalInformation Services, U.S. Department of Commerce. DE82013966(DOE/IR/05114-1).
Petroleum is commonly classified according to its specific gravityor by its API gravity. 5 These are both measures of density. A lowerspecific gravity is equivalent to a higher value on the API scale.Most crude petroleum oils have specific gravities in the range of0.80 to 0.95, which corresponds to 45 to 17 degree API. Lowerspecific gravity (higher API) is typically linked to a higher marketvalue.
5API gravity is an arbitrary scale expressing the gravity or density of liquid
petroleum products. The higher the API gravity, the lighter the compound.Light crudes generally exceed 38 degrees API and heavy crudes are commonlylabeled as crudes with API gravity of 22 or below. Intermediate crudes fall intothe range of 22 to 38 API gravity.
Table C-13. ApproximateElemental CompositionRanges of MostPetroleum OilsSulfur content in crude oiltypically ranges from 1 to2 percent. However, somecrude oil has up to 6 percentsulfur.
The sulfur found in crudepetroleum is removed fromrefined products by aprocess known ashydrodesulfurization. Theresulting hydrogen sulfidemust then be removed fromstack gasses to prevent itsrelease to the environment.
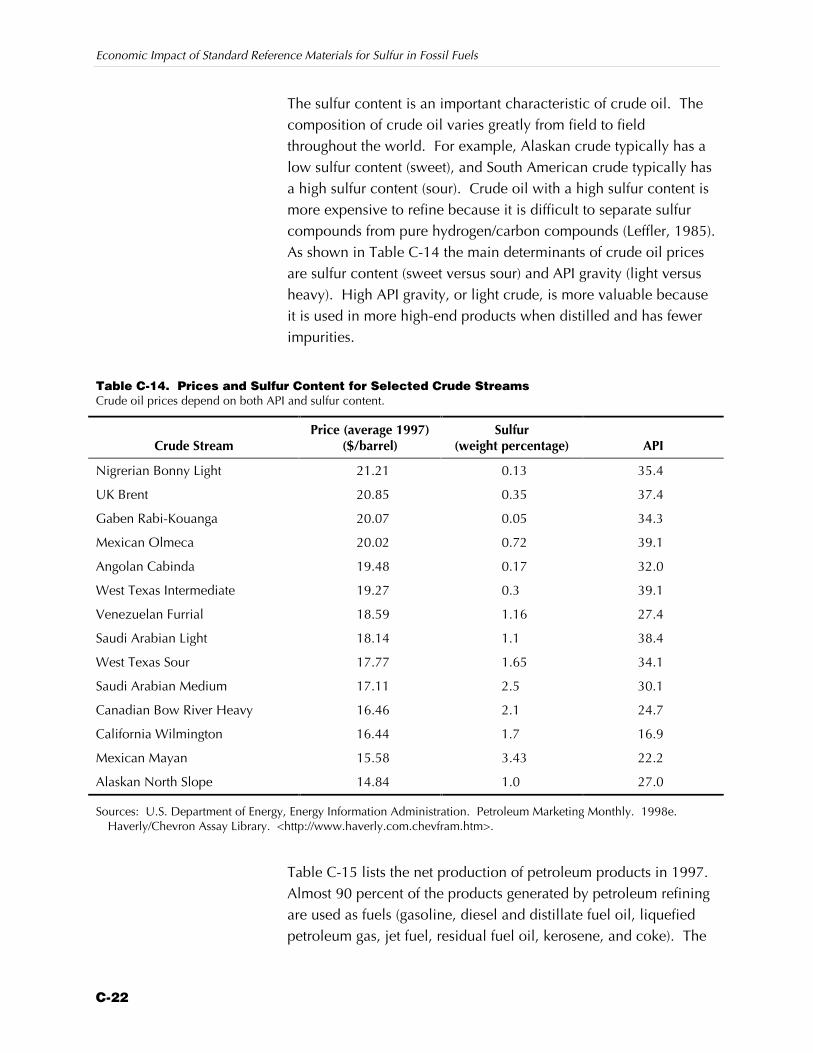
Economic Impact of Standard Reference Materials for Sulfur in Fossil Fuels
C-22
The sulfur content is an important characteristic of crude oil. Thecomposition of crude oil varies greatly from field to fieldthroughout the world. For example, Alaskan crude typically has alow sulfur content (sweet), and South American crude typically hasa high sulfur content (sour). Crude oil with a high sulfur content ismore expensive to refine because it is difficult to separate sulfurcompounds from pure hydrogen/carbon compounds (Leffler, 1985).As shown in Table C-14 the main determinants of crude oil pricesare sulfur content (sweet versus sour) and API gravity (light versusheavy). High API gravity, or light crude, is more valuable becauseit is used in more high-end products when distilled and has fewerimpurities.
Table C-14. Prices and Sulfur Content for Selected Crude StreamsCrude oil prices depend on both API and sulfur content.
Crude StreamPrice (average 1997)
($/barrel)Sulfur
(weight percentage) API
Nigrerian Bonny Light 21.21 0.13 35.4
UK Brent 20.85 0.35 37.4
Gaben Rabi-Kouanga 20.07 0.05 34.3
Mexican Olmeca 20.02 0.72 39.1
Angolan Cabinda 19.48 0.17 32.0
West Texas Intermediate 19.27 0.3 39.1
Venezuelan Furrial 18.59 1.16 27.4
Saudi Arabian Light 18.14 1.1 38.4
West Texas Sour 17.77 1.65 34.1
Saudi Arabian Medium 17.11 2.5 30.1
Canadian Bow River Heavy 16.46 2.1 24.7
California Wilmington 16.44 1.7 16.9
Mexican Mayan 15.58 3.43 22.2
Alaskan North Slope 14.84 1.0 27.0
Sources: U.S. Department of Energy, Energy Information Administration. Petroleum Marketing Monthly. 1998e.Haverly/Chevron Assay Library. <http://www.haverly.com.chevfram.htm>.
Table C-15 lists the net production of petroleum products in 1997.Almost 90 percent of the products generated by petroleum refiningare used as fuels (gasoline, diesel and distillate fuel oil, liquefiedpetroleum gas, jet fuel, residual fuel oil, kerosene, and coke). The
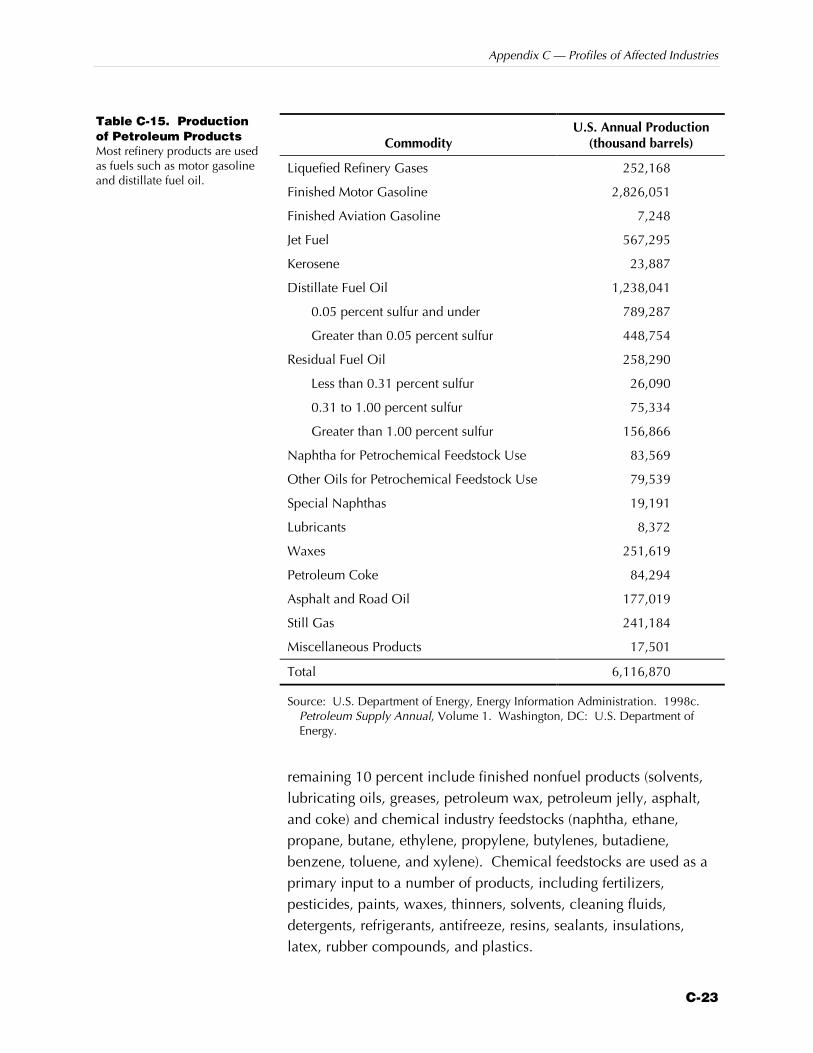
Appendix C — Profiles of Affected Industries
C-23
CommodityU.S. Annual Production
(thousand barrels)
Liquefied Refinery Gases 252,168
Finished Motor Gasoline 2,826,051
Finished Aviation Gasoline 7,248
Jet Fuel 567,295
Kerosene 23,887
Distillate Fuel Oil 1,238,041
0.05 percent sulfur and under 789,287
Greater than 0.05 percent sulfur 448,754
Residual Fuel Oil 258,290
Less than 0.31 percent sulfur 26,090
0.31 to 1.00 percent sulfur 75,334
Greater than 1.00 percent sulfur 156,866
Naphtha for Petrochemical Feedstock Use 83,569
Other Oils for Petrochemical Feedstock Use 79,539
Special Naphthas 19,191
Lubricants 8,372
Waxes 251,619
Petroleum Coke 84,294
Asphalt and Road Oil 177,019
Still Gas 241,184
Miscellaneous Products 17,501
Total 6,116,870
Source: U.S. Department of Energy, Energy Information Administration. 1998c.Petroleum Supply Annual, Volume 1. Washington, DC: U.S. Department ofEnergy.
remaining 10 percent include finished nonfuel products (solvents,lubricating oils, greases, petroleum wax, petroleum jelly, asphalt,and coke) and chemical industry feedstocks (naphtha, ethane,propane, butane, ethylene, propylene, butylenes, butadiene,benzene, toluene, and xylene). Chemical feedstocks are used as aprimary input to a number of products, including fertilizers,pesticides, paints, waxes, thinners, solvents, cleaning fluids,detergents, refrigerants, antifreeze, resins, sealants, insulations,latex, rubber compounds, and plastics.
Table C-15. Productionof Petroleum ProductsMost refinery products are usedas fuels such as motor gasolineand distillate fuel oil.
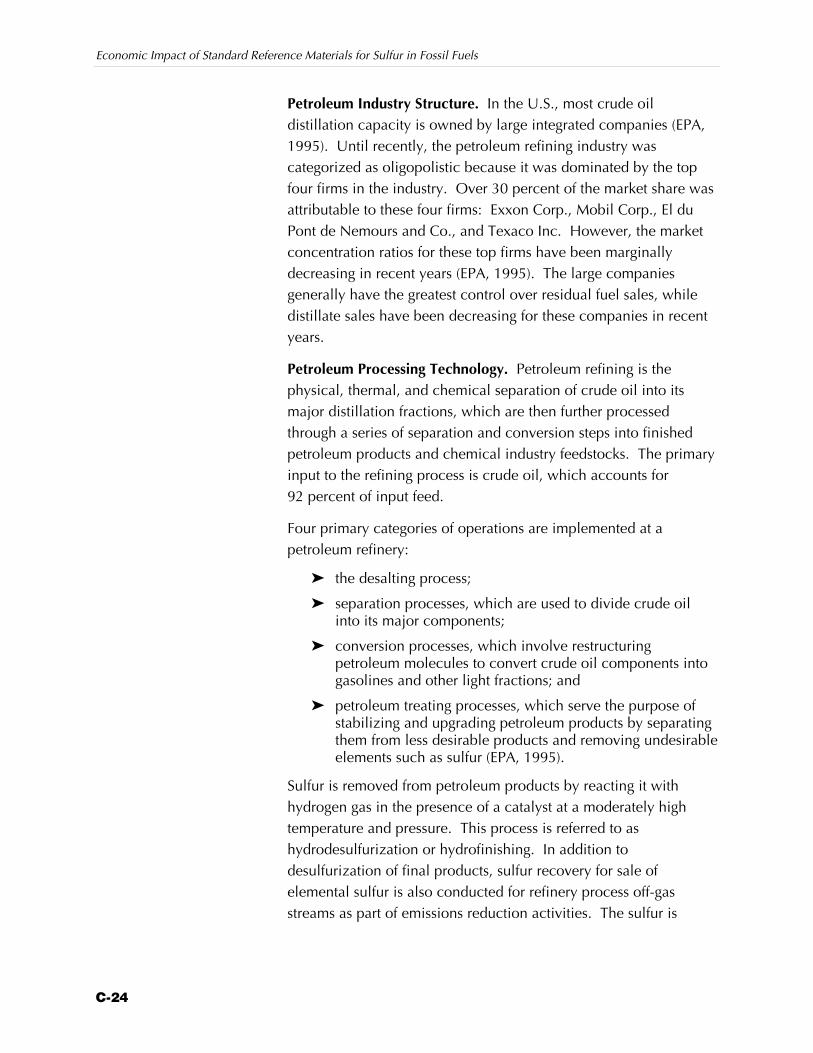
Economic Impact of Standard Reference Materials for Sulfur in Fossil Fuels
C-24
Petroleum Industry Structure. In the U.S., most crude oildistillation capacity is owned by large integrated companies (EPA,1995). Until recently, the petroleum refining industry wascategorized as oligopolistic because it was dominated by the topfour firms in the industry. Over 30 percent of the market share wasattributable to these four firms: Exxon Corp., Mobil Corp., El duPont de Nemours and Co., and Texaco Inc. However, the marketconcentration ratios for these top firms have been marginallydecreasing in recent years (EPA, 1995). The large companiesgenerally have the greatest control over residual fuel sales, whiledistillate sales have been decreasing for these companies in recentyears.
Petroleum Processing Technology. Petroleum refining is thephysical, thermal, and chemical separation of crude oil into itsmajor distillation fractions, which are then further processedthrough a series of separation and conversion steps into finishedpetroleum products and chemical industry feedstocks. The primaryinput to the refining process is crude oil, which accounts for92 percent of input feed.
Four primary categories of operations are implemented at apetroleum refinery:
Z the desalting process;
Z separation processes, which are used to divide crude oilinto its major components;
Z conversion processes, which involve restructuringpetroleum molecules to convert crude oil components intogasolines and other light fractions; and
Z petroleum treating processes, which serve the purpose ofstabilizing and upgrading petroleum products by separatingthem from less desirable products and removing undesirableelements such as sulfur (EPA, 1995).
Sulfur is removed from petroleum products by reacting it withhydrogen gas in the presence of a catalyst at a moderately hightemperature and pressure. This process is referred to ashydrodesulfurization or hydrofinishing. In addition todesulfurization of final products, sulfur recovery for sale ofelemental sulfur is also conducted for refinery process off-gasstreams as part of emissions reduction activities. The sulfur is
Appendix C — Profiles of Affected Industries
C-25
converted to hydrogen sulfide, which is then absorbed throughdesulfurization of stack gases.
Desulfurization of petroleum output streams can be very expensive.As part of background research for the development of its newsulfur content in gasoline regulations, EPA developed estimates ofthe cost of removing sulfur from gasoline. As shown in Table C-16,reducing the sulfur content of gasoline from its pre-Tier-2 levels(about 330 ppm) to 40 ppm is about 1.6 cents per gallon.
Sulfur LevelEPA Estimate of Cost
per Gallon (cents)API Estimate of Costper Gallon (cents)
150 ppm 0.7
100 ppm 1.1
40 ppm 1.6
30 ppm 1.7
2.3 to 2.6
Source: U.S. Environmental Protection Agency. April 1999. Draft RIA for Controlof Air Pollution from New Motor Vehicles: Tier 2 Motor Vehicle EmissionsStandards and Gasoline Sulfur Control Requirements.
The American Petroleum Institute (API) believes that EPAunderestimated the added cost of reducing the sulfur content ofgasoline below current levels. The trade association funded a seriesof studies conducted by MathPro that estimated the cost to be 2.3to 2.6 cents per gallon (Octane Week, 1999). Although API’sestimates are listed in Table C-16, the economic estimatespresented in this study are based on the more conservative EPAestimates of approximately 1 cent per gallon.
Maintaining specific sulfur levels in output streams and process off-gas streams is difficult because of the varying content of sulfur incrude oil. Accurate information about the sulfur content of thecrude oil and the output streams is essential to maintaining productspecifications and maximizing the efficiency of the processingequipment.
Frequently, refineries specialize in crude streams with either high orlow sulfur content. Because desulfurization equipment isexpensive, a company’s high-sulfur crude refining will typically beconcentrated in a few large facilities to increase equipmentutilization and decrease costs. Large refineries are generally more
Table C-16. Cost ofReducing the SulfurContent of Gasoline fromits Current Level (about350 ppm) to AlternativeLevelsAs the sulfur content of gasolineis reduced, the incremental costof removing each additionalppm of sulfur increases.
The varying content ofsulfur in crude oil makes itdifficult to maintainspecific sulfur levels inoutput streams.
Economic Impact of Standard Reference Materials for Sulfur in Fossil Fuels
C-26
flexible compared to small refineries in their ability to substituteone type of crude oil input for another.
Coke Industry
Coke is metallurgical coal that has been baked into a charcoal-likesubstance. This substance burns more evenly and at a highertemperature compared to coal. Coke is primarily used as an inputfor producing steel in blast furnaces at integrated iron and steelmills (i.e., furnace coke) and as an input for gray, ductile, andmalleable iron castings in cupolas at iron foundries (i.e., foundrycoke). Therefore, the demand for coke is a derived demand that islargely dependent on production of steel and iron castings.
The sulfur content of coke affects the production process and thesulfur content of iron and steel and that industry’s regulatorycompliance. Low-sulfur iron and steel is more valuable than high-sulfur iron and steel. Furthermore, the lower the sulfur content ofcoke, the lower the emissions of sulfur compounds during the ironand steel production process. Coke’s sulfur content is primarilydetermined by the sulfur content of the coals used to produce it.Alternatively, additional steps can be added to the productionprocess to reduce the amount of sulfur in coke. However, theseprocesses add to the cost of production; thus, facilities generallyprefer to use lower-sulfur coals to avoid additional desulfurizationprocesses (Zaino and Brousseau, 1983).
Characteristics of the Coke Industry. The manufacture of coke isincluded under Standard Industrial Classification (SIC) code 3312—Blast Furnaces and Steel Mills. However, coke production is asmall fraction of this industry.
Table C-17 summarizes coke industry capacity and production bytype of producer and type of coke. There are two primary types ofcoke producers: integrated producers and merchant producers.Integrated producers, which manufacture about 79 percent of allcoke, are owned by steel companies. Merchant producers, whichmanufacture the remaining 21 percent of coke, sell their product tosteel manufacturers.
In 1997, the coke industry produced about 20 million short tons ofcoke. About 90 percent of that coke was furnace coke to be usedin blast furnaces for steel making. The remaining 10 percent was
The sulfur content of cokeaffects the quality of ironand steel, the cost ofproduction, and the cost ofenvironmental compliance.
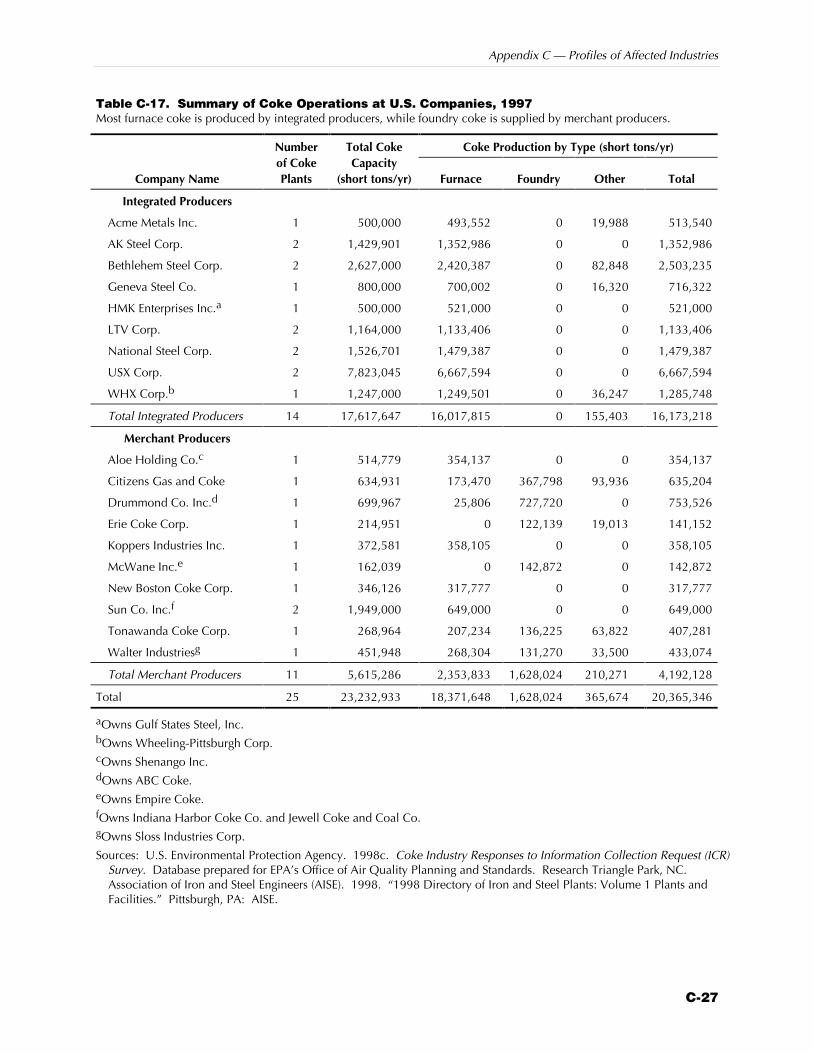
Appendix C — Profiles of Affected Industries
C-27
Table C-17. Summary of Coke Operations at U.S. Companies, 1997Most furnace coke is produced by integrated producers, while foundry coke is supplied by merchant producers.
Coke Production by Type (short tons/yr)
Company Name
Numberof CokePlants
Total CokeCapacity
(short tons/yr) Furnace Foundry Other Total
Integrated Producers
Acme Metals Inc. 1 500,000 493,552 0 19,988 513,540
AK Steel Corp. 2 1,429,901 1,352,986 0 0 1,352,986
Bethlehem Steel Corp. 2 2,627,000 2,420,387 0 82,848 2,503,235
Geneva Steel Co. 1 800,000 700,002 0 16,320 716,322
HMK Enterprises Inc.a 1 500,000 521,000 0 0 521,000
LTV Corp. 2 1,164,000 1,133,406 0 0 1,133,406
National Steel Corp. 2 1,526,701 1,479,387 0 0 1,479,387
USX Corp. 2 7,823,045 6,667,594 0 0 6,667,594
WHX Corp.b 1 1,247,000 1,249,501 0 36,247 1,285,748
Total Integrated Producers 14 17,617,647 16,017,815 0 155,403 16,173,218
Merchant Producers
Aloe Holding Co.c 1 514,779 354,137 0 0 354,137
Citizens Gas and Coke 1 634,931 173,470 367,798 93,936 635,204
Drummond Co. Inc.d 1 699,967 25,806 727,720 0 753,526
Erie Coke Corp. 1 214,951 0 122,139 19,013 141,152
Koppers Industries Inc. 1 372,581 358,105 0 0 358,105
McWane Inc.e 1 162,039 0 142,872 0 142,872
New Boston Coke Corp. 1 346,126 317,777 0 0 317,777
Sun Co. Inc.f 2 1,949,000 649,000 0 0 649,000
Tonawanda Coke Corp. 1 268,964 207,234 136,225 63,822 407,281
Walter Industriesg 1 451,948 268,304 131,270 33,500 433,074
Total Merchant Producers 11 5,615,286 2,353,833 1,628,024 210,271 4,192,128
Total 25 23,232,933 18,371,648 1,628,024 365,674 20,365,346
aOwns Gulf States Steel, Inc.bOwns Wheeling-Pittsburgh Corp.cOwns Shenango Inc.dOwns ABC Coke.eOwns Empire Coke.fOwns Indiana Harbor Coke Co. and Jewell Coke and Coal Co.gOwns Sloss Industries Corp.
Sources: U.S. Environmental Protection Agency. 1998c. Coke Industry Responses to Information Collection Request (ICR)Survey. Database prepared for EPA’s Office of Air Quality Planning and Standards. Research Triangle Park, NC.Association of Iron and Steel Engineers (AISE). 1998. “1998 Directory of Iron and Steel Plants: Volume 1 Plants andFacilities.” Pittsburgh, PA: AISE.
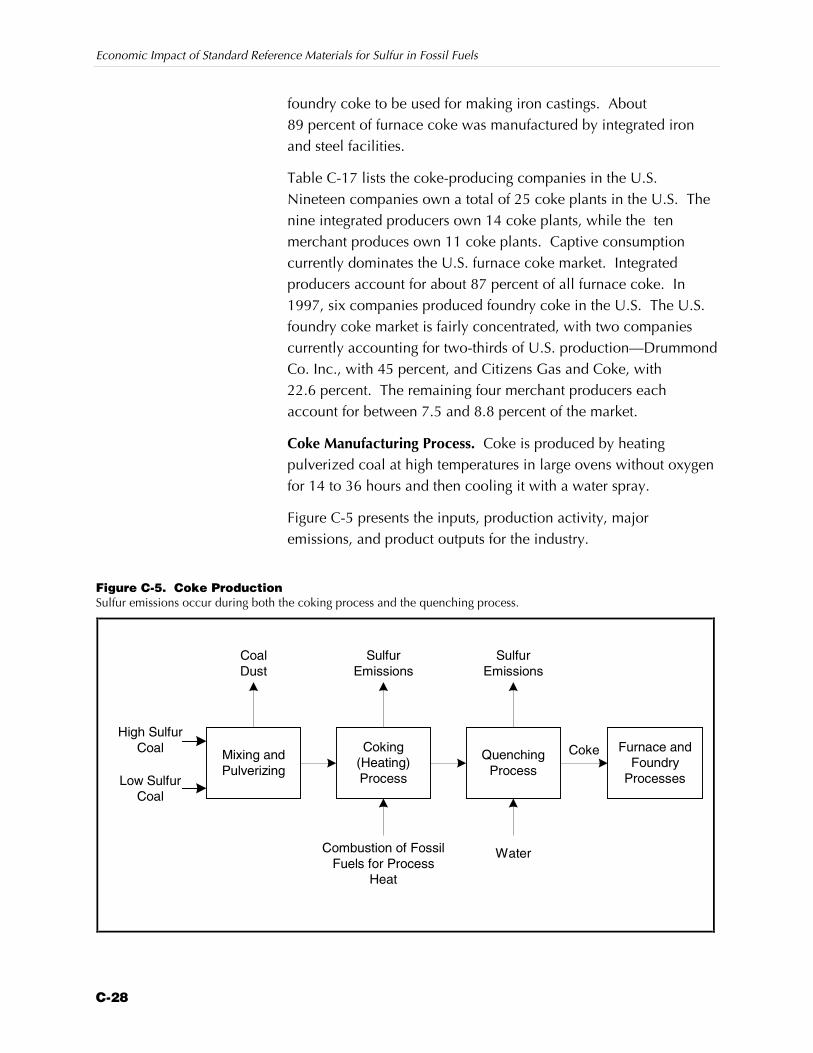
Economic Impact of Standard Reference Materials for Sulfur in Fossil Fuels
C-28
foundry coke to be used for making iron castings. About89 percent of furnace coke was manufactured by integrated ironand steel facilities.
Table C-17 lists the coke-producing companies in the U.S.Nineteen companies own a total of 25 coke plants in the U.S. Thenine integrated producers own 14 coke plants, while the tenmerchant produces own 11 coke plants. Captive consumptioncurrently dominates the U.S. furnace coke market. Integratedproducers account for about 87 percent of all furnace coke. In1997, six companies produced foundry coke in the U.S. The U.S.foundry coke market is fairly concentrated, with two companiescurrently accounting for two-thirds of U.S. production—DrummondCo. Inc., with 45 percent, and Citizens Gas and Coke, with22.6 percent. The remaining four merchant producers eachaccount for between 7.5 and 8.8 percent of the market.
Coke Manufacturing Process. Coke is produced by heatingpulverized coal at high temperatures in large ovens without oxygenfor 14 to 36 hours and then cooling it with a water spray.
Figure C-5 presents the inputs, production activity, majoremissions, and product outputs for the industry.
Figure C-5. Coke ProductionSulfur emissions occur during both the coking process and the quenching process.
Mixing andPulverizing
Coking(Heating)Process
QuenchingProcess
High SulfurCoal
SulfurEmissions
Combustion of FossilFuels for Process
Heat
SulfurEmissions
CoalDust
Water
Low SulfurCoal
Furnace andFoundry
Processes
Coke
Appendix C — Profiles of Affected Industries
C-29
Metallurgical coal is delivered to coke manufacturing plants inrailroad cars or barges. It is then transferred to mixing bins wherethe various types of coal are blended based on specificcharacteristics of the coal such as fluidity, ash, and sulfur content.Lankford et al. (1985) consider the selection of coals to be thesingle most important factor in establishing coke quality. The bestcoals are low in ash and sulfur content and produce a structurallystrong coke. Coal blending results in improved and moreconsistent coke quality, which justifies the extra expense of mixing.
The coal is pulverized and fed into the oven. The coal in the cokeoven is heated at temperatures up to 2,000 ºF for 14 to 36 hours.When subjected to such a high degree of heat in the absence of air,the chemical compounds making up coal are unstable and thecomplex organic molecules break down to yield gases and arelatively nonvolatile carbonaceous residue (i.e., coke). At the endof the coking cycle, doors on each end of the oven are removed,and the incandescent coke is pushed from the oven.
During what is known as the wet quenching process, theincandescent coke is carried to a quench tower where it is cooledto a temperature of 200 º to 500 ºF by a system of stationary watersprays and air dried in preparation for sizing. This quenchingprevents the coke from burning up in the air. The coke is thenscreened to a uniform size, which also results in some small cokefines (or breeze) that are recovered for use as a raw material inputto blast furnaces.
C.1.3 Fuel Combustion
As explained earlier in Appendix C, the primary uses of fossil fuelsin the U.S. are the production of power by electric utilities, theproduction of steel, and the production of power by industrialboilers. This section describes the structure of the electric powerindustry and the steel industry. However, we do not addressindustrial combustion. Because industrial boilers are used in allmajor industrial sectors, it would be very difficult for us tocharacterize this diverse set of industries.
Electricity Generation
Approximately 35 percent of all U.S. fossil fuel consumption(measured in Btus) is used to generate electricity. Electricity
Coke production involvesthree basic steps:Z mixing and pulverizing
Z coking
Z quenching
Economic Impact of Standard Reference Materials for Sulfur in Fossil Fuels
C-30
generation in 1996 consumed 88.9 percent of coal, 1.7 percent ofoil, and 16.2 percent of natural gas used in the U.S. Because of itsdependence on coal as a fuel, electricity generation accounts for65.9 percent of SO2 released into the atmosphere. The electricgeneration industry is heavily regulated because it is one of theprimary sources of SO2 emissions in the U.S.
The electric utility industry relies heavily on sulfur contentinformation to determine fuel mix and other operating parametersthat affect its compliance with environmental regulations.Furthermore, many power plants are designed to burn coal of aspecific sulfur content. Burning high-sulfur coal in these plants canlead to boiler fouling and slagging, decreased generating efficiency,and increased maintenance costs.
Characteristics of the Electricity Generation Industry. Electricutilities produce 88 percent of electricity generated in the U.S.Electric utilities are typically large publicly owned entities whoseprimary function is to generate and distribute electricity. Nonutilitygenerators account for the remaining 12 percent of electricitygeneration and are comprised mainly of independent powerproducers and industrial facilities engaged in self-generation andcogeneration. Cogeneration refers to the combined production ofelectricity with another form of useful energy, such as process heator steam.
The electric utility industry is very dependent on fossil fuels,especially coal. Fossil fuels account for over two-thirds of netmegawatthours (MWh) generated in the U.S. (EPA, 1998c). Asshown in Table C-18, nuclear, hydroelectric, renewable, and otherfuels account for the remaining net generation. Within the fossilfuel category, coal is used as the main energy source to generateelectricity in the utility industry, and natural gas is the main energysource for nonutility generators. Other fossil fuels used much lessfrequently to generate electricity are petroleum coke, refinery gas,coke oven gas, blast furnace gas, and liquefied petroleum gas.Future trends are for natural gas to increase its share of both utilityand nonutility electricity generation because of rapid technologyimprovements in combined-cycle gas turbine engines.
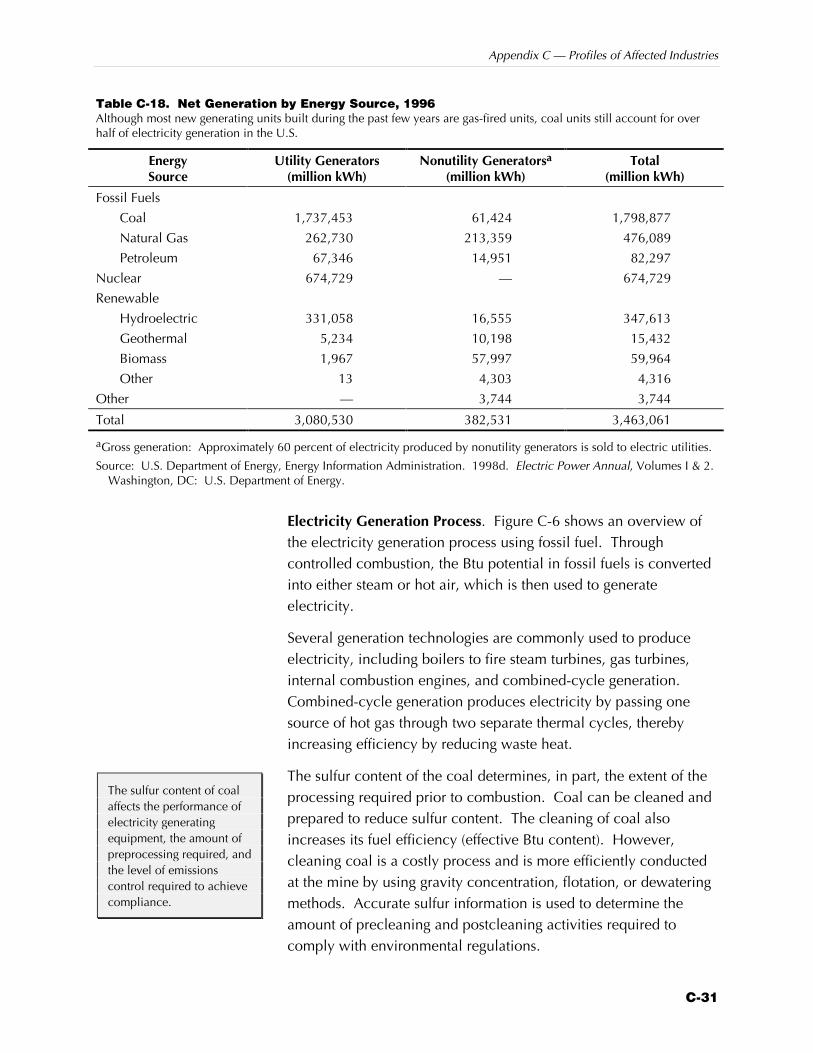
Appendix C — Profiles of Affected Industries
C-31
Table C-18. Net Generation by Energy Source, 1996Although most new generating units built during the past few years are gas-fired units, coal units still account for overhalf of electricity generation in the U.S.
EnergySource
Utility Generators(million kWh)
Nonutility Generatorsa
(million kWh)Total
(million kWh)
Fossil Fuels
Coal 1,737,453 61,424 1,798,877
Natural Gas 262,730 213,359 476,089
Petroleum 67,346 14,951 82,297
Nuclear 674,729 — 674,729
Renewable
Hydroelectric 331,058 16,555 347,613
Geothermal 5,234 10,198 15,432
Biomass 1,967 57,997 59,964
Other 13 4,303 4,316
Other — 3,744 3,744
Total 3,080,530 382,531 3,463,061
aGross generation: Approximately 60 percent of electricity produced by nonutility generators is sold to electric utilities.
Source: U.S. Department of Energy, Energy Information Administration. 1998d. Electric Power Annual, Volumes I & 2.Washington, DC: U.S. Department of Energy.
Electricity Generation Process. Figure C-6 shows an overview ofthe electricity generation process using fossil fuel. Throughcontrolled combustion, the Btu potential in fossil fuels is convertedinto either steam or hot air, which is then used to generateelectricity.
Several generation technologies are commonly used to produceelectricity, including boilers to fire steam turbines, gas turbines,internal combustion engines, and combined-cycle generation.Combined-cycle generation produces electricity by passing onesource of hot gas through two separate thermal cycles, therebyincreasing efficiency by reducing waste heat.
The sulfur content of the coal determines, in part, the extent of theprocessing required prior to combustion. Coal can be cleaned andprepared to reduce sulfur content. The cleaning of coal alsoincreases its fuel efficiency (effective Btu content). However,cleaning coal is a costly process and is more efficiently conductedat the mine by using gravity concentration, flotation, or dewateringmethods. Accurate sulfur information is used to determine theamount of precleaning and postcleaning activities required tocomply with environmental regulations.
The sulfur content of coalaffects the performance ofelectricity generatingequipment, the amount ofpreprocessing required, andthe level of emissionscontrol required to achievecompliance.
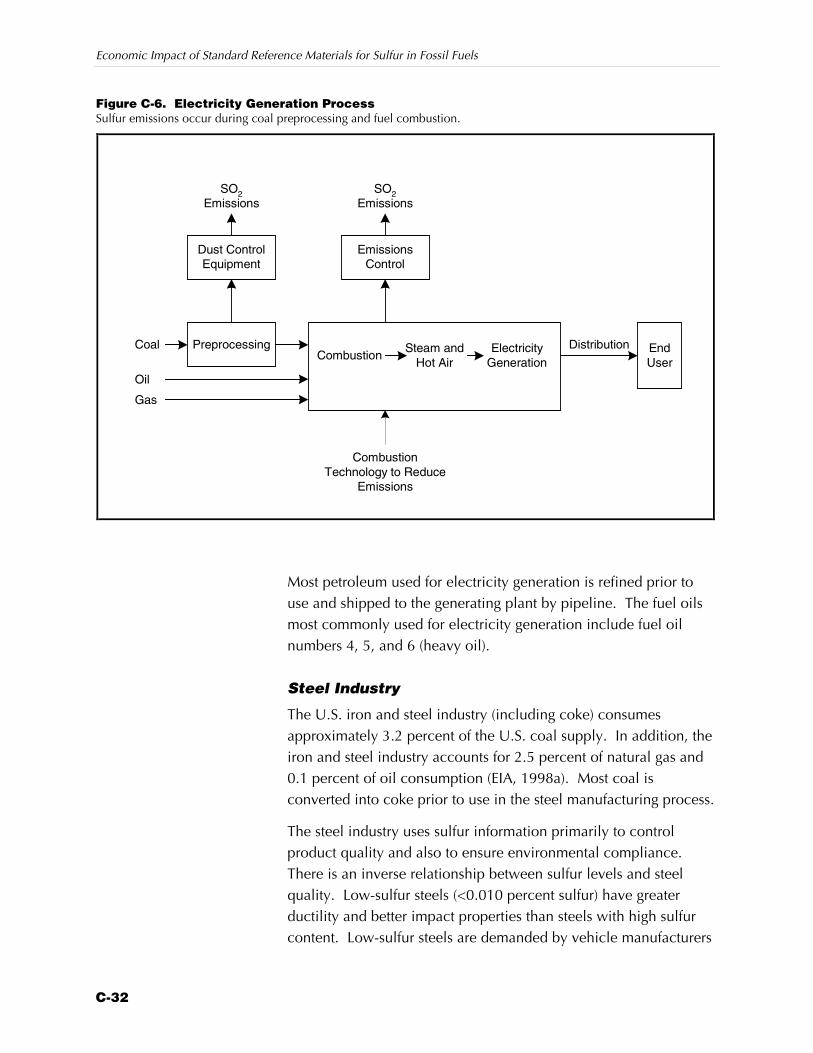
Economic Impact of Standard Reference Materials for Sulfur in Fossil Fuels
C-32
Figure C-6. Electricity Generation ProcessSulfur emissions occur during coal preprocessing and fuel combustion.
Preprocessing
Dust ControlEquipment
Coal
SO2Emissions
CombustionTechnology to Reduce
Emissions
Steam andHot Air
SO2Emissions
Combustion
Oil
EndUser
Distribution
Gas
EmissionsControl
ElectricityGeneration
Most petroleum used for electricity generation is refined prior touse and shipped to the generating plant by pipeline. The fuel oilsmost commonly used for electricity generation include fuel oilnumbers 4, 5, and 6 (heavy oil).
Steel Industry
The U.S. iron and steel industry (including coke) consumesapproximately 3.2 percent of the U.S. coal supply. In addition, theiron and steel industry accounts for 2.5 percent of natural gas and0.1 percent of oil consumption (EIA, 1998a). Most coal isconverted into coke prior to use in the steel manufacturing process.
The steel industry uses sulfur information primarily to controlproduct quality and also to ensure environmental compliance.There is an inverse relationship between sulfur levels and steelquality. Low-sulfur steels (<0.010 percent sulfur) have greaterductility and better impact properties than steels with high sulfurcontent. Low-sulfur steels are demanded by vehicle manufacturers
Appendix C — Profiles of Affected Industries
C-33
and pipe manufacturers because of their impact and corrosionresistance, which enhances the quality of end-use products (Zainoand Brousseau, 1983).
Characteristics of the Steel Industry. The U.S. iron and steelindustry can be separated into three distinct types of producers:integrated mills, nonintegrated or specialty mills, and mini-mills.Integrated iron and steel producers are companies that produce ironfrom iron ore in blast furnaces. The integrated producers in theU.S. are listed in Table C-17. Their principal commercial activity isthe production and sale of carbon steel. Integrated producers usefurnace coke in blast furnaces and either produce coke on site orpurchase it from merchant coke producers. Nonintegrated orspecialty mills do not have the necessary equipment to producesteel from basic raw materials; instead, they purchase these inputsin a processed form (i.e., semi-finished products) to manufacturesteel products. Mini-mills use only electric arc furnaces (EAFs) tomelt scrap steel and other materials to make steel products.
From 1980 to 1990, integrated iron and steel production in the U.S.decreased approximately 60 percent. This decline was due to slowgrowth in demand for steel, markets lost to substitute materials,increased foreign competition, and low productivity growthresulting from older and less-efficient capital stock. However,while the integrated producers were contracting, the mini-millswere more than doubling their capacity and expanding into newmarkets. As a whole, the U.S. steel industry experienced aturnaround in 1993 with shipments at their highest level since1981. This increase was due to the strong demand from theautomotive and construction industries and the weak dollar(making imports more expensive). As of 1997, integrated producersaccounted for roughly 55 percent of U.S. steel production, with20 plants operating at a total steel capacity of almost 6.2 millionshort tons per year (AISI, 1998; EPA, 1998a).
In 1994, iron and steel facilities consumed 1,907 trillion Btus ofenergy. The vast majority of this energy, 1,119 trillion Btus, was inthe form of coke and breeze. Natural gas and electricity supplymost of the industry’s remaining energy needs.
Manufacturing Process. Steel facilities manufacture steel bymelting, alloying, and molding pig iron and steel scrap. Figure C-7
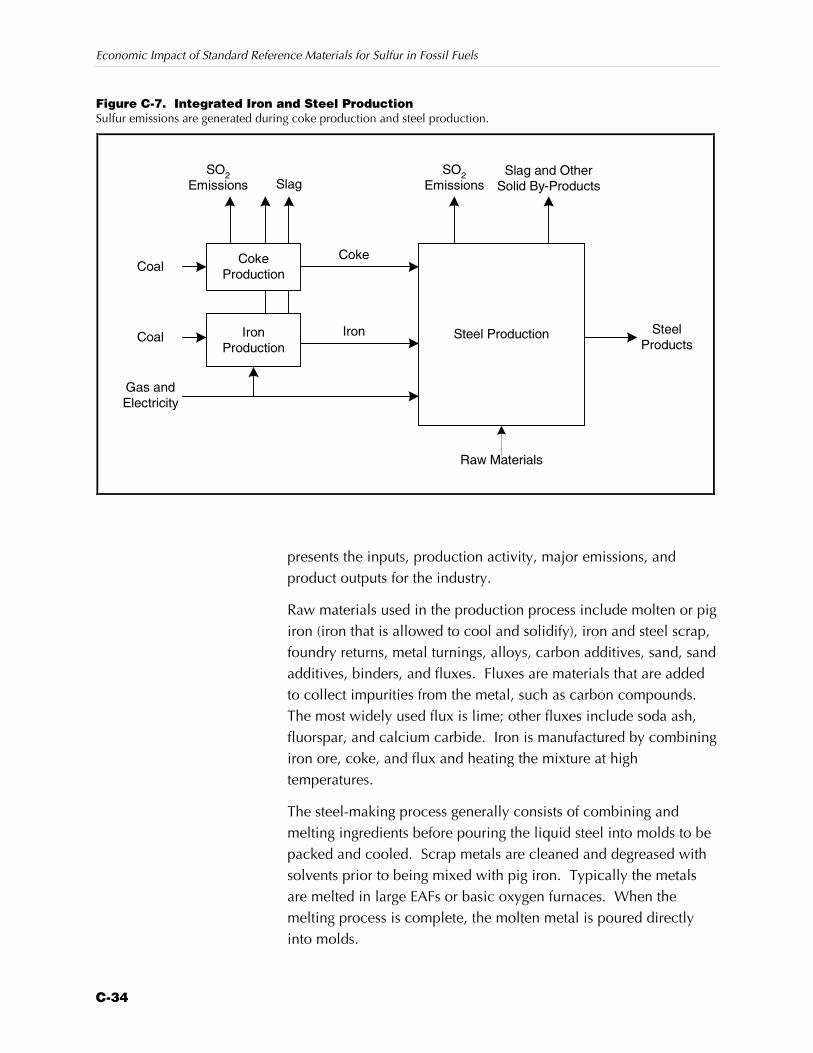
Economic Impact of Standard Reference Materials for Sulfur in Fossil Fuels
C-34
Figure C-7. Integrated Iron and Steel ProductionSulfur emissions are generated during coke production and steel production.
CokeProduction
IronProduction
Steel Production
Coal
SO2Emissions
SO2Emissions
Coke
Raw Materials
CoalSteel
Products
Slag and OtherSolid By-Products
Gas andElectricity
Iron
Slag
presents the inputs, production activity, major emissions, andproduct outputs for the industry.
Raw materials used in the production process include molten or pigiron (iron that is allowed to cool and solidify), iron and steel scrap,foundry returns, metal turnings, alloys, carbon additives, sand, sandadditives, binders, and fluxes. Fluxes are materials that are addedto collect impurities from the metal, such as carbon compounds.The most widely used flux is lime; other fluxes include soda ash,fluorspar, and calcium carbide. Iron is manufactured by combiningiron ore, coke, and flux and heating the mixture at hightemperatures.
The steel-making process generally consists of combining andmelting ingredients before pouring the liquid steel into molds to bepacked and cooled. Scrap metals are cleaned and degreased withsolvents prior to being mixed with pig iron. Typically the metalsare melted in large EAFs or basic oxygen furnaces. When themelting process is complete, the molten metal is poured directlyinto molds.
Appendix C — Profiles of Affected Industries
C-35
C.2 THE IMPORTANCE OF SULFUR IN FOSSILFUELSThis section describes the regulatory and technical issues that makethe sulfur content of fossil fuels important. The sulfur content of afuel is important for two reasons: because sulfur has a detrimentaleffect on the environment and because sulfur content can affect theperformance of a product or process. For both reasons, the sulfurcontent of fossil fuels affects its value; thus, information about sulfurcontent is essential to trade and production.
C.2.1 Environmental Regulation of Sulfur in Fossil Fuels
Because some sulfur compounds have a detrimental effect onhuman health, wildlife, agricultural productivity, and quality of life,sulfur compound emissions from some sources and sulfur contentof some fuels are regulated by EPA and by state regulatory agencies.These regulations have evolved over time and have become morestrict with respect to both sulfur content and sulfur compoundemissions. We expect that this trend will continue, as EPA requiresgreater control over sulfur compound emissions and lower sulfurcontent in fossil fuels.
The primary environmental concern is sulfur dioxide (SO2), whichis produced from the combustion of fuels that contain sulfur as animpurity. Sulfur dioxide is directly harmful to health when inhaledand indirectly harmful because it generates acid rain.
Table C-19 shows the share of SO2 emissions by fossil fuel type.Because of coal’s chemical composition, typically containing 2 to6 weight percent sulfur, the mining, processing, transportation, andcombustion of coal account for 80 percent of domestic fossil fuelSO2 emissions. In contrast, the combustion of natural gas, whichhas a much lower Btu-to-sulfur ratio, generates approximately4 percent of total domestic SO2 emissions.
Table C-20 lists SO2 emissions for the major industries directlyaffected by environmental regulation. Electricity generation,through its high consumption of coal, is the major generator of SO2
emissions, accounting for about two-thirds of these emissions.Industrial combustion, primarily in industrial boilers, accounts forapproximately 18 percent of SO2 emissions. Reductions in
Sulfur’s detrimental impacton the environment has ledto regulations of the sulfurcontent of fossil fuels andthe sulfur emissions offacilities burning fossilfuels. Because sulfur isexpensive to remove, theseregulations have resulted ina price premium for low-sulfur-content fossil fuels.
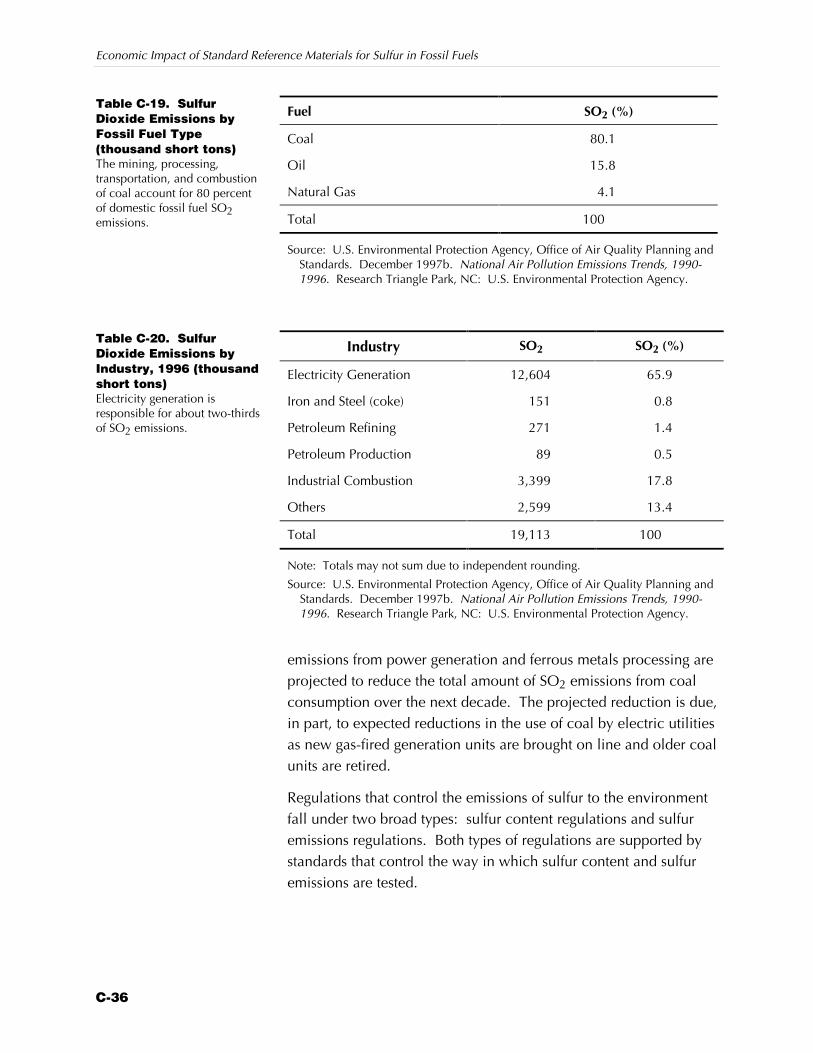
Economic Impact of Standard Reference Materials for Sulfur in Fossil Fuels
C-36
Fuel SO2 (%)
Coal 80.1
Oil 15.8
Natural Gas 4.1
Total 100
Source: U.S. Environmental Protection Agency, Office of Air Quality Planning andStandards. December 1997b. National Air Pollution Emissions Trends, 1990-1996. Research Triangle Park, NC: U.S. Environmental Protection Agency.
Industry SO2 SO2 (%)
Electricity Generation 12,604 65.9
Iron and Steel (coke) 151 0.8
Petroleum Refining 271 1.4
Petroleum Production 89 0.5
Industrial Combustion 3,399 17.8
Others 2,599 13.4
Total 19,113 100
Note: Totals may not sum due to independent rounding.
Source: U.S. Environmental Protection Agency, Office of Air Quality Planning andStandards. December 1997b. National Air Pollution Emissions Trends, 1990-1996. Research Triangle Park, NC: U.S. Environmental Protection Agency.
emissions from power generation and ferrous metals processing areprojected to reduce the total amount of SO2 emissions from coalconsumption over the next decade. The projected reduction is due,in part, to expected reductions in the use of coal by electric utilitiesas new gas-fired generation units are brought on line and older coalunits are retired.
Regulations that control the emissions of sulfur to the environmentfall under two broad types: sulfur content regulations and sulfuremissions regulations. Both types of regulations are supported bystandards that control the way in which sulfur content and sulfuremissions are tested.
Table C-19. SulfurDioxide Emissions byFossil Fuel Type(thousand short tons)The mining, processing,transportation, and combustionof coal account for 80 percentof domestic fossil fuel SO2emissions.
Table C-20. SulfurDioxide Emissions byIndustry, 1996 (thousandshort tons)Electricity generation isresponsible for about two-thirdsof SO2 emissions.
Appendix C — Profiles of Affected Industries
C-37
Sulfur Content Regulations
The Clean Air Act of 1970 authorized EPA to regulate productquality through specific formulations of gasoline and other fuels.The main national programs currently regulating sulfur content infossil fuels are the National Highway Diesel Fuel Program and theNational Ambient Air Quality Standards (NAAQS). The highwaydiesel fuel program required that the sulfur content of all highwaydiesel fuel be reduced from 0.5 percent (5,000 ppm) to0.05 percent (500 ppm) by October 1, 1993. California limits thesulfur content of diesel fuel to between 300 and 500 ppm.Reducing SO2 emissions from gasoline was one of the primarygoals included in the 1971 NAAQS. In addition, other provisionsof the Act limited the sulfur content in residual and distillate fueloils used by electric utilities and industrial plants.
New federal regulation promulgated under the Clean Air Act willlimit the sulfur content of gasoline by 2004. The federal legislation,formally proposed in May 1999, is known as “Tier 2” EmissionsStandards for Vehicles. It is based on actions taken by California toreduce motor vehicle emissions to improve air quality. Becauselow sulfur content of gasoline supports advanced emissions controltechnologies, California restricts the sulfur content of gasoline to nomore than 40 ppm or, alternatively, to a quarterly average of 30ppm with a cap of 80 ppm (EPA, 1998b). Federal regulations to bephased in by 2004 will set similar sulfur content levels for allgasoline sold in the U.S. Current and emerging sulfur contentregulations are an indirect result of efforts to limit automobileemissions of SO2 as well as other pollutants.
This legislation was prompted, in part, by tremendous progress intechnology to reduce emissions from gasoline-fueled vehicles. Theemissions performance of these low emissions vehicles (LEVs) isvery sensitive to the sulfur content of gasoline. Emissions controltechnology is often designed to meet the vehicle emission standardsof California, which currently has the most stringent vehicleemission standards in the world. The vehicles are also designed torun on the low-sulfur content gasoline sold in California. Whilegasoline in California averages less than 30 ppm and is limited tono more than 80 ppm, gasoline in the U.S. outside of Californiacurrently averages over 330 ppm and can reach levels as high as1,000 ppm (EPA, 1998b). This high sulfur level can significantly
Currently, the sulfurcontent of fuels used byindustry and EPA forfederal vehicle certificationcan differ substantially fromgasoline actually soldnationwide. Because theemissions performance ofLEVs is sensitive to thesulfur content of fossilfuels, these vehicles do notperform as well on the roadwith high-sulfur fuels asthey do during testing.
Economic Impact of Standard Reference Materials for Sulfur in Fossil Fuels
C-38
reduce catalyst performance and increase the emissions of thesevehicles. Low-sulfur gasoline is needed to enable the use ofadvanced emissions control technologies.
For these reasons, there was increasing momentum toward federalsulfur content regulation. In November 1997, the AmericanAutomobile Manufacturers Association (AAMA) and the Associationof International Automobile Manufactures (AIAM) petitioned EPA toestablish a national, year-round limit on gasoline sulfur. Theirrequest echoed California’s sulfur content limits. In California, thesulfur content of gasoline must not exceed 40 ppm on an annualaverage of 30 ppm. In addition, an individual gallon of gasolinemust not exceed 80 ppm. This request was based not only on itsimmediate impact on the industry’s ability to meet emissionsrequirements, but also on its importance for accommodating thenewest generation of automobile catalysts for LEVs and other newvehicle technologies.
The new Tier 2 emissions standards make California emissions thenational standard. Beginning in 2004, all cars and light trucks soldin the U.S., including sport utility vehicles, minivans, and pickuptrucks, will be equipped with advanced emissions controltechnologies. The impact of these technologies and low-sulfurgasoline will allow vehicles to be 77 to 95 percent cleaner thanthey are today (EPA, 1999).
Regulation of Sulfur Emissions
EPA regulates air emissions of SO2 from a variety of sources toreduce adverse health and environmental effects. Under the 1990Clean Air Act Amendments, EPA developed national emissionsstandards for 186 hazardous chemicals, including SO2 and sulfuroxide (SOx). National emissions standards for hazardous airpollutants (NESHAPs) regulations specify an emissions limit basedon what is achievable with a specific control technology and thechemical content of the inputs to the production process. Forexample, to achieve the limits, petroleum refineries using crude oilswith different levels of sulfur content may require different scrubbertechnologies on the catalytic cracker’s gas flue.
As a criteria pollutant, SO2 (combined with other sulfur oxides asSOx) is also regulated under new source review (NSR) and newsource performance standards (NSPSs). NSR requirements are
BP Amoco recentlyannounced that it willbegin selling low-sulfurgasoline in 40 citiesworldwide. Currently, BPAmoco’s Amoco Ultimategasoline has the industry’slowest sulfur content(outside of California) at200 ppm. BP Amoco’sgoal is to meet or exceedthe 2005 European goal of50 ppm (News andObserver, 1999).
Appendix C — Profiles of Affected Industries
C-39
typically conducted by state agencies. This program applies to newfacilities or expansion of existing facilities or process modificationsand requires facilities to meet lower achievable emission rate(LAER) standards compared to existing (unchanged) facilities. SO2
also falls under NAAQS and the acid rain program.
These emissions regulations affect all industries that use fossil fuelsas a fuel input, including petroleum refineries, coke and steelplants, utility boilers, and industrial boilers.
These regulations affect industries’ fuel choices and profitability.For example, public utilities commissions (PUCs) may have toapprove utilities’ fuel switching and emissions technology choices,and they define the way costs are treated in the rate base and howelectricity prices are established (Bohi, 1994). Emissions reductionshave typically been achieved by specifying pollution controltechnologies for SO2 emissions sources.
Air emissions from the stack gases from coal- and oil-fired boilersare primarily regulated through technology-based performancestandards included in state and local permits. These performancestandards commonly identify specific combustion technologies orend-of-pipe scrubber equipment that can be applied to individualunits (referred to as sources) to demonstrate compliance. Thesetechnologies may require coals of a specific sulfur content (EPA,1997a).
In addition to technology-based performance standards, generatingunits may also be subject to other local or regional environmentalregulations, including NAAQ standards, the Acid Rain Program,and the Acid Rain Allowance Trading Program.
NAAQ standards do not directly affect the fossil fuel electric powergeneration industry because they are not applied to individualsources. Rather, these standards are applied to the ambient air in aparticular area. Fossil fuel electric generators may be indirectlyaffected by these standards if they are located in or near an areawith nonattainment status. Generators in nonattainment areas maybe targeted for more stringent controls implemented through localoperating permits.
The Acid Rain Program was authorized by the Clean Air Act toreduce the adverse effects of acidic deposition on natural resources,
Economic Impact of Standard Reference Materials for Sulfur in Fossil Fuels
C-40
ecosystems, materials, visibility, and public health. The principalsources of acidic compounds are emissions of SO2 and NOx fromthe combustion of fossil fuels. To support the mandated reductionsin SO2 and NOx, EPA issued regulations requiring facilities in acidrain regions to install continuous emission monitoring systems(CEMS). In addition, all generating units in these regions over 25megawatts (and new units under 25 megawatts) that use fuel withsulfur content greater than 0.05 percent by weight are required tomeasure and report emissions under the Acid Rain Program (EPA,1997a).
The Acid Rain Allowance Trading Program is an innovativeapproach included in the 1990 Clean Air Act Amendmentsintended to reduce the costs of compliance while meeting the same(or improved) environmental objectives. The approach provides afirm with the flexibility to find the most cost-effective way ofachieving compliance through trading SO2 allowances. Thetrading system exploits the potential efficiency gain from equatingthe marginal cost of abatement (pollution reduction) for individualsources within a facility and across companies in a trading region(RFF, 1996). In the year 2001, steelmakers will join electric utilitiesin trading SO2 emissions allowances under Title IV of the Clean AirAct Amendments of 1990.
The market price for SO2 allowances is one measure of the impactof sulfur content on the value of fossil fuels. The allowance price isprimarily determined by the market availability of low-sulfur coaland the cost of purchasing and operating emissions abatementtechnologies, such as SO2 scrubbers. In June 1998, the marketprice for SO2 allowances hit a record high of $190 per ton (ACA,1998).
For facilities exceeding emissions limits (whether or not they areinadvertent), enforcement agencies can bring legal action resultingin fines, prison terms, or both. Individuals can be fined up to$25,000 per day for violations and can be sentenced to a year inprison. Corporations can be fined up to $1,000,000 for eachoffense. Furthermore, repeat offenders can have fines andsentences doubled.
Other remedies exist for facilities that cannot meet an emissionslimitation. Production rates can be reduced to reduce emissions, or
Individuals can befined up to $25,000per day forviolations and canbe sentenced to ayear in prison.Corporations can befined up to$1,000,000 for eachoffense.
Appendix C — Profiles of Affected Industries
C-41
agreements can be established with permitting agencies to allowfull production in exchange for emissions reductions in otherprocesses or for other actions acceptable to the agencies.
C.2.2 Sulfur’s Role in Product and Process Quality
In addition to its detrimental impact on the environment, sulfurcontent also affects the quality of products and processes that usefossil fuels. For example, catalysts for low-emissions vehicles aresensitive to the sulfur content of gasoline and diesel fuel. Similarly,the catalysts used in petroleum processing can be “poisoned” bysulfur; sulfur affects the technical quality of other petroleumproducts as well. Fuel oils used in heat-treating metals or in firingglass-melting furnaces must be low in sulfur to avoid damaging theproduct. The sulfur content of coke has an impact on the quality ofthe steel it is used to produce. As explained below, these technicalissues elevate the importance of accuracy and precision in themeasurement of sulfur content.
Sulfur Impact on Vehicle Catalysts
The technology for the low emissions vehicles of the future requireslow-sulfur fuels to operate efficiently. Sulfur in gasoline increasesexhaust emissions by decreasing the efficiency of the catalysts usedin current and advanced emissions control systems. The sulfuraffects the precious metals used in the catalyst; palladium isespecially sensitive to sulfur poisoning. Similarly, metal oxidesused to manage the oxygen concentrations in the exhaust are alsoaffected by sulfur (Hart’s Fuel Technology & Management’s Sulfur2000, 1998).
Sulfur in gasoline can also have a detrimental effect on emergingengine technologies. For example, the gasoline direct-injection(GDI) engine offers the promise of improved fuel economy,improved engine response under variable operating conditions, andmore rapid starting. However, performance of this technology issensitive to the sulfur content of gasoline. New fuel celltechnologies are also sensitive to the sulfur content of gasoline.
Economic Impact of Standard Reference Materials for Sulfur in Fossil Fuels
C-42
Sulfur in Other Petroleum-Based Products and inRefinery Processing
Other petroleum-based products are sensitive to the presence ofsulfur compounds. For example, undesirable sulfur compounds inbase oils used for lubricants lead to poor performance in lubricantproducts. However, sulfur is present in many of the additivesblended into the base oils to enhance performance. Base oil,additive, and lubricant product specifications typically includeallowable sulfur levels. Hence, monitoring sulfur levels for theseproducts is key to quality control.
Fuel oils used in heat-treating metals or in firing glass-meltingfurnaces must be low in sulfur to avoid damaging the product. Inaddition, some expensive process catalysts used in petroleum andchemical refining can be poisoned when trace amounts of sulfur-bearing materials are contained in feedstocks.
Steel
Sulfur is an undesirable property in steel except for specialpurposes. Sulfur with iron forms sulfide, which is soluble in theliquid metal and has a melting point lower than the otherconstituents of the iron. This phenomenon, called “hot-shortness,”may cause weaknesses in the steel. Sulfur also increases theshrinkage of the iron, increasing the difficulty of making accuratecastings, as well as the tendency to form cracks (which are a resultof the high shrinkage) (Lankford et al., 1985). As a result,specifications for the maximum allowable sulfur content in varioustypes of steel are on the order of 0.04 to 0.05 percent.
The major source of sulfur in the steel-making process is from coal,which is made into coke as described in Section C.1.2. Coal isprocessed into coke by a process called coking, which takes placein coke oven batteries. Coke that contains too much sulfur affectsthe productivity of the steel-making process as well as the sulfurcontent of the steel. Sulfur from the coke used in the blast furnacebecomes part of the slag, which is a by-product of the blast furnace(the other product is molten iron). A good deal of the sulfur isremoved from the blast furnace with the slag, which removes otherimpurities from the molten iron as well. If the coal contains toomuch sulfur, the volume of slag that is generated increases,
Scientists have determinedthat one factor contributingto the demise of TheTitanic was that the steelused in its construction hada high sulfur content,which caused it to bebrittle, especially undervery cold conditions(Modern Marvels, 1999).
Appendix C — Profiles of Affected Industries
C-43
decreasing the productivity of the blast furnace. Some sulfurremains dissolved in the iron (Lankford et al., 1985).
If the coal has too much sulfur, additional treatment is required toremove excess sulfur from the final product. After the iron isremoved from the blast furnace, it goes through a desulfurizationprocess. Flux materials are added to the iron, and the sulfur isremoved in a ladle prior to charging the iron to the steel-makingfurnace (Lankford et al., 1985).
C.3 USAGE OF NIST SRMS IN THE FOSSIL FUELINDUSTRYAs described in Section 3, NIST SRMs are used by the measurementand fossil fuel industries to develop CRMs, to calibrate instruments,and to check the accuracy of analytical methods. The chain oftraceability of all sulfur measurements to NIST SRMs begins withthe direct customers of NIST SRMS.
Figure C-8 shows the role that NIST SRMs play in the integrity ofthe measurement system. SRMs are developed using definitivemethods that are tied to the basic measurement units maintained atNIST. NIST definitive methods are methods involving highprecision primary techniques and have been critically evaluated forsources of bias in each specific application. SRMS are then used todevelop and evaluate reference methods, to ensure the accuracy ofsecondary reference materials, and to ensue accuracy in criticalquality assurance applications. Secondary reference materials andreference methods are then used to develop and evaluate fieldmethods to prepare working reference material such as calibrantsand to perform routine quality assurance activities. The integrity ofthis system is based on the quality of NIST SRMS and theirtraceability, through definitive methods, to the basic measurementunits.
C.3.1 How Industry Uses NIST SRMs
SRMs play an integral role in users’ quality control programs.Companies use SRMs in four ways: to calibrate equipment, todevelop and validate the accuracy of analytical methods, to prepare

Economic Impact of Standard Reference Materials for Sulfur in Fossil Fuels
C-44
Figure C-8. SRM Role in Measurement AccuracyNIST SRMs play an integral role in users’ quality control programs. They are used to develop and evaluate analyticalmethods, to produce secondary standards, and in quality assurance applications.
,�
BasicMeasurement
Units
,,,�
NISTSRMs
,9�
ReferenceMethods
9�
SecondaryReferenceMaterials
9,�
FieldMethods
,,�
DefinitiveMethods
é Reference MethodDevelopment and Evaluation
é Production of High-AccuracySecondary ReferenceMaterials
é Critical Quality AssuranceApplications
é Field Method Developmentand Evaluation
é Preparation of RoutineWorking ReferenceMaterials
é Routine Internal andExternal Quality Assurance
Field Applications
Source: Taylor, John K. 1993. Standard Reference Materials: Handbook for SRM Users. NIST Special Publication260-100. Washington, DC: U.S Government Printing Office. February.
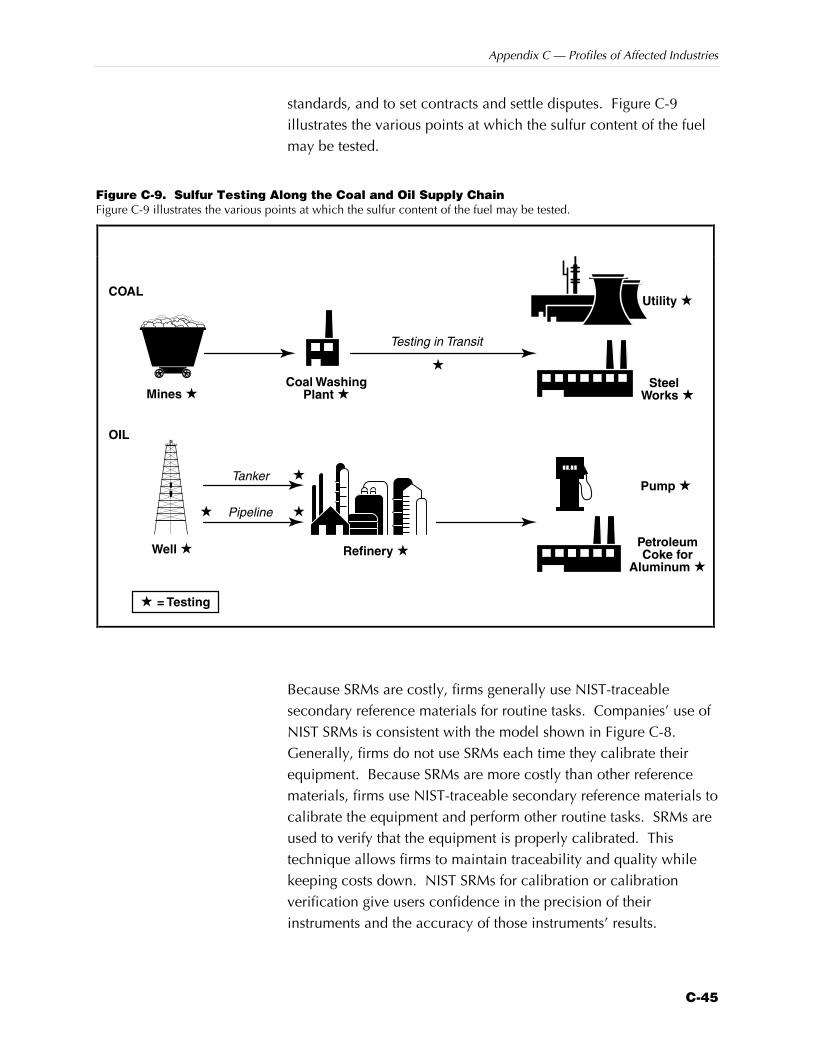
Appendix C — Profiles of Affected Industries
C-45
standards, and to set contracts and settle disputes. Figure C-9illustrates the various points at which the sulfur content of the fuelmay be tested.
Figure C-9. Sulfur Testing Along the Coal and Oil Supply ChainFigure C-9 illustrates the various points at which the sulfur content of the fuel may be tested.
Mines �Coal Washing
Plant �
COAL
OIL
Well � Refinery �
� = Testing
Pump �
Testing in Transit
�
�
��
Tanker
Pipeline
Steel Works �
PetroleumCoke for
Aluminum �
Utility �
Because SRMs are costly, firms generally use NIST-traceablesecondary reference materials for routine tasks. Companies’ use ofNIST SRMs is consistent with the model shown in Figure C-8.Generally, firms do not use SRMs each time they calibrate theirequipment. Because SRMs are more costly than other referencematerials, firms use NIST-traceable secondary reference materials tocalibrate the equipment and perform other routine tasks. SRMs areused to verify that the equipment is properly calibrated. Thistechnique allows firms to maintain traceability and quality whilekeeping costs down. NIST SRMs for calibration or calibrationverification give users confidence in the precision of theirinstruments and the accuracy of those instruments’ results.
Economic Impact of Standard Reference Materials for Sulfur in Fossil Fuels
C-46
Properly calibrated equipment is required for accurate sulfur-content testing and for applications development. Utilities,petroleum companies, coal companies, and other firms needproperly calibrated equipment to ensure that the fuel they havebought or sold meets the sulfur-content specifications detailed incontracts. There are financial, and often regulatory, penalties forfailing to meet those specifications. Equipment manufacturers useNIST SRMs to ensure that products are functioning properly and totest new prototypes.
NIST SRMs are also used in the production of certified referencematerials, or CRMs. Many firms produce CRMs for in-house use or tosell to other firms and NIST SRMs are used in the quality control andproduction processes. By using NIST SRMs to calibrate equipmentand validate equipment performance, CRM manufacturers make theirproducts traceable to NIST. NIST traceability is a key component of aCRM manufacturer’s credibility.
SRMs also support the analytical methods used by firms to takemeasurements and develop products and services. Indeed, manystandard analytical methods call for SRMs because they are easilyobtainable and authoritative. SRMs also allow firms to moreaccurately determine the bias of the methods they are using.
In addition, SRMs provide a common, independent benchmarkfrom which industry can develop product specifications and legallybinding contracts. Natural matrix SRMs are superior to otherreference materials because they are certified using criticallyevaluated methods. SRMs lend credibility and legal defensibility tomeasurements.
When disputes over measurement accuracy arise between firms,SRMs are used as a referee material. For example, if a firmpurchases a sulfur analyzer and later complains that instrument isnot functioning properly, the manufacturer will validate theaccuracy of the instrument’s measurements using NIST SRMs.Generally, fuel contracts will explicitly state that in the event of adispute over a fuel’s sulfur content or the precision of an instrumentthat ASTM methods and NIST SRMs will be used to referee thedispute settlement.
Regulatory agencies use SRMs to support their quality controlprograms, which in turn play an important role in regulatory
Appendix C — Profiles of Affected Industries
C-47
enforcement. To reduce the possibility of being out of compliancewith environmental regulations, regulators and industry prefer touse the same standards and methods.
Regulators use SRMs to verify the calibration of their laboratoryinstruments with NIST SRMs. Like industry, regulators use NIST-traceable CRMs, which they may have purchased or prepared in-house, to calibrate equipment. The more expensive NIST SRMs areused at regular intervals to ensure the equipment is functioningproperly.
NIST’s SRM program supports the reproducibility and accuracy ofthe ASTM methods used to determine compliance by providing anauthoritative primary standard. If SRMs were not available, greateruncertainty might occur regarding whether a plant was incompliance. Disagreements between a company and theregulatory agency regarding whether a plant was in compliancemight result should a primary standard not be available.
C.3.2 SRM Customers
Table C-21 classifies the customers of the NIST SRMs under studyfor the past 9 years and shows the number of units purchased byeach class of customers. From 1982 to early 1999, 2,954 differentorganizations purchased 45,673 units of sulfur fossil fuel SRMs.
Each level of the supply chain shown in Figure C-1 is representedamong NIST’s customers. As one would expect, among the largestgroup of customers are members of the sulfur measurement industryand members of the fuel extraction and processing industries.Public utilities are also important customers.
NIST SRMs are also purchased by users not specifically shown inFigure C-1. These companies include other U.S. industrialcustomers, such as cement and stone manufacturers, chemicalsmanufacturers, paper and allied products companies, and wastemanagement companies. These companies could be using NISTSRMs to support sulfur measurements required for compliance withenvironmental regulations on industrial boilers. U.S. federal, state,and local governments also purchase NIST SRMs for environmentalcompliance purposes, and a number of foreign companies,universities, laboratories, and governments also purchase NISTSRMs for sulfur in fossil fuels.
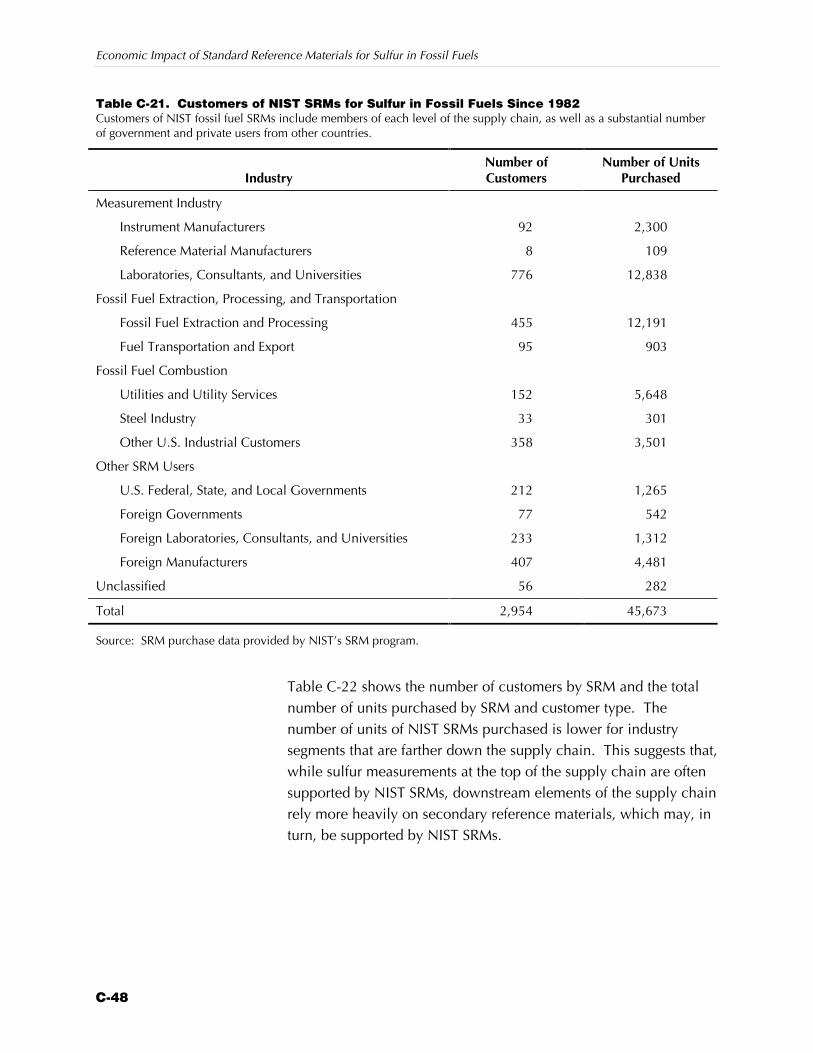
Economic Impact of Standard Reference Materials for Sulfur in Fossil Fuels
C-48
Table C-21. Customers of NIST SRMs for Sulfur in Fossil Fuels Since 1982Customers of NIST fossil fuel SRMs include members of each level of the supply chain, as well as a substantial numberof government and private users from other countries.
IndustryNumber ofCustomers
Number of UnitsPurchased
Measurement Industry
Instrument Manufacturers 92 2,300
Reference Material Manufacturers 8 109
Laboratories, Consultants, and Universities 776 12,838
Fossil Fuel Extraction, Processing, and Transportation
Fossil Fuel Extraction and Processing 455 12,191
Fuel Transportation and Export 95 903
Fossil Fuel Combustion
Utilities and Utility Services 152 5,648
Steel Industry 33 301
Other U.S. Industrial Customers 358 3,501
Other SRM Users
U.S. Federal, State, and Local Governments 212 1,265
Foreign Governments 77 542
Foreign Laboratories, Consultants, and Universities 233 1,312
Foreign Manufacturers 407 4,481
Unclassified 56 282
Total 2,954 45,673
Source: SRM purchase data provided by NIST’s SRM program.
Table C-22 shows the number of customers by SRM and the totalnumber of units purchased by SRM and customer type. Thenumber of units of NIST SRMs purchased is lower for industrysegments that are farther down the supply chain. This suggests that,while sulfur measurements at the top of the supply chain are oftensupported by NIST SRMs, downstream elements of the supply chainrely more heavily on secondary reference materials, which may, inturn, be supported by NIST SRMs.
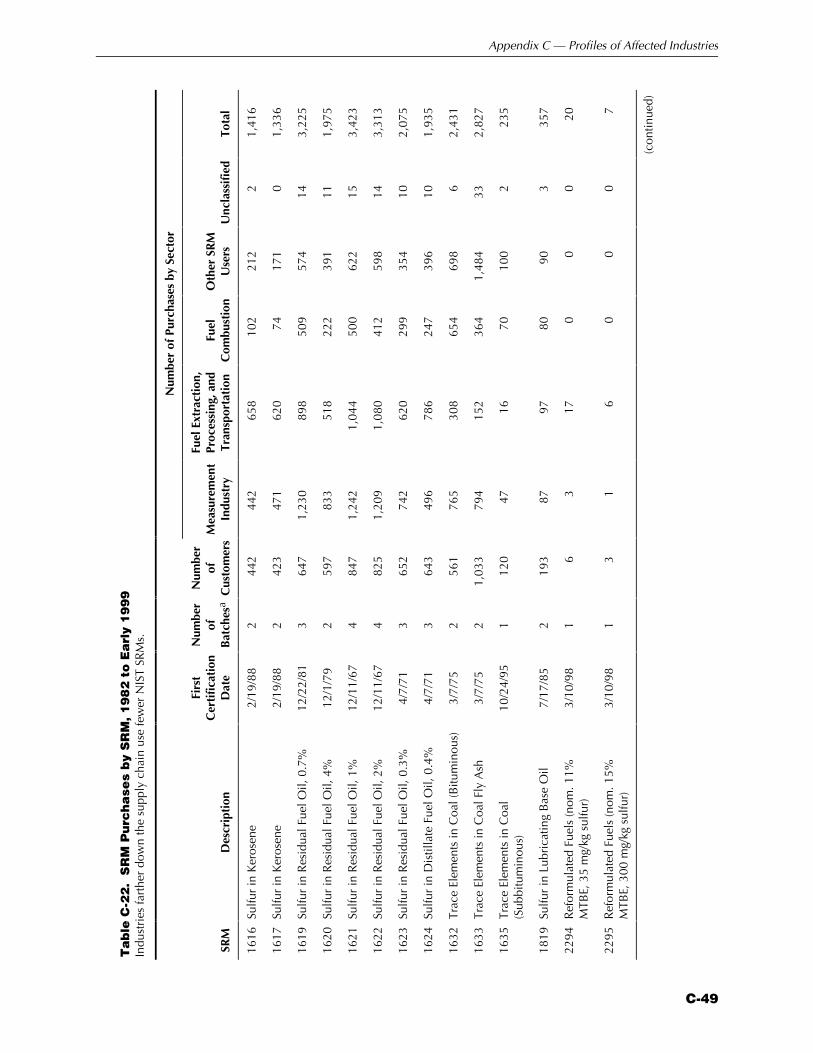
Appendix C — Profiles of Affected Industries
C-49
Ta
ble
C-2
2. S
RM
Pu
rch
ase
s b
y S
RM
, 1
98
2 t
o E
arl
y 1
99
9In
dust
ries
fart
her
dow
n th
e su
pply
cha
in u
se fe
wer
NIS
T SR
Ms.
Num
ber
of P
urch
ases
by
Sect
or
SRM
Des
crip
tion
Firs
tC
erti
ficat
ion
Dat
e
Num
ber
ofB
atch
esa
Num
ber
ofC
usto
mer
sM
easu
rem
ent
Indu
stry
Fuel
Ext
ract
ion,
Proc
essi
ng, a
ndTr
ansp
orta
tion
Fuel
Com
bust
ion
Oth
er S
RM
Use
rsU
ncla
ssif
ied
Tota
l
1616
Sulfu
r in
Ker
osen
e2/
19/8
82
442
442
658
102
212
21,
416
1617
Sulfu
r in
Ker
osen
e2/
19/8
82
423
471
620
7417
10
1,33
6
1619
Sulfu
r in
Res
idua
l Fue
l Oil,
0.7
%12
/22/
813
647
1,23
089
850
957
414
3,22
5
1620
Sulfu
r in
Res
idua
l Fue
l Oil,
4%
12/1
/79
259
783
351
822
239
111
1,97
5
1621
Sulfu
r in
Res
idua
l Fue
l Oil,
1%
12/1
1/67
484
71,
242
1,04
450
062
215
3,42
3
1622
Sulfu
r in
Res
idua
l Fue
l Oil,
2%
12/1
1/67
482
51,
209
1,08
041
259
814
3,31
3
1623
Sulfu
r in
Res
idua
l Fue
l Oil,
0.3
%4/
7/71
365
274
262
029
935
410
2,07
5
1624
Sulfu
r in
Dis
tilla
te F
uel O
il, 0
.4%
4/7/
713
643
496
786
247
396
101,
935
1632
Trac
e El
emen
ts in
Coa
l (B
itum
inou
s)3/
7/75
256
176
530
865
469
86
2,43
1
1633
Trac
e El
emen
ts in
Coa
l Fly
Ash
3/7/
752
1,03
379
415
236
41,
484
332,
827
1635
Trac
e El
emen
ts in
Coa
l(S
ubbi
tum
inou
s)10
/24/
951
120
4716
7010
02
235
1819
Sulfu
r in
Lub
rica
ting
Bas
e O
il7/
17/8
52
193
8797
8090
335
7
2294
Ref
orm
ulat
ed F
uels
(nom
. 11%
MTB
E, 3
5 m
g/kg
sul
fur)
3/10
/98
16
317
00
020
2295
Ref
orm
ulat
ed F
uels
(nom
. 15%
MTB
E, 3
00 m
g/kg
sul
fur)
3/10
/98
13
16
00
07
(con
tinue
d)
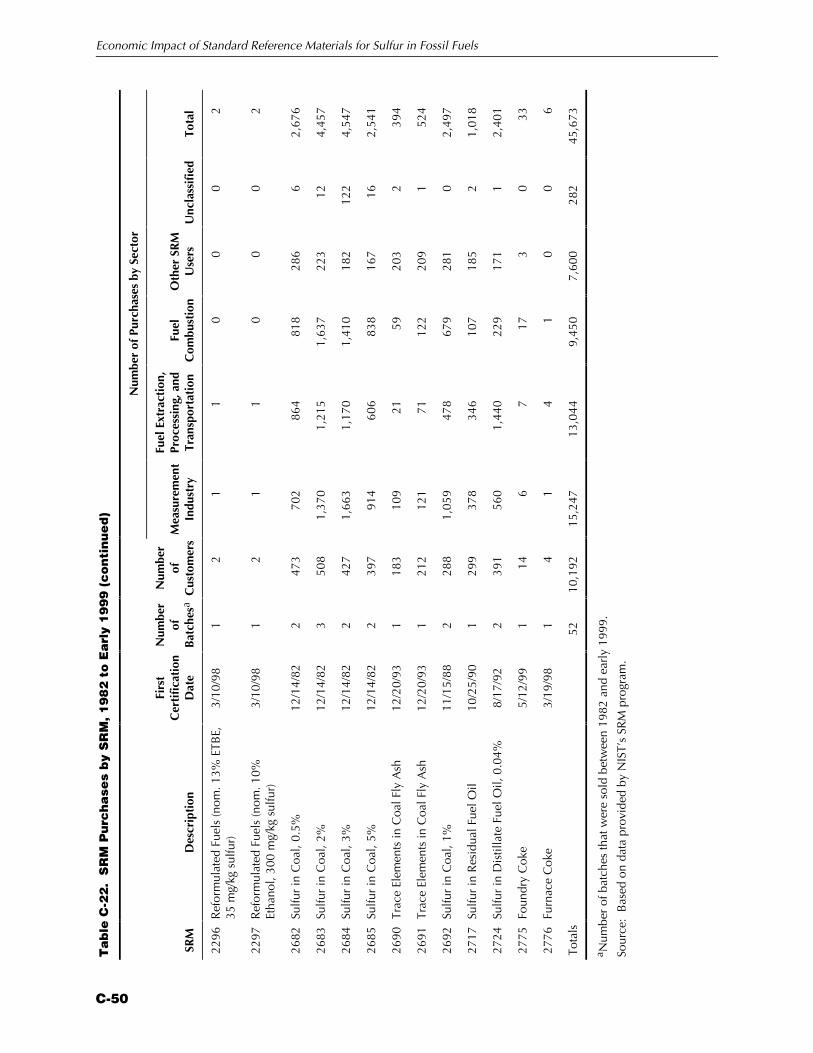
Economic Impact of Standard Reference Materials for Sulfur in Fossil Fuels
C-50
Ta
ble
C-2
2. S
RM
Pu
rch
ase
s b
y S
RM
, 1
98
2 t
o E
arl
y 1
99
9 (
co
nti
nu
ed
)
Num
ber
of P
urch
ases
by
Sect
or
SRM
Des
crip
tion
Firs
tC
erti
ficat
ion
Dat
e
Num
ber
ofB
atch
esa
Num
ber
ofC
usto
mer
sM
easu
rem
ent
Indu
stry
Fuel
Ext
ract
ion,
Proc
essi
ng, a
ndTr
ansp
orta
tion
Fuel
Com
bust
ion
Oth
er S
RM
Use
rsU
ncla
ssif
ied
Tota
l
2296
Ref
orm
ulat
ed F
uels
(nom
. 13%
ETB
E,35
mg/
kg s
ulfu
r)3/
10/9
81
21
10
00
2
2297
Ref
orm
ulat
ed F
uels
(nom
. 10%
Etha
nol,
300
mg/
kg s
ulfu
r)3/
10/9
81
21
10
00
2
2682
Sulfu
r in
Coa
l, 0.
5%12
/14/
822
473
702
864
818
286
62,
676
2683
Sulfu
r in
Coa
l, 2%
12/1
4/82
350
81,
370
1,21
51,
637
223
124,
457
2684
Sulfu
r in
Coa
l, 3%
12/1
4/82
242
71,
663
1,17
01,
410
182
122
4,54
7
2685
Sulfu
r in
Coa
l, 5%
12/1
4/82
239
791
460
683
816
716
2,54
1
2690
Trac
e El
emen
ts in
Coa
l Fly
Ash
12/2
0/93
118
310
921
5920
32
394
2691
Trac
e El
emen
ts in
Coa
l Fly
Ash
12/2
0/93
121
212
171
122
209
152
4
2692
Sulfu
r in
Coa
l, 1%
11/1
5/88
228
81,
059
478
679
281
02,
497
2717
Sulfu
r in
Res
idua
l Fue
l Oil
10/2
5/90
129
937
834
610
718
52
1,01
8
2724
Sulfu
r in
Dis
tilla
te F
uel O
il, 0
.04%
8/17
/92
239
156
01,
440
229
171
12,
401
2775
Foun
dry
Cok
e5/
12/9
91
146
717
30
33
2776
Furn
ace
Cok
e3/
19/9
81
41
41
00
6
Tota
ls52
10,1
9215
,247
13,0
449,
450
7,60
028
245
,673
a Num
ber
of b
atch
es th
at w
ere
sold
bet
wee
n 19
82 a
nd e
arly
199
9.
Sour
ce:
Bas
ed o
n da
ta p
rovi
ded
by N
IST’
s SR
M p
rogr
am.