Embed Size (px)
Citation preview
Economic Impact of SARS in Hong KongEconomic Impact of SARS in Hong Kong
Economic Impact of SARS:The Case of Hong Kong*
Alan SiuAssociate ProfessorSchool of Economics andFinanceThe University of Hong KongK. K. Leung BuildingRoom 1021Pokfulam RoadHong Kong, SAR, [email protected]
Y. C. Richard WongProfessor of Economics andDeanFaculty of Business andEconomicsThe University of Hong KongMeng Wah Complex, 7/FPokfulam RoadHong Kong, SAR, [email protected]
Asian Economic Papers 3:1 © 2004 The Earth Institute at Columbia University and the Massachusetts
Institute of Technology
AbstractSARS is the first deadly infectious disease of the 21st century. Itstarted in the Chinese province of Guangdong in November2002, and by August 2003, it had spread to 29 countries and 3 re-gions, with a cumulative total of 8,422 cases and 916 deaths. Thispaper describes the spread of the disease in Hong Kong and dis-cusses its impact on the economy. SARS was an unexpected nega-tive shock. The most significant negative effects were on the de-mand side, with local consumption and the export of servicesrelated to tourism and air travel severely affected in the short run.The economy did not experience a supply shock, as the manufac-turing base in the Pearl River Delta was unaffected, and goodscontinued to be exported through Hong Kong normally. Initialalarmist reports and estimates about the negative economic im-pacts were not borne out. Fear and panic subsided quickly oncethe outbreak was under control, and the economy reboundedrapidly.
1. Introduction
The World Health Organization (WHO) issued a globalalert about a deadly new infectious disease on 12 March2003. Three days later WHO named the disease severeacute respiratory syndrome (SARS). By 7 August 2003, thedisease had spread to 29 countries and 3 regions, with acumulative total of 8,422 cases and 916 deaths. The mostseverely affected areas were mainland China, Hong Kong,Taiwan, and Singapore. Within mainland China, the areas
* Financial support from the Hong Kong Institute of Economicsand Business Strategy of The University of Hong Kong fundedas an Area of Excellence by the University Grants Committee ofHong Kong is gratefully acknowledged. Eva Chan and JuneSieh provided excellent research assistance.
hardest hit were Guangdong, Beijing, Shanxi, and Inner Mongolia. The outbreakstarted in the Chinese province of Guangdong and was carried to Hong Kong, andfrom there SARS spread to other parts of the world, including Beijing and otherparts of China.
WHO set up a collaborative network of research labs to identify the virus causingSARS. Within weeks of the outbreak in Hong Kong, scientists at The University ofHong Kong had identiªed a new strain of coronavirus as the probable culprit. Thisvirus is highly contagious and can be fatal. Health care workers are particularly atrisk of infection. The exact mechanisms of transmission are still in doubt, but the vi-rus seems to be spread by intimate contact through transmission of droplets. One isunlikely to contract SARS from merely being in the vicinity of an infected individ-ual, because the virus does not appear to be airborne; however, the virus can surviveon objects such as doorknobs or elevator buttons for more than 24 hours. Hence, it ispossible to catch the disease by touching contaminated objects. Wearing face masksand washing hands vigorously using liquid soap are recommended as precaution-ary measures. There has been no report of transmission of the disease across interna-tional borders via contaminated cargo. These features of the virus suggest that quickand effective isolation of infected individuals and quarantine of those who havebeen in close contact with them are the key measures for limiting the spread of thedisease.
2. Spread of SARS in Hong Kong
SARS ªrst broke out in November 2002 in Foshan, which is near Guangzhou, in theChinese province of Guangdong. The virus made its way to other parts of the PearlRiver Delta by February 2003. China’s Ministry of Health informed WHO in mid-February 2003 of the occurrence in Guangdong province of 305 cases of “atypicalpneumonia” and reported that the spread of the illness was “under control.” Localmedia reported the outbreak, and the news spread around the Pearl River Delta re-gion through thousands of cell phone text messages. Hong Kong was alerted by thenews that people across the border were stocking up on Chinese herbal medicinesand boiling vinegar as a folk remedy to ward off the deadly unknown illness.
Because the world was kept in the dark about the seriousness of the outbreak inGuangdong, Hong Kong was caught unprepared when SARS ªrst appeared in theterritory via an elderly medical doctor from Guangzhou who had been treating“atypical pneumonia” patients. The doctor checked into room 911 of the MetropoleHong Kong Hotel on 21 February 2003 to attend a wedding reception, and he wasadmitted to a nearby hospital the next day. He informed the medical staff that he
63 Asian Economic Papers
Economic Impact of SARS in Hong Kong
was highly infectious, and he was promptly isolated. He later died after infecting anurse in the hospital.
The Guangzhou doctor, during his 1-day stay at the hotel, infected at least 10 otherguests staying on the same ºoor of the hotel. All these guests were overseas visitorsexcept for a Hong Kong resident who was visiting the hotel. The infected visitorssubsequently ignited outbreaks in Vietnam, Singapore, and Toronto, and the localresident (an airport worker) became the index patient at the Prince of Wales Hospi-tal. The airport worker developed SARS symptoms on 24 February but did not seektreatment at the hospital until 4 March. He was admitted into Ward 8A, where he in-fected over 100 people, including patients, visitors, medical students, nurses, anddoctors. Hospital emergency services had to be suspended temporarily.
In mid-March 2003, the Hong Kong public was told that the outbreak was conªnedto hospitals and was not spreading in the community. No isolation measures wereadopted; for instance, Prince of Wales Hospital was not cordoned off. The authori-ties had to face reality when SARS broke out in a multistoried housing estate, AmoyGardens. On 29 March, 22 of the 45 new SARS cases hospitalized in Hong Kongwere residents of Amoy Gardens. On the following day, 36 of the 60 new patientsadmitted to the hospital with probable SARS were residents of Amoy Gardens,bringing the cumulative total of infected residents to 213. Of these 213 patients, 107resided in Block E of Amoy Gardens. In addition, most of them lived in ºats thatwere oriented vertically relative to each other, which suggested that besides closeperson-to-person contact, SARS might have been spreading by other environmentalmeans.
The Hong Kong Department of Health issued an unprecedented quarantine order toprevent the further spread of SARS in the community. The isolation order requiredresidents of Block E of Amoy Gardens to remain in their ºats for 10 days. When thepolice carried out the order, they found no one home in well over half of the block’s264 apartments. Residents had learned about the Amoy Gardens outbreak via themedia and many had left their homes long before the authorities arrived. SARS wasclearly spreading in the community.
Fear of the SARS virus took root in the whole city. Face masks were selling brisklyand could be seen everywhere. Public places were disinfected several times a day.People washed their hands much more frequently and avoided going out tocrowded places. Restaurants, shops, cinemas, and other entertainment venues weredeserted. Many businesses suffered severe losses of income. Schools were ªnallyclosed to limit the spread of the virus.
64 Asian Economic Papers
Economic Impact of SARS in Hong Kong
All household contacts of conªrmed or suspected SARS patients were required toremain isolated in their homes for monitoring and treatment, up to a maximum of10 days. At the end of the outbreak, a total of 1,262 persons from 493 householdswere affected by this isolation order, and 34 of them subsequently came down withSARS (SARS Expert Committee 2003). The government did not compensate the indi-viduals for their conªnement, but it did provide daily necessities and ªnancial assis-tance. The police enforced the order by checking up on conªned individuals at theirhomes. Violators were sent warning letters.
Since 29 March 2003, health ofªcials tried to identify travelers who displayed SARSsymptoms at the airport and other border control points. All incoming travelers arenow required to complete a health declaration form. Temperature checks for all ar-riving, departing, and transit passengers at the airport were implemented in mid-April 2003. Temperature-screening devices were installed at other border controlpoints in late April of that year. As of 7 September, 83 persons had been referred tohospitals for suspected SARS, and 2 of them were later conªrmed to have been in-fected (SARS Expert Committee 2003). Since these measures were implemented, noSARS cases have been reported as having originated from Hong Kong.
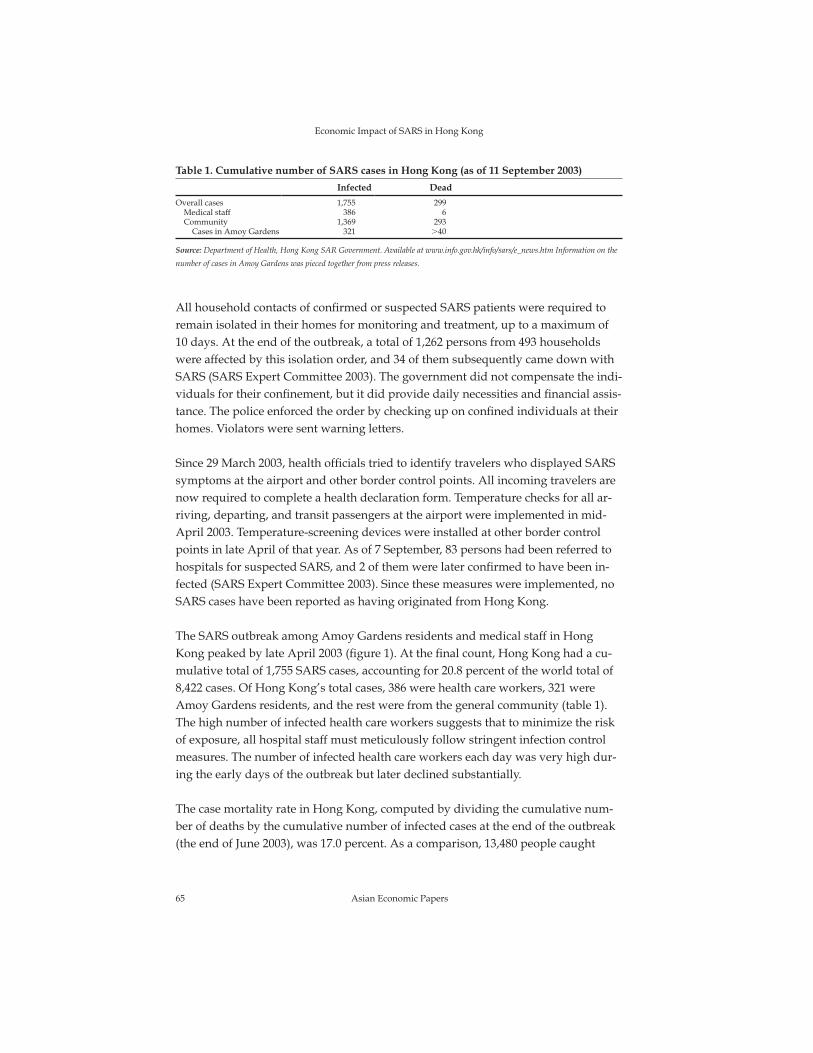
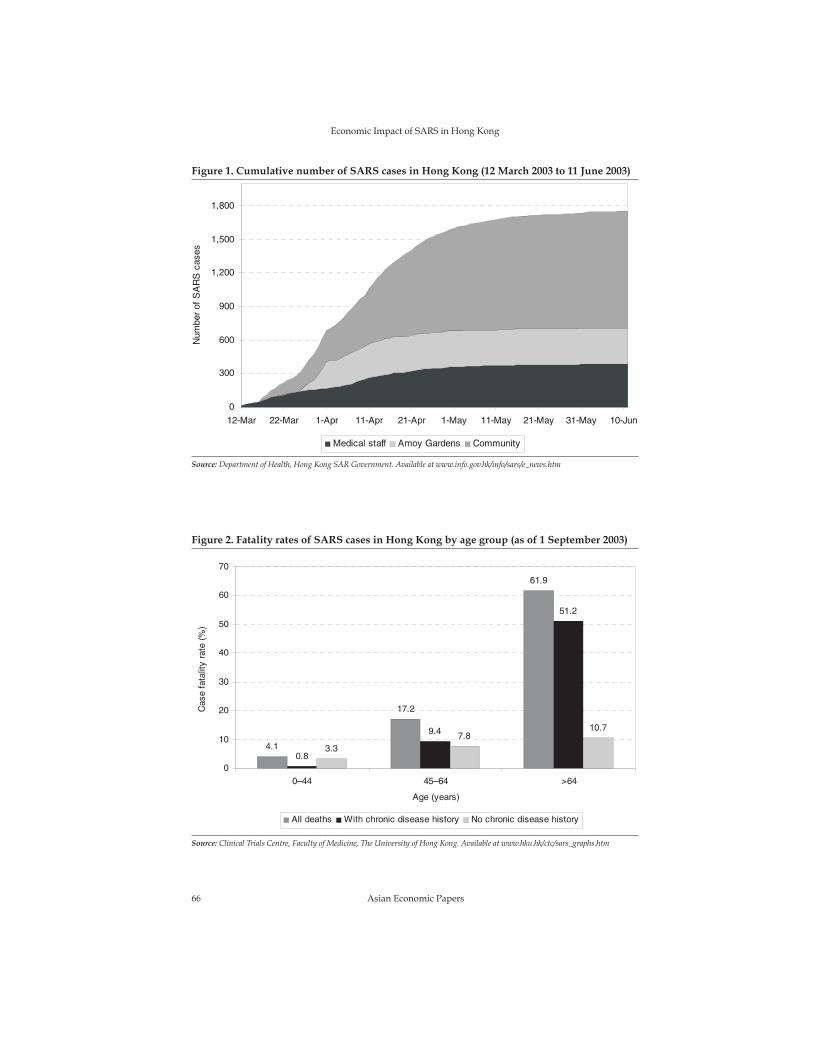
The SARS outbreak among Amoy Gardens residents and medical staff in HongKong peaked by late April 2003 (ªgure 1). At the ªnal count, Hong Kong had a cu-mulative total of 1,755 SARS cases, accounting for 20.8 percent of the world total of8,422 cases. Of Hong Kong’s total cases, 386 were health care workers, 321 wereAmoy Gardens residents, and the rest were from the general community (table 1).The high number of infected health care workers suggests that to minimize the riskof exposure, all hospital staff must meticulously follow stringent infection controlmeasures. The number of infected health care workers each day was very high dur-ing the early days of the outbreak but later declined substantially.
The case mortality rate in Hong Kong, computed by dividing the cumulative num-ber of deaths by the cumulative number of infected cases at the end of the outbreak(the end of June 2003), was 17.0 percent. As a comparison, 13,480 people caught
65 Asian Economic Papers
Economic Impact of SARS in Hong Kong
Table 1. Cumulative number of SARS cases in Hong Kong (as of 11 September 2003)
Infected Dead
Overall cases 1,755 299Medical staff 386 6Community 1,369 293
Cases in Amoy Gardens 321 �40
Source: Department of Health, Hong Kong SAR Government. Available at www.info.gov.hk/info/sars/e_news.htm Information on the
number of cases in Amoy Gardens was pieced together from press releases.
66 Asian Economic Papers
Economic Impact of SARS in Hong Kong
Figure 1. Cumulative number of SARS cases in Hong Kong (12 March 2003 to 11 June 2003)
Source: Department of Health, Hong Kong SAR Government. Available at www.info.gov.hk/info/sars/e_news.htm
Figure 2. Fatality rates of SARS cases in Hong Kong by age group (as of 1 September 2003)
Source: Clinical Trials Centre, Faculty of Medicine, The University of Hong Kong. Available at www.hku.hk/ctc/sars_graphs.htm
pneumonia in Hong Kong in 2002, and the case mortality rate was 17.5 percent(SARS Expert Committee 2003). The SARS mortality rate for young people (less than44 years of age) was low, whereas fatality rates were signiªcantly higher for the el-derly population, particularly older patients with a history of chronic disease(ªgure 2). Of the 299 SARS patients from Hong Kong who died, 191 were 65 yearsor older, and 158 of these cases had a history of chronic disease (table 2).
3. Hong Kong’s economy when SARS arrived
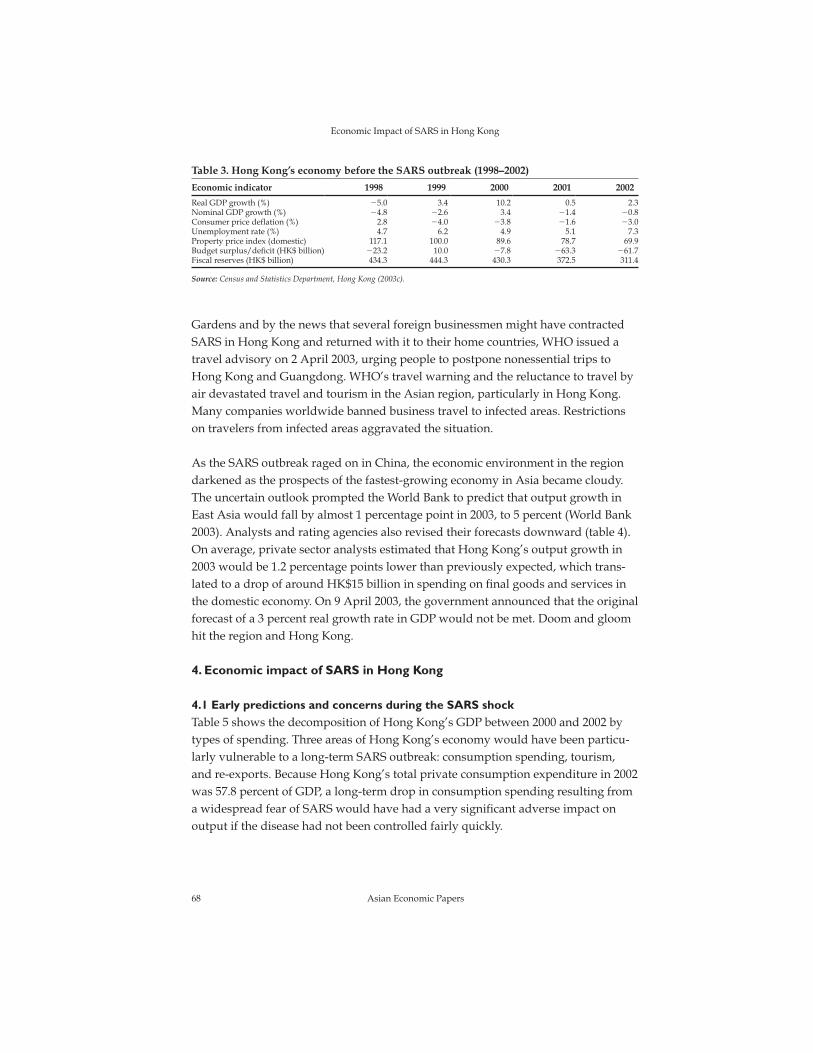
Since the onset of the Asian ªnancial crisis, Hong Kong’s economy has faced an un-favorable external environment. Financial liquidity in Asia drained away in the cri-sis and its aftermath. Hong Kong’s link to the U.S. dollar through a currency boardarrangement did not improve matters. The Hong Kong dollar appreciated in valuealong with the strengthening U.S. dollar during 1999–2002. Investment demand forhousing collapsed at the same time that the housing supply began to soar. Althoughnominal mortgage interest rates were kept low in a globally low-interest-rate envi-ronment, the true borrowing cost was high in real terms, with deºation ploddingalong at 2–4 percent per year (table 3). Households were struggling to pay downtheir mortgage debts after the housing-market bubble burst. Domestic consumptionwas shrinking, and the economy was contracting. Hong Kong’s unemployment ratehit record levels, exceeding 7 percent by the end of 2002. The unemployment prob-lem was made worse by the continuous inºow of low-skilled immigrants frommainland China.
Beginning in 2003, signs of economic recovery had appeared. Real GDP in HongKong grew at 3.4 percent in 2002:Q3 and at 5.1 percent in 2002:Q4. In late spring of2003, exports from China picked up very strongly, and cargo movement in HongKong ports and airports showed good growth. Thus, the outbreak of SARS hitHong Kong at a very bad time. Domestic demand collapsed before it had an oppor-tunity to recover from the recession in 2001. Alarmed by the outbreak at the Amoy
67 Asian Economic Papers
Economic Impact of SARS in Hong Kong
Table 2. Fatal SARS cases in Hong Kong (as of 11 September 2003)
Number of fatal cases
TotalWith history ofchronic disease
No history ofchronic disease
Overall fatal cases 299 201 98Male 168 108 60Female 129 91 38Unknown 2 2 0
Fatal cases aged 0–64 years 108 43 65Fatal cases aged 65 years or older 191 158 33
Source: Department of Health, Hong Kong SAR Government. Available at www.info.gov.hk/info/sars/e_news.htm
Gardens and by the news that several foreign businessmen might have contractedSARS in Hong Kong and returned with it to their home countries, WHO issued atravel advisory on 2 April 2003, urging people to postpone nonessential trips toHong Kong and Guangdong. WHO’s travel warning and the reluctance to travel byair devastated travel and tourism in the Asian region, particularly in Hong Kong.Many companies worldwide banned business travel to infected areas. Restrictionson travelers from infected areas aggravated the situation.
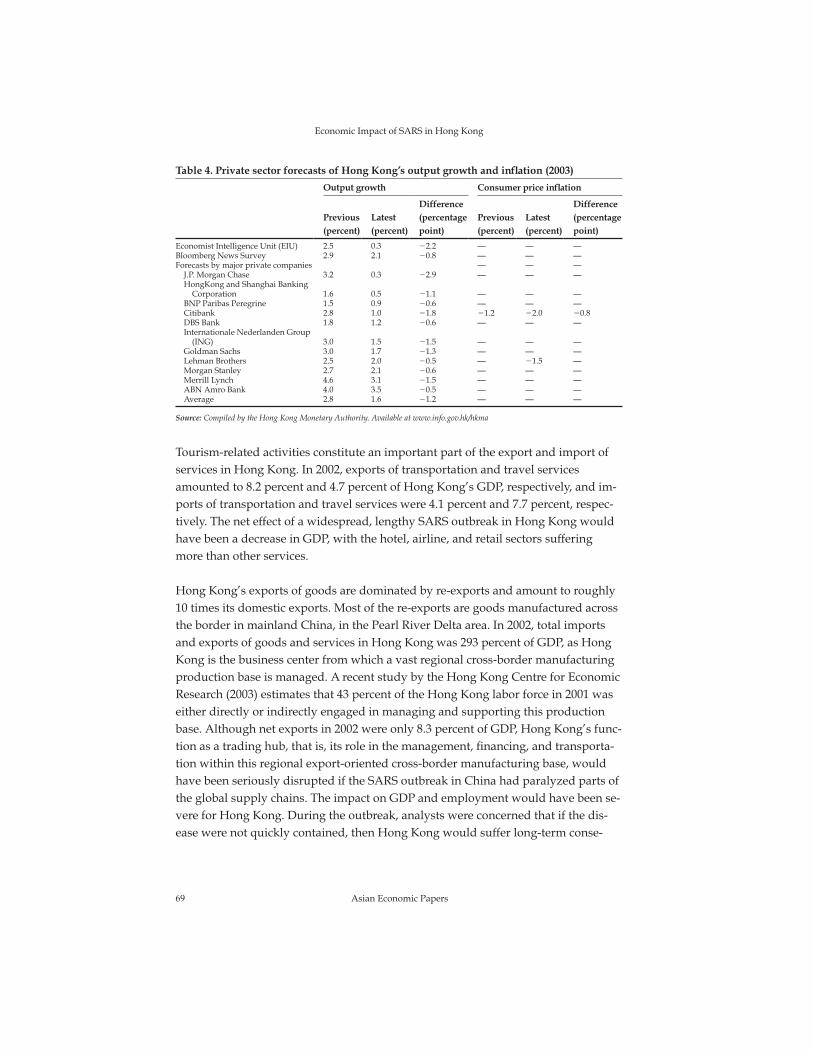
As the SARS outbreak raged on in China, the economic environment in the regiondarkened as the prospects of the fastest-growing economy in Asia became cloudy.The uncertain outlook prompted the World Bank to predict that output growth inEast Asia would fall by almost 1 percentage point in 2003, to 5 percent (World Bank2003). Analysts and rating agencies also revised their forecasts downward (table 4).On average, private sector analysts estimated that Hong Kong’s output growth in2003 would be 1.2 percentage points lower than previously expected, which trans-lated to a drop of around HK$15 billion in spending on ªnal goods and services inthe domestic economy. On 9 April 2003, the government announced that the originalforecast of a 3 percent real growth rate in GDP would not be met. Doom and gloomhit the region and Hong Kong.
4. Economic impact of SARS in Hong Kong
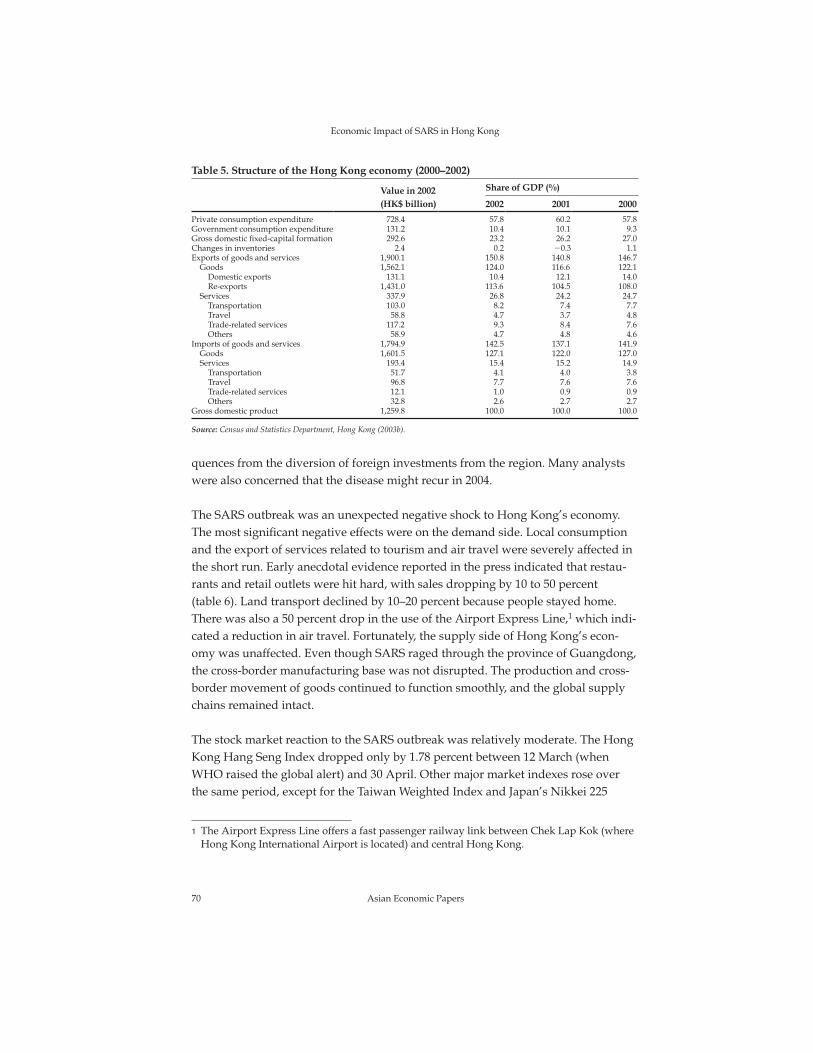
4.1 Early predictions and concerns during the SARS shockTable 5 shows the decomposition of Hong Kong’s GDP between 2000 and 2002 bytypes of spending. Three areas of Hong Kong’s economy would have been particu-larly vulnerable to a long-term SARS outbreak: consumption spending, tourism,and re-exports. Because Hong Kong’s total private consumption expenditure in 2002was 57.8 percent of GDP, a long-term drop in consumption spending resulting froma widespread fear of SARS would have had a very signiªcant adverse impact onoutput if the disease had not been controlled fairly quickly.
68 Asian Economic Papers
Economic Impact of SARS in Hong Kong
Table 3. Hong Kong’s economy before the SARS outbreak (1998–2002)
Economic indicator 1998 1999 2000 2001 2002
Real GDP growth (%) �5.0 3.4 10.2 0.5 2.3Nominal GDP growth (%) �4.8 �2.6 3.4 �1.4 �0.8Consumer price deºation (%) 2.8 �4.0 �3.8 �1.6 �3.0Unemployment rate (%) 4.7 6.2 4.9 5.1 7.3Property price index (domestic) 117.1 100.0 89.6 78.7 69.9Budget surplus/deªcit (HK$ billion) �23.2 10.0 �7.8 �63.3 �61.7Fiscal reserves (HK$ billion) 434.3 444.3 430.3 372.5 311.4
Source: Census and Statistics Department, Hong Kong (2003c).
Tourism-related activities constitute an important part of the export and import ofservices in Hong Kong. In 2002, exports of transportation and travel servicesamounted to 8.2 percent and 4.7 percent of Hong Kong’s GDP, respectively, and im-ports of transportation and travel services were 4.1 percent and 7.7 percent, respec-tively. The net effect of a widespread, lengthy SARS outbreak in Hong Kong wouldhave been a decrease in GDP, with the hotel, airline, and retail sectors sufferingmore than other services.
Hong Kong’s exports of goods are dominated by re-exports and amount to roughly10 times its domestic exports. Most of the re-exports are goods manufactured acrossthe border in mainland China, in the Pearl River Delta area. In 2002, total importsand exports of goods and services in Hong Kong was 293 percent of GDP, as HongKong is the business center from which a vast regional cross-border manufacturingproduction base is managed. A recent study by the Hong Kong Centre for EconomicResearch (2003) estimates that 43 percent of the Hong Kong labor force in 2001 waseither directly or indirectly engaged in managing and supporting this productionbase. Although net exports in 2002 were only 8.3 percent of GDP, Hong Kong’s func-tion as a trading hub, that is, its role in the management, ªnancing, and transporta-tion within this regional export-oriented cross-border manufacturing base, wouldhave been seriously disrupted if the SARS outbreak in China had paralyzed parts ofthe global supply chains. The impact on GDP and employment would have been se-vere for Hong Kong. During the outbreak, analysts were concerned that if the dis-ease were not quickly contained, then Hong Kong would suffer long-term conse-
69 Asian Economic Papers
Economic Impact of SARS in Hong Kong
Table 4. Private sector forecasts of Hong Kong’s output growth and inºation (2003)
Output growth Consumer price inºation
Previous(percent)
Latest(percent)
Difference(percentagepoint)
Previous(percent)
Latest(percent)
Difference(percentagepoint)
Economist Intelligence Unit (EIU) 2.5 0.3 �2.2 — — —Bloomberg News Survey 2.9 2.1 �0.8 — — —Forecasts by major private companies — — —
J.P. Morgan Chase 3.2 0.3 �2.9 — — —HongKong and Shanghai Banking
Corporation 1.6 0.5 �1.1 — — —BNP Paribas Peregrine 1.5 0.9 �0.6 — — —Citibank 2.8 1.0 �1.8 �1.2 �2.0 �0.8DBS Bank 1.8 1.2 �0.6 — — —Internationale Nederlanden Group
(ING) 3.0 1.5 �1.5 — — —Goldman Sachs 3.0 1.7 �1.3 — — —Lehman Brothers 2.5 2.0 �0.5 — �1.5 —Morgan Stanley 2.7 2.1 �0.6 — — —Merrill Lynch 4.6 3.1 �1.5 — — —ABN Amro Bank 4.0 3.5 �0.5 — — —Average 2.8 1.6 �1.2 — — —
Source: Compiled by the Hong Kong Monetary Authority. Available at www.info.gov.hk/hkma
quences from the diversion of foreign investments from the region. Many analystswere also concerned that the disease might recur in 2004.
The SARS outbreak was an unexpected negative shock to Hong Kong’s economy.The most signiªcant negative effects were on the demand side. Local consumptionand the export of services related to tourism and air travel were severely affected inthe short run. Early anecdotal evidence reported in the press indicated that restau-rants and retail outlets were hit hard, with sales dropping by 10 to 50 percent(table 6). Land transport declined by 10–20 percent because people stayed home.There was also a 50 percent drop in the use of the Airport Express Line,1 which indi-cated a reduction in air travel. Fortunately, the supply side of Hong Kong’s econ-omy was unaffected. Even though SARS raged through the province of Guangdong,the cross-border manufacturing base was not disrupted. The production and cross-border movement of goods continued to function smoothly, and the global supplychains remained intact.
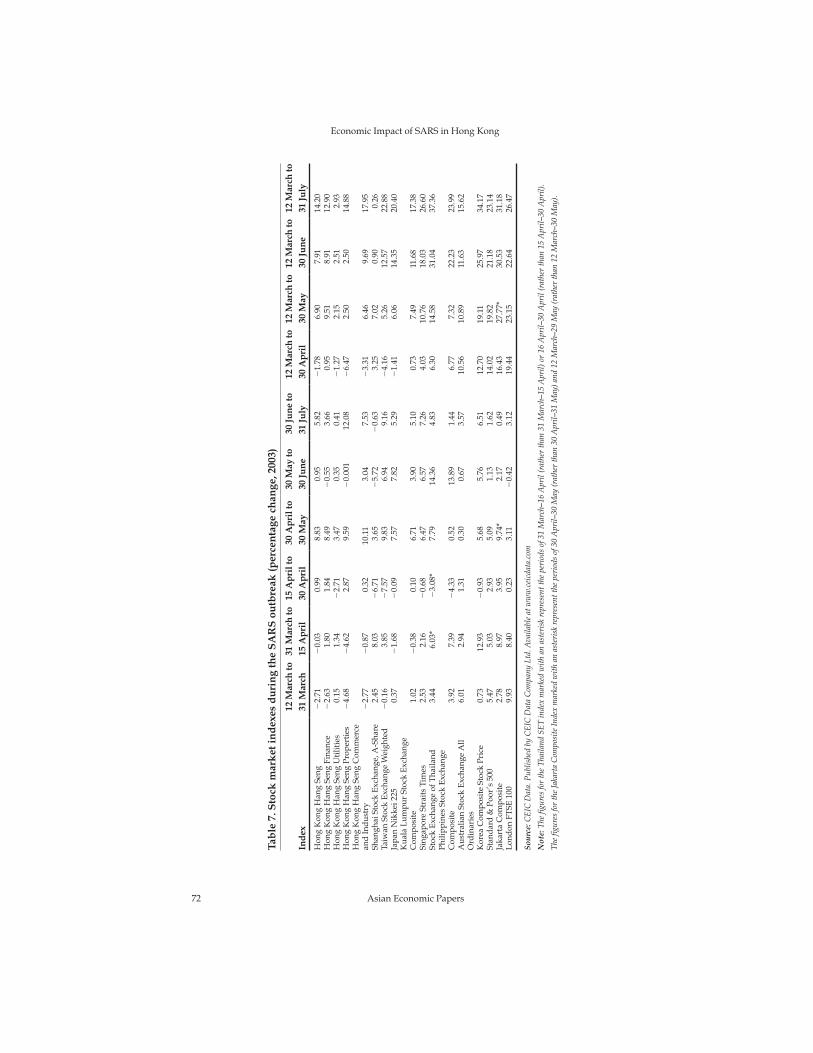
The stock market reaction to the SARS outbreak was relatively moderate. The HongKong Hang Seng Index dropped only by 1.78 percent between 12 March (whenWHO raised the global alert) and 30 April. Other major market indexes rose overthe same period, except for the Taiwan Weighted Index and Japan’s Nikkei 225
70 Asian Economic Papers
Economic Impact of SARS in Hong Kong
Table 5. Structure of the Hong Kong economy (2000–2002)
Value in 2002(HK$ billion)
Share of GDP (%)
2002 2001 2000
Private consumption expenditure 728.4 57.8 60.2 57.8Government consumption expenditure 131.2 10.4 10.1 9.3Gross domestic ªxed-capital formation 292.6 23.2 26.2 27.0Changes in inventories 2.4 0.2 �0.3 1.1Exports of goods and services 1,900.1 150.8 140.8 146.7
Goods 1,562.1 124.0 116.6 122.1Domestic exports 131.1 10.4 12.1 14.0Re-exports 1,431.0 113.6 104.5 108.0
Services 337.9 26.8 24.2 24.7Transportation 103.0 8.2 7.4 7.7Travel 58.8 4.7 3.7 4.8Trade-related services 117.2 9.3 8.4 7.6Others 58.9 4.7 4.8 4.6
Imports of goods and services 1,794.9 142.5 137.1 141.9Goods 1,601.5 127.1 122.0 127.0Services 193.4 15.4 15.2 14.9
Transportation 51.7 4.1 4.0 3.8Travel 96.8 7.7 7.6 7.6Trade-related services 12.1 1.0 0.9 0.9Others 32.8 2.6 2.7 2.7
Gross domestic product 1,259.8 100.0 100.0 100.0
Source: Census and Statistics Department, Hong Kong (2003b).
1 The Airport Express Line offers a fast passenger railway link between Chek Lap Kok (whereHong Kong International Airport is located) and central Hong Kong.
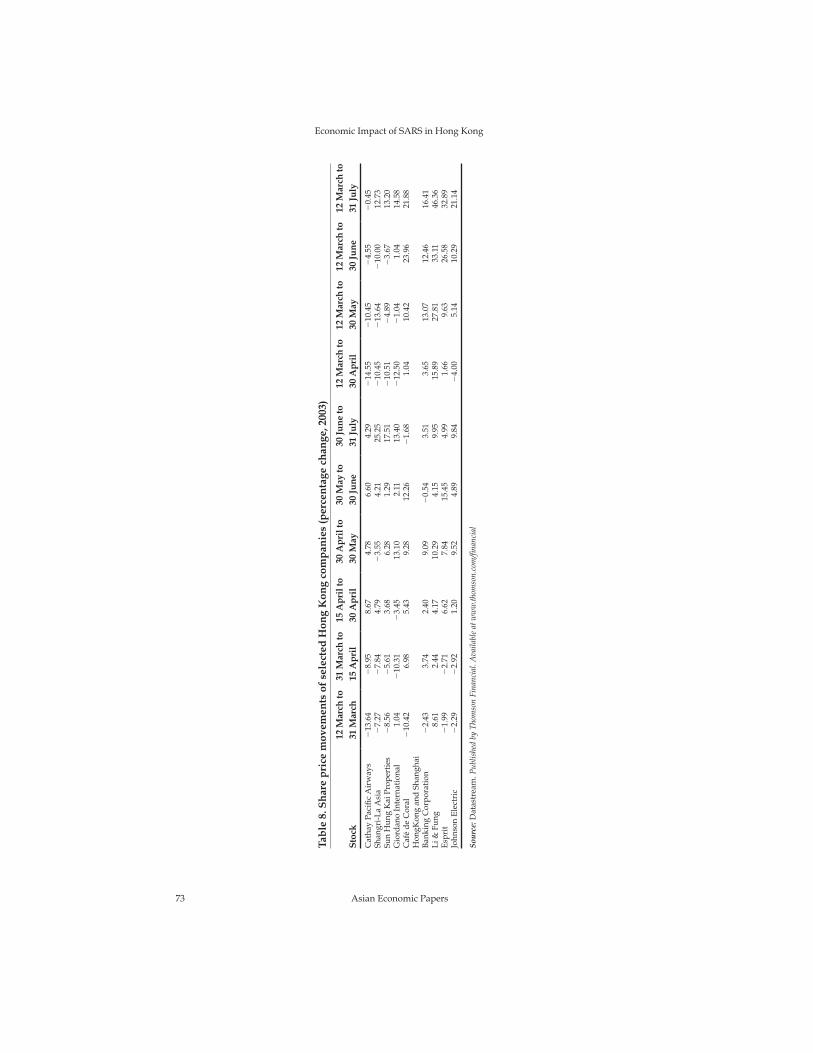
(table 7). The Hong Kong market surged ahead by 3.7 percent on 29 April, afterWHO announced that the worst of the SARS outbreak appeared to be over in Singa-pore, Hong Kong, Canada, and Vietnam. Stock shares of airlines, hotels, propertydevelopers, and retailers performed worse than the whole market, whereas sharesof export-oriented companies did relatively well (table 8).
4.2 Impact on local consumptionThe decline in local consumer spending in Hong Kong stemmed from fears that thedisease had spread to the community at large. Consequently, people refrained frommany consumption activities outside their homes. The drop in demand rippledthrough the whole economy: it affected other sectors, put further downward pres-sure on the price level, and worsened the unemployment problem. The SARS shockstarted to bite only in late March 2003, based on the March retail sales ªgure, whichwas HK$14.17 billion, a 6.1 percent drop from the previous year (table 9). Retailsales in April declined 15.2 percent from the previous year. As the number of newSARS cases started to decline in late April, local residents began venturing out moreoften. On 1 May, the Labor Day holiday, queues were seen outside some restaurantsand cinemas. The consumption pattern also adjusted, with supermarkets and videorental shops doing more business. Retail sales began to recover steadily after
71 Asian Economic Papers
Economic Impact of SARS in Hong Kong
Table 6. Anecdotal evidence of losses from SARS according to selected businesses(all dates 2003)
Sector Source Date Reported loss
Food and catering Hong Kong Federation ofRestaurants and Related TradesCafé de Coral
Mid-April
Early April
50 restaurants closed temporarily
Sales dropped by 20%
Retail Hong Kong Retail ManagementAssociationSa Sa InternationalGiordano InternationalMirabell International
Early April
Early AprilMid-AprilMid-April
Retail sales fell by 50%
Sales dropped by 10%Sales dropped by 30%Sales fell by 50% from a year prior
Tourism Hong Kong Tourism Board Early April 10.4% drop in visitor arrivals inthe last 16 days of March over ayear prior
Airline Cathay Paciªc Airways
Dragon Airlines
Mid-April
Mid-April
Estimated loss per day was US$3million; cancellation of ºights rosefrom 10% in late March to over40% in mid-AprilFlight schedule was cut by 48%
Transport CitybusNew World First BusMTR Corporation
Early AprilMid-AprilMid-April
Passenger level fell by 10%Passenger level fell by 20%Airport Express Line frequencywas cut as passenger levels fell by50%
Others The Hong Kong Convention andExhibition CentreCinema Association
Early April
Mid-April
12% of bookings were cancelled orpostponedRevenue in March dropped by47%
Sources: Various press reports from Ming Pao (www.mingpaonews.com) and South China Morning Post (www.scmp.com).
72 Asian Economic Papers
Economic Impact of SARS in Hong Kong
Tab
le7.
Sto
ckm
ark
etin
dex
esd
uri
ng
the
SA
RS
outb
reak
(per
cen
tage
chan
ge,2
003)
Ind
ex12
Mar
chto
31M
arch
31M
arch
to15
Ap
ril
15A
pri
lto
30A
pri
l30
Ap
rilt
o30
May
30M
ayto
30Ju
ne
30Ju
ne
to31
July
12M
arch
to30
Ap
ril
12M
arch
to30
May
12M
arch
to30
Jun
e12
Mar
chto
31Ju
ly
Hon
gK
ong
Han
gSe
ng�
2.71
�0.
030.
998.
830.
955.
82�
1.78
6.90
7.91
14.2
0H
ong
Kon
gH
ang
Seng
Fina
nce
�2.
631.
801.
848.
49�
0.55
3.66
0.95
9.51
8.91
12.9
0H
ong
Kon
gH
ang
Seng
Uti
litie
s0.
151.
34�
2.71
3.47
0.35
0.41
�1.
272.
152.
512.
93H
ong
Kon
gH
ang
Seng
Prop
erti
es�
4.68
�4.
622.
879.
59�
0.00
112
.08
�6.
472.
502.
5014
.88
Hon
gK
ong
Han
gSe
ngC
omm
erce
and
Ind
ustr
y�
2.77
�0.
870.
3210
.11
3.04
7.53
�3.
316.
469.
6917
.95
Shan
ghai
Stoc
kE
xcha
nge,
A-S
hare
2.45
8.03
�6.
713.
65�
5.72
�0.
633.
257.
020.
900.
26Ta
iwan
Stoc
kE
xcha
nge
Wei
ghte
d�
0.16
3.85
�7.
579.
836.
949.
16�
4.16
5.26
12.5
722
.88
Japa
nN
ikke
i225
0.37
�1.
68�
0.09
7.57
7.82
5.29
�1.
416.
0614
.35
20.4
0K
uala
Lum
pur
Stoc
kE
xcha
nge
Com
posi
te1.
02�
0.38
0.10
6.71
3.90
5.10
0.73
7.49
11.6
817
.38
Sing
apor
eSt
rait
sTi
mes
2.53
2.16
�0.
686.
476.
577.
264.
0310
.76
18.0
326
.60
Stoc
kE
xcha
nge
ofT
haila
nd3.
446.
03*
�3.
08*
7.79
14.3
64.
836.
3014
.58
31.0
437
.36
Phili
ppin
esSt
ock
Exc
hang
eC
ompo
site
3.92
7.39
�4.
330.
5213
.89
1.44
6.77
7.32
22.2
323
.99
Aus
tral
ian
Stoc
kE
xcha
nge
All
Ord
inar
ies
6.01
2.94
1.31
0.30
0.67
3.57
10.5
610
.89
11.6
315
.62
Kor
eaC
ompo
site
Stoc
kPr
ice
0.73
12.9
3�
0.93
5.68
5.76
6.51
12.7
019
.11
25.9
734
.17
Stan
dar
d&
Poor
’s50
05.
475.
032.
935.
091.
131.
6214
.02
19.8
221
.18
23.1
4Ja
kart
aC
ompo
site
2.78
8.97
3.95
9.74
*2.
170.
4916
.43
27.7
7*30
.53
31.1
8L
ond
onFT
SE10
09.
938.
400.
233.
11�
0.42
3.12
19.4
423
.15
22.6
426
.47
Sour
ce:C
EIC
Dat
a.P
ublis
hed
byC
EIC
Dat
aC
ompa
nyLt
d.A
vaila
ble
atw
ww
.cei
cdat
a.co
m
Not
e:T
heªg
ures
for
the
Tha
iland
SET
inde
xm
arke
dw
ith
anas
teri
skre
pres
entt
hepe
riod
sof
31M
arch
–16
Apr
il(r
athe
rth
an31
Mar
ch–1
5A
pril)
or16
Apr
il–30
Apr
il(r
athe
rth
an15
Apr
il–30
Apr
il).
The
ªgur
esfo
rth
eJa
kart
aC
ompo
site
Inde
xm
arke
dw
ith
anas
teri
skre
pres
entt
hepe
riod
sof
30A
pril–
30M
ay(r
athe
rth
an30
Apr
il–31
May
)and
12M
arch
–29
May
(rat
her
than
12M
arch
–30
May
).
73 Asian Economic Papers
Economic Impact of SARS in Hong Kong
Tab
le8.
Sh
are
pri
cem
ovem
ents
ofse
lect
edH
ong
Kon
gco
mp
anie
s(p
erce
nta
gech
ange
,200
3)
Sto
ck12
Mar
chto
31M
arch
31M
arch
to15
Ap
ril
15A
pri
lto
30A
pri
l30
Ap
rilt
o30
May
30M
ayto
30Ju
ne
30Ju
ne
to31
July
12M
arch
to30
Ap
ril
12M
arch
to30
May
12M
arch
to30
Jun
e12
Mar
chto
31Ju
ly
Cat
hay
Paci
ªcA
irw
ays
�13
.64
�8.
958.
674.
786.
604.
29�
14.5
5�
10.4
5�
4.55
�0.
45Sh
angr
i-L
aA
sia
�7.
27�
7.84
4.79
�3.
554.
2125
.25
�10
.45
�13
.64
�10
.00
12.7
3Su
nH
ung
Kai
Prop
erti
es�
8.56
�5.
613.
686.
281.
2917
.51
�10
.51
�4.
89�
3.67
13.2
0G
iord
ano
Inte
rnat
iona
l1.
04�
10.3
1�
3.45
13.1
02.
1113
.40
�12
.50
�1.
041.
0414
.58
Caf
éd
eC
oral
�10
.42
6.98
5.43
9.28
12.2
6�
1.68
1.04
10.4
223
.96
21.8
8H
ongK
ong
and
Shan
ghai
Ban
king
Cor
pora
tion
�2.
433.
742.
409.
09�
0.54
3.51
3.65
13.0
712
.46
16.4
1L
i&Fu
ng8.
612.
444.
1710
.29
4.15
9.95
15.8
927
.81
33.1
146
.36
Esp
rit
�1.
99�
2.71
6.62
7.84
15.4
54.
991.
669.
6326
.58
32.8
9Jo
hnso
nE
lect
ric
�2.
29�
2.92
1.20
9.52
4.89
9.84
�4.
005.
1410
.29
21.1
4
Sour
ce:D
atas
trea
m.P
ublis
hed
byT
hom
son
Fina
ncia
l.A
vaila
ble
atw
ww
.thom
son.
com
/ªna
ncia
l

May 2003 as the SARS outbreak receded, and reached their pre-outbreak levels bythe end of July.
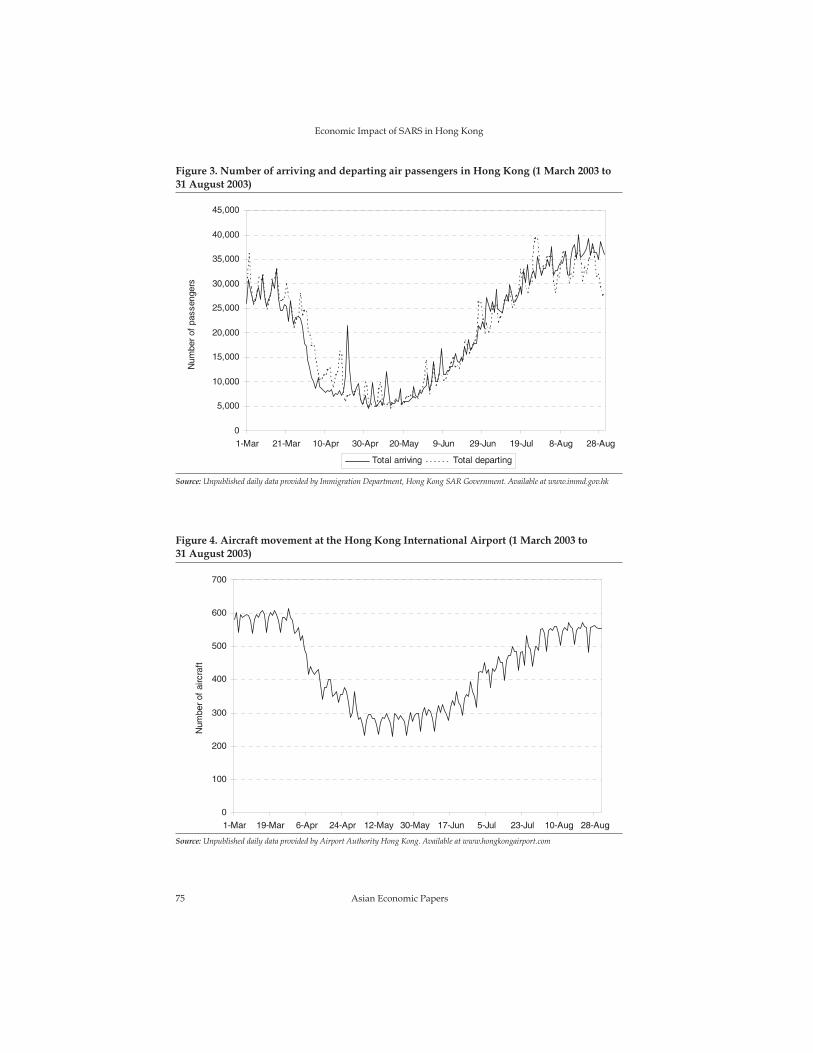
4.3 Impact on tourism and travelDuring the second half of March 2003, visitor arrivals dropped by 10.4 percent, com-pared with arrivals in the previous year, and airlines had to cancel ºights. As shownin ªgure 3, air passenger travel to and from Hong Kong began to drop in mid-Marchand fell sharply at the end of the month, several days before the WHO travel warn-ing. The spike during the Easter holidays was a result of local residents’ taking toursoutside Hong Kong. The amount of aircraft movement began to drop after the endof March and reached bottom in early May (ªgure 4). By the end of July, the numberof ºights had nearly recovered to the level seen in March.
Table 10 shows the number of passenger arrivals and departures by mode of travelfor visitors and residents in Hong Kong. In April 2003 visitor arrivals dropped in allthree modes of travel, compared with the March 2003 ªgures: the number of airlinepassengers fell by 77 percent, the number of people traveling by land declined by 52percent, and the number that came by sea dropped by 72 percent. On average, be-tween March and April 2003 the total number of visitors arriving in Hong Kong fellby 63 percent (around 850,000). The decline in travel by residents was considerablyless drastic, with a decrease in the total number of around 26 percent in Aprilmonth-on-month. In June, visitor arrivals started to recover and by August they hadreturned to their original levels. Residents’ travel recovered about a month sooner.(See table 10 and ªgures 5 and 6.)
As the SARS outbreak came under control, the number of visitors to Hong Kongpicked up. On average, between 1997 and 2002 only around half of the visitors toHong Kong were tourists: 30 percent were business travelers and 10 percent were
74 Asian Economic Papers
Economic Impact of SARS in Hong Kong
Table 9. Retail sales data for Hong Kong (2003)
Total retail sales Unit price index(year-on-yearpercentage change)
Volume index(year-on-yearpercentage change)2003
Value(HK$ billion)
Year-on-yearpercentage change
January 17.48 9.87 �1.71 11.76February 12.68 �12.56 �1.46 �11.23March 14.17 �6.06 �2.43 �3.73April 12.72 �15.15 �3.28 �12.24May 13.78 �11.13 �3.95 �7.45June 13.60 �6.46 �3.31 �3.31July 14.63 �2.49 �2.19 �0.30August 14.72 1.16 �1.68 2.91
Source: Census and Statistics Department, Hong Kong SAR Government. Available at www.info.gov.hk/censtatd/eng/hkstat/fas
/commerce/retail/retail_index.html
75 Asian Economic Papers
Economic Impact of SARS in Hong Kong
Figure 3. Number of arriving and departing air passengers in Hong Kong (1 March 2003 to31 August 2003)
Source: Unpublished daily data provided by Immigration Department, Hong Kong SAR Government. Available at www.immd.gov.hk
Figure 4. Aircraft movement at the Hong Kong International Airport (1 March 2003 to31 August 2003)
Source: Unpublished daily data provided by Airport Authority Hong Kong. Available at www.hongkongairport.com

76 Asian Economic Papers
Economic Impact of SARS in Hong Kong
Tab
le10
.Nu
mb
erof
arri
vin
gan
dd
epar
tin
gp
asse
nge
rsb
yai
r,la
nd
,an
dse
ain
Hon
gK
ong
(Jan
uar
y–A
ugu
st20
03)
Jan
uar
y20
03Fe
bru
ary
2003
Mar
ch20
03A
pri
l200
3M
ay20
03Ju
ne
2003
July
2003
Au
gust
2003
Pas
sen
ger
arri
vals
6,60
4,30
06,
758,
628
6,31
6,86
04,
143,
283
4,33
6,50
55,
430,
374
6,70
1,27
67,
926,
087
Air
889,
369
1,01
9,16
980
1,76
427
8,75
721
1,32
844
5,70
889
5,83
91,
104,
674
Lan
d4,
969,
356
4,83
0,00
24,
808,
490
3,41
6,89
23,
664,
852
4,33
5,24
05,
001,
669
5,78
0,18
5Se
a74
5,57
590
9,45
770
6,60
644
7,63
446
0,32
564
9,42
680
3,76
81,
041,
228
Pas
sen
ger
dep
artu
res
7,09
3,12
96,
191,
524
6,38
5,85
74,
237,
584
4,34
3,37
45,
420,
115
6,69
2,90
27,
771,
069
Air
1,03
2,31
184
3,42
585
3,17
233
2,12
521
4,32
644
7,49
588
9,83
91,
023,
221
Lan
d5,
210,
192
4,41
5,77
14,
731,
252
3,41
4,59
13,
656,
902
4,30
4,62
64,
954,
354
5,60
2,10
2Se
a85
0,62
693
2,32
880
1,43
349
0,86
847
2,14
666
7,99
484
8,70
91,
145,
746
Vis
itor
arri
vals
1,54
5,97
81,
408,
139
1,34
7,38
649
3,66
642
7,25
472
5,23
61,
291,
828
1,64
4,87
8A
ir53
8,90
454
6,49
046
4,41
410
6,55
556
,792
152,
548
404,
182
491,
602
Lan
d77
8,29
464
0,94
869
3,90
933
4,46
531
7,71
146
4,39
170
7,15
888
2,79
9Se
a22
8,78
022
0,70
118
9,06
352
,646
52,7
5110
8,29
718
0,48
827
0,47
7
Res
iden
tdep
artu
res
5,48
7,97
84,
803,
886
4,99
3,31
53,
702,
524
3,92
4,50
74,
718,
681
5,47
9,89
46,
087,
610
Sour
ce:C
EIC
Dat
a.P
ublis
hed
byC
EIC
Dat
aC
ompa
nyLt
d.A
vaila
ble
atw
ww
.cei
cdat
a.co
m

77 Asian Economic Papers
Economic Impact of SARS in Hong Kong
Figure 5. Number of visitors arriving in Hong Kong (August 2002 to August 2003)
Source: Census and Statistics Department, Hong Kong (2003d).
Figure 6. Number of departing Hong Kong residents (August 2002 to August 2003)
Source: Census and Statistics Department, Hong Kong (2003d).
those visiting friends or relatives (table 11). The number of visitors in the latter twogroups recovered more quickly than the number of tourist visitors. The occupancyrate in Hong Kong’s hotels dropped dramatically from around 79 percent in earlyMarch to 18 percent in early May, but by early July the rate had recovered to 71 per-cent (ªgure 7).
The depressed state of Hong Kong’s domestic demand since 1999 was partially off-set by increased demand by tourists. Total spending by tourists had dropped offdramatically between 1997 and 1998, at the onset of the Asian ªnancial crisis (table12), but since then it has grown at an average annual rate of 8 percent, largely be-cause of the increasing number of visitors from mainland China resulting from themore relaxed restrictions on travel to Hong Kong.2 The most up-to-date ªgure fortotal tourism expenditure associated with inbound tourism in Hong Kong isHK$77.4 billion in 2002, which amounts to 6 percent of GDP. The impact of touristspending on the value of retail sales is, however, quite substantial. The averagespending by each overnight tourist in 2001 was HK$4,588, and this spending in-creased to HK$4,904 in 2002. A drop of 850,000 visitors in April 2003 translates to areduction of HK$4.2 billion of spending in the domestic consumption market, im-plying that retail sales probably fell by around HK$2.0 billion in April, or 14 percentof the value of retail sales in March.
4.4 Impact on exports and re-exports of goodsThe fear that the SARS outbreak would cause a fall in Hong Kong’s goods exportsand re-exports was not borne out: cross-border truck trafªc ªgures showed no obvi-ous decrease between March and September 2003 (ªgure 8). Evidently the produc-tion and movement of goods continued unperturbed during the outbreak. The tradeªgures for exports of goods continued to grow robustly between January and
78 Asian Economic Papers
Economic Impact of SARS in Hong Kong
Table 11. Purpose of visit and average length of stay of visitors to Hong Kong (1997–2002)
Purpose of visit 1997 1998 1999 2000 2001 2002
Vacation 61% 49% 49% 55% 50% 47%Business/meetings 26% 32% 30% 30% 30% 32%Visiting friends and relatives 7% 9% 12% 8% 10% 14%En route 5% 8% 7% 6% 9% 7%Other purposes 2% 1% 2% 1% 2% 0%Average length of stay (nights) 3.6 3.4 3.4 3.0 3.1 3.6
Sources: Census and Statistics Department, Hong Kong (2003a) and Hong Kong Tourism Board (2003).
2 Under the Individual Visit Scheme commenced on 28 July 2003, residents of four Guangdongcities could travel to Hong Kong as individual visitors. Previously, they had to join a tourgroup to visit Hong Kong. The scheme was introduced by the Chinese government as ameasure to revive Hong Kong’s economy and was subsequently extended to Beijing, Shang-hai, and the whole of Guangdong province. Beijing’s policy is to extend the scheme furtherby including more cities.

June 2003. For the ªrst and second quarters of 2003, the value of the total exports ofgoods from Hong Kong rose by 17.6 percent and 12.2 percent, respectively, com-pared with the values in the same period of 2002. The value of re-exports surged by20.3 percent in 2003:Q1 and by 14.4 percent in 2003:Q2, and the value of domesticexports decreased by 10.4 percent in 2003:Q1 and 11.3 percent in 2003:Q2. The value
79 Asian Economic Papers
Economic Impact of SARS in Hong Kong
Figure 7. Hotel occupancy rates in Hong Kong (January–August 2003)
Source: Census and Statistics Department, Hong Kong (2003d).
Table 12. Visitor spending in Hong Kong (1992–2002)
YearTotal visitor spend-ing (HK$ billion)
Per capita visitorspending (HK$)
1992 46.70 6,6841993 58.30 6,6841994 62.51 6,6991995 72.94 7,1511996 91.49 7,0521997 75.70 6,7151998 56.83 5,4901999 56.99 4,8972000 63.91 4,6122001 61.80 4,5882002 77.41 4,904
Sources: Census and Statistics Department, Hong Kong (2003a) and Hong Kong Tourism Board (2003).
Note: Figures for 1998–2002 are new data on “total tourism expenditure associated with inbound tourism” and “overnight visitor per
capita spending” released by the Hong Kong Tourism Board in November 2003.
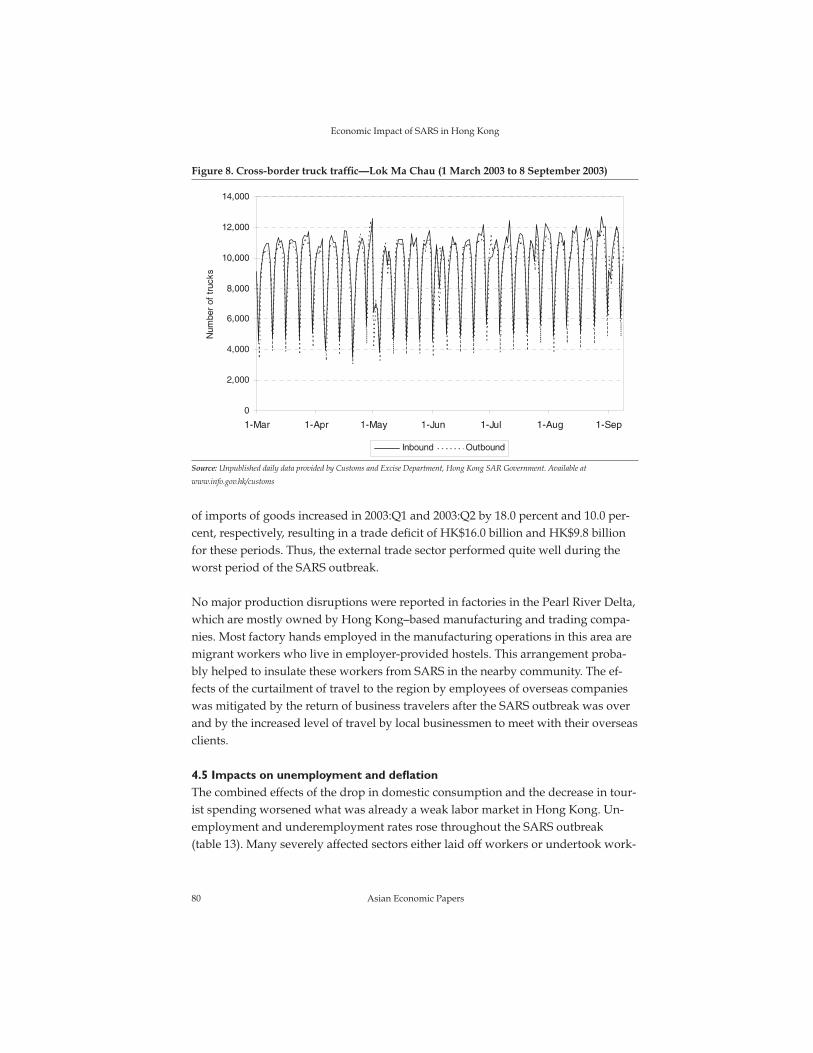
of imports of goods increased in 2003:Q1 and 2003:Q2 by 18.0 percent and 10.0 per-cent, respectively, resulting in a trade deªcit of HK$16.0 billion and HK$9.8 billionfor these periods. Thus, the external trade sector performed quite well during theworst period of the SARS outbreak.
No major production disruptions were reported in factories in the Pearl River Delta,which are mostly owned by Hong Kong–based manufacturing and trading compa-nies. Most factory hands employed in the manufacturing operations in this area aremigrant workers who live in employer-provided hostels. This arrangement proba-bly helped to insulate these workers from SARS in the nearby community. The ef-fects of the curtailment of travel to the region by employees of overseas companieswas mitigated by the return of business travelers after the SARS outbreak was overand by the increased level of travel by local businessmen to meet with their overseasclients.
4.5 Impacts on unemployment and deºationThe combined effects of the drop in domestic consumption and the decrease in tour-ist spending worsened what was already a weak labor market in Hong Kong. Un-employment and underemployment rates rose throughout the SARS outbreak(table 13). Many severely affected sectors either laid off workers or undertook work-
80 Asian Economic Papers
Economic Impact of SARS in Hong Kong
Figure 8. Cross-border truck trafªc—Lok Ma Chau (1 March 2003 to 8 September 2003)
Source: Unpublished daily data provided by Customs and Excise Department, Hong Kong SAR Government. Available at
www.info.gov.hk/customs
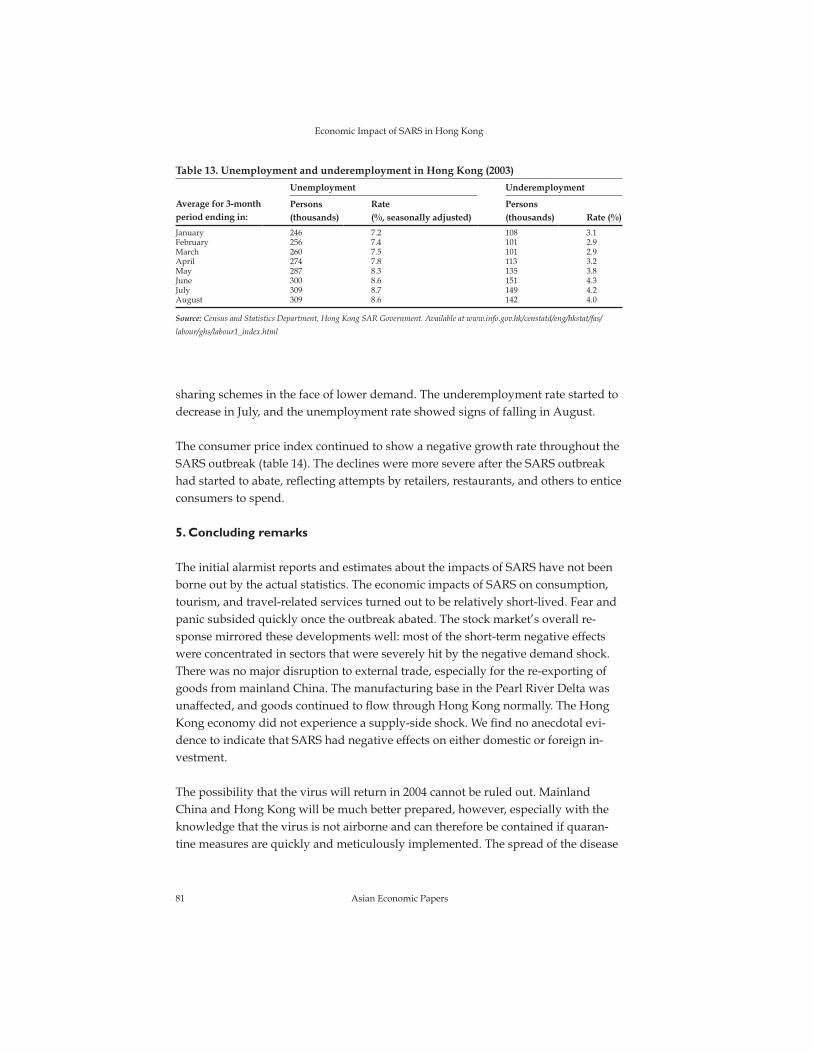
sharing schemes in the face of lower demand. The underemployment rate started todecrease in July, and the unemployment rate showed signs of falling in August.
The consumer price index continued to show a negative growth rate throughout theSARS outbreak (table 14). The declines were more severe after the SARS outbreakhad started to abate, reºecting attempts by retailers, restaurants, and others to enticeconsumers to spend.
5. Concluding remarks
The initial alarmist reports and estimates about the impacts of SARS have not beenborne out by the actual statistics. The economic impacts of SARS on consumption,tourism, and travel-related services turned out to be relatively short-lived. Fear andpanic subsided quickly once the outbreak abated. The stock market’s overall re-sponse mirrored these developments well: most of the short-term negative effectswere concentrated in sectors that were severely hit by the negative demand shock.There was no major disruption to external trade, especially for the re-exporting ofgoods from mainland China. The manufacturing base in the Pearl River Delta wasunaffected, and goods continued to ºow through Hong Kong normally. The HongKong economy did not experience a supply-side shock. We ªnd no anecdotal evi-dence to indicate that SARS had negative effects on either domestic or foreign in-vestment.
The possibility that the virus will return in 2004 cannot be ruled out. MainlandChina and Hong Kong will be much better prepared, however, especially with theknowledge that the virus is not airborne and can therefore be contained if quaran-tine measures are quickly and meticulously implemented. The spread of the disease
81 Asian Economic Papers
Economic Impact of SARS in Hong Kong
Table 13. Unemployment and underemployment in Hong Kong (2003)
Unemployment Underemployment
Average for 3-monthperiod ending in:
Persons(thousands)
Rate(%, seasonally adjusted)
Persons(thousands) Rate (%)
January 246 7.2 108 3.1February 256 7.4 101 2.9March 260 7.5 101 2.9April 274 7.8 113 3.2May 287 8.3 135 3.8June 300 8.6 151 4.3July 309 8.7 149 4.2August 309 8.6 142 4.0
Source: Census and Statistics Department, Hong Kong SAR Government. Available at www.info.gov.hk/censtatd/eng/hkstat/fas/
labour/ghs/labour1_index.html

in hospitals is likely to be better handled, with enhanced infection isolation facilities,infection control procedures, and heightened vigilance.
The fact that the disease raged on for several months without attracting worldwideattention reveals the damaging effects of information control in relatively closed so-cieties that do not have a free press. The spread of SARS to Hong Kong, with theªrst case in a hotel, was very unfortunate, but it may also have been critical in focus-ing public attention on the potential global threat posed by the virus. The media inHong Kong were the ªrst to raise public alarm by candidly reporting the facts. Thespread of the disease to several countries (notably Vietnam, Singapore, and Canada)brought world attention to the issues that SARS was a deadly new disease and wasspreading quickly, and that authorities in mainland China had failed to report in atimely manner a serious epidemic. The free ºow of information and the reactionsthat followed played an important role in stopping the spread of the disease. TheChinese government responded quickly to contain the spread of SARS in the wakeof international public pressure. Research that led to the early identiªcation of thevirus at The University of Hong Kong and of some of the properties of the diseasecalmed the public’s fears and may have helped avert an uncontrolled panic by in-vestors and the serious economic impacts that would have followed.
If a recurrence of the disease is controlled effectively, then Hong Kong’s close eco-nomic relationship with the mainland will not be affected by such a recurrence. An-other SARS outbreak could even help to speed up the opening of the mainland, forthe ªrst experience demonstrated to the Chinese leadership that GDP numbers de-pend on the conªdence of domestic and international economic agents. Any suchfurther opening will enhance Hong Kong’s role in China’s development. Indeed, thelifting of restrictions on travel to Hong Kong for residents of Guangdong, Shanghai,and Beijing permitted by the Individual Visit Scheme is likely to increase the ºow ofinformation between Hong Kong and mainland China. The recent signing of theCloser Economic Partnership Arrangement confers greater freedom for many
82 Asian Economic Papers
Economic Impact of SARS in Hong Kong
Table 14. Composite consumer price index in Hong Kong (2003)
Month Composite consumer price index Year-on-year percentage change
January 93.7 �1.6February 93.5 �2.0March 93.7 �2.1April 93.7 �1.8May 92.7 �2.5June 92.0 �3.1July 91.1 �4.0August 91.0 �3.8
Source: Census and Statistics Department, Hong Kong SAR Government. Available at www.info.gov.hk/censtatd/eng/hkstat/fas/cpi/
cpi_std_index.html
Hong Kong service providers to access the market in mainland China, and it islikely to contribute to China’s further opening up and integration with the rest ofthe world.
ReferencesCensus and Statistics Department, Hong Kong. 2003a. Statistical Digest of the Services Sector2003. Hong Kong: Publications Unit of the Census and Statistics Department.
———. 2003b. Gross Domestic Product, Third Quarter 2003. Hong Kong: Publications Unit of theCensus and Statistics Department.
———. 2003c. Hong Kong Annual Digest of Statistics 2003. Hong Kong: Publications Unit of theCensus and Statistics Department.
———. 2003d. Hong Kong Monthly Digest of Statistics, October 2003. Hong Kong: PublicationsUnit of the Census and Statistics Department.
Hong Kong Centre for Economic Research. 2003. Made in PRD: The Changing Face of HK Manu-facturers. Hong Kong: Hong Kong Centre for Economic Research, The University of HongKong.
Hong Kong Tourism Board. 2003. A Statistical Review of Hong Kong Tourism 2002. Hong Kong:Tourism Research Hong Kong Tourism Board. Available at http://www.partnernet.hktb.com
SARS Expert Committee. 2003. SARS in Hong Kong: From Experience to Action. Report of theSARS Expert Committee, October 2003. Available at http://www.sars-expertcom.gov.hk
World Bank. 2003. East Asia Update: Looking beyond Short-Term Shocks, April 2003. Washington,D.C.: World Bank.
83 Asian Economic Papers
Economic Impact of SARS in Hong Kong


![Effects of City-Size Heterogeneity on Epidemic Spreading ...web.phys.ntnu.no/~ingves/Downloads/MyPapers/... · ity) [2]. SARS spread within weeks from Hong Kong to 37 other countries](https://img.pdfslide.us/doc/110x75/5f4e0d49846cfb02336f292c/effects-of-city-size-heterogeneity-on-epidemic-spreading-webphysntnunoingvesdownloadsmypapers.jpg)