Embed Size (px)
Citation preview

Economic Impact of Removal of the Universal Service Fund in Missouri
Contact: Dr. David M. Mitchell, Director Bureau of Economic Research Missouri State University Springfield, Missouri 65897 (417) 836-5551

i
Economic Impact of Removal of the Universal Service Fund in Missouri
Executive Summary
Recently, the Federal Communications Commission (FCC) has proposed to alter the Universal Service Fund (USF) program and move the funds currently being used to support telephone service towards the establishment of a national broadband plan. In so doing, the FCC has proposed changes to the USF that would reduce, and could eliminate, USF Funding to thirty-five small telephone companies serving rural Missouri.
The Universal Service Fund (USF) was established with the goal that all consumers, including those in rural high-cost areas, have access to telecommunications and information services comparable in quality and price to those available in urban areas. For some parts of the country, due to terrain or low population density, it can be extremely costly to provide basic telephone service. The USF program is designed to defray some of these costs and make the price of telephone and internet access service in these high-cost areas comparable to the prices paid by urban consumers.
Thirty-five Incumbent Local Exchange Companies (ILECs) operating in Missouri were studied to determine the impact that such a move by the FCC might have on the statewide economy. These ILECs provide basic phone service in communities that, when compared to the rest of the country, are predominately poorer and have lower population densities than other communities. Consequently, these ILECs have higher costs than other telecommunications companies and are less able to pass these higher costs onto their lower-income customers who cannot afford the higher prices. Shifting funds away from these rural providers will impact their consumers through either significantly higher prices, severely diminished service, or both. The economic impacts of the decreased revenues to the ILECs will multiply throughout the economy. Over the next five years, output in Missouri would decline by over half a billion dollars from what it otherwise would have been had the USF program not been eliminated. Employment would diminish by 3,500 jobs, with wages declining by over $162 million during the 2012 to 2016 period. This diminished economic activity will lead to smaller tax revenues. Federal tax revenues will fall by $36.4 million while state and local tax revenues would decline by almost $35 million.
It is highly probable that many of the ILECs in Missouri will not be able to survive such a
transition in the long run and would go bankrupt. If the ILECs were allowed to increase prices for basic phone service, they still would be unable to make up for the decrease in revenue from the loss of the USF. Even if the ILECs would survive, they would decrease their investment in
ii
new infrastructure and equipment by approximately 40%. Although the impact of this on the quality and quantity of phone service in the short run would not be very severe, this cannot be said about the long run. As new investment in the infrastructure and equipment necessary to provide basic phone services decreases, the long run quality and quantity of basic telephone service and broadband service within these communities would deteriorate.
This study does not evaluate the impact of reductions in inter-carrier compensation
revenue the FCC has proposed. Inter-carrier compensation revenue is a significant revenue source for the ILECs. Any reductions to inter-carrier compensation revenues made by the FCC would accelerate and compound the impacts described in this study.

1
Economic Impact of Removal of the Universal Service Fund in Missouri
Introduction
The Bureau of Economic Research at Missouri State University conducted a study to determine the potential economic impact of the Federal Communications Commissions’ (FCC) proposed changes in distribution of Universal Service Funds (USF). The Bureau of Economic Research combined data collected from surveys of the Incumbent Local Exchange Carriers (ILEC) who would be impacted by the FCC ruling with data from the Bureau of Economic Analysis and the Census Bureau to formulate an economic model of the state economy. This model was used to determine what the economic impact, in terms of metrics such as employment, output, and taxes, would be on the state economy.
This report is outlined in the following manner. The first section provides background information on the USF program and what changes the FCC has proposed. The second section discusses the area of study in general and specifically how some of its characteristics impact the cost of telephone service. The third section examines the data collected and the methodology used. The fourth section considers the economic impacts.
Background and Proposed Future Direction of the Universal Service Fund
The telecommunications industry in the United States is large and growing in importance. In 2009, the industry had revenues of nearly $285 billion, employed over 1 million people, and completed over 235 billion switched calls.1 Of this $285 billion in revenues, $112 billion comes from local service, $121 billion for wireless service, and the remaining $52 billion for toll service. This industry has seen significant growth over the past few years. In 1996 the telecommunications industry had revenues of $222 billion which means that revenues have increased 28% from 1996 to today. Also in that year, Congress passed the 1996 Telecommunications Act, which was the first major overhaul of the Communications Act of 1934. The 1996 Telecommunications Act had several major goals, including continued pursuit of universal service via the USF in the US.2 This was to be made possible by the Universal Service Fund (USF) which would be administered by the Universal Service Administrative Company (USAC).
The USF is funded by a fee on the interstate and international long distance call revenue that is collected by telephone companies and remitted to USAC. These dollars are then distributed to eligible telecommunications carriers via the USF’s four subprograms. These
1 FCC, Trends in Telephone Service, September 2010, Tables 5.1, 10.2, 15.1, 2009 data (preliminary). The number of cellular-to-cellular phone calls was not available. 2 FCC, The Telecommunications Act of 1996, http://transition.fcc.gov/telecom.html

2
subprograms are known as: High Cost, Low Income, Rural Health Care, and Schools and Libraries.3 In 2010, USAC distributed $7.95 billion via these four subprograms.
The High Cost program helps to ensure that consumers across the country pay rates for telephone and information service that are comparable to those available in urban areas. These higher costs can derive from lower population densities or other factors, such as terrain, that make the delivery of services to affected households at reasonable rates not possible. This program is the largest source of USF funds receiving $4.27 billion in 2010 with average dollar/line support at $9.75 and median dollar/line support at $1.56.
The Low Income program aids low-income consumers to establish and preserve services who otherwise might not be able to afford such service. Last year, 2010, over 10.5 million households received the benefits of this program with disbursements from USAC at $1.32 billion.
The Rural Health care program reduces the rates for telephone and internet access service to rural health care providers. This is the lowest funded program which received $86 million in 2010. These dollars aid in the creation and support of advanced networks of telemedicine throughout the country. Over 3,000 health care providers receive this support yearly.
The final program is the Schools and Libraries program, or the ‘E-Rate’ program. This program provides discounted telephone service and internet access, and provides financial aid for basic maintenance and internal connections within schools and libraries in all 50 states and US territories. It is the second largest program and received disbursements of $2.28 billion in 2010. At the present time, there are over 22,000 eligible applicants benefiting from this program.
In February of 2011 the FCC released a Notice of Proposed Rule Making (NPRM) which seeks to significantly change the manner in which USF is distributed. Besides re-orienting the USF on broadband access instead of telephone service,4 the FCC proposed the following:
• Reduce the reimbursement rate for the high-cost loop program
• Phase out Local Switching Support (LSS)
• Set reimbursement rates for capital and operating expenses • Limit the total support per line any carrier can receive. This is despite the fact that the
FCC “recognize(s) that USF provides support to the hardest-to-serve-areas, which may be very costly to serve…”5
• Phase out Interstate Access Support (IAS) over a period of a few years
3 Universal Service Administrative Company, 2010 Annual Report, http://www.usac.org/about/governance/annual-reports/2010.html 4 FCC, Notice of Proposed Rule Making and Further Notice of Proposed Rule Making, Adopted Feb. 8, 2011, http://transition.fcc.gov/Daily_Releases/Daily_Business/2011/db0209/FCC-11-13A1.pdf 5 Ibid, pg. 12.
3
Study Area
This report analyzes the economic impact of the FCC’s NPRM on 35 of the, mostly rural, Incumbent Local Exchange Carriers (ILEC) in Missouri. AT&T, CenturyLink, and Windstream Communications were not included. The economic impact of USF changes was analyzed for each individual ILEC at the county level within the county or counties in which it had operations.6 The data was analyzed in 67 different counties (the target counties) in which the ILEC had a presence. Figure 1 shows the counties included in the study. These 67 counties represent 61% of the land area of Missouri. This data was then aggregated to the state level for reporting purposes.
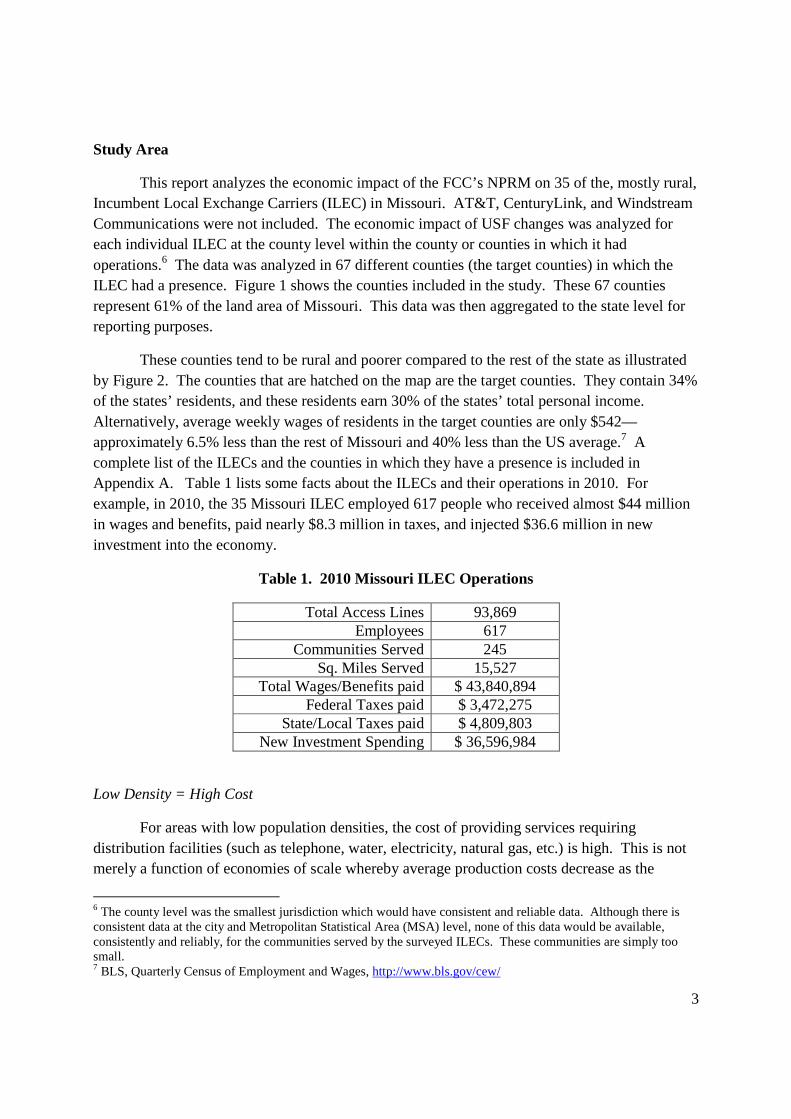
These counties tend to be rural and poorer compared to the rest of the state as illustrated by Figure 2. The counties that are hatched on the map are the target counties. They contain 34% of the states’ residents, and these residents earn 30% of the states’ total personal income. Alternatively, average weekly wages of residents in the target counties are only $542—approximately 6.5% less than the rest of Missouri and 40% less than the US average.7 A complete list of the ILECs and the counties in which they have a presence is included in Appendix A. Table 1 lists some facts about the ILECs and their operations in 2010. For example, in 2010, the 35 Missouri ILEC employed 617 people who received almost $44 million in wages and benefits, paid nearly $8.3 million in taxes, and injected $36.6 million in new investment into the economy.
Table 1. 2010 Missouri ILEC Operations
Total Access Lines 93,869 Employees 617
Communities Served 245 Sq. Miles Served 15,527
Total Wages/Benefits paid $ 43,840,894 Federal Taxes paid $ 3,472,275
State/Local Taxes paid $ 4,809,803 New Investment Spending $ 36,596,984
Low Density = High Cost
For areas with low population densities, the cost of providing services requiring distribution facilities (such as telephone, water, electricity, natural gas, etc.) is high. This is not merely a function of economies of scale whereby average production costs decrease as the
6 The county level was the smallest jurisdiction which would have consistent and reliable data. Although there is consistent data at the city and Metropolitan Statistical Area (MSA) level, none of this data would be available, consistently and reliably, for the communities served by the surveyed ILECs. These communities are simply too small. 7 BLS, Quarterly Census of Employment and Wages, http://www.bls.gov/cew/
4
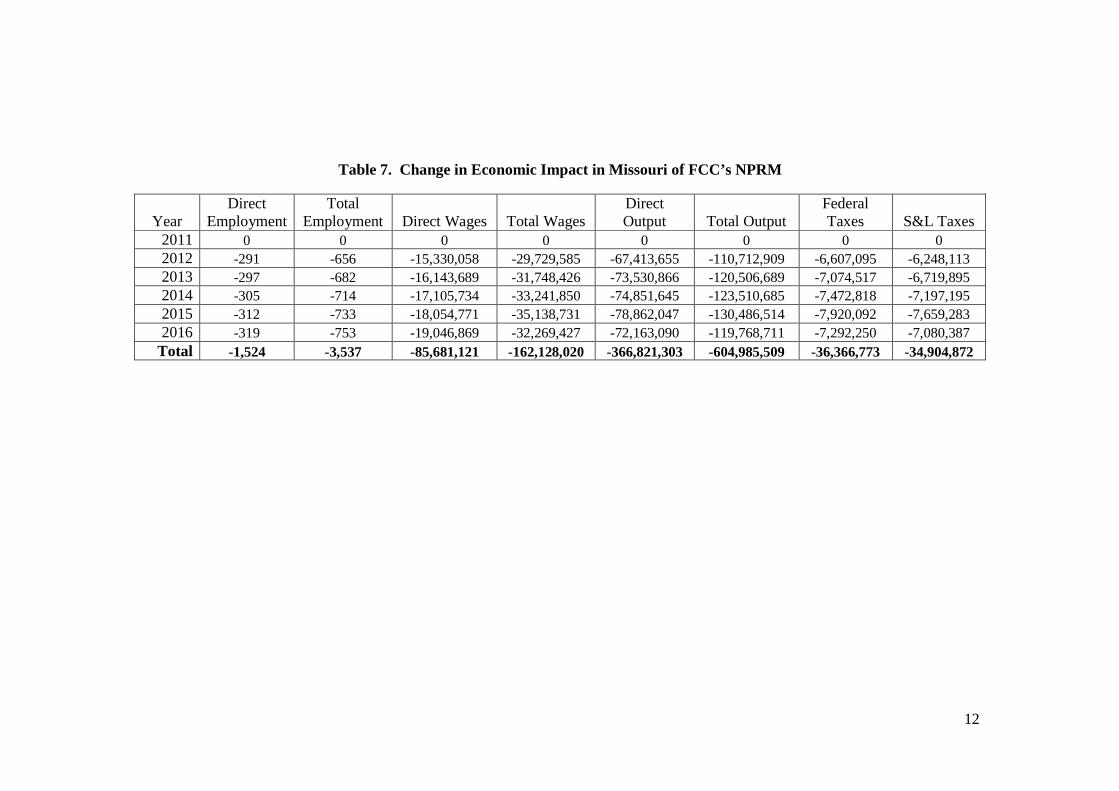
quantity produced increases. As there are fewer people per mile, the average cost of setting up a telephone loop from the switch to the customer is higher. Not only are the areas the ILECs serve low in customer density, but the population density of the target counties has been decreasing over the past 10 years. Of the 67 target counties, 52% of them lost population from the 2000 Census with an average population decrease of -5.5% among the counties to lose population. This loss is greater than the rest of Missouri counties where only 31% of the counties lost population, with an average population decrease of -2.3%8.
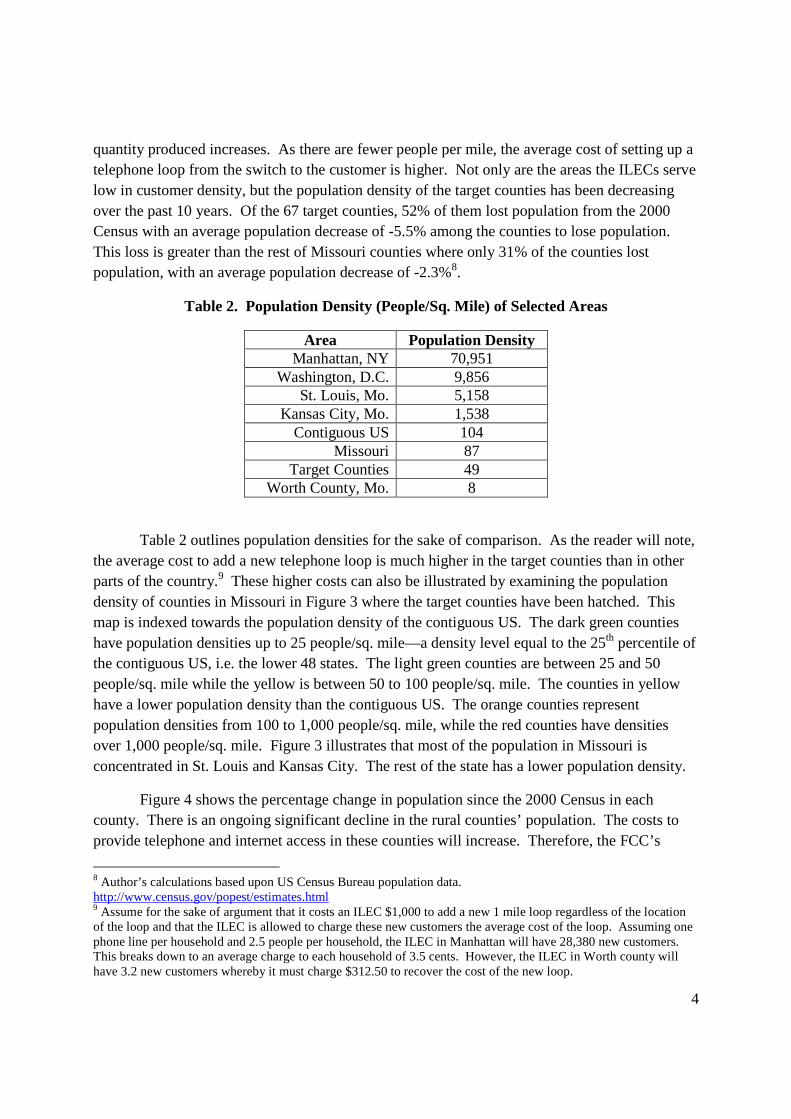
Table 2. Population Density (People/Sq. Mile) of Selected Areas
Area Population Density Manhattan, NY 70,951
Washington, D.C. 9,856 St. Louis, Mo. 5,158
Kansas City, Mo. 1,538 Contiguous US 104
Missouri 87 Target Counties 49
Worth County, Mo. 8
Table 2 outlines population densities for the sake of comparison. As the reader will note, the average cost to add a new telephone loop is much higher in the target counties than in other parts of the country.9 These higher costs can also be illustrated by examining the population density of counties in Missouri in Figure 3 where the target counties have been hatched. This map is indexed towards the population density of the contiguous US. The dark green counties have population densities up to 25 people/sq. mile—a density level equal to the 25th percentile of the contiguous US, i.e. the lower 48 states. The light green counties are between 25 and 50 people/sq. mile while the yellow is between 50 to 100 people/sq. mile. The counties in yellow have a lower population density than the contiguous US. The orange counties represent population densities from 100 to 1,000 people/sq. mile, while the red counties have densities over 1,000 people/sq. mile. Figure 3 illustrates that most of the population in Missouri is concentrated in St. Louis and Kansas City. The rest of the state has a lower population density.
Figure 4 shows the percentage change in population since the 2000 Census in each county. There is an ongoing significant decline in the rural counties’ population. The costs to provide telephone and internet access in these counties will increase. Therefore, the FCC’s
8 Author’s calculations based upon US Census Bureau population data. http://www.census.gov/popest/estimates.html 9 Assume for the sake of argument that it costs an ILEC $1,000 to add a new 1 mile loop regardless of the location of the loop and that the ILEC is allowed to charge these new customers the average cost of the loop. Assuming one phone line per household and 2.5 people per household, the ILEC in Manhattan will have 28,380 new customers. This breaks down to an average charge to each household of 3.5 cents. However, the ILEC in Worth county will have 3.2 new customers whereby it must charge $312.50 to recover the cost of the new loop.

5
proposed changes to USF will require the ILEC to increase revenues to continue to provide their current service levels. Revenues can be increased by raising rates, adding customers, or developing new lines of business or services--difficult, if not impossible, propositions in rural Missouri.
The basis for the FCC’s proposal to redirect USF is efficiency. In rural Missouri the FCC proposal would make it more difficult and more costly to provide comparable telephone and broadband, which would incent customers to drop off the network —two things the FCC has stated it does not want.
Data and Methodology
The amount of high-cost USF funds received for the past five years by each of the surveyed ILECs was not readily accessible; however, the total amount of high-cost USF disbursed on a national basis was available.10 As this report is forecasting five years into the future, the compound annual growth rate of USF disbursement over the past five years was determined. The compound annual growth rate is the rate at which an investment would have grown if it grew at a steady rate over the time of study. It is, in essence, a method of smoothing out the rate of growth for an investment.11 For the past five years, high-cost USF disbursements have grown at a rate of 2.366% per annum. This rate of growth was used to forecast future USF amounts that would accrue to the Missouri ILECs. Similar analysis, using national data, was used for ILEC non-USF revenues which were projected to grow at a compound annual growth rate of -1.68%.12
This analysis was extended towards the projected capital expenditures for facilities and equipment by the Missouri ILECs over the next five years. Once again, national data was used to econometrically estimate the relationship between capital spending and revenues. This was determined to be 28.4762 cents on the dollar—in other words, for every dollar of revenue received by an ILEC, it will invest approximately 28.4762 cents into capital expenditures for new facilities and equipment.13 We place a high degree of confidence in this estimate because it correlates very closely to the 2010 data from the Missouri ILECs. They had 2010 aggregated revenue of $129,712,259 and invested $36,596,989 into new equipment and structures—or 28.21 cents of investment to every dollar of revenue.
The amount of additional revenue that an ILEC needs to generate in order to hire another employee was estimated. Using national data on the amount of wireline revenues and the number of employees, this was estimated to be approximately $168,000 per employee in 2008.14
10 FCC, Trends in Telephone Service, September 2010, Table 19.3, 2009 data (preliminary) 11 The compound annual growth rate is determined by the following formula: {[(Ending value/Beginning value)]^(1/# of years)] -1} 12 FCC, Trends in Telephone Service, September 2010, Table 15.2, 2009 data (preliminary) 13 Ibid, Table 17.6 14 Ibid, Table 15.1 and BLS Current Employment Statistics, http://www.bls.gov/ces/
6
Unfortunately, the national data was not available for either 2009 or 2010 so a direct comparison between the national data and the 2010 Missouri ILEC estimate was not possible. However, in 2010 the Missouri ILECs had $210,230 of revenue for every employee, which is comparable to an estimate of ILECs in Kansas who had $259,900 in revenue for every employee in 2010.15 This estimate means that a Missouri ILEC will lay off an employee for every $210,230 drop in revenues. On the other hand, they would need to see revenues increase by $210,230 in order to hire another employee. The compound annual growth rate of average weekly wages was determined in a similar manner using national wage data for workers in the wireline telecommunications industry.16 This rate was then converted into an annual figure to determine yearly wages. Data at this level is only available back to 2007, but there was sufficient data to produce an estimated compound annual growth rate (CAGR) of 3.18% for wages. National average yearly wages were $63,521 for employees of wireline telecommunications firms, whereas they were $51,057 for employees of Missouri ILECs. Neither figure includes benefits. For purposes of this study, it was assumed that employee wages would increase at 3.18% per year while benefits would remain constant.
These estimates for future revenues, capital expenditures, wages, and USF revenues were applied to each of the Missouri ILECs in order to predict future activity by the ILEC. Tables 3 and 4 show these results. The data in Tables 3 and 4 does not constitute the total economic impact of the FCC changes to the USF program, but reflects how it will impact these Missouri ILECs in aggregate. For example, should the FCC continue the USF program without change, the 35 Missouri ILECs will have 626 employees in 2016. Over the next 5 years they will spend over $221 million on new investment, pay out over $273 million in wages and benefits, and pay nearly $51.5 million in federal, state, and local taxes.
On the other hand, should the FCC eliminate USF funding for these Missouri ILECs, they will see a dramatic decline in revenue. There would be two options available for these ILECs. The first would be to increase rates for existing telephone and broadband service. It is unclear if this can be accomplished politically or economically. Evidence suggests that the price elasticity of consumers for phone service is -0.46 while the cross-price elasticity is 0.3.17 In other words, for every 10% increase in price that the ILECs use to offset the decrease in universal service funds, they will lose 7.6% of their customers. Approximately 3% will substitute mobile-only phone service for wireline phone service and 4.6% will simply cease to have phone service at all.18 This creates a death spiral. In order to regain revenues, prices are raised, customers lost,
15 “Kansas Rural Local Exchange Carriers: Assessing the Impact of the National Broadband Plan”, Center for Economic Development and Business Research, Wichita State University, 2011. 16 BLS, Current Employment Statistics, http://www.bls.gov/ces/ 17 Train, K., McFadden, D. and Ben-Akiva, M. “The Demand for Local Phone Service: A Fully Discrete Model of Residential Calling Patterns and Service Choices.” RAND Journal of Economics, Vol. 18 (1987), pp. 109-123. Ward, M. and Woroch, G. “The Effects of Prices on Fixed and Mobile Telephone Penetration: Using Price Subsidies as Natural Experiments.” Information Economics and Policy, Vol. 22 (2010), pp. 18-32. 18 The extent to which consumers will substitute away from landline phone service and toward mobile phone-only service is a function of the quality of the mobile network in the area. If the mobile network is low quality, e.g. lots

7
creating pressure to raise prices again, which will again result in more customer losses. The result could be that a significant number of the ILECs, unable to make up the lost revenue, will cease operations all together.19 Assuming that other phone companies do not attempt to penetrate these markets, Missouri could see a large number of households who currently have phone and broadband services lose those services. The end result—customers dropping off the network—undermines not only the very purpose of the USF (i.e. universal service) it also undermines the FCC’s goal of advancing broadband service.
Table 3. Revenues, Employment, Investment, and Taxes for Missouri ILECs
(No Change in USF)
Year USF
Revenues Total
Revenues Employees Total Wages and Benefits
New Investment
Federal Taxes S&L Taxes
2011 59,721,706 129,893,584 618 38,106,256 36,642,980 3,575,645 4,952,991 2012 61,134,722 130,127,712 619 44,742,605 36,709,027 3,582,090 4,961,919 2013 62,581,169 130,415,077 620 45,877,308 36,790,093 3,590,000 4,972,876 2014 64,061,840 130,756,138 622 47,068,809 36,886,306 3,599,389 4,985,881 2015 65,577,543 131,151,377 624 48,319,914 36,997,803 3,610,269 5,000,952 2016 67,129,108 131,601,301 626 49,633,585 37,124,727 3,622,654 5,018,108
Total 380,206,088 783,945,188 3,729 273,748,477 221,150,938 21,580,046 29,892,727
Table 4. Revenues, Employment, Investment, and Taxes for Missouri ILECs (Removal of USF)
Year USF
Revenues Total
Revenues Employees Total Wages and Benefits
New Investment
Federal Taxes S&L Taxes
2011 59,721,706 129,893,584 618 38,106,256 36,642,980 3,575,645 4,952,991 2012 0 68,992,990 328 24,388,040 19,462,922 1,899,204 2,630,782 2013 0 67,833,908 323 24,574,582 19,135,945 1,867,297 2,586,585 2014 0 66,694,298 317 24,683,453 18,814,461 1,835,927 2,543,130 2015 0 65,573,834 312 24,868,267 18,498,379 1,805,083 2,500,405 2016 0 64,472,193 307 25,052,643 18,187,606 1,774,758 2,458,398 Total 59,721,706 463,460,806 2,205 161,673,242 130,742,293 12,757,914 17,672,291
The second option, and the one assumed for this project, would be for the ILEC to cut
costs, reduce its employees, and reduce its level of investments in facilities and equipment. It was further assumed that there would be no change in the quality or quantity of phone service in the short run. Under these conditions, one can expect new investment by the ILECs to fall to of ‘dead spots,’ then there will be less substitution and the impact will not be as large. Determining the quality of alternative mobile-only phone service in the target counties was beyond the scope of this project. 19This analysis was done under the following assumptions: a) businesses paid 2 ½ times what residential customers paid for wireline phone service, b) the cross price elasticity of demand facing businesses was ½ that facing households, c) the price elasticity for phone service was -.05 for businesses, and d) the business/residential proportion of the ILEC’s lines did not change. Under these conditions, total revenue will increase as the price of phone service increases until the price has increased by 45%. After this point, further increases in price would actually begin to decrease total revenue to the ILECs. Even at this point of maximum total revenue, the ILECs would still have 40% less revenue than they do now.

8
$130 million—a $90 million decrease. Tax payments to local, state, and federal agencies will fall by almost $39 million, wages and benefits would decrease by over $112 million and employment would be reduced by half. The decline in investment will create pressure that is likely to adversely impact the quality of phone and currently offered broadband service.
Input-Output Analysis
A county level Input-Output (IO) model was developed and implemented using IMPLAN to trace the economic impacts of the removal of the USF programs.20 Input-Output analysis assumes that in order for the economy of a region (such as a state or county) to generate output, it requires inputs. The pathway of these forward and backward linkages is tracked and recorded. For example, suppose that a new golf course is to be built in Kansas City, Missouri. There would be three different types of impacts from this activity. The actual construction and operation of the golf course would generate direct effects which would be associated with the direct purchase of inputs used in the production of golf games. The economic impact does not stop with the direct impact, as it has a ripple effect on other industries and households in the form of induced and indirect effects. For purposes of classification, the indirect effects are the increased use of inputs that are produced by other firms that are needed to meet the increased initial demands. The induced effects are created from the additional income generated and spent by households and business from the direct and indirect effects. Returning to the golf course example, the indirect effects could be in the form of increased commerce for local landscaping businesses that would plant and maintain the golf course. This generates additional income for the employees of the golf course and the landscaping company, who then purchase movie tickets, haircuts, restaurant meals, and other assorted goods and services which further generates additional income and consumption spending by these companies and their employees. This final effect is the induced effect.
The data for this project was then utilized within the econometric model to determine the economic effect that changes in USF revenues for the ILECs would have on the surrounding communities beginning in 2012 and running through 2016. These were then aggregated and reported on a state wide basis. This was compared to the present model that assumes no changes to the USF program. It was also assumed that the employees of the ILECs lived within the county/counties that they worked.
Results
The results are presented in Tables 5 through 7. Table 5 shows what the economic impact on the state of Missouri of the continuation of the USF program whereas Table 6 illustrates the economic impacts of its removal. Table 7 demonstrates how removing the program will likely impact the state of Missouri. The data in Tables 5 through 7 are in nominal
20 IMPLAN is a software package that is used in Input-Output analysis to determine the size and nature of economic shocks using a classification system of 509 different sub-sectors of the economy
9
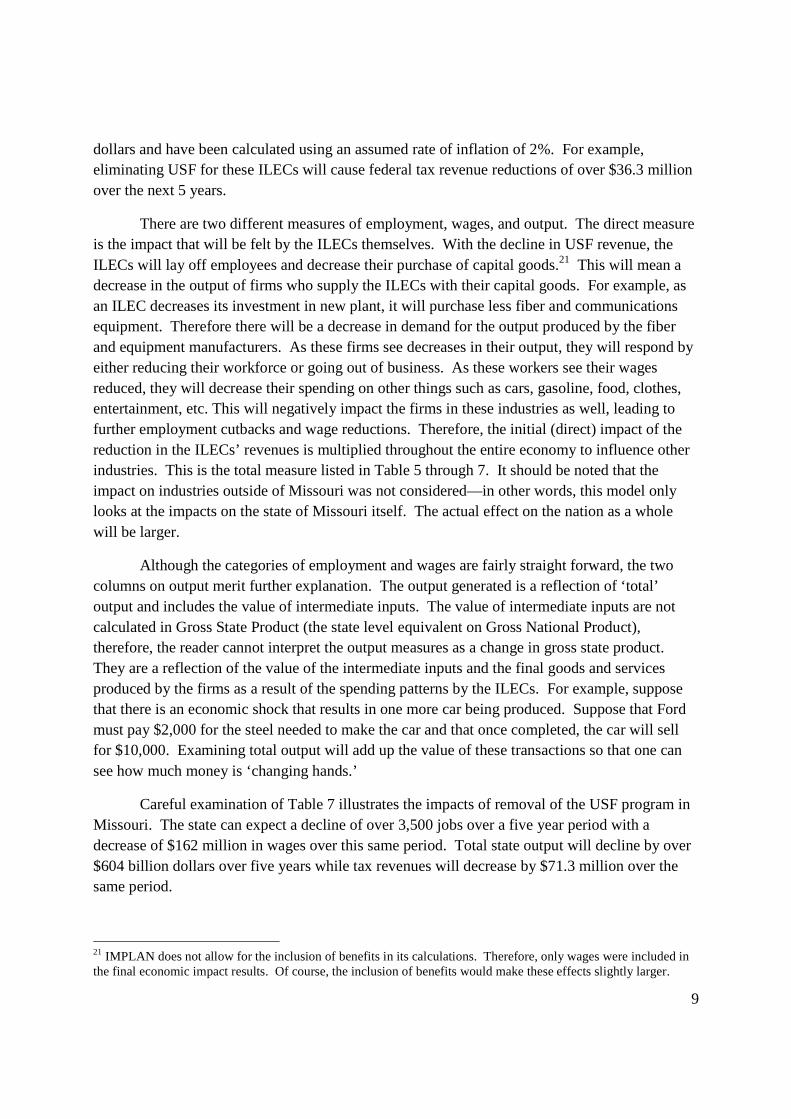
dollars and have been calculated using an assumed rate of inflation of 2%. For example, eliminating USF for these ILECs will cause federal tax revenue reductions of over $36.3 million over the next 5 years.
There are two different measures of employment, wages, and output. The direct measure is the impact that will be felt by the ILECs themselves. With the decline in USF revenue, the ILECs will lay off employees and decrease their purchase of capital goods.21 This will mean a decrease in the output of firms who supply the ILECs with their capital goods. For example, as an ILEC decreases its investment in new plant, it will purchase less fiber and communications equipment. Therefore there will be a decrease in demand for the output produced by the fiber and equipment manufacturers. As these firms see decreases in their output, they will respond by either reducing their workforce or going out of business. As these workers see their wages reduced, they will decrease their spending on other things such as cars, gasoline, food, clothes, entertainment, etc. This will negatively impact the firms in these industries as well, leading to further employment cutbacks and wage reductions. Therefore, the initial (direct) impact of the reduction in the ILECs’ revenues is multiplied throughout the entire economy to influence other industries. This is the total measure listed in Table 5 through 7. It should be noted that the impact on industries outside of Missouri was not considered—in other words, this model only looks at the impacts on the state of Missouri itself. The actual effect on the nation as a whole will be larger.
Although the categories of employment and wages are fairly straight forward, the two columns on output merit further explanation. The output generated is a reflection of ‘total’ output and includes the value of intermediate inputs. The value of intermediate inputs are not calculated in Gross State Product (the state level equivalent on Gross National Product), therefore, the reader cannot interpret the output measures as a change in gross state product. They are a reflection of the value of the intermediate inputs and the final goods and services produced by the firms as a result of the spending patterns by the ILECs. For example, suppose that there is an economic shock that results in one more car being produced. Suppose that Ford must pay $2,000 for the steel needed to make the car and that once completed, the car will sell for $10,000. Examining total output will add up the value of these transactions so that one can see how much money is ‘changing hands.’
Careful examination of Table 7 illustrates the impacts of removal of the USF program in Missouri. The state can expect a decline of over 3,500 jobs over a five year period with a decrease of $162 million in wages over this same period. Total state output will decline by over $604 billion dollars over five years while tax revenues will decrease by $71.3 million over the same period.
21 IMPLAN does not allow for the inclusion of benefits in its calculations. Therefore, only wages were included in the final economic impact results. Of course, the inclusion of benefits would make these effects slightly larger.

10
As disconcerting as these results are, they are smaller than the total effects of what the FCC may do. The FCC has also proposed reductions in inter-carrier compensation (ICC) for both interstate and intrastate calls. This study has focused only on changes in USF revenue. ICC is also a significant source of revenue to these ILECs. Reductions or eliminations in ICC will further reduce, and therefore adversely impact, new investment spending, employment, output, and tax revenues within Missouri.

11
Table 5. Economic Impact in Missouri of Continuation of USF Funding to Missouri ILECs
Year Direct
Employment Total
Employment Direct Wages Total Wages Direct Output Total Output
Federal Taxes S&L Taxes
2011 618 1,428 31,553,226 61,057,048 138,618,379 227,286,383 13,614,596 12,945,630 2012 619 1,417 32,609,299 63,214,390 143,246,024 235,274,855 14,093,974 13,397,968 2013 620 1,434 33,700,631 65,820,992 150,484,653 247,177,587 14,713,581 14,046,430 2014 622 1,455 34,884,480 67,794,657 152,655,210 251,892,254 15,240,339 14,678,224 2015 624 1,466 36,109,542 70,278,138 157,725,612 260,975,540 15,840,338 15,318,713 2016 626 1,477 37,377,241 67,995,380 152,055,896 252,366,394 15,365,607 14,919,188 Total 3,729 8,679 206,234,419 396,160,605 894,785,774 1,474,973,012 88,868,434 85,306,151
Table 6. Economic Impact in Missouri of Removal of USF Funding to Missouri ILECs
Year Direct
Employment Total
Employment Direct Wages Total Wages Direct Output Total Output
Federal Taxes S&L Taxes
2011 618 1,428 31,553,226 61,057,048 138,618,379 227,286,383 13,614,596 12,945,630 2012 328 761 17,279,241 33,484,804 75,832,369 124,561,945 7,486,879 7,149,855 2013 323 753 17,556,942 34,072,567 76,953,787 126,670,898 7,639,063 7,326,535 2014 317 742 17,778,746 34,552,807 77,803,565 128,381,568 7,767,521 7,481,029 2015 312 733 18,054,771 35,139,407 78,863,565 130,489,025 7,920,246 7,659,430 2016 307 725 18,330,372 35,725,953 79,892,806 132,597,683 8,073,357 7,838,800 Total 2,205 5,141 120,553,298 234,032,585 527,964,471 869,987,503 52,501,662 50,401,279
12
Table 7. Change in Economic Impact in Missouri of FCC’s NPRM
Year Direct
Employment Total
Employment Direct Wages Total Wages Direct Output Total Output
Federal Taxes S&L Taxes
2011 0 0 0 0 0 0 0 0 2012 -291 -656 -15,330,058 -29,729,585 -67,413,655 -110,712,909 -6,607,095 -6,248,113 2013 -297 -682 -16,143,689 -31,748,426 -73,530,866 -120,506,689 -7,074,517 -6,719,895 2014 -305 -714 -17,105,734 -33,241,850 -74,851,645 -123,510,685 -7,472,818 -7,197,195 2015 -312 -733 -18,054,771 -35,138,731 -78,862,047 -130,486,514 -7,920,092 -7,659,283 2016 -319 -753 -19,046,869 -32,269,427 -72,163,090 -119,768,711 -7,292,250 -7,080,387 Total -1,524 -3,537 -85,681,121 -162,128,020 -366,821,303 -604,985,509 -36,366,773 -34,904,872

13

14

15
16

17
Appendix A. Telephone Company List and Counties
Alma Communications: Lafayette BPS Telephone Company: New Madrid, Pemiscot, Stoddard Chariton Valley Telephone Corporation: Carroll, Linn, Macon, Randolph, Chariton, Shelby, Monroe, Livingston Choctaw Telephone Company: Greene, Lawrence Citizens Telephone Company of Higginsville, Mo: Lafayette Craw-Kan Telephone Cooperative, Inc.: Bates, Vernon, Barton, Jasper Ellington Telephone Company: Reynolds, Shannon Farber Telephone Company: Audrain Fidelity Telephone Company: Franklin, Gasconade, Crawford, Washington Goodman Telephone Company: McDonald, Newton Granby Telephone Company: Newton, Jasper Grand River Mutual Telephone Corporation: Andrew, Worth, Harrison, Mercer, Grundy, Gentry,Nodaway, Putnam, Sullivan, Linn, Livingston, Daviess Green Hills Telephone Corporation: Linn, Livingston, Caldwell, Ray, Carroll, Daviess Holway Telephone Company: Holt, Nodaway Iamo Telephone Company: Atchison, Nodaway Kingdom Telephone Company: Montgomery, Callaway KLM Telephone Company: Bates, Vernon Lathrop Telephone Company: Clinton, Caldwell Le-Ru Telephone Company: Barry, McDonald, Newton Mark Twain Rural Telephone Company: Clark, Lewis, Shelby, Schuyler, Scotland, Marion,
Macon, Knox, Adair McDonald County Telephone Company: McDonald Miller Telephone Company: Lawrence, Dade MoKan Dial, Inc.: Cass New Florence Telephone: Montgomery New London Telephone Company: Ralls, Northeast Missouri Rural Telephone Company: Putnam, Sullivan, Adair, Scotland, Clark, Schuyler, Knox, Linn, Macon Orchard Farm Telephone Company: St. Charles Oregon Farmers Telephone Company: Holt Otelco, Inc. Mid Missouri Division: Saline, Pettis, Cooper, Morgan, Moniteau Ozark Telephone Company: McDonald Peace Valley Telephone Co., Inc.: Howell, Oregon Rock Port Telephone Company: Atchison Seneca Telephone Company: Newton, McDonald Steelville Telephone Exchange, Inc.: Crawford, Washington, Iron, Dent Stoutland Telephone Company: Laclede, Camden

18