Embed Size (px)
Citation preview
INTELLECTUAL PROPERTY RIGHTS AND
AGRICULTURE: AN ANALYSIS OF THE
ECONOMIC IMPACT OF PLANT BREEDERS’
RIGHTS
By Dwijen Rangnekar
Research Associate, School of Economics, Kingston University,
UK
Prepared for Actionaid, UK
March 2000
Page i
TABLE OF CONTENTS
LIST OF FIGURES II
LIST OF TABLES III
INTRODUCTION 1
1. THE MAKING OF PLANT BREEDERS’ RIGHTS 4
1.1 Introduction 4
1.2 Early Efforts in Controlling Plant Genetic Resources 4
1.3 Early Interest in Breeders’ Rights in Britain 5
1.4 The Development of Seed Regulation on the Continent 8
1.5 UPOV – The Creation of a Sui Generis System for Protecting Plant Varieties 9
1.6 Introducing PBRs in the UK – The Plant Variety and Seeds Act (1964) 13
1.7 Conclusion 14
2. AGRICULTURE IN THE UK – SOME STATISTICAL EVIDENCE 15
2.1 Introduction 15
2.2 Macro Indicators 16
2.3 Land Distribution 20
2.4 Farm Incomes 23
2.5 Some Closing Points 25
3. AGRICULTURAL RESEARCH IN THE UK – BRIEF NOTES ON THE STRUGGLE TOCONTROL SCIENCE 26
3.1 Introduction 26
3.2 The Early Period 26
3.3 Centralised State Agricultural Research – 1947-71 27
Page ii
3.4 Rothschild Report Period – 1971-79 28
3.5 Radical Liberalisation – 1979-present 29
4. THE ECONOMIC IMPACT OF PLANT BREEDERS’ RIGHTS – EVIDENCE FROMUSA AND UK 30
4.1 Introduction 30
4.2 Investments in Plant Breeding 31
4.2(a) Firms and Investments in Plant Breeding 32
4.2(b) Changing Distribution of Private Investments 34
4.3 New Varieties 36
4.4 Market Concentration 44
4.5 Reflections on Market Power – Evidence of Changing Seed Prices 50
CONCLUSION 52
REFERENCES 56
List of Figures
Figure 1 16
Figure 2 17
Figure 3 19
Figure 4 21
Figure 5 22
Figure 6 24
Figure 7 25
Figure 8 33
Figure 9 35
Figure 10 39
Figure 11 45
Figure 12 47
Figure 13 47
Figure 14 51

Page iii
List of Tables
Table 1 18
Table 2 27
Table 3 37
Table 4 37
Table 5 42
Table 6 43
Introduction
Page 1
Introduction
Seeds are the most important input into agriculture – an importance that is belied by the cost
of a packet of seeds. The importance goes beyond what has been recognised as a form of
embodied technical change – technical change resulting from the varietal characteristics
embodied within the seed (i.e. the variety). Other forms of technical change in agriculture
relate to the organisation of agriculture and the range of inputs used in agriculture. Thus, the
replacement of animal and human labour by machines – mechanisation – allows tremendous
productivity improvements. However, the effective exploitation of the potential benefits of
mechanisation depend on the seed – it is only with the development of uniform maturing
varieties with characteristics amenable to machine-handling that mechanisation can become
pervasive on the farm. A similar predicament faces the extensive use of a range of chemical
inputs into agriculture – varieties that are developed to respond to these chemicals, with
characteristics like short stature, improved partitioning, etc., allow the widened use of the
chemicals. In this manner seeds form the delivery mechanism for most inputs intoagriculture. As such, the adoption of any new input into agriculture is fundamentally
contingent on varietal developments. By extension, plant breeding is of crucial importance in
determining the direction of technical change in agriculture. Hence, the efforts to control
breeding companies and the pressure to privatise agricultural research. Naturally, for private
investment to enter into agriculture some form of control must be offered as inducement.
Intellectual property rights (IPRs) as the preferred inducement is the subject of this extended
paper. Here we provide an overview of the analysis that is to follow.
Chapter 1 focusses on the origins of the system of IPRs pertaining to plant varieties – plant
breeders’ rights (PBRs) which fall within the jursidiction of the International Union for the
Protection of New Varieties of Plants (UPOV). The analysis reviews the debates that took
place when UPOV was established. Of particular importance in this review are:
• What were the factors that favoured the establishment of PBRs and were there anyconflicts or oppositions to their introduction? If so, how were those conflicts resolved.
• Importantly, given the existence of patents, why were plant varieties protected by aseparate, sui generis, system?
The latter issue has contemporary relevance in that increasing pressure is being mounted to
make plant varieties patentable subject matter. While, in the US patenting of plant varieties is
possible, under the European Patent Convention plant varieties are excluded from the scope
of application of patent law. An exemption that is reflected in the TRIPs Agreement, art.
27.3b.
Introduction
Page 2
The review establishes that the development of PBRs were closely related to regulatory
systems controlling the seed market. In particular, the developments in the UK were largely
confined to issues concerning the seed market. Farmers were concerned with the quality of
varieties that entered the market and demanded the introduction of merit tests as arequirement for marketing of a variety. In addition, given the biological and variable nature
of seeds, farmers demanded some legally-binding warranty in the form of labelling ofseeds, which would ensure that the packaged seeds were actually of the named variety on
the label. The latter demand related to possible misinformation that characterised trade in
seeds. Breeders in the UK expressed their frustration with existing regulatory systems that
did not adequately compensate them for the invention they produced. Enactment of thePlant Variety and Seeds Act in 1964 aimed at resolving these conflicts and tensions, whilst
also enabled Britain to fulfill its obligation to UPOV (which it signed in 1962).
The analysis establishes the manner in which the demands by farmers were gradually
appropriated by breeders and the regulatory authorities to introduce a system that provided
breeders with greater control over seed production. Popular rationalisation of PBRs was
based on the rhetoric of biological necessity – the breeder is best placed to maintain the
genetic constitution of the variety. Further, reflecting a laissez faire approach, the demands
for merit tests prior to market entry was entirely rejected. Instead, the system adopted was of
voluntary controls, with farmers’ choice through the market determining merit.
Historical analysis of the establishment of UPOV in 1961 sheds useful insights for
contemporary debates concerning the patenting of plant varieties. The analysis here
indicates that the primary opposition to the inclusion of plant varieties within the jurisdiction of
patent law was from industrial property lawyers. Despite existing national patent law practice
which provided patents on a range of species, mainly ornamentals and vegetables, the
inclusion of the entire plant kingdom would have led to some dilution of standards and
requirements of patenting.
Chapter 2 provides useful background statistical information on the changing fortunes ofagriculture in the UK. Agriculture in the UK, as in most other developed countries, has been
radically transformed in the 20th century. The practice of farming has become highly technical
and mechanised. Of particular interest and importance are the broad macro changes in the
status of agriculture as a dimisshing contributor to GDP and the labour force. In addition, the
chapter reviews characteristic features of industrialised agriculture:
• Even while a range of indicators establish the tremendous productivity improvements inagriculture, there is compelling evidence of increasing immerisation of the farm
Introduction
Page 3
• Accompanying the general trend of land consolidation is evidence of increasing numberof small holdings, which continue to persist but also remain marginal economic entities.
The chapter reflects on the above trends and presents statistical data to support the
conclusions.
Chapter 3 provides additional background material on agriculture in the UK. Here attention is
devoted to the historical struggle over controlling agricultural research in the UK. The pulls
and pushes of differing political agendas, the changing fortunes of private industry and the
varying demands of clients in agriculture have led to a number of changes in the agricultural
research system in the UK. The discussion points out important stages in the changing
complexion of the agricultural research system. In more recent years, the overarching
philosophy grounding the governments attitude to R&D in general has been one of radicalliberalisation. Under this approach the government, under Thatcher developed a plan to
withdraw from any research that had a near-market position. Consequently, varietal
development and much of plant breeding was deemed to be handed over to the private
sector.
Chapter 4 presents an economic analysis of PBRs based on available evidence from the US
and UK. As yet there is very little systematic work on the economic analysis of PBRs. Most of
the available literature on PBRs is directed at the politics of the issue and avoids undertaking
a comprehensive analysis of economic issues. The analysis presented here concentrates on
three primary issues:
• Investment in plant breeding: One of the primary rationalisations concerning any IPRsis its ability to stimulate private investment. The analysis reviews the evidence in thisregard and examines if investment has increased across the board, and if so, is theincrease a result of the availability of PBRs.
• Production of new varieties: A key rationale supporting IPRs is the positive impact ithas on inventive activity. In the case of plant breeding, the main inventive activity is theproduction of new varieties. An economic analysis of time series data on new grantsissued is presented to examine this claim.
• Market Power: PBRs, much like any other IPRs, will aggravate market structures as theyare a type of barrier-to-entry. One reflection of changing market power is the trend inseed prices. Statistical evidence in this regard is examined to enable a conclusion onwhether excessive monopoly power has resulted in recent times.
Apart from the above primary focus, chapter 4 also presents analysis of equally important
issues concerning PBRs, such as the exchange of genetic material and the issues
confronting plant breeding in the future.
1. The Making of Plant Breeders’ Rights
Page 4
1. The Making of Plant Breeders’ Rights
1.1 INTRODUCTION
It is important to keep in mind that PBRs are a very recent development – the first formal
system emerging in the 1920s in Europe and the first legal right being the Plant Patent Act
(1930) in the US. Given the contemporary nature of their development, it is pertinent to
examine the historical and economic factors that led to the introduction of such rights. The
question is of importance given the significance of plant breeding (and agricultural research)
and the fact that plant varieties are living organisms. The questions that the discussion to
follow addresses are:
• How did the international system of PBRs at UPOV come about?
• What were the factors that favoured the establishment of PBRs and were there anyconflicts or oppositions to their introduction? If so, how were those conflicts resolved.
• Importantly, given the existence of patents, why were plant varieties protected by aseparate, sui generis, system?
• All these questions bear on the developments in the UK which introduced PBRs throughthe Plant Variety and Seeds Act (1964) – hence the discussion of the UK case is alsopresented below.
1.2 EARLY EFFORTS IN CONTROLLING PLANT GENETIC RESOURCES
Colonialism is closely associated with efforts at controlling the movement and supply of
critical plant genetic resources. At times, entire species have been moved across continents
in what Mooney (1983) has characterised a `botanical chess game’. The development and
spread of botanical gardens in the 17th and 18th century is implicated in this colonial exercise
of securing strategic control over plant genetic resource (Brockway, 1979). It is recorded that
the gardens themselves sponsored “plant hunters” on colonial expeditions (Allard, 1960: 21).
Even while legal-sounding edicts have been made in the past, e.g. the edict issued by the
Papal States in 1883 (Lange, 1985), 20th century multilateral agreements have advanced the
degree of control to a much higher level by enabling rights in particular genetic combinations
that constitute a plant variety and/or specific genes themselves.
In the early decades of the 20th century, across Europe significant steps were taken to
establish rights for the plant breeder – 1921 law in Czechoslovakia and 1922 in France.
Similar laws in Austria in 1938, the Netherlands in 1941, and Federal Republic of Germany in
1953 (Laclaviëre, 1965; UPOV, 1984) followed these developments. Case law in Italy in
1. The Making of Plant Breeders’ Rights
Page 5
1948 and 1950 established new plant varieties as “industrial results” enabling their protection
under patents (Wuesthoff and Wuesthoff, 1952). In contrast, in the US, efforts at securing
control over plant genetic resources took a decidedly legal step. A bill for the protection of
horticultural plants, vines and trees was presented to Congress in 1906 (Bugos and Kevles,
1992), which after a number of submissions and modifications eventually became the PlantPatent Act, 1930 - making it the first patent act for plants (Fowler, 1994). The scope of
protection varied from denominational protection and forms of seed certification (France and
Czechoslovakia) to a limited form of exclusive control over the commercial exploitation of the
variety (the Netherlands and Germany). In some cases the application of law was restricted
to only vegetatively propagated species (US). Important features of the system were:
• French Decree of 1922: Three core elements define the system, a catalogue ofcultivated species, legislation controlling the trade in seeds and trademark protection. Inpractise, the self-discipline of the traders ensured that only seeds of registered varieties(those on the catalogue) could be commercialised (under existing trade regulation) andwere bought and sold using the variety name owned by the breeder (following trademarkprotection) (Berlan and Lewontin, 1986).
• Plant Breeders’ Decree of 1941 (the Netherlands): The seed market was regulatedthrough a certification process that only allowed named varieties to be transacted.Breeders had rights that allowed them to earn a royalty on first-generation seeds(Pistorius and van Wijk, 2000).
Two specific problems confronted the development of seed trade across Europe.
Firstly, the nominal, though important difference between national practice across Europe
proved to be a hurdle to the growing pan-European seed trade. Secondly, breeders
themselves were dissatisfied with the inadequacies of trademark based protection – here
only the varietal name was protected, thus allowing identical varieties under different names
to be marketed. Efforts were aimed at enhancing the scope of breeders’ rights, which, as will
be clarified below, were closely related to establishing a pan-European regulation on seed
moving in international trade.
1.3 EARLY INTEREST IN BREEDERS’ RIGHTS IN BRITAIN
To an extent, Britain remained conspicuous in the above developments. The debate
concerning PBRs in Britain is said to originate in a memorandum circulated by a Scottish
breeder, JBF McGill, in March 1946. The proposal was for a system of official testing of
varieties followed by an acreage levy that would accumulate to breeders. This memorandum
was followed by a Copyright Sub-committee directed to examine `the necessity and/or
desirability of organising a scheme of copyright for new cereal varieties’. While the committee
concluded in the negative, concern within the private and public sector was increasingly
1. The Making of Plant Breeders’ Rights
Page 6
expressed in terms of trade-related problems. At that stage, under the Seeds Act (1920), itwas mandatory to declare the variety name in all transactions concerning seeds. However,
there were some problems:
• Quality and merit requirements: There was no obligation on breeders and/or seedmerchants to meet any minimum quality/merit requirement for commercially transactedseeds.
• Seed labelling: There was no binding obligation concerning labelling of seed packets,neither was it necessary to report the merits of the variety, nor were the declarations on aseed label legally contestable.
• Plant breeders’ rights: As yet, breeders had no means of controlling the use andexploitation of varieties they bred.
Farmer groups were critically concerned with two of the above shortcomings of the seed
market regulations. Not only was there a demand for good quality varieties to be bred
domestically, but equally the concern was directed at ensuring supplies of authentic seeds. A1950 Committee on Qualitative Control of Seeds concluded that
• Official register of variety names should be developed to establish an unambiguousrelationship between variety name and varietal characteristics, a process that wouldeliminate synonyms.
• The use of variety name should be restricted to certified seeds of the named variety soas to ensure that seed traded under a particular variety name would be authentic andcorroborate to the varieties known characteristics. A development that would support theefforts in creating an official register of varieties.
The recommendations reflected a consumer protection rhetoric – one of the aims of the
regulations was to ensure reliable transactions in the seed market so as to protect the farmer
from wrongful labelling and/or substandard seeds. Yet, the Committee did not make merittests a statutory requirement for market entry nor seed certification mandatory –
seeds of any level of quality/merit could enter the official register and their seeds be
transacted on the market. Adopting a laissez faire approach, the government considered it
preferable to establish a voluntary system based on farmer-choice aided by the official
register:
… use of improved varieties could be promoted more readily by shortrecommended lists of the best in performance trials than by legislation restrictingthe sale of seeds to varieties which were equal to those in current use(Wellington, 1974: 100).
A subsequent examination of the two issues of merit tests and seed labelling by theCommittee on Transactions in Seeds (1957) (CTS) maintained the legal impunity of
declarations on the seed label:
1. The Making of Plant Breeders’ Rights
Page 7
… it would not be reasonable at this stage to require seed merchants to acceptlegal liability for civil claims in every case where a statement as to the varietymade in good faith subsequently proves to have been at fault. Nevertheless, abuyer of seed who suffers loss through the sale and delivery of wrongly namedseed should receive ex gratia compensation from the seller (paragraphs 303-04).
Clearly, the approach adopted in Britain was to separate the requirements of merit from
market entry of a variety. It was felt that breeders themselves would submit varieties for
official merit tests on a voluntary basis. The National Institute of Agricultural Botany (in
Cambridge) (NIAB) had been conducting variety merit tests for quite a while and reported the
results in Recommended Lists and Farmer’s Leaflets, which farmers used in deciding on
the appropriate variety to purchase for planting. The Recommended List for cereals were
introduced in 1944, following earlier work on potato. The work on merit of a variety was
closely tied into the core effort of NIAB – eliminating synonyms in the trade. Even whileNIAB pioneered a system of `aiding’ farmer-choice in the seed market, the regulatorysystem did not make merit-tests a statutory requirement for a variety to becommercialised.
As far as the issue of seed labelling is concerned, the government and regulatory bodies
adopted a similar laissez faire approach, with faith being expressed in the wider voluntary
adoption of seed certification regulations by merchants. Once again, NIAB handled work on
developing a system of seed certification that was dedicated to ensuring the maintenance of
distinguishing varietal characteristics throughout the seed production process. Through the
early 1940s a voluntary seed certification scheme was initiated and by 1954 a NationalCertifying Authority for Herbage Seeds was established and the following year the
category of `certified seeds’ became a trade entity. The mark of certified seeds was an
important trade advantage:
.. an indication not only of varieties of merit, but also of seed which has beenmost carefully produced to preserve the valuable characteristics of thosevarieties (Kelly, 1968: 49).
The discussion above demonstrates that much of the interest in breeders’ rights in Britain
was mediated through the struggle between farmers on one side and breeders and seed
merchants on the other side. Demands by farmers for reliable seed labelling and merit tests
as a prerequisite for market entry of a variety were repeatedly rejected. Instead, the
regulatory authorities adopted a laissez faire attitude of developing a vast regulatory system
focussed on (a) an index of varieties and (b) seed production processes. It was felt that the
market would automatically weed-out inferior varieties and that farmer-choice, aided by the
NIAB’s Recommended Lists, would ensure the adoption of the best variety.
1. The Making of Plant Breeders’ Rights
Page 8
Importantly, demand to make breeders and seed merchants legally responsible for
declarations on seed labels by the farmers was gradually being transformed into a reverse
demand by breeders for greater control over seed production (see section 1.6).
1.4 THE DEVELOPMENT OF SEED REGULATION ON THE CONTINENT
The one remarkable, though less reported, fact about the story of UPOV – the creation of a
sui generis system for plant varieties – is the existence of its core elements in the seed
regulatory system that was being rationalised and harmonised across by the Organisationfor European Economic Cooperation (OECD’s predecessor) in the 1950s. Despite
national differences, two features stand out within the national seed certification schemes in
Europe:
• Index of Varieties: developing a system of distinguishing varieties so as to eliminatesynonyms and create a register/index of varieties.
• Seed Certification: Developing regulations to oversee the maintenance of varietal puritythrough all stages of seed production and issuing certificates of `trueness to type’ – thepackaged seeds are of the named variety.
The problems confronting the emergent cross-border trade in seeds in Europe related to key
regulatory issues – national regulatory authorities used different terms to designate seeds of
particularly standards. Further, increasing cross-border trade raised the potential problem of
the introduction of the same variety under several different names – undermining national
efforts at creating an Index of Varieties. Finally, breeders themselves were increasingly
feeling frustrated in their efforts at not benefiting from the growing seed trade – availabletrademark type protection did not protect the specific breeding effort – the new varietyproduced – instead it focussed on the variety name. Anybody could replicate/copy the
`protected’ variety and trade it under a different name without infringing existing regulations.
The early 1950s saw efforts devoted at harmonisation of terminology and standards ofcertified seeds moving in international trade, initially concentrating on herbage seeds. The
results of the work was development of “common basis for the procedure by which certified seed
of comparable standards is produced” (Horne and Kelly, 1967: 260) – leading to an agreement
establishing the OEEC Herbage Seed Scheme (1958). Among the issues the scheme
established were the conditions for market-entry of varieties, demarcation of the role and
responsibility of breeders with respect to the authenticity of seeds, and necessary safeguards
concerning seed production. Among these provisions, two are critical:
• Seeds of varieties entering from other countries must have the breeder’s consent so asto ensure that “authentic seeds would be made available for multiplication”.
1. The Making of Plant Breeders’ Rights
Page 9
• In the interest of maintaining the authenticity of a variety, the “breeder [is] responsiblefor ensuring that successive lots of seed were available to provide the continuity of thescheme”.
These two provisions established de facto breeders’ rights – making the supply of seeds
contingent on the breeders’ consent. Yet, the provision was rationalised through the rhetoricof biological necessity – the breeder is best placed to maintain the genetic constitution of
the variety (Heitz, 1987: 77). The connection between breeders’ consent and a rhetorical
concern for authentic seeds attempted to resolve the consistent demand by farmers for
quality seeds and legally binding seed labelling.
Importantly, the close connection between breeders’ rights and the seed multiplication
developed with seed certification schemes was not in variance with the demands for PBRs
by breeders. This is amply demonstrated by the following quote from the President of the
Seed-Flower Section of ASSINSEL, the lobby group of breeders canvassing for breeders’
rights:
Only the production of stock seed is reserved to the originator. And this exclusiveright is necessary to maintain the type and quality of the creation (Schreiber,1962: 242).
In accepting the close relationship between exercising exclusively control over seedproduction (i.e. stock seed, or first generation seed) and ensuring quality andauthenticity of traded seeds that breeders were able to garner the support ofregulatory authorities. The UPOV system, established later in 1961, followed the example
of the seed certification schemes in two important directions.
Firstly, it made the scope of PBRs include the breeders’ right to earn a royalty through seed
multiplication – the production of stock seeds. Secondly, it required the breeder to be
responsible for maintaining the variety `true to type’ through out the period of grant, failing
which the grant would be revoked. As such, UPOV played the role of harmonising and
rationalising seed certification schemes across Europe with the additional benefit of providing
a legally binding PBRs system.
1.5 UPOV – THE CREATION OF A SUI GENERIS SYSTEM FOR PROTECTING PLANT
VARIETIES
A crucial historical question relates to the forces that led to the establishment of UPOV in
1961 – what led to the protection of plant varieties by a sui generis system, separate
1. The Making of Plant Breeders’ Rights
Page 10
from, and independent of, the pre-existing patent system? This question reflects upon a
number of precedents and favourable factors in the run-up that led to a sui generis system
for plant varieties – a system that specifically secured the protection of plant varieties under a
more liberal and less monopolistic system of legal rights. In contrast to the final outcome, a
number of factors actually favoured the inclusion of plant varieties within national patent
systems:
• The wide notion of industrial property within the Paris Convention includedagriculture products (see art. 1[3] of the 1934 London Conference), hence opening thepossibility of plant varieties being considered `industrial products’ and accordinglypatentable subject matter. As noted below, some countries sought this route withinnational patent law.
• The inclusion of plant varieties, of select species, within national patent law wasincreasingly become common practice in a number of countries. In the US, the 1930Plant Patent Act covered patents for vegetatively propagated species. Ornamentals wereconsidered patentable subject matter in a number of European countries – Spain in 1929,Germany in the 1930s, France in 1949, Italy in 1951 and Belgium in 1958 (Mooney, 1983;Pistorius and Wijk, 2000).
• Developments within the seed certification schemes, in the 1950s, that wereharmonising national regulatory schemes across the OEEC did not rule out patents forplant varieties as a possible route of enhancing existing systems for protecting breeders’rights (Rangnekar, forthcoming).
• The international lobby group canvassing for breeders’ rights, ASSINSEL, hadfavourably considered patent protection as their main option in the 1940s-50s.ASSINSEL’s approach was supported by a 1952 report to the international conference ofindustrial property lawyers, AIPPI, that concluded that “for a large part of their creations,the plant breeders’ require a special protection, but they also require patent protection fortheir most important inventions” (Wuesthoff and Wuesthoff, 1952).
Interestingly, the main opposition to the patenting of plant varieties emerged not fromthe Ministries of Agriculture in Europe, but from industry (Pistorius and Wijk, 2000;
Rangnekar, forthcoming). This view results from a close study of the debate and struggle
between ASSINSEL and AIPPI. The latter were averse to the possible weakening of the
patent system so as to accommodate plant varieties. Innovations in plant breeding, i.e. the
production of most new varieties, would fail to meet two crucial requirements for the grant of
patents – demonstration of an inventive step and the disclosure of the invention so as to
enable reproduction of the invention. Hence, in 1954, the AIPPI delegates votedoverwhelmingly in favour of maintaining plants as non-patentable subject matter. This
opposition from the apex body of patent lawyers was critical, more so since a conference for
the revision of the Paris Convention was slated for 1958. Not surprisingly, the 1958 Paris
Convention meeting did not even consider the issue of patenting plant varieties. With these
rebuffs, in 1956 ASSINSEL decided to convene an international conference to examine the
1. The Making of Plant Breeders’ Rights
Page 11
matter of protecting new plant varieties, which gets hosted by the French government in
1957. It is from this meeting that the UPOV gets established in 1961.
Behind the ASSINSEL-AIPPI struggle were developments concerning the harmonisation ofnational patent laws in Europe, which were initiated with the foundation of the Council of
Europe in 1949. The Committee of Experts proposed a definition of industrial property – the
subject matter that would be considered patentable – that placed plant varieties outside the
ambit of patent law. This definition finally gets accepted as art. 2 of the StrasbourgConvention – Convention on the Unification of Certain Points of Substantive Law on Patents
for Inventions (1963):
the Contracting States shall not be bound to provide for the grant of patents inrespect of
[…]
plant or animal varieties or essentially biological processes for the production ofplants or animals; this provision does not apply to micro-biological processes andthe products thereof.
The AIPPI itself submitted similar proposals to demarcate the patentable from the non-
patentable in terms of distinguishing between microbiological and biological respectively
(Bent et al., 1987: 66). The European Patent Convention itself affirms this distinction and
separation in art. 53, hoping to establish separate spheres of law. Reflecting this prevailing
legal opinion, UPOV in art. 2(1) identifies the jurisdiction of PBRs:
Each Member State of the Union may recognise the right of the breeder providedfor in this Convention by either a grant of a special title of protection [i.e. plantbreeders’ rights] or of a patent. Nevertheless, a Member State of the Unionwhose national law admits of protection under both these forms may provide onlyone of them for one and the same botanical genus or species (emphasis added).
The important conclusion from the above discussion is that the lobby of patent lawyers,
AIPPI, were the main hurdle to the initial aspirations of ASSINSEL in securing patent
protection for plant varieties. Substantive elements of the opposition reflected some of theproblems in making plants patentable subject matter. Here I draw attention to three
requirements for securing a patent: (a) the inventive step, (b) demonstration of industrial
applicability and (c) provision of enabling disclosure.
The test for novelty and inventive step requires the invention to be considered novel when
compared to the state of the art at the time of application, i.e. the inventive step is not
obvious to a person skilled in the art. It is often argued that breeders develop new varieties
“in just as true a sense as the chemist is said to create his new product” (CTS, 1960: 25, the
1. The Making of Plant Breeders’ Rights
Page 12
Committee that recommended PBRs in the UK). However, for the most, the production of
new plant varieties is really incremental inventions. Further, the very method of breeding is
itself suspect – not only is the underlying breeding process of common knowledge, but often
the actual steps reveal possible acts of discovery. To avoid these taxing requirements for
patents, UPOV has the following peculiar features:
• There is no merit test as part of the system of granting PBRs. To secure protection anew plant variety does not have to establish any improvement in the existing state of theart.
• The novelty requirement for PBRs is highly simplified, requiring the breeder todemonstrate that its is commercially novel, i.e. it has not been offered for sale within thelast four years (art. 6[1][b], UPOV 1961).
• There is no requirement for the demonstration of an inventive step. It is onlynecessary for the variety to be clearly distinguishable from all other varieties whoseexistence is a matter of common knowledge at the time when protection is applied for(art. 6[1][a], UPOV 1961). As such, the variety could very well be an act of discovery.
One of the corner stone of patent law is the requirement of utility – to promote inventionswith industrial applicability. In this regard, the invention is required to demonstrate
industrial applicability, in that it translates into either a product or process, a principle that
acts as a barrier against the possible patenting of discoveries in the sciences. Not all
`inventions’ in plant breeding have industrial applications, many new varieties are cosmetic
developments upon existing varieties. This requirement within patent law is notparalleled by any alternative requirement within the PBRs system.
Within patent law, the disclosures describing the invention must be enabling, i.e. they
should adequately describe the invention in a manner that enables others skilled in the art to
replicate the invention. In this manner, patents are claimed to promote the disclosure and
dissemination of new knowledge. Many species breed true-to-type, i.e. replicate themselves
upon propagation, thus ensuring that the `invention’ is automatically reproducible. However,
neither is an adequate and enabling disclosure of the breeding process easy to provide, nor
is a replication of the breeding steps a guarantee to the production of an identical variety. To
avoid these problems, the UPOV system, borrowing from seed certification schemes,
conducts field trials of the varieties to establish their distinguishing characteristics. Thesubmission of the plant variety and the conduct of field trials to establish thedistinctive characteristics of the variety serves the purpose of `disclosing’ the newvariety.
1. The Making of Plant Breeders’ Rights
Page 13
1.6 INTRODUCING PBRS IN THE UK – THE PLANT VARIETY AND SEEDS ACT (1964)
Britain participated in the deliberations that led to the foundation of UPOV in 1961. It signed
UPOV in November 1962 and implemented its obligations with the passing of the Plant
Variety and Seeds Act (1964).
There was little public debate on PBRs in Britain apart from efforts at developing a copyrightscheme for protecting breeders. Much of the work in Britain took place within the public
sector and concerned the seed certification schemes (discussed above). The first focussed
official consideration of PBRs took place within the Committee on Transactions in Seeds(1960). The enquiry took place at a time when there were crucial tensions between farmers
on the one hand and breeders and merchants on the other. Farmers had been demanding
merit tests for varieties that were marketed and declarations on seed packets that were
legally enforced. The Committee proposed a compromise – introduction of legally
enforceable seed labelling in exchange for greater control over seed production for the
breeders.
The Committee on Transactions in Seeds did not consider that sellers could bereasonably expected to give a warranty on the variety unless they were in aposition to exercise adequate control at all stages of the production of authenticseeds (Wellington, 1964: 61).
Clearly, the demands for `consumer protection’ on the part of farmers wereappropriated and transformed by breeders and merchants to take the shape ofdemands for PBRs.
At the time the Committee was examining the case for introducing PBRs in the UK, it is fair to
say that a de facto system of PBRs were already introduced through the national seed
certification schemes agreed within OEEC. More importantly, the deliberations within UK
took place in the shadow of the efforts on the Continent that led to the foundation of UPOV.
Being a member of UPOV, it became obligatory for the UK to implement its obligations and
introduce PBRs. Thus, the question of the rhetoric used to create wider consensus tosupport the introduction of PBRs.
Key to understanding the manner in which PBRs were introduced in UK is the relationship
between the Committee on Transactions in Seeds and UPOV. Firstly, central members of the
Committee participated in the debate at UPOV and the OEEC – many of these members
were from the National Institute of Agricultural Botany. Most importantly, a MAFF official, Mr
Smith, was both secretary to CTS whilst also being the key British representative to UPOV.
Later, Smith becomes the first Controller of the Plant Variety Rights Office in 1965, and also
1. The Making of Plant Breeders’ Rights
Page 14
held the Chair at UPOV. It is therefore not surprising that the recommendations madeby CTS were entirely in agreement with the system proposed by UPOV.
There was pressure to be part of the process of increasing harmonisation of trade andpatent laws across Europe and hence the obligation to implement multilateral agreements.
In the case of the UPOV, this tension between international reciprocity and nationalinterest was apparent in the debate concerning whether merit test should be a prerequisite
to market entry of a variety. Farmers had repeatedly made this request. Interestingly, the
CTS (1960) recommended that PBRs be granted to varieties that demonstratedistinctness, uniformity and stability and demonstrate reasonable merit – a clear
statement in favour of the demands being made by farmers. The Parliamentary debate
shows wide support for this measure (reviewed in Rangnekar, forthcoming). Yet the final
draft of the Bill excluded the merit requirement, which was explained as being in conflict with
international obligations under the UPOV. Alternatives to the merit test were the mandatory
field trials conducted by NIAB, with the results published for the benefit of farmers. Theoverarching philosophy was that of a laissez faire approach of market choicedetermining merit:
… [G]rowers should remain free to determine the commercial success or failureof varieties provided that they are given adequate information about them andwere not confused by different names … (Wellington, 1974: 100).
The “desire to act in concert with other countries” was the rationalisation presented in
Parliament by Lord Oswald. Yet, the government tried to suggest that the legislation would
`improve the quality of the crops in the country’. Obviously, Britain was desperately in need
of maintaining its trade in seeds with the Continent – between 50-70% of the cereal seed
market was based on varieties developed on the Continent. Without PBRs, continued access
to them could have been stopped. Given the high dependence on foreign-bred varieties, the
government sought to claim that PBRs would stimulate the domestic private breederswho till then occupied a marginal position in the market. With extensive pressure on Britain to
`act in concert’, the debate in Parliament glossed over the grant of PBRs as something “least
contentious” (Lord Balerno, 1963 in House of Lords).
1.7 CONCLUSION
A review of the history of the foundation of UPOV and a review of the debates concerning
PBRs in the UK sheds critical insights. Firstly, the review establishes that PBRs originated
within the efforts directed at rationalising and harmonising national seed certification
schemes in the 1950s. The demands by breeders for enhanced protection found useful
1. The Making of Plant Breeders’ Rights
Page 15
support with the regulatory authorities’ concern for authentic and reliable seeds. While the
seed certification schemes provided de facto breeders’ rights, UPOV enabled their legal
protection.
Importantly, the review draws attention to the factors that enabled the foundation of UPOV as
a system dedicated to protecting new plant varieties – a sui generis system independent of,
and separate from, patents. The discussion notes the opposition from the lobby groups
representing patent lawyers. In addition, the activity of plant breeding and the nature of plant
varieties also posed insurmountable problems for their inclusion within the application of
patent law.
In the UK, the debate on PBRs closely followed Continental developments. Thus, once again
we see the close relationship between seed certification schemes and the provision of PBRs.
An examination of the conflicts between the demands being made by farmers and those by
breeders is illustrative of the manner in which the consumer rhetoric of seed labelling gets
transformed into a means for providing PBR.
2. Agriculture in the UK – Some Statistical Evidence
2.1 INTRODUCTION
The practice of agriculture in an industrialised country has undergone dramatic structural and
economic changes in the last century. Many analysts have proposed the notion of
industrialised agriculture as a superior notion to capture the realities of agriculture in an
industrialised country. The discussion here aims to bring together statistical evidence of the
state of agriculture in the UK, with the aim of shedding some insights on the following issues:
• The relationship between changes in agricultural productivity and the situation of farmincome.
• The association between developments of an agri-industrial complex and changes in theeconomic vitality of the farm.
• Changing status of the farmer and the costs of sustaining agriculture in the UK.
This background is considered useful for an appropriate understanding of the issues
concerning PBRs in the UK.
2. Agriculture in the UK – Some Statistical Evidence
Page 16
2.2 MACRO INDICATORS
It is difficult to easily and unambiguously capture the significance of agriculture to the British
economy. The difficulty in part reflects the definition for agriculture – are we exclusively
referring to the farm-based activities or do we also include ancillary industries that support
the farm (e.g. animal medicine, farm inputs and machinery, etc.). With respect to the latter
broad-based definition, a case could easily be made for also including the food retailing
industry which has grown substantially in the last couple of decades. However, following
normal statistical approaches, agriculture is looked at from the narrow perspective of
`farming’.
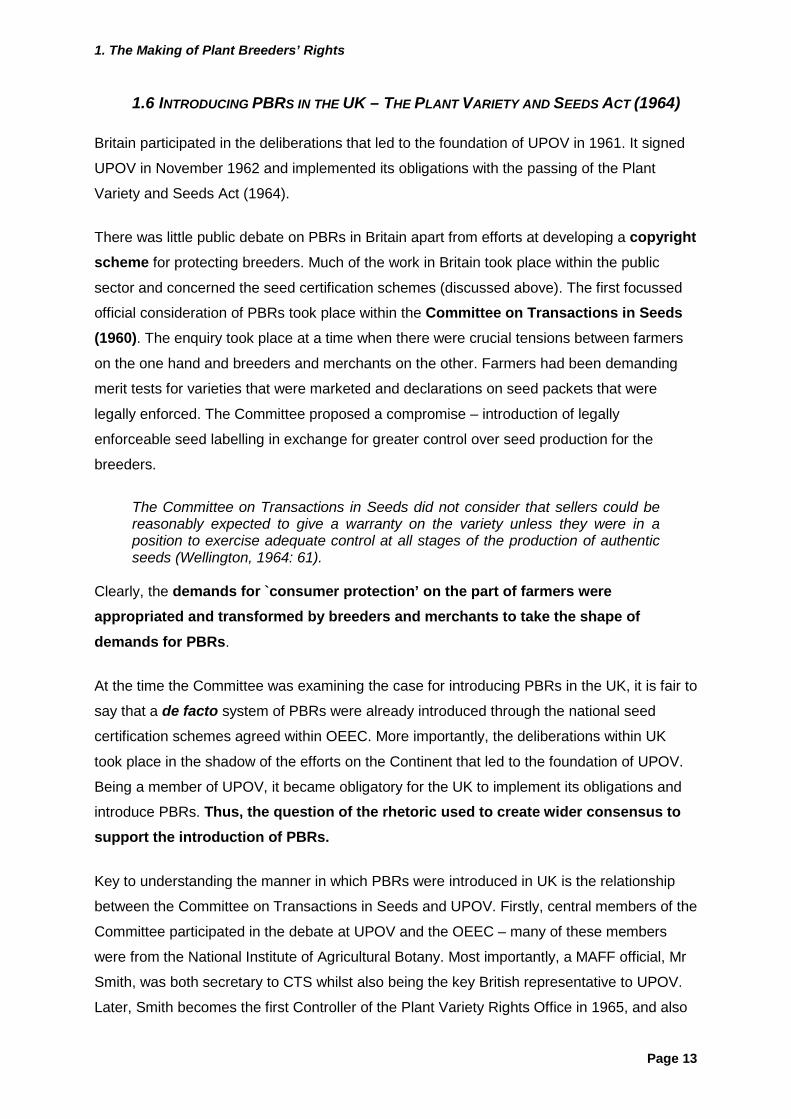
The contribution of agriculture to the GDP (Gross Domestic Product) has constantly
declined. From a high of 4.0% in 1960 it fell to 3.1% in 1971 and has averaged a little over
1% in the 1990s. Thus, even with an increasing level of production over the years, especially
in more recent years, the contribution of agriculture to the national economy is very low (seefigure 1 – Agriculture and UK GDP)
Figure 1
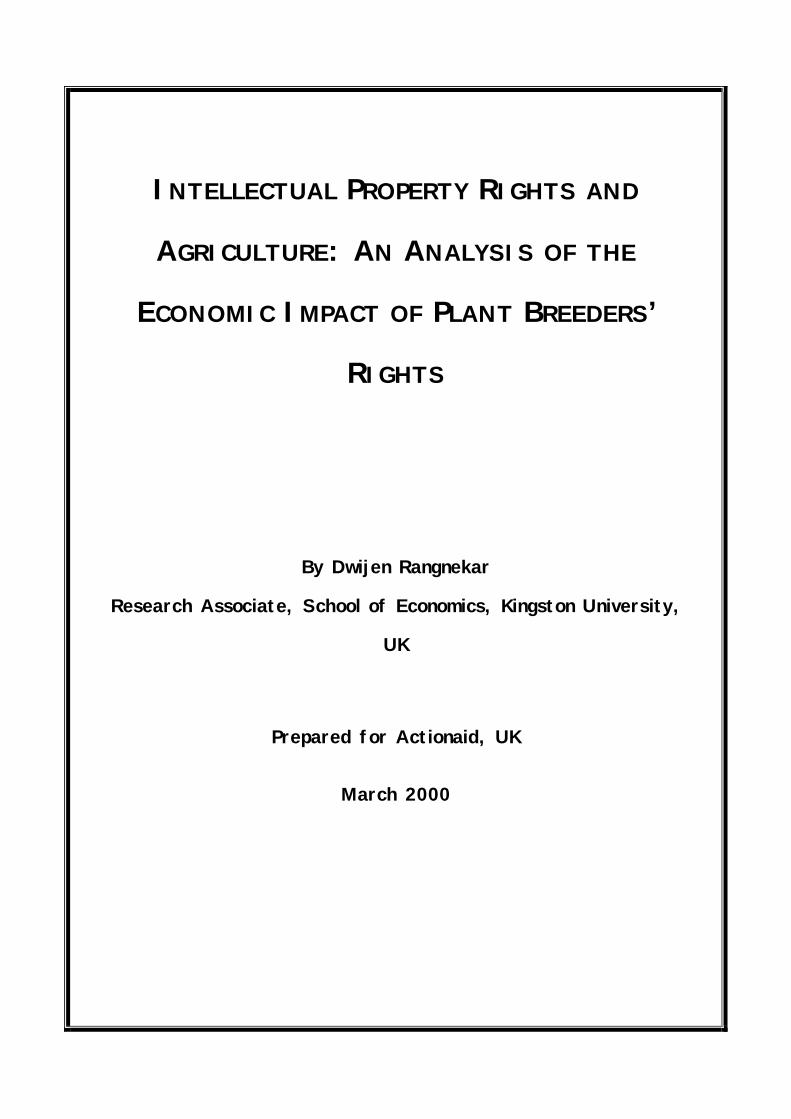
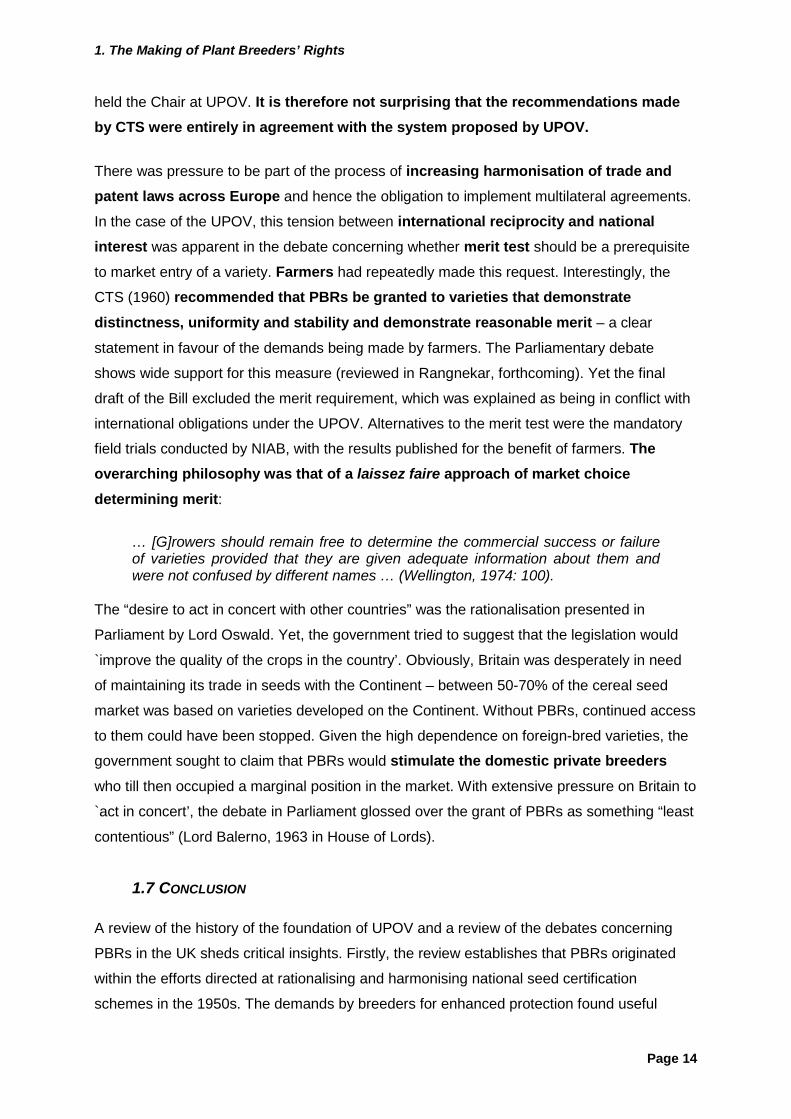
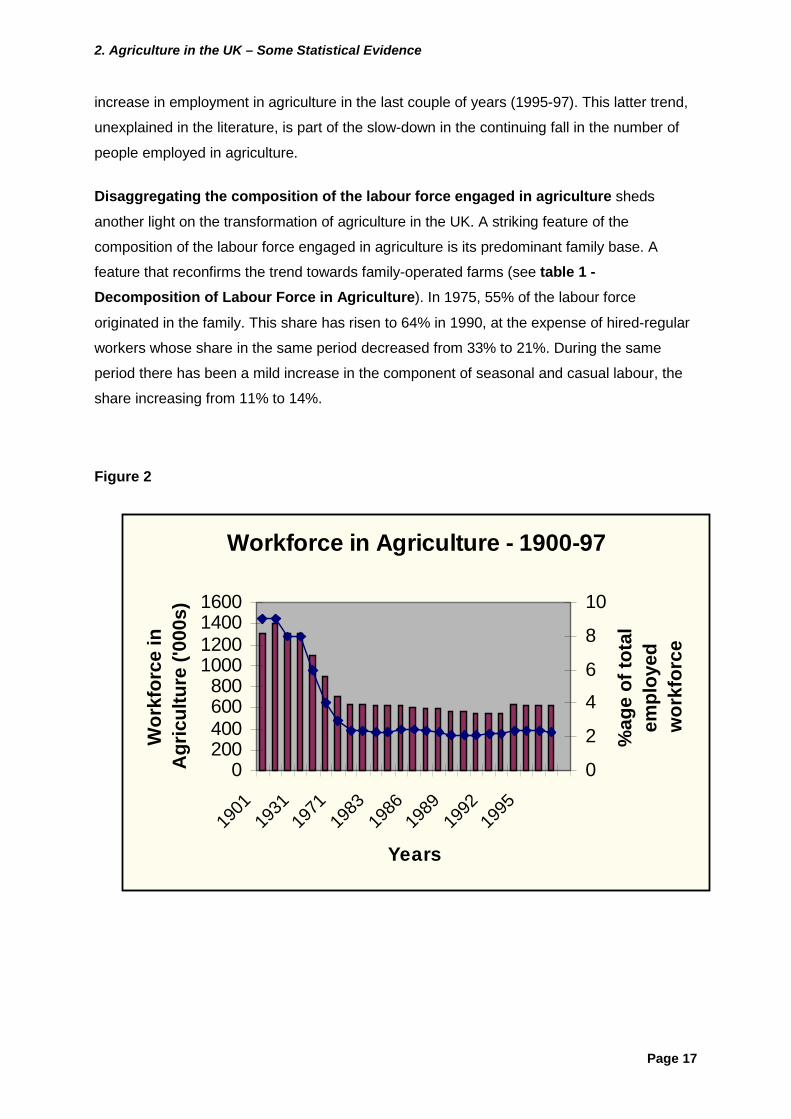
Reflecting this diminishing significance of agriculture to the national economy is the
proportion of the workforce actively engaged in agriculture (see figure 2 – Workforce inAgriculture). Looking at the historical trend, it is clear that the share of the workforce in
agriculture has fallen substantially. In the first two decades of the 20th century, agriculture
accounted for about 9% of the workforce. By the 1970 the share had fallen to 3% and in the
1990s it averaged 2.4%. The only remarkable aspect of the transformation is the minor
Agriculture and UK GDP - 1960-98
0
2000
4000
6000
8000
10000
12000
1960
1963
1966
1969
1972
1975
1978
1981
1984
1987
1990
1993
1996
Years
Agr
icul
ture
's c
ontr
ibut
ion
to
GD
P (c
onst
ant p
rices
£M
n)
0.0
0.5
1.0
1.5
2.0
2.5
3.0
3.5
4.0
4.5
%G
DP
Agriculture's contribution to GDP
%age share of GDP
2. Agriculture in the UK – Some Statistical Evidence
Page 17
increase in employment in agriculture in the last couple of years (1995-97). This latter trend,
unexplained in the literature, is part of the slow-down in the continuing fall in the number of
people employed in agriculture.
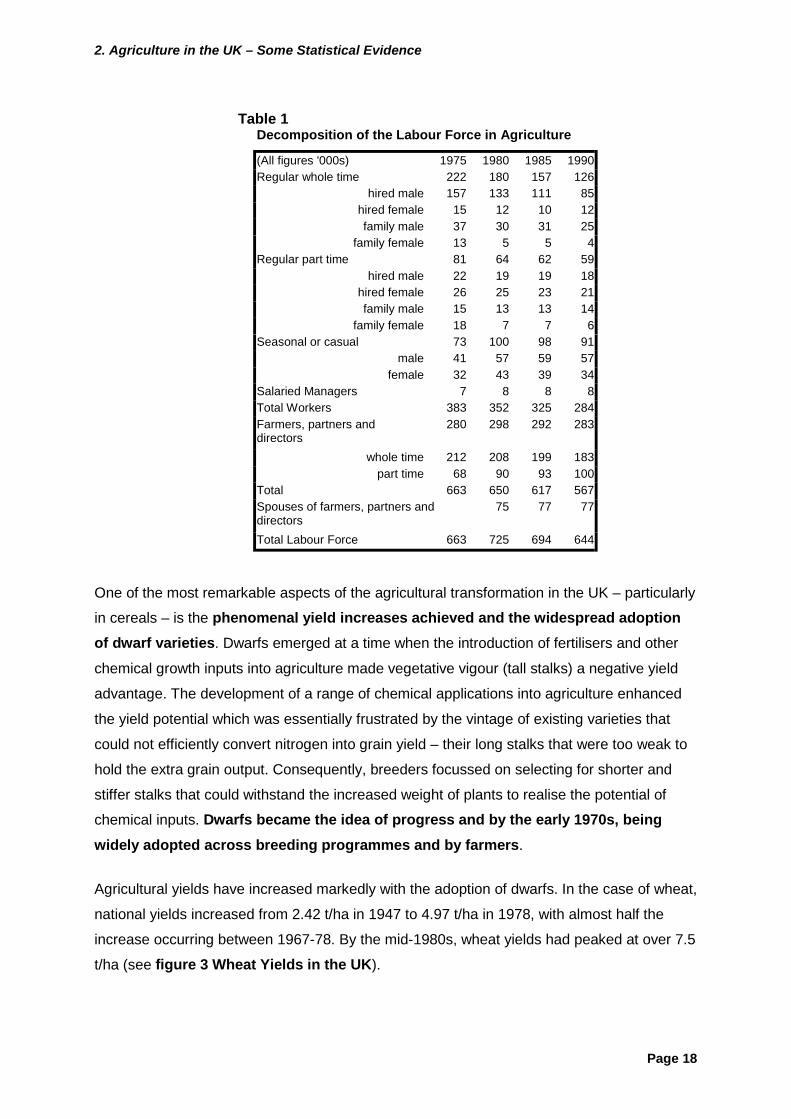
Disaggregating the composition of the labour force engaged in agriculture sheds
another light on the transformation of agriculture in the UK. A striking feature of the
composition of the labour force engaged in agriculture is its predominant family base. A
feature that reconfirms the trend towards family-operated farms (see table 1 -Decomposition of Labour Force in Agriculture). In 1975, 55% of the labour force
originated in the family. This share has risen to 64% in 1990, at the expense of hired-regular
workers whose share in the same period decreased from 33% to 21%. During the same
period there has been a mild increase in the component of seasonal and casual labour, the
share increasing from 11% to 14%.
Figure 2
Workforce in Agriculture - 1900-97
0200400600800
1000120014001600
1901
1931
1971
1983
1986
1989
1992
1995
Years
Wor
kfor
ce in
A
gric
ultu
re ('
000s
)
0
2
46
8
10%
age
of to
tal
empl
oyed
w
orkf
orce
2. Agriculture in the UK – Some Statistical Evidence
Page 18
Table 1Decomposition of the Labour Force in Agriculture
(All figures '000s) 1975 1980 1985 1990Regular whole time 222 180 157 126
hired male 157 133 111 85hired female 15 12 10 12family male 37 30 31 25
family female 13 5 5 4Regular part time 81 64 62 59
hired male 22 19 19 18hired female 26 25 23 21family male 15 13 13 14
family female 18 7 7 6Seasonal or casual 73 100 98 91
male 41 57 59 57female 32 43 39 34
Salaried Managers 7 8 8 8Total Workers 383 352 325 284Farmers, partners anddirectors
280 298 292 283
whole time 212 208 199 183part time 68 90 93 100
Total 663 650 617 567Spouses of farmers, partners anddirectors
75 77 77
Total Labour Force 663 725 694 644
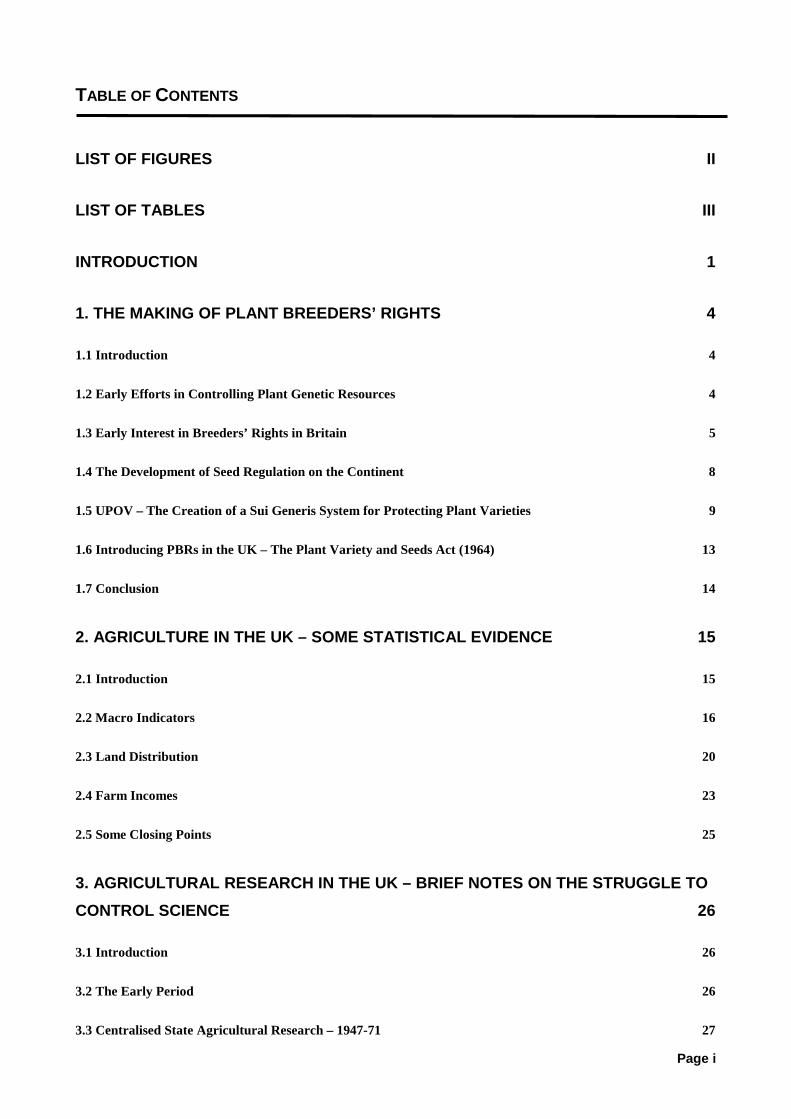
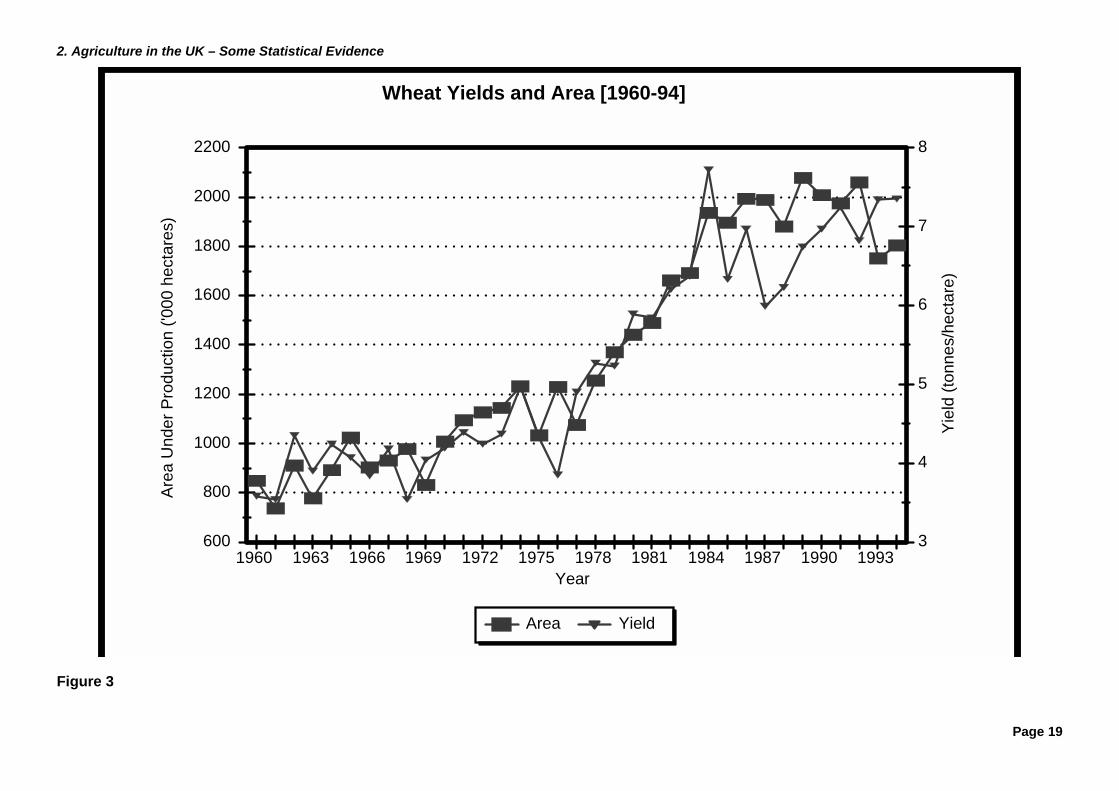
One of the most remarkable aspects of the agricultural transformation in the UK – particularly
in cereals – is the phenomenal yield increases achieved and the widespread adoptionof dwarf varieties. Dwarfs emerged at a time when the introduction of fertilisers and other
chemical growth inputs into agriculture made vegetative vigour (tall stalks) a negative yield
advantage. The development of a range of chemical applications into agriculture enhanced
the yield potential which was essentially frustrated by the vintage of existing varieties that
could not efficiently convert nitrogen into grain yield – their long stalks that were too weak to
hold the extra grain output. Consequently, breeders focussed on selecting for shorter and
stiffer stalks that could withstand the increased weight of plants to realise the potential of
chemical inputs. Dwarfs became the idea of progress and by the early 1970s, beingwidely adopted across breeding programmes and by farmers.
Agricultural yields have increased markedly with the adoption of dwarfs. In the case of wheat,
national yields increased from 2.42 t/ha in 1947 to 4.97 t/ha in 1978, with almost half the
increase occurring between 1967-78. By the mid-1980s, wheat yields had peaked at over 7.5
t/ha (see figure 3 Wheat Yields in the UK).
2. Agriculture in the UK – Some Statistical Evidence
Page 19
Figure 3
600
800
1000
1200
1400
1600
1800
2000
2200 Ar
ea U
nder
Pro
duct
ion
('000
hec
tare
s)
3
4
5
6
7
8
Yiel
d (to
nnes
/hec
tare
)
1960 1963 1966 1969 1972 1975 1978 1981 1984 1987 1990 1993 Year
Area Yield
Wheat Yields and Area [1960-94]
2. Agriculture in the UK – Some Statistical Evidence
Page 20
2. Agriculture in the UK – Some Statistical Evidence
Page 20
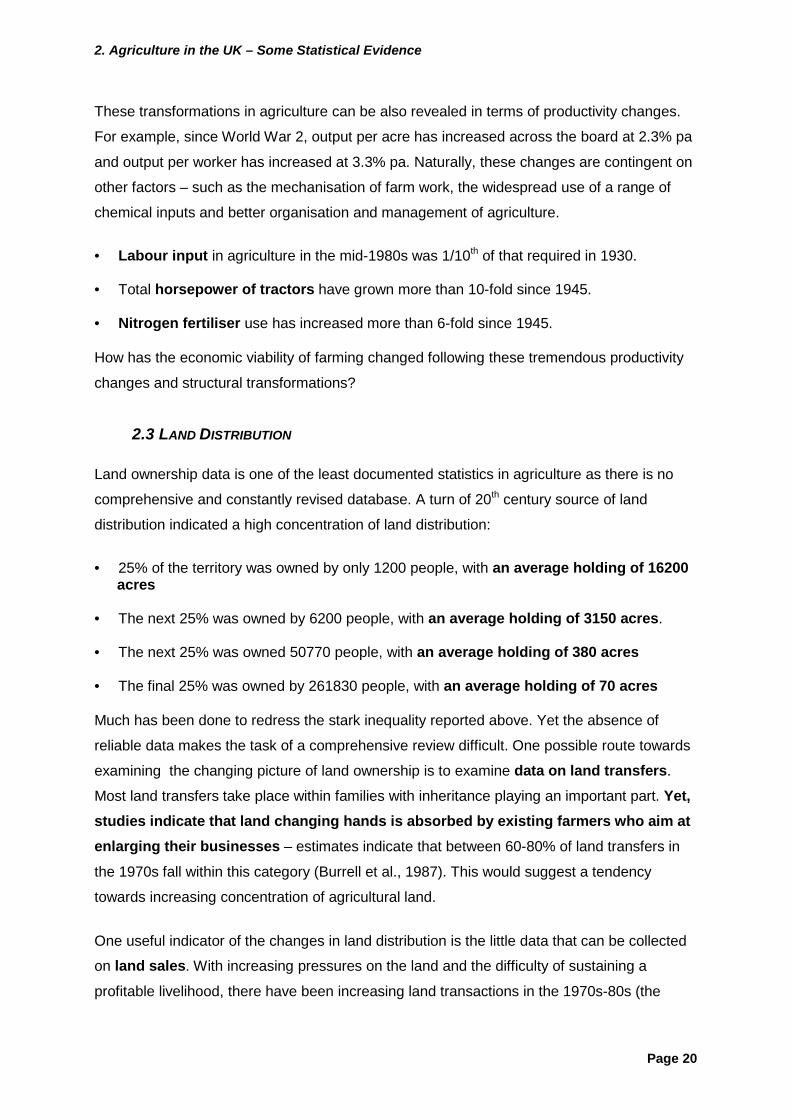
These transformations in agriculture can be also revealed in terms of productivity changes.
For example, since World War 2, output per acre has increased across the board at 2.3% pa
and output per worker has increased at 3.3% pa. Naturally, these changes are contingent on
other factors – such as the mechanisation of farm work, the widespread use of a range of
chemical inputs and better organisation and management of agriculture.
• Labour input in agriculture in the mid-1980s was 1/10th of that required in 1930.
• Total horsepower of tractors have grown more than 10-fold since 1945.
• Nitrogen fertiliser use has increased more than 6-fold since 1945.
How has the economic viability of farming changed following these tremendous productivity
changes and structural transformations?
2.3 LAND DISTRIBUTION
Land ownership data is one of the least documented statistics in agriculture as there is no
comprehensive and constantly revised database. A turn of 20th century source of land
distribution indicated a high concentration of land distribution:
• 25% of the territory was owned by only 1200 people, with an average holding of 16200acres
• The next 25% was owned by 6200 people, with an average holding of 3150 acres.
• The next 25% was owned 50770 people, with an average holding of 380 acres
• The final 25% was owned by 261830 people, with an average holding of 70 acres
Much has been done to redress the stark inequality reported above. Yet the absence of
reliable data makes the task of a comprehensive review difficult. One possible route towards
examining the changing picture of land ownership is to examine data on land transfers.
Most land transfers take place within families with inheritance playing an important part. Yet,studies indicate that land changing hands is absorbed by existing farmers who aim atenlarging their businesses – estimates indicate that between 60-80% of land transfers in
the 1970s fall within this category (Burrell et al., 1987). This would suggest a tendency
towards increasing concentration of agricultural land.
One useful indicator of the changes in land distribution is the little data that can be collected
on land sales. With increasing pressures on the land and the difficulty of sustaining a
profitable livelihood, there have been increasing land transactions in the 1970s-80s (the
2. Agriculture in the UK – Some Statistical Evidence
Page 21
Figure 4
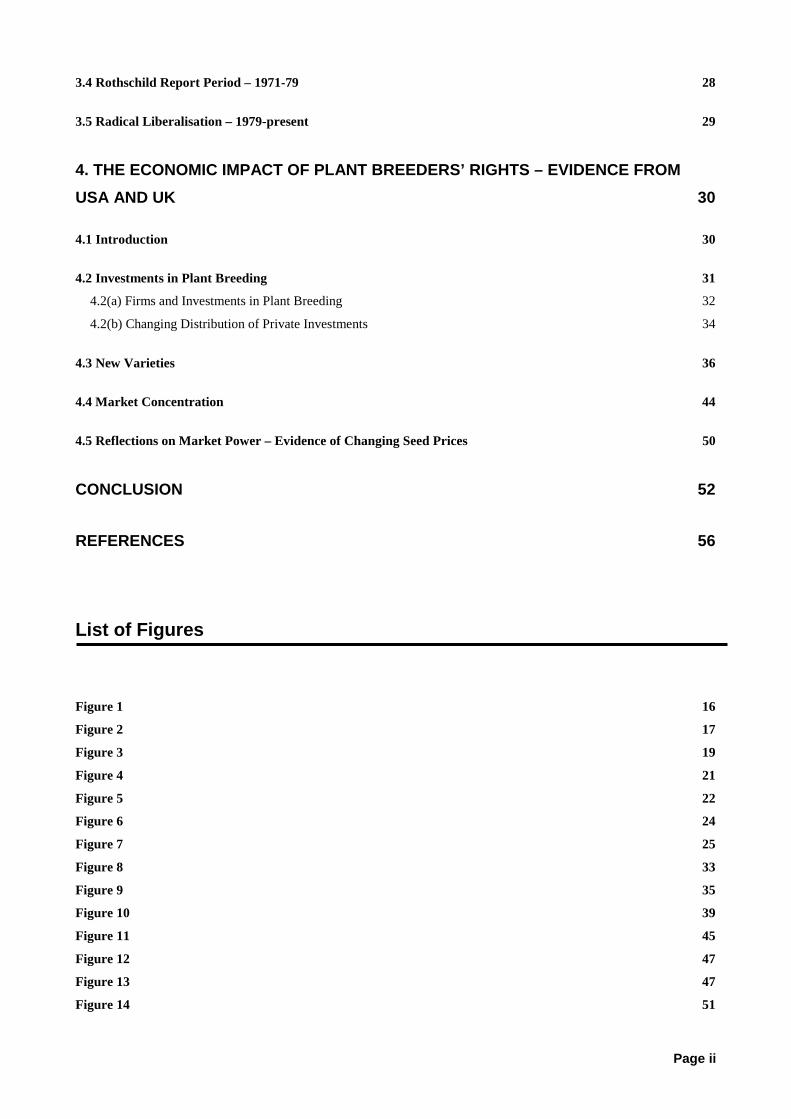
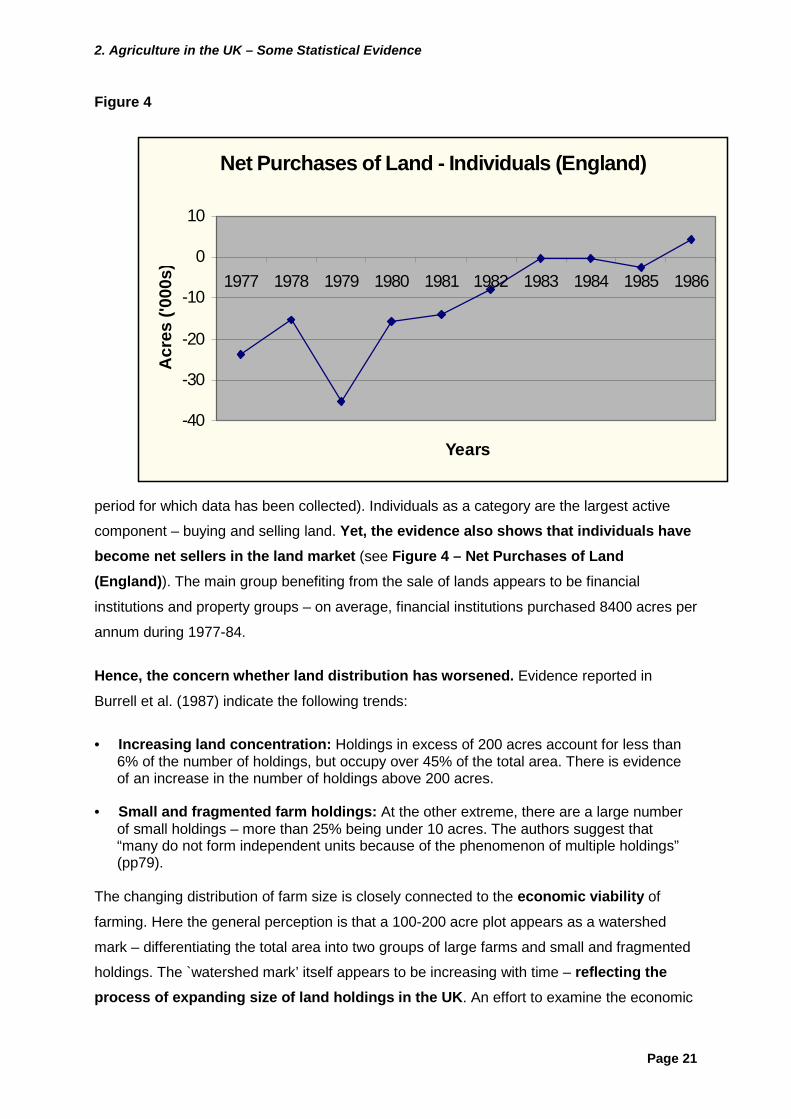
period for which data has been collected). Individuals as a category are the largest active
component – buying and selling land. Yet, the evidence also shows that individuals havebecome net sellers in the land market (see Figure 4 – Net Purchases of Land(England)). The main group benefiting from the sale of lands appears to be financial
institutions and property groups – on average, financial institutions purchased 8400 acres per
annum during 1977-84.
Hence, the concern whether land distribution has worsened. Evidence reported in
Burrell et al. (1987) indicate the following trends:
• Increasing land concentration: Holdings in excess of 200 acres account for less than6% of the number of holdings, but occupy over 45% of the total area. There is evidenceof an increase in the number of holdings above 200 acres.
• Small and fragmented farm holdings: At the other extreme, there are a large numberof small holdings – more than 25% being under 10 acres. The authors suggest that“many do not form independent units because of the phenomenon of multiple holdings”(pp79).
The changing distribution of farm size is closely connected to the economic viability of
farming. Here the general perception is that a 100-200 acre plot appears as a watershed
mark – differentiating the total area into two groups of large farms and small and fragmented
holdings. The `watershed mark’ itself appears to be increasing with time – reflecting theprocess of expanding size of land holdings in the UK. An effort to examine the economic
Net Purchases of Land - Individuals (England)
-40
-30
-20
-10
0
10
1977 1978 1979 1980 1981 1982 1983 1984 1985 1986
Years
Acr
es ('
000s
)
2. Agriculture in the UK – Some Statistical Evidence
Page 22
aspects of farm is possible through an analysis of indicators representing the value of output
generated on the farm. One such measure, the European Size Unit (ESU), gives the value
of output measure of farm business based on the costs and incomes generated from
farming.
Figure 5
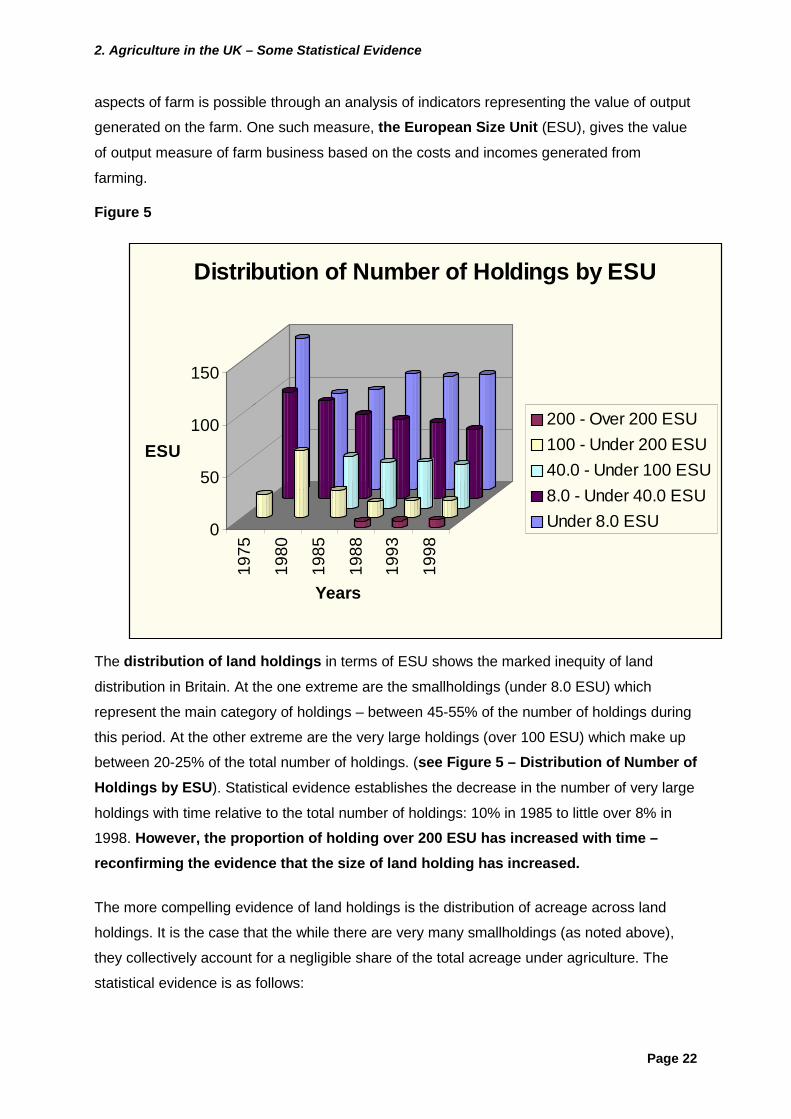
The distribution of land holdings in terms of ESU shows the marked inequity of land
distribution in Britain. At the one extreme are the smallholdings (under 8.0 ESU) which
represent the main category of holdings – between 45-55% of the number of holdings during
this period. At the other extreme are the very large holdings (over 100 ESU) which make up
between 20-25% of the total number of holdings. (see Figure 5 – Distribution of Number ofHoldings by ESU). Statistical evidence establishes the decrease in the number of very large
holdings with time relative to the total number of holdings: 10% in 1985 to little over 8% in
1998. However, the proportion of holding over 200 ESU has increased with time –reconfirming the evidence that the size of land holding has increased.
The more compelling evidence of land holdings is the distribution of acreage across land
holdings. It is the case that the while there are very many smallholdings (as noted above),
they collectively account for a negligible share of the total acreage under agriculture. The
statistical evidence is as follows:
0
50
100
150
ESU
1975
1980
1985
1988
1993
1998
Years
Distribution of Number of Holdings by ESU
200 - Over 200 ESU100 - Under 200 ESU40.0 - Under 100 ESU8.0 - Under 40.0 ESUUnder 8.0 ESU
2. Agriculture in the UK – Some Statistical Evidence
Page 23
• In 1984, while 44% of the holdings were less than 20 acres, the collective share of totalacreage was under 8%. By 1998, the number of these holdings were marginally lower at43%, but their acreage share fell to 5%. Clearly, the average size of smallholdings hasdecreased with time.
• For the very large holdings – greater than 100 acres, in 1984 this group constituted 13%of the number of holdings, but occupied 51% of the acreage. By 1998, the groupconstituted 17% of the holdings and 67% of the acreage. Clearly, the average size ofvery large holdings has increased with time.
The substantive increase in the share of very large holdings has been at the expense of all
other categories of land holdings. Importantly, this trend corroborates with evidence interms of land enlargement within British agriculture. Even in terms of agricultural output,
large farm are dominant – in 1985, the 10% of the biggest farms produced 25% of theoutput. Bringing in the medium and large farms together, 80% of total agricultural output
produced on these farms.
2.4 FARM INCOMES
Establishing the situation of farm incomes is made difficult by inadequacies of data on the
levels of inputs used on the farm. To some extent, farming practices of over-the-fence sales
of inputs (e.g. seeds and feeding stuffs) do not help. Yet, there is a widely held perception
that the purchased inputs have increased considerably over the years. The increased
dependence of the farm on off-farm inputs is part of the larger transformations taking place in
the agri-food industries.
Analysts recognise a process through which on-farm activities are substituted by purchased
inputs while many farm-based activities are appropriated and replaced by industrial
production. Historically, this has been identified with the replacement of manual and animal
labour by machines. Following these changes has been the introduction of chemical
fertilisers.
In the UK, the introduction of dwarf crop species in the late 1960s-early 1970s was
followed by substantial increases in the dependence on non-farm inputs, particularly
fertilisers and crop protection chemicals. Seeds have also become an important purchased
input – replacing the traditional on-farm processes of seed saving and exchange.
2. Agriculture in the UK – Some Statistical Evidence
Page 24
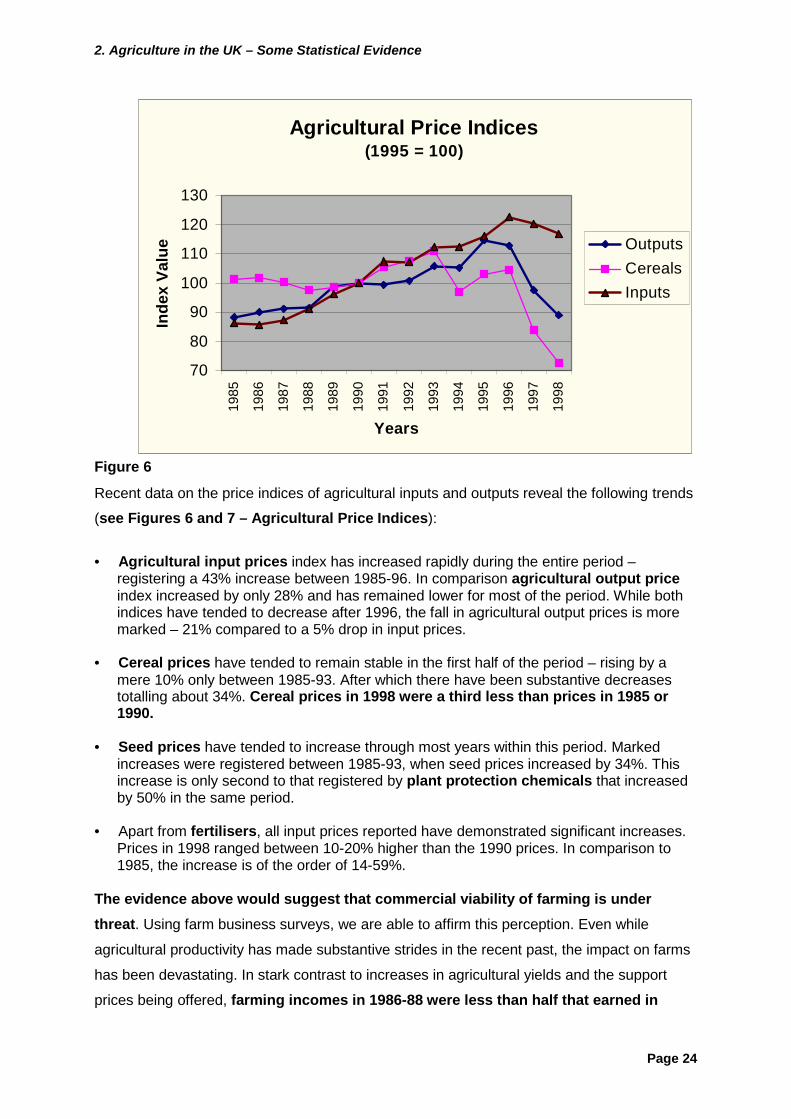
Figure 6
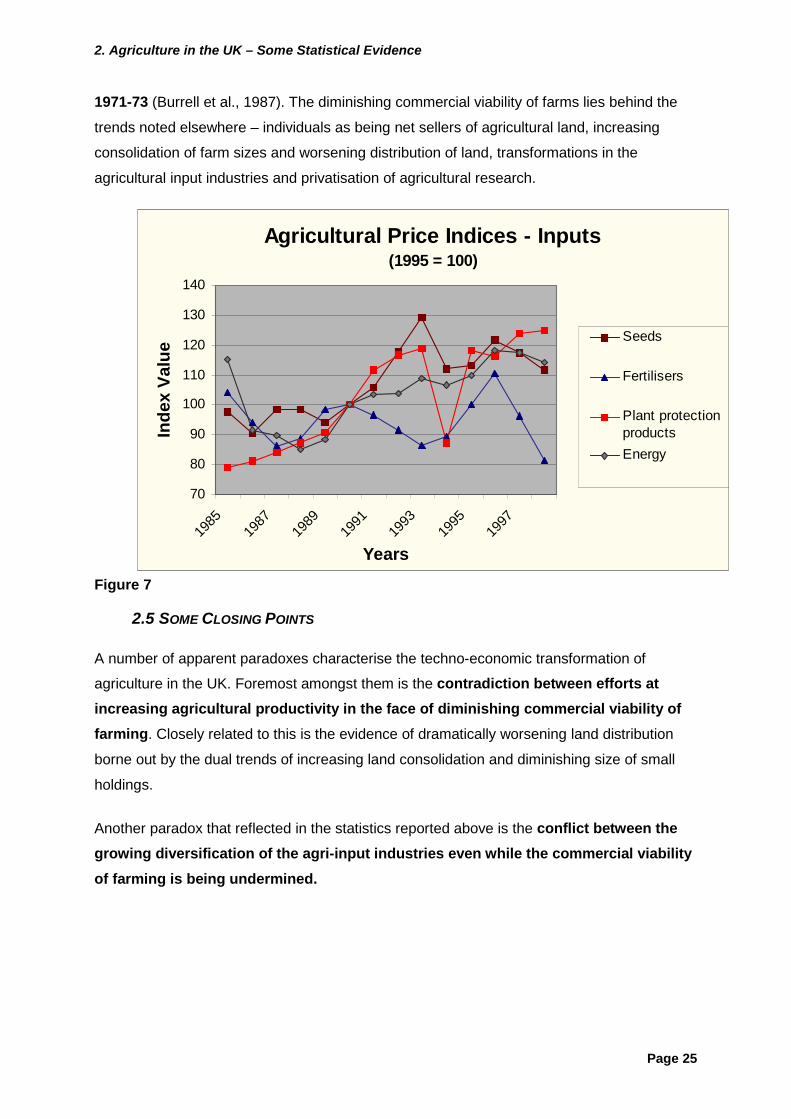
Recent data on the price indices of agricultural inputs and outputs reveal the following trends
(see Figures 6 and 7 – Agricultural Price Indices):
• Agricultural input prices index has increased rapidly during the entire period –registering a 43% increase between 1985-96. In comparison agricultural output priceindex increased by only 28% and has remained lower for most of the period. While bothindices have tended to decrease after 1996, the fall in agricultural output prices is moremarked – 21% compared to a 5% drop in input prices.
• Cereal prices have tended to remain stable in the first half of the period – rising by amere 10% only between 1985-93. After which there have been substantive decreasestotalling about 34%. Cereal prices in 1998 were a third less than prices in 1985 or1990.
• Seed prices have tended to increase through most years within this period. Markedincreases were registered between 1985-93, when seed prices increased by 34%. Thisincrease is only second to that registered by plant protection chemicals that increasedby 50% in the same period.
• Apart from fertilisers, all input prices reported have demonstrated significant increases.Prices in 1998 ranged between 10-20% higher than the 1990 prices. In comparison to1985, the increase is of the order of 14-59%.
The evidence above would suggest that commercial viability of farming is underthreat. Using farm business surveys, we are able to affirm this perception. Even while
agricultural productivity has made substantive strides in the recent past, the impact on farms
has been devastating. In stark contrast to increases in agricultural yields and the support
prices being offered, farming incomes in 1986-88 were less than half that earned in
Agricultural Price Indices(1995 = 100)
70
80
90
100
110
120
130
1985
1986
1987
1988
1989
1990
1991
1992
1993
1994
1995
1996
1997
1998
Years
Inde
x Va
lue Outputs
CerealsInputs
2. Agriculture in the UK – Some Statistical Evidence
Page 25
1971-73 (Burrell et al., 1987). The diminishing commercial viability of farms lies behind the
trends noted elsewhere – individuals as being net sellers of agricultural land, increasing
consolidation of farm sizes and worsening distribution of land, transformations in the
agricultural input industries and privatisation of agricultural research.
Figure 7
2.5 SOME CLOSING POINTS
A number of apparent paradoxes characterise the techno-economic transformation of
agriculture in the UK. Foremost amongst them is the contradiction between efforts atincreasing agricultural productivity in the face of diminishing commercial viability offarming. Closely related to this is the evidence of dramatically worsening land distribution
borne out by the dual trends of increasing land consolidation and diminishing size of small
holdings.
Another paradox that reflected in the statistics reported above is the conflict between thegrowing diversification of the agri-input industries even while the commercial viabilityof farming is being undermined.
Agricultural Price Indices - Inputs(1995 = 100)
70
80
90
100
110
120
130
140
1985
1987
1989
1991
1993
1995
1997
Years
Inde
x Va
lue Seeds
Fertilisers
Plant protectionproductsEnergy
3. Agricultural Research in the UK – Brief Notes on the Struggle to Control Science
Page 26
3. Agricultural Research in the UK – Brief Notes on the Struggle toControl Science
3.1 INTRODUCTION
The statistical trends noted above must be placed in some context. For example, what
factors have generated the particular focus on raising agricultural productivity by developing
dwarfs and the supporting range of chemical inputs? To shed some insights on the context
surrounding the changes in British agriculture I sketch some brief points about the control of
agricultural research in the UK.
Two core points are reviewed in the discussion below. Firstly, the changing nature of public
research in agriculture. Over the years, the philosophy of government intervention has
changed radically. The second point of relevance is the emergence of private funded and
controlled research in agriculture. The latter has been substantially promoted by the
privatisation of key breeding facilities in the UK.
3.2 THE EARLY PERIOD
The turn of the century orientation to agricultural research policy in Britain was characterised
by a laissez faire attitude – the state maintained a healthy distance from interfering with the
level of agricultural research underway or the direction the research adopted. This approach
was complemented by the over-riding philosophy concerning the pursuit of scientific research
– independent search for knowledge. In the sense, the pursuit of science was separate from
any commercial outcomes that otherwise might result from the results of research. Reflecting
the separation between science and commerce, the Journal of Agricultural Science
established by scientists at Cambridge University in 1903 had an editorial policy of not
accepting papers dealing with farming as opposed to agricultural science.
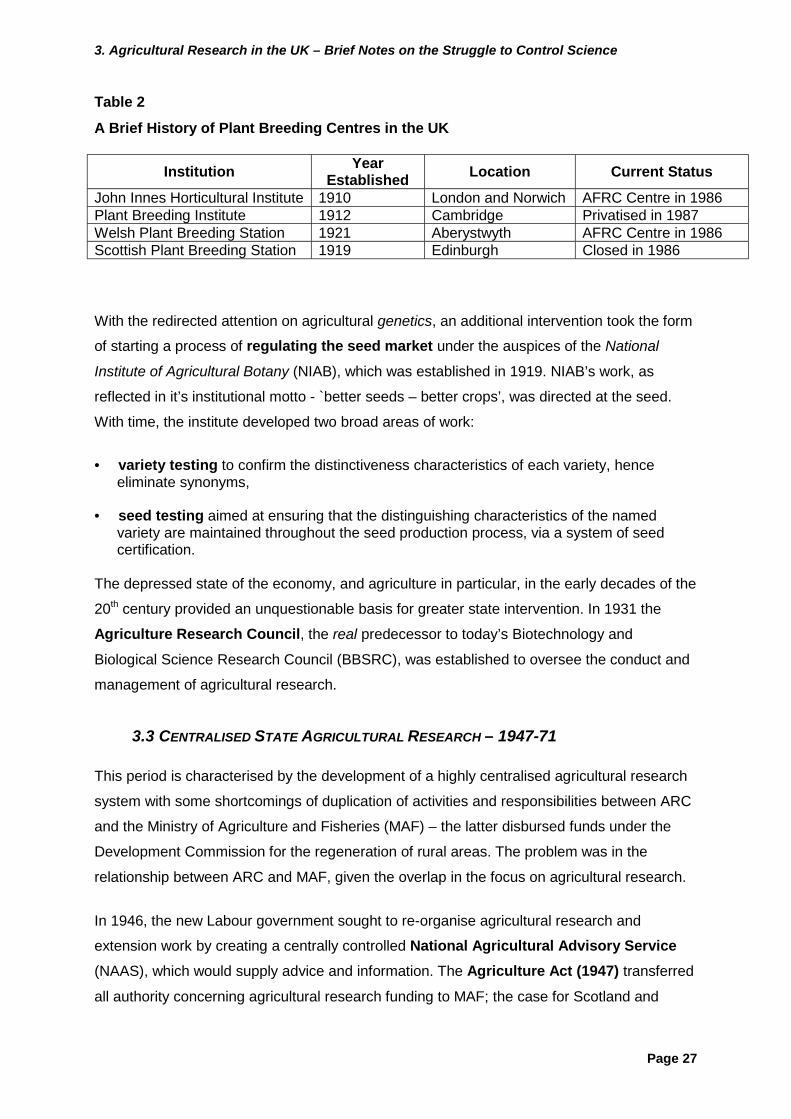
Despite this general separation of science from commerce and a laissez faire principle on the
part of the government crucial initial steps in forming an agricultural research systemwere taken with the creation of plant breeding stations in Britain (see Table 2 – Brief Historyof Plant Breeding Centres in UK). With the re-discovery of Mendelian genetics at the turn
of the century, fundamental research in plant breeding adopted a greater scientific
orientation. State patronage in the form of establishing institutions and bringing forward
necessary funds proved crucial.
3. Agricultural Research in the UK – Brief Notes on the Struggle to Control Science
Page 27
Table 2
A Brief History of Plant Breeding Centres in the UK
Institution YearEstablished Location Current Status
John Innes Horticultural Institute 1910 London and Norwich AFRC Centre in 1986Plant Breeding Institute 1912 Cambridge Privatised in 1987Welsh Plant Breeding Station 1921 Aberystwyth AFRC Centre in 1986Scottish Plant Breeding Station 1919 Edinburgh Closed in 1986
With the redirected attention on agricultural genetics, an additional intervention took the form
of starting a process of regulating the seed market under the auspices of the National
Institute of Agricultural Botany (NIAB), which was established in 1919. NIAB’s work, as
reflected in it’s institutional motto - `better seeds – better crops’, was directed at the seed.
With time, the institute developed two broad areas of work:
• variety testing to confirm the distinctiveness characteristics of each variety, henceeliminate synonyms,
• seed testing aimed at ensuring that the distinguishing characteristics of the namedvariety are maintained throughout the seed production process, via a system of seedcertification.
The depressed state of the economy, and agriculture in particular, in the early decades of the
20th century provided an unquestionable basis for greater state intervention. In 1931 the
Agriculture Research Council, the real predecessor to today’s Biotechnology and
Biological Science Research Council (BBSRC), was established to oversee the conduct and
management of agricultural research.
3.3 CENTRALISED STATE AGRICULTURAL RESEARCH – 1947-71
This period is characterised by the development of a highly centralised agricultural research
system with some shortcomings of duplication of activities and responsibilities between ARC
and the Ministry of Agriculture and Fisheries (MAF) – the latter disbursed funds under the
Development Commission for the regeneration of rural areas. The problem was in the
relationship between ARC and MAF, given the overlap in the focus on agricultural research.
In 1946, the new Labour government sought to re-organise agricultural research and
extension work by creating a centrally controlled National Agricultural Advisory Service(NAAS), which would supply advice and information. The Agriculture Act (1947) transferred
all authority concerning agricultural research funding to MAF; the case for Scotland and
3. Agricultural Research in the UK – Brief Notes on the Struggle to Control Science
Page 28
Northern Ireland being slightly different. The centralisation of control under MAF was
strengthened by later Conservative government in 1955 by consolidating the Ministry of Food
within MAF, as food rationing had by then ended. Importantly, control over research funding
for food remained outside the jurisdiction of the newly christened Ministry of Agriculture,Fisheries and Food (MAFF).
On the other hand, the ARC fostered and developed much closer ties with institutes of higher
education. In contrast, MAFF expanded its links with the farming and food industry through
NAAS. Consequently, there developed two overlapping systems supporting agricultural and
food research.
In the mid-1960s, the Labour government undertook another re-organisation of the funding
for research and development. The Science and Technology Act (1965) transferred all
responsibilities concerning the various research councils to the Department of Education and
Science, thus institutionalising the agricultural research system. To some extent the authority
of MAFF was undermined by this development.
3.4 ROTHSCHILD REPORT PERIOD – 1971-79
This period is characterised by the parliamentary review of government support for R&D,
later published as the Rothschild Report (1970). The core recommendation made by the
report was to reorient the basis and nature of R&D in terms of the needs of the
commissioning agency. This customer-contract principle required the agenda of R&D to be
set by the client – the commissioning government agency. In this sense, the ARC was
criticised for being divorced from the needs of the core clients of its research – the farmers,
agricultural input suppliers, the food industry and MAFF. Though MAFF was recommended
to adopt a more interventionist role in directing the agenda of agricultural R&D, the struggle
over resources between Whitehall and scientists continued.
In 1976, the UK became a full-member of the EEC and adopted the Common AgriculturePolicy. The latter led to the introduction of a system of guaranteed support prices, well in
excess of world market prices or those previously paid nationally. Farmers rationally
responding by adopting intensive cropping practices supported by greatly increased
applications of a range of chemical inputs. As result, not only were there gross environmental
impacts, highlighted by conservation and nature groups, but a massive build-up of
agricultural products. In response, the avowed focus of agricultural R&D, normally aimed at
enhancing productivity, required substantive change in focus.
3. Agricultural Research in the UK – Brief Notes on the Struggle to Control Science
Page 29
3.5 RADICAL LIBERALISATION – 1979-PRESENT
The 1979 election of a Conservative government deeply committed to a radical agenda of
cutting-back the state and curtailing public support for R&D had significant impact of
agriculture, as it did in most other aspects of social and economic sectors. Not only did the
ARC immediately experience a drastic cut in funds, but the its budget continued to decline till
1987-88 – a 23% reduction from £156Mn to £120Mn. With the reduced funding, the number
of research centres under ARC reduced from 18 to 8. Other institutional and organisational
changes led to the integration of agricultural and food research issues, leading to the ARC
being renamed as the Agriculture and Food Research Council (AFRC). By 1988-89, 15%
of the AFRC’s budget was devoted to food safety issues – an issue that still remains a crucial
political embarrassment in the UK.
The 1980s witnessed the most radical form of liberalisation with the outright sale and closure
of a number of public institutions (see Table 2 above). A key privatisation with respect to
agricultural research was the sale of the Plant Breeding Institute, Cambridge to Unilever in1987 for £66Mn. Unilver managed to outbid other contenders like ICI Chemicals and Booker
Seeds. There was much consternation at this sale:
Somewhat ironically, at the same time as it was being fragmented and privatised,US science policy-makers were advocating the establishment of researchstations that would emulate the interdisciplinary approach of the PBI. The PBIwas regarded as a particularly successful establishment in terms of its breedingof cereal crops for the UK: over 87% of UK cereal crops grown in 1987 were PBIvarieties (Webster, 1989: 225).
Even breeders at the Institute were alarmed at the privatisation of their institute and the
breakdown of its interdisciplinary approach to crop development:
It now seems likely that many of the specialist departments of which the [PublicBreeding] Institute was formed may, for political or economic reasons, bedispersed or disbanded. ... In this casual way one of the greatest successes forall time in crop research could be destroyed. Whether either of the separatedparts can long survive is unclear (Lupton, 1987: xi-xiv).
The general philosophy underlying the radical privatisation of the public sector was
eventually articulated in an internal Cabinet document, the Barnes Review, of 1988. This
document pioneered the view that research that is `near-market’ should be entirely
conducted by the private sector. In contrast to the earlier customer-contract principle, the
new mantra within the government was that public R&D should be more contained and
focussed on basic science. With respect to agricultural R&D, the Review recommended a cut
amounting to £30Mn – about 30% of the research budget.
3. Agricultural Research in the UK – Brief Notes on the Struggle to Control Science
Page 30
Finally, in 1994 the government re-organised all the research councils to create 6 centres
with a greater technological focus cutting across industrial sectors. The AFRC was renamed
the Biotechnology and Biological Research Council. Ironically, the title does not reflect its
core sectors of food and agriculture!
4. The Economic Impact of Plant Breeders’ Rights – Evidence fromUSA and UK
4.1 INTRODUCTION
There are few systematic and substantive studies on the economic impact of plant breeders’
rights in developed countries. This lack of literature is surprising given the heated debate that
accompanies the subject of IPRs and plant genetic resources. The discussion here will
closely study four empirical-based studies of PBRs:
• Perrin, Kunnings and Ihnen (1983): An academic work produced by the North CarolinaState University. The report is an empirical evaluation of the PVPA (1970) in the USfocussing closely on the re-direction of R&D towards soybean breeding. The data used isderived from questionnaires circulated amongst breeding companies.
• Butler and Marion (1985): The report results from a request of Senate AgricultureCommittee (US) which reviewed conflicting views on the social costs and benefits ofPBRs at the time of extending the scope of application of PVPA (1970). The study isbased on questionnaire responses from breeding companies in a wide range of crops.
• ALP da Rocha (1994): This PhD thesis examines econometric issues concerning therelationship between availability of PBRs and the rate of introduction of new varieties fora range of fruits, vegetables and ornamentals in the UK. The results shed useful insightinto the question of whether the availability of PBRs caused increases in the rate ofintroduction of new varieties.
• Rangnekar (forthcoming): This PhD thesis examines issues concerning the relationshipbetween the direction of technical change (innovation avenues) and strategies ofappropriation so as to draw implications shed insights into the consequences ofprivatising agricultural research. Conclusions are based on a case study of wheatbreeding in the UK.
The two studies concerning PBRs in the US have drawn extensive attention in the literature,
partly because of their favourable conclusion on the positive impact of PBRs. For example, a
World Bank survey on IPRs reviewed the US-based studies and concluded
protection for intellectual property in seeds and plants in developed countries hasresulted in increased private breeding activity […] Some potential costs of
4. The Economic Impact of Plant Breeders’ Rights – Evidence from USA and UK
Page 31
protecting intellectual property in agriculture have been anticipated but notestablished (Lesser, 1990: 68).
Given the importance of these studies we need to examine them closely as well as analyse
the data that provides the foundation for the results. The following points need to be kept in
mind.
• Are the studies representative of the US seed industry? Butler and Marion (1985)[henceforth BM] petitioned 398 firms in the US, of which 67% responded. However, only60 firms (15% of total petitioned firms) provided financial information that could be used inthe study. These 60 firms represent roughly 50% of seed sales and variety grants. Perrinet al. (1983) [henceforth PKI] began with a sample of 214 firms, where some 60%responded, with only 34% providing complete/usable data.
• Are firms reliable sources for data? Firms may have a reason to furnish inaccuratedata, which would raise problems for economic analysis. The PKI study draws attentionto discrepancies between their estimates of the seed market and those resulting from thedata provided by the companies. As the studies do not resolve these discrepancies,some of the results need to be treated with caution.
• Do the studies provide a historical analysis? Both studies analyse a very brief period,1960-80, focussing on the period immediately around the 1970 enactment of PVPA.Unfortunately, neither studies contextualise the evidence in terms of general historicaltrends so as to differentiate the actual impact of PVPA from other structural changesoccurring in agriculture. Consequently, the weight of the results is undermined.
Three primary issues will be reviewed in the following discussion: (a) the evidence in terms of
investment in plant breeding, (b) data concerning the production of new varieties – the
primary inventive activity being impacted by PBRs, and (c) influence on market structure in
terms of monopoly power and seed prices.
4.2 INVESTMENTS IN PLANT BREEDING
A primary rationalisation supporting IPRs is the incentive it provides privateinvestment, a point empirically validated by evidence establishing the increased levelof private investment. In the context of plant breeding, studies have tackled this issue by
providing a number of indicators of private investment in plant breeding.
• Number of firms in plant breeding
• Private R&D expenditures in plant breeding
• Number of new varieties released (i.e. PBRs granted)
4. The Economic Impact of Plant Breeders’ Rights – Evidence from USA and UK
Page 32
4.2(A) FIRMS AND INVESTMENTS IN PLANT BREEDING
Following the argument that IPRs act as an incentive to private investments it should be the
case that the provision of PBRs is succeeded by an increase in the number of firms in plant
breeding – new firms becoming active in plant breeding. A related indicator would be the
initiation of breeding programmes.
Evidence of firms in plant breeding in the UK is based on the membership of the British
Association of Plant Breeding, the apex body of private breeders that oversees the royalty
payment system among other things. The only reported evidence of this is from Murphy
(1980), which is a submission to the US House of Representatives during the debate over
extending PVPA (1970). Murphy states that the number of members increased from 10 to 23
during the period 1967-73. In contrast, in the Netherlands, the availability of PBRs was
followed by consolidation within the industry that led to disappearance of a number of smaller
cereal breeders (Leenders, 1976).
With respect to the US, BM provide information on 60 breeding companies:
• 20 companies (33%) had breeding programmes before 1960, i.e. well before thelegislation was enacted in 1970;
• 13 companies (22%) initiated breeding programmes between 1960-69, probably inanticipation of the legislation;
• 27 companies (45%) started breeding programmes after the 1970 Act.
Since the majority of breeding programmes began in anticipation of PVPA or soon after it,
the conclusion that PVPA encouraged private investment.
The number of firms or breeding programmes remain an unreliable indicator, partly
since there is no evidence of the trend rate of growth in the number of firms or
acknowledgement of possible exiting of firms and changes in market structure. Further,
membership to the apex association would appear obvious, particularly since it oversees the
collection of royalty payments. To make the number of firms a meaningful indicator it is
necessary to examine the structural changes occurring in the seed industry as well as
investment data. An increase in the number of firms has little or no association with
economic value or efficiency. As far as the evidence of breeding programmes is considered it
may be the case that breeding programmes initiated after 1970 are smaller in magnitude or
only focused only on select crops. It could also be that newer breeding programmes are
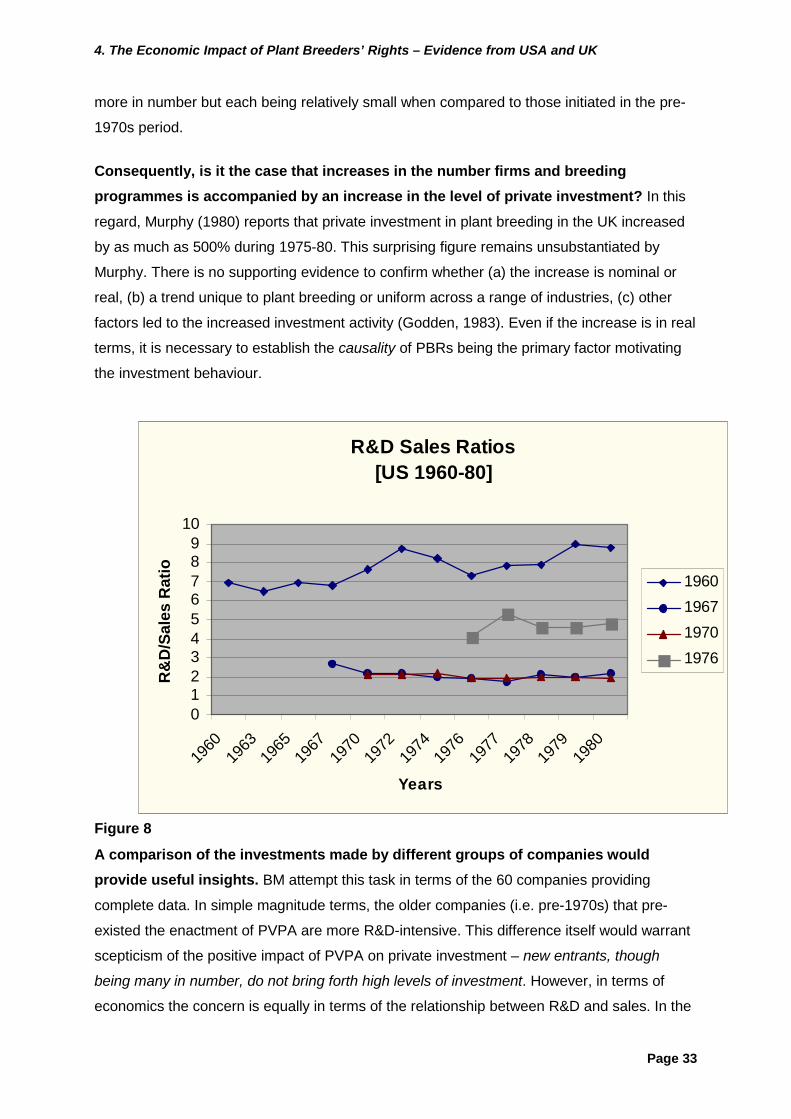
4. The Economic Impact of Plant Breeders’ Rights – Evidence from USA and UK
Page 33
more in number but each being relatively small when compared to those initiated in the pre-
1970s period.
Consequently, is it the case that increases in the number firms and breedingprogrammes is accompanied by an increase in the level of private investment? In this
regard, Murphy (1980) reports that private investment in plant breeding in the UK increased
by as much as 500% during 1975-80. This surprising figure remains unsubstantiated by
Murphy. There is no supporting evidence to confirm whether (a) the increase is nominal or
real, (b) a trend unique to plant breeding or uniform across a range of industries, (c) other
factors led to the increased investment activity (Godden, 1983). Even if the increase is in real
terms, it is necessary to establish the causality of PBRs being the primary factor motivating
the investment behaviour.
Figure 8
A comparison of the investments made by different groups of companies wouldprovide useful insights. BM attempt this task in terms of the 60 companies providing
complete data. In simple magnitude terms, the older companies (i.e. pre-1970s) that pre-
existed the enactment of PVPA are more R&D-intensive. This difference itself would warrant
scepticism of the positive impact of PVPA on private investment – new entrants, though
being many in number, do not bring forth high levels of investment. However, in terms of
economics the concern is equally in terms of the relationship between R&D and sales. In the
R&D Sales Ratios[US 1960-80]
0123456789
10
1960
1963
1965
1967
1970
1972
1974
1976
1977
1978
1979
1980
Years
R&
D/S
ales
Rat
io
1960196719701976
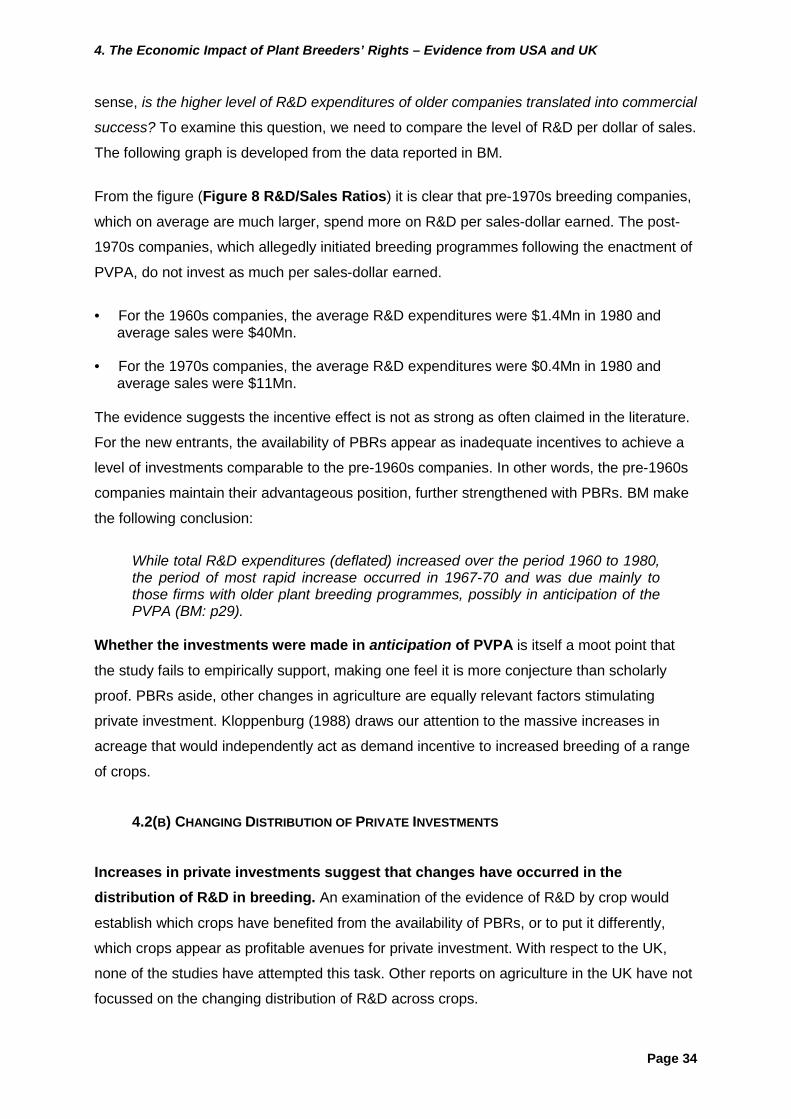
4. The Economic Impact of Plant Breeders’ Rights – Evidence from USA and UK
Page 34
sense, is the higher level of R&D expenditures of older companies translated into commercial
success? To examine this question, we need to compare the level of R&D per dollar of sales.
The following graph is developed from the data reported in BM.
From the figure (Figure 8 R&D/Sales Ratios) it is clear that pre-1970s breeding companies,
which on average are much larger, spend more on R&D per sales-dollar earned. The post-
1970s companies, which allegedly initiated breeding programmes following the enactment of
PVPA, do not invest as much per sales-dollar earned.
• For the 1960s companies, the average R&D expenditures were $1.4Mn in 1980 andaverage sales were $40Mn.
• For the 1970s companies, the average R&D expenditures were $0.4Mn in 1980 andaverage sales were $11Mn.
The evidence suggests the incentive effect is not as strong as often claimed in the literature.
For the new entrants, the availability of PBRs appear as inadequate incentives to achieve a
level of investments comparable to the pre-1960s companies. In other words, the pre-1960s
companies maintain their advantageous position, further strengthened with PBRs. BM make
the following conclusion:
While total R&D expenditures (deflated) increased over the period 1960 to 1980,the period of most rapid increase occurred in 1967-70 and was due mainly tothose firms with older plant breeding programmes, possibly in anticipation of thePVPA (BM: p29).
Whether the investments were made in anticipation of PVPA is itself a moot point that
the study fails to empirically support, making one feel it is more conjecture than scholarly
proof. PBRs aside, other changes in agriculture are equally relevant factors stimulating
private investment. Kloppenburg (1988) draws our attention to the massive increases in
acreage that would independently act as demand incentive to increased breeding of a range
of crops.
4.2(B) CHANGING DISTRIBUTION OF PRIVATE INVESTMENTS
Increases in private investments suggest that changes have occurred in thedistribution of R&D in breeding. An examination of the evidence of R&D by crop would
establish which crops have benefited from the availability of PBRs, or to put it differently,
which crops appear as profitable avenues for private investment. With respect to the UK,
none of the studies have attempted this task. Other reports on agriculture in the UK have not
focussed on the changing distribution of R&D across crops.
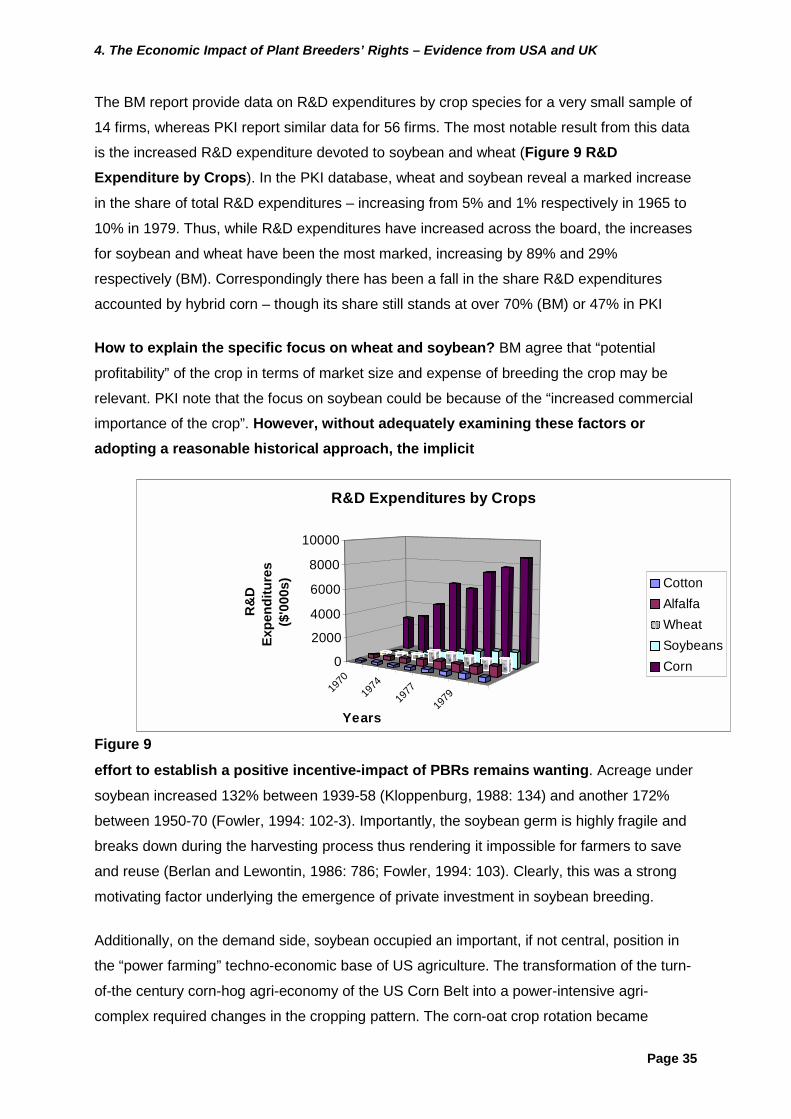
4. The Economic Impact of Plant Breeders’ Rights – Evidence from USA and UK
Page 35
The BM report provide data on R&D expenditures by crop species for a very small sample of
14 firms, whereas PKI report similar data for 56 firms. The most notable result from this data
is the increased R&D expenditure devoted to soybean and wheat (Figure 9 R&DExpenditure by Crops). In the PKI database, wheat and soybean reveal a marked increase
in the share of total R&D expenditures – increasing from 5% and 1% respectively in 1965 to
10% in 1979. Thus, while R&D expenditures have increased across the board, the increases
for soybean and wheat have been the most marked, increasing by 89% and 29%
respectively (BM). Correspondingly there has been a fall in the share R&D expenditures
accounted by hybrid corn – though its share still stands at over 70% (BM) or 47% in PKI
How to explain the specific focus on wheat and soybean? BM agree that “potential
profitability” of the crop in terms of market size and expense of breeding the crop may be
relevant. PKI note that the focus on soybean could be because of the “increased commercial
importance of the crop”. However, without adequately examining these factors oradopting a reasonable historical approach, the implicit
Figure 9effort to establish a positive incentive-impact of PBRs remains wanting. Acreage under
soybean increased 132% between 1939-58 (Kloppenburg, 1988: 134) and another 172%
between 1950-70 (Fowler, 1994: 102-3). Importantly, the soybean germ is highly fragile and
breaks down during the harvesting process thus rendering it impossible for farmers to save
and reuse (Berlan and Lewontin, 1986: 786; Fowler, 1994: 103). Clearly, this was a strong
motivating factor underlying the emergence of private investment in soybean breeding.
Additionally, on the demand side, soybean occupied an important, if not central, position in
the “power farming” techno-economic base of US agriculture. The transformation of the turn-
of-the century corn-hog agri-economy of the US Corn Belt into a power-intensive agri-
complex required changes in the cropping pattern. The corn-oat crop rotation became
1970
1974
1977
1979
������������������������������������������������������������������������������������������������������ ������������������������������������������������������������������������������������������������������ ������������������������������������������������������������������������������������������������������������������������������������������������������ ���
���������
������������������
������������������������
����������������������������
�������������������������������������������������������� ��
����������������������������������
�������������
��������������������
����������������������������������������������� �����
��������������
����������������������������
������������������������������������������������������������������������������������������� ����
��������������
���������
������������������
���������
����������������������������������������������������������������������������������������������
������������������
�������
������������������
�������
������������������������
���������������
������������������������
�������������������������������������������
�����������������������������������
�������0
2000
4000
6000
8000
10000
R&
D
Expe
nditu
res
($'0
00s)
Years
R&D Expenditures by Crops
CottonAlfalfa���������������
����������
WheatSoybeansCorn
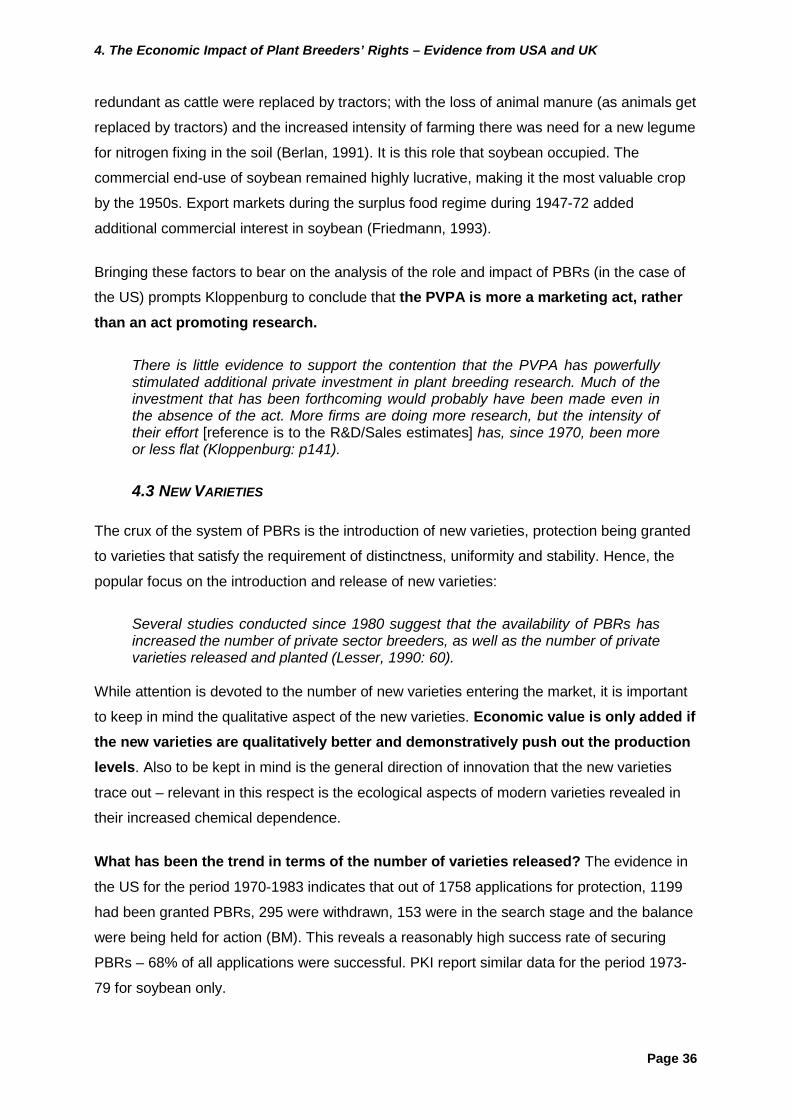
4. The Economic Impact of Plant Breeders’ Rights – Evidence from USA and UK
Page 36
redundant as cattle were replaced by tractors; with the loss of animal manure (as animals get
replaced by tractors) and the increased intensity of farming there was need for a new legume
for nitrogen fixing in the soil (Berlan, 1991). It is this role that soybean occupied. The
commercial end-use of soybean remained highly lucrative, making it the most valuable crop
by the 1950s. Export markets during the surplus food regime during 1947-72 added
additional commercial interest in soybean (Friedmann, 1993).
Bringing these factors to bear on the analysis of the role and impact of PBRs (in the case of
the US) prompts Kloppenburg to conclude that the PVPA is more a marketing act, ratherthan an act promoting research.
There is little evidence to support the contention that the PVPA has powerfullystimulated additional private investment in plant breeding research. Much of theinvestment that has been forthcoming would probably have been made even inthe absence of the act. More firms are doing more research, but the intensity oftheir effort [reference is to the R&D/Sales estimates] has, since 1970, been moreor less flat (Kloppenburg: p141).
4.3 NEW VARIETIES
The crux of the system of PBRs is the introduction of new varieties, protection being granted
to varieties that satisfy the requirement of distinctness, uniformity and stability. Hence, the
popular focus on the introduction and release of new varieties:
Several studies conducted since 1980 suggest that the availability of PBRs hasincreased the number of private sector breeders, as well as the number of privatevarieties released and planted (Lesser, 1990: 60).
While attention is devoted to the number of new varieties entering the market, it is important
to keep in mind the qualitative aspect of the new varieties. Economic value is only added ifthe new varieties are qualitatively better and demonstratively push out the productionlevels. Also to be kept in mind is the general direction of innovation that the new varieties
trace out – relevant in this respect is the ecological aspects of modern varieties revealed in
their increased chemical dependence.
What has been the trend in terms of the number of varieties released? The evidence in
the US for the period 1970-1983 indicates that out of 1758 applications for protection, 1199
had been granted PBRs, 295 were withdrawn, 153 were in the search stage and the balance
were being held for action (BM). This reveals a reasonably high success rate of securing
PBRs – 68% of all applications were successful. PKI report similar data for the period 1973-
79 for soybean only.
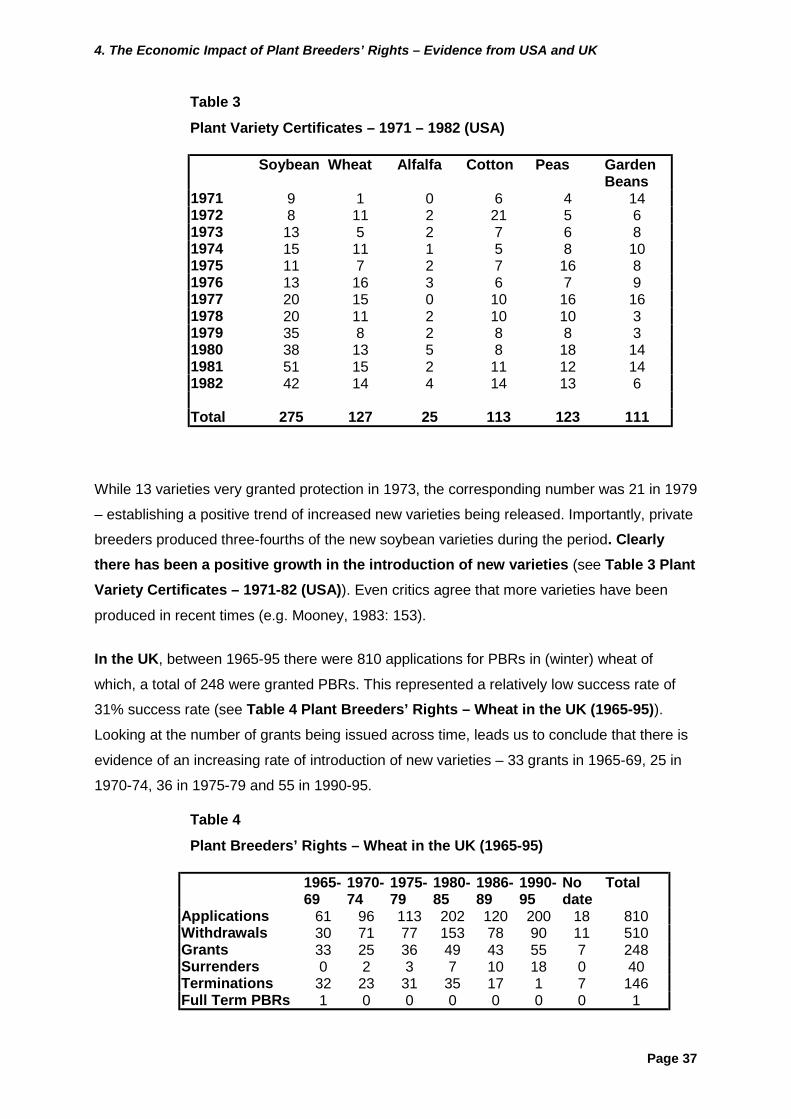
4. The Economic Impact of Plant Breeders’ Rights – Evidence from USA and UK
Page 37
Table 3Plant Variety Certificates – 1971 – 1982 (USA)
Soybean Wheat Alfalfa Cotton Peas GardenBeans
1971 9 1 0 6 4 141972 8 11 2 21 5 61973 13 5 2 7 6 81974 15 11 1 5 8 101975 11 7 2 7 16 81976 13 16 3 6 7 91977 20 15 0 10 16 161978 20 11 2 10 10 31979 35 8 2 8 8 31980 38 13 5 8 18 141981 51 15 2 11 12 141982 42 14 4 14 13 6
Total 275 127 25 113 123 111
While 13 varieties very granted protection in 1973, the corresponding number was 21 in 1979
– establishing a positive trend of increased new varieties being released. Importantly, private
breeders produced three-fourths of the new soybean varieties during the period. Clearlythere has been a positive growth in the introduction of new varieties (see Table 3 PlantVariety Certificates – 1971-82 (USA)). Even critics agree that more varieties have been
produced in recent times (e.g. Mooney, 1983: 153).
In the UK, between 1965-95 there were 810 applications for PBRs in (winter) wheat of
which, a total of 248 were granted PBRs. This represented a relatively low success rate of
31% success rate (see Table 4 Plant Breeders’ Rights – Wheat in the UK (1965-95)).Looking at the number of grants being issued across time, leads us to conclude that there is
evidence of an increasing rate of introduction of new varieties – 33 grants in 1965-69, 25 in
1970-74, 36 in 1975-79 and 55 in 1990-95.
Table 4Plant Breeders’ Rights – Wheat in the UK (1965-95)
1965-69
1970-74
1975-79
1980-85
1986-89
1990-95
Nodate
Total
Applications 61 96 113 202 120 200 18 810Withdrawals 30 71 77 153 78 90 11 510Grants 33 25 36 49 43 55 7 248Surrenders 0 2 3 7 10 18 0 40Terminations 32 23 31 35 17 1 7 146Full Term PBRs 1 0 0 0 0 0 0 1
4. The Economic Impact of Plant Breeders’ Rights – Evidence from USA and UK
Page 38
However, since Rangnekar (forthcoming) did not examine the difference between the pre-PBRs and post-PBRs period no statement can be made on the impact of PBRs on therate of introduction of new varieties. There may be other factors influencing the
introduction of new varieties.
Are PBRs the sole factor causing an increase in the number of new varieties released?This is a more complicated issue concerning (a) changes in historical trends concerning the
rate of release of new varieties and (b) econometric issues concerning causality. An
examination between a pre- and post-PBRs period is a necessary prerequisite to confirm that
the rate of varietal release has increased after the enactment of PBRs legislation. Further, to
establish that the availability of PBRs caused the rate of introduction of new varieties
requires an isolation of the influence of all other factors and demonstrating that they have a
trivial impact. None of the US studies reviewed here have conducted this task. A number
of factors play an important role in determining the rate of introduction of new varieties. Apart
from the various demand-side factors noted earlier (e.g. changing acreage, increasing crop
profitability), the supply-side must also be considered. For example, improvements in
breeding techniques and the use of computer-based systems for information processing and
monitoring of crosses has enabled increased production of new varieties. The relationship
between innovations and IPRs is more complicated than what the various reports reviewed
here suggest.
An econometric exercise to test causality can be conducted. The only econometric
exercise to test the causality relationship between availability of PBRs and the rate of
introduction of new varieties concerns fruits, vegetable and ornamental breeding in the UK
(da Rocha, 1994). The following evidence is based on examining historical data for the
period 1930s-90s and conducting a series of econometric tests to assess the issue of
causality. Following results were reported:
• Apples: There is no statistical support for the claim that PBRs have led to increased rateof introduction of new varieties. PBRs have had no perceptible impact on changing thetrend rate of introduction of new varieties.
• Strawberries: The availability of protection has had a positive impact on the rate ofintroduction of new varieties. However, the main beneficiaries of the availability of PBRshave been public breeders and foreign breeders, i.e. their respective shares of the PBRsgranted have increased.
• Rose: The number of rose varieties released after the availability of protection hasincreased substantially indicating a positive influence. However, statistical tests suggestthat there has been a feedback effect between the number of grants made and the paceof innovation. The latter result casts serious doubts on the significance of PBRs ininfluencing the rate of introduction of new varieties.
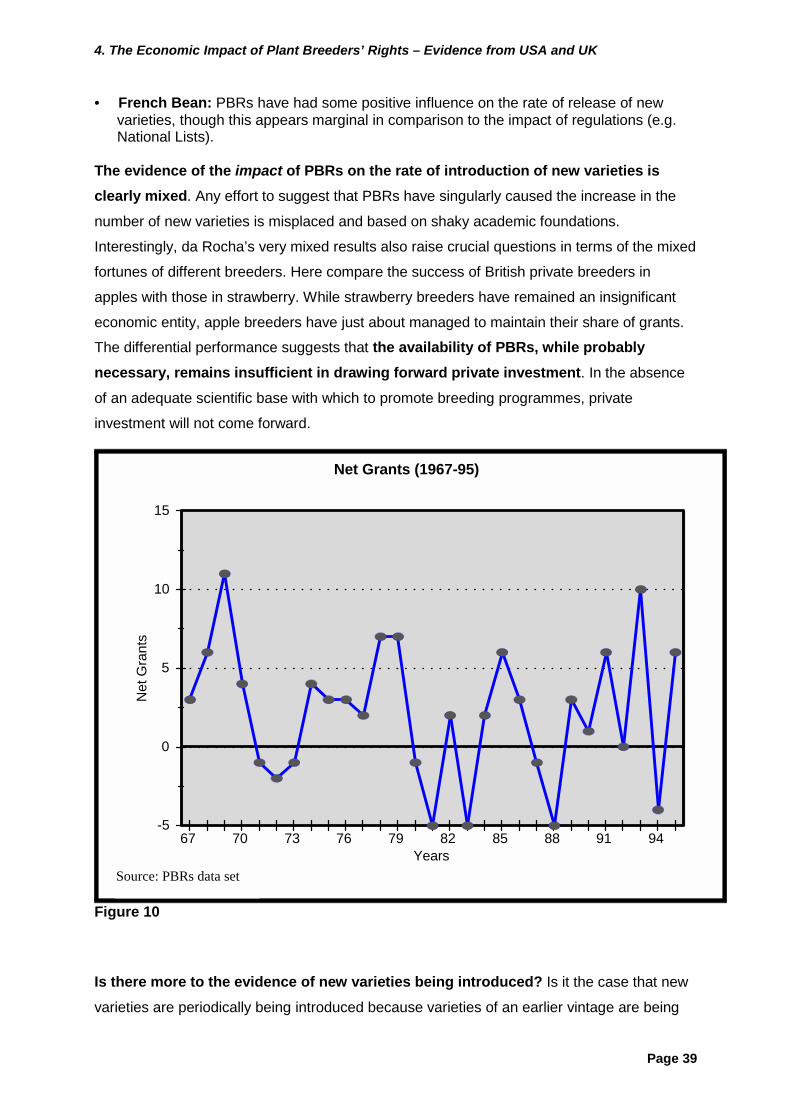
4. The Economic Impact of Plant Breeders’ Rights – Evidence from USA and UK
Page 39
• French Bean: PBRs have had some positive influence on the rate of release of newvarieties, though this appears marginal in comparison to the impact of regulations (e.g.National Lists).
The evidence of the impact of PBRs on the rate of introduction of new varieties isclearly mixed. Any effort to suggest that PBRs have singularly caused the increase in the
number of new varieties is misplaced and based on shaky academic foundations.
Interestingly, da Rocha’s very mixed results also raise crucial questions in terms of the mixed
fortunes of different breeders. Here compare the success of British private breeders in
apples with those in strawberry. While strawberry breeders have remained an insignificant
economic entity, apple breeders have just about managed to maintain their share of grants.
The differential performance suggests that the availability of PBRs, while probablynecessary, remains insufficient in drawing forward private investment. In the absence
of an adequate scientific base with which to promote breeding programmes, private
investment will not come forward.
-5
0
5
10
15
Net
Gra
nts
67 70 73 76 79 82 85 88 91 94 Years
Net Grants (1967-95)
Source: PBRs data set
Figure 10
Is there more to the evidence of new varieties being introduced? Is it the case that new
varieties are periodically being introduced because varieties of an earlier vintage are being
4. The Economic Impact of Plant Breeders’ Rights – Evidence from USA and UK
Page 40
withdrawn? Terminations of grants are purely commercial decisions and may be part of
deeper strategies of appropriation. Rangnekar (forthcoming) examines this issue for wheat
PBRs in the UK. The evidence in terms of net grants, i.e. new varieties released less old
varieties withdrawn, suggests that the level of inventive activity based on the number of new
varieties is an overstatement (Figure 10 Net Grants (1967-95)). Other researchers have
emphasised the breeder’s strongest sale’s pitch is `new’ variety – thus, there is a vested
interest in reducing the life-span of older varieties and continuously changing the portfolio of
existing varieties (Berlan and Lewontin, 1986).
Two important points fall out from analysis the evidence in terms of net grant:
• There are periods when the market suffers a net withdrawal of varieties – morevarieties are withdrawn from the market than those entering the market – such as 1971-73, 1980-81, 1987-88 and 1994.
• There is limited empirical support for an increasing level of inventive activity. To beclear, the trend of net grants does not demonstrate a significant positive rate of growthduring the period of analysis, 1967-95.
Based on the case of wheat in the UK, it is clear that the popular focus on new varieties
entering the market is an incomplete analysis of the impact of PBRs. None of the studies,
including da Rocha, have attempted to compare the entry and exit of varieties. Looking at the
entry-exit dynamics sheds useful insights into the wider corporate strategies of appropriation
Naturally, one needs to also examine the characteristics of the new varieties – are theysubstantively better – in the sense, do these varieties add economic value to theproduction base of the economy? This is a crucial question since there is no test forinventiveness or utility in the system for grant of PBRs. Unlike a patent grant where the
invention is tested for its industrial utility and non-obviousness, varieties are only tested for
distinctness, uniformity, stability and (commercial) novelty. The absence of a merit/inventive
test for new varieties raises the possibility that trivial/cosmetic developments may be
granted protection and could be the basis for much of the increase in the number of new
varieties. In the US, the National Academy of Sciences has noted that much of commercial
plant breeding is focussed on genetic `fine-tuning’ of improved varieties. However, all such
cosmetically differentiated varieties do not add economic value or contribute to enhancing
the nation’s production possibilities. Consider the following extract from the Plant Variety
Protection Office Journal (1984) (of the US) with respect to the distinctness of a new
soybean variety, S30-31, bred by Northrup King and Co.
S30-31 is most similar to Pella, Cumberland and Agripro 25; however, S30-31has grey pubescence vs. twany for Pella, yellow hila vs. imperfect black for
4. The Economic Impact of Plant Breeders’ Rights – Evidence from USA and UK
Page 41
Cumberland, and white flowers vs. purple for Agripro 25 (quoted in Kloppenburg,1988, p144).
Drawing attention to the wasteful nature of cosmetic breeding reflected in the proliferation of
near-identical varieties is important. Given our earlier evidence of differential success insecuring PBRs across the range of crops, it is useful to closely examine thedistribution of grants between companies and crops. Of importance here is the
distribution of PBRs, both in terms of the concentration of grants held by companies and the
share across crops. Collecting empirical evidence of this is difficult, as it requires co-
ordinating all PBRs grants with ultimate corporate owners. Since interest is in the change in
the distribution of grants, tracking changes in the corporate ownership of the seed industry is
an essential prerequisite. Unfortunately, the enormity of this task has dissuaded most
analysts from undertaking this task.
As far as the distribution of PBRs in the US is concerned we have evidence only for a
point in time. For the period 1971-82, the following evidence is reported in BM:
• Of the 83 species covered by the PVPA, five species accounted for 63% of all grantsissued: soybean (23%), wheat (11%), garden peas (10%), cotton (9%), and gardenbeans (10%). And 21 species accounted for 89% of all grants.
• Of the 200 separate breeding institutions (public and private) that had been issued agrant, only 27 institutions secured 10 or more grants. The share of grants made to these27 institutions amounted to 56.7%; though, the top 15 grant holders togethercontrolled 43% of the grants.
• Bringing together the crop-wise distribution of grants with the company shares revealsthat the 27 top grant holders controlled 52% of the grants:
There is clear indication of concentration of PBRs within companies and differential
distribution of PBRs across crops. Not surprisingly, the availability of protection does notguarantee that private investment will accordingly be devoted to all crops. As noted
earlier, the profitability of a crop is a stronger factor motivating private investment. The
distribution of PBRs between companies, i.e. top 15 holders accounting for 43% of the total
grants made, is itself not too alarming. Maybe a closer look at the crop-level distributionis warranted.
Data of PBRs distribution at the crop level supports the widely held view is heavily
concentrated with a few firms controlling most of the market (Table 5 Distribution of PBRsin the US). For the most part, the share of grants issued to the top four firms rangebetween 50-100%.
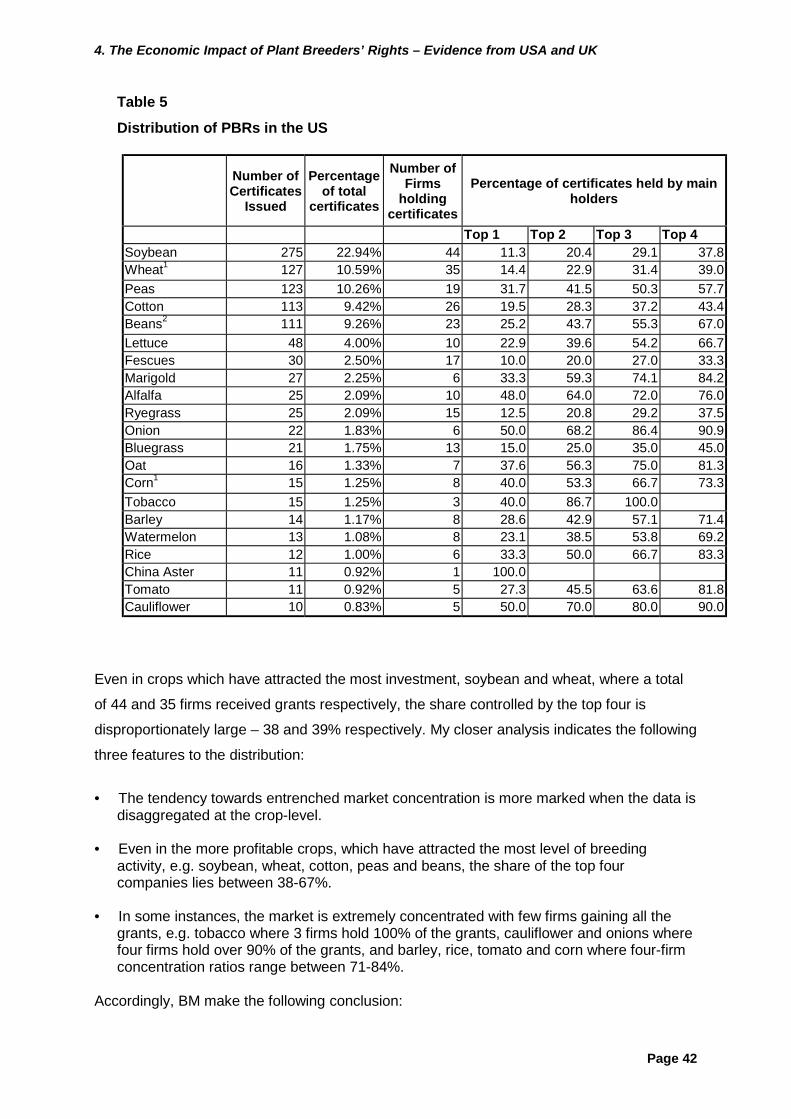
4. The Economic Impact of Plant Breeders’ Rights – Evidence from USA and UK
Page 42
Table 5Distribution of PBRs in the US
Number ofCertificates
Issued
Percentageof total
certificates
Number ofFirms
holdingcertificates
Percentage of certificates held by mainholders
Top 1 Top 2 Top 3 Top 4Soybean 275 22.94% 44 11.3 20.4 29.1 37.8Wheat1 127 10.59% 35 14.4 22.9 31.4 39.0Peas 123 10.26% 19 31.7 41.5 50.3 57.7Cotton 113 9.42% 26 19.5 28.3 37.2 43.4Beans2 111 9.26% 23 25.2 43.7 55.3 67.0Lettuce 48 4.00% 10 22.9 39.6 54.2 66.7Fescues 30 2.50% 17 10.0 20.0 27.0 33.3Marigold 27 2.25% 6 33.3 59.3 74.1 84.2Alfalfa 25 2.09% 10 48.0 64.0 72.0 76.0Ryegrass 25 2.09% 15 12.5 20.8 29.2 37.5Onion 22 1.83% 6 50.0 68.2 86.4 90.9Bluegrass 21 1.75% 13 15.0 25.0 35.0 45.0Oat 16 1.33% 7 37.6 56.3 75.0 81.3Corn1 15 1.25% 8 40.0 53.3 66.7 73.3Tobacco 15 1.25% 3 40.0 86.7 100.0Barley 14 1.17% 8 28.6 42.9 57.1 71.4Watermelon 13 1.08% 8 23.1 38.5 53.8 69.2Rice 12 1.00% 6 33.3 50.0 66.7 83.3China Aster 11 0.92% 1 100.0Tomato 11 0.92% 5 27.3 45.5 63.6 81.8Cauliflower 10 0.83% 5 50.0 70.0 80.0 90.0
Even in crops which have attracted the most investment, soybean and wheat, where a total
of 44 and 35 firms received grants respectively, the share controlled by the top four is
disproportionately large – 38 and 39% respectively. My closer analysis indicates the following
three features to the distribution:
• The tendency towards entrenched market concentration is more marked when the data isdisaggregated at the crop-level.
• Even in the more profitable crops, which have attracted the most level of breedingactivity, e.g. soybean, wheat, cotton, peas and beans, the share of the top fourcompanies lies between 38-67%.
• In some instances, the market is extremely concentrated with few firms gaining all thegrants, e.g. tobacco where 3 firms hold 100% of the grants, cauliflower and onions wherefour firms hold over 90% of the grants, and barley, rice, tomato and corn where four-firmconcentration ratios range between 71-84%.
Accordingly, BM make the following conclusion:
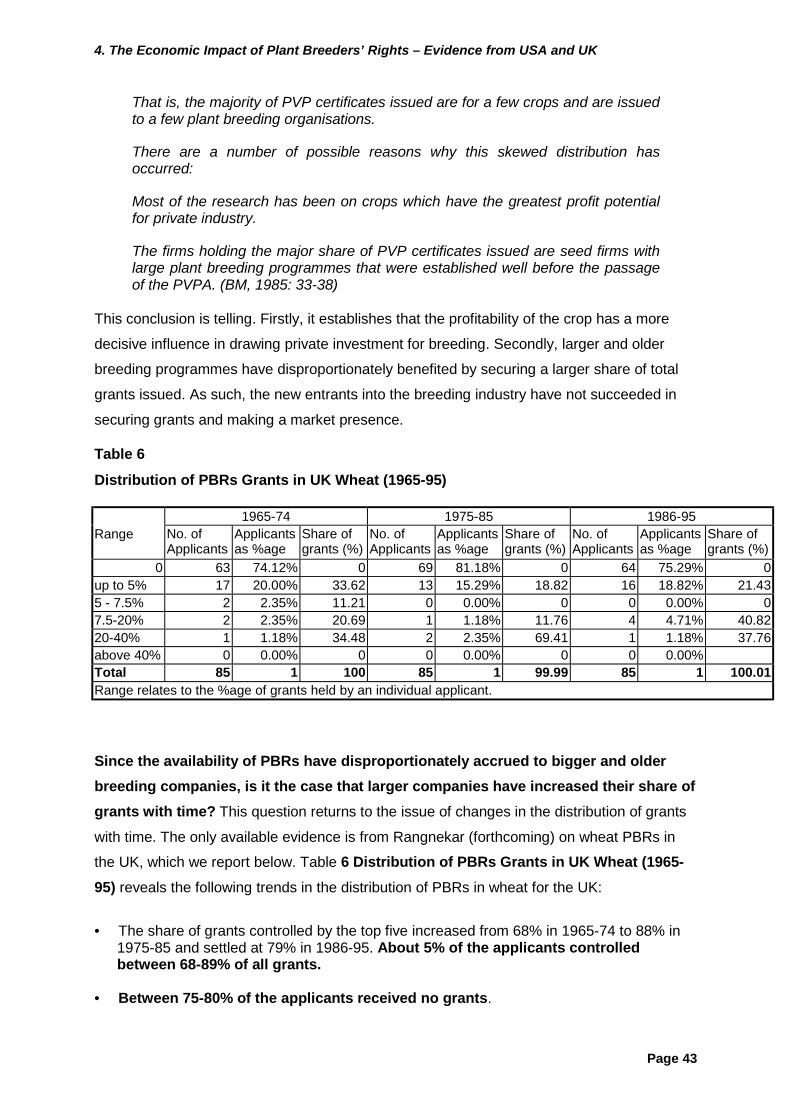
4. The Economic Impact of Plant Breeders’ Rights – Evidence from USA and UK
Page 43
That is, the majority of PVP certificates issued are for a few crops and are issuedto a few plant breeding organisations.
There are a number of possible reasons why this skewed distribution hasoccurred:
Most of the research has been on crops which have the greatest profit potentialfor private industry.
The firms holding the major share of PVP certificates issued are seed firms withlarge plant breeding programmes that were established well before the passageof the PVPA. (BM, 1985: 33-38)
This conclusion is telling. Firstly, it establishes that the profitability of the crop has a more
decisive influence in drawing private investment for breeding. Secondly, larger and older
breeding programmes have disproportionately benefited by securing a larger share of total
grants issued. As such, the new entrants into the breeding industry have not succeeded in
securing grants and making a market presence.
Table 6Distribution of PBRs Grants in UK Wheat (1965-95)
1965-74 1975-85 1986-95Range No. of
ApplicantsApplicantsas %age
Share ofgrants (%)
No. ofApplicants
Applicantsas %age
Share ofgrants (%)
No. ofApplicants
Applicantsas %age
Share ofgrants (%)
0 63 74.12% 0 69 81.18% 0 64 75.29% 0up to 5% 17 20.00% 33.62 13 15.29% 18.82 16 18.82% 21.435 - 7.5% 2 2.35% 11.21 0 0.00% 0 0 0.00% 07.5-20% 2 2.35% 20.69 1 1.18% 11.76 4 4.71% 40.8220-40% 1 1.18% 34.48 2 2.35% 69.41 1 1.18% 37.76above 40% 0 0.00% 0 0 0.00% 0 0 0.00%Total 85 1 100 85 1 99.99 85 1 100.01Range relates to the %age of grants held by an individual applicant.
Since the availability of PBRs have disproportionately accrued to bigger and olderbreeding companies, is it the case that larger companies have increased their share ofgrants with time? This question returns to the issue of changes in the distribution of grants
with time. The only available evidence is from Rangnekar (forthcoming) on wheat PBRs in
the UK, which we report below. Table 6 Distribution of PBRs Grants in UK Wheat (1965-95) reveals the following trends in the distribution of PBRs in wheat for the UK:
• The share of grants controlled by the top five increased from 68% in 1965-74 to 88% in1975-85 and settled at 79% in 1986-95. About 5% of the applicants controlledbetween 68-89% of all grants.
• Between 75-80% of the applicants received no grants.
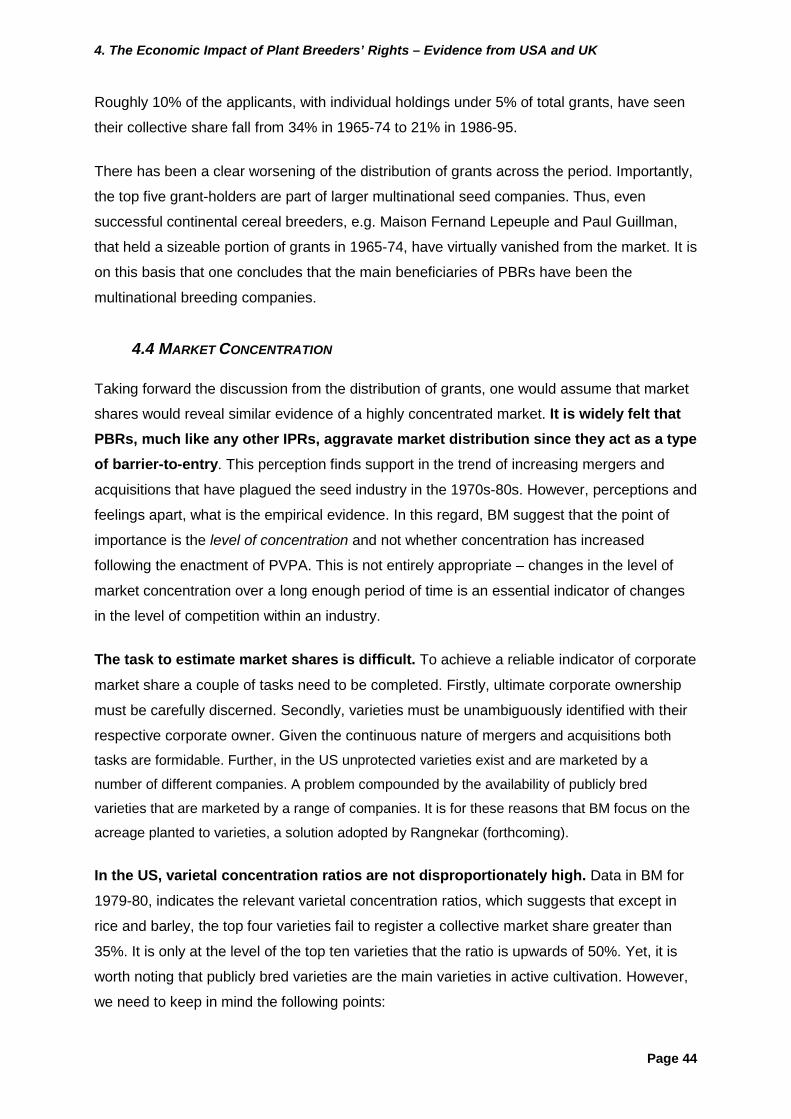
4. The Economic Impact of Plant Breeders’ Rights – Evidence from USA and UK
Page 44
Roughly 10% of the applicants, with individual holdings under 5% of total grants, have seen
their collective share fall from 34% in 1965-74 to 21% in 1986-95.
There has been a clear worsening of the distribution of grants across the period. Importantly,
the top five grant-holders are part of larger multinational seed companies. Thus, even
successful continental cereal breeders, e.g. Maison Fernand Lepeuple and Paul Guillman,
that held a sizeable portion of grants in 1965-74, have virtually vanished from the market. It is
on this basis that one concludes that the main beneficiaries of PBRs have been the
multinational breeding companies.
4.4 MARKET CONCENTRATION
Taking forward the discussion from the distribution of grants, one would assume that market
shares would reveal similar evidence of a highly concentrated market. It is widely felt thatPBRs, much like any other IPRs, aggravate market distribution since they act as a typeof barrier-to-entry. This perception finds support in the trend of increasing mergers and
acquisitions that have plagued the seed industry in the 1970s-80s. However, perceptions and
feelings apart, what is the empirical evidence. In this regard, BM suggest that the point of
importance is the level of concentration and not whether concentration has increased
following the enactment of PVPA. This is not entirely appropriate – changes in the level of
market concentration over a long enough period of time is an essential indicator of changes
in the level of competition within an industry.
The task to estimate market shares is difficult. To achieve a reliable indicator of corporate
market share a couple of tasks need to be completed. Firstly, ultimate corporate ownership
must be carefully discerned. Secondly, varieties must be unambiguously identified with their
respective corporate owner. Given the continuous nature of mergers and acquisitions both
tasks are formidable. Further, in the US unprotected varieties exist and are marketed by a
number of different companies. A problem compounded by the availability of publicly bred
varieties that are marketed by a range of companies. It is for these reasons that BM focus on the
acreage planted to varieties, a solution adopted by Rangnekar (forthcoming).
In the US, varietal concentration ratios are not disproportionately high. Data in BM for
1979-80, indicates the relevant varietal concentration ratios, which suggests that except in
rice and barley, the top four varieties fail to register a collective market share greater than
35%. It is only at the level of the top ten varieties that the ratio is upwards of 50%. Yet, it is
worth noting that publicly bred varieties are the main varieties in active cultivation. However,
we need to keep in mind the following points:
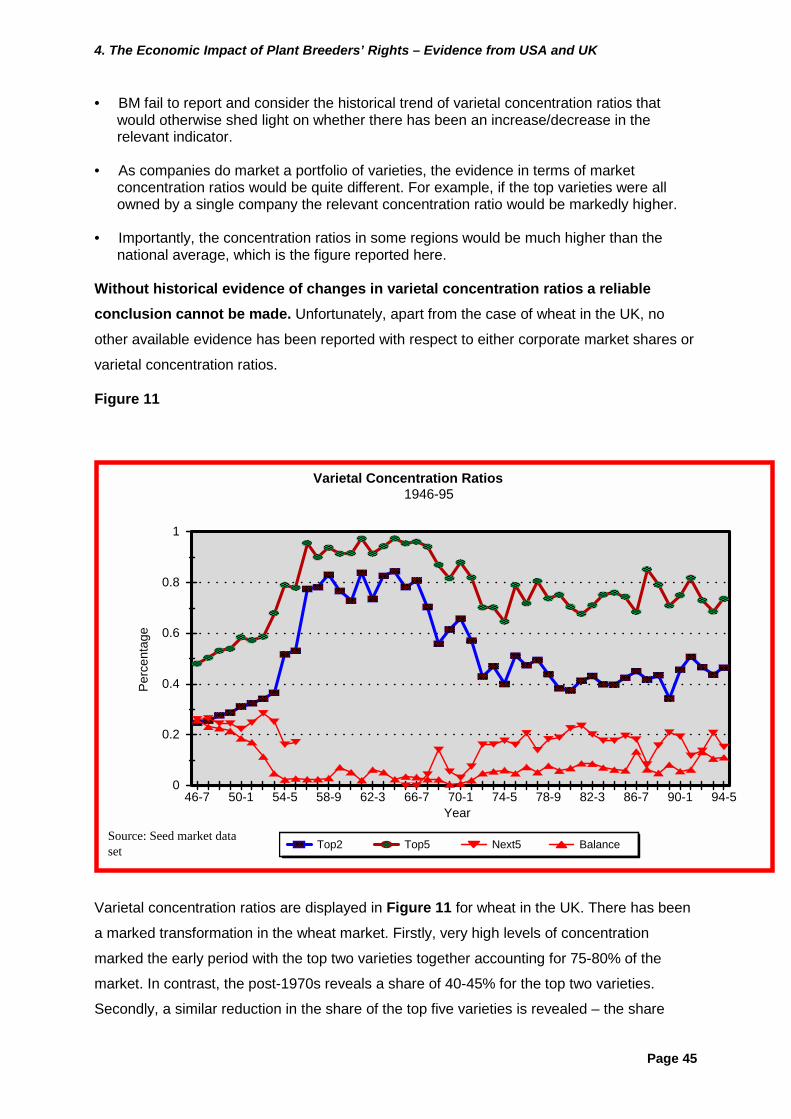
4. The Economic Impact of Plant Breeders’ Rights – Evidence from USA and UK
Page 45
• BM fail to report and consider the historical trend of varietal concentration ratios thatwould otherwise shed light on whether there has been an increase/decrease in therelevant indicator.
• As companies do market a portfolio of varieties, the evidence in terms of marketconcentration ratios would be quite different. For example, if the top varieties were allowned by a single company the relevant concentration ratio would be markedly higher.
• Importantly, the concentration ratios in some regions would be much higher than thenational average, which is the figure reported here.
Without historical evidence of changes in varietal concentration ratios a reliableconclusion cannot be made. Unfortunately, apart from the case of wheat in the UK, no
other available evidence has been reported with respect to either corporate market shares or
varietal concentration ratios.
Figure 11
0
0.2
0.4
0.6
0.8
1
Perc
enta
ge
46-7 50-1 54-5 58-9 62-3 66-7 70-1 74-5 78-9 82-3 86-7 90-1 94-5Year
����������������
����������������
�����������������������
����������
������������������
������������
���������������������
������������������������
������������������������
���������������
������������
������
������������
��������������
��������������
����������������
����������������
�������������
���������������
�����������������
������������
���������������������������������������
����������������
����������������
�����
���������������������������
��������������������
����������������
����������������������������
������������
������������������
��������������
���������������������
����������������
������������������������
�������������
���������������������������
������������������
��������������
�����������������������
����������������
�����
���������������
����������
������������������
���������������������������
�����������������������
������������������������
������������
����������
���������������������
������
������������
���������������� Top2
������������ Top5 Next5 Balance
Varietal Concentration Ratios1946-95
Source: Seed market dataset
Varietal concentration ratios are displayed in Figure 11 for wheat in the UK. There has been
a marked transformation in the wheat market. Firstly, very high levels of concentration
marked the early period with the top two varieties together accounting for 75-80% of the
market. In contrast, the post-1970s reveals a share of 40-45% for the top two varieties.
Secondly, a similar reduction in the share of the top five varieties is revealed – the share
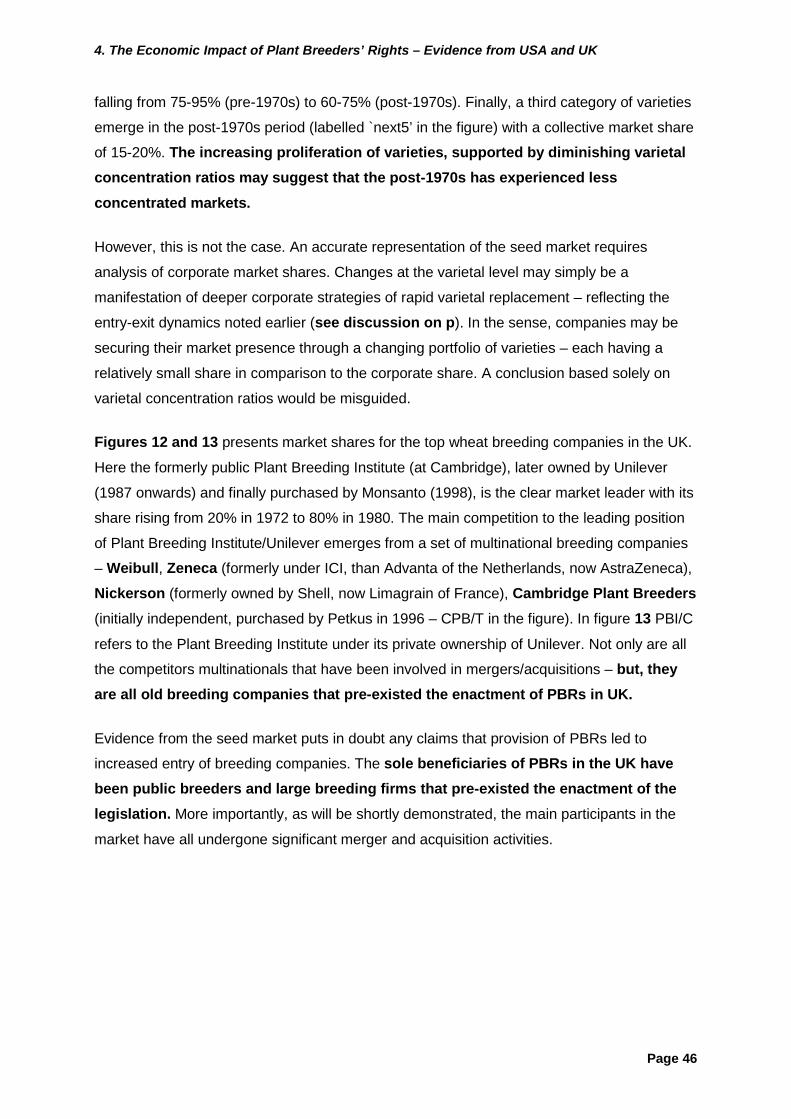
4. The Economic Impact of Plant Breeders’ Rights – Evidence from USA and UK
Page 46
falling from 75-95% (pre-1970s) to 60-75% (post-1970s). Finally, a third category of varieties
emerge in the post-1970s period (labelled `next5’ in the figure) with a collective market share
of 15-20%. The increasing proliferation of varieties, supported by diminishing varietalconcentration ratios may suggest that the post-1970s has experienced lessconcentrated markets.
However, this is not the case. An accurate representation of the seed market requires
analysis of corporate market shares. Changes at the varietal level may simply be a
manifestation of deeper corporate strategies of rapid varietal replacement – reflecting the
entry-exit dynamics noted earlier (see discussion on p). In the sense, companies may be
securing their market presence through a changing portfolio of varieties – each having a
relatively small share in comparison to the corporate share. A conclusion based solely on
varietal concentration ratios would be misguided.
Figures 12 and 13 presents market shares for the top wheat breeding companies in the UK.
Here the formerly public Plant Breeding Institute (at Cambridge), later owned by Unilever
(1987 onwards) and finally purchased by Monsanto (1998), is the clear market leader with its
share rising from 20% in 1972 to 80% in 1980. The main competition to the leading position
of Plant Breeding Institute/Unilever emerges from a set of multinational breeding companies
– Weibull, Zeneca (formerly under ICI, than Advanta of the Netherlands, now AstraZeneca),
Nickerson (formerly owned by Shell, now Limagrain of France), Cambridge Plant Breeders(initially independent, purchased by Petkus in 1996 – CPB/T in the figure). In figure 13 PBI/C
refers to the Plant Breeding Institute under its private ownership of Unilever. Not only are all
the competitors multinationals that have been involved in mergers/acquisitions – but, theyare all old breeding companies that pre-existed the enactment of PBRs in UK.
Evidence from the seed market puts in doubt any claims that provision of PBRs led to
increased entry of breeding companies. The sole beneficiaries of PBRs in the UK havebeen public breeders and large breeding firms that pre-existed the enactment of thelegislation. More importantly, as will be shortly demonstrated, the main participants in the
market have all undergone significant merger and acquisition activities.
4. The Economic Impact of Plant Breeders’ Rights – Evidence from USA and UK
Page 47
0
0.2
0.4
0.6
0.8
1
Mar
ket S
hare
(%)
46-7 50-1 54-5 58-9 62-3 66-7 70-1 74-5 78-9 82-3 86-7 90-1 94-5Years
Market Share (1946-95)Plant Breeding Institute
Source: Seed market dataset
Figure 12
0
0.05
0.1
0.15
0.2
0.25
0.3
Mar
ket S
hare
(%)
74-5 76-7 78-9 80-1 82-3 84-5 86-7 88-9 90-1 92-3 94-5Year
Weibull Nickerson Zeneca PBIC CPB/T
Market Shares (1974-1995)Select Companies
Source: Seedmarket dataset
Figure 13
4. The Economic Impact of Plant Breeders’ Rights – Evidence from USA and UK
Page 48
Discussion on market concentration is closely related to the merger and acquisitionactivities witnessed in the seed industry. Reports in the US note the general perception
that the PVPA had promoted increased acquisitions within the seed industry leading to much
higher levels of conglomeration – two-thirds of public breeders and four-fifths of seed
company respondents felt that the PVPA had led to an increased acquisition of independent
seed companies by non-seed companies (see BM). The companies that have bought into the
seed industry originate in the following industrial sectors:
• Petro-chemical and pharmaceuticals;
• Grain and food-processing
• Genetic engineering and seed companies
Mooney (1983) reports evidence of 762 corporate take-overs in North America and Europe
during the 1960s-80s – chemical companies alone made 246 of these purchases. Between
1976-86, a total US$10 billion world-wide was spent in this acquisition drive – largely led by
chemical companies like Sandoz, DeKalb-Pfizer, Shell, ICI, and Ciba Geigy (The Economist,
1986). In the US alone, of the 100 corporate take-overs reported in McMullen (1987) only 2
occurred prior to PVPA – 61 occurred between 1970-79, 19 in the 1980s, and dates could
not be established for the remainder. The purchasing drive was well-directed and aimed at
seed companies with active breeding programmes and strong marketing channels (BM,
1985) – an aspect re-confirmed with respect to wheat breeding in the UK (Rangnekar,
forthcoming). The evidence clearly indicates that the merger and acquisition drive inthe seed industry was fostered by the availability of PBRs. Equally relevant are otherfactors, such as the success in hybrid breeding across a number of crop species, the
widening global seed market and the growing use of chemical inputs, advances achieved in
dwarfing (i.e. green revolution varieties).
With the increasing transformation of the seed industry in the US, some commentators note
that by the mid-1980s there were hardly any independent seed companies remaining save
the anomaly of Pioneer Hi-Bred. In the UK, cereal-breeding companies faced a similar fate –
the only possible solution for survival was to consolidate and merge. The main MNCs active
in the UK emerged either from the petro-chemical industry or the food industry. As far as the
US case goes, BM offer the following conclusion:
On balance, conglomerates have probably had a negative influence on the seedindustry by acquiring many previously independent companies, eliminating actualand potential competitors in some cases, consolidating plant breeding activitiesand thereby reducing diversity, and in other cases reducing the viability of theseed companies acquired (p51).
4. The Economic Impact of Plant Breeders’ Rights – Evidence from USA and UK
Page 49
In the case of the wheat market in the UK, we reiterate the earlier points: (a) the sole
beneficiaries have been breeding companies that have been historically active in the sector
and (b) managed to consolidate and merge with MNCs. Clearly, the availability of PBRs has
not prompted any new entrant into the market.
Consequently, the view that formidable barriers-to-entry have been erected in the seedindustry. Much economic research in a wide variety of industries concludes that highly
concentrated industries erect formidable entry barriers, which get further entrenched by the
system of IPRs. These entry barriers may correspond to scale economies, the cost of
conducting R&D, the advertising budget required to secure brand presence, etc. While little
of this research has been directed at the seed industry, the following points are worth
considering.
The presence of publicly bred varieties and the varietal release policy practised by the
public sector is of crucial importance. The availability of these varieties potentially allows
small breeding companies to make a market presence without having to incur the
substantive costs of developing parental breeding material. Yet, larger companies with the
advantage of their scale of operations are able to profitably utilise the newly released
parental lines developed by the public sector – a point well established in the case of the US.
With respect to the UK, the withdrawal of the public sector, which in the case of wheat
occurred with sale of public breeding stations to Unilever, the possibilities for new entrants to
participate in the seed industry become more difficult.
The science of breeding has changed tremendously in the last few decades with the
increasingly wide spread application of biotechnology. Correspondingly, the costs of
developing new cultivars have increased. Importantly, much of this science base remains
privately owned. Thus, new entrants are faced with formidable start-up costs of
acquiring/replicating the necessary science base. Further, the high levels of concentration in
the seed industry make survival for a new entrant all the more difficult.
Exchange of genetic material is fundamental for continuous breeding of varieties – new
improved varieties are the result of crosses of locally adapted material. While PBRs do have
a liberal research exemption clause, the possibilities of patents encompassing plant varieties
will substantially reduce the exchange of genetic material. This would pose new dangers for
the seed industry with potentially greater control over the direction of agricultural research
being vested with MNCs. There already indication of the of increasing threats to exchange of
genetic material. Given the crucial important of genetic material for the continued activity of
plant breeding, this is indeed alarming. Recent evidence from an informal survey conducted
4. The Economic Impact of Plant Breeders’ Rights – Evidence from USA and UK
Page 50
with public breeders in the US confirms our apprehensions (Price, 1999). Based on a simple
questionnaire, Price received 86 responses, representing 25 US universities and 41 crops.
The responses were as follows:
• 48% indicated that they had experienced difficulty in obtaining genetic stocks from privatecompanies;
• 45% indicated that this had interfered with their research;
• 28% felt that it had interfered with their ability to release new varieties,
• 23% reported that it had interfered with the training of graduate students.
The results raise a number of questions related to the fundamental role of publicbreeding? And highlight possible issues concerning on the location of agriculturalresearch - Is it in the public interest to have future varietal releases donepredominantly by industry? If training of future breeders is being threatened, who willensure the continued recruitment of breeders?
4.5 REFLECTIONS ON MARKET POWER – EVIDENCE OF CHANGING SEED PRICES
An empirical indicator of market power is the trajectory of seed prices. Theoretically, it isbelieved that an industry with a high level of monopoly power demonstrates markedlyhigher prices, as corporations are able to create barriers to entry and forestallcompetition.
A number of factors are relevant in determining the market price of seeds. For example, the
range of varieties available and the competition between different companies producing the
varieties, the presence of publicly-bred varieties and the availability of on-farm saved seeds.
Equally important are the productivity improvements revealed by the new varieties being
produced and the market competition in the downstream sectors using the variety. Evidence
of changes in the seed prices are represented in the following trends:
• Expenditures on seeds as a proportion of total expenditures for farm inputs haveincreased from 1.9% in 1960 to 3.2% in 1977 and settled at 3.0% in 1980. However, forsome species it is much higher – corn 10.4%, soybeans 14.3%, wheat 11.1% andpeanuts 18.3% (1979 figures).
• Seed expenditures quadrupled between 1970-80 – a rate of increase comparable to theincreases in fertiliser expenditures – three-fourths of the increase were attributed toincreases in seed prices, the balance being on account of increased amounts of seedpurchased (BM). In constant dollars (1960), seed expenditures increased from $519Mn in1960 to $1515Mn in 1980 (PKI)
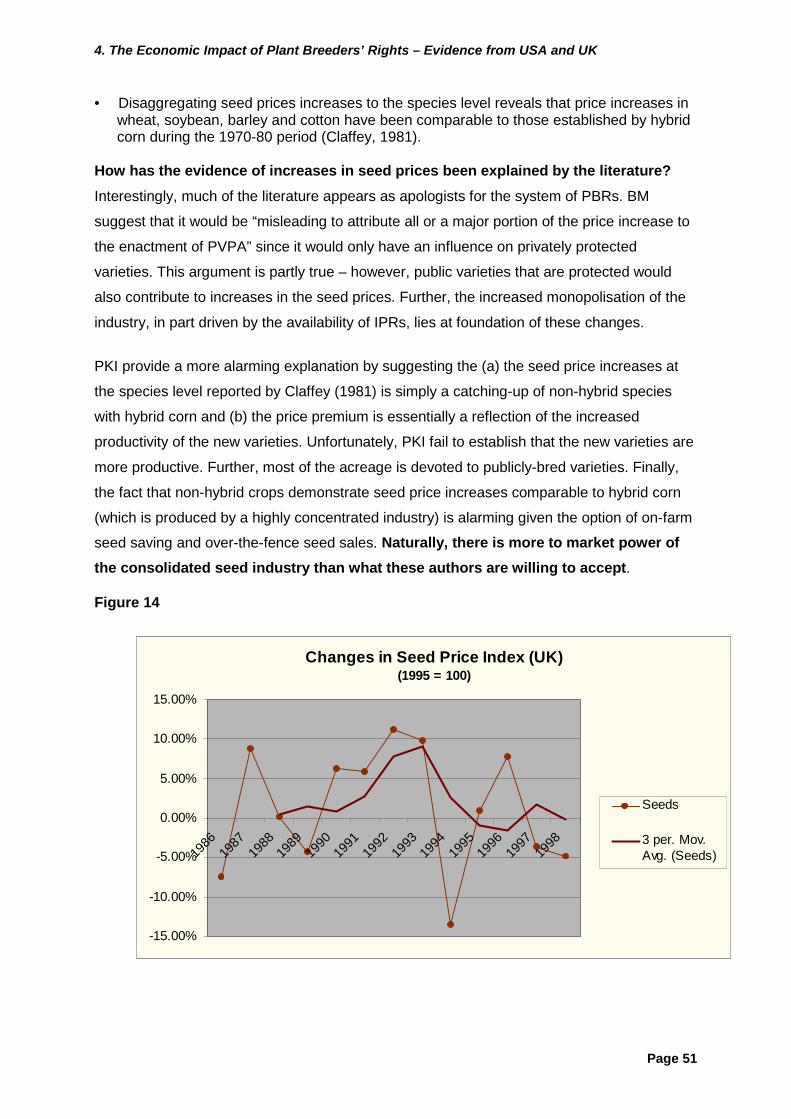
4. The Economic Impact of Plant Breeders’ Rights – Evidence from USA and UK
Page 51
• Disaggregating seed prices increases to the species level reveals that price increases inwheat, soybean, barley and cotton have been comparable to those established by hybridcorn during the 1970-80 period (Claffey, 1981).
How has the evidence of increases in seed prices been explained by the literature?Interestingly, much of the literature appears as apologists for the system of PBRs. BM
suggest that it would be “misleading to attribute all or a major portion of the price increase to
the enactment of PVPA” since it would only have an influence on privately protected
varieties. This argument is partly true – however, public varieties that are protected would
also contribute to increases in the seed prices. Further, the increased monopolisation of the
industry, in part driven by the availability of IPRs, lies at foundation of these changes.
PKI provide a more alarming explanation by suggesting the (a) the seed price increases at
the species level reported by Claffey (1981) is simply a catching-up of non-hybrid species
with hybrid corn and (b) the price premium is essentially a reflection of the increased
productivity of the new varieties. Unfortunately, PKI fail to establish that the new varieties are
more productive. Further, most of the acreage is devoted to publicly-bred varieties. Finally,
the fact that non-hybrid crops demonstrate seed price increases comparable to hybrid corn
(which is produced by a highly concentrated industry) is alarming given the option of on-farm
seed saving and over-the-fence seed sales. Naturally, there is more to market power ofthe consolidated seed industry than what these authors are willing to accept.
Figure 14
Changes in Seed Price Index (UK)(1995 = 100)
-15.00%
-10.00%
-5.00%
0.00%
5.00%
10.00%
15.00%
1986
1987
1988
1989
1990
1991
1992
1993
1994
1995
1996
1997
1998
Seeds
3 per. Mov.Avg. (Seeds)
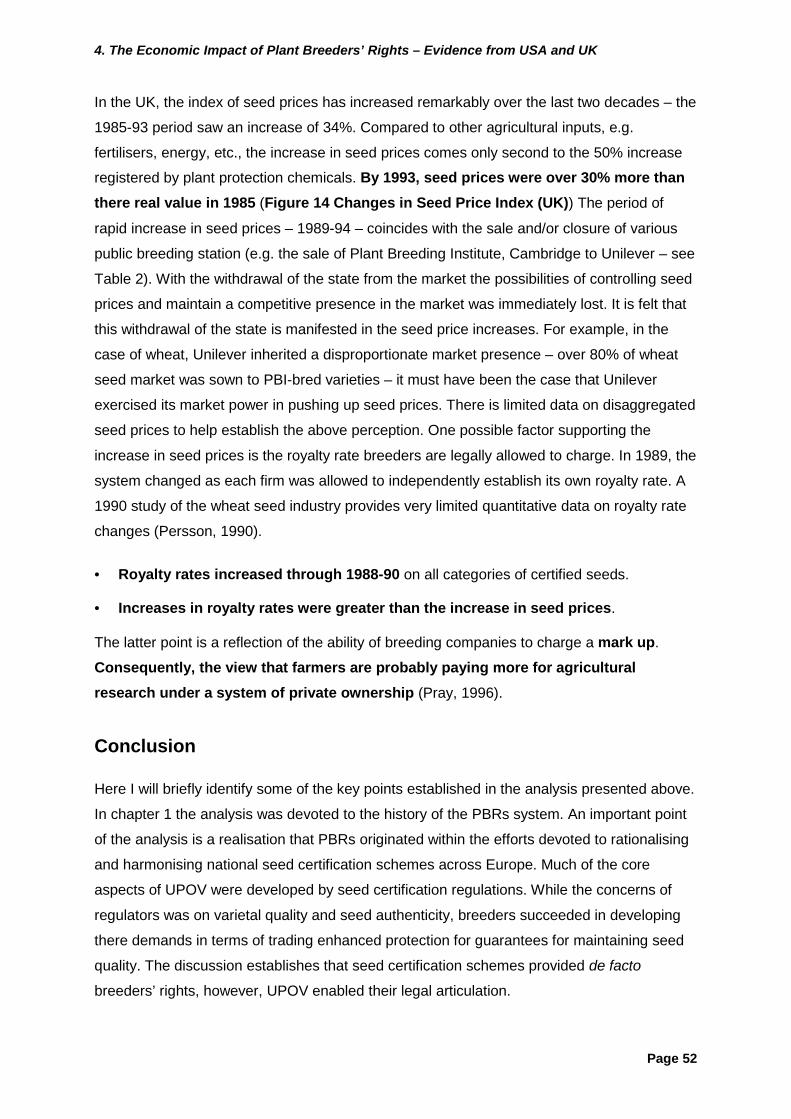
4. The Economic Impact of Plant Breeders’ Rights – Evidence from USA and UK
Page 52
In the UK, the index of seed prices has increased remarkably over the last two decades – the
1985-93 period saw an increase of 34%. Compared to other agricultural inputs, e.g.
fertilisers, energy, etc., the increase in seed prices comes only second to the 50% increase
registered by plant protection chemicals. By 1993, seed prices were over 30% more thanthere real value in 1985 (Figure 14 Changes in Seed Price Index (UK)) The period of
rapid increase in seed prices – 1989-94 – coincides with the sale and/or closure of various
public breeding station (e.g. the sale of Plant Breeding Institute, Cambridge to Unilever – see
Table 2). With the withdrawal of the state from the market the possibilities of controlling seed
prices and maintain a competitive presence in the market was immediately lost. It is felt that
this withdrawal of the state is manifested in the seed price increases. For example, in the
case of wheat, Unilever inherited a disproportionate market presence – over 80% of wheat
seed market was sown to PBI-bred varieties – it must have been the case that Unilever
exercised its market power in pushing up seed prices. There is limited data on disaggregated
seed prices to help establish the above perception. One possible factor supporting the
increase in seed prices is the royalty rate breeders are legally allowed to charge. In 1989, the
system changed as each firm was allowed to independently establish its own royalty rate. A
1990 study of the wheat seed industry provides very limited quantitative data on royalty rate
changes (Persson, 1990).
• Royalty rates increased through 1988-90 on all categories of certified seeds.
• Increases in royalty rates were greater than the increase in seed prices.
The latter point is a reflection of the ability of breeding companies to charge a mark up.
Consequently, the view that farmers are probably paying more for agriculturalresearch under a system of private ownership (Pray, 1996).
Conclusion
Here I will briefly identify some of the key points established in the analysis presented above.
In chapter 1 the analysis was devoted to the history of the PBRs system. An important point
of the analysis is a realisation that PBRs originated within the efforts devoted to rationalising
and harmonising national seed certification schemes across Europe. Much of the core
aspects of UPOV were developed by seed certification regulations. While the concerns of
regulators was on varietal quality and seed authenticity, breeders succeeded in developing
there demands in terms of trading enhanced protection for guarantees for maintaining seed
quality. The discussion establishes that seed certification schemes provided de facto
breeders’ rights, however, UPOV enabled their legal articulation.
Conclusion
Page 53
It is always important to keep in mind the factors that prompted the creation of a sui generis
system for the protection of plant varieties. The analysis draws attention to a number of
factors that favoured the widening application of patent law in the 1950s to include plant
varieties. Yet, the exclusion of plant varieties from patenting was primarily a result of the
opposition from lobby groups representing patent lawyers. In addition, the activity of plant
breeding and the nature of plant varieties also posed insurmountable problems for their
inclusion within the application of patent law. Consequently, some peculiar aspects of UPOV
– the absence of a test for inventiveness or merit test for new varieties, the relaxed
requirement for novelty and the unique method of disclosures.
In the UK, the debate on PBRs closely followed Continental developments. Thus, once again
we see the close relationship between seed certification schemes and the provision of PBRs.
An examination of the conflicts between the demands being made by farmers and those by
breeders is illustrative of the manner in which the consumer rhetoric of seed labelling gets
transformed into a means for providing PBR. Farmers were demanding a merit test prior to
market entry of varieties and legally-binding seed labelling. In response, breeders argued
that seed quality can only be guaranteed if greater controls over seed production were
offered to breeders. In this manner, one of the demands of farmers was accommodated
whilst breeders succeeded in securing PBRs.
Chapter 2 reviewed statistical evidence representing changes in the status of agriculture in
the UK. Agreeably, there have been marked technological and productivity improvements in
agriculture, partly captured in the following trends:
• Labour input in agriculture in the mid-1980s was 1/10th of that required in 1930.
• Total horsepower of tractors have grown more than 10-fold since 1945.
• Nitrogen fertiliser use has increased more than 6-fold since 1945.
Reflecting these changes has been key varietal developments – particularly the introduction
and adoption of dwarf varieties. Consequently, yields have increased tremendously in
agriculture. Yet there are a number of apparent paradoxes within the techno-economic
transformation of agriculture in the UK. For example, contrast the productivity indicators with
the reality of diminishing commercial viability of farming -–the latter captured in the fact that
net farm incomes have consistently fallen in recent decades. Farm incomes are falling as
agricultural input prices are rising faster than agricultural output prices, despite the extensive
support system. Finally, the review drew attention to the worsening land distribution system
in the UK.
Conclusion
Page 54
Chapter 4 reviewed the development of UK’s agricultural research system, which drew
attention to the general struggle to control resources devoted to agriculture. Part of the
struggle was a reflection between differing political ideologies of central control and laissez
faire. Consequently, the last century has experienced great reversals in the state’s role as
provider of agricultural research. In the more recent past, the prevailing ideology of radical
liberalisation witnessed the withdrawal of the state from `near-market’ research. As a result
key plant breeding stations were either closed or sold to the private sector.
Chapter 5 presented economic analysis of the impact of PBRs in the UK and US, focussing
on three themes: (a) private investment, (b) introduction of new varieties and (c) market
power.
With respect to private investment and the number of firms active in plant breeding, the
following evidence has been reported earlier:
• Mixed evidence in terms of number of firms active in plant breeding. While evidence ofincreasing entry of firms into plant breeding is mixed, there is compelling evidence of seedindustry consolidation. The latter is well supported by reports of widespread mergers andacquisitions within the industry.
• There is indication of increasing levels of private investment in plant breeding. Yet, theclear influence of PBRs on the level of investment is not theoretically convincing.More importantly, older firms that pre-existed PBRs legislation have been the most active.
• Private investment appears to concentrate on select crops, suggesting that theprofitability of the crop is more crucial in bringing forth private investment. As such,the stimulating role of PBRs is questionable. Alternatively, PBRs on their own cannot accountfor increased private investment. The latter point is amply demonstrated in the discussionconcerning soybean.
The evidence of PBRs is most often presented in terms of increased number of new plant
varieties. The study establishes that this focus is mistaken and deluding. The importantquestions is whether PBRs caused the changes in the number of new varieties. None
of the US-based studies have theoretically addressed this question. Econometric exercises
with respect to the UK convincingly establish a very mixed result – in some cases, PBRs can
be claimed as having caused an increase in the rate of introduction of new varieties.
Yet more important is the empirical evidence in terms of the entry-exit movement of plantvarieties – net grants. It has been demonstrated that companies are constantly replacing
the portfolio of varieties – the rate of introduction of new varieties is part of deeper
commercial strategies of changing the portfolio of existing varieties. Consequently, there area number of periods when the market experiences a net withdrawal of varieties. This
evidence undermines claims concerning PBR’s positive impact on inventive activity.
Conclusion
Page 55
Statistical evidence on the distribution of PBRs grants confirms our suspicions of a highly
concentrated market. Data concerning the US establishes that across a range of crops there
is an unhealthy level of concentration. Time series data for wheat in the UK confirms thatPBRs distribution has tended to worsen with time – about 5% of the applicants controlled
between 68-89% of the grants issued. An overwhelming 75-82% of applicants did not receive
a single grant throughout the period of study, 1965-95. The main beneficiaries of the PBRssystem have been the older breeding firms that have been subsequently consolidatedwithin MNCs.
The high level of concentration in the distribution of grants is reflected in market shares. The
only time series data available confirms that market shares have remained quiteaggravated. While there may be more varieties in the market, corporate shares have not
diminished. Entry-barriers exist in the seed industry, compounded by the skeweddistribution of grants. One reflection of market power is the behaviour of seed prices. The
following evidence has been reported:
• In the US, three-fourths of the increase in seed expenditures is attributed to increases inseed prices, the balance resulting from increased amounts of seed purchased.
• In the UK, seed prices (aggregated for all species) increased by 34% between 1985-93 –an increase second only to the increase in price of plant protection chemicals. The increasein royalty rates (a result of PBRs) has been higher than the increase in seed prices.
On all three issues, investments, number of varieties introduced and monopoly power one
finds limited theoretical proof for the positive role of PBRs. One defining feature of the results
reiterated above is the general fact that older breeding firms, now consolidated within MNCs,
have been the primary beneficiary of the availability of protection. Further, the study
establishes the influence of a range of other factors that have compelling impact. Based on
the review completed here it would be difficult to recommend the generalisation and
harmonisation of PBRs (the UPOV system) across developing countries. Equally, there is no
theoretical support for further expanding the scope of PBRs.

References
Page 56
References
Allard, R. W. (1960): Principles of Plant Breeding. Japan. John Wiley and Sons, Inc. andToppan Company Ltd.
Bent, Stephen A., Schwaab, Richard L., Conlin, David G. and Jeffrey, Donald D. (1987):Intellectual Property Rights in Biotechnology Worldwide. New York, USA. Stockton Press.
Berlan, Jean-Pierre (1991): `The historical roots of the present agricultural crisis'. InFriedland, William H., Busch, Lawerence, Buttel, Frederick H. and Rudy, Alan P., Ed.Towards a New Political Economy of Agriculture. Boulder, CO, USA. Westview Press: 115-36.
Berlan, Jean-Pierre and Lewontin, Richard (1986): `Breeders' Rights and patenting lifeforms'. Nature, 322: 785-88.
Brockway, Lucile (1979): Science and Colonial Expansion: The Role of the British RoyalBotanical Gardens. London, UK. Academic Press.
Bugos, Glenn E. and Kevles, Daniel J. (1992): `Plants as intellectual property: Americanpractice, law, and policy in world context'. Osiris, 7: 75-104.
Burrell, L. et al. (1987): Agri-facts. London, UK
Butler, L. J. and Marion, B. W. (1985): The Impacts of Patent Protection on the US SeedIndustry and Public Plant Breeding. Madison, USA. Research Division, College ofAgricultural and Life Sciences, University of Wisconsin-Madison.
Claffey, B. (1981): Patenting Life Forms: Issues Surrounding the Plant Variety Protection Act.Southern Journal of Agricultural Economics. December.
Committee on Transactions in Seeds (1957): Report of the Committee on Transactions inSeeds. Presented to Parliament in November 1957. Cmnd. 300. London, UK. HMSO.
Committee on Transactions in Seeds (1960): Plant Breeders' Rights: Report of theCommittee on Transactions in Seeds. Presented to Parliament, July, 1960. London, UK.HMSO. Cmnd 1092.
da Rocha, Andre‚ Lacombe Penna (1994): An Analysis of the Impact of Plant Breeders'Rights Legislation on the Introduction of New Varieties in UK Horticulture. Wye College,University of London, London, UK. May. Ph.D.
Fowler, Cary (1994): Unnatural Selection: Technology, Politics and Plant Evolution.Switzerland. Gordon and Breach Science Publishers SA.
Friedmann, Harriet (1993): `The political economy of food: A global crisis'. New Left Review,197, Jan/Feb: 29-57.
Godden, David (1983) Letters – Plant Breeders’ Rights. European Intellectual PropertyReview 5(3), March: 78-79.
Heitz, Andre‚ (1987): `The history of plant variety protection'. In Anon., Ed. The First Twenty-Five Years of the International Convention for the Protection of New Varieties of Plants.Geneva, Switzerland. UPOV: 53-96.
References
Page 57
Horne, F. R. and Kelly, A. F. (1967): `The OECD certification schemes and internationaltrade in seeds'. Proceedings of the International Seed Testing Association, 32(2): 259-74.
Kelly, A. F. (1968): `The work of systematic botany branch'. Journal of the National Instituteof Agricultural Botany, 11: 246-52.
Kloppenburg, Jack R., jr. (1988): First the Seed: The Political Economy of PlantBiotechnology, 1492-2000. Cambridge, UK. Cambridge University Press.
Laclaviere, B. (1965): `The Convention of Paris of December 2, 1961, for the Protection ofNew Varieties of Plants and the International Union for the Protection of New Varieties ofPlants'. Industrial Property, 10: 224-28.
Lange, P. (1985): `The Nature of Plant Breeders' Rights and Their Demarcation fromPatentable Inventions'. Plant Variety Protection Gazette and Newsletter, 44: 17-27.
Leenders, Hans (1976): The European View on the EEC Certification Rules. AgriculturalMerchant, July.
Lesser, William H. (1990): `Sector issues II: Seeds and plants'. In Siebeck, Wolfgang E.,Evenson, Robert E., Lesser, William and Primo Braga, Carlos A., Ed. StrengtheningProtection of Intellectual Property in Developing Countries. Washington, DC, USA. TheWorld Bank: 59-68.
Lupton, F. G. H. (1987): `Preface'. In Lupton, F. G. H., Ed. Wheat Breeding: Its ScientificBasis. London, UK and New York, USA. Chapman & Hall.
McMullen, Neil (1987): Seeds and World Agricultural Progress. Washington, DC, USA.National Planning Association. Report No. 227.
Mooney, Pat Roy (1983): `The law of the seed: Another development and plant geneticresources'. Development Dialogue, pp1-173.
Murphy, P. W. (1980): `Evidence Submitted by Mr P.W. Murphy, Controller of the UnitedKingdom Plant Variety Rights Office, to the Subcommittee of Department of Investigations,Oversight and Research of the House of Representatives Agriculture Committee of theUnited States of America'. UPOV Newsletter, 23 (October): 3-8.
OEEC and EPA (1959): Documentation Concerning National Systems of Seed Certification[Project No. 215]. . OEEC/EPA.
Palladino, Paolo (1990): `The political economy of applied research: Plant Breeding in GreatBritain, 1910-1940'. Minerva, XXVIII: 446-68.
Palladino, Paolo (1996): `Science, technology, and the economy: Plant breeding in GreatBritain, 1920-1970'. Economic History Review, 49(1): 116-36.
Perrin, R. K., Kunnings, K. A. and Ihnen, L. A. (1983): Some Economic Effects of the USPlant Variety Protection Act of 1970. Raleigh, North Carolina, USA. North Carolina StateUniversity.
Pistorius, Robin and van Wijk, Jereon (2000): The Exploitation of Plant Genetic Information:Political Strategies in Crop Development. Department of Political Science, University ofAmsterdam, the Netherlands. PhD.
Price, S. (1999): Public and private plant breeding. Nature Biotechnology, 17(October).
References
Page 58
Rangnekar, Dwijen (forthcoming): Innovative Appropriation: The Role of Economics, Scienceand Law in Transforming Plants into Products, A Case Study of Wheat Breeding in the UK.School of Economics, Kingston University, Kingston, UK. Ph.D.
Schreiber, Fritz (1962): `Plant breeders' rights'. Seed Trade Review, 14 (11): 237, 241-43,245, 247.
The Economist (1986): `Seed firms: fruit machines'. The Economist, 15 August: 56, 58.
Thirtle, C. et al. (1998) Rise and fall of public sector plant breeding in the UK. AgriculturalEconomics, 19 (Summer).
Thirtle, C., Beck, H. S., Palladino, P., Upton, M. and Wise, W. S. (1991): `Agriculture andfood'. In Nicholson, Robin, Cunningham, Catherine M. and Gummer, Philip, Ed. Science andTechnology in United Kingdom. London, UK. Longman: 116-46.
Webster, Andrew (1989): `Privatisation of public sector research: the case of a plantbreeding institute'. Science and Public Policy, 16(4): 224-32.
Wellington, P. S. (1964): `Legislation on Crop Varieties'. NAAS Quarterly Review: TheJournal of the National Agriculture Advisory Service, 66 (Winter) : 58-62.
Wellington, P. S. (1974): `Crop varieties: their testing, commercial exploitation and statutorycontrol'. Journal of the Royal Agricultural Society of England, 135 : 84-106.
Wuesthoff, Dr Ing Franz and Wuesthoff, Dr Freda (1952): Protection of New Varieties ofCultivated Plants. Report of the German Group to the Vienna Congress of the InternationalAssociation for the Protection of Industrial Property. Reprinted in Stephen A. Bent, et al.,1987.