Embed Size (px)
Citation preview

PNNL-24844
Economic Impact of Pacific Northwest National Laboratory on the State of Washington in Fiscal Year 2014 MJ Scott JM Niemeyer October 2015 Prepared for the U.S. Department of Energy under Contract DE-AC05-76RL01830 Pacific Northwest National Laboratory Richland, Washington 99352
ii
Economic Impact of PNNL on Washington State FY 2014
Highlights
Economic Impact of PNNL on Washington State FY 2014
Impacts
iv
Economic Impact of PNNL on Washington State FY 2014
Acknowledgments
Pacific Northwest National Laboratory’s (PNNL’s) fiscal year (FY) 2014 Economic Impact Analysis report was prepared by PNNL Economists Mike Scott and Michelle Niemeyer, with editorial support from Jennifer Blake and key contributions throughout the report by Pamela Hughes, senior advisor for Institutional Science and Technology Performance.
Other PNNL and Battelle staff members who provided the data used in this report include Johnnie Asencio, Kerry Bass, Jonathon Bates, Mark Bayless, Joe Burks, Lindsie Canales, Steve Cassidy, Robin Conger, Danielle Deichman, Madeline Deroche, Jeff Estes, Amy Gadd, Jodi Hamm, Mark Hattrup, Brenda Herrington, Karen King, Terry Law, Grace Lester, Charlotte Morgan, Michelle Nichols, Kim Pierret, Marc Podratz, Angela Saraceno, Gary Spanner, Christie Sylvester, Annette Schutzenhofer, Janel Tingey, Derek Tonn, Lori Williams, and Jimmy Voyles.
v
Economic Impact of PNNL on Washington State FY 2014
Executive Summary
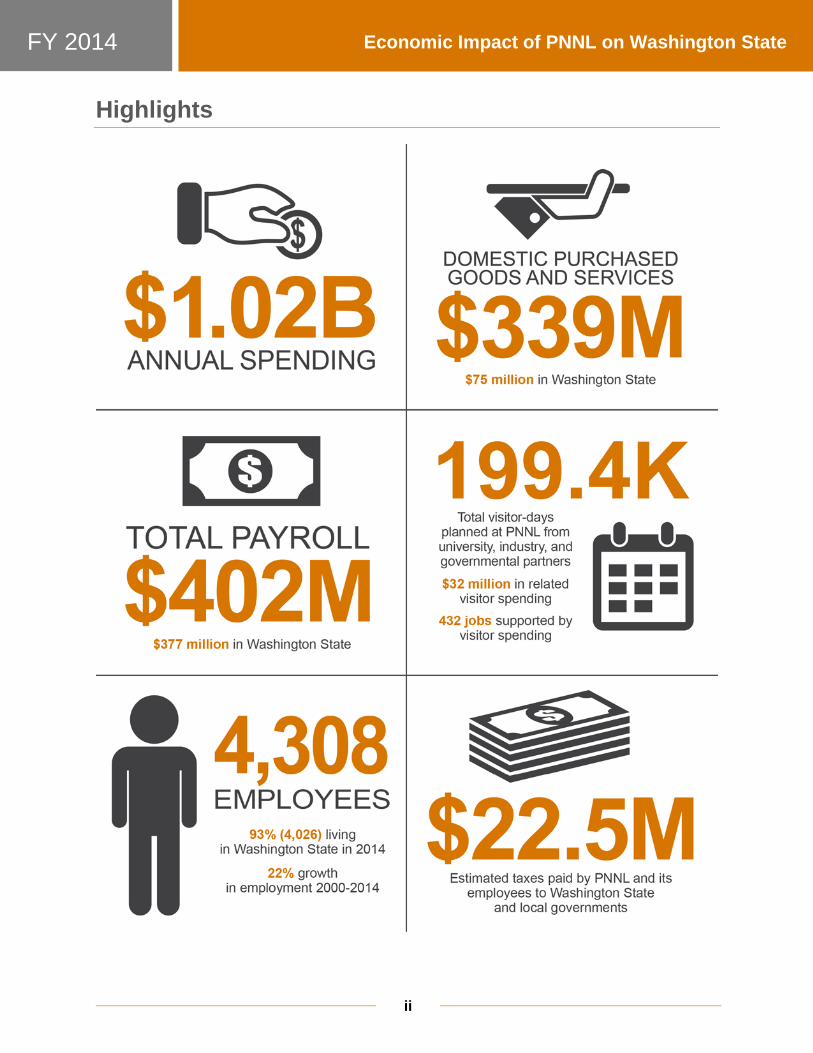
PNNL is a large economic entity with a total of 4,308 employees, $939 million (M) in total funding, and $1.02 billion (B) in total spending during FY 2014.1 The number of employees that live in Washington State is 4,026 or 93 percent of the Laboratory staff.
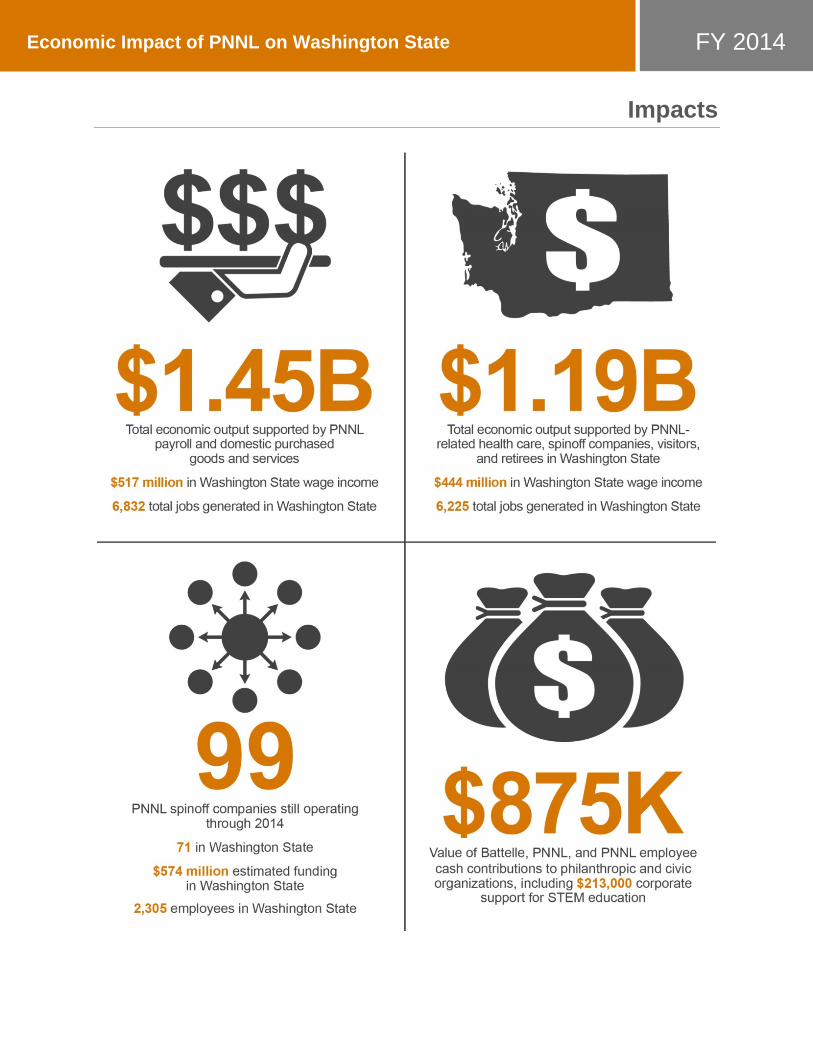
The Laboratory directly and indirectly supported $1.45 billion in economic output, 6,832 jobs, and $517 million in Washington State wage income from current operations. The state also gained more than $1.19 billion in output, over 6,200 jobs, and $444 million in income through closely related economic activities such as visitors, health care spending, spending by resident retirees, and spinoff companies.2
PNNL affects Washington’s economy through commonly recognized economic channels, including spending on payrolls and other goods and services that support Laboratory operations. Less commonly recognized channels also have their own impacts and include company-supported spending on health care for its staff members and retirees, spending of its resident retirees, Laboratory visitor spending, and the economic activities in a growing constellation of “spinoff” companies founded on PNNL research, technology, and managerial expertise.
PNNL also has a significant impact on science and technology education and community not-for-profit organizations. PNNL is an active participant in the future scientific enterprise in Washington with the state’s K-12 schools, colleges, and universities. The Laboratory sends staff members to the classroom and brings hundreds of students to the PNNL campus to help train the next generation of scientists, engineers, mathematicians, and technicians. This investment in human capital, though difficult to measure in terms of current dollars of economic output, is among the important lasting legacies of the Laboratory. Finally, PNNL contributes to the local community with millions of dollars’ worth of cash and in-kind corporate and staff contributions, all of which strengthen the economy.
The purpose of this report is to quantify these effects, providing detailed information on PNNL’s revenues and expenditures, as well as the impacts of its activities on the rest of the Washington State economy. 1The latest PNNL data available was for FY 2014 spanning Oct. 1, 2013 through Sept. 30, 2014. 2 Economic impact of PNNL’s operations on Washington State varies annually as federal research programs are dynamic and affected by levels of federal funding. For a comparison with selected other major technology entities in Washington State and with other DOE national laboratories, see Appendix B.
vi
Economic Impact of PNNL on Washington State FY 2014
Acronyms
ANL Argonne National Laboratory
ARM Atmospheric Radiation Measurement
B billion
BNL Brookhaven National Laboratory
DHS U.S. Department of Homeland Security
DoD U.S. Department of Defense
DOE U.S. Department of Energy
EMSL Environmental Molecular Sciences Laboratory
FY fiscal year
gsf gross square feet
GSP gross state product
INL Idaho National Laboratory
IP intellectual property
K thousand
LASER Leadership and Assistance for Science Education Reform
LBNL Lawrence Berkeley National Laboratory
M million
MESA Mathematics, Engineering, and Science Achievement
NAICS North American Industry Classification System
NREL National Renewable Energy Laboratory
OASI Social Security Old Age and Survivors’ Insurance
ORNL Oak Ridge National Laboratory
PNNL Pacific Northwest National Laboratory
R&D research and development
S&T science and technology
STEM science, technology, engineering, and mathematics
TAP Technology Assistance Program
U.S. United States
WBL Work-Based Learning
vii
Economic Impact of PNNL on Washington State FY 2014
Contents
Highlights ...................................................................................................................................................... ii
Impacts ......................................................................................................................................................... iii Acknowledgments ........................................................................................................................................ iv
Executive Summary ....................................................................................................................................... v Acronyms ..................................................................................................................................................... vi Introduction .................................................................................................................................................. 1 PNNL as an Economic Entity ......................................................................................................................... 2
PNNL Revenues and Expenses .............................................................................................................. 2
PNNL Employment ................................................................................................................................ 2 PNNL’s Payroll and Benefits ................................................................................................................. 3 Purchased Goods and Services and Investments ................................................................................. 3 Expenditures for New Construction and Renovations ......................................................................... 4
PNNL State and Local Taxes Paid .......................................................................................................... 5 Economic Impact of PNNL Operations ................................................................................................. 6
Other Economic Influences ........................................................................................................................... 7 Health Care Expenditures ..................................................................................................................... 7
PNNL Retirees ....................................................................................................................................... 7 Technology Transfer ............................................................................................................................. 8
Technology Commercialization: New Products and Spinoff Companies ..................................... 8 Intellectual Property..................................................................................................................... 9 Honors and Awards .................................................................................................................... 10
STEM Education and Work-Based Learning ....................................................................................... 10 PNNL Visitors ...................................................................................................................................... 12 Community Investments and Assistance ............................................................................................ 13
EMSL and ARM Climate Research Facility Users ........................................................................ 14
Economic Impact of Closely Related Activity ..................................................................................... 15 Conclusion ................................................................................................................................................... 16 Appendix A The IMPLAN Model .................................................................................................................. 17 Appendix B Benchmarking the Results ....................................................................................................... 19

viii
Economic Impact of PNNL on Washington State FY 2014
Figures
PNNL’s Total Funding in FY 2014 was $939.3 million ................................................................................... 2
PNNL’s Spending in FY 2014 was Approximately $1 billion .......................................................................... 2 Location of PNNL Employees ........................................................................................................................ 3
PNNL Physical Sciences Facility at the Richland, Washington Campus ........................................................ 4 FY 2014 Economic Impact of Washington Payroll and Purchased Goods and Services
Expenditures by PNNL ........................................................................................................................... 6
Estimated Spending for Washington State PNNL Employee and Retiree Health Care in FY 2014 ............... 7 Total Impact of Health Care Spending, Spinoff Companies, Visitor Spending, and Retirees on the
Washington State Economy in FY 2014 .............................................................................................. 15
Tables
FY 2014 PNNL Purchased Goods and Services Spending, Total U.S. Domestic and in Washington State ...................................................................................................................................................... 4
PNNL Construction Spending in FY 2014 ...................................................................................................... 5 FY 2014 Washington State and Local Taxes Paid by PNNL and its Employees ............................................. 6
Estimated Washington State PNNL Retiree Income in FY 2014.................................................................... 8 Companies with Ties to PNNL—Number, Estimated FY 2014 Funding, and Number of Employees ........... 8 Technology Assistance Program Statistics .................................................................................................... 8 PNNL Statistics on Inventions, Patents, Technology Transfers, and License Income ................................... 9
Statistics on the PNNL STEM Education Programs During FY 2014 ............................................................ 12 Number of Out-of-Town Visitors and Visitor Days to PNNL Facilities ........................................................ 13 PNNL and Battelle Community Assistance Statistics for FY 2014 ............................................................... 14 FY 2014 EMSL Users .................................................................................................................................... 15
1
Economic Impact of PNNL on Washington State FY 2014
Introduction
Pacific Northwest National Laboratory (PNNL) is a multidisciplinary national laboratory celebrating 50 years of innovation and advancing the frontiers of science and technology (S&T) in areas that inspire and enable the world to live prosperously, safely, and securely. Located in Richland, Washington, PNNL is one of 10 United States (U.S.) Department of Energy (DOE) Office of Science national laboratories.
Since 1965, PNNL has made significant scientific and technological discoveries that have benefitted the nation. These include major advances in our understanding of the effects of aerosols and clouds on climate sensitivity, experiments conducted in the Environmental Molecular Sciences Laboratory (EMSL) on amorphous solid water that led to understanding the fundamental nature of glasses (materials used in applications ranging from nuclear waste storage to pharmaceuticals), and the development of a chemical catalyst to produce ethylene glycol—a chemical widely used in everyday products—from renewable sources.
PNNL delivers world-leading S&T to understand, predict, and control the behavior of complex adaptive systems through a strong foundation of nationally and internationally recognized scientific capabilities. Major initiatives focus on answering critical scientific questions in complex biological, climate, subsurface, chemical, materials, and computing systems. PNNL’s research strengthens the nation’s foundation for innovation as staff members develop solutions for DOE and the National Nuclear Security Administration, U.S. Department of Homeland Security (DHS), and other federal agencies.
Operated by Battelle Memorial Institute, PNNL has more than 4,300 staff members with total spending at $1.02 billion (B) during fiscal year (FY) 2014. PNNL operates EMSL and provides technical and operational leadership to the Atmospheric Radiation Measurement (ARM) Climate Research Facility. PNNL also operates a marine research facility in Sequim, Washington and has satellite offices in Seattle and Tacoma, Washington; Portland, Oregon; and College Park, Maryland.
2
Economic Impact of PNNL on Washington State FY 2014
PNNL as an Economic Entity
PNNL Revenues and Expenses
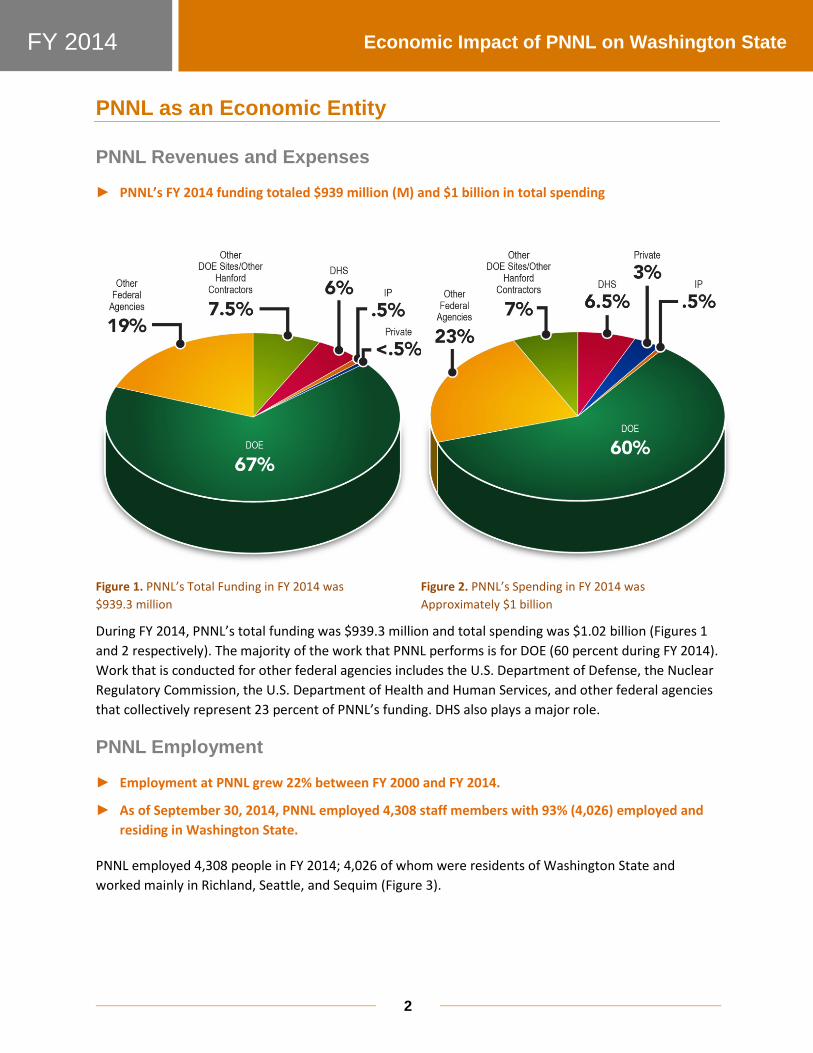
► PNNL’s FY 2014 funding totaled $939 million (M) and $1 billion in total spending
Figure 1. PNNL’s Total Funding in FY 2014 was $939.3 million
Figure 2. PNNL’s Spending in FY 2014 was Approximately $1 billion
During FY 2014, PNNL’s total funding was $939.3 million and total spending was $1.02 billion (Figures 1 and 2 respectively). The majority of the work that PNNL performs is for DOE (60 percent during FY 2014). Work that is conducted for other federal agencies includes the U.S. Department of Defense, the Nuclear Regulatory Commission, the U.S. Department of Health and Human Services, and other federal agencies that collectively represent 23 percent of PNNL’s funding. DHS also plays a major role.
PNNL Employment
► Employment at PNNL grew 22% between FY 2000 and FY 2014.
► As of September 30, 2014, PNNL employed 4,308 staff members with 93% (4,026) employed and residing in Washington State.
PNNL employed 4,308 people in FY 2014; 4,026 of whom were residents of Washington State and worked mainly in Richland, Seattle, and Sequim (Figure 3).

3
Economic Impact of PNNL on Washington State FY 2014
In addition, there were 112 staff members in the Washington, D.C. area; 33 staff members assigned to work in Corvallis and Portland, Oregon (and are assumed to live in Oregon); and 137 staff members employed at other offices in the United States or in foreign countries.
PNNL’s Payroll and Benefits
► PNNL spent a total of $402 million on payrolls with $377 million going to Washington State residents.
► PNNL provides $144 million for employer-provided benefits to support Laboratory operations.
PNNL’s total payroll during FY 2014 was $402 million, of which $377 million went to Washington State residents. Because the Lab is a research and development (R&D) organization, PNNL has a large percentage of high-wage professions (see the average wages of other selected Washington R&D organizations and other DOE national laboratories in Appendix B).
The average annual wage for all Washington State PNNL employees at the end of FY 2014 was $93,762.1 In 2014, the state average occupational wage was about $52,500.2 As such, the average PNNL worker likely spends at a higher level and, therefore, has an above-average impact on the state economy compared with the average worker in the state.
While not directly part of wages, benefits outlays contribute to PNNL’s economic impact. PNNL provides a benefit package that costs $144 million per year. Included are an employer-provided health insurance package, employer matching of a portion of employee 401K contributions, a defined benefit pension plan, and other items (e.g., disability, tuition refunds, and group life insurance).
Purchased Goods and Services and Investments
► $75 million was spent on purchases made from Washington State firms.
During FY 2014, PNNL placed domestic procurements3 for $339 million of goods and services to support operations of the Laboratory. Table 1 shows that a wide variety of goods and services were purchased, from small scientific equipment to subcontracts with universities, consultants, and research firms. Of the total, 22.1 percent (or $75 million) of the purchases were made from Washington State firms.
1 $93,762 includes student employees, which reduce the PNNL average. For comparable data on other Washington
State R&D organizations and other DOE national laboratories, see Appendix B. 2 The weighted average for all occupations for which the average annual wage and the number of workers both
were published was $52,539. 3 Excludes purchases outside of the United States.
Figure 3. Location of PNNL Employees
4
Economic Impact of PNNL on Washington State FY 2014
Table 1. FY 2014 PNNL Purchased Goods and Services Spending, Total U.S. Domestic and in Washington State
Type of Expenditure Total ($M) In Washington State ($M) Construction $23 $20 Finance, Insurance, Real Estate $38 $20 Computers, Lab Equipment, Software, Services, Retail Trade $84 $6 Wholesale Trade $18 $7 Utilities, Transportation, Publishing, Management, and Business Services
$103 $12
Technical and Scientific Subcontractors $22 $3 Medical and Health Services $1 $1 All Other $50 $5 Total* $339 $75 *Detail may not add to total due to rounding.
Expenditures for New Construction and Renovations
► Forty-two (42) construction jobs were supported by the $9 million in in-state subcontractor construction spending.
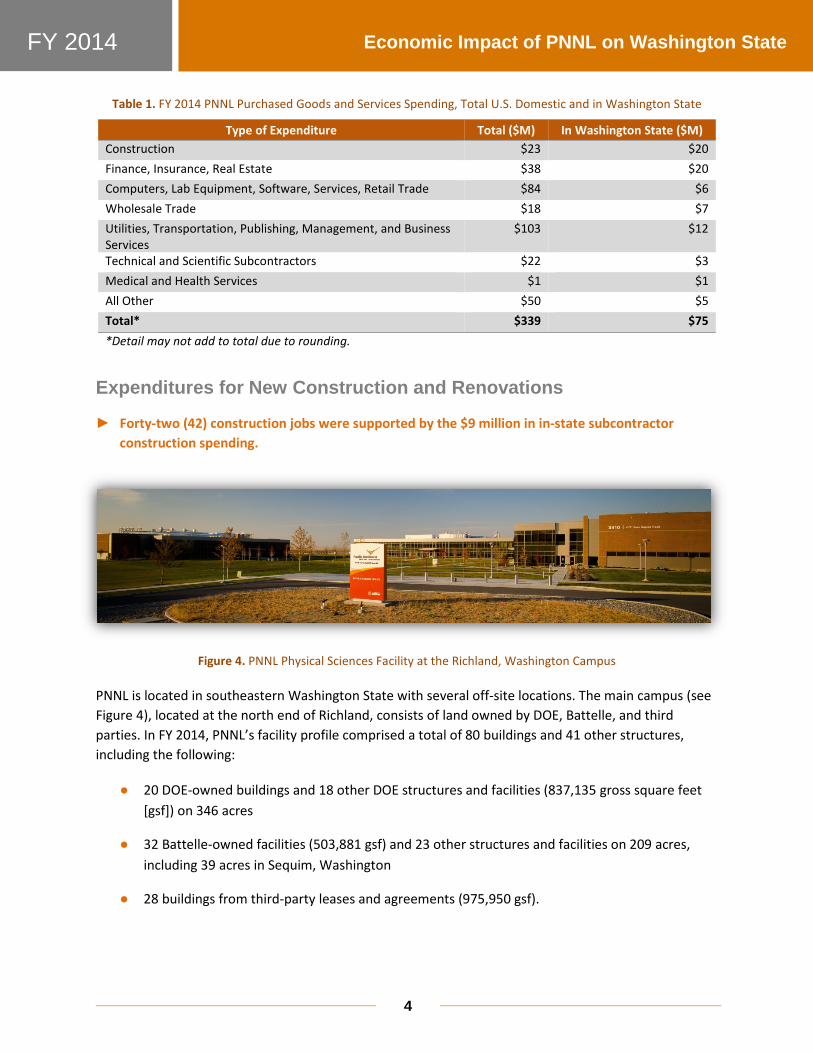
Figure 4. PNNL Physical Sciences Facility at the Richland, Washington Campus
PNNL is located in southeastern Washington State with several off-site locations. The main campus (see Figure 4), located at the north end of Richland, consists of land owned by DOE, Battelle, and third parties. In FY 2014, PNNL’s facility profile comprised a total of 80 buildings and 41 other structures, including the following:
● 20 DOE-owned buildings and 18 other DOE structures and facilities (837,135 gross square feet [gsf]) on 346 acres
● 32 Battelle-owned facilities (503,881 gsf) and 23 other structures and facilities on 209 acres, including 39 acres in Sequim, Washington
● 28 buildings from third-party leases and agreements (975,950 gsf).
5
Economic Impact of PNNL on Washington State FY 2014
Large scientific enterprises like PNNL periodically must renovate their research facilities and procure major scientific equipment as their scope of work, scientific knowledge base, and responsibilities change. PNNL makes these investments through its capital budgets.
Fiscal year 2014 was an active year for making capital investments with major renovations worth $18 million (see Table 2). All PNNL major renovations were performed on buildings located in Washington State. Of this total, 61 percent ($11 million) included reimbursements to subcontractors working on PNNL buildings, including out-of-state contractors working on in-state projects.1 Washington State resident subcontractors earned $9 million of this $11 million, or 82 percent. Total costs other than PNNL labor related to these renovations are included in the $339 million non-payroll purchases listed in Table 1. An estimated 42 construction jobs were supported by the $9 million in in-state subcontractor construction spending. These are included in the total impacts detailed in Table 2 and Figure 5.
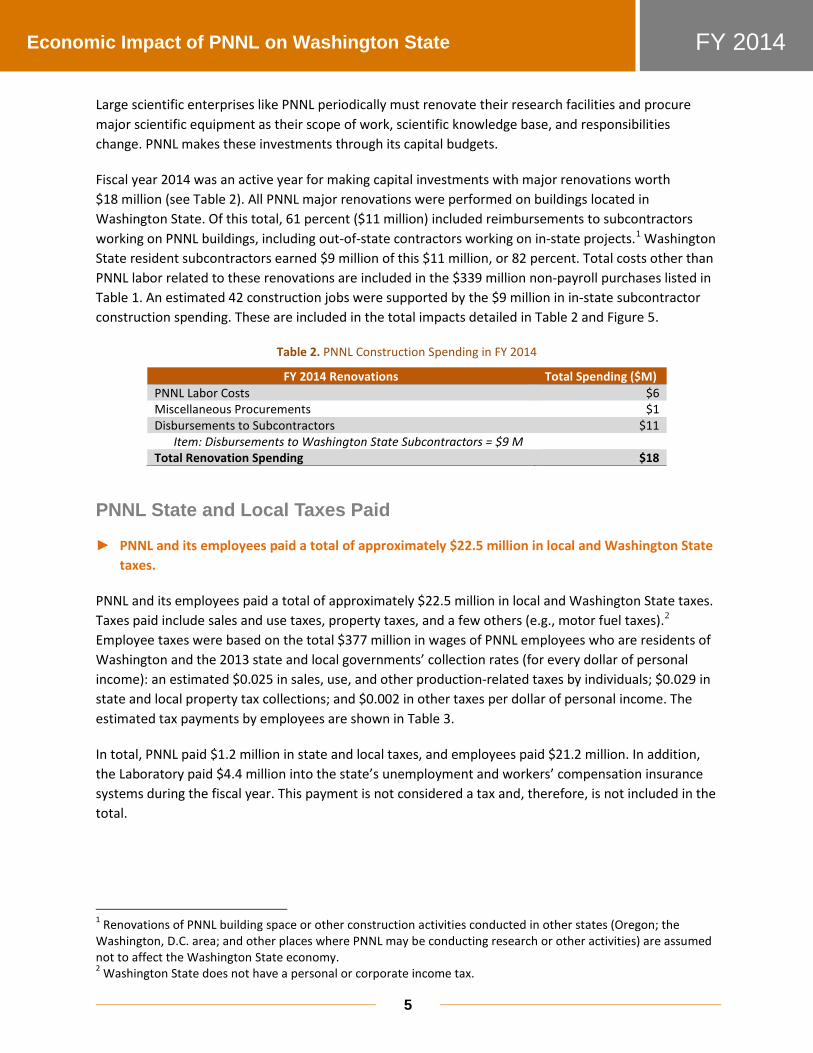
Table 2. PNNL Construction Spending in FY 2014
FY 2014 Renovations Total Spending ($M) PNNL Labor Costs $6 Miscellaneous Procurements $1 Disbursements to Subcontractors $11
Item: Disbursements to Washington State Subcontractors = $9 M Total Renovation Spending $18
PNNL State and Local Taxes Paid
► PNNL and its employees paid a total of approximately $22.5 million in local and Washington State taxes.
PNNL and its employees paid a total of approximately $22.5 million in local and Washington State taxes. Taxes paid include sales and use taxes, property taxes, and a few others (e.g., motor fuel taxes).2 Employee taxes were based on the total $377 million in wages of PNNL employees who are residents of Washington and the 2013 state and local governments’ collection rates (for every dollar of personal income): an estimated $0.025 in sales, use, and other production-related taxes by individuals; $0.029 in state and local property tax collections; and $0.002 in other taxes per dollar of personal income. The estimated tax payments by employees are shown in Table 3.
In total, PNNL paid $1.2 million in state and local taxes, and employees paid $21.2 million. In addition, the Laboratory paid $4.4 million into the state’s unemployment and workers’ compensation insurance systems during the fiscal year. This payment is not considered a tax and, therefore, is not included in the total.
1 Renovations of PNNL building space or other construction activities conducted in other states (Oregon; the Washington, D.C. area; and other places where PNNL may be conducting research or other activities) are assumed not to affect the Washington State economy. 2 Washington State does not have a personal or corporate income tax.
6
Economic Impact of PNNL on Washington State FY 2014
Table 3. FY 2014 Washington State and Local Taxes Paid by PNNL and its Employees
Washington Tax Category Paid by PNNL in FY 2014 ($K) Estimated Paid by PNNL Employees in FY 2014 ($K)(*)
Sales and Use Taxes $170 $9,394 Business and Occupation Taxes (less credits) $0 --
Leasehold Taxes $12 0 Property Taxes $1,040 $10,977 Other State and Local Taxes Negligible $857 Total $1,222 $21,229 *Detail does not sum to total because of rounding.
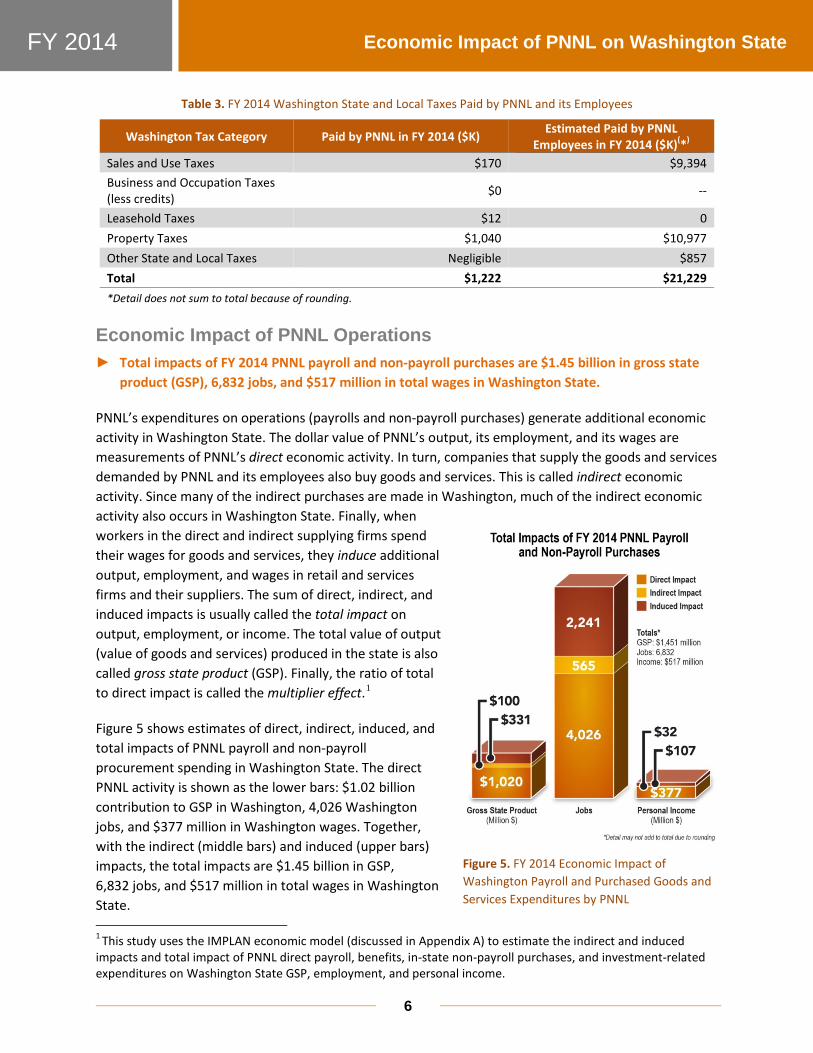
Economic Impact of PNNL Operations ► Total impacts of FY 2014 PNNL payroll and non-payroll purchases are $1.45 billion in gross state
product (GSP), 6,832 jobs, and $517 million in total wages in Washington State.
PNNL’s expenditures on operations (payrolls and non-payroll purchases) generate additional economic activity in Washington State. The dollar value of PNNL’s output, its employment, and its wages are measurements of PNNL’s direct economic activity. In turn, companies that supply the goods and services demanded by PNNL and its employees also buy goods and services. This is called indirect economic activity. Since many of the indirect purchases are made in Washington, much of the indirect economic activity also occurs in Washington State. Finally, when workers in the direct and indirect supplying firms spend their wages for goods and services, they induce additional output, employment, and wages in retail and services firms and their suppliers. The sum of direct, indirect, and induced impacts is usually called the total impact on output, employment, or income. The total value of output (value of goods and services) produced in the state is also called gross state product (GSP). Finally, the ratio of total to direct impact is called the multiplier effect.1
Figure 5 shows estimates of direct, indirect, induced, and total impacts of PNNL payroll and non-payroll procurement spending in Washington State. The direct PNNL activity is shown as the lower bars: $1.02 billion contribution to GSP in Washington, 4,026 Washington jobs, and $377 million in Washington wages. Together, with the indirect (middle bars) and induced (upper bars) impacts, the total impacts are $1.45 billion in GSP, 6,832 jobs, and $517 million in total wages in Washington State. 1 This study uses the IMPLAN economic model (discussed in Appendix A) to estimate the indirect and induced impacts and total impact of PNNL direct payroll, benefits, in-state non-payroll purchases, and investment-related expenditures on Washington State GSP, employment, and personal income.
Figure 5. FY 2014 Economic Impact of Washington Payroll and Purchased Goods and Services Expenditures by PNNL
7
Economic Impact of PNNL on Washington State FY 2014
Other Economic Influences
This section of the report provides estimates of the total impact of economic activity that, while not strictly PNNL activity, would not exist in Washington State without the presence of the Laboratory. These activities include health care insurance expenditures on behalf of PNNL employee and retiree households, spending by PNNL retirees, spending by spinoff companies that have their “roots” in PNNL and likely would not be located in Washington State except for the presence of the Laboratory, and spending by visitors to the Laboratory who are paid by other institutions.
Health Care Expenditures
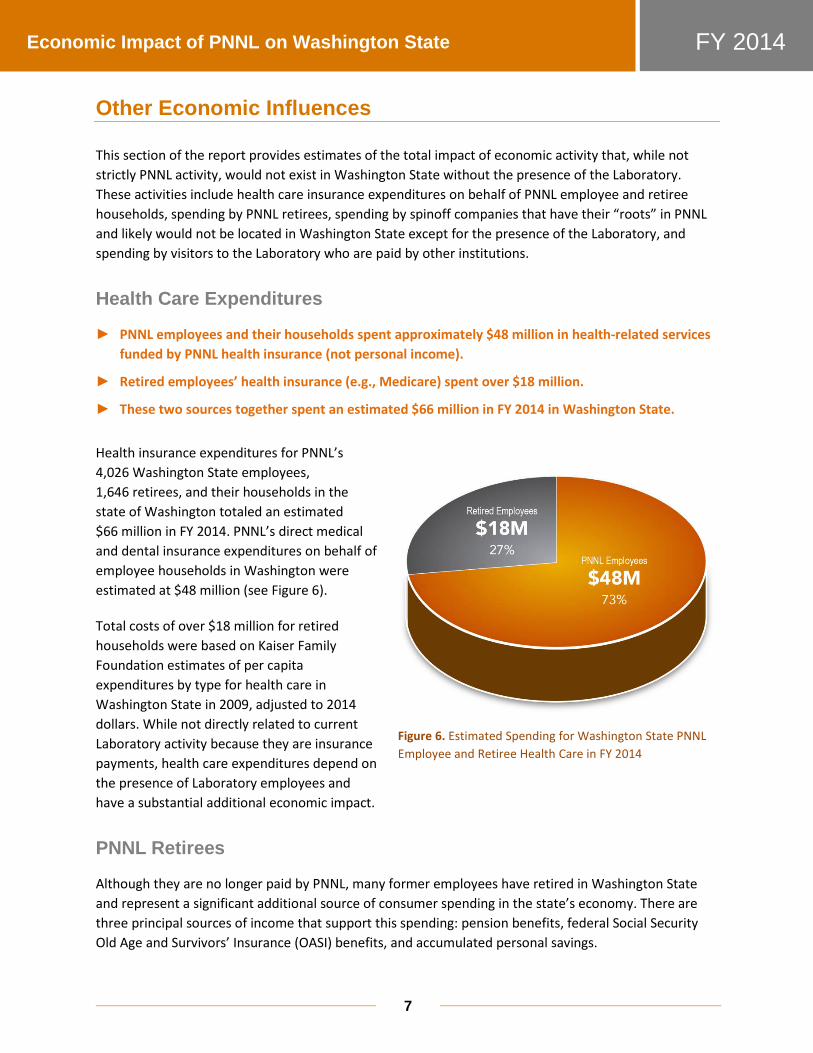
► PNNL employees and their households spent approximately $48 million in health-related services funded by PNNL health insurance (not personal income).
► Retired employees’ health insurance (e.g., Medicare) spent over $18 million.
► These two sources together spent an estimated $66 million in FY 2014 in Washington State.
Health insurance expenditures for PNNL’s 4,026 Washington State employees, 1,646 retirees, and their households in the state of Washington totaled an estimated $66 million in FY 2014. PNNL’s direct medical and dental insurance expenditures on behalf of employee households in Washington were estimated at $48 million (see Figure 6).
Total costs of over $18 million for retired households were based on Kaiser Family Foundation estimates of per capita expenditures by type for health care in Washington State in 2009, adjusted to 2014 dollars. While not directly related to current Laboratory activity because they are insurance payments, health care expenditures depend on the presence of Laboratory employees and have a substantial additional economic impact.
PNNL Retirees
Although they are no longer paid by PNNL, many former employees have retired in Washington State and represent a significant additional source of consumer spending in the state’s economy. There are three principal sources of income that support this spending: pension benefits, federal Social Security Old Age and Survivors’ Insurance (OASI) benefits, and accumulated personal savings.
Figure 6. Estimated Spending for Washington State PNNL Employee and Retiree Health Care in FY 2014
8
Economic Impact of PNNL on Washington State FY 2014
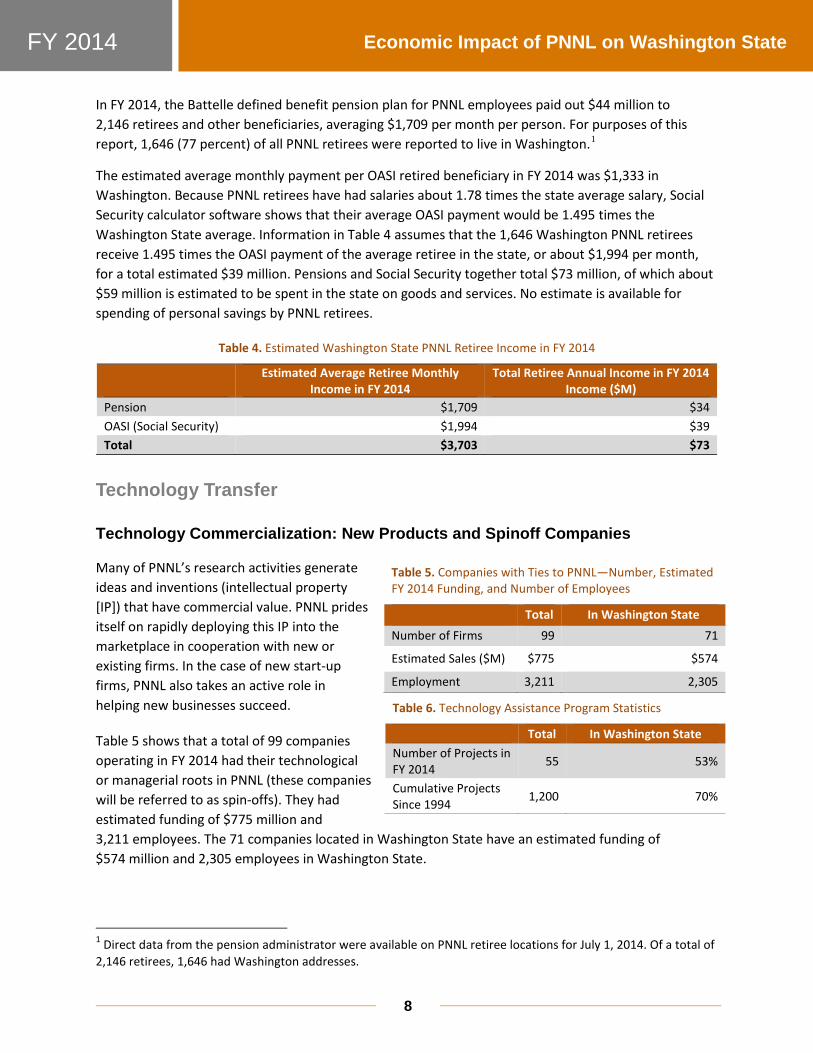
In FY 2014, the Battelle defined benefit pension plan for PNNL employees paid out $44 million to 2,146 retirees and other beneficiaries, averaging $1,709 per month per person. For purposes of this report, 1,646 (77 percent) of all PNNL retirees were reported to live in Washington.1
The estimated average monthly payment per OASI retired beneficiary in FY 2014 was $1,333 in Washington. Because PNNL retirees have had salaries about 1.78 times the state average salary, Social Security calculator software shows that their average OASI payment would be 1.495 times the Washington State average. Information in Table 4 assumes that the 1,646 Washington PNNL retirees receive 1.495 times the OASI payment of the average retiree in the state, or about $1,994 per month, for a total estimated $39 million. Pensions and Social Security together total $73 million, of which about $59 million is estimated to be spent in the state on goods and services. No estimate is available for spending of personal savings by PNNL retirees.
Table 4. Estimated Washington State PNNL Retiree Income in FY 2014
Estimated Average Retiree Monthly
Income in FY 2014 Total Retiree Annual Income in FY 2014
Income ($M) Pension $1,709 $34 OASI (Social Security) $1,994 $39 Total $3,703 $73
Technology Transfer
Technology Commercialization: New Products and Spinoff Companies
Many of PNNL’s research activities generate ideas and inventions (intellectual property [IP]) that have commercial value. PNNL prides itself on rapidly deploying this IP into the marketplace in cooperation with new or existing firms. In the case of new start-up firms, PNNL also takes an active role in helping new businesses succeed.
Table 5 shows that a total of 99 companies operating in FY 2014 had their technological or managerial roots in PNNL (these companies will be referred to as spin-offs). They had estimated funding of $775 million and 3,211 employees. The 71 companies located in Washington State have an estimated funding of $574 million and 2,305 employees in Washington State.
1 Direct data from the pension administrator were available on PNNL retiree locations for July 1, 2014. Of a total of 2,146 retirees, 1,646 had Washington addresses.
Table 5. Companies with Ties to PNNL—Number, Estimated FY 2014 Funding, and Number of Employees
Total In Washington State Number of Firms 99 71
Estimated Sales ($M) $775 $574
Employment 3,211 2,305
Table 6. Technology Assistance Program Statistics
Total In Washington State Number of Projects in FY 2014 55 53%
Cumulative Projects Since 1994 1,200 70%
9
Economic Impact of PNNL on Washington State FY 2014
PNNL’s Economic Development Office’s Technology Assistance Program (TAP) provides funding for researchers to work with a small business for up to a staff-week per project. Small businesses that use PNNL’s free TAP are eligible to receive a royalty-free license for IP generated in the course of the project. Table 6 shows that PNNL conducted 55 TAP projects during FY 2014. Fifty-three (53) percent of these were conducted for Washington-State-based companies.
These projects involved 1,909 hours of assistance at no cost to the small business. Since 1994, PNNL has completed 1,200 assistance projects—70 percent of them for Washington-State-based companies. Many fledgling companies in Washington State either directly receive in-kind assistance from PNNL or become partners with PNNL in identifying potential start-up funding or markets for their products and services. In many cases, the funding that they receive from others likely would not occur if PNNL was not providing this assistance.
Intellectual Property
While undoubtedly valuable as investments in the future or in Washington’s current quality of life, there are other aspects of PNNL’s presence in Washington State that are much more difficult to calculate in terms of the state’s GSP or employment. The first of these is IP created by PNNL R&D activities.
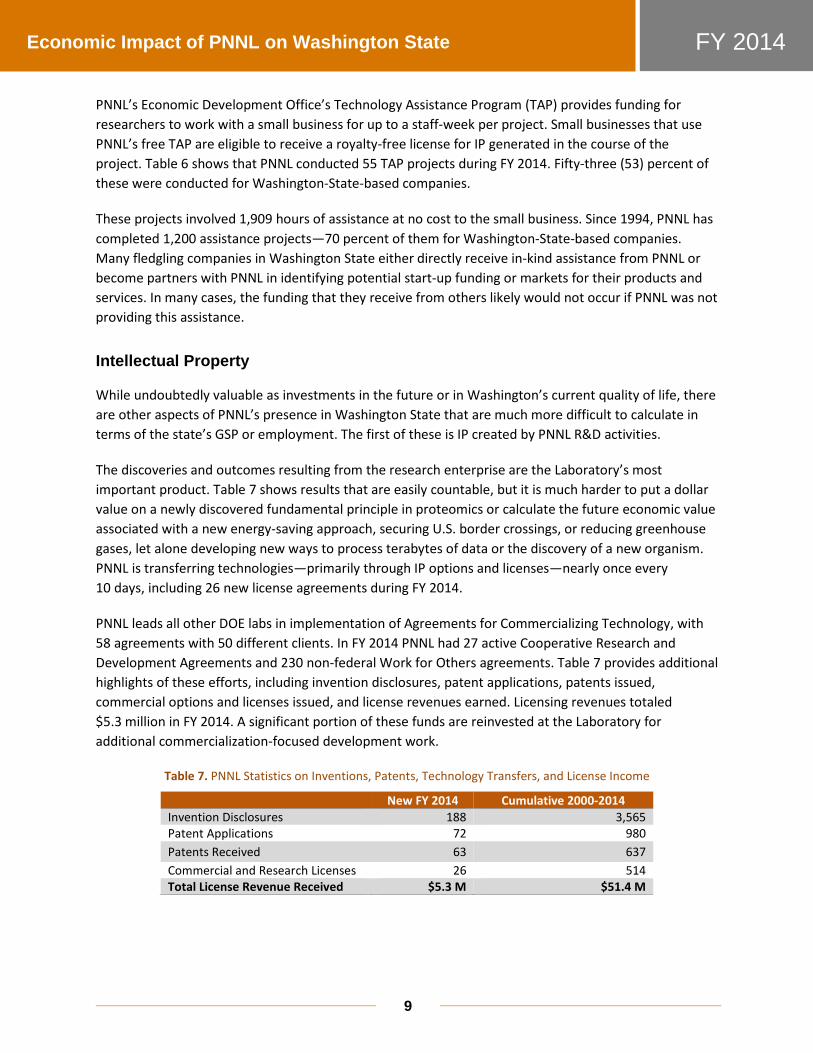
The discoveries and outcomes resulting from the research enterprise are the Laboratory’s most important product. Table 7 shows results that are easily countable, but it is much harder to put a dollar value on a newly discovered fundamental principle in proteomics or calculate the future economic value associated with a new energy-saving approach, securing U.S. border crossings, or reducing greenhouse gases, let alone developing new ways to process terabytes of data or the discovery of a new organism. PNNL is transferring technologies—primarily through IP options and licenses—nearly once every 10 days, including 26 new license agreements during FY 2014.
PNNL leads all other DOE labs in implementation of Agreements for Commercializing Technology, with 58 agreements with 50 different clients. In FY 2014 PNNL had 27 active Cooperative Research and Development Agreements and 230 non-federal Work for Others agreements. Table 7 provides additional highlights of these efforts, including invention disclosures, patent applications, patents issued, commercial options and licenses issued, and license revenues earned. Licensing revenues totaled $5.3 million in FY 2014. A significant portion of these funds are reinvested at the Laboratory for additional commercialization-focused development work.
Table 7. PNNL Statistics on Inventions, Patents, Technology Transfers, and License Income
New FY 2014 Cumulative 2000-2014 Invention Disclosures 188 3,565 Patent Applications 72 980 Patents Received 63 637 Commercial and Research Licenses 26 514 Total License Revenue Received $5.3 M $51.4 M

10
Economic Impact of PNNL on Washington State FY 2014
Honors and Awards
During FY 2014, PNNL research resulted in numerous awards for scientific excellence, including three R&D 100 Awards for the GlyphTM wearable media device (which solves the problem of how to view electronic screens comfortably and clearly for long periods of time), System for Analysis at the Liquid Vacuum Interface (which can image liquid samples in their natural state, at the molecular level in real-time and space), and the Solar Thermochemical Advanced Reactor System (which concentrates solar power to convert natural gas into synthesis gas), bringing the cumulative total of R&D 100 awards to 93.1 From the Federal Laboratory Consortium, PNNL won one Excellence in Technology Transfer Award for Real Vision Head-Mounted Display, which was licensed to Avegant and became the Glyph technology, and which brought the total of technology transfer awards through 2014 to 79,2 more than any other federal laboratory and almost a quarter of the total won by all DOE labs.
PNNL researchers had a total of 1,121 peer-reviewed, published articles in FY 2014, with Thomson-Reuters’ Essential Science Indicators ranking PNNL among the top one percent of cited institutions in chemistry, physics, geoscience, biology and biochemistry, materials science, environment/ecology, engineering, microbiology, pharmacology and toxicology, and clinical medicine.
Other noteworthy highlights include five PNNL researchers—Drs. Jun Liu, Alex Guenther, Phil Rasch, Yuyan Shao, and Yuehe Lin—ranking internationally among the top one percent most cited for their subject field and year of publication, earning them the mark of exceptional impact. Also, two PNNL researchers, Drs. Marat Valiev and Karol Kowalski, were selected by the Journal of Chemical Physics as having written one of the best 80 papers in the journal’s 80 years.
STEM Education and Work-Based Learning
The Office of STEM (Science, Technology, Engineering, and Mathematics) Education and Work-Based Learning (WBL) programs at PNNL respond to the national concern over the lack of U.S. students entering STEM disciplines. As a result, PNNL is helping to prepare the next generation of scientists, engineers, and innovators.
PNNL is a trusted and valued collaborator in DOE’s Workforce Development for Teachers and Scientists program and the region's efforts to improve science and engineering education from grade school to graduate school. PNNL helps to connect the world of research and education by linking academic learning to the world beyond the classroom. Office of STEM Education programs enable high standards, support excellence, spread innovation, and help meet future workforce needs. WBL programs 1) establish a laboratory climate where developing students is recognized as a valued activity; 2) preserve, share, and pass on academic, research, professional protocol, knowledge, and skills; 3) provide opportunities for empowerment and self-determination which transcends age, ethnicity, gender, and race; 4) expose undergraduate students to other networking opportunities with STEM
1 Pacific Northwest National Laboratory. 2014. About PNNL: R&D 100 Awards. http://www.pnl.gov/about/rd100awards.asp. Last accessed 5-20-2015. 2 Pacific Northwest National Laboratory. 2014. About PNNL: Federal Laboratory Consortium Awards. http://www.pnl.gov/about/flcawards.asp. Last accessed 5-20-2015.
11
Economic Impact of PNNL on Washington State FY 2014
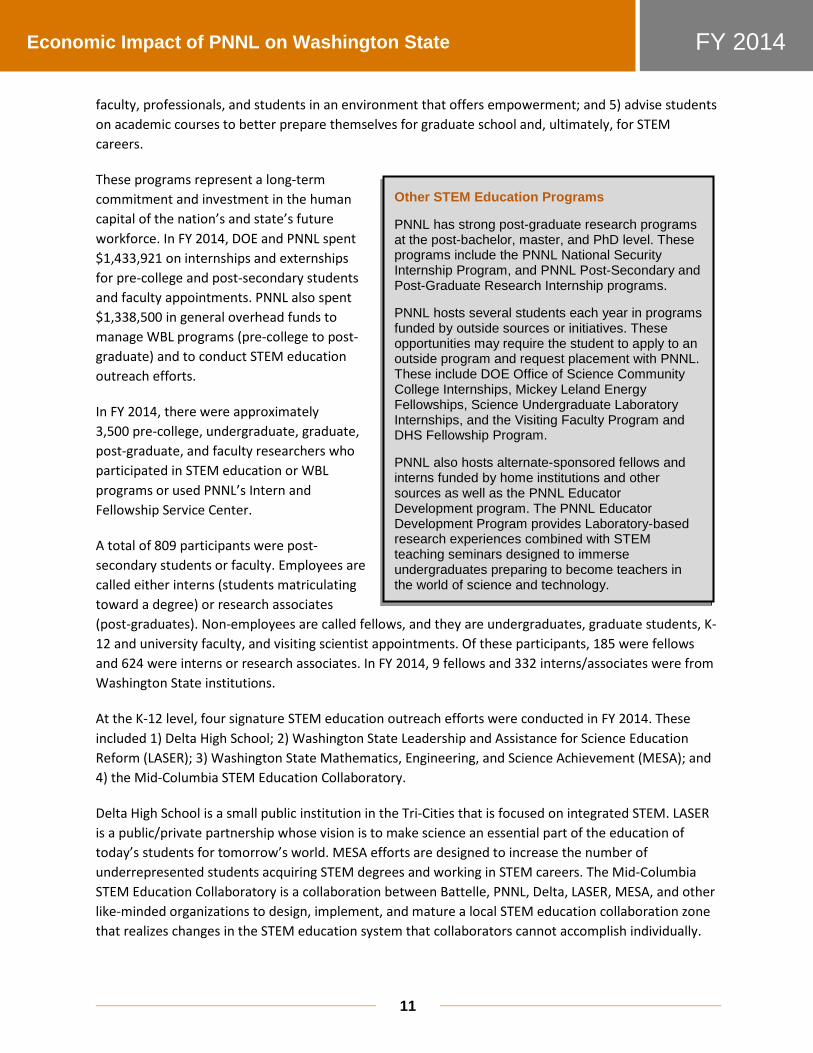
faculty, professionals, and students in an environment that offers empowerment; and 5) advise students on academic courses to better prepare themselves for graduate school and, ultimately, for STEM careers.
These programs represent a long-term commitment and investment in the human capital of the nation’s and state’s future workforce. In FY 2014, DOE and PNNL spent $1,433,921 on internships and externships for pre-college and post-secondary students and faculty appointments. PNNL also spent $1,338,500 in general overhead funds to manage WBL programs (pre-college to post-graduate) and to conduct STEM education outreach efforts.
In FY 2014, there were approximately 3,500 pre-college, undergraduate, graduate, post-graduate, and faculty researchers who participated in STEM education or WBL programs or used PNNL’s Intern and Fellowship Service Center.
A total of 809 participants were post-secondary students or faculty. Employees are called either interns (students matriculating toward a degree) or research associates (post-graduates). Non-employees are called fellows, and they are undergraduates, graduate students, K-12 and university faculty, and visiting scientist appointments. Of these participants, 185 were fellows and 624 were interns or research associates. In FY 2014, 9 fellows and 332 interns/associates were from Washington State institutions.
At the K-12 level, four signature STEM education outreach efforts were conducted in FY 2014. These included 1) Delta High School; 2) Washington State Leadership and Assistance for Science Education Reform (LASER); 3) Washington State Mathematics, Engineering, and Science Achievement (MESA); and 4) the Mid-Columbia STEM Education Collaboratory.
Delta High School is a small public institution in the Tri-Cities that is focused on integrated STEM. LASER is a public/private partnership whose vision is to make science an essential part of the education of today’s students for tomorrow’s world. MESA efforts are designed to increase the number of underrepresented students acquiring STEM degrees and working in STEM careers. The Mid-Columbia STEM Education Collaboratory is a collaboration between Battelle, PNNL, Delta, LASER, MESA, and other like-minded organizations to design, implement, and mature a local STEM education collaboration zone that realizes changes in the STEM education system that collaborators cannot accomplish individually.
Other STEM Education Programs
PNNL has strong post-graduate research programs at the post-bachelor, master, and PhD level. These programs include the PNNL National Security Internship Program, and PNNL Post-Secondary and Post-Graduate Research Internship programs.
PNNL hosts several students each year in programs funded by outside sources or initiatives. These opportunities may require the student to apply to an outside program and request placement with PNNL. These include DOE Office of Science Community College Internships, Mickey Leland Energy Fellowships, Science Undergraduate Laboratory Internships, and the Visiting Faculty Program and DHS Fellowship Program.
PNNL also hosts alternate-sponsored fellows and interns funded by home institutions and other sources as well as the PNNL Educator Development program. The PNNL Educator Development Program provides Laboratory-based research experiences combined with STEM teaching seminars designed to immerse undergraduates preparing to become teachers in the world of science and technology.
12
Economic Impact of PNNL on Washington State FY 2014
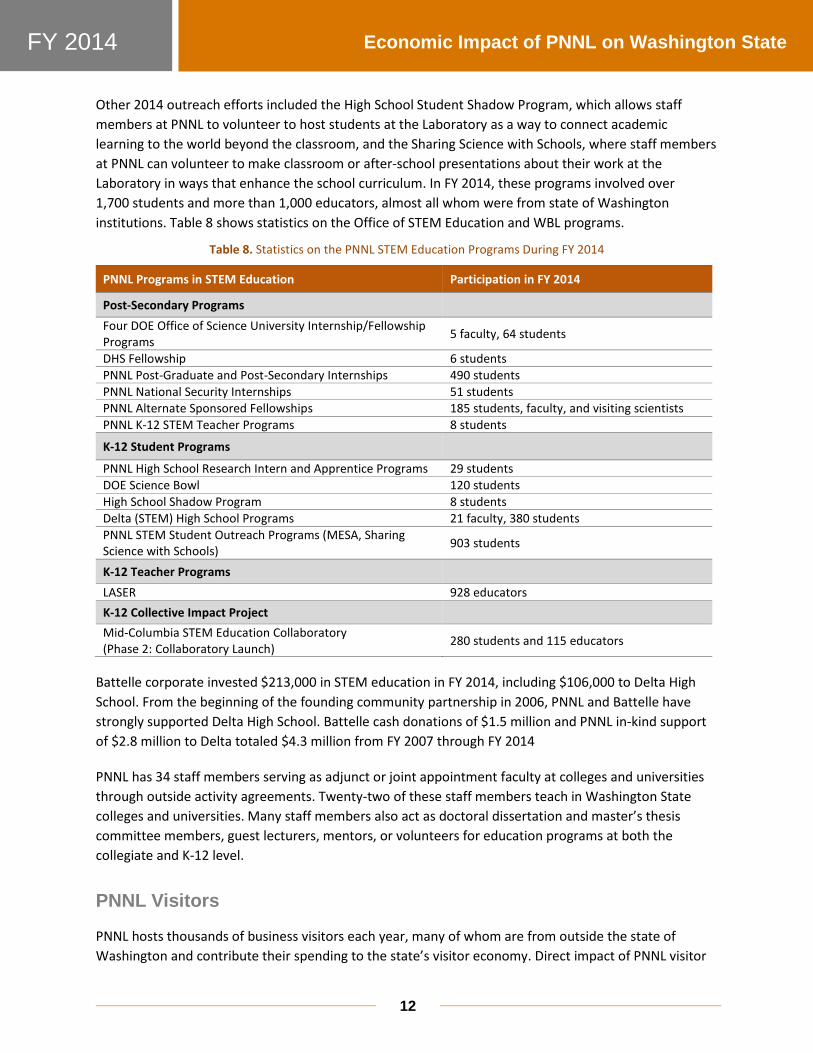
Other 2014 outreach efforts included the High School Student Shadow Program, which allows staff members at PNNL to volunteer to host students at the Laboratory as a way to connect academic learning to the world beyond the classroom, and the Sharing Science with Schools, where staff members at PNNL can volunteer to make classroom or after-school presentations about their work at the Laboratory in ways that enhance the school curriculum. In FY 2014, these programs involved over 1,700 students and more than 1,000 educators, almost all whom were from state of Washington institutions. Table 8 shows statistics on the Office of STEM Education and WBL programs.
Table 8. Statistics on the PNNL STEM Education Programs During FY 2014
PNNL Programs in STEM Education Participation in FY 2014
Post-Secondary Programs Four DOE Office of Science University Internship/Fellowship Programs 5 faculty, 64 students
DHS Fellowship 6 students PNNL Post-Graduate and Post-Secondary Internships 490 students PNNL National Security Internships 51 students PNNL Alternate Sponsored Fellowships 185 students, faculty, and visiting scientists PNNL K-12 STEM Teacher Programs 8 students
K-12 Student Programs
PNNL High School Research Intern and Apprentice Programs 29 students DOE Science Bowl 120 students High School Shadow Program 8 students Delta (STEM) High School Programs 21 faculty, 380 students PNNL STEM Student Outreach Programs (MESA, Sharing Science with Schools) 903 students
K-12 Teacher Programs LASER 928 educators K-12 Collective Impact Project Mid-Columbia STEM Education Collaboratory (Phase 2: Collaboratory Launch) 280 students and 115 educators
Battelle corporate invested $213,000 in STEM education in FY 2014, including $106,000 to Delta High School. From the beginning of the founding community partnership in 2006, PNNL and Battelle have strongly supported Delta High School. Battelle cash donations of $1.5 million and PNNL in-kind support of $2.8 million to Delta totaled $4.3 million from FY 2007 through FY 2014
PNNL has 34 staff members serving as adjunct or joint appointment faculty at colleges and universities through outside activity agreements. Twenty-two of these staff members teach in Washington State colleges and universities. Many staff members also act as doctoral dissertation and master’s thesis committee members, guest lecturers, mentors, or volunteers for education programs at both the collegiate and K-12 level.
PNNL Visitors
PNNL hosts thousands of business visitors each year, many of whom are from outside the state of Washington and contribute their spending to the state’s visitor economy. Direct impact of PNNL visitor
13
Economic Impact of PNNL on Washington State FY 2014
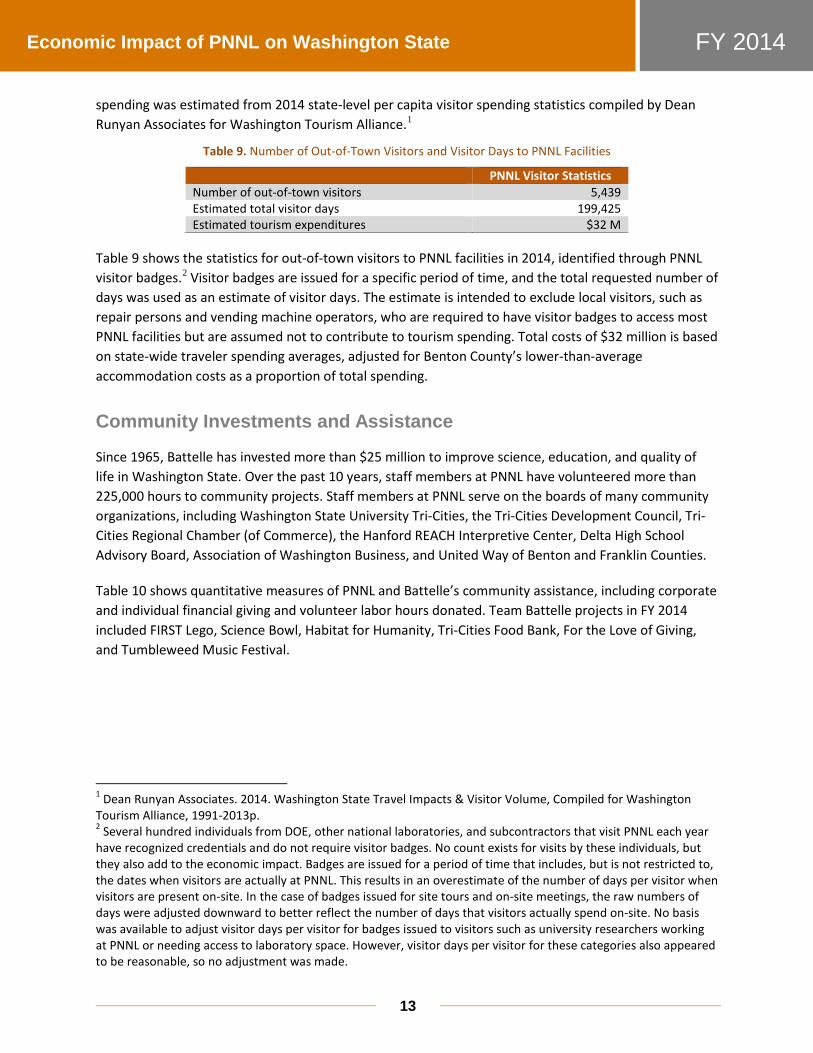
spending was estimated from 2014 state-level per capita visitor spending statistics compiled by Dean Runyan Associates for Washington Tourism Alliance.1
Table 9. Number of Out-of-Town Visitors and Visitor Days to PNNL Facilities
PNNL Visitor Statistics Number of out-of-town visitors 5,439 Estimated total visitor days 199,425 Estimated tourism expenditures $32 M
Table 9 shows the statistics for out-of-town visitors to PNNL facilities in 2014, identified through PNNL visitor badges.2 Visitor badges are issued for a specific period of time, and the total requested number of days was used as an estimate of visitor days. The estimate is intended to exclude local visitors, such as repair persons and vending machine operators, who are required to have visitor badges to access most PNNL facilities but are assumed not to contribute to tourism spending. Total costs of $32 million is based on state-wide traveler spending averages, adjusted for Benton County’s lower-than-average accommodation costs as a proportion of total spending.
Community Investments and Assistance
Since 1965, Battelle has invested more than $25 million to improve science, education, and quality of life in Washington State. Over the past 10 years, staff members at PNNL have volunteered more than 225,000 hours to community projects. Staff members at PNNL serve on the boards of many community organizations, including Washington State University Tri-Cities, the Tri-Cities Development Council, Tri-Cities Regional Chamber (of Commerce), the Hanford REACH Interpretive Center, Delta High School Advisory Board, Association of Washington Business, and United Way of Benton and Franklin Counties.
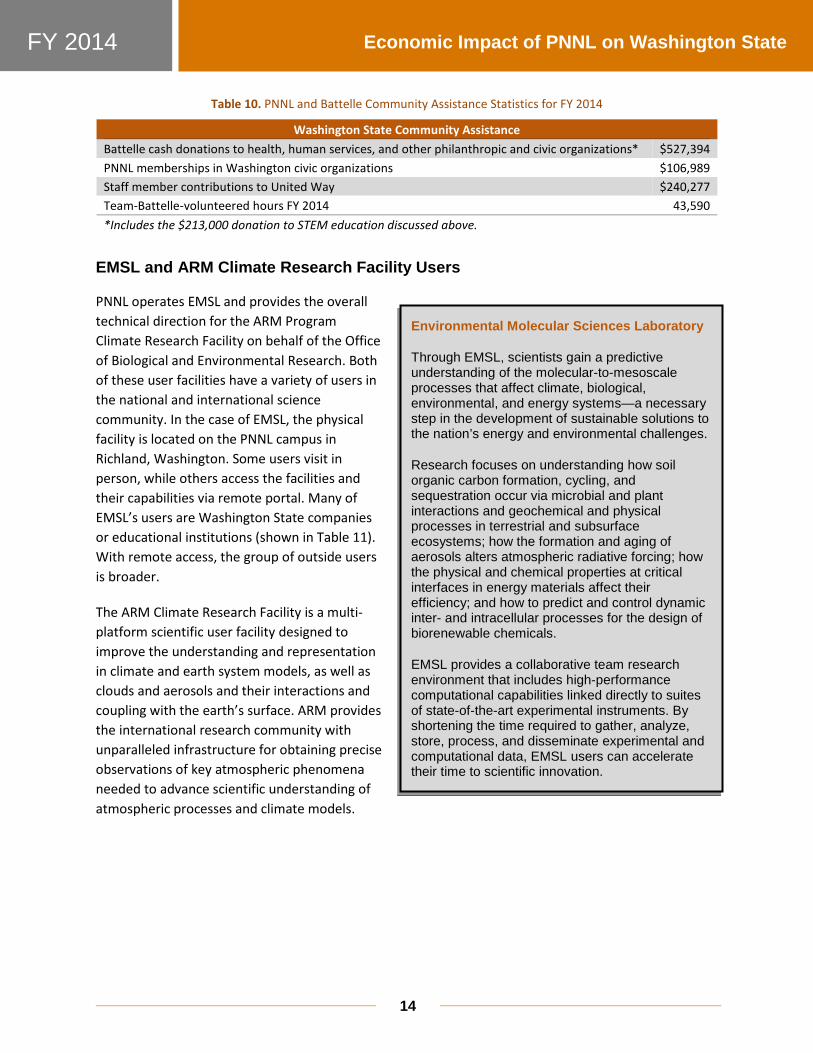
Table 10 shows quantitative measures of PNNL and Battelle’s community assistance, including corporate and individual financial giving and volunteer labor hours donated. Team Battelle projects in FY 2014 included FIRST Lego, Science Bowl, Habitat for Humanity, Tri-Cities Food Bank, For the Love of Giving, and Tumbleweed Music Festival.
1 Dean Runyan Associates. 2014. Washington State Travel Impacts & Visitor Volume, Compiled for Washington Tourism Alliance, 1991-2013p. 2 Several hundred individuals from DOE, other national laboratories, and subcontractors that visit PNNL each year have recognized credentials and do not require visitor badges. No count exists for visits by these individuals, but they also add to the economic impact. Badges are issued for a period of time that includes, but is not restricted to, the dates when visitors are actually at PNNL. This results in an overestimate of the number of days per visitor when visitors are present on-site. In the case of badges issued for site tours and on-site meetings, the raw numbers of days were adjusted downward to better reflect the number of days that visitors actually spend on-site. No basis was available to adjust visitor days per visitor for badges issued to visitors such as university researchers working at PNNL or needing access to laboratory space. However, visitor days per visitor for these categories also appeared to be reasonable, so no adjustment was made.
14
Economic Impact of PNNL on Washington State FY 2014
Table 10. PNNL and Battelle Community Assistance Statistics for FY 2014
Washington State Community Assistance Battelle cash donations to health, human services, and other philanthropic and civic organizations* $527,394 PNNL memberships in Washington civic organizations $106,989 Staff member contributions to United Way $240,277 Team-Battelle-volunteered hours FY 2014 43,590 *Includes the $213,000 donation to STEM education discussed above.
EMSL and ARM Climate Research Facility Users
PNNL operates EMSL and provides the overall technical direction for the ARM Program Climate Research Facility on behalf of the Office of Biological and Environmental Research. Both of these user facilities have a variety of users in the national and international science community. In the case of EMSL, the physical facility is located on the PNNL campus in Richland, Washington. Some users visit in person, while others access the facilities and their capabilities via remote portal. Many of EMSL’s users are Washington State companies or educational institutions (shown in Table 11). With remote access, the group of outside users is broader.
The ARM Climate Research Facility is a multi-platform scientific user facility designed to improve the understanding and representation in climate and earth system models, as well as clouds and aerosols and their interactions and coupling with the earth’s surface. ARM provides the international research community with unparalleled infrastructure for obtaining precise observations of key atmospheric phenomena needed to advance scientific understanding of atmospheric processes and climate models.
Environmental Molecular Sciences Laboratory
Through EMSL, scientists gain a predictive understanding of the molecular-to-mesoscale processes that affect climate, biological, environmental, and energy systems—a necessary step in the development of sustainable solutions to the nation’s energy and environmental challenges.
Research focuses on understanding how soil organic carbon formation, cycling, and sequestration occur via microbial and plant interactions and geochemical and physical processes in terrestrial and subsurface ecosystems; how the formation and aging of aerosols alters atmospheric radiative forcing; how the physical and chemical properties at critical interfaces in energy materials affect their efficiency; and how to predict and control dynamic inter- and intracellular processes for the design of biorenewable chemicals.
EMSL provides a collaborative team research environment that includes high-performance computational capabilities linked directly to suites of state-of-the-art experimental instruments. By shortening the time required to gather, analyze, store, process, and disseminate experimental and computational data, EMSL users can accelerate their time to scientific innovation.
15
Economic Impact of PNNL on Washington State FY 2014
In FY 2014, there were 1,296 unique ARM scientific users: 590 from universities, 37 from industry, 221 from DOE laboratories, 114 from other federal agencies, 234 foreign, and 100 “other.” One hundred and sixty (160) users used ARM’s facilities’ on-site assets, 454 used off-site services, and 682 used data services. The vast majority of ARM users do not visit PNNL, but interact with the facility by downloading data or by visiting one of the remote ARM field sites. ARM has approximately 53 employees at PNNL, not all of whom are full-time.
Table 11. FY 2014 EMSL Users Total EMSL Users Washington State Users EMSL total users 726 362 Number of international (foreign) users 58 0 U.S. users 668 362 Non-PNNL U.S. users 362 56
Economic Impact of Closely Related Activity
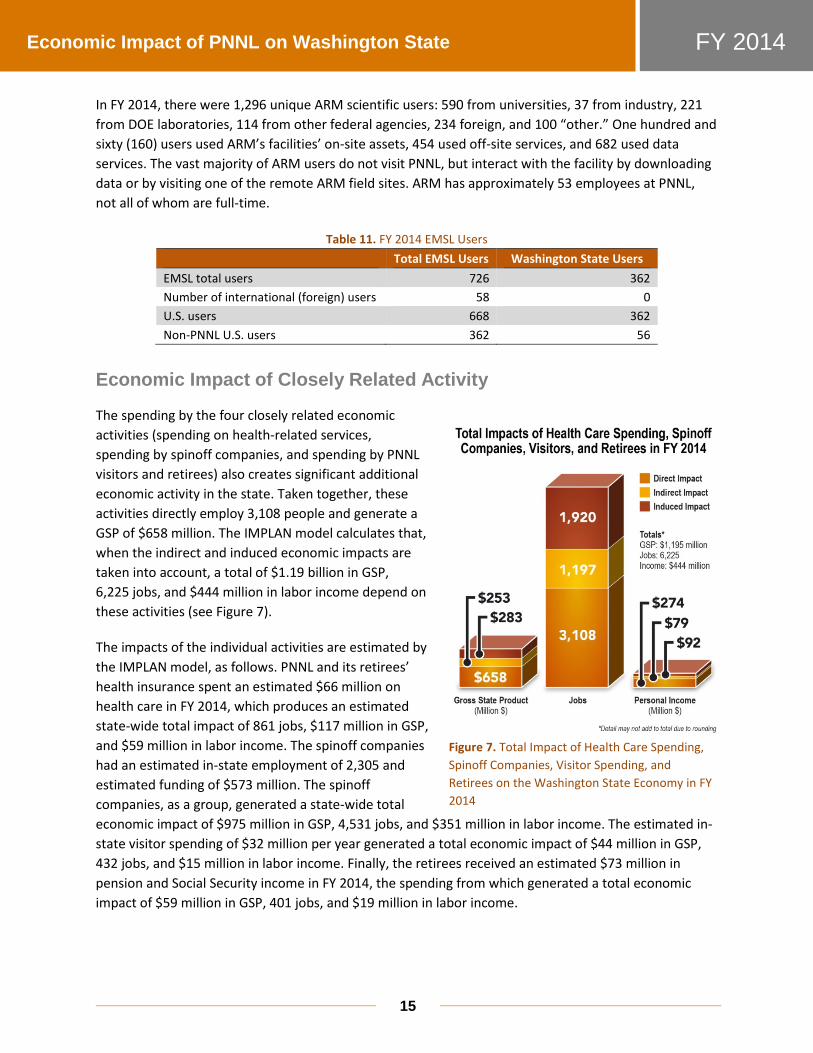
The spending by the four closely related economic activities (spending on health-related services, spending by spinoff companies, and spending by PNNL visitors and retirees) also creates significant additional economic activity in the state. Taken together, these activities directly employ 3,108 people and generate a GSP of $658 million. The IMPLAN model calculates that, when the indirect and induced economic impacts are taken into account, a total of $1.19 billion in GSP, 6,225 jobs, and $444 million in labor income depend on these activities (see Figure 7).
The impacts of the individual activities are estimated by the IMPLAN model, as follows. PNNL and its retirees’ health insurance spent an estimated $66 million on health care in FY 2014, which produces an estimated state-wide total impact of 861 jobs, $117 million in GSP, and $59 million in labor income. The spinoff companies had an estimated in-state employment of 2,305 and estimated funding of $573 million. The spinoff companies, as a group, generated a state-wide total economic impact of $975 million in GSP, 4,531 jobs, and $351 million in labor income. The estimated in-state visitor spending of $32 million per year generated a total economic impact of $44 million in GSP, 432 jobs, and $15 million in labor income. Finally, the retirees received an estimated $73 million in pension and Social Security income in FY 2014, the spending from which generated a total economic impact of $59 million in GSP, 401 jobs, and $19 million in labor income.
Figure 7. Total Impact of Health Care Spending, Spinoff Companies, Visitor Spending, and Retirees on the Washington State Economy in FY 2014
16
Economic Impact of PNNL on Washington State FY 2014
Conclusion
PNNL is an economic asset to the nation and the state of Washington. Its scientists and engineers regularly contribute ideas, inventions, technologies, and processes to the nation’s and state’s body of scientific and technological knowledge that will build the economy of tomorrow. PNNL takes seriously its role in making this knowledge practical, actionable, and commercially viable, and has won numerous awards for interagency collaboration, technology transfer, and technology commercialization. The growing number of 71 commercial companies in Washington State is based on PNNL ideas and assistance, with 2,305 resident employees and an estimated $574 million in funding as proof of the success of the PNNL model.
PNNL’s current operations constitute a large source of economic activity in Washington State, with $1.02 billion in total spending, 4,026 resident employees, in-state payrolls of $377 million, and purchases from Washington businesses of about $75 million. This economic activity supports a total of $1.45 billion total economic output, total in-state payrolls of $517 million, and about 6,800 jobs through Laboratory operations in the state. An additional $1.19 billion in output, in-state payrolls of $444 million, and over 6,200 jobs are supported through closely related activities such as spinoff companies, Laboratory retirees, visitors to PNNL, and health care spending. Lastly, PNNL and its employees annually contribute millions of dollars and thousands of hours to education and community services, helping secure the future and making Washington a better place to live.
17
Economic Impact of PNNL on Washington State FY 2014
Appendix A
The IMPLAN Model To calculate the economic impact of PNNL on the state of Washington, PNNL used IMPLAN® (IMpact analysis for PLANning),1 a widely accepted economic input-output model, to estimate funding, employment, and labor income impacts. IMPLAN, a product of MIG, Inc. (formerly Minnesota IMPLAN Group, Inc.), contains highly disaggregated data on regional economic indicators based on data from a variety of sources, such as the U.S. Bureau of Economic Analysis, and then aggregates the entire economy into 440 sectors. It is based on social accounting between industries and within the distribution chain and contains numerous economic multipliers to quantify direct, indirect, and induced output; employment; and labor income impacts. Output from IMPLAN is in the form of direct, indirect, and induced economic output (gross funding); jobs; and labor income created or supported, as well as their associated multipliers.
Each sector that produces goods and services generates demand for goods and services in other sectors. This iterative process is the multiplier effect. Multipliers can be described through the following definitions:
● Direct effects are the initial change to the industry or institution in question.
● Indirect effects are the changes in inter-industry purchases as they respond to the new demands of the directly affected industries. The direct change creates increases in economic activity for downstream businesses that support these direct industries.
● Induced effects are the increases in household income expenditures generated by the direct and indirect effects.
The Washington State data file for 2012 was used in this analysis with gross domestic product deflators within the model used to convert impacts to 2014 dollars. PNNL data on purchases of goods and services, associated companies output, employee payroll, retiree income, visitor spending, and health care purchases were compiled and translated into IMPLAN inputs. Table A.1 characterizes the IMPLAN inputs.
1 IMPLAN. Version 3.0. Davidson, NC: IMPLAN Group LLC, Inc. www.implan.com

18
Economic Impact of PNNL on Washington State FY 2014
Table A.1. IMPLAN Input Characterization
Expenditures Input Characterization
Purchases on goods and services
Expenditures were assigned a NAICS code and then translated to their respective IMPLAN sector using the IMPLAN NAICS bridge. Expenditures were calculated as an industry change and retail margins used where needed. Purchases are dominated by the construction, real estate, engineering services, medical and diagnostic laboratories, computer systems design services, and university sectors.
Spinoff companies Each company was assigned an IMPLAN sector. IMPLAN data were used to derive an output per employee and each company’s output was subsequently calculated in IMPLAN. The dominant sectors were inorganic chemical manufacturing and environmental and technical consulting services sectors.
Employee salaries Payroll data are calculated in IMPLAN as a change in employee compensation. IMPLAN derives the impact from the model’s income expenditure patterns.
Health care spending Health care expenditures from employees and retirees were assigned a NAICS code and translated to one of the five primary medical IMPLAN sectors and one retail sector supplying medical-related items and then calculated as an industry change. Margins were used for the retail sector.
Retiree income Retiree income was calculated in IMPLAN as a change in employee compensation. IMPLAN derives the impact from the model’s income expenditure patterns.
Visitor spending Visitor spending was aggregated into day-visitor and overnight-visitor spending and calculated in IMPLAN as a change in sectors typically affected by visitor spending, such as accommodation, food establishments, and retail gasoline sectors.
IMPLAN = IMpact Analysis for PLANning NAICS = North American Industry Classification System

19
Economic Impact of PNNL on Washington State FY 2014
Appendix B
Benchmarking the Results Many regions’ private and public stakeholders care about the economic impact of major industries and industry clusters. This appendix reports on benchmarking reviews of economic impact analyses of a peer group that includes other large industries and companies (“peer entities”) within the state of Washington and other national laboratories to show where PNNL “fits” on a number of economic dimensions assessed in this study.
It is important to note that the main report used the IMPLAN economic model to calculate the effects of several types of PNNL operations expenditures (and, separately, expenditures for closely related economic activities) on overall economic activity in Washington. Due to lack of certain data on peer entities and study resource constraints, it was not possible to perform the same analysis for the peer entities. Rather, this Appendix compares key economic input data and results from published reports of previously completed economic impact studies on the peer entities to similar economic input data and results from the main report for PNNL operations (most of the other studies did not look at closely related activities). A list of the studies on the peer entities appears at the end of this Appendix. Where an input or output is different from the similar concept in this study, this has been noted in the following tables. Where no comparable data was available in the peer entity study, an “NA” appears.
The other studies are all reasonably recent (within the last 10 years), but the studies were done at different times, for different scopes of activity, and some used different impact assessment methods and variables than in this study, so comparisons with and between peer entities are only an approximation.
PNNL is a medium-large economic entity that consistently delivers at or above its weight compared to its peers. The dimensions that are compared across peer entities are:
1. Scale of the peers’ direct economic activity, as measured by total spending or funding, resident employment, purchases of other goods and services, average annual wage rates, and total payroll
2. Impact on total state economic activity, as measured by GSP, employment, and wage income
Because the other studies did not look at all of the dimensions examined in this study, the comparison is limited to the dimensions discussed above.
PNNL’s Washington State S&T peer group includes Boeing, Microsoft, the University of Washington, and Washington State University. Although they are not S&T companies, comparisons were also done on the first two dimensions for three other large, high-profile employers in the state for which economic impact information is available: the military, life sciences, and wine sectors.
20
Economic Impact of PNNL on Washington State FY 2014
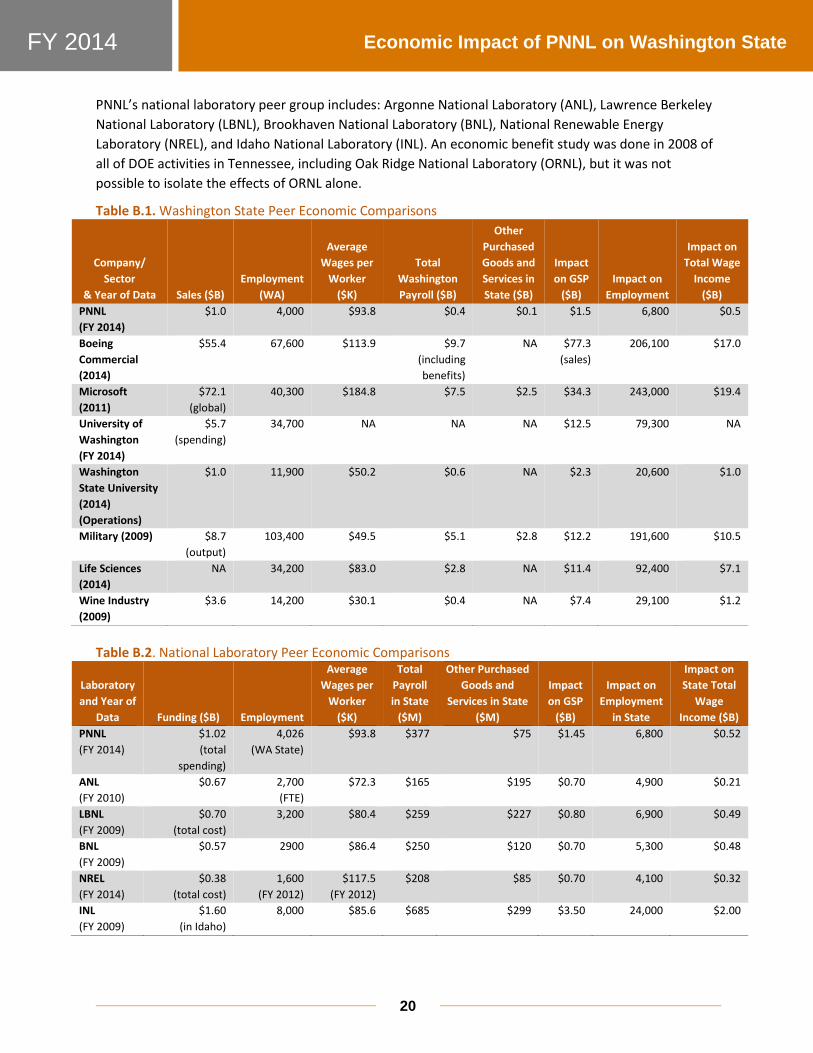
PNNL’s national laboratory peer group includes: Argonne National Laboratory (ANL), Lawrence Berkeley National Laboratory (LBNL), Brookhaven National Laboratory (BNL), National Renewable Energy Laboratory (NREL), and Idaho National Laboratory (INL). An economic benefit study was done in 2008 of all of DOE activities in Tennessee, including Oak Ridge National Laboratory (ORNL), but it was not possible to isolate the effects of ORNL alone.
Table B.1. Washington State Peer Economic Comparisons
Company/ Sector
& Year of Data Sales ($B) Employment
(WA)
Average Wages per
Worker ($K)
Total Washington Payroll ($B)
Other Purchased Goods and Services in State ($B)
Impact on GSP
($B) Impact on
Employment
Impact on Total Wage
Income ($B)
PNNL (FY 2014)
$1.0 4,000 $93.8 $0.4 $0.1 $1.5 6,800 $0.5
Boeing Commercial (2014)
$55.4 67,600 $113.9 $9.7 (including benefits)
NA $77.3 (sales)
206,100 $17.0
Microsoft (2011)
$72.1 (global)
40,300 $184.8 $7.5 $2.5 $34.3 243,000 $19.4
University of Washington (FY 2014)
$5.7 (spending)
34,700 NA NA NA $12.5 79,300 NA
Washington State University (2014) (Operations)
$1.0 11,900 $50.2 $0.6 NA $2.3 20,600 $1.0
Military (2009) $8.7 (output)
103,400 $49.5 $5.1 $2.8 $12.2 191,600 $10.5
Life Sciences (2014)
NA 34,200 $83.0 $2.8 NA $11.4 92,400 $7.1
Wine Industry (2009)
$3.6 14,200 $30.1 $0.4 NA $7.4 29,100 $1.2
Table B.2. National Laboratory Peer Economic Comparisons
Laboratory and Year of
Data Funding ($B) Employment
Average Wages per
Worker ($K)
Total Payroll in State
($M)
Other Purchased Goods and
Services in State ($M)
Impact on GSP
($B)
Impact on Employment
in State
Impact on State Total
Wage Income ($B)
PNNL (FY 2014)
$1.02 (total
spending)
4,026 (WA State)
$93.8 $377 $75 $1.45 6,800 $0.52
ANL (FY 2010)
$0.67 2,700 (FTE)
$72.3 $165 $195 $0.70 4,900 $0.21
LBNL (FY 2009)
$0.70 (total cost)
3,200
$80.4 $259 $227 $0.80 6,900 $0.49
BNL (FY 2009)
$0.57 2900 $86.4 $250 $120 $0.70 5,300 $0.48
NREL (FY 2014)
$0.38 (total cost)
1,600 (FY 2012)
$117.5 (FY 2012)
$208 $85 $0.70 4,100 $0.32
INL (FY 2009)
$1.60 (in Idaho)
8,000 $85.6 $685 $299 $3.50 24,000 $2.00
21
Economic Impact of PNNL on Washington State FY 2014
Other Studies Reviewed
● Appleseed. 2010. Brookhaven National Laboratory Economic Impact Report: Meeting National Needs, Creating Opportunities for Growth. Appleseed, New York., 60 pp. http://www.appleseedinc.com/wp-content/uploads/2014/12/Meeting-National-Needs-Creating-Opportunities-for-Growth.pdf. Last accessed 9-25-2014.
● Berk and Associates. 2010. Washington State’s Defense Economy: Measuring and Growing its Impact. Washington Economic Development Commission, Washington Department of Commerce, Seattle, Washington, 29pp.
● Black G, D Holley, and J Church. 2010. INL Impacts: An Analysis of the Effects of Idaho National Laboratory Site Operations on Idaho’s Economy. Boise State University, Boise, Idaho, 16 pp. http://www.inl.gov/portal-files/impacts_brochure.pdf. Last accessed 9-25-2014.
● CBRE Consulting. 2010. Berkeley Lab Economic Impact Study. CBRE Consulting, San Francisco, California, 51 pp. https://www.lbl.gov/wp-content/uploads/2014/06/CBRE-LBNL-Economic-Impact-Study-FINAL.pdf. Last accessed 9-25-2014.
● Community Attributes, Inc. 2015a. Washington State Aerospace Industry Economic Impact Study: 2015 Addendum, Washington State Aerospace Partnership, 7 pp. http://www.washington-aerospace.com/CAI.WAP%20Aerospace%20Impacts%202015%20Update%20FINAL.pdf. Last accessed 4-20-2015.
● Community Attributes, Inc. 2015b. Washington State University Economic Reach and Impact, 16 pp. https://economicdevelopment.wsu.edu/documents/2015/06/wsu-economic-impact.pdf. Last accessed 4-20-15.
● Eicher TS. 2014. The 2011 Microsoft Economic Impact Study. Prepared for Microsoft Corporation, 31pp. http://www.one-report.com/download.html/2014/shared/library/0259-00010864.pdf. Last accessed 9-25-2014.
● Sallee CM., SD Watkins, and AL Rosaen. 2011. The Economic Impact of Argonne National Laboratory. Anderson Economic Group, LLC, Chicago, Illinois, 42 pp. http://uchicagoargonnellc.org/pdf/AEG_Argonne_June_2011.pdf. Last accessed 9-25-14.
● Stoel Rives, LLP. 2012. 2011 Washington Patent Report. http://www.stoel.com/showarticle.aspx?Show=9772. Last accessed 4-20-2015.
● Stonebridge Research Group, LLC. 2012. The Economic Impact of Washington State Wine and Grapes. Prepared for the Washington State Wine Commission. Stonebridge Research Group, LLC, St. Helena, California, 53pp. http://www.wawgg.org/files/documents/2012_Economic_Impact_WA_Wine-Grapes.pdf. Last accessed 9-25-2014.
● Tripp Umbach. 2014. 2014 Economic and Community Impact Report of the University of Washington. Executive Report (FY 08-09). University of Washington, Seattle, Washington, 33 pp.

22
Economic Impact of PNNL on Washington State FY 2014
http://www.washington.edu/externalaffairs/files/2015/01/14-Economic-Impact-Report.pdf. Last accessed 4-20-14.
● Washington Biotechnology and Biomedical Association. 2014. Trends in Washington’s Life Sciences Industry 2015 Summary. http://www.washbio.org/?page=Economic_Development. 1p. Last Accessed 4-20-2015.
● Washington Research Council. 2011. Trends in Washington’s Life Sciences Industry. Washington Research Council, Tukwila, Washington, 24 pp. https://researchcouncil.files.wordpress.com/2013/08/2011lifesciencesimpactreportfinal111711.pdf. Last accessed 4-2-14.
● Wobbekind R and B Lewandowski. 2015. National Renewable Energy Laboratory: Economic Contribution of Operations and Capital Investments on the Region, the State of Colorado, and the Nation, FY 2012-FY 2014. Leeds School of Business, University of Colorado, Boulder, Colorado, 37pp. http://www.nrel.gov/about/assets/pdfs/nrel-economic-impact-report_may2015.pdf. Last Accessed 6-25-2015.


2
Economic Impact of PNNL on Washington State FY 2014