Embed Size (px)
Citation preview
ECONOMIC IMPACT OF OFFSHORE WIND FARM DEVELOPMENT ON THE CENTRAL COAST OF CALIFORNIA
CALIFORNIA POLYTECHNIC STATE UNIVERSITY
APRIL 3 2021
Stephen F Hamilton Professor of Economics California Polytechnic State University Cyrus Ramezani Professor of Finance California Polytechnic State UniversityChristopher Almacen Graduate Research Assistant California Polytechnic State University Ben Stephan Undergraduate Research Assistant California Polytechnic State University
Economic Impact of Offshore Wind Farm Development on the Central Coast
3
Table of ContentsExecutive Summary 041 Introduction 12
11 Recent Technological Advances Make Floating Offshore Wind Possible 13
12 Outlook for Offshore Wind in California 14
13 Economic Value of Offshore Wind 15
2 Industry Background amp Requirements 1821 Technology Description23
22 Offshore Wind Power Has a Favorable Time Profile on the Electricty Grid 24
23 Port Infrastructure Requirements 25
24 Transmission Infrastructure Requirements 29
25 Regional Supply Chain Development 30
26 Timing of Proposed Wind Farm Development 32
27 Employment and Output Demographics in San Luis Obispo County 33
3 Methods and Scope 3631 Scope of the Study 37
311 Specialized Wind Port 38
312 Develoment of Representative 1 GW OSW Farm 39
313 Decommissioning and Recommisioning Provisions for a 1 GW OSW Farm 40
32 Methods 42
4 Results 4541 Port Construction Impacts 46
42 Offshore Wind Development Impacts 47
421 OSW 1 GW Baseline with Decommissioning 48
422 OSW 1 GW Baseline with Recommissioning 53
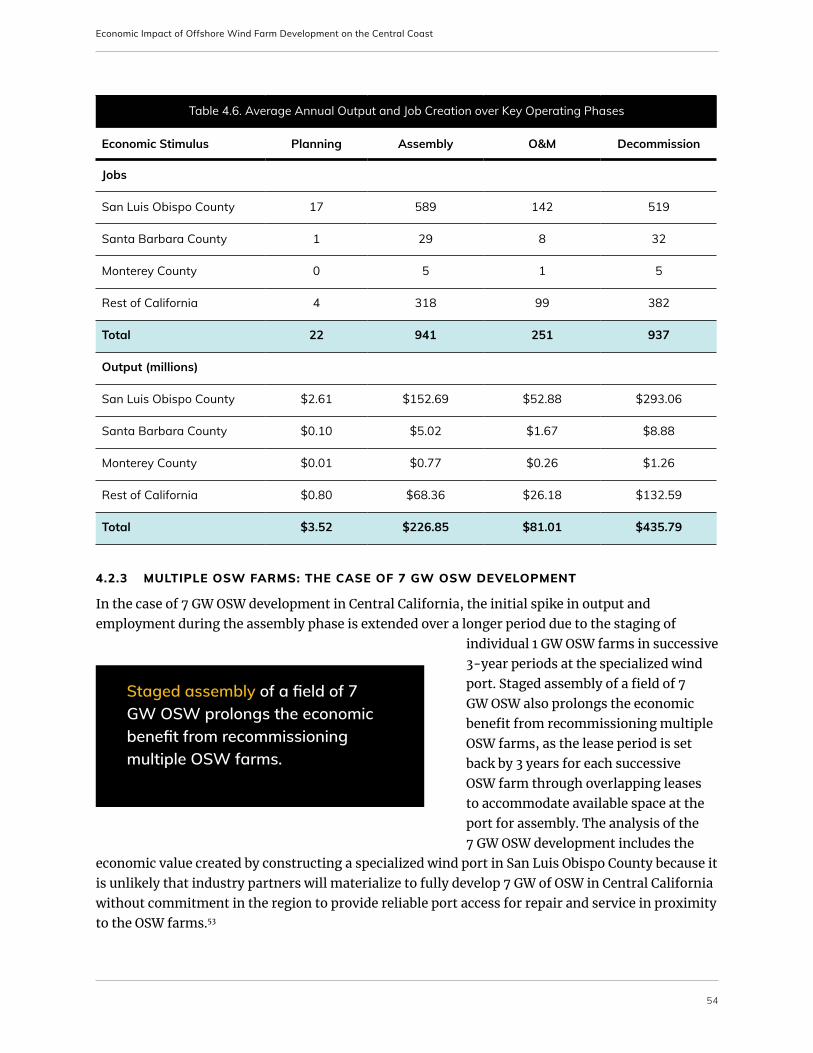
423 Multiple OSW Farms The Case of 7 GW OSW Development 54
424 Smaller Scale Development The Case of 3 GW OSW 59
5 Fiscal Implications 6251 Property Taxes from Land Improvement at the Specialized Wind Port 63
52 Unitary Taxes on Electricity Transmission by PGampE 64
53 Sales and Use Taxes on OSW Spending 65
54 Sales and Use Taxes Corporate Taxes and Income Taxes from Affiliated Spending 65
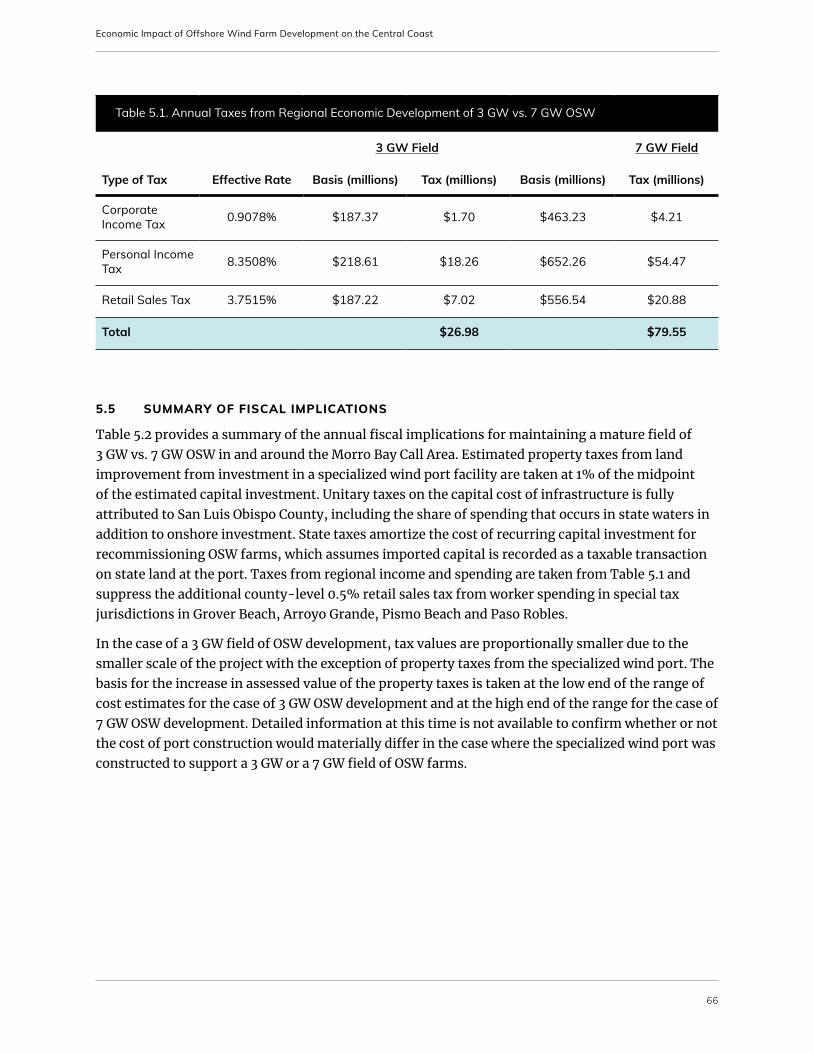
55 Summary of Fiscal Implications 66
6 Conclusion 68References 71
Economic Impact of Offshore Wind Farm Development on the Central Coast
4
EXECUTIVE SUMMARY
Economic Impact of Offshore Wind Farm Development on the Central Coast
5
EXECUTIVE SUMMARY
As the State of California continues to transition toward being 100 powered by renewable energy by 2045 offshore wind (OSW) is poised to provide a substantial contribution to the statersquos green energy portfolio Developing OSW energy resources along Californiarsquos Central Coast mdash as underpinned by current plans by the US Bureau of Ocean Energy Management (BOEM) to auction federal waters in the OSW planning area for up to 7 gigawatts (GW) of OSW development mdash has the potential not only to reduce carbon emissions on the electricity grid but also to stimulate broad-based economic growth create quality jobs in green energy and benefit regional communities in and around San Luis Obispo County
Recent advances in floating OSW technology have greatly reduced the cost of producing electricity opening the door for commercial OSW farms to be developed in California With the ocean floor along Californiarsquos coast sloping steeply downward into deep waters offshore wind turbines must be installed on floating platforms rather than being fixed to the ocean floor in shallow waters as is done along the East Coast and much of Europe Given the physical scale and logistical complexity of developing floating OSW farms in California including the need to develop an extensive supply chain to capture these benefits meeting Californiarsquos long-term climate goals will require considerable coordination between government and industry to make the economic potential of OSW a reality
This report analyzes the regional economic benefit to San Luis Obispo County for 3 to 7 GW of OSW development along Californiarsquos Central Coast The regional economic benefit considered in this report provides a dynamic summary of the green job opportunities value added and fiscal returns from the project over time as a result of recurring project spending to meet the needs of an emerging OSW industry in the county
The regional economic benefit fits within a larger context of economic benefits from green energy development in the State of California The overarching economic benefit of OSW in California is derived from its ability to deliver electricity to the grid at minimum social cost It is not possible to convert energy into power without cost and minimizing the social cost of producing electricity on the grid must consider both private costs (what electricity suppliers must pay) and external costs (eg greenhouse gas emissions wildlife disruption) The statersquos ambitious goal of achieving a
Meeting Californiarsquos long-term climate goals will require considerable coordination between government and industry to make the economic potential of OSW a reality
Economic Impact of Offshore Wind Farm Development on the Central Coast
6
zero-carbon renewable electricity mix by 2045 implicitly places a large weight on greenhouse gas emissions in the calculation of social cost tilting the economic balance toward the evaluation of carbon-free electricity projects that minimize private costs
Relative to other renewable energy resources OSW has a favorable time profile of electricity delivery OSW farms produce peak electricity during evening hours reducing storage needs when mixed in a renewable energy portfolio with solar power generation that delivers peak energy in the middle of the day Relative to commercial solar power OSW energy can generate electricity around the clock resulting in a capacity factor of 50 almost double that of commercial solar power1 The levelized cost of energy ($MWh) which represents the long-run average cost of electricity generation over the life of a power plant is approaching parity with commercial solar photovoltaic systems and nuclear power as recent technological advances have greatly reduced the cost of floating OSW 2
An important challenge for floating OSW energy development is minimizing transportation and logistical costs between the OSW field and the specialized wind ports that serve them Given the massive size of OSW turbines final assembly must take place in reinforced quays at a port either at a waterfront manufacturing hub (likely in Asia) or at a specialized wind port that receives floating foundations towers and turbines from the manufacturing center and assembles them locally Developing a specialized wind port provides a foothold for regional economic values to be generated in California by providing assembly maintenance and repair jobs for turbines that might otherwise be towed into federal waters off Californiarsquos coast from international manufacturing centers
The economics of OSW development are driven by tremendous fixed costs that must be incurred up front to make floating OSW power a reality The National Renewable Energy Laboratory (NREL) estimates that installing an OSW farm with 1 GW nameplate capacity involves investing largely unrecoverable capital expenditures (CapEx) of more than $55 billion which requires OSW turbines to be maintained and connected to the electricity grid for extended periods of time to recoup the initial upfront investment The economics of energy projects that involve high fixed costs and low variable costs favor maximizing the time OSW turbines spend on the water generating electricity for the grid as the opportunity cost of down time for turbine maintenance and repair can quickly erode the economic value of OSW The need to maintain OSW turbines for a large number of days on the water to recoup the initial capital investment in turn highlights the need to develop specialized
wind ports for assembly and repair of wind turbines in close proximity to the OSW farms
The center for job creation from floating OSW farms will be at the ports For this reason the regional economic value calculated in this report presumes a specialized wind port is available to assemble and repair floating OSW turbines in San Luis Obispo County
Making economic benefits from OSW development a reality for San Luis Obispo County will require developing a specialized wind port as a hub for OSW jobs and regional supply-chain development
Economic Impact of Offshore Wind Farm Development on the Central Coast
7
In the event a specialized port is not constructed in the county the regional economic benefits considered here will not materialize in San Luis Obispo County but instead will occur in the county that provides the port Making economic benefits from OSW development a reality for San Luis Obispo County will require developing a specialized wind port as a hub for OSW jobs and regional supply-chain development An important next step to attaining the economic benefits detailed in this report is to conduct a feasibility study for developing a specialized wind port in San Luis Obispo County
The economic benefit of OSW development on the Central Coast is derived from the following activities port construction planning assembly operation and maintenance (OampM) and decommissioning (recommissioning)
Virtually all the jobs to support these activities will occur at the specialized wind port which is the physical entity that ties OSW farms located in federal waters to a staging area on Californiarsquos coast
Unlocking Californiarsquos offshore wind energy potential is a case study in the challenges and opportunities involved in the 21st-century clean energy transition Deploying floating OSW farms off Californiarsquos coastline will require developing an entirely new industry in California that must surmount major transmission infrastructure requirements address electricity storage needs and provide integrated resource planning to smooth the timing of electricity delivery from solar land-based wind offshore wind hydropower and geothermal sources in a renewable energy portfolio The emerging OSW industry in California currently lags far behind China and the EU in supply-chain development and its success will depend largely on coordinated policy decisions by state and regional government to provide clear market signals for stakeholders
Investor confidence is needed to develop regional supply chains for OSW energy development in California In-state production of the full range of OSW farm components including turbines and floating foundations is not a reality today but is possible if state and federal planners send clear signals to OSW developers that investing in OSW manufacturing capacity in California will be rewarded by long-term market development If state planners fail to provide clear market signals on the outlook for OSW in California it is likely that much of the supply chain will continue to be outsourced to international manufacturing hubs in China and South Korea for turbines and floating foundations reducing the potential for economic benefits to be realized over time in California
The regional economic benefit of OSW development considered in this report does not include additional values that can be created through the long-term development of manufacturing capacity for turbines and floating foundations in California Indeed the current gap between Californiarsquos capability for OSW manufacturing and the rest of the world remains large Instead the report considers the construction and operation of a small specialized wind port in San Luis Obispo County that acts as a receiving point for manufactured components and engages in the assembly repair and maintenance of floating OSW turbines
A key implication of the study is that the regional economic value of OSW farm development off the Central Coast of California will be largely captured by the county that develops a specialized wind port for assembly and repair of OSW turbines Given the large scale of offshore wind turbines which
Economic Impact of Offshore Wind Farm Development on the Central Coast
8
are many times larger than onshore turbines it is not possible to transport OSW turbines by truck or rail requiring these activities to take place directly at a port For this reason installing operating and maintaining a field of 3 - 7 GW of OSW farms in the region will require developing an extensive supply chain to support the hub of economic activity centered at the specialized wind port
The economic benefit to San Luis Obispo County from OSW farm development is defined by several key phases
bull construction of a specialized wind portbull assembly of OSW turbines at the portbull an operation and maintenance (OampM) period that relies on the specialized wind port to repair
and maintain OSW turbinesbull a decommissioning (or alternatively recommissioning) period at the end of each 30-year lease
With current technology all phases of floating OSW development will take place in a port either by making use of a specialized wind port for final assembly of OSW turbines in California or by floating fully assembled structures into place directly from existing manufacturing centers in Asia
The main findings of the report are as follows Table E1 shows regional job and output creation during the 5-year construction phase of the specialized wind port
Table E2 shows the total job and output for a representative 1 GW OSW farm over a 35-year horizon through 2058 that includes planning assembly a 25-year period for operation and maintenance and a 3-year decommissioning period Economic output includes local spending on labor materials and services and does not include the value of the energy created The value of the representative 1 GW OSW farm is in addition to the value created during the 5-year period of port construction
Table E1 Output and Job Creation from Port Construction
RegionFull-Time
Equivalent JobsTotal Output (million $s)
San Luis Obispo County 11825 $202261
Santa Barbara County 234 $3896
Monterey County 28 $577
Rest of California 3837 $92956
California Total 15925 $299689
Economic Impact of Offshore Wind Farm Development on the Central Coast
9
Table E3 provides a breakdown of the regional economic benefit to San Luis Obispo County in terms of average wages employee compensation and total output resulting from direct project spending indirect activity stimulated through supply-chain development and induced economic activity from employee spending Employee compensation includes wages and fringe benefits paid for by employers
Table E4 compares the annual average economic benefit from operating a mature 3 GW vs 7 GW field of OSW farms These values are based on a scenario of perpetual lease renewal in which OSW turbines are floated back to the specialized wind port for recommissioning at the end of each lease followed by redeployment of OSW turbines for subsequent use The values are based on a perpetual OampM period that begins on the date of final installation of the field in a perpetual cycle of maintenance and repair through the end of the service life of each 1 GW OSW farm The annual economic benefit of maintaining a mature field of OSW farms is in addition to the economic benefit from construction of a specialized wind port in Table E1
Table E3 Regional Economic Impact of a 1 GW Wind Farm in San Luis Obispo County
ImpactFull-Time
Equivalent Jobs
Average Job Compensation ($
year)
Employee Compensation
(million $s)Total Output (million $s)
Direct 3490 $88650 $30941 $162674
Indirect 2308 $66076 $15251 $57822
Induced 814 $74884 $6093 $24760
Total Economic Impact 6612 $79076 $52285 $245256
Table E2 Output and Job Creation from a 1 GW Wind Farm with Decommissioning
RegionFull-Time
Equivalent JobsTotal Output (million $s)
San Luis Obispo County 6612 $245256
Santa Barbara County 364 $7766
Monterey County 58 $1189
Rest of California 4333 $116470
California Total 11368 $370681
Economic Impact of Offshore Wind Farm Development on the Central Coast
10
Table E5 compares the annual fiscal benefits from taxes collected at the county and state level from perpetual operation of a mature 3 GW vs 7 GW field of OSW farms Economic benefits are particularly important to San Luis Obispo County given the planned closure of the Diablo Canyon Power Plant (DCPP) The development of OSW farms just beyond sightlines from the Central Coast could be particularly beneficial to San Luis Obispo County by providing jobs in the affiliated green energy sector of the regional economy
Table E5 Summary of Annual Fiscal Benefits from 3 GW vs 7 GW OSW
3 GW Field 7 GW Field
Tax BasisCounty Taxes (million $yr)
State Taxes (million $yr)
County Taxes (million $yr)
State Taxes (million $yr)
Specialized Wind Port
Property Taxes $1700 $2500
OSW Capital Spending $2133 $4978
Transmission Infrastructure
Unitary Taxes $434 $1012
Regional Spending
Corporate Income Tax $170 $421
Personal Income Tax $1826 $5447
Retail Sales Tax $702 $2088
Total $2134 $4831 $3512 $12933
Table E4 Annual Output and Job Creation from Maintaining a 3 GW vs 7 GW Field of OSW Farms in Perpetuity
3 GW Field 7 GW Field
Type of Tax FTE Jobs Output (millions) FTE Jobs Output (millions)
San Luis Obispo County 617 $25454 1389 $68601
Santa Barbara County 33 $795 80 $2114
Monterey County 5 $119 13 $317
Rest of California 443 $13237 1006 $33123
California Total 1098 $39605 2488 $104154
Economic Impact of Offshore Wind Farm Development on the Central Coast
11
Over time economic opportunities can change in ways that are difficult to predict prior to the initial investment As installed wind farm capacity in California increases over time both in Central California as well as other regions it is likely that regional supply chains develop further This would occur through cost-reducing learning effects and potentially even through the creation of a manufacturing industry for floating OSW foundations towers and turbines in California that would allow a greater share of inputs to be locally sourced from producers in the state Coordinated development of OSW in California and elsewhere in the US has the potential to greatly expand the regional economic impact for a given level of capital expenditure
Unlocking Californiarsquos offshore wind energy potential is a case study in the challenges and opportunities involved in the 21st-century clean energy transition
Economic Impact of Offshore Wind Farm Development on the Central Coast
12
SECTION 2
INTRODUCTION
Economic Impact of Offshore Wind Farm Development on the Central Coast
13
1 INTRODUCTION
As the State of California moves toward meeting its ambitious clean energy and climate goals mdash underscored by targets to reduce greenhouse gas (GHG) emissions from 1990 levels by 40 by 2030 and 80 by 2050 and to achieve a zero-carbon renewable electricity mix by 2045 mdash offshore wind (OSW) is poised to provide a substantial contribution With 112 GW of technical offshore wind resource potential along its coastline the OSW energy sector alone is capable of meeting more than 15 times the statersquos annual electricity demand
Californiarsquos current power supply has already started to shift toward renewable zero-carbon sources In 2019 the State of California derived approximately 32 of its electricity from renewable sources (including 12 solar and 10 onshore wind) and 55 GHG-free including 9 nuclear power (16163 GWh) from Diablo Canyon Power Plant (DCPP)3 Yet despite the recent development of commercial solar power in California including four commercial solar plants in San Luis Obispo County the growth of zero-emission electricity supply is not on target to meet Californiarsquos clean energy goals Based on recent emissions inventory data California emitted 424 million metric tons (MMT) of CO2e in 2017 which implies that reducing statewide emissions below the 260 MMT of carbon dioxide equivalent (CO2e) limit by 2030 will require reducing emissions by an average of 13 MMT of CO2e annually nearly double the annual rate of 7 MMT of CO2e achieved over the past decade4
Much of the movement toward clean energy supply will need to take place on Californiarsquos electricity grid On January 28 2021 General Motors Co set an ambitious target to completely phase out gasoline- and diesel-powered vehicles globally by 20355 The movement of large automakers to the electricity grid compounds the findings of recent California Energy Commission (CEC) and California Public Utilities Commission (CPUC) studies that indicate the state will require two to six times more renewable power capacity by 2050 than is installed today to meet its policy goals under AB 32 implying a need for between 100 to 150 GW of new renewable power capacity6
11 RECENT TECHNOLOGICAL ADVANCES MAKE FLOATING OFFSHORE WIND POSSIBLE
Unlike the coastline on the East Coast of the US the ocean floor slopes steeply downward into deep waters off the California coastline requiring the use of floating platforms for OSW Recent advances in floating platform technologies for OSW turbines have greatly reduced the cost of developing floating OSW farms making it possible to build OSW farms to scale in California that rival the generation capacity of fixed platform technologies as used over the past several decades in the shallower waters off the East Coast and Europe Floating wind technology which relies on mooring lines and anchors to tether platforms to the ocean floor has the advantage of allowing offshore wind turbines to be placed further from shore where the wind speeds are generally faster and more consistent allowing greater power generation while limiting sight impacts from shore While the technology for floating OSW has been demonstrated successfully in pilot projects around the world
Economic Impact of Offshore Wind Farm Development on the Central Coast
14
a commercial scale floating offshore wind farm has not yet been deployed in the United States7
The Bureau of Ocean Energy Management (BOEM) recently initiated the leasing process for three potential offshore wind sites in approximately 687832 acres of federal waters off the California coast to be auctioned for commercial OSW production as early as 20228 BOEM identified Call Areas located off the coast of Central California and the northernmost region of the state (Humboldt Bay) Additionally two more sites (Del Norte and Cape Mendocino) were identified in studies by BOEM and the National Renewable Energy Laboratory (NREL) for potential future OSW development Together development of the initial Call Areas identified by BOEM could support approximately 9 GW of offshore wind development up to 7 GW of which is in the OSW planning area on the Central Coast The development of 7 GW of OSW in the Central Coast OSW planning area would provide roughly 11 of the statersquos current electricity needs (30660 GWh out of 277704 GWh in Californiarsquos 2019 energy mix)9
Floating offshore wind technology which is relatively new has already demonstrated impressive capacity factors of over 50 percent roughly twice that of commercial solar10 The capacity factor of OSW is greater than that of commercial solar because OSW can generate electricity 24 hours a day11 and recent engineering studies project that Californiarsquos floating offshore wind turbines could reach capacity factors of over 70 percent of their maximum theoretical output12
12 OUTLOOK FOR OSW IN CALIFORNIA
The development of OSW energy which has not been featured prominently in Californiarsquos resource planning analyses to date offers several distinct advantages over alternative renewable energy sources Unlike commercial-scale solar power and onshore wind where many of the most productive sites in California have already been developed OSW represents a large and highly scalable resource in California that remains largely untapped Although OSW development is subject to siting concerns such as exclusion zones from the Department of Defense and Marine Protected Areas (MPAs) and entails potential impacts to local fisheries marine mammals and ocean shipping lanes the development of OSW remains relatively unimpeded by the property rights concerns associated with developing onshore resources OSW farms can also be located close to coastal load centers and make use of available transmission capacity eliminating the need to install costly transmission lines to deliver electricity to the California grid
Developing OSW technology in California will require significant capital investment In the US total investment in the offshore wind industry is expected to reach $17 billion by 2025 $108 billion by 2030 and $166 billion by 2035 roughly two-thirds of which will go to the construction industry 25 to the turbine OampM and associated supply chain with much of the remainder
Investment in the offshore wind industry in the US is expected to reach $17 billion by 2025 $108 billion by 2030 and $166 billion by 2035
Economic Impact of Offshore Wind Farm Development on the Central Coast
15
allocated to the transportation industry and ports13
As OSW technology continues to develop it is rapidly becoming cost-competitive with traditional energy sources making floating OSW farms capable of achieving acceptable commercial returns A recent study indicates that including offshore wind in the statersquos energy mix would produce ratepayer savings of approximately $1 to $2 billion by 2040 on a net present value (NPV) basis with floating OSW becoming part of the least-cost portfolio by 203014
Before offshore wind platforms can be constructed suitable ports must be established for staging and assembly of floating turbines onshore Because offshore floating turbines are larger than land-based wind turbines with expected heights exceeding 700 ft turbine blades for OSW are too large to be transported on existing highways or rail lines requiring the assembly of turbines on floating platforms to occur quayside with finished wind turbines delivered by ship directly from the specialized wind port to the offshore site where the moorings and anchors are placed For this reason the specialized wind port is the center for job creation from OSW development Virtually all supply chains that develop to meet the unique requirements of offshore wind originate and terminate at the specialized wind port
This report evaluates the economic impact to San Luis Obispo County and the State of California from the development of one or more OSW farms and the associated port and transmission infrastructure in and around the Morro Bay Call Area The Central California region is ideal for offshore wind development for several reasons
bull Wind speeds are generally strong15 bull The region has existing connections to the statersquos electrical grid bull Much of the coast is outside of national marine sanctuaries where disturbance to the seabed is
prohibitedbull The region is favorably positioned between major population centers with high power demand
in Northern and Southern California
13 ECONOMIC VALUE OF OFFSHORE WIND
When evaluating the regional economic stimulus created by OSW development in San Luis Obispo County it is important to place these values in context with the overall economic value of OSW development for California The overall economic benefit of OSW is captured by transactions between electricity providers and consumers (households and businesses) in Californiarsquos electricity market Consumer benefits in the electricity market are greatest when electricity prices are low Because converting energy to power requires cost the most valuable sources of power in an electricity portfolio are those that deliver electricity to the grid at the lowest cost Indeed for a fixed amount of electricity generation to meet consumer demand economic benefits are maximized when electricity is supplied to consumers at minimum cost
One difficulty in assessing the economic value of renewable energy sources is the distinction between private and social cost The economic value is greatest for an energy portfolio that meets consumer demand at minimum social cost which is the sum of private cost and external cost Private costs reflect actual costs incurred by electricity suppliers for instance the levelized cost
Economic Impact of Offshore Wind Farm Development on the Central Coast
16
of electricity (LCOE) used to evaluate energy investments over time while external costs refer to costs society incurs that are not captured in the electricity market for instance the cost imposed on future generations from GHG emissions today16 For this reason a coal-fired electricity plant may have lower private costs than a floating OSW farm while the wind farm nevertheless has lower social costs a distinction that can be lost when comparing different potential energy sources based strictly on private costs such as the LCOE
Another difficulty in assessing the economic value of renewable energy sources is the distinction between fixed and variable cost In the case of OSW energy substantial fixed costs must be sunk up front to assemble install and connect floating wind turbines to the electricity grid however once this investment has been made the turbines generate electricity at extremely low marginal cost during their entire period of operation A relevant factor that underpins the economic value of a renewable energy project is the LCOE which represents the average cost of electricity generation over the life of the project Because fixed costs are so high to install floating OSW turbines and marginal costs are so low the LCOE for OSW is highly sensitive to the duration in which a wind turbine can be deployed Minimizing the LCOE from an OSW project involves maximizing the time a wind turbine is operating on the water providing electricity at low marginal cost to the grid
Economic values considered in this report focus on the regional economic impact of a given level of project spending on job creation and economic output in San Luis Obispo County Specifically the values calculated in this report provide a mapping from a given amount of direct investment in capital and labor in the county to the economic output and jobs that result from regional supply chain development and the affiliated increase in sales and output that spill across other regional industries from the spending of workers and business who derive income from the project (ie the economic ldquomultiplierrdquo)
The regional economic benefit to developing OSW farms in San Luis Obispo County represents only the value captured by the regional supply chain for a given amount of direct spending on OSW The proper interpretation of the results is the projected economic value realized by San Luis Obispo County from a given level of project spending (private cost) rather than the overall economic benefit that results from minimizing the social costs of electricity generation
To understand this distinction consider the effect of increasing the distance between OSW farms off the coast of Central California and the specialized wind port that serves them As the distance increases between the OSW farms and the specialized wind port the LCOE rises due to increased transportation and logistical costs of wind turbine installation and repair reducing time on the water for wind turbines to operate and resulting in higher electricity prices The overall economic value of the OSW project decreases over distance from the specialized wind port compounded by an increase in the external costs of carbon emissions in the transportation sector However because private costs are higher for OSW projects that involve greater distances to the specialized wind port locating OSW farms farther away from the port raises the economic value of the project to the regional economy for instance by adding jobs in the water transportation industry Put differently the economic value to the regional economy will appear larger as the distance increases between the OSW farms and the port whereas the overall economic value of the OSW project is larger when OSW
Economic Impact of Offshore Wind Farm Development on the Central Coast
17
farms are situated in closer proximity to the specialized wind ports
While developing projects with lower LCOE and lower external costs from pollution in the transportation sector provide the greatest overall economic value projects with higher LCOE provide greater stimulus to the regional economy Thus the proper interpretation of the regional economic values calculated in this report are the impacts to San Luis Obispo County from a fixed level of project spending
01 Wind speeds are generally strong
02 The region has existing connections to the statersquos electrical grid
03 Much of the coast is outside of national marine sanctuaries where disturbance to the seabed is prohibited
04 The region is favorably positioned between major population centers with high power demand in Northern and Southern California
THE CENTRAL CALIFORNIA REGION IS IDEAL FOR OFFSHORE WIND
DEVELOPMENT FOR SEVERAL REASONS
Economic Impact of Offshore Wind Farm Development on the Central Coast
18
SECTION 2
INDUSTRY BACKGROUND AND REQUIREMENTS
Economic Impact of Offshore Wind Farm Development on the Central Coast
19
2 INDUSTRY BACKGROUND AND REQUIREMENTS
Interest is growing for the development of OSW in California as large-scale adoption of renewable energy is needed to substitute for fossil fuel-generated electricity under the statersquos ambitious climate goals
Along the coastline of California the ocean floor slopes steeply downward into deep waters requiring the use of floating platforms for OSW as opposed to platforms fixed to the ocean floor like those currently used in shallower waters along the East Coast Recent advances in floating platform technologies have greatly reduced the cost of developing floating OSW farms making it possible to build OSW to scale in California Floating OSW farms have the potential to provide California with a reliable source of renewable energy that can deliver electricity to Californiarsquos homes and business during times of peak energy demand while operating largely at distances beyond the sightlines of coastal property (See Figure 21)
According to NREL Californiarsquos offshore technical resource capacity is about 112 GW17 BOEM has initiated plans to develop OSW power off the coast of California in a recent call for information from companies interested in purchasing commercial wind energy leases in federal waters off the coast of Central and Northern California Specifically the Call Areas for BOEM identify three potential OSW sites off the coast of California Humboldt Bay Morro Bay and Diablo Canyon The Central California Call Area offers a combined electricity generation capacity of 7 GW for OSW
Developing OSW energy on the Central Coast to its full potential will require cooperation from the US Department of Defense (DOD) Following the announcement of the BOEM Call Areas in 2018 DOD assessments found OSW development in the region to be incompatible with the wide array of critical DOD operations citing significant mission activities in the Diablo Canyon Call Area18
Figure 21 Schematic of a Floating Offshore Wind Farm
Source BOEM California Offshore Renewable Energy Fact Sheet February 22 2017
Economic Impact of Offshore Wind Farm Development on the Central Coast
20
Subsequently a group comprised of DOD BOEM NOAAs Office of National Marine Sanctuaries Congressman Carbajal and Congressman Panetta has focused on expanding the OSW planning area by considering potential development areas proximate to and within the Morro Bay Call Area that may be compatible with DOD operations While the Diablo Canyon Call Area may not be developed due to other ocean use and environmental conflicts there is sufficient sea space in and around the Morro Bay Call Area to support 7 GW of OSW
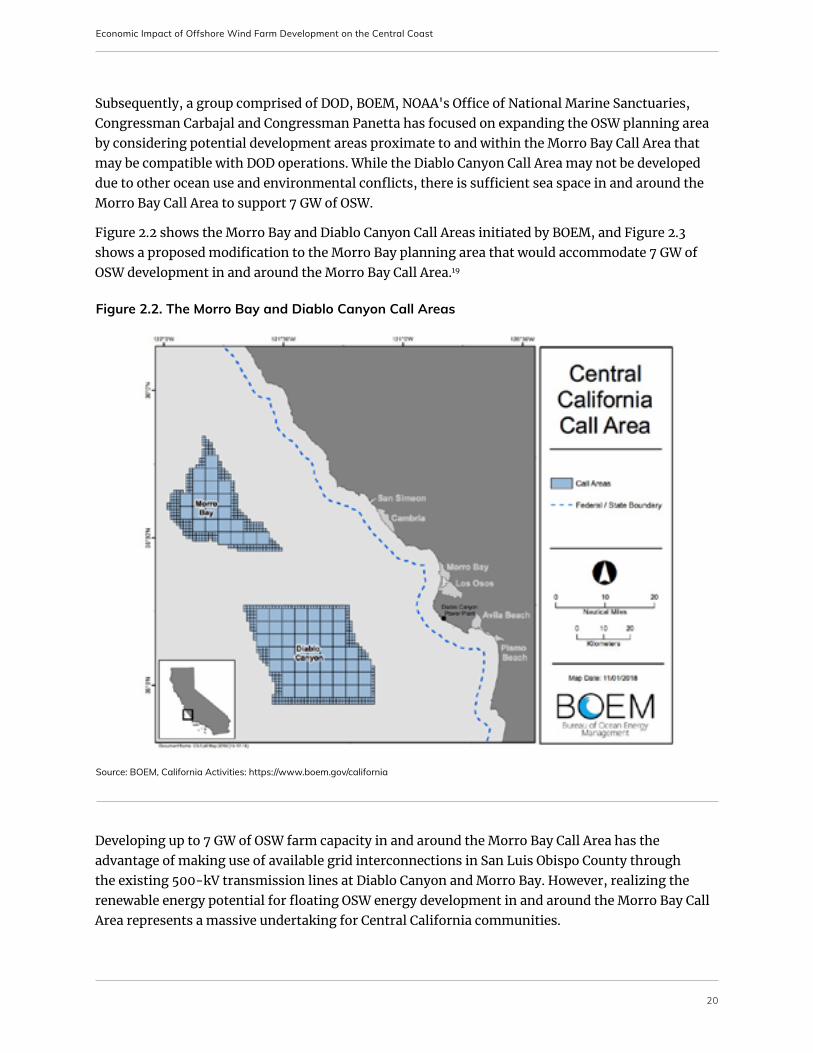
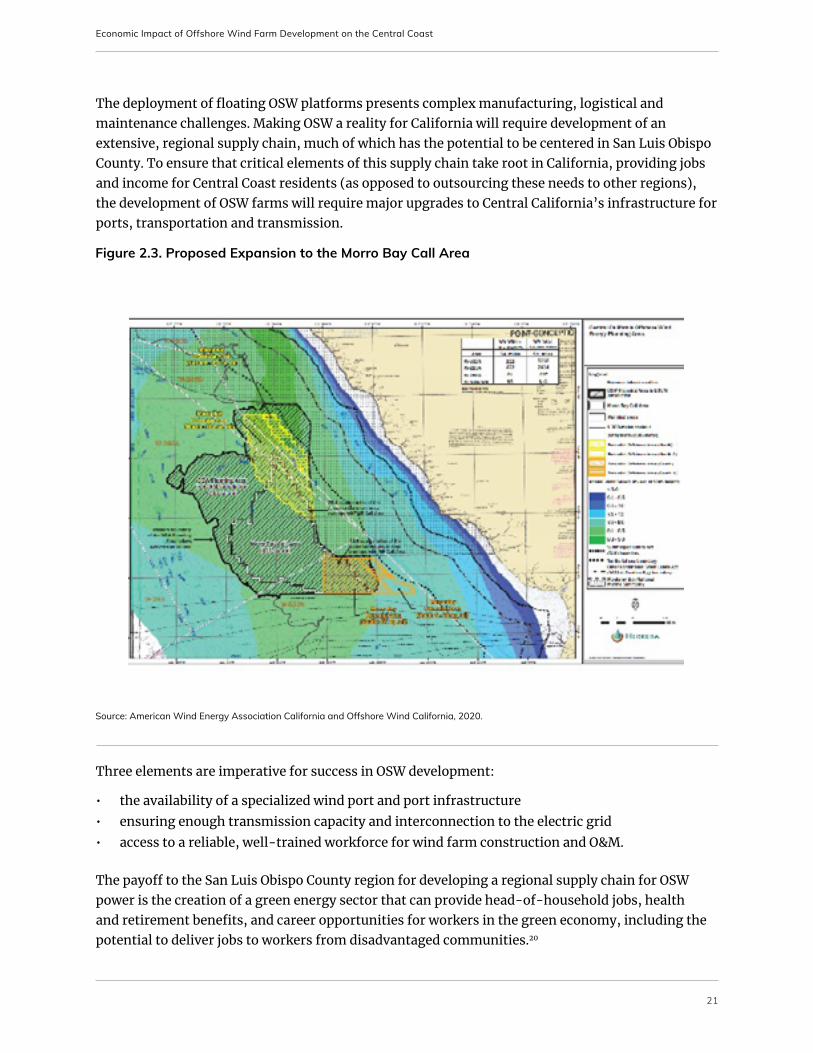
Figure 22 shows the Morro Bay and Diablo Canyon Call Areas initiated by BOEM and Figure 23 shows a proposed modification to the Morro Bay planning area that would accommodate 7 GW of OSW development in and around the Morro Bay Call Area19
Developing up to 7 GW of OSW farm capacity in and around the Morro Bay Call Area has the advantage of making use of available grid interconnections in San Luis Obispo County through the existing 500-kV transmission lines at Diablo Canyon and Morro Bay However realizing the renewable energy potential for floating OSW energy development in and around the Morro Bay Call Area represents a massive undertaking for Central California communities
Figure 22 The Morro Bay and Diablo Canyon Call Areas
Source BOEM California Activities httpswwwboemgovcalifornia
Economic Impact of Offshore Wind Farm Development on the Central Coast
21
The deployment of floating OSW platforms presents complex manufacturing logistical and maintenance challenges Making OSW a reality for California will require development of an extensive regional supply chain much of which has the potential to be centered in San Luis Obispo County To ensure that critical elements of this supply chain take root in California providing jobs and income for Central Coast residents (as opposed to outsourcing these needs to other regions) the development of OSW farms will require major upgrades to Central Californiarsquos infrastructure for ports transportation and transmission
Three elements are imperative for success in OSW development
bull the availability of a specialized wind port and port infrastructurebull ensuring enough transmission capacity and interconnection to the electric gridbull access to a reliable well-trained workforce for wind farm construction and OampM
The payoff to the San Luis Obispo County region for developing a regional supply chain for OSW power is the creation of a green energy sector that can provide head-of-household jobs health and retirement benefits and career opportunities for workers in the green economy including the potential to deliver jobs to workers from disadvantaged communities20
Figure 23 Proposed Expansion to the Morro Bay Call Area
Source American Wind Energy Association California and Offshore Wind California 2020
Economic Impact of Offshore Wind Farm Development on the Central Coast
22
01 The availability of a regional port and port infrastructure
02 Ensuring enough transmission capacity and interconnection to the electric grid
03 Access to a reliable well-trained workforce for wind farm construction and OampM
THREE ELEMENTS ARE IMPERATIVE FOR SUCCESS IN OSW
DEVELOPMENT
The payoff to the San Luis Obispo County region for developing a regional supply chain for OSW power is the creation of a green energy sector that can provide head-of-household jobs health and retirement benefits and career opportunities for workers in the green economy including the potential to deliver jobs to workers from disadvantaged communities
Economic Impact of Offshore Wind Farm Development on the Central Coast
23
21 TECHNOLOGY DESCRIPTION
California differs from the Northeast US in that its deep coastal waters require a different type of offshore wind technology floating platforms for wind turbines Floating platform technology for OSW has been successfully demonstrated in multiple jurisdictions worldwide with larger-scale commercial projects being planned and contracted for deployment in the near future While the cost of floating offshore wind today remains higher than the fixed-bottom offshore wind that prevails on the East Coast the technology is now well understood and the cost of OSW power is expected to decline rapidly with the scale of deployment as commercialization continues
Each floating offshore wind system consists of a commercially available floating support structure and a large offshore wind turbine generator The proposed plant located approximately 45 km offshore is expected to have between 70 and 100 floating windmills
Floating OSW technology requires no piling making it well-suited for deep and variable seabed conditions Each floating windmill is attached by anchor to the sea floor as seen in Figure 24
Floating OSW technology has other benefits over fixed OSW foundations as well Floating wind turbines can be larger anchored in deeper water towed back to shore for major repairs and upgrades and safer for ground risk shore-side assembly and deployment further offshore compared to fixed OSW foundations22
There are four basic components of an OSW turbine the tower nacelle hub and blades These components (OSW turbines to towers and floating platforms) are all delivered by marine vessels for final assembly in bays within the specialized wind port Before any components are attached to
Figure 24 Floating OSW
Source Lou Thomas and Wu (2019)21
Economic Impact of Offshore Wind Farm Development on the Central Coast
24
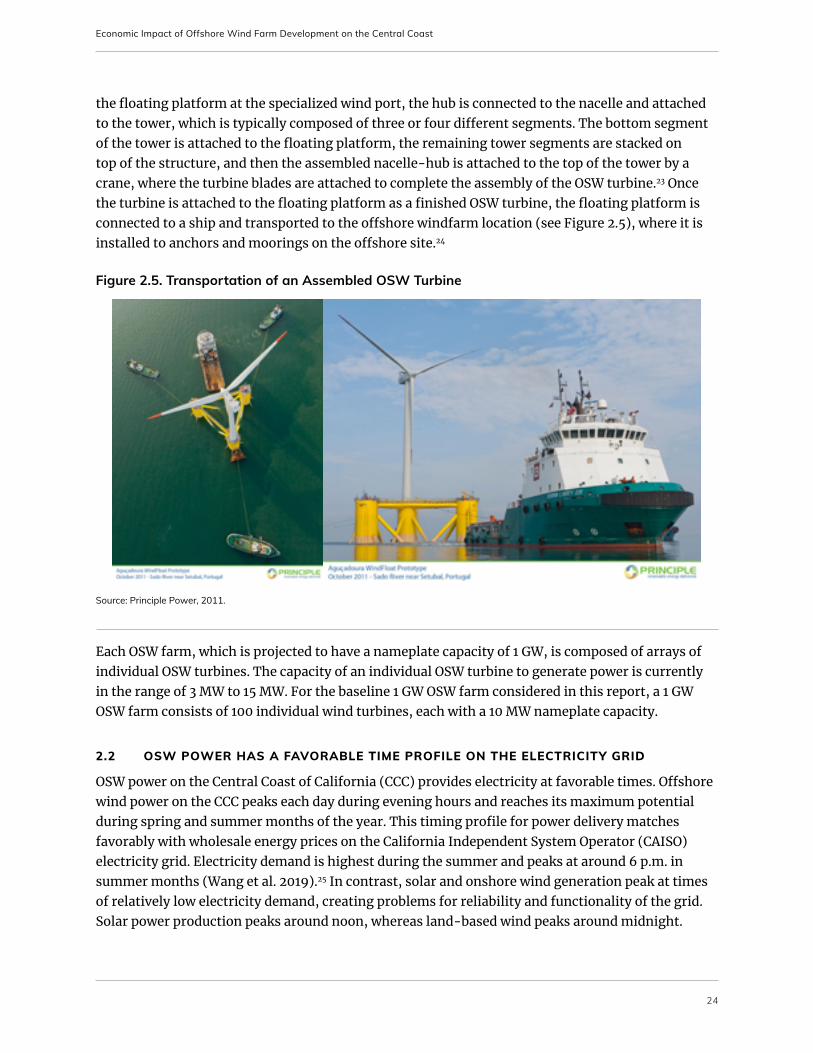
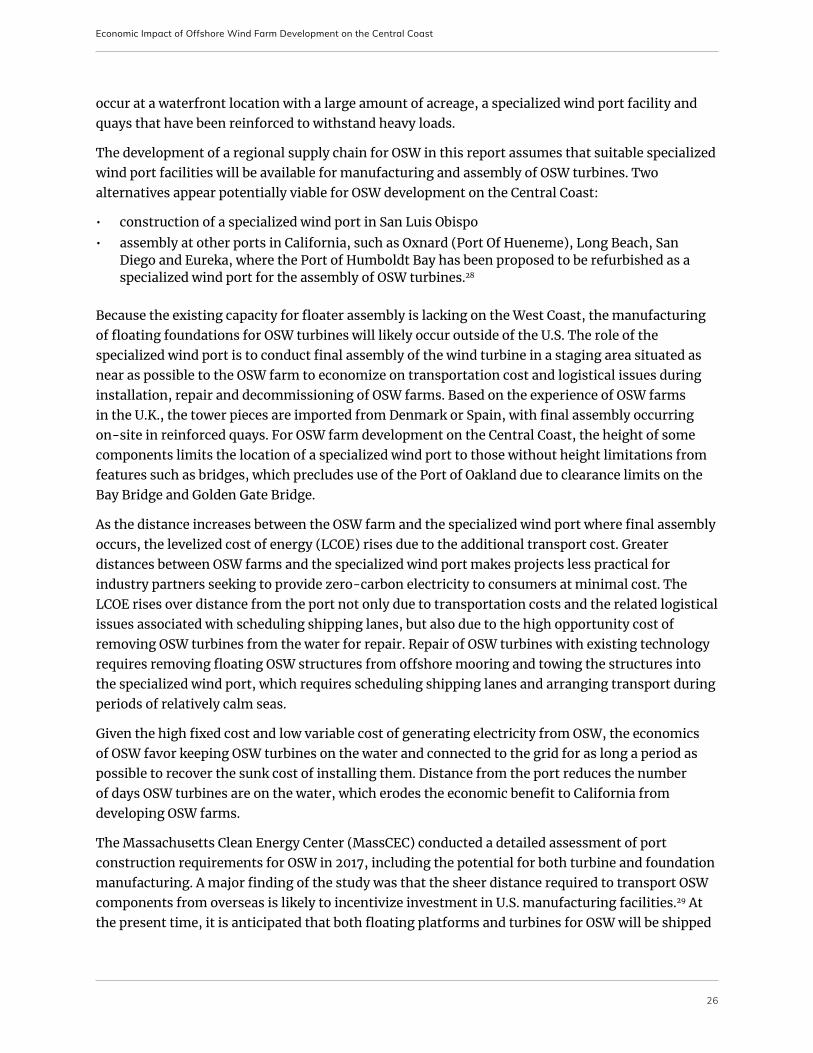
the floating platform at the specialized wind port the hub is connected to the nacelle and attached to the tower which is typically composed of three or four different segments The bottom segment of the tower is attached to the floating platform the remaining tower segments are stacked on top of the structure and then the assembled nacelle-hub is attached to the top of the tower by a crane where the turbine blades are attached to complete the assembly of the OSW turbine23 Once the turbine is attached to the floating platform as a finished OSW turbine the floating platform is connected to a ship and transported to the offshore windfarm location (see Figure 25) where it is installed to anchors and moorings on the offshore site24
Each OSW farm which is projected to have a nameplate capacity of 1 GW is composed of arrays of individual OSW turbines The capacity of an individual OSW turbine to generate power is currently in the range of 3 MW to 15 MW For the baseline 1 GW OSW farm considered in this report a 1 GW OSW farm consists of 100 individual wind turbines each with a 10 MW nameplate capacity
22 OSW POWER HAS A FAVORABLE TIME PROFILE ON THE ELECTRICITY GRID
OSW power on the Central Coast of California (CCC) provides electricity at favorable times Offshore wind power on the CCC peaks each day during evening hours and reaches its maximum potential during spring and summer months of the year This timing profile for power delivery matches favorably with wholesale energy prices on the California Independent System Operator (CAISO) electricity grid Electricity demand is highest during the summer and peaks at around 6 pm in summer months (Wang et al 2019)25 In contrast solar and onshore wind generation peak at times of relatively low electricity demand creating problems for reliability and functionality of the grid Solar power production peaks around noon whereas land-based wind peaks around midnight
Figure 25 Transportation of an Assembled OSW Turbine
Source Principle Power 2011
Economic Impact of Offshore Wind Farm Development on the Central Coast
25
The timing of peak offshore wind power production aligns well in a portfolio of energy sources that provide peak power at different times Developing a reliable electricity portfolio by combining renewable sources smooths out deliveries on the grid relaxing supply constraints in a system with limited storage capability26
Combining OSW with onshore wind and solar power results in a more reliable delivery profile for renewable energy that better matches with electricity demand Superior matching displaces reliance on carbon-intensive natural gas (ldquopeakerrdquo) plants during evening hours and as fossil-fuel based electricity sources are phased out over time in California reduces reliance on costly grid-scale lithium-ion battery storage
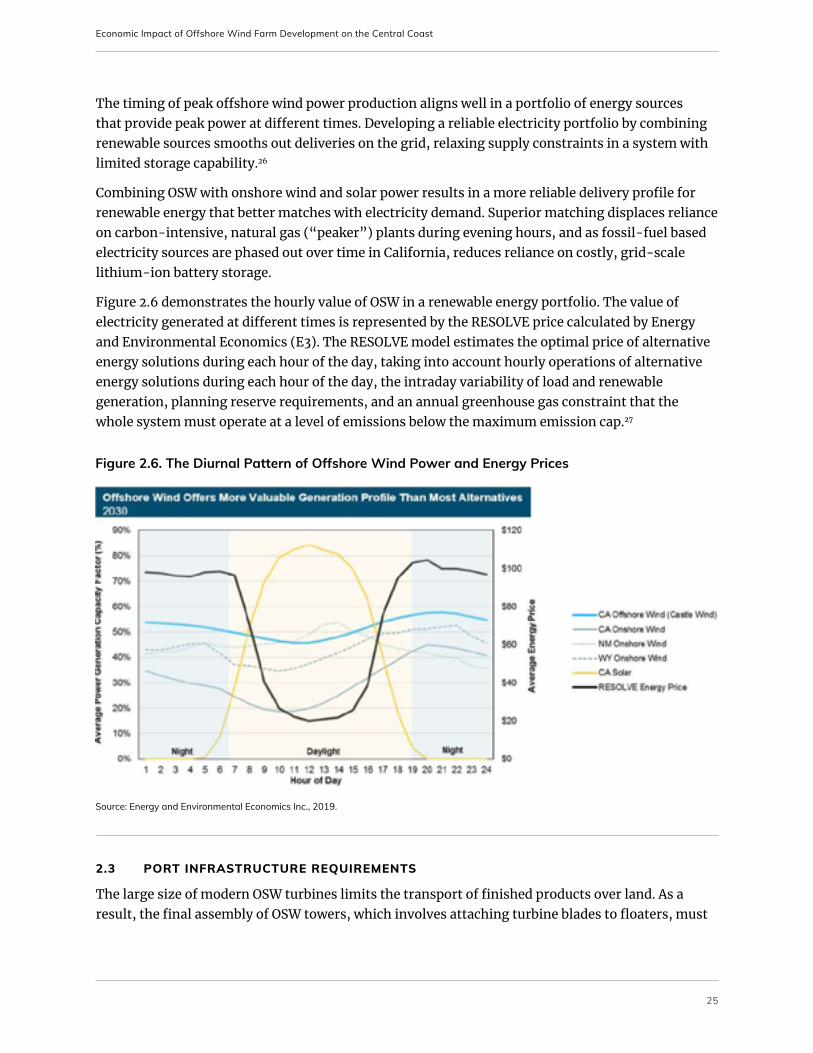
Figure 26 demonstrates the hourly value of OSW in a renewable energy portfolio The value of electricity generated at different times is represented by the RESOLVE price calculated by Energy and Environmental Economics (E3) The RESOLVE model estimates the optimal price of alternative energy solutions during each hour of the day taking into account hourly operations of alternative energy solutions during each hour of the day the intraday variability of load and renewable generation planning reserve requirements and an annual greenhouse gas constraint that the whole system must operate at a level of emissions below the maximum emission cap27
23 PORT INFRASTRUCTURE REQUIREMENTS
The large size of modern OSW turbines limits the transport of finished products over land As a result the final assembly of OSW towers which involves attaching turbine blades to floaters must
Figure 26 The Diurnal Pattern of Offshore Wind Power and Energy Prices
Source Energy and Environmental Economics Inc 2019
Economic Impact of Offshore Wind Farm Development on the Central Coast
26
occur at a waterfront location with a large amount of acreage a specialized wind port facility and quays that have been reinforced to withstand heavy loads
The development of a regional supply chain for OSW in this report assumes that suitable specialized wind port facilities will be available for manufacturing and assembly of OSW turbines Two alternatives appear potentially viable for OSW development on the Central Coast
bull construction of a specialized wind port in San Luis Obispobull assembly at other ports in California such as Oxnard (Port Of Hueneme) Long Beach San
Diego and Eureka where the Port of Humboldt Bay has been proposed to be refurbished as a specialized wind port for the assembly of OSW turbines28
Because the existing capacity for floater assembly is lacking on the West Coast the manufacturing of floating foundations for OSW turbines will likely occur outside of the US The role of the specialized wind port is to conduct final assembly of the wind turbine in a staging area situated as near as possible to the OSW farm to economize on transportation cost and logistical issues during installation repair and decommissioning of OSW farms Based on the experience of OSW farms in the UK the tower pieces are imported from Denmark or Spain with final assembly occurring on-site in reinforced quays For OSW farm development on the Central Coast the height of some components limits the location of a specialized wind port to those without height limitations from features such as bridges which precludes use of the Port of Oakland due to clearance limits on the Bay Bridge and Golden Gate Bridge
As the distance increases between the OSW farm and the specialized wind port where final assembly occurs the levelized cost of energy (LCOE) rises due to the additional transport cost Greater distances between OSW farms and the specialized wind port makes projects less practical for industry partners seeking to provide zero-carbon electricity to consumers at minimal cost The LCOE rises over distance from the port not only due to transportation costs and the related logistical issues associated with scheduling shipping lanes but also due to the high opportunity cost of removing OSW turbines from the water for repair Repair of OSW turbines with existing technology requires removing floating OSW structures from offshore mooring and towing the structures into the specialized wind port which requires scheduling shipping lanes and arranging transport during periods of relatively calm seas
Given the high fixed cost and low variable cost of generating electricity from OSW the economics of OSW favor keeping OSW turbines on the water and connected to the grid for as long a period as possible to recover the sunk cost of installing them Distance from the port reduces the number of days OSW turbines are on the water which erodes the economic benefit to California from developing OSW farms
The Massachusetts Clean Energy Center (MassCEC) conducted a detailed assessment of port construction requirements for OSW in 2017 including the potential for both turbine and foundation manufacturing A major finding of the study was that the sheer distance required to transport OSW components from overseas is likely to incentivize investment in US manufacturing facilities29 At the present time it is anticipated that both floating platforms and turbines for OSW will be shipped
Economic Impact of Offshore Wind Farm Development on the Central Coast
27
to California from overseas likely from South Korea or China then received at a specialized wind port for final assembly and installation on an OSW farm
The specialized wind port where assembly occurs must have protected waters and no overhead obstruction for fully assembled turbines to be towed out standing to the offshore site (see Figure 27) The sheer scale of OSW turbines imposes land requirements for manufacturing to take place in the specialized wind port Providing throughput of 500 MW per year of OSW at the port with the 10-15 MW turbines available today will require about 50 acres of land for movement storage and assembly
In 2016 BOEM commissioned a study on the suitability of various California ports for OSW assembly The study identified Port Of Hueneme as the most suitable existing port for OSW assembly followed by Long Beach and San Diego30 However as Collier (2017) reports all of the recommended ports suitable for OSW assembly are constrained by available land adjacent to the port that would be necessary for manufacturing31 In the case of Port Of Hueneme land constraints limit the ability of the port to take on new manufacturing without making use of land on the existing Navy yard and logistical problems arranging transportation through the Santa Barbara Channel hamper its ability to serve as a specialized wind port for multiple large-scale OSW farms off the Central Coast
Apart from making use of existing ports another possibility is to develop one or more specialized ports for assembly of OSW turbines in California Humboldt Bay in Eureka has a deep-water harbor
Figure 27 Turbine Assembly and Assembled Turbine in Port
Source Principle Power 2011
Economic Impact of Offshore Wind Farm Development on the Central Coast
28
and vast expanses of vacant industrial land that can be developed for OSW turbine (and even floater) assembly however the use of Humboldt Bay for OSW development faces major logistical challenges for land transport and the region lacks grid interconnection as a hub for OSW In contrast the Central California area offers reliable grid interconnection at Morro Bay Power Plant (MBPP) and Diablo Canyon Power Plant (DCPP) but lacks a deep-water port
While it may be possible to serve floating OSW farms in Central California from Port Of Hueneme or an expanded port facility in Humboldt Bay the economic practicality of installing and maintaining OSW farms from distant ports will require a reliability study Given the need to maintain OSW turbines on the water and keep them connected to the grid to recover the significant fixed costs of OSW development further study is needed to model the ability to service OSW farms from these more distant ports The economic viability of serving floating OSW farms from distant ports depends on the repair cycle for OSW turbines including the probability that failed systems can be scheduled for service quickly under port capacity logistic and weather constraints
DCPP decommissioning makes available a potentially suitable site to develop a specialized port facility for OSW The benefits of developing a specialized wind port for OSW on the DCPP property include
bull site availabilitybull potential for brownfield developmentbull a local revenue source from port fees and land improvementsbull reduced accident risk from the proposed DCPP decommissioning
A specialized wind port at DCPP would facilitate removal of DCPP decommissioning material by sea instead of by road A recent UCLA Transportation Risk Analysis finds that barging involves lower transportation risk (ie accidents injuries fatalities) than trucking and rail transport during the period of DCPP decommissioning Specifically combining barge transport for the initial leg of the route with trucking and rail for subsequent legs reduces fatality risks by over 40 percent and injury risk by 32 percent32
In terms of the present study the center for job creation and regional economic stimulus from OSW is at the ports A port facility provides a coordination point in the supply chain for manufacturing assembly transportation and offshore installation of OSW turbines as well as a maintenance yard for periodic repair and ultimately for disassembly and decommissioning During the 25-year operating period of the OSW farm the port provides facilities for turbine repair stimulating the regional supply chain for manufactured components and support for OampM staff Some turbine components can be transported by land which creates incentives for regional supply chain development for a wide range of industrial partsrsquo manufacturers in California and even nationwide However because the sheer size of offshore turbines is so large that they must be transported by water and because connecting the blades to tower sections and floating foundations requires final assembly to take place in reinforced quays the regional supply chains for OSW originate and terminate at the port
Economic Impact of Offshore Wind Farm Development on the Central Coast
29
24 TRANSMISSION INFRASTRUCTURE REQUIREMENTS
Compared with other renewable technologies OSW delivers power directly to coastal load centers where electricity is needed most Much of the existing transmission infrastructure in California was developed during the time of coastal power plants which now have been either decommissioned or slated for retirement The San Onofre Nuclear Generating Station was shut down in 2013 and is currently being decommissioned
In San Luis Obispo County the 650 MW Morro Bay Power Plant (MBPP) closed in 2014 leaving behind valuable transmission infrastructure The retirement of the Diablo Canyon Power Plant (DCPP) in 2025 which has a nameplate capacity of 2256 MW and generated 16163 GWh in 2019 for the California electricity grid33 will free up an additional 6 GW of transmission capacity Utilizing the combined 7 GW transmission capacity at DCPP and MBPP as interconnection points for OSW power reduces the cost of providing electricity on the grid
The existing PGampE transmission infrastructure that connects DCPP and MBPP to the wholesale electricity grid represents a highly valuable economic asset that can be repositioned to receive electricity generated from OSW in Central California The current DCPP transmission infrastructure is comprised of three 500-kilovolt (kV) high voltage direct current transmission lines that will become available for alternative use after closure of DCPP in 2025 The high cost of installing new electricity transmission lines creates an economic opportunity in San Luis Obispo County to repurpose the existing infrastructure for electricity transmission from OSW
For comparison development of a Northern California Call Area specialized wind port in Humboldt Bay will require new electricity transmission infrastructure to connect OSW power generation to the Bay Area with 500 kV transmission lines The estimated cost of installing transmission infrastructure to convey electricity to the grid for the more limited 1836 GW OSW development planned in the region is in the range of $17 billion to $3 billion depending on overland or subsea transmission options34 These costs are roughly in line with the projected cost of other electricity transmission projects in the US For example the projected construction cost for a single 500 kV direct current transmission line to deliver up to 3 GW of energy from Wyoming to the Eldorado Valley in Nevada was $35 billion in April 2013 an average cost of $42 million per mile over the length of the proposed 835-mile transmission line35 The existing transmission structure connecting DCPP to the electricity grid already has three 500 kV direct current transmission lines in place
The existing PGampE transmission infrastructure that connects DCPP and MBPP to the wholesale electricity grid represents a highly valuable economic asset
Economic Impact of Offshore Wind Farm Development on the Central Coast
30
25 REGIONAL SUPPLY CHAIN DEVELOPMENT
The ability of San Luis Obispo County to support the development of an OSW supply chain will greatly affect the regional economic impact of OSW development Simply put the economic impacts of OSW are larger for the region when the OSW industry derives a greater share of employment from the region as local workers who receive paychecks from OSW projects in turn spend their dollars at local businesses in the community
The establishment of a California-based OSW supply chain is an important factor in maximizing economic values derived in the State and San Luis Obispo County regions Underpinning the need for regional supply chain development are the logistics for OSW development which involves the delivery of the extremely large component parts required for turbine assembly into specialized wind ports Due to the significant costs of long-distance ocean transit the central hub for supply chain development will occur around the specialized wind port where OSW turbines are assembled36
In California the initial development of OSW projects is likely to depend on floating foundations imported from abroad with development of a regional supply chain needed for turbine assembly and for smaller machine components that can be manufactured domestically For example the foundations for California projects are likely to be manufactured in China South Korea or Japan due to past investment in developing offshore wind manufacturing capacity with a regional supply chain needed only for the final assembly of turbines that will take place in regional California ports According to a recent UC Berkeley study about 60 percent of all equipment in US wind farms is currently manufactured domestically with equipment suppliers such as GE Siemens and Vestas having manufacturing facilities in South Carolina Iowa and Kansas and Colorado respectively while generators are sourced from Europe or Asia37
In East Asia and Europe governments and wind turbine manufacturers have worked aggressively in recent years to develop complete supply chains for OSW including factories and other facilities for manufacturing turbines blades towers and floating foundations in high-tech clusters developed in specialized wind ports Several states on the East Coast including Connecticut Massachusetts Rhode Island Maryland and South Carolina have taken steps in industrial planning to create manufacturing hubs for OSW although the West Coast has lagged behind in light of the only recent advances in floating OSW technology over fixed platform technologies that can be used in the relatively shallow waters along the East Coast
Deploying commercial-scale floating wind farms will require collaboration between a wide range of occupations including skilled workers (pile drivers divers millwrights plumbers pipefitters welders cutters solderers brazers carpenters crane operators electrical technicians health and safety specialists) engineers (electrical environmental mechanical marine research subsea structure design) various dock and marine laborers vessel crews plant managers sales representatives lawyers and administrative marketing and communications professionals
At least in the initial phases of OSW development in California OSW foundations and wind turbines are likely to be transported from manufacturing facilities in Pacific Rim countries to one or more specialized wind port facilities in California where wind turbines will be attached to floaters and assembled in quays then barged to offshore sites to be anchored and connected to the electrical
Economic Impact of Offshore Wind Farm Development on the Central Coast
31
grid Once the turbines are installed and running employment in the industry will then transition to an operations and maintenance (OampM) phase that will create additional jobs for regular inspection and repair OampM jobs will largely be composed of environmental specialists vessel crews and engineers augmented by skilled workers crane operators and installation workers at the port facility during times when repair and maintenance is needed
Over a longer horizon it is possible that OSW investment in specialized wind ports for assembly of commercial-scale floating wind farms leads to development of expertise in building floating foundations A regional manufacturing facility for assembling floating OSW foundations would greatly reduce transportation and logistical costs However the analysis in this report does not consider the economic value of foundation manufacturing in California because intermediate term options exist to economize on shipping costs by developing this manufacturing expertise elsewhere on the West Coast for instance the Port of Seattle
Several factors affect the level of regional supply chain development for assembling OSW turbines in San Luis Obispo County
bull the existing industrial basebull local content requirementsbull skills of the workforcebull the timing of development
The existing industrial base in the region is important for the ability to source electrical components and other aspects of turbine assembly from local suppliers in California In the case of OSW the project would build on the existing industrial base in the green energy sector of San Luis Obispo County and neighboring Monterey County creating synergies among small businesses construction and electrical workers involved in the construction and operation of the commercial solar farms in these counties providing an immediate source of labor and electrical components that can transition to servicing OSW farms Santa Barbara County has existing workers with experience operating on offshore oil and gas platforms which facilitates the transition of workers in the region to new employment opportunities in the offshore installation component of the OSW industry such as setting anchors and moorings and offshore turbine installation
Local content requirements and government incentives can also be used to stimulate development of a regional supply chain for OSW Under a local content requirement agreements can specify that a minimum share of local employment be maintained For fabricated components that can be locally sourced government investment and financial incentives can accelerate the pace of regional supply chain development While there are legal restrictions to imposing local procurement and hiring requirements in California under the Commerce Clause of the US Constitution there are nevertheless numerous policy tools available to increase local hiring For example Community Benefits Agreements (CBA) and Community Workforce Agreements (CWA) can be used by developers for infrastructure projects such as port construction and improvement The use of local business enterprise (LBE) and disadvantaged business enterprise (DBE) provisions can also result in increased local procurement and hiring38
Economic Impact of Offshore Wind Farm Development on the Central Coast
32
The relevant skills of the local workforce are also important for development of the regional supply chain for OSW San Luis Obispo County is relatively small in terms of population but offers proportioned access for its size to a skilled workforce of construction and electrical workers both due to the recent construction of commercial solar plants in the California Valley and active commercial and residential real estate sectors The region also has businesses engaged in fiberglass manufacturing and marine vessel operators that have the skills needed to find employment in the OSW industry in the event that it develops in the county
Finally the size and timing of supply chain development is important For a regional supply chain to develop manufacturers must specialize in providing products that meet the needs of the industry which in turn requires assurance that consistent demand will materialize for these products before permanent employees are hired and sunk costs are incurred to grow the industry In the case of OSW development investment decisions will be facilitated if regional manufacturers capable of providing labor components and technical expertise to OSW farms have a clear expectation for sequential development of 6-7 GW of OSW farms staged over multiple years relative to the case of a single 1 GW wind farm The timing of OSW projects is also important if multiple wind farms enter production in Central California as a steady flow of projects over time provides stronger incentives for regional supply chain development
26 TIMING OF PROPOSED WIND FARM DEVELOPMENT
Staging and coordinated development of OSW is essential For example a single port harbor facility will become overburdened with multiple projects under construction at the same time The maximum throughput for each quay in the port is one 10 MW wind turbine per week and the wind turbine must be moved before work can begin on the subsequent turbine Therefore developers will need to consider multiple facility strategies and secure their options well ahead of time
Figure 28 Wind Turbine Development Timeline
Economic Impact of Offshore Wind Farm Development on the Central Coast
33
Figure 28 shows the timeline for OSW farm development Following a projectrsquos commissioning and turbine assembly phases the operation and maintenance (OampM) period of OSW will also require ports for transportation of personnel and components (for offshore repairs and upgrades) and for receiving OSW turbines towed back to the port for repair
Given the seasonal logistics of installing OSW turbines throughput at the specialized wind port is expected to be approximately 500 MW per year during the assembly period The assembly period considered in this report uses a more conservative time frame of 3 years for each 1 GW OSW farm The Operations amp Maintenance (OampM) period for each 1 GW OSW farm is then 25 years followed by a decommissioning period of 3 years The spending pattern for a single 1 GW OSW farm is punctuated by two spikes in regional employment the first during the 3-year assembly phase of the OSW farm and a subsequent and larger spike during the 3-year decommissioning phase in which OSW turbines are taken back to the port and disassembled
For a specialized wind port to support a 3 GW field of wind farms the assembly period is prolonged from 3 years to 9 years by staging OSW turbine assembly in successive 3-year periods for each 1 GW OSW farms Accordingly for a specialized wind port to support a 7 GW field of OSW farms the assembly period is prolonged from 3 years to 21 years It is possible that this period would be shortened by bringing OSW turbines to the Central Coast from other nearby ports that develop the manufacturing capacity for OSW andor by floating fully assembled structures into place from ports in Asia
After OSW turbines are assembled and installed in the ocean the specialized wind port conducts maintenance and repair operations for up to 7 GW of OSW during the OampM period for the projects At a failure rate of once every 25 years for 10 MW wind turbines the specialized wind port would need to accommodate the repair of approximately 28 wind turbines per year to support a 7 GW field of OSW farms
27 EMPLOYMENT AND OUTPUT DEMOGRAPHICS IN SAN LUIS OBISPO COUNTY
As of 2019 San Luis Obispo County has a population of 283111 175 of whom are under the age of 18 209 over the age of 65 and 592 veterans39 From 2011 to 2016 the San Luis Obispo County population grew 3840
Educational attainment in San Luis Obispo County (70) is above the statewide average (62) and national average (59) Two out of 5 residents in the county have a bachelorrsquos degree or higher San Luis Obispo County is predominantly white (69) with the second largest ethnicity being Hispanic or Latino at 2241
The San Luis Obispo County labor market supports 178476 total jobs In 2019 employment in the county was 208 farm jobs 8469 private nonfarm jobs and 1323 public sector jobs including state and local government employment and the military42
The average earnings level per worker in the county is $56409 which is lower than both the state and national averages of $78217 and $66029 respectively43 Figure 29 compares the income
Economic Impact of Offshore Wind Farm Development on the Central Coast
34
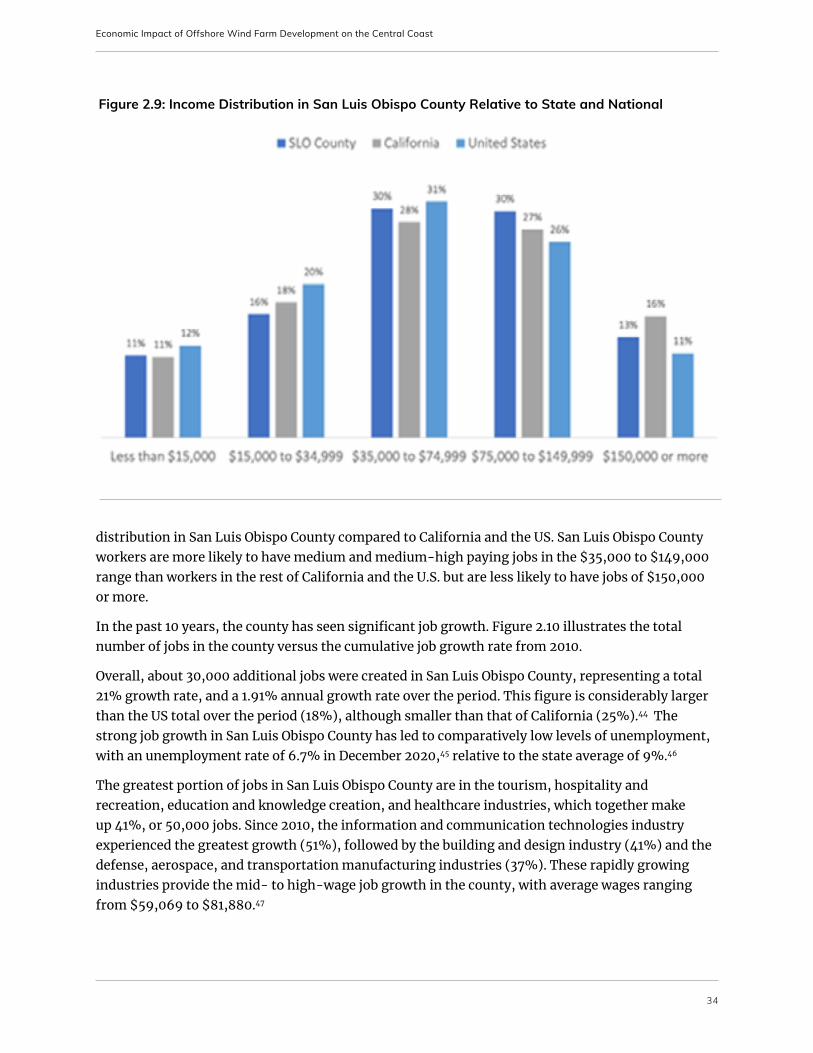
distribution in San Luis Obispo County compared to California and the US San Luis Obispo County workers are more likely to have medium and medium-high paying jobs in the $35000 to $149000 range than workers in the rest of California and the US but are less likely to have jobs of $150000 or more
In the past 10 years the county has seen significant job growth Figure 210 illustrates the total number of jobs in the county versus the cumulative job growth rate from 2010
Overall about 30000 additional jobs were created in San Luis Obispo County representing a total 21 growth rate and a 191 annual growth rate over the period This figure is considerably larger than the US total over the period (18) although smaller than that of California (25)44 The strong job growth in San Luis Obispo County has led to comparatively low levels of unemployment with an unemployment rate of 67 in December 202045 relative to the state average of 946
The greatest portion of jobs in San Luis Obispo County are in the tourism hospitality and recreation education and knowledge creation and healthcare industries which together make up 41 or 50000 jobs Since 2010 the information and communication technologies industry experienced the greatest growth (51) followed by the building and design industry (41) and the defense aerospace and transportation manufacturing industries (37) These rapidly growing industries provide the mid- to high-wage job growth in the county with average wages ranging from $59069 to $8188047
Figure 29 Income Distribution in San Luis Obispo County Relative to State and National
Economic Impact of Offshore Wind Farm Development on the Central Coast
35
Gross domestic product (GDP) in San Luis Obispo County was $191 billion in 2019 with GDP per capita of $6734048 Figure 211 shows the GDP growth rate in San Luis Obispo County over the last decade Over the period of 2010 to 2019 San Luis Obispo County real GDP growth was 2745 exceeding the growth rate in national real GDP of 2239 but lagging behind the real GDP growth rate of 3615 for California over the period49
Figure 210 10 Year Job Growth in San Luis Obispo
Figure 211 GDP Growth Rate in San Luis Obispo County California and the US
Economic Impact of Offshore Wind Farm Development on the Central Coast
36
SECTION 3
METHODS AND SCOPE
Economic Impact of Offshore Wind Farm Development on the Central Coast
37
3 METHODS AND SCOPE
31 SCOPE OF THE STUDY
The regional economic benefits calculated in this report are predicated on the development of a specialized wind port in San Luis Obispo County to provide service for up to 7 GW in OSW capacity in and around the Morro Bay Call Area In the event that a specialized wind port for OSW assembly is not constructed in San Luis Obispo County the regional economic benefit would instead materialize in whichever county provides the specialized wind port
At the State of California level the value of OSW development combined across all counties will be similar to the value reported here for the state-level impact with one important caveat If the specialized wind port is located farther away from the OSW farms than a neighboring county such as Monterey or Santa Barbara mdash for instance if a specialized wind port is developed in Humboldt Bay as a single hub for OSW assembly in California mdash then additional project cost would be required for water transportation (eg labor and fuel) raising direct spending at the more distant specialized wind port relative to the case considered here for a port in San Luis Obispo County The resulting increase in direct project spending would result in greater job creation and larger regional economic benefits for the more distant county in the transportation industry however because the social cost of OSW increases with distance from the specialized wind port both in terms of private costs and external costs incurred during water transportation50 locating the specialized wind port farther from the OSW field results in lower economic benefits to California Therefore using values from regional economic models to make such a comparison would be misleading
This report considers two phases of offshore wind (OSW) development off the Central Coast
1 An initial planning period that involves construction of a specialized wind port in San Luis Obispo County
2 OSW farm development with staged assembly of up to 7 GW capacity of OSW
For both phases the regional economic value captured in San Luis Obispo County is conditional on construction of a specialized wind port in the county either on the DCPP property or elsewhere in the county
If for example a specialized wind port was located on the existing DCPP property the specialized wind port provides a conduit for job creation in San Luis Obispo County The indirect benefits that would occur in the regional economy from the influx of new jobs at the port would extend to other counties in California for instance through supply chain development to vendors contractors and component manufacturers in Santa Barbara County Ventura County Monterey County and Kern County The indirect purchases stimulated in different counties in California is accounted for in the model however because the regional supply chains for OSW projects likely will extend across state borders the development of OSW in Central California will provide additional economic value for neighboring states in a manner that falls outside the lens of the model
Workers employed at a specialized wind port in San Luis Obispo County will spend much of their
Economic Impact of Offshore Wind Farm Development on the Central Coast
38
disposable income making induced purchases such as food retail items and restaurant meals at establishments near their homes The regional economic model matches employment at the specialized wind port to the available workforce in San Luis Obispo County which implicitly assumes that available workers in San Luis Obispo County are employed at the specialized wind port before jobs are offered to workers outside the county Thus the regional economic value for San Luis Obispo County will attribute a greater share of induced spending by workers to establishments in San Luis Obispo County than if these workers commute to work from residences across county lines Given the proximity between DCPP and nearby population centers in Northern Santa Barbara County such as Santa Maria and Orcutt a share of the regional economic value attributed to San Luis Obispo County in this report will materialize in Santa Barbara County for workers commuting across county lines
The model used to calculate regional economic benefits in this report matches workers employed in San Luis Obispo County to the available workforce in San Luis Obispo County Specifically the model assigns jobs in San Luis Obispo to workers in San Luis Obispo if the labor force exists in the county to meet the job requirements and only reaches outside the county for workers when the industry providing the labor service no longer has available workers in the county to perform the task In practice workers from outside the county may outcompete workers in the county for jobs (eg by being willing to take the job for a lower wage or by having superior skills) in a manner that is not accounted for in the regional model To the extent that workers commuting across county lines compete intensively for these jobs the model will over-attribute induced spending of workers to San Luis Obispo County from household purchases that occur in the neighboring counties where commuting workers reside
311 SPECIALIZED WIND PORT
The scope of the analysis encompasses the value of the regional output and employment effect resulting from the development and use of a specialized port in San Luis Obispo County for the assembly maintenance and repair of OSW farms Because a specialized wind port is necessary to receive the regional economic value from OSW development and San Luis Obispo County does not currently have one it is necessary to model the construction of a specialized wind port jointly with the development of large-scale OSW projects in the region
The goal of the present study is to calculate the regional economic benefit to San Luis Obispo County from the development of 3 and 7 GW OSW capacity in and around the Morro Bay Call Area The model does not encompass the full economic value of constructing a specialized wind port in San Luis Obispo County which might be used for the movement of other goods apart from OSW components Therefore this report considers solely the development of a specialized wind port used only for staging the assembly installation and repair of OSW Any additional regional economic value that can be generated from a specialized wind port from importing and exporting goods unrelated to OSW is not included in the report The scope of economic benefits considered in this report is conservative because developing a specialized wind port for OSW involves construction costs for elements such as a breakwater that would in turn economize on the cost of
Economic Impact of Offshore Wind Farm Development on the Central Coast
39
expanding the footprint of a specialized wind port beyond the specialized needs required to create a hub for OSW
Construction of a specialized wind port on the DCPP property occurs in the model over the 5-year period of 2024-2028 Constructing a specialized wind port for OSW will require an estimated 1100 construction jobs per year at a total direct cost in the range of between $17 and $25 billion The analysis considers only the direct job requirement of port construction (1100 workers per year) to be sourced locally as it is currently unclear where the materials used to construct the port such as the breakwater and pilings will be sourced Considering only the direct job requirement for constructing a specialized port for OSW in San Luis Obispo County results in a conservative measure of the regional economic benefit as all construction material required to be purchased for port construction is implicitly assumed to be sourced from locations outside of California The total project cost which is substantially larger than the direct labor cost component of the project is included only to calculate the fiscal benefit of sales and use taxes in Section 5 which implies project spending on imported material is designated as a California sales transaction at the point of delivery to the port
312 DEVELOPMENT OF A REPRESENTATIVE 1 GW OSW FARM
The timeline of a representative 1 GW OSW farm has 4 phases planning amp permitting (7 years) assembly (3 years) operations and maintenance (25 years) and sunsetdecommissioning (3 years)
Figure 31 shows the average labor requirement for a 1 GW OSW farm during each phase of development in the case of a sunset period involving decommissioning of the OSW farm
Figure 31 Average Labor Requirement for a 1 GW OSW Farm over the Life of the Plant
Economic Impact of Offshore Wind Farm Development on the Central Coast
40
The planning phase for the first OSW farm occurs over the period 2022-2028 which coincides with the granting of a lease through a BOEM auction and the development of a specialized wind port in San Luis Obispo County both of which must also occur over this time period to realize the regional economic benefits of OSW
The assembly phase considers a 3-year assembly period for each 1 GW OSW farm starting with the first 1 GW wind farm over the period 2029-2031 While OSW turbine assembly in the specialized wind port can potentially occur at a faster pace for instance 500 MW per year (or 2 years per 1 GW OSW farm) a longer 3-year period is considered for each OSW farm to account for the logistics involved in arranging installation around weather events and conducting repairs for multiple OSW farms The assembly phase will tend to be shorter for the first 1 GW OSW farm than for subsequent wind farms because of the need to maintain space in the specialized wind port for turbine repair For development of a field of 7 GW OSW farms the assembly period involves staging the assembly of each 1 GW OSW in successive 3-year periods so that assembly occurs for a total of 21 years for a total of seven 1 GW OSW farms
The OampM phase for each 1 GW OSW farm consists of an operating life of 25 years (the OampM period) following turbine assembly and installation For the first 1 GW OSW farm the OampM period is 2032-2058 and the OampM period is set back by 3 years for each subsequent 1 GW OSW farm due to the staging of assembly in successive 3-year periods at the port
313 DECOMMISSIONING AND RECOMMISSIONING PROVISIONS FOR A 1 GW OSW FARM
The representative 1 GW OSW farm is decommissioned over a 3-year period coinciding with partial OSW farm operation and partial disassembly as OSW turbines are removed from the farm For the initial 1 GW OSW farm decommissioning occurs over the period 2057-2059 For each 1 GW OSW farm installed thereafter the assembly period is pushed back 3 years by staged operations at the port pushing back the sunset period by 3 years for each subsequent 1 GW OSW farm During the sunsetting period each 1 GW OSW farm comes back to port to be disassembled Current requirements for decommissioning involve a 3-year decommissioning period however given the strong economic incentive to maximize the length of time on the water for individual OSW turbines it is likely by 2059 that the period will be shorter for decommissioning (as well as for redeployment in the case of lease renewal)
Decommissioning occurs for each OSW farm after 25 years of operation and is accomplished two ways in the model
bull decommissioning as required by BOEM lease agreementsbull or recommissioning which involves renewing or replacing the lease agreement to maintain 1
GW OSW on the leased area for a subsequent 25-years of operation
The economic return for maintaining wind turbines on the water once the capital expenditure is sunk suggests that streamlined processes will be developed for decommissioning and replacing OSW farms by the end of the initial BOEM lease period
Economic Impact of Offshore Wind Farm Development on the Central Coast
41
In the case of decommissioning the value of a 7 GW field of OSW farms is reduced by removing OSW turbines from the water at the end of each lease agreement Under recommissioning the benefit of a field of 7 GW OSW farms can be measured in perpetuity (ie as a renewable resource) by considering the annual benefit under an integrative lease process designed to keep wind turbines generating electricity and connected to the grid In the case of recommissioning each 1 GW OSW farm is replaced in a single 3-year period rather than modeling separate decommissioning and assembly periods where one 1 GW OSW farm is decommissioned for 3 years before the next 1 GW OSW farm can be assembled
The design life of the wind turbine generator and the floating substructure that supports it coincides with an expected operating life of 25 years for OSW After the 25-year life of an OSW farm either the farm would need to be replaced or the turbines would need to be refurbished to extend the life of the units for another 25 years Under the recommissioning option each 1 GW OSW farm in the field of 7 GW OSW remains in service for electricity production either by remaining in operation or by being replaced by another in an integrative fashion that handles the logistical challenges Under recommissioning the model economizes on what would otherwise be a 6-year transition period (3 years for decommissioning of the initial OSW farm plus 3 years assembly for installing the replacement 1 GW OSW farm) with a single 3-year period that integrates the decommissioning and assembly phases The decrease in time required to replace a 1 GW OSW farm with another at the end of each lease capitalizes on the economic benefit of maintaining wind turbines generating electricity for the grid during the transition given the availability of existing anchors and moorings and other fixed investments at the offshore site that reduce the deployment time for a subsequent OSW farm
The labor requirement for an integrated recommissioning process is taken to be two times the onshore labor required during the initial assembly period (once for disassembly and again for reassembly) plus the labor required to reinstall each windmill to the existing cables and moorings at the offshore site The use of two times the onshore labor component is consistent with recent experience at the WindFloat prototype in Aguccediladoura Portugal in which wind turbines were brought back to shore and removed from the foundations for repair and then the entire structures were reassembled cleaned repainted and installed back into service at the offshore site The recommissioning scenario results in conservative regional economic value relative to the case of a decommissioning period for each 1 GW OSW farm followed by approval and installation of an entirely new 1 GW OSW project through an uncoordinated process as an orchestrated process economizes on direct project spending by combining the two phases into a single 3-year period
The economic value from the recommissioning scenario is conservative because it assumes replacement at the end of the 25-year operating horizon with an identical 1 GW OSW farm To the extent that turbine technology is superior 30 years from now the economic value of a replacement 1 GW OSW farm will be larger than the value considered here in the recommissioning scenario however much of this benefit will be captured by an improved capacity factor of turbines that deliver electricity at a lower LCOE That is the benefit of supplying electricity at lower cost is received in the electricity market and not something that would necessarily affect the regional
Economic Impact of Offshore Wind Farm Development on the Central Coast
42
supply chain and labor market that are the focus of this report The labor market requirement to install a replacement 1 GW OSW farm is taken to be the same as the labor requirement for the representative 1 GW OSW farm today in terms of the number of employees needed at each stage of the process in Figure 31 above The regional economic value is conservative by assuming that in 30 years there will still not be manufacturing capability for floating offshore platforms and turbines in California
It should also be noted that conveying the electricity produced at each 1 GW OSW farm will require grid connection costs to provide interconnection and transmission to Californiarsquos electricity grid The cost of constructing transmission lines for a field of 7 GW OSW farms will be lower to the extent that the suggested project makes use of the existing 500 kV transmission cables that currently connect DCPP to the electricity grid This makes the Central California region highly attractive for OSW energy development Nevertheless substantial additional expenses will be needed to develop offshore spur lines to connect OSW farms to landfall via undersea cables that extend many miles out to sea which will also require a supporting structure of sub-stations and terminals to connect cables at landfall with the existing onshore interconnection and transmission structure that exists at DCPP
32 METHODS
The regional economic impacts calculated from OSW farm development in Central California reflect the ldquoripple effectrdquo of new jobs and economic output that occurs when direct investments in the offshore wind industry complex lead to expansion in the production of upstream supply-chain inputs plus induced spending as new employee households increase local spending (eg grocery stores auto dealerships and restaurants) It should be noted that economic impacts are different from economic viability or profitability Economic impacts reflect expenditures and the extent to which inputs are locally sourced Higher costs (that would reduce economic viability and profit) in fact lead to larger economic impacts
Over time economic impacts can change As installed wind farm capacity in California increases one might expect not only cost-reducing learning effects but also an increase in the local share of input sourcing due to in-state investment in manufacturing specialized OSW inputs To the extent that this type of specialized investment occurs for instance if the ability to manufacture floating foundations for OSW develops somewhere in California then the regional economic impact of OSW farm development on the Central Coast would be greater for the State of California than is captured here
Regional economic impacts are increased by greater project expenditures as well as by a larger share of inputs that are locally sourced in the region Thus regional economic values differ from the overall economic value of a project because greater project expenditures raise total costs of electricity generation harming economic value while providing for greater regional stimulus The regional economic value of OSW farms is usually limited to direct wind farm capital and operations and maintenance (OampM) costs which are recovered through revenues derived from power purchase agreements Port and transmission infrastructure improvements typically are
Economic Impact of Offshore Wind Farm Development on the Central Coast
43
not included in regional economic values for OSW which is why the regional economic benefit is calculated separately for the construction of a specialized wind port in San Luis Obispo County Port infrastructure investments would likely be made by a terminal operator with costs of port construction recovered through various fees paid by users of terminal facilities to the terminal operator Similarly transmission infrastructure costs would likely be incurred by PGampE or another electricity provider with costs recovered by way of transmission access charges (TACs) paid by regional energy consumers
Regional economic models are based on a set of input-output (I-O) production relationships in the county (and neighboring counties) where the investment occurs Final goods such as wind energy are the outputs of the model which requires a variety of input purchases to be made in a variety of upstream markets (supply-chain effects) to construct and operate the OSW farm Upstream market purchases include labor from different industries and the purchase of intermediate goods (eg manufactured parts such as turbine blades manufactured electrical components and raw materials such as concrete and steel) Some of these inputs can be locally sourced while other inputs must be imported from outside the region as is presently the case for both turbines and floating foundations I-O models use economic data on current workers and component manufacturers in affiliated industries at the county level to create a simplified quantitative depiction of the ability to locally source inputs to meet the output requirements of a project thereby capturing regional economic value
This study utilizes the Regional Economic Models Inc (ldquoREMIrdquo) Policy Insight Plus (ldquoPI+rdquo) model to estimate the current and future economic impact of OSW development on San Luis Obispo County and neighboring counties REMI PI+ is a sophisticated economic modeling tool used by public agencies consulting firms nonprofit organizations and local governments to simulate the economic impact of a variety of public and private capital investments including infrastructure development energy projects and military bases
The REMI PI+ model calculates the regional economic impact of OSW development in San Luis Obispo County using data on the local labor requirement to install operate and decommission a field of 1 GW OSW farms at the specialized wind port The REMI PI+ model is a dynamic I-O model that uses this data to determine the current impact of OSW farm development as well as its forward-looking impact given historical changes in the business cycle and the ability of future workers and industry to migrate to the region The results of the model are reported for each county individually
The model provides output that quantifies the economic impact of a certain area of study and for the sake of this report allows results to be segmented on a county-wide basis into the number of jobs created benefit to county GDP and the general tax implications In construction of the model REMI PI+ uses audited data from public agencies such as the US Bureau of Economic Analysis and the US Census Bureau as well as user inputted data to construct its larger model
The resulting estimated impacts from the REMI PI+ model are segmented into direct indirect and induced impacts Direct impacts are directly related to the operations and growth of the base for example a contractor who is hired to help build infrastructure for port expansion Indirect impacts
Economic Impact of Offshore Wind Farm Development on the Central Coast
44
are values related to economic growth in upstream industries catalyzed by spending at the port on OSW for example a regional asphalt provider hired to provide road access to the specialized wind port While the asphalt providerrsquos job is directly attributable to the needs of the port it has no direct impact on port operations and therefore represents an indirect impact
Induced impacts are ripple effects that occur at all points in the supply chain catalyzed by both direct and indirect impacts For example an induced impact from the road expansion project would be an asphalt quarry that hires additional employees to help service the increased demand for asphalt from the road expansion project to serve the port While those jobs are created by the increased asphalt demand due to the infrastructure project to connect an existing road to the port the new employees hired at the asphalt quarry are working neither directly at the port facility nor indirectly on the paving project making the creation of this job an induced impact The majority of induced impacts in the model arise from food retail and housing purchases by workers employed directly and indirectly by OSW
Most input-output models are static meaning that inflation employment and expenditures for example remain constant over time However this report uses the dynamic impact model built into REMI PI+ to project the estimated economic impact of OSW development over time As this is a dynamic impact model projections will be made based off the assumption of business cycle fluctuations reflecting historical trends Estimates will be reported both for San Luis Obispo County as well as for the State of California
Finally it should be noted that the regional economic benefits calculated here are gross impacts of the OSW project rather than net impacts and as such may overstate actual benefits as an all-or-nothing comparison That is economic impacts to the region not immediately deriving from the construction and operation of an offshore wind facility are omitted in the report even though the use of regional resources to provide inputs for the OSW project claims these resources from other alternative projects the region could pursue For example expenditure on a wind farm in California may displace expenditures on expansion of a commercial solar power plant A net economic impact assessment of the value of OSW in relation to other potential investments in San Luis Obispo County would need to consider the foregone value of displaced economic activity
The economic values calculated using the REMI PI+ model are presented both in terms of (undiscounted) lifetime job and output impacts and in terms of annual average impacts over various phases of project development Undiscounted lifetime job impacts are calculated by multiplying the operational period of the project by the estimated number of annual operational period jobs and then adding them together into a measure of the total full-time equivalent (FTE) jobs created by the project For example a project that provides 100 full-time jobs each year for a 10-year period provides a total economic benefit to the region of 1000 FTE jobs and an annual average impact of 100 full-time jobs per year
Economic Impact of Offshore Wind Farm Development on the Central Coast
45
SECTION 4
RESULTS
Economic Impact of Offshore Wind Farm Development on the Central Coast
46
4 RESULTS
The regional economic benefit to San Luis Obispo County from OSW development is predicated on the ability to serve floating OSW turbines in and around the Morro Bay Call Area from a specialized wind port The specialized wind port serves as a hub for the assembly maintenance repair and eventually the decommissioning of floating OSW turbines
The economic benefits are calculated in this report for an initial period of port construction Port construction involves direct employment of an average of 1100 workers per year for 5 years at a total cost of between $17 billion and $25 billion Much of the material used to construct the port is projected to be sourced from regions outside the county and delivered to the port by marine vessel For the calculation of regional economic benefits the conservative assumption is made that none of the material is sourced from California which implies the regional economic stimulus is driven only by the direct employment of 1100 construction workers in San Luis Obispo County
Construction of the port occurs over the period coinciding with the 7-year planning phase for the first 1 GW OSW farm 2022-2028 Direct employment for port construction is projected to build over the first few years and reach a peak employment at around the midpoint of the port construction phase however a fully developed time schedule for employment is not available at this time
The measures of economic effects considered in this report are
bull Output ndash business sales less the costs of materials and equipment produced outside of California
bull Employment ndash the full-time equivalent jobs provided to California residents
41 PORT CONSTRUCTION IMPACTS
Table 41 shows the regional economic value realized for San Luis Obispo County and the State of California over the 5-year period of port construction Direct construction spending for a specialized wind port results in local stimulus in San Luis Obispo County of $202 billion ($405 million per year for 5 years) and the creation of approximately 11825 full-time equivalent (FTE) jobs (2365 per year for 5 years) Construction of a specialized wind port in San Luis Obispo County also stimulates the economy of neighboring counties providing 234 jobs and $39 million in economic output for Santa Barbara County and 28 jobs and $58 million in economic output
for Monterey County over the 5-year construction period The overall impact in California considering spill-over impacts to other regions in the state is $300 billion ($599 million per year for 5 years) and the creation of 15925 FTE jobs (3185 annually for 5 years)
Port construction spending would result in a stimulus of $202 billion and the creation of approximately 11825 jobs over 5 years
Economic Impact of Offshore Wind Farm Development on the Central Coast
47
It should be noted that the regional economic impact model assigns available workers in San Luis Obispo County to jobs in San Luis Obispo County before considering workers available to take these jobs in other counties Given the construction of a specialized wind port in San Luis Obispo County jobs are provided to workers in San Luis Obispo County that may ultimately be captured by workers in neighboring counties who are able to outcompete workers in the county This is particularly true for Northern Santa Barbara County given the proximity of the Santa Maria metropolitan area to Arroyo Grande in Southern San Luis Obispo County
For comparison a June 2019 analysis by the California Public Utilities Commission found that current decommissioning plans for DCPP will increase annual economic output in the San Luis Obispo County region by $724 million per year for 10 years and will result in the creation of approximately 4934 FTE jobs annually for ten years (Roland-Holst et al 2019)51
Development of a specialized wind port on the DCPP property may also serve to reduce transportation risks (ie accidents injuries fatalities) from DCPP decommissioning as the use of barge transportation making use of the existing breakwater is projected to lower fatality risks by more than 40 percent52 A more detailed study of specialized wind port construction to jointly meet the goals of DCPP decommissioning and OSW development including potential labor substitution from decommissioning to port construction on the DCPP property is beyond the scope of this report
42 OFFSHORE WIND DEVELOPMENT IMPACTS
After the initial period of port construction assembly can begin in the specialized wind port for the first 1 GW OSW farm in 2029 The economic value of OSW continues from that time through the staged assembly of 1 GW OSW every 3 years Thus the full development of a field of 7 GW OSW from a specialized wind port in San Luis Obispo County will occur over the 21-year period from 2029-2049 While California currently does not have a specialized wind port for assembling OSW turbines it is possible that other specialized wind ports are developed in California during this time allowing OSW turbines to be assembled and dispatched to the Central California region from other nearby
Table 41 Output and Job Creation from Port Construction
RegionFull-Time
Equivalent JobsTotal Output (million $s)
San Luis Obispo County 11825 $202261
Santa Barbara County 234 $3896
Monterey County 28 $577
Rest of California 3837 $92956
California Total 15925 $299689
Economic Impact of Offshore Wind Farm Development on the Central Coast
48
ports This would accelerate the pace of development for installing up to 7 GW OSW in Central California and result in a final completion date prior to 2049
After the initial installation of a field of 7 GW OSW in and around the Morro Bay Call Area proximity between the OSW sites and the specialized wind port in San Luis Obispo will make the specialized wind port the primary area for repair and recommissioning of wind turbines Given the high fixed costs and low variable cost of operating OSW turbines the economics of maintaining 7 GW OSW in the region favor repair from the nearest port with available space to maximize the time turbines spend on the water and connected to the grid
The regional economic value of OSW is constructed by considering the baseline value of a representative 1 GW OSW farm and then modeling the staged development of seven identical 1 GW OSW farms over time The economic value of a representative 1 GW OSW farm is calculated for two cases decommissioning and recommissioning Given that all 7 GW OSW would ultimately be removed from the water following decommissioning the focus of the report is on the long-run economic value to the region from the perpetual renewal of OSW farms over time through recommissioning Recommissioning economizes on redeployment time for the replacement of a 1 GW OSW farm at the end of the lease (from a 6-year period for decommissioning and assembly to a 3-year recommissioning period that bundles these phases together) however bundling decommissioning together with redeployment increases the labor requirement for the 3-year period beyond that required for only decommissioning
421 OSW 1 GW BASELINE WITH DECOMMISSIONING
Table 42 shows the regional economic value realized for San Luis Obispo County neighboring counties and the State of California over the planning assembly and operating horizon of a 1 GW OSW farm through the decommissioning phase The regional economic stimulus provided by the 1 GW OSW farm over its lifetime results in output of $25 billion for San Luis Obispo County and the creation of 6612 full-time equivalent (FTE) jobs over the period 2022-2059 The overall impact in California considering spill-over impacts to other regions in the state is $37 billion and the creation of 11368 FTE jobs during this period
Table 42 Output and Job Creation from a 1 GW Wind Farm with Decommissioning
Region Full-Time Equivalent JobsTotal Output (million $s)
San Luis Obispo County 6612 $245256
Santa Barbara County 364 $7766
Monterey County 58 $1189
Rest of California 4333 $116470
California Total 11368 $370681
Economic Impact of Offshore Wind Farm Development on the Central Coast
49
The majority of the regional economic benefit is derived in San Luis Obispo County because all direct jobs are sourced at the port Santa Barbara County receives economic stimulus of $78 million and 364 FTE jobs over the period due to the alignment of jobs and workers in the model at the location of the specialized wind port In the event that a specialized wind port for OSW assembly and repair is sited in Santa Barbara County rather than San Luis Obispo County the distribution of economic benefits between the two counties essentially would be reversed with Santa Barbara County then becoming the source of output and job creation in the model While some of this outcome is driven by the nature of the model which assigns jobs to workers in the county where direct spending occurs whenever qualified workers in the county are available to provide it the stark difference in regional economic benefits across counties illustrates the fact that direct spending at the specialized wind port is the origin of job creation The regional supply chain to support a 1 GW OSW farm begins and ends at the port
The regional economic benefit realized over this time period is largely concentrated during the assembly and decommissioning phases of the project as shown in Figures 41 and 42 After a small amount of employment and output benefits generated during the planning phase regional employment and output spike during the 3-year assembly period 2029-2031 During the OampM period for the 1 GW OSW farm regional job creation and output falls from the level achieved during assembly and stabilizes Annual jobs and output creation have a positive gradient during this period due to the dynamic adjustment in the REMI PI+ model which builds the regional employment base through population growth in San Luis Obispo County as the 1 GW OSW farm causes labor migration into the county increasing the size of the labor force by providing a reliable source of head-of-household jobs After the 25-year OampM period of the OSW farm regional employment and output spike a second time during the 3-year decommissioning period from 2057-2059
Figure 41 Distribution of Employment Impacts over the Horizon of a 1 GW OSW Farm
Economic Impact of Offshore Wind Farm Development on the Central Coast
50
Figures 43 and 44 show the top sectors stimulated by direct employment at the specialized wind port facility for OSW in San Luis Obispo County for indirect and induced employment respectively In terms of indirect employment the largest industry stimulated by direct spending at the port is administrative and support services (60) followed by regional supply chain development in the professional scientific and technical services industry (14) The increased demand for manufactured components at the specialized port facility for OSW in San Luis Obispo County stimulates regional supply chains for professional scientific and technical support presenting an opportunity for collaboration with Cal Poly and stimulating regional job creation for Cal Poly graduates in engineering fields in local consulting firms and support industries The influx of jobs in professional scientific and technical support fields and other related aspects of the regional supply chain can be further facilitated through independent investment in the Cal Poly Technology Park and furthering industry partnerships in affiliated technical fields that support OSW
Figure 42 Distribution of Output over the Horizon of a 1 GW OSW Farm
The influx of jobs in professional scientific and technical support fields and other related aspects of the regional supply chain can be further facilitated through independent investment in the Cal Poly Technology Park and furthering industry partnerships in affiliated technical fields that support OSW
Economic Impact of Offshore Wind Farm Development on the Central Coast
51
Table 43 shows the distribution of jobs average annual wages total employee compensation and total output for a 1 GW OSW farm in terms of direct indirect and induced impacts Average annual wages and total employee compensation includes wages and fringe benefits paid for by employers
Figure 43 Top 10 Sectors for Indirect Employment from Offshore Wind
Figure 44 Top 10 Sectors for Induced Employment from Offshore Wind
Economic Impact of Offshore Wind Farm Development on the Central Coast
52
Table 44 breaks down output and job creation into annual averages over the various phases of the operating horizon of a 1 GW OSW farm including the final decommissioning phase that removes it from the ocean The regional economic stimulus provided by the 1 GW OSW farm over its lifetime results in the highest annual employment level during the assembly period which provides an average of 589 full-time jobs each year for workers in San Luis Obispo County and 941 full-time jobs each year in California The decommissioning period results in the greatest output creation averaging $218 million per year for San Luis Obispo County and $326 million per year for California during the 3-year decommissioning period
Table 43 Regional Economic Impact of a 1 GW Wind Farm in San Luis Obispo County
ImpactFull-Time
Equivalent Jobs
Average Job Compensation
($year)
Employee Compensation
(millions)Total Output
(millions)
Direct 3490 $88650 $30941 $162674
Indirect 2308 $66076 $15251 $57822
Induced 814 $74884 $6093 $24760
Total Economic Impact 6612 $79076 $52285 $245256
Table 44 Average Annual Output and Job Creation over Key Operating Phases
Economic Stimulus Planning Assembly OampM Decommission
Jobs
San Luis Obispo County 17 589 142 390
Santa Barbara County 1 29 8 24
Monterey County 0 5 1 4
Rest of California 4 318 99 289
Total 22 941 251 707
Output (millions)
San Luis Obispo County $261 $15269 $5288 $21803
Santa Barbara County $010 $502 $167 $670
Monterey County $001 $077 $026 $096
Rest of California $080 $6836 $2618 $9981
Total $352 $22685 $8101 $32550
Economic Impact of Offshore Wind Farm Development on the Central Coast
53
422 OSW 1 GW BASELINE WITH RECOMMISSIONING
In the recommissioning scenario the decommissioning phase for the 1 GW OSW farm is paired with redeployment of a replacement 1 GW OSW farm in the ocean in a new (or renewed) lease agreement Table 45 shows the regional economic value realized for San Luis Obispo County and the State of California over the construction and operating horizon of a 1 GW OSW farm that includes a 3-year recommissioning phase that maintains the 1 GW OSW farm on the water at the end of the period
The regional economic stimulus provided by the 1 GW OSW farm over a lifetime that includes recommissioning and replacement results in output of $268 billion for San Luis Obispo County and the creation of 6999 full-time equivalent (FTE) jobs over the period 2022-2059 The overall impact in California considering spill-over impacts to other regions in the state is $404 billion and the creation of 12059 FTE jobs during this period Comparing entries in Tables 42 and 45 recommissioning the 1 GW OSW farm generates an additional $225 million for San Luis Obispo County ($331 million for California) and the creation of an additional 387 FTE jobs for San Luis Obispo County (692 for California) over the period
Table 46 breaks down output and job creation into annual averages over the various phases of the operating horizon of a recommissioned 1 GW OSW farm that is placed back into service at the end of the horizon The regional economic stimulus provided by a recommissioned 1 GW OSW farm over its lifetime is identical in the first three phases (planning assembly and OampM) with the additional output and job creation concentrated in the final 3-year recommissioning phase Comparing entries in Tables 44 and 46 the added value of recommissioning over decommissioning over the 3-year decommissioning period for the project involves an additional 129 full-time jobs per year in San Luis Obispo County (230 full time jobs per year in California) resulting in additional economic output of $71 million per year in San Luis Obispo County and $110 million per year in California
Table 45 Output and Job Creation from a 1 GW Wind Farm with Recommissioning
Region
Full-Time Equivalent
JobsTotal Output
(millions)
San Luis Obispo County 6999 $267766
Santa Barbara County 387 $8420
Monterey County 62 $1280
Rest of California 4611 $126302
California Total 12059 $403768
Economic Impact of Offshore Wind Farm Development on the Central Coast
54
423 MULTIPLE OSW FARMS THE CASE OF 7 GW OSW DEVELOPMENT
In the case of 7 GW OSW development in Central California the initial spike in output and employment during the assembly phase is extended over a longer period due to the staging of
individual 1 GW OSW farms in successive 3-year periods at the specialized wind port Staged assembly of a field of 7 GW OSW also prolongs the economic benefit from recommissioning multiple OSW farms as the lease period is set back by 3 years for each successive OSW farm through overlapping leases to accommodate available space at the port for assembly The analysis of the 7 GW OSW development includes the
economic value created by constructing a specialized wind port in San Luis Obispo County because it is unlikely that industry partners will materialize to fully develop 7 GW of OSW in Central California without commitment in the region to provide reliable port access for repair and service in proximity to the OSW farms53
Table 46 Average Annual Output and Job Creation over Key Operating Phases
Economic Stimulus Planning Assembly OampM Decommission
Jobs
San Luis Obispo County 17 589 142 519
Santa Barbara County 1 29 8 32
Monterey County 0 5 1 5
Rest of California 4 318 99 382
Total 22 941 251 937
Output (millions)
San Luis Obispo County $261 $15269 $5288 $29306
Santa Barbara County $010 $502 $167 $888
Monterey County $001 $077 $026 $126
Rest of California $080 $6836 $2618 $13259
Total $352 $22685 $8101 $43579
Staged assembly of a field of 7 GW OSW prolongs the economic benefit from recommissioning multiple OSW farms
Economic Impact of Offshore Wind Farm Development on the Central Coast
55
The time horizon for the REMI model extends through 2060 which is not enough to capture the full cycle of development for a 7 GW OSW field given the staged decommissioning horizon that extends through 2077 For this reason the analysis of a 7 GW OSW field is decomposed into two parts First the model is run for staged assembly and deployment of a field of 7 GW OSW farms without decommissioning or recommissioning at the end of the horizon (which would otherwise capture the decommissioning period for only the initial 1 GW OSW farm through 2059) Then the value of a 7 GW OSW field is captured in perpetuity by incorporating the additional value of recommissioning for a representative 1 GW OSW at the end of the lifecycle of each 1 GW OSW farm
This process allows the annual economic value to be calculated in a long-run steady state comprised of a 28-year combined OampM (25 years) and recommissioning (3 years) phase for each OSW farm The long-run steady state value captures the annual value of operating and recommissioning a 7 GW field of OSW farms in a perpetual replacement cycle that begins on the date the final OSW turbine is installed in the 7 GW field
Figures 45 and 46 show the regional economic benefit realized over the time period 2022-2060 without the additional value generated by decommissioning (recommissioning) of each 1 GW OSW farm After an initial spike in regional economic benefits during the period of port construction the economic benefits during the assembly period are prolonged by the staged assembly of 7 GW OSW The annual economic benefit rises steeply during this period both for jobs and output because this period includes OampM for previously assembled 1 GW OSW farms as staging occurs between the assembly phases of each 1 GW OSW farm The regional economic benefit subsequently drops off in 2058 due to removal of the decommissioning (recommissioning) period from the REMI PI+ model runs
Figure 45 Distribution of Employment Impacts over the Horizon of a 7 GW OSW Field
Economic Impact of Offshore Wind Farm Development on the Central Coast
56
The trend toward rising annual output and employment levels during the OampM period in which all 7 OSW farms are in operation reflects the dynamic adjustment elements in the REMI PI+ model which builds up the locally sourced labor pool over time as workers gain experience in the OSW industry For this reason the regional economic value is greater for San Luis Obispo County and for California for the second 1 GW OSW farm than for the first and so on compounding the annual economic benefits realized in the region as a greater level of OSW development occurs over time
Table 47 shows the regional economic value realized for San Luis Obispo County and the State of California over the planning assembly and operating horizon of a 7 GW field of OSW farms absent recommissioning These values include the construction of a specialized wind port during the planning phase prior to assembly of the OSW farms The regional economic stimulus provided by the 7 GW field of OSW farms without decommissioning or replacement results in output of $150 billion for San Luis Obispo County and the creation of 44960 full-time equivalent (FTE) jobs over the period 2022-2060 The overall impact in California is $225 billion and the creation of 72162 FTE jobs during this period
Figure 46 Distribution of Output Impacts over the Horizon of a 7 GW OSW Field
The regional economic value is greater for SLO County and for California for the second 1 GW OSW farm than for the first and so on compounding the annual economic benefits realized in the region as a greater level of OSW development occurs over time
Economic Impact of Offshore Wind Farm Development on the Central Coast
57
The entries in Table 47 encompass the economic value of port construction provided in Table 41 Netting out the port construction impacts in Table 41 the development of a 7 GW field of OSW in the specialized wind port provided an additional 33135 (56238) jobs and additional output of $13 billion ($195 billion) in San Luis Obispo County
Table 48 breaks down output and job creation into annual averages over the various phases of the operating horizon absent recommissioning The port construction period overlaps with planning for the first 1 GW OSW farm and the assembly period is staged over 21 years and involves the transition of assembled OSW farms to OampM toward the end of the assembly period
Table 48 Average Annual Output and Job Creation over Key Operating Phases
Economic Stimulus Port Construction Assembly OampM
Jobs
San Luis Obispo County 2365 1080 1075
Santa Barbara County 47 46 62
Monterey County 6 7 10
Rest of California 767 655 780
California Total 3185 1790 1926
Output (millions)
San Luis Obispo County $40452 $36304 $50331
Santa Barbara County $779 $976 $1583
Monterey County $115 $153 $243
Rest of California $18591 $17134 $25146
California Total $59938 $54566 $77303
Table 47 Output and Job Creation from a 7 GW field of OSW
RegionFull-Time Equivalent
JobsTotal Output
(millions)
San Luis Obispo County 44960 $1500241
Santa Barbara County 2019 $44632
Monterey County 314 $6871
Rest of California 24869 $699440
California Total 72162 $2251185
Economic Impact of Offshore Wind Farm Development on the Central Coast
58
The regional economic stimulus provided by a 7 GW field of OSW farms over its lifetime results in the highest annual employment level during the OampM period The OampM period for a 7 GW field of OSW provides an average of $503 million in annual output and 1075 full-time jobs each year for workers in San Luis Obispo County and $773 million in annual output and 1926 full-time jobs each year in California
Table 49 derives annual steady-state values from periodic recommissioning and redeployment of 7 GW OSW for perpetuity The steady-state values represent the annual OampM value for continued operation of a 7 GW field of OSW farms plus the additional benefit from periodic recommissioning of each 1 GW OSW farm staged in 3-year periods that begin with the first OSW farm in 2059 Specifically the average annual regional economic benefits are derived in perpetuity by calculating the economic value for each variable over a 28-year rolling horizon that begins with the OampM period 2050-2058 in which all 7 OSW farms operate followed by a 21-year recommissioning phase involving the staged reassembly and redeployment of successive 1 GW OSW farms over 3-year intervals at the port
The annual average output level resulting from periodic recommissioning and redeployment of 7 GW OSW is $686 million in annual output and 1389 full-time jobs each year for workers in San Luis Obispo County and $104 billion in annual output and 2488 full-time jobs each year in California The interpretation of these values is the long-run average economic value to the regional economy from operating a mature field of OSW farms that perpetually recommissions and maintains 7 GW of OSW in the Central California region
The steady-state average regional economic values represent an approximation because a fully integrated process for maintaining a 7 GW field of OSW farms would be driven by strong economic incentives to maintain OSW turbines on the water generating electricity for the maximum number of days By the time the first OSW farm begins the recommissioning process in 2059 the solution to this problem may ultimately involve a different staging process for OSW turbine replacement than the one considered here in which each 1 GW OSW farm is recommissioned in a 3-year period following its 25-year operating period
Table 49 Annual Output and Job Creation from 7 GW OSW for Perpetuity
RegionFull-Time
Equivalent Jobs Total Output (millions)
San Luis Obispo County 1389 $68601
Santa Barbara County 80 $2114
Monterey County 13 $317
Rest of California 1006 $33123
California Total 2488 $104154
Economic Impact of Offshore Wind Farm Development on the Central Coast
59
The entries in Table 49 are conservative for two reasons First replacement of each 1 GW OSW farm which begins in the year 2059 is with another baseline 1 GW OSW farm built with currently available technology By 2058 it is possible that technological advances will increase the economic value of reinstalling an OSW farm on a new or renewed lease Second the value during the recommissioning period for each 1 GW OSW farm is taken as the added value of recommissioning for the baseline 1 GW OSW farm considered above This suppresses the dynamic adjustment feature of the REMI model under which the value of subsequent recommissioning periods is elevated based on the experience gained by the regional workforce from recommissioning the first 1 GW OSW farm
424 SMALLER SCALE DEVELOPMENT THE CASE OF 3 GW OSW
The potential to develop 7 GW of OSW in and around the Morro Bay Call Area depends on the ability to reach an agreement with the US Department of Defense (DOD) for an expanded OSW planning area In the event that an expanded OSW planning area is not identified in and around the Morro Bay Call Area it is possible to develop a smaller 3 GW field of OSW farms in the 311 square mile area encompassed by the existing Morro Bay Call Area
In the case of 3 GW OSW development in Central California the initial spike in output and employment during the assembly phase is contracted to a 9-year period due to the staging of individual 1 GW OSW farms in successive 3-year periods at the specialized wind port The analysis of the 3 GW OSW development scenario includes the economic value created by constructing a specialized wind port in San Luis Obispo County because the regional economic benefit of OSW development is centered around job creation at the port
Table 410 shows the regional economic value realized for San Luis Obispo County and the State of California over the planning assembly and operating horizon of a 3 GW field of OSW farms absent recommissioning These values include the construction of a specialized wind port during the planning phase prior to assembly of the OSW farms The regional economic stimulus provided by the 3 GW field of OSW farms generates output of $767 billion for San Luis Obispo County and the creation of 28422 full-time equivalent (FTE) jobs over the period 2022-2060 The overall impact in California is $117 billion and the creation of 44282 FTE jobs during this period
Table 410 Output and Job Creation from a 3 GW field of OSW
RegionFull-Time
Equivalent Jobs Total Output (million $s)
San Luis Obispo County 28422 $766223
Santa Barbara County 1140 $23255
Monterey County 173 $3583
Rest of California 14547 $376664
California Total 44282 $1169724
Economic Impact of Offshore Wind Farm Development on the Central Coast
60
Table 411 breaks down output and job creation into annual averages over the various phases of the operating horizon for a 3 GW field of OSW farms absent recommissioning The port construction period overlaps with planning for the first 1 GW OSW farm and the assembly period is staged over 9 years and involves the transition of assembled OSW farms to OampM toward the end of the assembly period
Following the bump in employment during port construction the regional economic stimulus provided by a 3 GW field of OSW farms over its lifetime results in the highest annual employment level during the assembly period Relative to a 7 GW field of OSW employment and output levels tick downward in the OampM period as the regional economy is less active in supporting the smaller field of OSW farms due to a decreased need for maintenance and repair The OampM period for a 3 GW field of OSW provides an average of $176 million in annual output and 483 full-time jobs each year for workers in San Luis Obispo County and $281 million in annual output and 858 full-time jobs each year in California
Table 412 derives annual steady-state values from periodic recommissioning of a 3 GW field of OSW farms for perpetuity The steady-state values represent the annual OampM value for continued operation of a 3 GW field of OSW farms plus the additional benefit from periodic recommissioning of each 1 GW OSW farm staged in 3-year periods that begin with the first OSW farm in 2059 The
Table 411 Average Annual Output and Job Creation over Key Operating Phases of a 3 GW Field of OSW
Economic Stimulus Port Construction Assembly OampM
Jobs
San Luis Obispo County 2365 768 483
Santa Barbara County 47 22 25
Monterey County 6 4 4
Rest of California 767 454 346
California Total 3185 1249 858
Output (millions)
San Luis Obispo County $40452 $20088 $17624
Santa Barbara County $779 $405 $568
Monterey County $115 $067 $087
Rest of California $18591 $10313 $9819
California Total $59938 $30874 $28098
Economic Impact of Offshore Wind Farm Development on the Central Coast
61
average annual regional economic benefits are derived in perpetuity by calculating the economic value for each variable over a 28-year rolling horizon that begins with the OampM period 2038-2058 in which all three OSW farms operate followed by a 9-year recommissioning phase involving the staged reassembly and redeployment of successive 1 GW OSW farms over 3-year intervals at the port
The annual average output level resulting from periodic recommissioning and redeployment of 3 GW OSW is $255 million in annual output and 617 full-time jobs each year for workers in San Luis Obispo County and $396 million in annual output and 1098 full-time jobs each year in California The interpretation of these values is the long-run average economic value to the regional economy from operating a mature field of OSW farms that perpetually recommissions and maintains 3 GW of OSW from a specialized wind port in San Luis Obispo County
Table 412 Annual Output and Job Creation from 3 GW OSW in Perpetuity
RegionFull-Time
Equivalent Jobs Output (millions)
San Luis Obispo County 617 $25454
Santa Barbara County 33 $795
Monterey County 5 $119
Rest of California 443 $13237
California Total 1098 $39605
Economic Impact of Offshore Wind Farm Development on the Central Coast
62
SECTION 5
FISCAL IMPLICATIONS
Economic Impact of Offshore Wind Farm Development on the Central Coast
63
5 FISCAL IMPLICATIONS
Development of OSW farms in Central California have fiscal implications for San Luis Obispo County The fiscal impact of the project is composed of tax revenue derived from several components
bull property taxes on assessed land improvements at the specialized wind portbull unitary taxes assessed on PGampE from the use of transmission and distribution lines in San Luis
Obispo Countybull sales and use taxes on personal consumption of workers employed at the port facilitybull sales and use taxes on OSW capital expenditurebull income taxes on employee wages
bull corporate taxes on value added in the regional supply chain
The fiscal implications depend on renewable energy credits and other aspects that may result in certain components of project expenditures being exempt from state and local taxes For imported equipment delivered to the port such as turbines towers and floating sub-structures the ability to tax these expenditures depends on the ability of the county to declare imports as an originating transaction that occurs at a specialized wind port For this report fiscal implications are calculated gross of any tax credits that may be applied
Local taxes include property and excise taxes paid to municipalities by workers in the jobs generated by the construction- and operating-period employment reflected in Tables 46-48 as well as property and other local taxes by the companies employing those individuals State taxes include income and sales taxes paid by individuals as well as payroll income and other taxes paid by the companies that employ those individuals The taxes are thus proportional to the total direct indirect and induced economic effects provided in these tables However these totals do not represent all taxes paid by companies whose output is only partly affected by the changes in demand attributable to construction and operating periods of offshore wind energy installation and maintenance port construction and terminal operation
51 PROPERTY TAXES FROM LAND IMPROVEMENTS AT THE SPECIALIZED WIND PORT
Property taxes in San Luis Obispo County are levied at a 1 percent rate on land improvements resulting from development of a specialized wind port in San Luis Obispo County The projected capital expense required to construct the port is in the range of $17 billion to $25 billion Using the cost of developing a specialized wind port as a proxy for the change in assessed land improvements constructing a specialized wind port in San Luis Obispo County would result in annual property taxes to the county of $17-25 million per year
Economic Impact of Offshore Wind Farm Development on the Central Coast
64
52 UNITARY TAXES ON ELECTRICITY TRANSMISSION BY PGampE
The County of San Luis Obispo currently receives unitary taxes and franchise taxes from PGampE from the operation of DCPP In the 2019-2020 tax year unitary tax revenues in San Luis Obispo County accounted for $236 million in annual taxes 85 of which was paid by PGampE By far unitary taxes represent the largest revenue source for the county from DCPP54
California bases the unitary tax on the combined total corporate income of multi-state and multi-national corporations by applying a formula to determine the total amount of income the corporation realized within California The State of California assesses the unitary tax on individual corporations as well as groups of companies who operate together as a ldquounitrdquo and then divides the total tax receipt for each unit at the state-level into shares of taxes received by each county For the case of PGampE unitary taxes are assessed by the State Board of Equalization (BOE) at the same 1 rate as property taxes using Historic Cost Less Depreciation (HCLD) as the basis for the assessment The current board-adopted value for PGampE as the basis for unitary taxes is $312 billion55
With the planned closure of DCPP and potential development of OSW the unitary tax received by San Luis Obispo County will change based both on changes in the HCLD for PGampE and shifts in the share of capital costs attributed to the county from electricity distribution Absent OSW development the prospective closure of DCPP will reduce PGampErsquos HCLD following a decrease in annual operating costs however this drop in operating costs will be offset to some extent by increased storage and maintenance costs for nuclear material As existing power generated by DCPP is replaced by electricity generation elsewhere it is likely that the HCLD of PGampE increases although the share of capital costs attributed to San Luis Obispo County can go up or down depending on capital investment required to upgrade the transmission infrastructure for power delivery from alternative uses such as OSW
The National Renewable Energy Laboratory (NREL) estimates required investments in transmission infrastructure for a 1 GW OSW farm site with an average distance to cable landfall of 45km to be $162 billion56 These costs which include grid connection costs for an offshore spur line would be incurred by PGampE (or another contractor in its unit) as part of the basis for the unitary tax Each region in California would be entitled to a share of the unitary tax revenue proportional to the change in PGampErsquos HCLD realized within the region
Based on the estimated transmission infrastructure cost of $162 billion for a 1 GW OSW farm the total cost of developing a 7 GW field of OSW would be approximately $813 billion57 Of this investment the majority of the transmission line would be situated in federal waters outside the tax jurisdiction of the state The taxable proportion of grid connection costs for an offshore spur line to a 7 GW field of OSW can be calculated according to the share of the transmission infrastructure passing through California waters which is the territory extending 3 nautical miles (56 km) from the shore at mean low tide These costs would include both the share of the transmission line residing in California and the cost of the substation at the cable landfall An approximation of the share of grid connection costs attributed to California would be 1244 (=5645 km) Based on this increment the increase in unitary taxes for San Luis Obispo County from a 7 GW field of OSW would be approximately $10 million per year
Economic Impact of Offshore Wind Farm Development on the Central Coast
65
53 SALES AND USE TAXES ON OSW SPENDING
Sales and use taxes are assessed on taxable sales in California at a rate of 725 In addition counties and municipalities can charge an additional local sales tax of up to 25 through special sales tax jurisdictions Currently special tax jurisdictions in San Luis Obispo County provide an additional assessment of 05 for Grover Beach Arroyo Grande Pismo Beach and Paso Robles for a combined effective tax rate of 775 for purchases made in these communities While it is possible that a specialized wind port authority can levy an additional assessment for OSW spending at the port the values provided here consider sales and use taxes only at the 725 rate
The overnight capital cost for a floating 1 GW OSW farm is projected to be $41 billion of which roughly 30 is comprised of turbine capital cost and 36 for the support structure (including the floating substructure lines and anchors for mooring systems and array cables) These OSW components will be imported at least in the short-term58
Sales and use taxes can be assessed on California transactions at the specialized wind port even for imported goods if the transaction occurs in California If the capital spending on turbines and the support structure for a 7 GW field of OSW farms is taxed taxable spending during the 21-year assembly and installation period for OSW would result in California sales and use taxes of $14 billion Based on a 28-year replacement standard for each 1 GW OSW farm the annual sales and use taxes for California in a long-run steady state with periodic recommissioning would result in $498 million per year in additional sales and use taxes for the State of California at prevailing OSW capital costs
54 SALES AND USE TAXES CORPORATE TAXES AND INCOME TAXES FROM AFFILIATED SPENDING
The development of OSW also generates local taxes from income and induced spending by OSW workers as well as corporate taxes on the value added in the regional supply chain from the companies employing those individuals State taxes include income and sales taxes paid by individuals as well as payroll income and other taxes paid by the companies that employ them
Table 51 presents the estimated annual increase in California state taxes from maintaining a 3 GW vs a 7 GW field of OSW farms for perpetuity Corporate income taxes are based on value-added created in the regional supply chain personal income taxes are levied on worker incomes and sales taxes on retail purchases are derived from disposable income The effective tax rate for each component is calculated using data from the California Legislative Analystrsquos Office as the average tax collected in each category as a share of economic activity that occurred in the state over the period 2017-2019 The effective rate for the corporate income tax is taken to be the corporate tax bill as a share of value-added and the retail sales tax is taken to be the retail sales and use tax revenue as a share of personal consumption expenditures spent on taxable items in the state Development of a 3 GW field of OSW farms results in an additional $27 million per year in California tax revenue whereas a 7 GW field of OSW farms contributes $76 million per year in California tax revenue
Economic Impact of Offshore Wind Farm Development on the Central Coast
66
55 SUMMARY OF FISCAL IMPLICATIONS
Table 52 provides a summary of the annual fiscal implications for maintaining a mature field of 3 GW vs 7 GW OSW in and around the Morro Bay Call Area Estimated property taxes from land improvement from investment in a specialized wind port facility are taken at 1 of the midpoint of the estimated capital investment Unitary taxes on the capital cost of infrastructure is fully attributed to San Luis Obispo County including the share of spending that occurs in state waters in addition to onshore investment State taxes amortize the cost of recurring capital investment for recommissioning OSW farms which assumes imported capital is recorded as a taxable transaction on state land at the port Taxes from regional income and spending are taken from Table 51 and suppress the additional county-level 05 retail sales tax from worker spending in special tax jurisdictions in Grover Beach Arroyo Grande Pismo Beach and Paso Robles
In the case of a 3 GW field of OSW development tax values are proportionally smaller due to the smaller scale of the project with the exception of property taxes from the specialized wind port The basis for the increase in assessed value of the property taxes is taken at the low end of the range of cost estimates for the case of 3 GW OSW development and at the high end of the range for the case of 7 GW OSW development Detailed information at this time is not available to confirm whether or not the cost of port construction would materially differ in the case where the specialized wind port was constructed to support a 3 GW or a 7 GW field of OSW farms
Table 51 Annual Taxes from Regional Economic Development of 3 GW vs 7 GW OSW
3 GW Field 7 GW Field
Type of Tax Effective Rate Basis (millions) Tax (millions) Basis (millions) Tax (millions)
Corporate Income Tax 09078 $18737 $170 $46323 $421
Personal Income Tax 83508 $21861 $1826 $65226 $5447
Retail Sales Tax 37515 $18722 $702 $55654 $2088
Total $2698 $7955
Economic Impact of Offshore Wind Farm Development on the Central Coast
67
Table 52 Summary of Annual Fiscal Benefits from 3 GW vs 7 GW OSW
3 GW Field 7 GW Field
Tax BasisCounty Taxes (millionsyr)
State Taxes (millionsyr)
County Taxes (millionsyr)
State Taxes (millionsyr)
Specialized Wind Port
Property Taxes $1700 $2500
OSW Capital Spending $2133 $4978
Transmission Infrastructure
Unitary Taxes $434 $1012
Regional Spending
Corporate Income Tax $170 $421
Personal Income Tax $1826 $5447
Retail Sales Tax $702 $2088
Total $2134 $4831 $3512 $12933
Economic Impact of Offshore Wind Farm Development on the Central Coast
68
SECTION 6
CONCLUSION
Economic Impact of Offshore Wind Farm Development on the Central Coast
69
6 CONCLUSION
The development of up to 7 GW OSW in and around the Morro Bay Call Area represents a considerable opportunity for job and economic output impacts However the logistical challenges associated with building and operating a field of OSW farms and the associated specialized wind port that supports them are substantial If a specialized wind port for OSW turbine assembly and repair is not constructed in San Luis Obispo County then the regional economic benefits of jobs and economic output creation would occur instead in the county that provides the port In contrast the State of California would retain much of the economic benefit of OSW development if another county in California provides the specialized wind port
Construction-phase impacts during the 5-year period of port construction generate 11825 full-time equivalent (FTE) construction jobs in San Luis Obispo County and 15925 construction jobs overall in California stimulating $202 billion in additional economic output for San Luis Obispo County and $3 billion in economic output for California These impacts on economic output and jobs include port terminal and transmission infrastructure improvements as well as the first stage of wind farm development and planning operations
Following the period of port construction and OSW planning assembly of 1 GW OSW farms is staged over time in a 3-year period for each OSW farm For a 3 GW field of OSW farms construction of a port followed by staged assembly of 1 GW OSW farms over a total of 9 years provides 28422 FTE jobs in San Luis Obispo County and 44282 FTE jobs in California over an operating horizon through 2060 Developing a 3 GW field of OSW farms generates $766 billion in economic output for San Luis Obispo County and $1170 billion in economic output for California through the year 2060 Additional jobs and economic output would be realized during the decommissioning period of the field which extends well beyond the horizon of the REMI model in 2060 and is therefore not considered in the model
For a 7 GW field of OSW farms construction of a port followed by staged assembly of 1 GW OSW farms over a total of 21 years provides 44960 FTE jobs in San Luis Obispo County and 72162 FTE jobs in California over an operating horizon through 2060 Developing a 7 GW field of OSW farms generates $15 billion in economic output for San Luis Obispo County and $2251 billion in economic output for California through the year 2060 As in the case of a 3 GW field of OSW farms additional jobs and economic output would be realized during the decommissioning period which is not considered in the model
Perpetual operation of a mature 3 GW or 7 GW field of OSW farms produces considerable regional economic benefits each year Perpetual operation of a mature 3 GW field of OSW farms results in the creation of 617 jobs per year in San Luis Obispo County and 1098 jobs per year in California and provides additional economic output of $254 million per year in San Luis Obispo County and $396
Economic Impact of Offshore Wind Farm Development on the Central Coast
70
million per year in California Perpetual operation of a mature 7 GW field of OSW farms results in the creation of 1389 jobs per year in San Luis Obispo County and 2488 jobs per year in California and provides additional economic output of $686 million per year in San Luis Obispo County and $104 billion per year in California
Fiscal benefits to San Luis Obispo County are predominantly driven by property taxes on land improvements at the specialized wind port which generates between $17-$25 million per year in local property tax revenues The considerable cost of developing the necessary transmission infrastructure to provide grid connection for a 3-7 GW field of OSW farms to the existing connections at DCPP provides a tax benefit to the county as well Based on the taxable change in the cost of the transmission infrastructure the development of a 3 GW field of OSW farms is projected to result in increased unitary taxes for San Luis Obispo County of $43 million per year whereas the development of a 7 GW field of OSW farms is projected to result in increased unitary taxes for San Luis Obispo County of $101 million per year
The fiscal impact to the State of California is comprised of sales and use taxes on personal consumption expenditures resulting from worker spending corporate income taxes on value added by companies in the regional supply chain and the state income taxes on employed workers Using effective tax rates derived from data provided by the California Legislative Analystrsquos Office perpetual operation of a mature 3 GW field of OSW generates $27 million per year in California tax revenue whereas a 7 GW field of OSW generates $796 million per year in California tax revenue from the projected economic activity created by OSW
Over time economic impacts can change As installed wind farm capacity in California increases through planned developments in Central and Northern California learning effects are likely to further reduce costs and investment in OSW manufacturing capabilities in California would allow a greater share of inputs to be locally sourced Changes along these lines will result in greater regional economic benefits in the long-term for floating OSW development in California
Economic Impact of Offshore Wind Farm Development on the Central Coast
71
REFERENCES
American Jobs Project 2019 The California Offshore Wind Project A Vision for Industry Growth February 2019 Available at httpsoffshorewindhuborgresource1771
American Wind Energy Association California and Offshore Wind California 2020 AWEA-California and Offshore Wind California Comments California Energy Commission Docket 17-MISC-01 June 30 2020 Available at httpsefilingenergycagovGetDocumentaspxtn=233690ampDocumentContentId=66331
Berkeley Lab 2020 Wind Technologies Market Report Available at httpsemplblgovwind-technologies-market-report
Beiter P Musial W Smith A Kilcher L Damiani R Maness M Sirnivas S Stehly T Gevorgian V Mooney M and Scott G 2016 A spatial-economic cost-reduction pathway analysis for US offshore wind energy development from 2015ndash2030 (No NRELTP-6A20-66579) National Renewable Energy Laboratory(NREL) Golden CO (United States)
BOEM California Offshore Wind Energy httpscaoffshorewinddatabasinorgmaps4c-86c5e61e044747ac010102c4787507active
Brightline Defense 2020 California Offshore Wind Winding up for Environmental Growth and Environmental Equity December 2020
Bureau of Ocean Energy Management (BOEM) California Offshore Renewable Energy Fact Sheet February 22 2017 Available at httpswwwboemgovsitesdefaultfilesrenewable-energy-programState-ActivitiesCABOEM-Offshore-Renewables-Factsheet--02-22-17pdf
Busch C and Orvis R 2020 Insights from the California Energy Policy Simulator On the Statersquos Current Greenhouse Gas Emission Trajectory and Six Policy Opportunities for Deepening Emission Reductions Energy Innovation LLC January 2020 Available at httpsenergyinnovationorgwp-contentuploads202005Insights-from-the-California-Energy-Policy-Simulator_5120pdf
California Board of Equalization Unitary Valuation Methods March 2003 Available at httpswwwboecagovproptaxespdfmethodsbook2003pdf
California Energy Commission 2019 Total System Electric Generation Available at httpswwwenergycagovdata-reportsenergy-almanaccalifornia-electricity-data2019-total-system-electric-generation
California Energy Commission 2020 UPDATED Notice of Availability of Outreach on Additional Considerations for Offshore Wind Energy off the Central Coast of CA May 7 2020
Colias M 2021 GM to Phase Out Gas- and Diesel-Powered Vehicles by 2035 The Wall Street Journal January 28 2021 Available at httpswwwwsjcomarticlesgm-sets-2035-target-to-phase-out-gas-and-diesel-powered-vehicles-globally-11611850343
Economic Impact of Offshore Wind Farm Development on the Central Coast
72
Collier R 2017 High Road for Deep Water Center for Labor Research and Education University of California Berkeley CA
Dvorak MJ Archer CL and Jacobson MZ 2010 California offshore wind energy potential Renewable energy 35(6) pp1244-1254
Energy and Environmental Economics Inc 2019 The Economic Value of Offshore Wind Power in California August 2019 Available at httpcastlewindcomwp-contentuploads2019082019-08-08_E3-CastleWind-OffshoreWindValueReport_compressedpdf
Energy and Environmental Economics Inc 2018 ldquoDeep Decarbonization in a High Renewables Futurerdquo California Energy Commission June 18 2018 Available at httpswwwethreecomwp-contentuploads201806Deep_Decarbonization_in_a_High_Renewables_Future_CEC-500-2018-012-1pdf
Fripp M and Wiser RH 2008 Effects of temporal wind patterns on the value of wind-generated electricity in California and the Northwest IEEE Transactions on Power Systems 23(2) pp477-485
Froese M 2019 Why collaboration is critical to offshore wind and port success Windpower Energy and Development August 28 2019 Available at httpswwwwindpowerengineeringcomwhy-collaboration-is-critical-to-offshore-wind-and-port-success
Garrick BJ and Wakefield DJ 2020 Probabilistic Risk Assessment of Nuclear Power Plant Spent Fuel Handling and Storage Programs Methodology and Application to the Diablo Canyon Power Plant The B John Garrick Institute for the Risk Sciences at UCLA and Pacific Gas and Electric Company February 17 2020
Global Wind Energy Council (GWEC) 2020 Global Offshore Wind Report August 5 2020 Available at httpsgwecnetglobal-offshore-wind-report-2020
Hackett S and Anderson J 2020 California North Coast Offshore Wind Studies Economic Development and Impacts Schatz Energy Research Center September 2020
London Economics International LLC 2013 Analysis of the Macroeconomic Impacts of the Proposed Zephyr Transmission Project May 2013 Available at httpwwwdatcllccomwp-contentuploads201306ZephyrEconomicBenefitsStudy-5212013pdf
Lowder K 2021 Wind Power amp Renewables Surge to New Record in China Cleantechnica January 22 2021 Available at httpscleantechnicacom20210122wind-power-renewables-surge-to-new-record-in-china
Massachusetts Clean Energy Center 2017 2017 Massachusetts Offshore Wind Ports amp Infrastructure Assessment May 2017 Available at httpwwwmassceccomports
Musial W Beiter P Tegen S and Smith A 2016 Potential Offshore Wind Energy Areas in California An Assessment of Locations Technology and Costs National Renewable Energy Laboratory December 2016 Available at httpswwwboemgovsitesdefaultfilesenvironmental-stewardshipEnvironmental-StudiesPacific-RegionStudiesBOEM-2016-074pdf
Economic Impact of Offshore Wind Farm Development on the Central Coast
73
National Renewable Energy Laboratory (NREL) Annual Technology Baseline 2020 Available at httpsatbnrelgovelectricity2020dataphp
Porter A and Phillips S 2016 Determining the Infrastructure Needs to Support Offshore Floating Wind and Marine Hydrokinetic Facilities on the Pacific West Coast and Hawaii US Bureau of Offshore Energy Management March 3 2016 Available at httpwwwdataboemgovPIPDFImagesESPIS55503pdf
Reed S 2021 A Monster Wind Turbine is Upending the Industry The New York Times January 1 2021 Available at httpswwwnytimescom20210101businessGE-wind-turbinehtml
Roland-Holst DW Behnke D Evans S Froumllund L and Yi-Chen A 2019 Economic Impact Assessment of the Prospective Closure of the Diablo Canyon Nuclear Power Plant California Public Utilities Commission June 28 2019
Severy M and Jacobson A 2020 California North Coast Offshore Wind Studies Interconnection Constraints and Pathways Schatz Energy Research Center September 2020
Severy M Younes A Zoellick J and Jacobson A 2020 Northern California Offshore Wind Generation and Load Compatibility Assessment with Emphasis on Electricity Grid Constraints Mitigation Measures and Associated Costs Final Synthesis Report Energy Research Center September 2020 OCS Study BOEM 2020-045
Shaner MR Davis SJ Lewis NS and Caldeira K 2018 ldquoGeophysical constraints on the reliability of solar and wind power in the United Statesrdquo Energy amp Environmental Science 11(4) pp914-925
Sinden G 2007 ldquoCharacteristics of the UK wind resource Long-term patterns and relationship to electricity demandrdquo Energy Policy 35(1) pp112-127
Speer B Keyser D and Tegen S 2016 Floating Offshore Wind in California Gross Potential for Jobs and Economic Impacts from Two Future Scenarios (No NRELTP-5000-65352) National Renewable Energy Laboratory (NREL) Golden CO (United States)
Wang YH Walter RK White C Kehrli MD Hamilton SF Soper PH and Ruttenberg BI 2019 ldquoSpatial and temporal variation of offshore wind power and its value along the Central California Coastrdquo Environmental Research Communications 1(12) p121001
1 A power plant with a 50 capacity factor produces twice as much power per day as a power plant with the same nameplate
capacity and a 25 capacity factor
2 The overnight LCOE for floating OSW is currently $67MWh which compared with $69MWh for commercial PV in Los
Angeles $61MWh for nuclear and $57-89MWh for new steam-reach development of hydropower and $123MWh for flash
steam enhanced geothermal systems National Renewable Energy Laboratory (NREL) Annual Technology Baseline 2020
Available at httpsatbnrelgovelectricity2020dataphp
3 California Energy Commission 2019 Total System Electric Generation Available at httpswwwenergycagovdata-reports
energy-almanaccalifornia-electricity-data2019-total-system-electric-generation
Economic Impact of Offshore Wind Farm Development on the Central Coast
74
4 Busch C and Orvis R 2020 Insights from the California Energy Policy Simulator on the Statersquos Current Greenhouse Gas Emission
Trajectory and Six Policy Opportunities for Deepening Emission Reductions Energy Innovation LLC January 2020 Available at
httpsenergyinnovationorgwp-contentuploads202005Insights-from-the-California-Energy-Policy-Simulator_5120
5 Colias M 2021 GM to Phase Out Gas- and Diesel-Powered Vehicles by 2035 The Wall Street Journal January 28 2021
Available at httpswwwwsjcomarticlesgm-sets-2035-target-to-phase-out-gas-and-diesel-powered-vehicles-
globally-11611850343
6 Energy and Environmental Economics Inc 2018 ldquoDeep Decarbonization in a High Renewables Futurerdquo California Energy
Commission June 18 2018 Available at httpswwwethreecomwp-contentuploads201806Deep_Decarbonization_
in_a_High_Renewables_Future_CEC-500-2018-012-1pdf
7 Severy M Younes A Zoellick J Jacobson A 2020 Northern California Offshore Wind Generation and Load Compatibility
Assessment with Emphasis on Electricity Grid Constraints Mitigation Measures and Associated Costs Final Synthesis Report Schatz
Energy Research Center September 2020
8 Bureau of Ocean Energy Management (BOEM) httpswwwboemgovrenewable-energylease-and-grant-information
9 This calculation is based on a capacity factor of 50 for OSW The exact amount of generating capacity needed to meet state
renewable energy targets in 2050 depends on future demand growth driven by electrification and the capacity factor of the
power source which is rapidly increasing for OSW
10 National Renewable Energy Laboratory (NREL) Annual Technology Baseline 2020 Available at httpsatbnrelgov
electricity2020dataphp
11 A capacity factor of 50 percent is equivalent to achieving the full nameplate capacity of the OSW farm for 12 hours per day
with zero electricity generation for the remaining 12 hours per day
12 American Jobs Project 2019 The California Offshore Wind Project A Vision for Industry Growth February 2019 Available
at httpsoffshorewindhuborgresource1771
13 Myers Amanda 2020 Seven Policies to Tap US Offshore Windrsquos $166 Billion Economic Growth And Emissions Reduction
Potential Forbes August 31 2020 Available at httpswwwforbescomsitesenergyinnovation20200831seven-policies-
the-us-can-use-to-tap-offshore-winds-166-billion-economic-growth-and-emissions-reduction-
potentialsh=5bf30e546f27
14 Energy and Environmental Economics Inc 2019 The Economic Value of Offshore Wind Power in California August 2019
Available at httpcastlewindcomwp-contentuploads2019082019-08-08_E3-CastleWind-OffshoreWindValueReport_
compressedpdf
15 Wang YH Walter RK White C Kehrli MD Hamilton SF Soper PH and Ruttenberg BI 2019 ldquoSpatial and temporal
variation of offshore wind power and its value along the Central California Coastrdquo Environmental Research Communications
1(12) p121001
16 External costs of GHG emissions are captured to some extent in California electricity prices through public regulations for
instance the cap-and-trade program for carbon emissions under AB 32 Similarly higher electricity generation costs are
priced into the California grid indirectly by Californiarsquos commitment to developing renewable sources
17 Musial W Beiter P Tegen S and Smith A 2016 Potential Offshore Wind Energy Areas in California An Assessment of
Locations Technology and Costs National Renewable Energy Laboratory December 2016 Available at httpswwwboem
govsitesdefaultfilesenvironmental-stewardshipEnvironmental-StudiesPacific-RegionStudiesBOEM-2016-074pdf
18 California Energy Commission 2020 UPDATED Notice of Availability of Outreach on Additional Considerations for Offshore Wind
Energy off the Central Coast of CA May 7 2020
Economic Impact of Offshore Wind Farm Development on the Central Coast
75
19 American Wind Energy Association California and Offshore Wind California 2020 Offshore Wind Development in Morro Bay
Letter to the Honorable Salud Carbajal and the Honorable Jimmy Panetta May 27 2020
20 Brightline Defense 2020 California Offshore Wind Winding up for Environmental Growth and Environmental Equity December
2020
21 Ma K Luo Y Thomas KC amp Wu Y 2019 Mooring System Engineering for Offshore Structures Elsevier Science amp
Technology San Diego Available from ProQuest Ebook Central February 2021
22 KampL Gates 2019 Offshore Wind Handbook Version 2 October 2019 Available at httpsfilesklgatescomfilesuploads
documents2019_offshore_wind_handbookpdf
23 If the blades are not already attached to the nacelle-hub each blade is then lifted separately by the crane and connected to
the hub
24 Uraz E 2011 Offshore wind turbine transportation amp installation analyses planning optimal marine operations for offshore
wind projects Available at httpwwwdiva-portalorgsmashgetdiva2691575FULLTEXT01pdf
25 Wang YH Walter RK White C Kehrli MD Hamilton SF Soper PH and Ruttenberg BI 2019 Spatial and temporal
variation of offshore wind power and its value along the Central California Coast Environmental Research Communications
1(12) p121001
26 Wang YH Walter RK White C Kehrli MD Hamilton SF Soper PH and Ruttenberg BI 2019 Spatial and temporal
variation of offshore wind power and its value along the Central California Coast Environmental Research Communications
1(12) p121001
27 The electricity portfolio must include enough firm capacity to meet coincident system peak plus additional 15 of planning
reserve margin (PRM) requirement
28 Hackett S and Anderson J 2020 California North Coast Offshore Wind Studies Economic Development and Impacts
Schatz Energy Research Center September 2020
29 Massachusetts Clean Energy Center 2017 Massachusetts Offshore Wind Ports amp Infrastructure Assessment May 2017 Available
at httpwwwmassceccomports
30 Porter A and Phillips S 2016 Determining the Infrastructure Needs to Support Offshore Floating Wind and Marine Hydrokinetic
Facilities on the Pacific West Coast and Hawaii US Bureau of Offshore Energy Management March 3 2016 Available at http
wwwdataboemgovPIPDFImagesESPIS55503pdf
31 Collier R 2017 High Road for Deep Water Center for Labor Research and Education University of California Berkeley CA
32 Garrick BJ and Wakefield DJ 2020 Probabilistic Risk Assessment of Nuclear Power Plant Spent Fuel Handling and Storage
Programs Methodology and Application to the Diablo Canyon Power Plant The B John Garrick Institute for the Risk Sciences at
UCLA and Pacific Gas and Electric Company February 17 2020
33 California Energy Commission 2019 Total System Electric Generation Available at httpswwwenergycagovdata-reports
energy-almanaccalifornia-electricity-data2019-total-system-electric-generation
34 Severy M and Jacobson A 2020 California North Coast Offshore Wind Studies Interconnection Constraints and Pathways
Schatz Energy Research Center September 2020
35 London Economics International LLC 2013 Analysis of the Macroeconomic Impacts of the Proposed Zephyr Transmission Project
May 20 2013 Available at httpwwwdatcllccomwp-contentuploads201306ZephyrEconomicBenefitsStudy-5212013pdf
36 Collier R 2017 High Road for Deep Water Center for Labor Research and Education University of California Berkeley CA
37 Collier R 2017 High Road for Deep Water Center for Labor Research and Education University of California Berkeley CA
38 Brightline Defense 2020 California Offshore Wind Winding up for Environmental Growth and Environmental Equity December
2020
39 US Census Bureau 2020
Economic Impact of Offshore Wind Farm Development on the Central Coast
76
40 SLO County BW Report 2018
41 SLO County BW Report 2018
42 US Bureau of Economic Analysis
43 SLO County BW Report 2018
44 US Bureau of Economic Analysis
45 wwwslocountycagov 2021 SLO County Monthly Labor Market Information - County of San Luis Obispo Available at https
wwwslocountycagovDepartmentsSocial-ServicesWorkforce-Development-BoardSLO-County-Monthly-Labor-Market-
Informationaspx
46 wwwblsgov 2021 Unemployment Rates for States Available at httpwwwblsgovweblauslaumstrkhtm
47 SLO County BW Report 2018
48 US Bureau of Economic Analysis 2020
49 US Bureau of Economic Analysis 2020
50 Private costs of OSW include the opportunity cost of delaying the time wind turbines spend on the water by the extra travel
days from a more distant port which will be passed through into consumer electricity prices though higher LCOE for the
change in duration the wind turbines produce electricity for the grid (ie the extra days required for transportation during
periods of turbine installation and repair)
51 Roland-Holst DW Behnke D Evans S Froumllund L and Yi-Chen A 2019 Economic Impact Assessment of the
Prospective Closure of the Diablo Canyon Nuclear Power Plant California Public Utilities Commission June 28 2019
52 Garrick BJ and Wakefield DJ 2020 Probabilistic Risk Assessment of Nuclear Power Plant Spent Fuel Handling and Storage
Programs Methodology and Application to the Diablo Canyon Power Plant The B John Garrick Institute for the Risk Sciences at
UCLA and Pacific Gas and Electric Company February 17 2020
53 A specialized wind port for OSW assembly and repair ultimately may be provided in a neighboring county however the
regional economic benefit considered in this report presumes the port is constructed in San Luis Obispo County
54 SLO County Assessorrsquos Office
55 State of California Board of Equalization httpswwwboecagovproptaxespdfPropValues2020pdf
56 NREL 2020 ATB
57 To the extent economies of scale exist in developing the transmission infrastructure for a 7 GW field of OSW using the NREL
cost approximation for a 1 GW OSW farm as a scalar for field development costs will over-estimate actual transmission
infrastructure costs for 7 GW field of OSW
58 The National Defense Authorization Act for FY2021 recently passed by US Congress includes amendments that ensure that
the Outer Continental Shelf Lands Act (OCSLA) applies to offshore wind farms The amendments have the potential to increase
the share of transportation costs captured by American-built vessels in the offshore wind fleet under the Jones Act
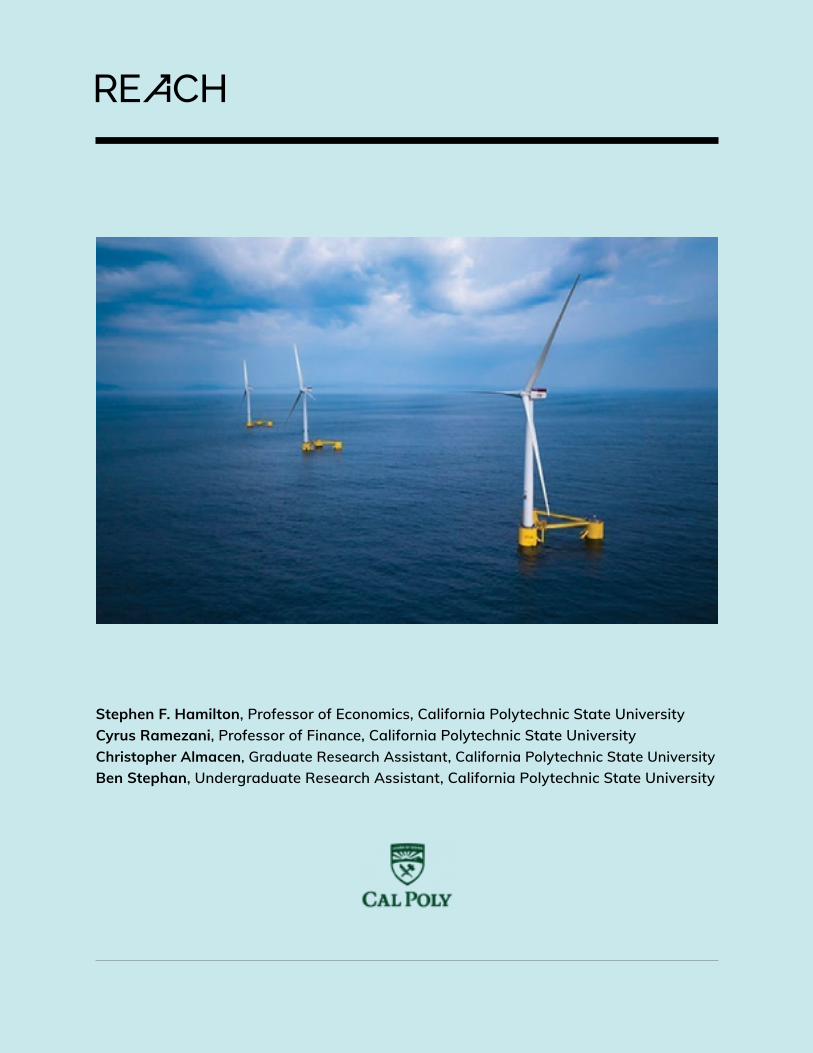
Stephen F Hamilton Professor of Economics California Polytechnic State University Cyrus Ramezani Professor of Finance California Polytechnic State UniversityChristopher Almacen Graduate Research Assistant California Polytechnic State University Ben Stephan Undergraduate Research Assistant California Polytechnic State University
Economic Impact of Offshore Wind Farm Development on the Central Coast
3
Table of ContentsExecutive Summary 041 Introduction 12
11 Recent Technological Advances Make Floating Offshore Wind Possible 13
12 Outlook for Offshore Wind in California 14
13 Economic Value of Offshore Wind 15
2 Industry Background amp Requirements 1821 Technology Description23
22 Offshore Wind Power Has a Favorable Time Profile on the Electricty Grid 24
23 Port Infrastructure Requirements 25
24 Transmission Infrastructure Requirements 29
25 Regional Supply Chain Development 30
26 Timing of Proposed Wind Farm Development 32
27 Employment and Output Demographics in San Luis Obispo County 33
3 Methods and Scope 3631 Scope of the Study 37
311 Specialized Wind Port 38
312 Develoment of Representative 1 GW OSW Farm 39
313 Decommissioning and Recommisioning Provisions for a 1 GW OSW Farm 40
32 Methods 42
4 Results 4541 Port Construction Impacts 46
42 Offshore Wind Development Impacts 47
421 OSW 1 GW Baseline with Decommissioning 48
422 OSW 1 GW Baseline with Recommissioning 53
423 Multiple OSW Farms The Case of 7 GW OSW Development 54
424 Smaller Scale Development The Case of 3 GW OSW 59
5 Fiscal Implications 6251 Property Taxes from Land Improvement at the Specialized Wind Port 63
52 Unitary Taxes on Electricity Transmission by PGampE 64
53 Sales and Use Taxes on OSW Spending 65
54 Sales and Use Taxes Corporate Taxes and Income Taxes from Affiliated Spending 65
55 Summary of Fiscal Implications 66
6 Conclusion 68References 71
Economic Impact of Offshore Wind Farm Development on the Central Coast
4
EXECUTIVE SUMMARY
Economic Impact of Offshore Wind Farm Development on the Central Coast
5
EXECUTIVE SUMMARY
As the State of California continues to transition toward being 100 powered by renewable energy by 2045 offshore wind (OSW) is poised to provide a substantial contribution to the statersquos green energy portfolio Developing OSW energy resources along Californiarsquos Central Coast mdash as underpinned by current plans by the US Bureau of Ocean Energy Management (BOEM) to auction federal waters in the OSW planning area for up to 7 gigawatts (GW) of OSW development mdash has the potential not only to reduce carbon emissions on the electricity grid but also to stimulate broad-based economic growth create quality jobs in green energy and benefit regional communities in and around San Luis Obispo County
Recent advances in floating OSW technology have greatly reduced the cost of producing electricity opening the door for commercial OSW farms to be developed in California With the ocean floor along Californiarsquos coast sloping steeply downward into deep waters offshore wind turbines must be installed on floating platforms rather than being fixed to the ocean floor in shallow waters as is done along the East Coast and much of Europe Given the physical scale and logistical complexity of developing floating OSW farms in California including the need to develop an extensive supply chain to capture these benefits meeting Californiarsquos long-term climate goals will require considerable coordination between government and industry to make the economic potential of OSW a reality
This report analyzes the regional economic benefit to San Luis Obispo County for 3 to 7 GW of OSW development along Californiarsquos Central Coast The regional economic benefit considered in this report provides a dynamic summary of the green job opportunities value added and fiscal returns from the project over time as a result of recurring project spending to meet the needs of an emerging OSW industry in the county
The regional economic benefit fits within a larger context of economic benefits from green energy development in the State of California The overarching economic benefit of OSW in California is derived from its ability to deliver electricity to the grid at minimum social cost It is not possible to convert energy into power without cost and minimizing the social cost of producing electricity on the grid must consider both private costs (what electricity suppliers must pay) and external costs (eg greenhouse gas emissions wildlife disruption) The statersquos ambitious goal of achieving a
Meeting Californiarsquos long-term climate goals will require considerable coordination between government and industry to make the economic potential of OSW a reality
Economic Impact of Offshore Wind Farm Development on the Central Coast
6
zero-carbon renewable electricity mix by 2045 implicitly places a large weight on greenhouse gas emissions in the calculation of social cost tilting the economic balance toward the evaluation of carbon-free electricity projects that minimize private costs
Relative to other renewable energy resources OSW has a favorable time profile of electricity delivery OSW farms produce peak electricity during evening hours reducing storage needs when mixed in a renewable energy portfolio with solar power generation that delivers peak energy in the middle of the day Relative to commercial solar power OSW energy can generate electricity around the clock resulting in a capacity factor of 50 almost double that of commercial solar power1 The levelized cost of energy ($MWh) which represents the long-run average cost of electricity generation over the life of a power plant is approaching parity with commercial solar photovoltaic systems and nuclear power as recent technological advances have greatly reduced the cost of floating OSW 2
An important challenge for floating OSW energy development is minimizing transportation and logistical costs between the OSW field and the specialized wind ports that serve them Given the massive size of OSW turbines final assembly must take place in reinforced quays at a port either at a waterfront manufacturing hub (likely in Asia) or at a specialized wind port that receives floating foundations towers and turbines from the manufacturing center and assembles them locally Developing a specialized wind port provides a foothold for regional economic values to be generated in California by providing assembly maintenance and repair jobs for turbines that might otherwise be towed into federal waters off Californiarsquos coast from international manufacturing centers
The economics of OSW development are driven by tremendous fixed costs that must be incurred up front to make floating OSW power a reality The National Renewable Energy Laboratory (NREL) estimates that installing an OSW farm with 1 GW nameplate capacity involves investing largely unrecoverable capital expenditures (CapEx) of more than $55 billion which requires OSW turbines to be maintained and connected to the electricity grid for extended periods of time to recoup the initial upfront investment The economics of energy projects that involve high fixed costs and low variable costs favor maximizing the time OSW turbines spend on the water generating electricity for the grid as the opportunity cost of down time for turbine maintenance and repair can quickly erode the economic value of OSW The need to maintain OSW turbines for a large number of days on the water to recoup the initial capital investment in turn highlights the need to develop specialized
wind ports for assembly and repair of wind turbines in close proximity to the OSW farms
The center for job creation from floating OSW farms will be at the ports For this reason the regional economic value calculated in this report presumes a specialized wind port is available to assemble and repair floating OSW turbines in San Luis Obispo County
Making economic benefits from OSW development a reality for San Luis Obispo County will require developing a specialized wind port as a hub for OSW jobs and regional supply-chain development
Economic Impact of Offshore Wind Farm Development on the Central Coast
7
In the event a specialized port is not constructed in the county the regional economic benefits considered here will not materialize in San Luis Obispo County but instead will occur in the county that provides the port Making economic benefits from OSW development a reality for San Luis Obispo County will require developing a specialized wind port as a hub for OSW jobs and regional supply-chain development An important next step to attaining the economic benefits detailed in this report is to conduct a feasibility study for developing a specialized wind port in San Luis Obispo County
The economic benefit of OSW development on the Central Coast is derived from the following activities port construction planning assembly operation and maintenance (OampM) and decommissioning (recommissioning)
Virtually all the jobs to support these activities will occur at the specialized wind port which is the physical entity that ties OSW farms located in federal waters to a staging area on Californiarsquos coast
Unlocking Californiarsquos offshore wind energy potential is a case study in the challenges and opportunities involved in the 21st-century clean energy transition Deploying floating OSW farms off Californiarsquos coastline will require developing an entirely new industry in California that must surmount major transmission infrastructure requirements address electricity storage needs and provide integrated resource planning to smooth the timing of electricity delivery from solar land-based wind offshore wind hydropower and geothermal sources in a renewable energy portfolio The emerging OSW industry in California currently lags far behind China and the EU in supply-chain development and its success will depend largely on coordinated policy decisions by state and regional government to provide clear market signals for stakeholders
Investor confidence is needed to develop regional supply chains for OSW energy development in California In-state production of the full range of OSW farm components including turbines and floating foundations is not a reality today but is possible if state and federal planners send clear signals to OSW developers that investing in OSW manufacturing capacity in California will be rewarded by long-term market development If state planners fail to provide clear market signals on the outlook for OSW in California it is likely that much of the supply chain will continue to be outsourced to international manufacturing hubs in China and South Korea for turbines and floating foundations reducing the potential for economic benefits to be realized over time in California
The regional economic benefit of OSW development considered in this report does not include additional values that can be created through the long-term development of manufacturing capacity for turbines and floating foundations in California Indeed the current gap between Californiarsquos capability for OSW manufacturing and the rest of the world remains large Instead the report considers the construction and operation of a small specialized wind port in San Luis Obispo County that acts as a receiving point for manufactured components and engages in the assembly repair and maintenance of floating OSW turbines
A key implication of the study is that the regional economic value of OSW farm development off the Central Coast of California will be largely captured by the county that develops a specialized wind port for assembly and repair of OSW turbines Given the large scale of offshore wind turbines which
Economic Impact of Offshore Wind Farm Development on the Central Coast
8
are many times larger than onshore turbines it is not possible to transport OSW turbines by truck or rail requiring these activities to take place directly at a port For this reason installing operating and maintaining a field of 3 - 7 GW of OSW farms in the region will require developing an extensive supply chain to support the hub of economic activity centered at the specialized wind port
The economic benefit to San Luis Obispo County from OSW farm development is defined by several key phases
bull construction of a specialized wind portbull assembly of OSW turbines at the portbull an operation and maintenance (OampM) period that relies on the specialized wind port to repair
and maintain OSW turbinesbull a decommissioning (or alternatively recommissioning) period at the end of each 30-year lease
With current technology all phases of floating OSW development will take place in a port either by making use of a specialized wind port for final assembly of OSW turbines in California or by floating fully assembled structures into place directly from existing manufacturing centers in Asia
The main findings of the report are as follows Table E1 shows regional job and output creation during the 5-year construction phase of the specialized wind port
Table E2 shows the total job and output for a representative 1 GW OSW farm over a 35-year horizon through 2058 that includes planning assembly a 25-year period for operation and maintenance and a 3-year decommissioning period Economic output includes local spending on labor materials and services and does not include the value of the energy created The value of the representative 1 GW OSW farm is in addition to the value created during the 5-year period of port construction
Table E1 Output and Job Creation from Port Construction
RegionFull-Time
Equivalent JobsTotal Output (million $s)
San Luis Obispo County 11825 $202261
Santa Barbara County 234 $3896
Monterey County 28 $577
Rest of California 3837 $92956
California Total 15925 $299689
Economic Impact of Offshore Wind Farm Development on the Central Coast
9
Table E3 provides a breakdown of the regional economic benefit to San Luis Obispo County in terms of average wages employee compensation and total output resulting from direct project spending indirect activity stimulated through supply-chain development and induced economic activity from employee spending Employee compensation includes wages and fringe benefits paid for by employers
Table E4 compares the annual average economic benefit from operating a mature 3 GW vs 7 GW field of OSW farms These values are based on a scenario of perpetual lease renewal in which OSW turbines are floated back to the specialized wind port for recommissioning at the end of each lease followed by redeployment of OSW turbines for subsequent use The values are based on a perpetual OampM period that begins on the date of final installation of the field in a perpetual cycle of maintenance and repair through the end of the service life of each 1 GW OSW farm The annual economic benefit of maintaining a mature field of OSW farms is in addition to the economic benefit from construction of a specialized wind port in Table E1
Table E3 Regional Economic Impact of a 1 GW Wind Farm in San Luis Obispo County
ImpactFull-Time
Equivalent Jobs
Average Job Compensation ($
year)
Employee Compensation
(million $s)Total Output (million $s)
Direct 3490 $88650 $30941 $162674
Indirect 2308 $66076 $15251 $57822
Induced 814 $74884 $6093 $24760
Total Economic Impact 6612 $79076 $52285 $245256
Table E2 Output and Job Creation from a 1 GW Wind Farm with Decommissioning
RegionFull-Time
Equivalent JobsTotal Output (million $s)
San Luis Obispo County 6612 $245256
Santa Barbara County 364 $7766
Monterey County 58 $1189
Rest of California 4333 $116470
California Total 11368 $370681
Economic Impact of Offshore Wind Farm Development on the Central Coast
10
Table E5 compares the annual fiscal benefits from taxes collected at the county and state level from perpetual operation of a mature 3 GW vs 7 GW field of OSW farms Economic benefits are particularly important to San Luis Obispo County given the planned closure of the Diablo Canyon Power Plant (DCPP) The development of OSW farms just beyond sightlines from the Central Coast could be particularly beneficial to San Luis Obispo County by providing jobs in the affiliated green energy sector of the regional economy
Table E5 Summary of Annual Fiscal Benefits from 3 GW vs 7 GW OSW
3 GW Field 7 GW Field
Tax BasisCounty Taxes (million $yr)
State Taxes (million $yr)
County Taxes (million $yr)
State Taxes (million $yr)
Specialized Wind Port
Property Taxes $1700 $2500
OSW Capital Spending $2133 $4978
Transmission Infrastructure
Unitary Taxes $434 $1012
Regional Spending
Corporate Income Tax $170 $421
Personal Income Tax $1826 $5447
Retail Sales Tax $702 $2088
Total $2134 $4831 $3512 $12933
Table E4 Annual Output and Job Creation from Maintaining a 3 GW vs 7 GW Field of OSW Farms in Perpetuity
3 GW Field 7 GW Field
Type of Tax FTE Jobs Output (millions) FTE Jobs Output (millions)
San Luis Obispo County 617 $25454 1389 $68601
Santa Barbara County 33 $795 80 $2114
Monterey County 5 $119 13 $317
Rest of California 443 $13237 1006 $33123
California Total 1098 $39605 2488 $104154
Economic Impact of Offshore Wind Farm Development on the Central Coast
11
Over time economic opportunities can change in ways that are difficult to predict prior to the initial investment As installed wind farm capacity in California increases over time both in Central California as well as other regions it is likely that regional supply chains develop further This would occur through cost-reducing learning effects and potentially even through the creation of a manufacturing industry for floating OSW foundations towers and turbines in California that would allow a greater share of inputs to be locally sourced from producers in the state Coordinated development of OSW in California and elsewhere in the US has the potential to greatly expand the regional economic impact for a given level of capital expenditure
Unlocking Californiarsquos offshore wind energy potential is a case study in the challenges and opportunities involved in the 21st-century clean energy transition
Economic Impact of Offshore Wind Farm Development on the Central Coast
12
SECTION 2
INTRODUCTION
Economic Impact of Offshore Wind Farm Development on the Central Coast
13
1 INTRODUCTION
As the State of California moves toward meeting its ambitious clean energy and climate goals mdash underscored by targets to reduce greenhouse gas (GHG) emissions from 1990 levels by 40 by 2030 and 80 by 2050 and to achieve a zero-carbon renewable electricity mix by 2045 mdash offshore wind (OSW) is poised to provide a substantial contribution With 112 GW of technical offshore wind resource potential along its coastline the OSW energy sector alone is capable of meeting more than 15 times the statersquos annual electricity demand
Californiarsquos current power supply has already started to shift toward renewable zero-carbon sources In 2019 the State of California derived approximately 32 of its electricity from renewable sources (including 12 solar and 10 onshore wind) and 55 GHG-free including 9 nuclear power (16163 GWh) from Diablo Canyon Power Plant (DCPP)3 Yet despite the recent development of commercial solar power in California including four commercial solar plants in San Luis Obispo County the growth of zero-emission electricity supply is not on target to meet Californiarsquos clean energy goals Based on recent emissions inventory data California emitted 424 million metric tons (MMT) of CO2e in 2017 which implies that reducing statewide emissions below the 260 MMT of carbon dioxide equivalent (CO2e) limit by 2030 will require reducing emissions by an average of 13 MMT of CO2e annually nearly double the annual rate of 7 MMT of CO2e achieved over the past decade4
Much of the movement toward clean energy supply will need to take place on Californiarsquos electricity grid On January 28 2021 General Motors Co set an ambitious target to completely phase out gasoline- and diesel-powered vehicles globally by 20355 The movement of large automakers to the electricity grid compounds the findings of recent California Energy Commission (CEC) and California Public Utilities Commission (CPUC) studies that indicate the state will require two to six times more renewable power capacity by 2050 than is installed today to meet its policy goals under AB 32 implying a need for between 100 to 150 GW of new renewable power capacity6
11 RECENT TECHNOLOGICAL ADVANCES MAKE FLOATING OFFSHORE WIND POSSIBLE
Unlike the coastline on the East Coast of the US the ocean floor slopes steeply downward into deep waters off the California coastline requiring the use of floating platforms for OSW Recent advances in floating platform technologies for OSW turbines have greatly reduced the cost of developing floating OSW farms making it possible to build OSW farms to scale in California that rival the generation capacity of fixed platform technologies as used over the past several decades in the shallower waters off the East Coast and Europe Floating wind technology which relies on mooring lines and anchors to tether platforms to the ocean floor has the advantage of allowing offshore wind turbines to be placed further from shore where the wind speeds are generally faster and more consistent allowing greater power generation while limiting sight impacts from shore While the technology for floating OSW has been demonstrated successfully in pilot projects around the world
Economic Impact of Offshore Wind Farm Development on the Central Coast
14
a commercial scale floating offshore wind farm has not yet been deployed in the United States7
The Bureau of Ocean Energy Management (BOEM) recently initiated the leasing process for three potential offshore wind sites in approximately 687832 acres of federal waters off the California coast to be auctioned for commercial OSW production as early as 20228 BOEM identified Call Areas located off the coast of Central California and the northernmost region of the state (Humboldt Bay) Additionally two more sites (Del Norte and Cape Mendocino) were identified in studies by BOEM and the National Renewable Energy Laboratory (NREL) for potential future OSW development Together development of the initial Call Areas identified by BOEM could support approximately 9 GW of offshore wind development up to 7 GW of which is in the OSW planning area on the Central Coast The development of 7 GW of OSW in the Central Coast OSW planning area would provide roughly 11 of the statersquos current electricity needs (30660 GWh out of 277704 GWh in Californiarsquos 2019 energy mix)9
Floating offshore wind technology which is relatively new has already demonstrated impressive capacity factors of over 50 percent roughly twice that of commercial solar10 The capacity factor of OSW is greater than that of commercial solar because OSW can generate electricity 24 hours a day11 and recent engineering studies project that Californiarsquos floating offshore wind turbines could reach capacity factors of over 70 percent of their maximum theoretical output12
12 OUTLOOK FOR OSW IN CALIFORNIA
The development of OSW energy which has not been featured prominently in Californiarsquos resource planning analyses to date offers several distinct advantages over alternative renewable energy sources Unlike commercial-scale solar power and onshore wind where many of the most productive sites in California have already been developed OSW represents a large and highly scalable resource in California that remains largely untapped Although OSW development is subject to siting concerns such as exclusion zones from the Department of Defense and Marine Protected Areas (MPAs) and entails potential impacts to local fisheries marine mammals and ocean shipping lanes the development of OSW remains relatively unimpeded by the property rights concerns associated with developing onshore resources OSW farms can also be located close to coastal load centers and make use of available transmission capacity eliminating the need to install costly transmission lines to deliver electricity to the California grid
Developing OSW technology in California will require significant capital investment In the US total investment in the offshore wind industry is expected to reach $17 billion by 2025 $108 billion by 2030 and $166 billion by 2035 roughly two-thirds of which will go to the construction industry 25 to the turbine OampM and associated supply chain with much of the remainder
Investment in the offshore wind industry in the US is expected to reach $17 billion by 2025 $108 billion by 2030 and $166 billion by 2035
Economic Impact of Offshore Wind Farm Development on the Central Coast
15
allocated to the transportation industry and ports13
As OSW technology continues to develop it is rapidly becoming cost-competitive with traditional energy sources making floating OSW farms capable of achieving acceptable commercial returns A recent study indicates that including offshore wind in the statersquos energy mix would produce ratepayer savings of approximately $1 to $2 billion by 2040 on a net present value (NPV) basis with floating OSW becoming part of the least-cost portfolio by 203014
Before offshore wind platforms can be constructed suitable ports must be established for staging and assembly of floating turbines onshore Because offshore floating turbines are larger than land-based wind turbines with expected heights exceeding 700 ft turbine blades for OSW are too large to be transported on existing highways or rail lines requiring the assembly of turbines on floating platforms to occur quayside with finished wind turbines delivered by ship directly from the specialized wind port to the offshore site where the moorings and anchors are placed For this reason the specialized wind port is the center for job creation from OSW development Virtually all supply chains that develop to meet the unique requirements of offshore wind originate and terminate at the specialized wind port
This report evaluates the economic impact to San Luis Obispo County and the State of California from the development of one or more OSW farms and the associated port and transmission infrastructure in and around the Morro Bay Call Area The Central California region is ideal for offshore wind development for several reasons
bull Wind speeds are generally strong15 bull The region has existing connections to the statersquos electrical grid bull Much of the coast is outside of national marine sanctuaries where disturbance to the seabed is
prohibitedbull The region is favorably positioned between major population centers with high power demand
in Northern and Southern California
13 ECONOMIC VALUE OF OFFSHORE WIND
When evaluating the regional economic stimulus created by OSW development in San Luis Obispo County it is important to place these values in context with the overall economic value of OSW development for California The overall economic benefit of OSW is captured by transactions between electricity providers and consumers (households and businesses) in Californiarsquos electricity market Consumer benefits in the electricity market are greatest when electricity prices are low Because converting energy to power requires cost the most valuable sources of power in an electricity portfolio are those that deliver electricity to the grid at the lowest cost Indeed for a fixed amount of electricity generation to meet consumer demand economic benefits are maximized when electricity is supplied to consumers at minimum cost
One difficulty in assessing the economic value of renewable energy sources is the distinction between private and social cost The economic value is greatest for an energy portfolio that meets consumer demand at minimum social cost which is the sum of private cost and external cost Private costs reflect actual costs incurred by electricity suppliers for instance the levelized cost
Economic Impact of Offshore Wind Farm Development on the Central Coast
16
of electricity (LCOE) used to evaluate energy investments over time while external costs refer to costs society incurs that are not captured in the electricity market for instance the cost imposed on future generations from GHG emissions today16 For this reason a coal-fired electricity plant may have lower private costs than a floating OSW farm while the wind farm nevertheless has lower social costs a distinction that can be lost when comparing different potential energy sources based strictly on private costs such as the LCOE
Another difficulty in assessing the economic value of renewable energy sources is the distinction between fixed and variable cost In the case of OSW energy substantial fixed costs must be sunk up front to assemble install and connect floating wind turbines to the electricity grid however once this investment has been made the turbines generate electricity at extremely low marginal cost during their entire period of operation A relevant factor that underpins the economic value of a renewable energy project is the LCOE which represents the average cost of electricity generation over the life of the project Because fixed costs are so high to install floating OSW turbines and marginal costs are so low the LCOE for OSW is highly sensitive to the duration in which a wind turbine can be deployed Minimizing the LCOE from an OSW project involves maximizing the time a wind turbine is operating on the water providing electricity at low marginal cost to the grid
Economic values considered in this report focus on the regional economic impact of a given level of project spending on job creation and economic output in San Luis Obispo County Specifically the values calculated in this report provide a mapping from a given amount of direct investment in capital and labor in the county to the economic output and jobs that result from regional supply chain development and the affiliated increase in sales and output that spill across other regional industries from the spending of workers and business who derive income from the project (ie the economic ldquomultiplierrdquo)
The regional economic benefit to developing OSW farms in San Luis Obispo County represents only the value captured by the regional supply chain for a given amount of direct spending on OSW The proper interpretation of the results is the projected economic value realized by San Luis Obispo County from a given level of project spending (private cost) rather than the overall economic benefit that results from minimizing the social costs of electricity generation
To understand this distinction consider the effect of increasing the distance between OSW farms off the coast of Central California and the specialized wind port that serves them As the distance increases between the OSW farms and the specialized wind port the LCOE rises due to increased transportation and logistical costs of wind turbine installation and repair reducing time on the water for wind turbines to operate and resulting in higher electricity prices The overall economic value of the OSW project decreases over distance from the specialized wind port compounded by an increase in the external costs of carbon emissions in the transportation sector However because private costs are higher for OSW projects that involve greater distances to the specialized wind port locating OSW farms farther away from the port raises the economic value of the project to the regional economy for instance by adding jobs in the water transportation industry Put differently the economic value to the regional economy will appear larger as the distance increases between the OSW farms and the port whereas the overall economic value of the OSW project is larger when OSW
Economic Impact of Offshore Wind Farm Development on the Central Coast
17
farms are situated in closer proximity to the specialized wind ports
While developing projects with lower LCOE and lower external costs from pollution in the transportation sector provide the greatest overall economic value projects with higher LCOE provide greater stimulus to the regional economy Thus the proper interpretation of the regional economic values calculated in this report are the impacts to San Luis Obispo County from a fixed level of project spending
01 Wind speeds are generally strong
02 The region has existing connections to the statersquos electrical grid
03 Much of the coast is outside of national marine sanctuaries where disturbance to the seabed is prohibited
04 The region is favorably positioned between major population centers with high power demand in Northern and Southern California
THE CENTRAL CALIFORNIA REGION IS IDEAL FOR OFFSHORE WIND
DEVELOPMENT FOR SEVERAL REASONS
Economic Impact of Offshore Wind Farm Development on the Central Coast
18
SECTION 2
INDUSTRY BACKGROUND AND REQUIREMENTS
Economic Impact of Offshore Wind Farm Development on the Central Coast
19
2 INDUSTRY BACKGROUND AND REQUIREMENTS
Interest is growing for the development of OSW in California as large-scale adoption of renewable energy is needed to substitute for fossil fuel-generated electricity under the statersquos ambitious climate goals
Along the coastline of California the ocean floor slopes steeply downward into deep waters requiring the use of floating platforms for OSW as opposed to platforms fixed to the ocean floor like those currently used in shallower waters along the East Coast Recent advances in floating platform technologies have greatly reduced the cost of developing floating OSW farms making it possible to build OSW to scale in California Floating OSW farms have the potential to provide California with a reliable source of renewable energy that can deliver electricity to Californiarsquos homes and business during times of peak energy demand while operating largely at distances beyond the sightlines of coastal property (See Figure 21)
According to NREL Californiarsquos offshore technical resource capacity is about 112 GW17 BOEM has initiated plans to develop OSW power off the coast of California in a recent call for information from companies interested in purchasing commercial wind energy leases in federal waters off the coast of Central and Northern California Specifically the Call Areas for BOEM identify three potential OSW sites off the coast of California Humboldt Bay Morro Bay and Diablo Canyon The Central California Call Area offers a combined electricity generation capacity of 7 GW for OSW
Developing OSW energy on the Central Coast to its full potential will require cooperation from the US Department of Defense (DOD) Following the announcement of the BOEM Call Areas in 2018 DOD assessments found OSW development in the region to be incompatible with the wide array of critical DOD operations citing significant mission activities in the Diablo Canyon Call Area18
Figure 21 Schematic of a Floating Offshore Wind Farm
Source BOEM California Offshore Renewable Energy Fact Sheet February 22 2017
Economic Impact of Offshore Wind Farm Development on the Central Coast
20
Subsequently a group comprised of DOD BOEM NOAAs Office of National Marine Sanctuaries Congressman Carbajal and Congressman Panetta has focused on expanding the OSW planning area by considering potential development areas proximate to and within the Morro Bay Call Area that may be compatible with DOD operations While the Diablo Canyon Call Area may not be developed due to other ocean use and environmental conflicts there is sufficient sea space in and around the Morro Bay Call Area to support 7 GW of OSW
Figure 22 shows the Morro Bay and Diablo Canyon Call Areas initiated by BOEM and Figure 23 shows a proposed modification to the Morro Bay planning area that would accommodate 7 GW of OSW development in and around the Morro Bay Call Area19
Developing up to 7 GW of OSW farm capacity in and around the Morro Bay Call Area has the advantage of making use of available grid interconnections in San Luis Obispo County through the existing 500-kV transmission lines at Diablo Canyon and Morro Bay However realizing the renewable energy potential for floating OSW energy development in and around the Morro Bay Call Area represents a massive undertaking for Central California communities
Figure 22 The Morro Bay and Diablo Canyon Call Areas
Source BOEM California Activities httpswwwboemgovcalifornia
Economic Impact of Offshore Wind Farm Development on the Central Coast
21
The deployment of floating OSW platforms presents complex manufacturing logistical and maintenance challenges Making OSW a reality for California will require development of an extensive regional supply chain much of which has the potential to be centered in San Luis Obispo County To ensure that critical elements of this supply chain take root in California providing jobs and income for Central Coast residents (as opposed to outsourcing these needs to other regions) the development of OSW farms will require major upgrades to Central Californiarsquos infrastructure for ports transportation and transmission
Three elements are imperative for success in OSW development
bull the availability of a specialized wind port and port infrastructurebull ensuring enough transmission capacity and interconnection to the electric gridbull access to a reliable well-trained workforce for wind farm construction and OampM
The payoff to the San Luis Obispo County region for developing a regional supply chain for OSW power is the creation of a green energy sector that can provide head-of-household jobs health and retirement benefits and career opportunities for workers in the green economy including the potential to deliver jobs to workers from disadvantaged communities20
Figure 23 Proposed Expansion to the Morro Bay Call Area
Source American Wind Energy Association California and Offshore Wind California 2020
Economic Impact of Offshore Wind Farm Development on the Central Coast
22
01 The availability of a regional port and port infrastructure
02 Ensuring enough transmission capacity and interconnection to the electric grid
03 Access to a reliable well-trained workforce for wind farm construction and OampM
THREE ELEMENTS ARE IMPERATIVE FOR SUCCESS IN OSW
DEVELOPMENT
The payoff to the San Luis Obispo County region for developing a regional supply chain for OSW power is the creation of a green energy sector that can provide head-of-household jobs health and retirement benefits and career opportunities for workers in the green economy including the potential to deliver jobs to workers from disadvantaged communities
Economic Impact of Offshore Wind Farm Development on the Central Coast
23
21 TECHNOLOGY DESCRIPTION
California differs from the Northeast US in that its deep coastal waters require a different type of offshore wind technology floating platforms for wind turbines Floating platform technology for OSW has been successfully demonstrated in multiple jurisdictions worldwide with larger-scale commercial projects being planned and contracted for deployment in the near future While the cost of floating offshore wind today remains higher than the fixed-bottom offshore wind that prevails on the East Coast the technology is now well understood and the cost of OSW power is expected to decline rapidly with the scale of deployment as commercialization continues
Each floating offshore wind system consists of a commercially available floating support structure and a large offshore wind turbine generator The proposed plant located approximately 45 km offshore is expected to have between 70 and 100 floating windmills
Floating OSW technology requires no piling making it well-suited for deep and variable seabed conditions Each floating windmill is attached by anchor to the sea floor as seen in Figure 24
Floating OSW technology has other benefits over fixed OSW foundations as well Floating wind turbines can be larger anchored in deeper water towed back to shore for major repairs and upgrades and safer for ground risk shore-side assembly and deployment further offshore compared to fixed OSW foundations22
There are four basic components of an OSW turbine the tower nacelle hub and blades These components (OSW turbines to towers and floating platforms) are all delivered by marine vessels for final assembly in bays within the specialized wind port Before any components are attached to
Figure 24 Floating OSW
Source Lou Thomas and Wu (2019)21
Economic Impact of Offshore Wind Farm Development on the Central Coast
24
the floating platform at the specialized wind port the hub is connected to the nacelle and attached to the tower which is typically composed of three or four different segments The bottom segment of the tower is attached to the floating platform the remaining tower segments are stacked on top of the structure and then the assembled nacelle-hub is attached to the top of the tower by a crane where the turbine blades are attached to complete the assembly of the OSW turbine23 Once the turbine is attached to the floating platform as a finished OSW turbine the floating platform is connected to a ship and transported to the offshore windfarm location (see Figure 25) where it is installed to anchors and moorings on the offshore site24
Each OSW farm which is projected to have a nameplate capacity of 1 GW is composed of arrays of individual OSW turbines The capacity of an individual OSW turbine to generate power is currently in the range of 3 MW to 15 MW For the baseline 1 GW OSW farm considered in this report a 1 GW OSW farm consists of 100 individual wind turbines each with a 10 MW nameplate capacity
22 OSW POWER HAS A FAVORABLE TIME PROFILE ON THE ELECTRICITY GRID
OSW power on the Central Coast of California (CCC) provides electricity at favorable times Offshore wind power on the CCC peaks each day during evening hours and reaches its maximum potential during spring and summer months of the year This timing profile for power delivery matches favorably with wholesale energy prices on the California Independent System Operator (CAISO) electricity grid Electricity demand is highest during the summer and peaks at around 6 pm in summer months (Wang et al 2019)25 In contrast solar and onshore wind generation peak at times of relatively low electricity demand creating problems for reliability and functionality of the grid Solar power production peaks around noon whereas land-based wind peaks around midnight
Figure 25 Transportation of an Assembled OSW Turbine
Source Principle Power 2011
Economic Impact of Offshore Wind Farm Development on the Central Coast
25
The timing of peak offshore wind power production aligns well in a portfolio of energy sources that provide peak power at different times Developing a reliable electricity portfolio by combining renewable sources smooths out deliveries on the grid relaxing supply constraints in a system with limited storage capability26
Combining OSW with onshore wind and solar power results in a more reliable delivery profile for renewable energy that better matches with electricity demand Superior matching displaces reliance on carbon-intensive natural gas (ldquopeakerrdquo) plants during evening hours and as fossil-fuel based electricity sources are phased out over time in California reduces reliance on costly grid-scale lithium-ion battery storage
Figure 26 demonstrates the hourly value of OSW in a renewable energy portfolio The value of electricity generated at different times is represented by the RESOLVE price calculated by Energy and Environmental Economics (E3) The RESOLVE model estimates the optimal price of alternative energy solutions during each hour of the day taking into account hourly operations of alternative energy solutions during each hour of the day the intraday variability of load and renewable generation planning reserve requirements and an annual greenhouse gas constraint that the whole system must operate at a level of emissions below the maximum emission cap27
23 PORT INFRASTRUCTURE REQUIREMENTS
The large size of modern OSW turbines limits the transport of finished products over land As a result the final assembly of OSW towers which involves attaching turbine blades to floaters must
Figure 26 The Diurnal Pattern of Offshore Wind Power and Energy Prices
Source Energy and Environmental Economics Inc 2019
Economic Impact of Offshore Wind Farm Development on the Central Coast
26
occur at a waterfront location with a large amount of acreage a specialized wind port facility and quays that have been reinforced to withstand heavy loads
The development of a regional supply chain for OSW in this report assumes that suitable specialized wind port facilities will be available for manufacturing and assembly of OSW turbines Two alternatives appear potentially viable for OSW development on the Central Coast
bull construction of a specialized wind port in San Luis Obispobull assembly at other ports in California such as Oxnard (Port Of Hueneme) Long Beach San
Diego and Eureka where the Port of Humboldt Bay has been proposed to be refurbished as a specialized wind port for the assembly of OSW turbines28
Because the existing capacity for floater assembly is lacking on the West Coast the manufacturing of floating foundations for OSW turbines will likely occur outside of the US The role of the specialized wind port is to conduct final assembly of the wind turbine in a staging area situated as near as possible to the OSW farm to economize on transportation cost and logistical issues during installation repair and decommissioning of OSW farms Based on the experience of OSW farms in the UK the tower pieces are imported from Denmark or Spain with final assembly occurring on-site in reinforced quays For OSW farm development on the Central Coast the height of some components limits the location of a specialized wind port to those without height limitations from features such as bridges which precludes use of the Port of Oakland due to clearance limits on the Bay Bridge and Golden Gate Bridge
As the distance increases between the OSW farm and the specialized wind port where final assembly occurs the levelized cost of energy (LCOE) rises due to the additional transport cost Greater distances between OSW farms and the specialized wind port makes projects less practical for industry partners seeking to provide zero-carbon electricity to consumers at minimal cost The LCOE rises over distance from the port not only due to transportation costs and the related logistical issues associated with scheduling shipping lanes but also due to the high opportunity cost of removing OSW turbines from the water for repair Repair of OSW turbines with existing technology requires removing floating OSW structures from offshore mooring and towing the structures into the specialized wind port which requires scheduling shipping lanes and arranging transport during periods of relatively calm seas
Given the high fixed cost and low variable cost of generating electricity from OSW the economics of OSW favor keeping OSW turbines on the water and connected to the grid for as long a period as possible to recover the sunk cost of installing them Distance from the port reduces the number of days OSW turbines are on the water which erodes the economic benefit to California from developing OSW farms
The Massachusetts Clean Energy Center (MassCEC) conducted a detailed assessment of port construction requirements for OSW in 2017 including the potential for both turbine and foundation manufacturing A major finding of the study was that the sheer distance required to transport OSW components from overseas is likely to incentivize investment in US manufacturing facilities29 At the present time it is anticipated that both floating platforms and turbines for OSW will be shipped
Economic Impact of Offshore Wind Farm Development on the Central Coast
27
to California from overseas likely from South Korea or China then received at a specialized wind port for final assembly and installation on an OSW farm
The specialized wind port where assembly occurs must have protected waters and no overhead obstruction for fully assembled turbines to be towed out standing to the offshore site (see Figure 27) The sheer scale of OSW turbines imposes land requirements for manufacturing to take place in the specialized wind port Providing throughput of 500 MW per year of OSW at the port with the 10-15 MW turbines available today will require about 50 acres of land for movement storage and assembly
In 2016 BOEM commissioned a study on the suitability of various California ports for OSW assembly The study identified Port Of Hueneme as the most suitable existing port for OSW assembly followed by Long Beach and San Diego30 However as Collier (2017) reports all of the recommended ports suitable for OSW assembly are constrained by available land adjacent to the port that would be necessary for manufacturing31 In the case of Port Of Hueneme land constraints limit the ability of the port to take on new manufacturing without making use of land on the existing Navy yard and logistical problems arranging transportation through the Santa Barbara Channel hamper its ability to serve as a specialized wind port for multiple large-scale OSW farms off the Central Coast
Apart from making use of existing ports another possibility is to develop one or more specialized ports for assembly of OSW turbines in California Humboldt Bay in Eureka has a deep-water harbor
Figure 27 Turbine Assembly and Assembled Turbine in Port
Source Principle Power 2011
Economic Impact of Offshore Wind Farm Development on the Central Coast
28
and vast expanses of vacant industrial land that can be developed for OSW turbine (and even floater) assembly however the use of Humboldt Bay for OSW development faces major logistical challenges for land transport and the region lacks grid interconnection as a hub for OSW In contrast the Central California area offers reliable grid interconnection at Morro Bay Power Plant (MBPP) and Diablo Canyon Power Plant (DCPP) but lacks a deep-water port
While it may be possible to serve floating OSW farms in Central California from Port Of Hueneme or an expanded port facility in Humboldt Bay the economic practicality of installing and maintaining OSW farms from distant ports will require a reliability study Given the need to maintain OSW turbines on the water and keep them connected to the grid to recover the significant fixed costs of OSW development further study is needed to model the ability to service OSW farms from these more distant ports The economic viability of serving floating OSW farms from distant ports depends on the repair cycle for OSW turbines including the probability that failed systems can be scheduled for service quickly under port capacity logistic and weather constraints
DCPP decommissioning makes available a potentially suitable site to develop a specialized port facility for OSW The benefits of developing a specialized wind port for OSW on the DCPP property include
bull site availabilitybull potential for brownfield developmentbull a local revenue source from port fees and land improvementsbull reduced accident risk from the proposed DCPP decommissioning
A specialized wind port at DCPP would facilitate removal of DCPP decommissioning material by sea instead of by road A recent UCLA Transportation Risk Analysis finds that barging involves lower transportation risk (ie accidents injuries fatalities) than trucking and rail transport during the period of DCPP decommissioning Specifically combining barge transport for the initial leg of the route with trucking and rail for subsequent legs reduces fatality risks by over 40 percent and injury risk by 32 percent32
In terms of the present study the center for job creation and regional economic stimulus from OSW is at the ports A port facility provides a coordination point in the supply chain for manufacturing assembly transportation and offshore installation of OSW turbines as well as a maintenance yard for periodic repair and ultimately for disassembly and decommissioning During the 25-year operating period of the OSW farm the port provides facilities for turbine repair stimulating the regional supply chain for manufactured components and support for OampM staff Some turbine components can be transported by land which creates incentives for regional supply chain development for a wide range of industrial partsrsquo manufacturers in California and even nationwide However because the sheer size of offshore turbines is so large that they must be transported by water and because connecting the blades to tower sections and floating foundations requires final assembly to take place in reinforced quays the regional supply chains for OSW originate and terminate at the port
Economic Impact of Offshore Wind Farm Development on the Central Coast
29
24 TRANSMISSION INFRASTRUCTURE REQUIREMENTS
Compared with other renewable technologies OSW delivers power directly to coastal load centers where electricity is needed most Much of the existing transmission infrastructure in California was developed during the time of coastal power plants which now have been either decommissioned or slated for retirement The San Onofre Nuclear Generating Station was shut down in 2013 and is currently being decommissioned
In San Luis Obispo County the 650 MW Morro Bay Power Plant (MBPP) closed in 2014 leaving behind valuable transmission infrastructure The retirement of the Diablo Canyon Power Plant (DCPP) in 2025 which has a nameplate capacity of 2256 MW and generated 16163 GWh in 2019 for the California electricity grid33 will free up an additional 6 GW of transmission capacity Utilizing the combined 7 GW transmission capacity at DCPP and MBPP as interconnection points for OSW power reduces the cost of providing electricity on the grid
The existing PGampE transmission infrastructure that connects DCPP and MBPP to the wholesale electricity grid represents a highly valuable economic asset that can be repositioned to receive electricity generated from OSW in Central California The current DCPP transmission infrastructure is comprised of three 500-kilovolt (kV) high voltage direct current transmission lines that will become available for alternative use after closure of DCPP in 2025 The high cost of installing new electricity transmission lines creates an economic opportunity in San Luis Obispo County to repurpose the existing infrastructure for electricity transmission from OSW
For comparison development of a Northern California Call Area specialized wind port in Humboldt Bay will require new electricity transmission infrastructure to connect OSW power generation to the Bay Area with 500 kV transmission lines The estimated cost of installing transmission infrastructure to convey electricity to the grid for the more limited 1836 GW OSW development planned in the region is in the range of $17 billion to $3 billion depending on overland or subsea transmission options34 These costs are roughly in line with the projected cost of other electricity transmission projects in the US For example the projected construction cost for a single 500 kV direct current transmission line to deliver up to 3 GW of energy from Wyoming to the Eldorado Valley in Nevada was $35 billion in April 2013 an average cost of $42 million per mile over the length of the proposed 835-mile transmission line35 The existing transmission structure connecting DCPP to the electricity grid already has three 500 kV direct current transmission lines in place
The existing PGampE transmission infrastructure that connects DCPP and MBPP to the wholesale electricity grid represents a highly valuable economic asset
Economic Impact of Offshore Wind Farm Development on the Central Coast
30
25 REGIONAL SUPPLY CHAIN DEVELOPMENT
The ability of San Luis Obispo County to support the development of an OSW supply chain will greatly affect the regional economic impact of OSW development Simply put the economic impacts of OSW are larger for the region when the OSW industry derives a greater share of employment from the region as local workers who receive paychecks from OSW projects in turn spend their dollars at local businesses in the community
The establishment of a California-based OSW supply chain is an important factor in maximizing economic values derived in the State and San Luis Obispo County regions Underpinning the need for regional supply chain development are the logistics for OSW development which involves the delivery of the extremely large component parts required for turbine assembly into specialized wind ports Due to the significant costs of long-distance ocean transit the central hub for supply chain development will occur around the specialized wind port where OSW turbines are assembled36
In California the initial development of OSW projects is likely to depend on floating foundations imported from abroad with development of a regional supply chain needed for turbine assembly and for smaller machine components that can be manufactured domestically For example the foundations for California projects are likely to be manufactured in China South Korea or Japan due to past investment in developing offshore wind manufacturing capacity with a regional supply chain needed only for the final assembly of turbines that will take place in regional California ports According to a recent UC Berkeley study about 60 percent of all equipment in US wind farms is currently manufactured domestically with equipment suppliers such as GE Siemens and Vestas having manufacturing facilities in South Carolina Iowa and Kansas and Colorado respectively while generators are sourced from Europe or Asia37
In East Asia and Europe governments and wind turbine manufacturers have worked aggressively in recent years to develop complete supply chains for OSW including factories and other facilities for manufacturing turbines blades towers and floating foundations in high-tech clusters developed in specialized wind ports Several states on the East Coast including Connecticut Massachusetts Rhode Island Maryland and South Carolina have taken steps in industrial planning to create manufacturing hubs for OSW although the West Coast has lagged behind in light of the only recent advances in floating OSW technology over fixed platform technologies that can be used in the relatively shallow waters along the East Coast
Deploying commercial-scale floating wind farms will require collaboration between a wide range of occupations including skilled workers (pile drivers divers millwrights plumbers pipefitters welders cutters solderers brazers carpenters crane operators electrical technicians health and safety specialists) engineers (electrical environmental mechanical marine research subsea structure design) various dock and marine laborers vessel crews plant managers sales representatives lawyers and administrative marketing and communications professionals
At least in the initial phases of OSW development in California OSW foundations and wind turbines are likely to be transported from manufacturing facilities in Pacific Rim countries to one or more specialized wind port facilities in California where wind turbines will be attached to floaters and assembled in quays then barged to offshore sites to be anchored and connected to the electrical
Economic Impact of Offshore Wind Farm Development on the Central Coast
31
grid Once the turbines are installed and running employment in the industry will then transition to an operations and maintenance (OampM) phase that will create additional jobs for regular inspection and repair OampM jobs will largely be composed of environmental specialists vessel crews and engineers augmented by skilled workers crane operators and installation workers at the port facility during times when repair and maintenance is needed
Over a longer horizon it is possible that OSW investment in specialized wind ports for assembly of commercial-scale floating wind farms leads to development of expertise in building floating foundations A regional manufacturing facility for assembling floating OSW foundations would greatly reduce transportation and logistical costs However the analysis in this report does not consider the economic value of foundation manufacturing in California because intermediate term options exist to economize on shipping costs by developing this manufacturing expertise elsewhere on the West Coast for instance the Port of Seattle
Several factors affect the level of regional supply chain development for assembling OSW turbines in San Luis Obispo County
bull the existing industrial basebull local content requirementsbull skills of the workforcebull the timing of development
The existing industrial base in the region is important for the ability to source electrical components and other aspects of turbine assembly from local suppliers in California In the case of OSW the project would build on the existing industrial base in the green energy sector of San Luis Obispo County and neighboring Monterey County creating synergies among small businesses construction and electrical workers involved in the construction and operation of the commercial solar farms in these counties providing an immediate source of labor and electrical components that can transition to servicing OSW farms Santa Barbara County has existing workers with experience operating on offshore oil and gas platforms which facilitates the transition of workers in the region to new employment opportunities in the offshore installation component of the OSW industry such as setting anchors and moorings and offshore turbine installation
Local content requirements and government incentives can also be used to stimulate development of a regional supply chain for OSW Under a local content requirement agreements can specify that a minimum share of local employment be maintained For fabricated components that can be locally sourced government investment and financial incentives can accelerate the pace of regional supply chain development While there are legal restrictions to imposing local procurement and hiring requirements in California under the Commerce Clause of the US Constitution there are nevertheless numerous policy tools available to increase local hiring For example Community Benefits Agreements (CBA) and Community Workforce Agreements (CWA) can be used by developers for infrastructure projects such as port construction and improvement The use of local business enterprise (LBE) and disadvantaged business enterprise (DBE) provisions can also result in increased local procurement and hiring38
Economic Impact of Offshore Wind Farm Development on the Central Coast
32
The relevant skills of the local workforce are also important for development of the regional supply chain for OSW San Luis Obispo County is relatively small in terms of population but offers proportioned access for its size to a skilled workforce of construction and electrical workers both due to the recent construction of commercial solar plants in the California Valley and active commercial and residential real estate sectors The region also has businesses engaged in fiberglass manufacturing and marine vessel operators that have the skills needed to find employment in the OSW industry in the event that it develops in the county
Finally the size and timing of supply chain development is important For a regional supply chain to develop manufacturers must specialize in providing products that meet the needs of the industry which in turn requires assurance that consistent demand will materialize for these products before permanent employees are hired and sunk costs are incurred to grow the industry In the case of OSW development investment decisions will be facilitated if regional manufacturers capable of providing labor components and technical expertise to OSW farms have a clear expectation for sequential development of 6-7 GW of OSW farms staged over multiple years relative to the case of a single 1 GW wind farm The timing of OSW projects is also important if multiple wind farms enter production in Central California as a steady flow of projects over time provides stronger incentives for regional supply chain development
26 TIMING OF PROPOSED WIND FARM DEVELOPMENT
Staging and coordinated development of OSW is essential For example a single port harbor facility will become overburdened with multiple projects under construction at the same time The maximum throughput for each quay in the port is one 10 MW wind turbine per week and the wind turbine must be moved before work can begin on the subsequent turbine Therefore developers will need to consider multiple facility strategies and secure their options well ahead of time
Figure 28 Wind Turbine Development Timeline
Economic Impact of Offshore Wind Farm Development on the Central Coast
33
Figure 28 shows the timeline for OSW farm development Following a projectrsquos commissioning and turbine assembly phases the operation and maintenance (OampM) period of OSW will also require ports for transportation of personnel and components (for offshore repairs and upgrades) and for receiving OSW turbines towed back to the port for repair
Given the seasonal logistics of installing OSW turbines throughput at the specialized wind port is expected to be approximately 500 MW per year during the assembly period The assembly period considered in this report uses a more conservative time frame of 3 years for each 1 GW OSW farm The Operations amp Maintenance (OampM) period for each 1 GW OSW farm is then 25 years followed by a decommissioning period of 3 years The spending pattern for a single 1 GW OSW farm is punctuated by two spikes in regional employment the first during the 3-year assembly phase of the OSW farm and a subsequent and larger spike during the 3-year decommissioning phase in which OSW turbines are taken back to the port and disassembled
For a specialized wind port to support a 3 GW field of wind farms the assembly period is prolonged from 3 years to 9 years by staging OSW turbine assembly in successive 3-year periods for each 1 GW OSW farms Accordingly for a specialized wind port to support a 7 GW field of OSW farms the assembly period is prolonged from 3 years to 21 years It is possible that this period would be shortened by bringing OSW turbines to the Central Coast from other nearby ports that develop the manufacturing capacity for OSW andor by floating fully assembled structures into place from ports in Asia
After OSW turbines are assembled and installed in the ocean the specialized wind port conducts maintenance and repair operations for up to 7 GW of OSW during the OampM period for the projects At a failure rate of once every 25 years for 10 MW wind turbines the specialized wind port would need to accommodate the repair of approximately 28 wind turbines per year to support a 7 GW field of OSW farms
27 EMPLOYMENT AND OUTPUT DEMOGRAPHICS IN SAN LUIS OBISPO COUNTY
As of 2019 San Luis Obispo County has a population of 283111 175 of whom are under the age of 18 209 over the age of 65 and 592 veterans39 From 2011 to 2016 the San Luis Obispo County population grew 3840
Educational attainment in San Luis Obispo County (70) is above the statewide average (62) and national average (59) Two out of 5 residents in the county have a bachelorrsquos degree or higher San Luis Obispo County is predominantly white (69) with the second largest ethnicity being Hispanic or Latino at 2241
The San Luis Obispo County labor market supports 178476 total jobs In 2019 employment in the county was 208 farm jobs 8469 private nonfarm jobs and 1323 public sector jobs including state and local government employment and the military42
The average earnings level per worker in the county is $56409 which is lower than both the state and national averages of $78217 and $66029 respectively43 Figure 29 compares the income
Economic Impact of Offshore Wind Farm Development on the Central Coast
34
distribution in San Luis Obispo County compared to California and the US San Luis Obispo County workers are more likely to have medium and medium-high paying jobs in the $35000 to $149000 range than workers in the rest of California and the US but are less likely to have jobs of $150000 or more
In the past 10 years the county has seen significant job growth Figure 210 illustrates the total number of jobs in the county versus the cumulative job growth rate from 2010
Overall about 30000 additional jobs were created in San Luis Obispo County representing a total 21 growth rate and a 191 annual growth rate over the period This figure is considerably larger than the US total over the period (18) although smaller than that of California (25)44 The strong job growth in San Luis Obispo County has led to comparatively low levels of unemployment with an unemployment rate of 67 in December 202045 relative to the state average of 946
The greatest portion of jobs in San Luis Obispo County are in the tourism hospitality and recreation education and knowledge creation and healthcare industries which together make up 41 or 50000 jobs Since 2010 the information and communication technologies industry experienced the greatest growth (51) followed by the building and design industry (41) and the defense aerospace and transportation manufacturing industries (37) These rapidly growing industries provide the mid- to high-wage job growth in the county with average wages ranging from $59069 to $8188047
Figure 29 Income Distribution in San Luis Obispo County Relative to State and National
Economic Impact of Offshore Wind Farm Development on the Central Coast
35
Gross domestic product (GDP) in San Luis Obispo County was $191 billion in 2019 with GDP per capita of $6734048 Figure 211 shows the GDP growth rate in San Luis Obispo County over the last decade Over the period of 2010 to 2019 San Luis Obispo County real GDP growth was 2745 exceeding the growth rate in national real GDP of 2239 but lagging behind the real GDP growth rate of 3615 for California over the period49
Figure 210 10 Year Job Growth in San Luis Obispo
Figure 211 GDP Growth Rate in San Luis Obispo County California and the US
Economic Impact of Offshore Wind Farm Development on the Central Coast
36
SECTION 3
METHODS AND SCOPE
Economic Impact of Offshore Wind Farm Development on the Central Coast
37
3 METHODS AND SCOPE
31 SCOPE OF THE STUDY
The regional economic benefits calculated in this report are predicated on the development of a specialized wind port in San Luis Obispo County to provide service for up to 7 GW in OSW capacity in and around the Morro Bay Call Area In the event that a specialized wind port for OSW assembly is not constructed in San Luis Obispo County the regional economic benefit would instead materialize in whichever county provides the specialized wind port
At the State of California level the value of OSW development combined across all counties will be similar to the value reported here for the state-level impact with one important caveat If the specialized wind port is located farther away from the OSW farms than a neighboring county such as Monterey or Santa Barbara mdash for instance if a specialized wind port is developed in Humboldt Bay as a single hub for OSW assembly in California mdash then additional project cost would be required for water transportation (eg labor and fuel) raising direct spending at the more distant specialized wind port relative to the case considered here for a port in San Luis Obispo County The resulting increase in direct project spending would result in greater job creation and larger regional economic benefits for the more distant county in the transportation industry however because the social cost of OSW increases with distance from the specialized wind port both in terms of private costs and external costs incurred during water transportation50 locating the specialized wind port farther from the OSW field results in lower economic benefits to California Therefore using values from regional economic models to make such a comparison would be misleading
This report considers two phases of offshore wind (OSW) development off the Central Coast
1 An initial planning period that involves construction of a specialized wind port in San Luis Obispo County
2 OSW farm development with staged assembly of up to 7 GW capacity of OSW
For both phases the regional economic value captured in San Luis Obispo County is conditional on construction of a specialized wind port in the county either on the DCPP property or elsewhere in the county
If for example a specialized wind port was located on the existing DCPP property the specialized wind port provides a conduit for job creation in San Luis Obispo County The indirect benefits that would occur in the regional economy from the influx of new jobs at the port would extend to other counties in California for instance through supply chain development to vendors contractors and component manufacturers in Santa Barbara County Ventura County Monterey County and Kern County The indirect purchases stimulated in different counties in California is accounted for in the model however because the regional supply chains for OSW projects likely will extend across state borders the development of OSW in Central California will provide additional economic value for neighboring states in a manner that falls outside the lens of the model
Workers employed at a specialized wind port in San Luis Obispo County will spend much of their
Economic Impact of Offshore Wind Farm Development on the Central Coast
38
disposable income making induced purchases such as food retail items and restaurant meals at establishments near their homes The regional economic model matches employment at the specialized wind port to the available workforce in San Luis Obispo County which implicitly assumes that available workers in San Luis Obispo County are employed at the specialized wind port before jobs are offered to workers outside the county Thus the regional economic value for San Luis Obispo County will attribute a greater share of induced spending by workers to establishments in San Luis Obispo County than if these workers commute to work from residences across county lines Given the proximity between DCPP and nearby population centers in Northern Santa Barbara County such as Santa Maria and Orcutt a share of the regional economic value attributed to San Luis Obispo County in this report will materialize in Santa Barbara County for workers commuting across county lines
The model used to calculate regional economic benefits in this report matches workers employed in San Luis Obispo County to the available workforce in San Luis Obispo County Specifically the model assigns jobs in San Luis Obispo to workers in San Luis Obispo if the labor force exists in the county to meet the job requirements and only reaches outside the county for workers when the industry providing the labor service no longer has available workers in the county to perform the task In practice workers from outside the county may outcompete workers in the county for jobs (eg by being willing to take the job for a lower wage or by having superior skills) in a manner that is not accounted for in the regional model To the extent that workers commuting across county lines compete intensively for these jobs the model will over-attribute induced spending of workers to San Luis Obispo County from household purchases that occur in the neighboring counties where commuting workers reside
311 SPECIALIZED WIND PORT
The scope of the analysis encompasses the value of the regional output and employment effect resulting from the development and use of a specialized port in San Luis Obispo County for the assembly maintenance and repair of OSW farms Because a specialized wind port is necessary to receive the regional economic value from OSW development and San Luis Obispo County does not currently have one it is necessary to model the construction of a specialized wind port jointly with the development of large-scale OSW projects in the region
The goal of the present study is to calculate the regional economic benefit to San Luis Obispo County from the development of 3 and 7 GW OSW capacity in and around the Morro Bay Call Area The model does not encompass the full economic value of constructing a specialized wind port in San Luis Obispo County which might be used for the movement of other goods apart from OSW components Therefore this report considers solely the development of a specialized wind port used only for staging the assembly installation and repair of OSW Any additional regional economic value that can be generated from a specialized wind port from importing and exporting goods unrelated to OSW is not included in the report The scope of economic benefits considered in this report is conservative because developing a specialized wind port for OSW involves construction costs for elements such as a breakwater that would in turn economize on the cost of
Economic Impact of Offshore Wind Farm Development on the Central Coast
39
expanding the footprint of a specialized wind port beyond the specialized needs required to create a hub for OSW
Construction of a specialized wind port on the DCPP property occurs in the model over the 5-year period of 2024-2028 Constructing a specialized wind port for OSW will require an estimated 1100 construction jobs per year at a total direct cost in the range of between $17 and $25 billion The analysis considers only the direct job requirement of port construction (1100 workers per year) to be sourced locally as it is currently unclear where the materials used to construct the port such as the breakwater and pilings will be sourced Considering only the direct job requirement for constructing a specialized port for OSW in San Luis Obispo County results in a conservative measure of the regional economic benefit as all construction material required to be purchased for port construction is implicitly assumed to be sourced from locations outside of California The total project cost which is substantially larger than the direct labor cost component of the project is included only to calculate the fiscal benefit of sales and use taxes in Section 5 which implies project spending on imported material is designated as a California sales transaction at the point of delivery to the port
312 DEVELOPMENT OF A REPRESENTATIVE 1 GW OSW FARM
The timeline of a representative 1 GW OSW farm has 4 phases planning amp permitting (7 years) assembly (3 years) operations and maintenance (25 years) and sunsetdecommissioning (3 years)
Figure 31 shows the average labor requirement for a 1 GW OSW farm during each phase of development in the case of a sunset period involving decommissioning of the OSW farm
Figure 31 Average Labor Requirement for a 1 GW OSW Farm over the Life of the Plant
Economic Impact of Offshore Wind Farm Development on the Central Coast
40
The planning phase for the first OSW farm occurs over the period 2022-2028 which coincides with the granting of a lease through a BOEM auction and the development of a specialized wind port in San Luis Obispo County both of which must also occur over this time period to realize the regional economic benefits of OSW
The assembly phase considers a 3-year assembly period for each 1 GW OSW farm starting with the first 1 GW wind farm over the period 2029-2031 While OSW turbine assembly in the specialized wind port can potentially occur at a faster pace for instance 500 MW per year (or 2 years per 1 GW OSW farm) a longer 3-year period is considered for each OSW farm to account for the logistics involved in arranging installation around weather events and conducting repairs for multiple OSW farms The assembly phase will tend to be shorter for the first 1 GW OSW farm than for subsequent wind farms because of the need to maintain space in the specialized wind port for turbine repair For development of a field of 7 GW OSW farms the assembly period involves staging the assembly of each 1 GW OSW in successive 3-year periods so that assembly occurs for a total of 21 years for a total of seven 1 GW OSW farms
The OampM phase for each 1 GW OSW farm consists of an operating life of 25 years (the OampM period) following turbine assembly and installation For the first 1 GW OSW farm the OampM period is 2032-2058 and the OampM period is set back by 3 years for each subsequent 1 GW OSW farm due to the staging of assembly in successive 3-year periods at the port
313 DECOMMISSIONING AND RECOMMISSIONING PROVISIONS FOR A 1 GW OSW FARM
The representative 1 GW OSW farm is decommissioned over a 3-year period coinciding with partial OSW farm operation and partial disassembly as OSW turbines are removed from the farm For the initial 1 GW OSW farm decommissioning occurs over the period 2057-2059 For each 1 GW OSW farm installed thereafter the assembly period is pushed back 3 years by staged operations at the port pushing back the sunset period by 3 years for each subsequent 1 GW OSW farm During the sunsetting period each 1 GW OSW farm comes back to port to be disassembled Current requirements for decommissioning involve a 3-year decommissioning period however given the strong economic incentive to maximize the length of time on the water for individual OSW turbines it is likely by 2059 that the period will be shorter for decommissioning (as well as for redeployment in the case of lease renewal)
Decommissioning occurs for each OSW farm after 25 years of operation and is accomplished two ways in the model
bull decommissioning as required by BOEM lease agreementsbull or recommissioning which involves renewing or replacing the lease agreement to maintain 1
GW OSW on the leased area for a subsequent 25-years of operation
The economic return for maintaining wind turbines on the water once the capital expenditure is sunk suggests that streamlined processes will be developed for decommissioning and replacing OSW farms by the end of the initial BOEM lease period
Economic Impact of Offshore Wind Farm Development on the Central Coast
41
In the case of decommissioning the value of a 7 GW field of OSW farms is reduced by removing OSW turbines from the water at the end of each lease agreement Under recommissioning the benefit of a field of 7 GW OSW farms can be measured in perpetuity (ie as a renewable resource) by considering the annual benefit under an integrative lease process designed to keep wind turbines generating electricity and connected to the grid In the case of recommissioning each 1 GW OSW farm is replaced in a single 3-year period rather than modeling separate decommissioning and assembly periods where one 1 GW OSW farm is decommissioned for 3 years before the next 1 GW OSW farm can be assembled
The design life of the wind turbine generator and the floating substructure that supports it coincides with an expected operating life of 25 years for OSW After the 25-year life of an OSW farm either the farm would need to be replaced or the turbines would need to be refurbished to extend the life of the units for another 25 years Under the recommissioning option each 1 GW OSW farm in the field of 7 GW OSW remains in service for electricity production either by remaining in operation or by being replaced by another in an integrative fashion that handles the logistical challenges Under recommissioning the model economizes on what would otherwise be a 6-year transition period (3 years for decommissioning of the initial OSW farm plus 3 years assembly for installing the replacement 1 GW OSW farm) with a single 3-year period that integrates the decommissioning and assembly phases The decrease in time required to replace a 1 GW OSW farm with another at the end of each lease capitalizes on the economic benefit of maintaining wind turbines generating electricity for the grid during the transition given the availability of existing anchors and moorings and other fixed investments at the offshore site that reduce the deployment time for a subsequent OSW farm
The labor requirement for an integrated recommissioning process is taken to be two times the onshore labor required during the initial assembly period (once for disassembly and again for reassembly) plus the labor required to reinstall each windmill to the existing cables and moorings at the offshore site The use of two times the onshore labor component is consistent with recent experience at the WindFloat prototype in Aguccediladoura Portugal in which wind turbines were brought back to shore and removed from the foundations for repair and then the entire structures were reassembled cleaned repainted and installed back into service at the offshore site The recommissioning scenario results in conservative regional economic value relative to the case of a decommissioning period for each 1 GW OSW farm followed by approval and installation of an entirely new 1 GW OSW project through an uncoordinated process as an orchestrated process economizes on direct project spending by combining the two phases into a single 3-year period
The economic value from the recommissioning scenario is conservative because it assumes replacement at the end of the 25-year operating horizon with an identical 1 GW OSW farm To the extent that turbine technology is superior 30 years from now the economic value of a replacement 1 GW OSW farm will be larger than the value considered here in the recommissioning scenario however much of this benefit will be captured by an improved capacity factor of turbines that deliver electricity at a lower LCOE That is the benefit of supplying electricity at lower cost is received in the electricity market and not something that would necessarily affect the regional
Economic Impact of Offshore Wind Farm Development on the Central Coast
42
supply chain and labor market that are the focus of this report The labor market requirement to install a replacement 1 GW OSW farm is taken to be the same as the labor requirement for the representative 1 GW OSW farm today in terms of the number of employees needed at each stage of the process in Figure 31 above The regional economic value is conservative by assuming that in 30 years there will still not be manufacturing capability for floating offshore platforms and turbines in California
It should also be noted that conveying the electricity produced at each 1 GW OSW farm will require grid connection costs to provide interconnection and transmission to Californiarsquos electricity grid The cost of constructing transmission lines for a field of 7 GW OSW farms will be lower to the extent that the suggested project makes use of the existing 500 kV transmission cables that currently connect DCPP to the electricity grid This makes the Central California region highly attractive for OSW energy development Nevertheless substantial additional expenses will be needed to develop offshore spur lines to connect OSW farms to landfall via undersea cables that extend many miles out to sea which will also require a supporting structure of sub-stations and terminals to connect cables at landfall with the existing onshore interconnection and transmission structure that exists at DCPP
32 METHODS
The regional economic impacts calculated from OSW farm development in Central California reflect the ldquoripple effectrdquo of new jobs and economic output that occurs when direct investments in the offshore wind industry complex lead to expansion in the production of upstream supply-chain inputs plus induced spending as new employee households increase local spending (eg grocery stores auto dealerships and restaurants) It should be noted that economic impacts are different from economic viability or profitability Economic impacts reflect expenditures and the extent to which inputs are locally sourced Higher costs (that would reduce economic viability and profit) in fact lead to larger economic impacts
Over time economic impacts can change As installed wind farm capacity in California increases one might expect not only cost-reducing learning effects but also an increase in the local share of input sourcing due to in-state investment in manufacturing specialized OSW inputs To the extent that this type of specialized investment occurs for instance if the ability to manufacture floating foundations for OSW develops somewhere in California then the regional economic impact of OSW farm development on the Central Coast would be greater for the State of California than is captured here
Regional economic impacts are increased by greater project expenditures as well as by a larger share of inputs that are locally sourced in the region Thus regional economic values differ from the overall economic value of a project because greater project expenditures raise total costs of electricity generation harming economic value while providing for greater regional stimulus The regional economic value of OSW farms is usually limited to direct wind farm capital and operations and maintenance (OampM) costs which are recovered through revenues derived from power purchase agreements Port and transmission infrastructure improvements typically are
Economic Impact of Offshore Wind Farm Development on the Central Coast
43
not included in regional economic values for OSW which is why the regional economic benefit is calculated separately for the construction of a specialized wind port in San Luis Obispo County Port infrastructure investments would likely be made by a terminal operator with costs of port construction recovered through various fees paid by users of terminal facilities to the terminal operator Similarly transmission infrastructure costs would likely be incurred by PGampE or another electricity provider with costs recovered by way of transmission access charges (TACs) paid by regional energy consumers
Regional economic models are based on a set of input-output (I-O) production relationships in the county (and neighboring counties) where the investment occurs Final goods such as wind energy are the outputs of the model which requires a variety of input purchases to be made in a variety of upstream markets (supply-chain effects) to construct and operate the OSW farm Upstream market purchases include labor from different industries and the purchase of intermediate goods (eg manufactured parts such as turbine blades manufactured electrical components and raw materials such as concrete and steel) Some of these inputs can be locally sourced while other inputs must be imported from outside the region as is presently the case for both turbines and floating foundations I-O models use economic data on current workers and component manufacturers in affiliated industries at the county level to create a simplified quantitative depiction of the ability to locally source inputs to meet the output requirements of a project thereby capturing regional economic value
This study utilizes the Regional Economic Models Inc (ldquoREMIrdquo) Policy Insight Plus (ldquoPI+rdquo) model to estimate the current and future economic impact of OSW development on San Luis Obispo County and neighboring counties REMI PI+ is a sophisticated economic modeling tool used by public agencies consulting firms nonprofit organizations and local governments to simulate the economic impact of a variety of public and private capital investments including infrastructure development energy projects and military bases
The REMI PI+ model calculates the regional economic impact of OSW development in San Luis Obispo County using data on the local labor requirement to install operate and decommission a field of 1 GW OSW farms at the specialized wind port The REMI PI+ model is a dynamic I-O model that uses this data to determine the current impact of OSW farm development as well as its forward-looking impact given historical changes in the business cycle and the ability of future workers and industry to migrate to the region The results of the model are reported for each county individually
The model provides output that quantifies the economic impact of a certain area of study and for the sake of this report allows results to be segmented on a county-wide basis into the number of jobs created benefit to county GDP and the general tax implications In construction of the model REMI PI+ uses audited data from public agencies such as the US Bureau of Economic Analysis and the US Census Bureau as well as user inputted data to construct its larger model
The resulting estimated impacts from the REMI PI+ model are segmented into direct indirect and induced impacts Direct impacts are directly related to the operations and growth of the base for example a contractor who is hired to help build infrastructure for port expansion Indirect impacts
Economic Impact of Offshore Wind Farm Development on the Central Coast
44
are values related to economic growth in upstream industries catalyzed by spending at the port on OSW for example a regional asphalt provider hired to provide road access to the specialized wind port While the asphalt providerrsquos job is directly attributable to the needs of the port it has no direct impact on port operations and therefore represents an indirect impact
Induced impacts are ripple effects that occur at all points in the supply chain catalyzed by both direct and indirect impacts For example an induced impact from the road expansion project would be an asphalt quarry that hires additional employees to help service the increased demand for asphalt from the road expansion project to serve the port While those jobs are created by the increased asphalt demand due to the infrastructure project to connect an existing road to the port the new employees hired at the asphalt quarry are working neither directly at the port facility nor indirectly on the paving project making the creation of this job an induced impact The majority of induced impacts in the model arise from food retail and housing purchases by workers employed directly and indirectly by OSW
Most input-output models are static meaning that inflation employment and expenditures for example remain constant over time However this report uses the dynamic impact model built into REMI PI+ to project the estimated economic impact of OSW development over time As this is a dynamic impact model projections will be made based off the assumption of business cycle fluctuations reflecting historical trends Estimates will be reported both for San Luis Obispo County as well as for the State of California
Finally it should be noted that the regional economic benefits calculated here are gross impacts of the OSW project rather than net impacts and as such may overstate actual benefits as an all-or-nothing comparison That is economic impacts to the region not immediately deriving from the construction and operation of an offshore wind facility are omitted in the report even though the use of regional resources to provide inputs for the OSW project claims these resources from other alternative projects the region could pursue For example expenditure on a wind farm in California may displace expenditures on expansion of a commercial solar power plant A net economic impact assessment of the value of OSW in relation to other potential investments in San Luis Obispo County would need to consider the foregone value of displaced economic activity
The economic values calculated using the REMI PI+ model are presented both in terms of (undiscounted) lifetime job and output impacts and in terms of annual average impacts over various phases of project development Undiscounted lifetime job impacts are calculated by multiplying the operational period of the project by the estimated number of annual operational period jobs and then adding them together into a measure of the total full-time equivalent (FTE) jobs created by the project For example a project that provides 100 full-time jobs each year for a 10-year period provides a total economic benefit to the region of 1000 FTE jobs and an annual average impact of 100 full-time jobs per year
Economic Impact of Offshore Wind Farm Development on the Central Coast
45
SECTION 4
RESULTS
Economic Impact of Offshore Wind Farm Development on the Central Coast
46
4 RESULTS
The regional economic benefit to San Luis Obispo County from OSW development is predicated on the ability to serve floating OSW turbines in and around the Morro Bay Call Area from a specialized wind port The specialized wind port serves as a hub for the assembly maintenance repair and eventually the decommissioning of floating OSW turbines
The economic benefits are calculated in this report for an initial period of port construction Port construction involves direct employment of an average of 1100 workers per year for 5 years at a total cost of between $17 billion and $25 billion Much of the material used to construct the port is projected to be sourced from regions outside the county and delivered to the port by marine vessel For the calculation of regional economic benefits the conservative assumption is made that none of the material is sourced from California which implies the regional economic stimulus is driven only by the direct employment of 1100 construction workers in San Luis Obispo County
Construction of the port occurs over the period coinciding with the 7-year planning phase for the first 1 GW OSW farm 2022-2028 Direct employment for port construction is projected to build over the first few years and reach a peak employment at around the midpoint of the port construction phase however a fully developed time schedule for employment is not available at this time
The measures of economic effects considered in this report are
bull Output ndash business sales less the costs of materials and equipment produced outside of California
bull Employment ndash the full-time equivalent jobs provided to California residents
41 PORT CONSTRUCTION IMPACTS
Table 41 shows the regional economic value realized for San Luis Obispo County and the State of California over the 5-year period of port construction Direct construction spending for a specialized wind port results in local stimulus in San Luis Obispo County of $202 billion ($405 million per year for 5 years) and the creation of approximately 11825 full-time equivalent (FTE) jobs (2365 per year for 5 years) Construction of a specialized wind port in San Luis Obispo County also stimulates the economy of neighboring counties providing 234 jobs and $39 million in economic output for Santa Barbara County and 28 jobs and $58 million in economic output
for Monterey County over the 5-year construction period The overall impact in California considering spill-over impacts to other regions in the state is $300 billion ($599 million per year for 5 years) and the creation of 15925 FTE jobs (3185 annually for 5 years)
Port construction spending would result in a stimulus of $202 billion and the creation of approximately 11825 jobs over 5 years
Economic Impact of Offshore Wind Farm Development on the Central Coast
47
It should be noted that the regional economic impact model assigns available workers in San Luis Obispo County to jobs in San Luis Obispo County before considering workers available to take these jobs in other counties Given the construction of a specialized wind port in San Luis Obispo County jobs are provided to workers in San Luis Obispo County that may ultimately be captured by workers in neighboring counties who are able to outcompete workers in the county This is particularly true for Northern Santa Barbara County given the proximity of the Santa Maria metropolitan area to Arroyo Grande in Southern San Luis Obispo County
For comparison a June 2019 analysis by the California Public Utilities Commission found that current decommissioning plans for DCPP will increase annual economic output in the San Luis Obispo County region by $724 million per year for 10 years and will result in the creation of approximately 4934 FTE jobs annually for ten years (Roland-Holst et al 2019)51
Development of a specialized wind port on the DCPP property may also serve to reduce transportation risks (ie accidents injuries fatalities) from DCPP decommissioning as the use of barge transportation making use of the existing breakwater is projected to lower fatality risks by more than 40 percent52 A more detailed study of specialized wind port construction to jointly meet the goals of DCPP decommissioning and OSW development including potential labor substitution from decommissioning to port construction on the DCPP property is beyond the scope of this report
42 OFFSHORE WIND DEVELOPMENT IMPACTS
After the initial period of port construction assembly can begin in the specialized wind port for the first 1 GW OSW farm in 2029 The economic value of OSW continues from that time through the staged assembly of 1 GW OSW every 3 years Thus the full development of a field of 7 GW OSW from a specialized wind port in San Luis Obispo County will occur over the 21-year period from 2029-2049 While California currently does not have a specialized wind port for assembling OSW turbines it is possible that other specialized wind ports are developed in California during this time allowing OSW turbines to be assembled and dispatched to the Central California region from other nearby
Table 41 Output and Job Creation from Port Construction
RegionFull-Time
Equivalent JobsTotal Output (million $s)
San Luis Obispo County 11825 $202261
Santa Barbara County 234 $3896
Monterey County 28 $577
Rest of California 3837 $92956
California Total 15925 $299689
Economic Impact of Offshore Wind Farm Development on the Central Coast
48
ports This would accelerate the pace of development for installing up to 7 GW OSW in Central California and result in a final completion date prior to 2049
After the initial installation of a field of 7 GW OSW in and around the Morro Bay Call Area proximity between the OSW sites and the specialized wind port in San Luis Obispo will make the specialized wind port the primary area for repair and recommissioning of wind turbines Given the high fixed costs and low variable cost of operating OSW turbines the economics of maintaining 7 GW OSW in the region favor repair from the nearest port with available space to maximize the time turbines spend on the water and connected to the grid
The regional economic value of OSW is constructed by considering the baseline value of a representative 1 GW OSW farm and then modeling the staged development of seven identical 1 GW OSW farms over time The economic value of a representative 1 GW OSW farm is calculated for two cases decommissioning and recommissioning Given that all 7 GW OSW would ultimately be removed from the water following decommissioning the focus of the report is on the long-run economic value to the region from the perpetual renewal of OSW farms over time through recommissioning Recommissioning economizes on redeployment time for the replacement of a 1 GW OSW farm at the end of the lease (from a 6-year period for decommissioning and assembly to a 3-year recommissioning period that bundles these phases together) however bundling decommissioning together with redeployment increases the labor requirement for the 3-year period beyond that required for only decommissioning
421 OSW 1 GW BASELINE WITH DECOMMISSIONING
Table 42 shows the regional economic value realized for San Luis Obispo County neighboring counties and the State of California over the planning assembly and operating horizon of a 1 GW OSW farm through the decommissioning phase The regional economic stimulus provided by the 1 GW OSW farm over its lifetime results in output of $25 billion for San Luis Obispo County and the creation of 6612 full-time equivalent (FTE) jobs over the period 2022-2059 The overall impact in California considering spill-over impacts to other regions in the state is $37 billion and the creation of 11368 FTE jobs during this period
Table 42 Output and Job Creation from a 1 GW Wind Farm with Decommissioning
Region Full-Time Equivalent JobsTotal Output (million $s)
San Luis Obispo County 6612 $245256
Santa Barbara County 364 $7766
Monterey County 58 $1189
Rest of California 4333 $116470
California Total 11368 $370681
Economic Impact of Offshore Wind Farm Development on the Central Coast
49
The majority of the regional economic benefit is derived in San Luis Obispo County because all direct jobs are sourced at the port Santa Barbara County receives economic stimulus of $78 million and 364 FTE jobs over the period due to the alignment of jobs and workers in the model at the location of the specialized wind port In the event that a specialized wind port for OSW assembly and repair is sited in Santa Barbara County rather than San Luis Obispo County the distribution of economic benefits between the two counties essentially would be reversed with Santa Barbara County then becoming the source of output and job creation in the model While some of this outcome is driven by the nature of the model which assigns jobs to workers in the county where direct spending occurs whenever qualified workers in the county are available to provide it the stark difference in regional economic benefits across counties illustrates the fact that direct spending at the specialized wind port is the origin of job creation The regional supply chain to support a 1 GW OSW farm begins and ends at the port
The regional economic benefit realized over this time period is largely concentrated during the assembly and decommissioning phases of the project as shown in Figures 41 and 42 After a small amount of employment and output benefits generated during the planning phase regional employment and output spike during the 3-year assembly period 2029-2031 During the OampM period for the 1 GW OSW farm regional job creation and output falls from the level achieved during assembly and stabilizes Annual jobs and output creation have a positive gradient during this period due to the dynamic adjustment in the REMI PI+ model which builds the regional employment base through population growth in San Luis Obispo County as the 1 GW OSW farm causes labor migration into the county increasing the size of the labor force by providing a reliable source of head-of-household jobs After the 25-year OampM period of the OSW farm regional employment and output spike a second time during the 3-year decommissioning period from 2057-2059
Figure 41 Distribution of Employment Impacts over the Horizon of a 1 GW OSW Farm
Economic Impact of Offshore Wind Farm Development on the Central Coast
50
Figures 43 and 44 show the top sectors stimulated by direct employment at the specialized wind port facility for OSW in San Luis Obispo County for indirect and induced employment respectively In terms of indirect employment the largest industry stimulated by direct spending at the port is administrative and support services (60) followed by regional supply chain development in the professional scientific and technical services industry (14) The increased demand for manufactured components at the specialized port facility for OSW in San Luis Obispo County stimulates regional supply chains for professional scientific and technical support presenting an opportunity for collaboration with Cal Poly and stimulating regional job creation for Cal Poly graduates in engineering fields in local consulting firms and support industries The influx of jobs in professional scientific and technical support fields and other related aspects of the regional supply chain can be further facilitated through independent investment in the Cal Poly Technology Park and furthering industry partnerships in affiliated technical fields that support OSW
Figure 42 Distribution of Output over the Horizon of a 1 GW OSW Farm
The influx of jobs in professional scientific and technical support fields and other related aspects of the regional supply chain can be further facilitated through independent investment in the Cal Poly Technology Park and furthering industry partnerships in affiliated technical fields that support OSW
Economic Impact of Offshore Wind Farm Development on the Central Coast
51
Table 43 shows the distribution of jobs average annual wages total employee compensation and total output for a 1 GW OSW farm in terms of direct indirect and induced impacts Average annual wages and total employee compensation includes wages and fringe benefits paid for by employers
Figure 43 Top 10 Sectors for Indirect Employment from Offshore Wind
Figure 44 Top 10 Sectors for Induced Employment from Offshore Wind
Economic Impact of Offshore Wind Farm Development on the Central Coast
52
Table 44 breaks down output and job creation into annual averages over the various phases of the operating horizon of a 1 GW OSW farm including the final decommissioning phase that removes it from the ocean The regional economic stimulus provided by the 1 GW OSW farm over its lifetime results in the highest annual employment level during the assembly period which provides an average of 589 full-time jobs each year for workers in San Luis Obispo County and 941 full-time jobs each year in California The decommissioning period results in the greatest output creation averaging $218 million per year for San Luis Obispo County and $326 million per year for California during the 3-year decommissioning period
Table 43 Regional Economic Impact of a 1 GW Wind Farm in San Luis Obispo County
ImpactFull-Time
Equivalent Jobs
Average Job Compensation
($year)
Employee Compensation
(millions)Total Output
(millions)
Direct 3490 $88650 $30941 $162674
Indirect 2308 $66076 $15251 $57822
Induced 814 $74884 $6093 $24760
Total Economic Impact 6612 $79076 $52285 $245256
Table 44 Average Annual Output and Job Creation over Key Operating Phases
Economic Stimulus Planning Assembly OampM Decommission
Jobs
San Luis Obispo County 17 589 142 390
Santa Barbara County 1 29 8 24
Monterey County 0 5 1 4
Rest of California 4 318 99 289
Total 22 941 251 707
Output (millions)
San Luis Obispo County $261 $15269 $5288 $21803
Santa Barbara County $010 $502 $167 $670
Monterey County $001 $077 $026 $096
Rest of California $080 $6836 $2618 $9981
Total $352 $22685 $8101 $32550
Economic Impact of Offshore Wind Farm Development on the Central Coast
53
422 OSW 1 GW BASELINE WITH RECOMMISSIONING
In the recommissioning scenario the decommissioning phase for the 1 GW OSW farm is paired with redeployment of a replacement 1 GW OSW farm in the ocean in a new (or renewed) lease agreement Table 45 shows the regional economic value realized for San Luis Obispo County and the State of California over the construction and operating horizon of a 1 GW OSW farm that includes a 3-year recommissioning phase that maintains the 1 GW OSW farm on the water at the end of the period
The regional economic stimulus provided by the 1 GW OSW farm over a lifetime that includes recommissioning and replacement results in output of $268 billion for San Luis Obispo County and the creation of 6999 full-time equivalent (FTE) jobs over the period 2022-2059 The overall impact in California considering spill-over impacts to other regions in the state is $404 billion and the creation of 12059 FTE jobs during this period Comparing entries in Tables 42 and 45 recommissioning the 1 GW OSW farm generates an additional $225 million for San Luis Obispo County ($331 million for California) and the creation of an additional 387 FTE jobs for San Luis Obispo County (692 for California) over the period
Table 46 breaks down output and job creation into annual averages over the various phases of the operating horizon of a recommissioned 1 GW OSW farm that is placed back into service at the end of the horizon The regional economic stimulus provided by a recommissioned 1 GW OSW farm over its lifetime is identical in the first three phases (planning assembly and OampM) with the additional output and job creation concentrated in the final 3-year recommissioning phase Comparing entries in Tables 44 and 46 the added value of recommissioning over decommissioning over the 3-year decommissioning period for the project involves an additional 129 full-time jobs per year in San Luis Obispo County (230 full time jobs per year in California) resulting in additional economic output of $71 million per year in San Luis Obispo County and $110 million per year in California
Table 45 Output and Job Creation from a 1 GW Wind Farm with Recommissioning
Region
Full-Time Equivalent
JobsTotal Output
(millions)
San Luis Obispo County 6999 $267766
Santa Barbara County 387 $8420
Monterey County 62 $1280
Rest of California 4611 $126302
California Total 12059 $403768
Economic Impact of Offshore Wind Farm Development on the Central Coast
54
423 MULTIPLE OSW FARMS THE CASE OF 7 GW OSW DEVELOPMENT
In the case of 7 GW OSW development in Central California the initial spike in output and employment during the assembly phase is extended over a longer period due to the staging of
individual 1 GW OSW farms in successive 3-year periods at the specialized wind port Staged assembly of a field of 7 GW OSW also prolongs the economic benefit from recommissioning multiple OSW farms as the lease period is set back by 3 years for each successive OSW farm through overlapping leases to accommodate available space at the port for assembly The analysis of the 7 GW OSW development includes the
economic value created by constructing a specialized wind port in San Luis Obispo County because it is unlikely that industry partners will materialize to fully develop 7 GW of OSW in Central California without commitment in the region to provide reliable port access for repair and service in proximity to the OSW farms53
Table 46 Average Annual Output and Job Creation over Key Operating Phases
Economic Stimulus Planning Assembly OampM Decommission
Jobs
San Luis Obispo County 17 589 142 519
Santa Barbara County 1 29 8 32
Monterey County 0 5 1 5
Rest of California 4 318 99 382
Total 22 941 251 937
Output (millions)
San Luis Obispo County $261 $15269 $5288 $29306
Santa Barbara County $010 $502 $167 $888
Monterey County $001 $077 $026 $126
Rest of California $080 $6836 $2618 $13259
Total $352 $22685 $8101 $43579
Staged assembly of a field of 7 GW OSW prolongs the economic benefit from recommissioning multiple OSW farms
Economic Impact of Offshore Wind Farm Development on the Central Coast
55
The time horizon for the REMI model extends through 2060 which is not enough to capture the full cycle of development for a 7 GW OSW field given the staged decommissioning horizon that extends through 2077 For this reason the analysis of a 7 GW OSW field is decomposed into two parts First the model is run for staged assembly and deployment of a field of 7 GW OSW farms without decommissioning or recommissioning at the end of the horizon (which would otherwise capture the decommissioning period for only the initial 1 GW OSW farm through 2059) Then the value of a 7 GW OSW field is captured in perpetuity by incorporating the additional value of recommissioning for a representative 1 GW OSW at the end of the lifecycle of each 1 GW OSW farm
This process allows the annual economic value to be calculated in a long-run steady state comprised of a 28-year combined OampM (25 years) and recommissioning (3 years) phase for each OSW farm The long-run steady state value captures the annual value of operating and recommissioning a 7 GW field of OSW farms in a perpetual replacement cycle that begins on the date the final OSW turbine is installed in the 7 GW field
Figures 45 and 46 show the regional economic benefit realized over the time period 2022-2060 without the additional value generated by decommissioning (recommissioning) of each 1 GW OSW farm After an initial spike in regional economic benefits during the period of port construction the economic benefits during the assembly period are prolonged by the staged assembly of 7 GW OSW The annual economic benefit rises steeply during this period both for jobs and output because this period includes OampM for previously assembled 1 GW OSW farms as staging occurs between the assembly phases of each 1 GW OSW farm The regional economic benefit subsequently drops off in 2058 due to removal of the decommissioning (recommissioning) period from the REMI PI+ model runs
Figure 45 Distribution of Employment Impacts over the Horizon of a 7 GW OSW Field
Economic Impact of Offshore Wind Farm Development on the Central Coast
56
The trend toward rising annual output and employment levels during the OampM period in which all 7 OSW farms are in operation reflects the dynamic adjustment elements in the REMI PI+ model which builds up the locally sourced labor pool over time as workers gain experience in the OSW industry For this reason the regional economic value is greater for San Luis Obispo County and for California for the second 1 GW OSW farm than for the first and so on compounding the annual economic benefits realized in the region as a greater level of OSW development occurs over time
Table 47 shows the regional economic value realized for San Luis Obispo County and the State of California over the planning assembly and operating horizon of a 7 GW field of OSW farms absent recommissioning These values include the construction of a specialized wind port during the planning phase prior to assembly of the OSW farms The regional economic stimulus provided by the 7 GW field of OSW farms without decommissioning or replacement results in output of $150 billion for San Luis Obispo County and the creation of 44960 full-time equivalent (FTE) jobs over the period 2022-2060 The overall impact in California is $225 billion and the creation of 72162 FTE jobs during this period
Figure 46 Distribution of Output Impacts over the Horizon of a 7 GW OSW Field
The regional economic value is greater for SLO County and for California for the second 1 GW OSW farm than for the first and so on compounding the annual economic benefits realized in the region as a greater level of OSW development occurs over time
Economic Impact of Offshore Wind Farm Development on the Central Coast
57
The entries in Table 47 encompass the economic value of port construction provided in Table 41 Netting out the port construction impacts in Table 41 the development of a 7 GW field of OSW in the specialized wind port provided an additional 33135 (56238) jobs and additional output of $13 billion ($195 billion) in San Luis Obispo County
Table 48 breaks down output and job creation into annual averages over the various phases of the operating horizon absent recommissioning The port construction period overlaps with planning for the first 1 GW OSW farm and the assembly period is staged over 21 years and involves the transition of assembled OSW farms to OampM toward the end of the assembly period
Table 48 Average Annual Output and Job Creation over Key Operating Phases
Economic Stimulus Port Construction Assembly OampM
Jobs
San Luis Obispo County 2365 1080 1075
Santa Barbara County 47 46 62
Monterey County 6 7 10
Rest of California 767 655 780
California Total 3185 1790 1926
Output (millions)
San Luis Obispo County $40452 $36304 $50331
Santa Barbara County $779 $976 $1583
Monterey County $115 $153 $243
Rest of California $18591 $17134 $25146
California Total $59938 $54566 $77303
Table 47 Output and Job Creation from a 7 GW field of OSW
RegionFull-Time Equivalent
JobsTotal Output
(millions)
San Luis Obispo County 44960 $1500241
Santa Barbara County 2019 $44632
Monterey County 314 $6871
Rest of California 24869 $699440
California Total 72162 $2251185
Economic Impact of Offshore Wind Farm Development on the Central Coast
58
The regional economic stimulus provided by a 7 GW field of OSW farms over its lifetime results in the highest annual employment level during the OampM period The OampM period for a 7 GW field of OSW provides an average of $503 million in annual output and 1075 full-time jobs each year for workers in San Luis Obispo County and $773 million in annual output and 1926 full-time jobs each year in California
Table 49 derives annual steady-state values from periodic recommissioning and redeployment of 7 GW OSW for perpetuity The steady-state values represent the annual OampM value for continued operation of a 7 GW field of OSW farms plus the additional benefit from periodic recommissioning of each 1 GW OSW farm staged in 3-year periods that begin with the first OSW farm in 2059 Specifically the average annual regional economic benefits are derived in perpetuity by calculating the economic value for each variable over a 28-year rolling horizon that begins with the OampM period 2050-2058 in which all 7 OSW farms operate followed by a 21-year recommissioning phase involving the staged reassembly and redeployment of successive 1 GW OSW farms over 3-year intervals at the port
The annual average output level resulting from periodic recommissioning and redeployment of 7 GW OSW is $686 million in annual output and 1389 full-time jobs each year for workers in San Luis Obispo County and $104 billion in annual output and 2488 full-time jobs each year in California The interpretation of these values is the long-run average economic value to the regional economy from operating a mature field of OSW farms that perpetually recommissions and maintains 7 GW of OSW in the Central California region
The steady-state average regional economic values represent an approximation because a fully integrated process for maintaining a 7 GW field of OSW farms would be driven by strong economic incentives to maintain OSW turbines on the water generating electricity for the maximum number of days By the time the first OSW farm begins the recommissioning process in 2059 the solution to this problem may ultimately involve a different staging process for OSW turbine replacement than the one considered here in which each 1 GW OSW farm is recommissioned in a 3-year period following its 25-year operating period
Table 49 Annual Output and Job Creation from 7 GW OSW for Perpetuity
RegionFull-Time
Equivalent Jobs Total Output (millions)
San Luis Obispo County 1389 $68601
Santa Barbara County 80 $2114
Monterey County 13 $317
Rest of California 1006 $33123
California Total 2488 $104154
Economic Impact of Offshore Wind Farm Development on the Central Coast
59
The entries in Table 49 are conservative for two reasons First replacement of each 1 GW OSW farm which begins in the year 2059 is with another baseline 1 GW OSW farm built with currently available technology By 2058 it is possible that technological advances will increase the economic value of reinstalling an OSW farm on a new or renewed lease Second the value during the recommissioning period for each 1 GW OSW farm is taken as the added value of recommissioning for the baseline 1 GW OSW farm considered above This suppresses the dynamic adjustment feature of the REMI model under which the value of subsequent recommissioning periods is elevated based on the experience gained by the regional workforce from recommissioning the first 1 GW OSW farm
424 SMALLER SCALE DEVELOPMENT THE CASE OF 3 GW OSW
The potential to develop 7 GW of OSW in and around the Morro Bay Call Area depends on the ability to reach an agreement with the US Department of Defense (DOD) for an expanded OSW planning area In the event that an expanded OSW planning area is not identified in and around the Morro Bay Call Area it is possible to develop a smaller 3 GW field of OSW farms in the 311 square mile area encompassed by the existing Morro Bay Call Area
In the case of 3 GW OSW development in Central California the initial spike in output and employment during the assembly phase is contracted to a 9-year period due to the staging of individual 1 GW OSW farms in successive 3-year periods at the specialized wind port The analysis of the 3 GW OSW development scenario includes the economic value created by constructing a specialized wind port in San Luis Obispo County because the regional economic benefit of OSW development is centered around job creation at the port
Table 410 shows the regional economic value realized for San Luis Obispo County and the State of California over the planning assembly and operating horizon of a 3 GW field of OSW farms absent recommissioning These values include the construction of a specialized wind port during the planning phase prior to assembly of the OSW farms The regional economic stimulus provided by the 3 GW field of OSW farms generates output of $767 billion for San Luis Obispo County and the creation of 28422 full-time equivalent (FTE) jobs over the period 2022-2060 The overall impact in California is $117 billion and the creation of 44282 FTE jobs during this period
Table 410 Output and Job Creation from a 3 GW field of OSW
RegionFull-Time
Equivalent Jobs Total Output (million $s)
San Luis Obispo County 28422 $766223
Santa Barbara County 1140 $23255
Monterey County 173 $3583
Rest of California 14547 $376664
California Total 44282 $1169724
Economic Impact of Offshore Wind Farm Development on the Central Coast
60
Table 411 breaks down output and job creation into annual averages over the various phases of the operating horizon for a 3 GW field of OSW farms absent recommissioning The port construction period overlaps with planning for the first 1 GW OSW farm and the assembly period is staged over 9 years and involves the transition of assembled OSW farms to OampM toward the end of the assembly period
Following the bump in employment during port construction the regional economic stimulus provided by a 3 GW field of OSW farms over its lifetime results in the highest annual employment level during the assembly period Relative to a 7 GW field of OSW employment and output levels tick downward in the OampM period as the regional economy is less active in supporting the smaller field of OSW farms due to a decreased need for maintenance and repair The OampM period for a 3 GW field of OSW provides an average of $176 million in annual output and 483 full-time jobs each year for workers in San Luis Obispo County and $281 million in annual output and 858 full-time jobs each year in California
Table 412 derives annual steady-state values from periodic recommissioning of a 3 GW field of OSW farms for perpetuity The steady-state values represent the annual OampM value for continued operation of a 3 GW field of OSW farms plus the additional benefit from periodic recommissioning of each 1 GW OSW farm staged in 3-year periods that begin with the first OSW farm in 2059 The
Table 411 Average Annual Output and Job Creation over Key Operating Phases of a 3 GW Field of OSW
Economic Stimulus Port Construction Assembly OampM
Jobs
San Luis Obispo County 2365 768 483
Santa Barbara County 47 22 25
Monterey County 6 4 4
Rest of California 767 454 346
California Total 3185 1249 858
Output (millions)
San Luis Obispo County $40452 $20088 $17624
Santa Barbara County $779 $405 $568
Monterey County $115 $067 $087
Rest of California $18591 $10313 $9819
California Total $59938 $30874 $28098
Economic Impact of Offshore Wind Farm Development on the Central Coast
61
average annual regional economic benefits are derived in perpetuity by calculating the economic value for each variable over a 28-year rolling horizon that begins with the OampM period 2038-2058 in which all three OSW farms operate followed by a 9-year recommissioning phase involving the staged reassembly and redeployment of successive 1 GW OSW farms over 3-year intervals at the port
The annual average output level resulting from periodic recommissioning and redeployment of 3 GW OSW is $255 million in annual output and 617 full-time jobs each year for workers in San Luis Obispo County and $396 million in annual output and 1098 full-time jobs each year in California The interpretation of these values is the long-run average economic value to the regional economy from operating a mature field of OSW farms that perpetually recommissions and maintains 3 GW of OSW from a specialized wind port in San Luis Obispo County
Table 412 Annual Output and Job Creation from 3 GW OSW in Perpetuity
RegionFull-Time
Equivalent Jobs Output (millions)
San Luis Obispo County 617 $25454
Santa Barbara County 33 $795
Monterey County 5 $119
Rest of California 443 $13237
California Total 1098 $39605
Economic Impact of Offshore Wind Farm Development on the Central Coast
62
SECTION 5
FISCAL IMPLICATIONS
Economic Impact of Offshore Wind Farm Development on the Central Coast
63
5 FISCAL IMPLICATIONS
Development of OSW farms in Central California have fiscal implications for San Luis Obispo County The fiscal impact of the project is composed of tax revenue derived from several components
bull property taxes on assessed land improvements at the specialized wind portbull unitary taxes assessed on PGampE from the use of transmission and distribution lines in San Luis
Obispo Countybull sales and use taxes on personal consumption of workers employed at the port facilitybull sales and use taxes on OSW capital expenditurebull income taxes on employee wages
bull corporate taxes on value added in the regional supply chain
The fiscal implications depend on renewable energy credits and other aspects that may result in certain components of project expenditures being exempt from state and local taxes For imported equipment delivered to the port such as turbines towers and floating sub-structures the ability to tax these expenditures depends on the ability of the county to declare imports as an originating transaction that occurs at a specialized wind port For this report fiscal implications are calculated gross of any tax credits that may be applied
Local taxes include property and excise taxes paid to municipalities by workers in the jobs generated by the construction- and operating-period employment reflected in Tables 46-48 as well as property and other local taxes by the companies employing those individuals State taxes include income and sales taxes paid by individuals as well as payroll income and other taxes paid by the companies that employ those individuals The taxes are thus proportional to the total direct indirect and induced economic effects provided in these tables However these totals do not represent all taxes paid by companies whose output is only partly affected by the changes in demand attributable to construction and operating periods of offshore wind energy installation and maintenance port construction and terminal operation
51 PROPERTY TAXES FROM LAND IMPROVEMENTS AT THE SPECIALIZED WIND PORT
Property taxes in San Luis Obispo County are levied at a 1 percent rate on land improvements resulting from development of a specialized wind port in San Luis Obispo County The projected capital expense required to construct the port is in the range of $17 billion to $25 billion Using the cost of developing a specialized wind port as a proxy for the change in assessed land improvements constructing a specialized wind port in San Luis Obispo County would result in annual property taxes to the county of $17-25 million per year
Economic Impact of Offshore Wind Farm Development on the Central Coast
64
52 UNITARY TAXES ON ELECTRICITY TRANSMISSION BY PGampE
The County of San Luis Obispo currently receives unitary taxes and franchise taxes from PGampE from the operation of DCPP In the 2019-2020 tax year unitary tax revenues in San Luis Obispo County accounted for $236 million in annual taxes 85 of which was paid by PGampE By far unitary taxes represent the largest revenue source for the county from DCPP54
California bases the unitary tax on the combined total corporate income of multi-state and multi-national corporations by applying a formula to determine the total amount of income the corporation realized within California The State of California assesses the unitary tax on individual corporations as well as groups of companies who operate together as a ldquounitrdquo and then divides the total tax receipt for each unit at the state-level into shares of taxes received by each county For the case of PGampE unitary taxes are assessed by the State Board of Equalization (BOE) at the same 1 rate as property taxes using Historic Cost Less Depreciation (HCLD) as the basis for the assessment The current board-adopted value for PGampE as the basis for unitary taxes is $312 billion55
With the planned closure of DCPP and potential development of OSW the unitary tax received by San Luis Obispo County will change based both on changes in the HCLD for PGampE and shifts in the share of capital costs attributed to the county from electricity distribution Absent OSW development the prospective closure of DCPP will reduce PGampErsquos HCLD following a decrease in annual operating costs however this drop in operating costs will be offset to some extent by increased storage and maintenance costs for nuclear material As existing power generated by DCPP is replaced by electricity generation elsewhere it is likely that the HCLD of PGampE increases although the share of capital costs attributed to San Luis Obispo County can go up or down depending on capital investment required to upgrade the transmission infrastructure for power delivery from alternative uses such as OSW
The National Renewable Energy Laboratory (NREL) estimates required investments in transmission infrastructure for a 1 GW OSW farm site with an average distance to cable landfall of 45km to be $162 billion56 These costs which include grid connection costs for an offshore spur line would be incurred by PGampE (or another contractor in its unit) as part of the basis for the unitary tax Each region in California would be entitled to a share of the unitary tax revenue proportional to the change in PGampErsquos HCLD realized within the region
Based on the estimated transmission infrastructure cost of $162 billion for a 1 GW OSW farm the total cost of developing a 7 GW field of OSW would be approximately $813 billion57 Of this investment the majority of the transmission line would be situated in federal waters outside the tax jurisdiction of the state The taxable proportion of grid connection costs for an offshore spur line to a 7 GW field of OSW can be calculated according to the share of the transmission infrastructure passing through California waters which is the territory extending 3 nautical miles (56 km) from the shore at mean low tide These costs would include both the share of the transmission line residing in California and the cost of the substation at the cable landfall An approximation of the share of grid connection costs attributed to California would be 1244 (=5645 km) Based on this increment the increase in unitary taxes for San Luis Obispo County from a 7 GW field of OSW would be approximately $10 million per year
Economic Impact of Offshore Wind Farm Development on the Central Coast
65
53 SALES AND USE TAXES ON OSW SPENDING
Sales and use taxes are assessed on taxable sales in California at a rate of 725 In addition counties and municipalities can charge an additional local sales tax of up to 25 through special sales tax jurisdictions Currently special tax jurisdictions in San Luis Obispo County provide an additional assessment of 05 for Grover Beach Arroyo Grande Pismo Beach and Paso Robles for a combined effective tax rate of 775 for purchases made in these communities While it is possible that a specialized wind port authority can levy an additional assessment for OSW spending at the port the values provided here consider sales and use taxes only at the 725 rate
The overnight capital cost for a floating 1 GW OSW farm is projected to be $41 billion of which roughly 30 is comprised of turbine capital cost and 36 for the support structure (including the floating substructure lines and anchors for mooring systems and array cables) These OSW components will be imported at least in the short-term58
Sales and use taxes can be assessed on California transactions at the specialized wind port even for imported goods if the transaction occurs in California If the capital spending on turbines and the support structure for a 7 GW field of OSW farms is taxed taxable spending during the 21-year assembly and installation period for OSW would result in California sales and use taxes of $14 billion Based on a 28-year replacement standard for each 1 GW OSW farm the annual sales and use taxes for California in a long-run steady state with periodic recommissioning would result in $498 million per year in additional sales and use taxes for the State of California at prevailing OSW capital costs
54 SALES AND USE TAXES CORPORATE TAXES AND INCOME TAXES FROM AFFILIATED SPENDING
The development of OSW also generates local taxes from income and induced spending by OSW workers as well as corporate taxes on the value added in the regional supply chain from the companies employing those individuals State taxes include income and sales taxes paid by individuals as well as payroll income and other taxes paid by the companies that employ them
Table 51 presents the estimated annual increase in California state taxes from maintaining a 3 GW vs a 7 GW field of OSW farms for perpetuity Corporate income taxes are based on value-added created in the regional supply chain personal income taxes are levied on worker incomes and sales taxes on retail purchases are derived from disposable income The effective tax rate for each component is calculated using data from the California Legislative Analystrsquos Office as the average tax collected in each category as a share of economic activity that occurred in the state over the period 2017-2019 The effective rate for the corporate income tax is taken to be the corporate tax bill as a share of value-added and the retail sales tax is taken to be the retail sales and use tax revenue as a share of personal consumption expenditures spent on taxable items in the state Development of a 3 GW field of OSW farms results in an additional $27 million per year in California tax revenue whereas a 7 GW field of OSW farms contributes $76 million per year in California tax revenue
Economic Impact of Offshore Wind Farm Development on the Central Coast
66
55 SUMMARY OF FISCAL IMPLICATIONS
Table 52 provides a summary of the annual fiscal implications for maintaining a mature field of 3 GW vs 7 GW OSW in and around the Morro Bay Call Area Estimated property taxes from land improvement from investment in a specialized wind port facility are taken at 1 of the midpoint of the estimated capital investment Unitary taxes on the capital cost of infrastructure is fully attributed to San Luis Obispo County including the share of spending that occurs in state waters in addition to onshore investment State taxes amortize the cost of recurring capital investment for recommissioning OSW farms which assumes imported capital is recorded as a taxable transaction on state land at the port Taxes from regional income and spending are taken from Table 51 and suppress the additional county-level 05 retail sales tax from worker spending in special tax jurisdictions in Grover Beach Arroyo Grande Pismo Beach and Paso Robles
In the case of a 3 GW field of OSW development tax values are proportionally smaller due to the smaller scale of the project with the exception of property taxes from the specialized wind port The basis for the increase in assessed value of the property taxes is taken at the low end of the range of cost estimates for the case of 3 GW OSW development and at the high end of the range for the case of 7 GW OSW development Detailed information at this time is not available to confirm whether or not the cost of port construction would materially differ in the case where the specialized wind port was constructed to support a 3 GW or a 7 GW field of OSW farms
Table 51 Annual Taxes from Regional Economic Development of 3 GW vs 7 GW OSW
3 GW Field 7 GW Field
Type of Tax Effective Rate Basis (millions) Tax (millions) Basis (millions) Tax (millions)
Corporate Income Tax 09078 $18737 $170 $46323 $421
Personal Income Tax 83508 $21861 $1826 $65226 $5447
Retail Sales Tax 37515 $18722 $702 $55654 $2088
Total $2698 $7955
Economic Impact of Offshore Wind Farm Development on the Central Coast
67
Table 52 Summary of Annual Fiscal Benefits from 3 GW vs 7 GW OSW
3 GW Field 7 GW Field
Tax BasisCounty Taxes (millionsyr)
State Taxes (millionsyr)
County Taxes (millionsyr)
State Taxes (millionsyr)
Specialized Wind Port
Property Taxes $1700 $2500
OSW Capital Spending $2133 $4978
Transmission Infrastructure
Unitary Taxes $434 $1012
Regional Spending
Corporate Income Tax $170 $421
Personal Income Tax $1826 $5447
Retail Sales Tax $702 $2088
Total $2134 $4831 $3512 $12933
Economic Impact of Offshore Wind Farm Development on the Central Coast
68
SECTION 6
CONCLUSION
Economic Impact of Offshore Wind Farm Development on the Central Coast
69
6 CONCLUSION
The development of up to 7 GW OSW in and around the Morro Bay Call Area represents a considerable opportunity for job and economic output impacts However the logistical challenges associated with building and operating a field of OSW farms and the associated specialized wind port that supports them are substantial If a specialized wind port for OSW turbine assembly and repair is not constructed in San Luis Obispo County then the regional economic benefits of jobs and economic output creation would occur instead in the county that provides the port In contrast the State of California would retain much of the economic benefit of OSW development if another county in California provides the specialized wind port
Construction-phase impacts during the 5-year period of port construction generate 11825 full-time equivalent (FTE) construction jobs in San Luis Obispo County and 15925 construction jobs overall in California stimulating $202 billion in additional economic output for San Luis Obispo County and $3 billion in economic output for California These impacts on economic output and jobs include port terminal and transmission infrastructure improvements as well as the first stage of wind farm development and planning operations
Following the period of port construction and OSW planning assembly of 1 GW OSW farms is staged over time in a 3-year period for each OSW farm For a 3 GW field of OSW farms construction of a port followed by staged assembly of 1 GW OSW farms over a total of 9 years provides 28422 FTE jobs in San Luis Obispo County and 44282 FTE jobs in California over an operating horizon through 2060 Developing a 3 GW field of OSW farms generates $766 billion in economic output for San Luis Obispo County and $1170 billion in economic output for California through the year 2060 Additional jobs and economic output would be realized during the decommissioning period of the field which extends well beyond the horizon of the REMI model in 2060 and is therefore not considered in the model
For a 7 GW field of OSW farms construction of a port followed by staged assembly of 1 GW OSW farms over a total of 21 years provides 44960 FTE jobs in San Luis Obispo County and 72162 FTE jobs in California over an operating horizon through 2060 Developing a 7 GW field of OSW farms generates $15 billion in economic output for San Luis Obispo County and $2251 billion in economic output for California through the year 2060 As in the case of a 3 GW field of OSW farms additional jobs and economic output would be realized during the decommissioning period which is not considered in the model
Perpetual operation of a mature 3 GW or 7 GW field of OSW farms produces considerable regional economic benefits each year Perpetual operation of a mature 3 GW field of OSW farms results in the creation of 617 jobs per year in San Luis Obispo County and 1098 jobs per year in California and provides additional economic output of $254 million per year in San Luis Obispo County and $396
Economic Impact of Offshore Wind Farm Development on the Central Coast
70
million per year in California Perpetual operation of a mature 7 GW field of OSW farms results in the creation of 1389 jobs per year in San Luis Obispo County and 2488 jobs per year in California and provides additional economic output of $686 million per year in San Luis Obispo County and $104 billion per year in California
Fiscal benefits to San Luis Obispo County are predominantly driven by property taxes on land improvements at the specialized wind port which generates between $17-$25 million per year in local property tax revenues The considerable cost of developing the necessary transmission infrastructure to provide grid connection for a 3-7 GW field of OSW farms to the existing connections at DCPP provides a tax benefit to the county as well Based on the taxable change in the cost of the transmission infrastructure the development of a 3 GW field of OSW farms is projected to result in increased unitary taxes for San Luis Obispo County of $43 million per year whereas the development of a 7 GW field of OSW farms is projected to result in increased unitary taxes for San Luis Obispo County of $101 million per year
The fiscal impact to the State of California is comprised of sales and use taxes on personal consumption expenditures resulting from worker spending corporate income taxes on value added by companies in the regional supply chain and the state income taxes on employed workers Using effective tax rates derived from data provided by the California Legislative Analystrsquos Office perpetual operation of a mature 3 GW field of OSW generates $27 million per year in California tax revenue whereas a 7 GW field of OSW generates $796 million per year in California tax revenue from the projected economic activity created by OSW
Over time economic impacts can change As installed wind farm capacity in California increases through planned developments in Central and Northern California learning effects are likely to further reduce costs and investment in OSW manufacturing capabilities in California would allow a greater share of inputs to be locally sourced Changes along these lines will result in greater regional economic benefits in the long-term for floating OSW development in California
Economic Impact of Offshore Wind Farm Development on the Central Coast
71
REFERENCES
American Jobs Project 2019 The California Offshore Wind Project A Vision for Industry Growth February 2019 Available at httpsoffshorewindhuborgresource1771
American Wind Energy Association California and Offshore Wind California 2020 AWEA-California and Offshore Wind California Comments California Energy Commission Docket 17-MISC-01 June 30 2020 Available at httpsefilingenergycagovGetDocumentaspxtn=233690ampDocumentContentId=66331
Berkeley Lab 2020 Wind Technologies Market Report Available at httpsemplblgovwind-technologies-market-report
Beiter P Musial W Smith A Kilcher L Damiani R Maness M Sirnivas S Stehly T Gevorgian V Mooney M and Scott G 2016 A spatial-economic cost-reduction pathway analysis for US offshore wind energy development from 2015ndash2030 (No NRELTP-6A20-66579) National Renewable Energy Laboratory(NREL) Golden CO (United States)
BOEM California Offshore Wind Energy httpscaoffshorewinddatabasinorgmaps4c-86c5e61e044747ac010102c4787507active
Brightline Defense 2020 California Offshore Wind Winding up for Environmental Growth and Environmental Equity December 2020
Bureau of Ocean Energy Management (BOEM) California Offshore Renewable Energy Fact Sheet February 22 2017 Available at httpswwwboemgovsitesdefaultfilesrenewable-energy-programState-ActivitiesCABOEM-Offshore-Renewables-Factsheet--02-22-17pdf
Busch C and Orvis R 2020 Insights from the California Energy Policy Simulator On the Statersquos Current Greenhouse Gas Emission Trajectory and Six Policy Opportunities for Deepening Emission Reductions Energy Innovation LLC January 2020 Available at httpsenergyinnovationorgwp-contentuploads202005Insights-from-the-California-Energy-Policy-Simulator_5120pdf
California Board of Equalization Unitary Valuation Methods March 2003 Available at httpswwwboecagovproptaxespdfmethodsbook2003pdf
California Energy Commission 2019 Total System Electric Generation Available at httpswwwenergycagovdata-reportsenergy-almanaccalifornia-electricity-data2019-total-system-electric-generation
California Energy Commission 2020 UPDATED Notice of Availability of Outreach on Additional Considerations for Offshore Wind Energy off the Central Coast of CA May 7 2020
Colias M 2021 GM to Phase Out Gas- and Diesel-Powered Vehicles by 2035 The Wall Street Journal January 28 2021 Available at httpswwwwsjcomarticlesgm-sets-2035-target-to-phase-out-gas-and-diesel-powered-vehicles-globally-11611850343
Economic Impact of Offshore Wind Farm Development on the Central Coast
72
Collier R 2017 High Road for Deep Water Center for Labor Research and Education University of California Berkeley CA
Dvorak MJ Archer CL and Jacobson MZ 2010 California offshore wind energy potential Renewable energy 35(6) pp1244-1254
Energy and Environmental Economics Inc 2019 The Economic Value of Offshore Wind Power in California August 2019 Available at httpcastlewindcomwp-contentuploads2019082019-08-08_E3-CastleWind-OffshoreWindValueReport_compressedpdf
Energy and Environmental Economics Inc 2018 ldquoDeep Decarbonization in a High Renewables Futurerdquo California Energy Commission June 18 2018 Available at httpswwwethreecomwp-contentuploads201806Deep_Decarbonization_in_a_High_Renewables_Future_CEC-500-2018-012-1pdf
Fripp M and Wiser RH 2008 Effects of temporal wind patterns on the value of wind-generated electricity in California and the Northwest IEEE Transactions on Power Systems 23(2) pp477-485
Froese M 2019 Why collaboration is critical to offshore wind and port success Windpower Energy and Development August 28 2019 Available at httpswwwwindpowerengineeringcomwhy-collaboration-is-critical-to-offshore-wind-and-port-success
Garrick BJ and Wakefield DJ 2020 Probabilistic Risk Assessment of Nuclear Power Plant Spent Fuel Handling and Storage Programs Methodology and Application to the Diablo Canyon Power Plant The B John Garrick Institute for the Risk Sciences at UCLA and Pacific Gas and Electric Company February 17 2020
Global Wind Energy Council (GWEC) 2020 Global Offshore Wind Report August 5 2020 Available at httpsgwecnetglobal-offshore-wind-report-2020
Hackett S and Anderson J 2020 California North Coast Offshore Wind Studies Economic Development and Impacts Schatz Energy Research Center September 2020
London Economics International LLC 2013 Analysis of the Macroeconomic Impacts of the Proposed Zephyr Transmission Project May 2013 Available at httpwwwdatcllccomwp-contentuploads201306ZephyrEconomicBenefitsStudy-5212013pdf
Lowder K 2021 Wind Power amp Renewables Surge to New Record in China Cleantechnica January 22 2021 Available at httpscleantechnicacom20210122wind-power-renewables-surge-to-new-record-in-china
Massachusetts Clean Energy Center 2017 2017 Massachusetts Offshore Wind Ports amp Infrastructure Assessment May 2017 Available at httpwwwmassceccomports
Musial W Beiter P Tegen S and Smith A 2016 Potential Offshore Wind Energy Areas in California An Assessment of Locations Technology and Costs National Renewable Energy Laboratory December 2016 Available at httpswwwboemgovsitesdefaultfilesenvironmental-stewardshipEnvironmental-StudiesPacific-RegionStudiesBOEM-2016-074pdf
Economic Impact of Offshore Wind Farm Development on the Central Coast
73
National Renewable Energy Laboratory (NREL) Annual Technology Baseline 2020 Available at httpsatbnrelgovelectricity2020dataphp
Porter A and Phillips S 2016 Determining the Infrastructure Needs to Support Offshore Floating Wind and Marine Hydrokinetic Facilities on the Pacific West Coast and Hawaii US Bureau of Offshore Energy Management March 3 2016 Available at httpwwwdataboemgovPIPDFImagesESPIS55503pdf
Reed S 2021 A Monster Wind Turbine is Upending the Industry The New York Times January 1 2021 Available at httpswwwnytimescom20210101businessGE-wind-turbinehtml
Roland-Holst DW Behnke D Evans S Froumllund L and Yi-Chen A 2019 Economic Impact Assessment of the Prospective Closure of the Diablo Canyon Nuclear Power Plant California Public Utilities Commission June 28 2019
Severy M and Jacobson A 2020 California North Coast Offshore Wind Studies Interconnection Constraints and Pathways Schatz Energy Research Center September 2020
Severy M Younes A Zoellick J and Jacobson A 2020 Northern California Offshore Wind Generation and Load Compatibility Assessment with Emphasis on Electricity Grid Constraints Mitigation Measures and Associated Costs Final Synthesis Report Energy Research Center September 2020 OCS Study BOEM 2020-045
Shaner MR Davis SJ Lewis NS and Caldeira K 2018 ldquoGeophysical constraints on the reliability of solar and wind power in the United Statesrdquo Energy amp Environmental Science 11(4) pp914-925
Sinden G 2007 ldquoCharacteristics of the UK wind resource Long-term patterns and relationship to electricity demandrdquo Energy Policy 35(1) pp112-127
Speer B Keyser D and Tegen S 2016 Floating Offshore Wind in California Gross Potential for Jobs and Economic Impacts from Two Future Scenarios (No NRELTP-5000-65352) National Renewable Energy Laboratory (NREL) Golden CO (United States)
Wang YH Walter RK White C Kehrli MD Hamilton SF Soper PH and Ruttenberg BI 2019 ldquoSpatial and temporal variation of offshore wind power and its value along the Central California Coastrdquo Environmental Research Communications 1(12) p121001
1 A power plant with a 50 capacity factor produces twice as much power per day as a power plant with the same nameplate
capacity and a 25 capacity factor
2 The overnight LCOE for floating OSW is currently $67MWh which compared with $69MWh for commercial PV in Los
Angeles $61MWh for nuclear and $57-89MWh for new steam-reach development of hydropower and $123MWh for flash
steam enhanced geothermal systems National Renewable Energy Laboratory (NREL) Annual Technology Baseline 2020
Available at httpsatbnrelgovelectricity2020dataphp
3 California Energy Commission 2019 Total System Electric Generation Available at httpswwwenergycagovdata-reports
energy-almanaccalifornia-electricity-data2019-total-system-electric-generation
Economic Impact of Offshore Wind Farm Development on the Central Coast
74
4 Busch C and Orvis R 2020 Insights from the California Energy Policy Simulator on the Statersquos Current Greenhouse Gas Emission
Trajectory and Six Policy Opportunities for Deepening Emission Reductions Energy Innovation LLC January 2020 Available at
httpsenergyinnovationorgwp-contentuploads202005Insights-from-the-California-Energy-Policy-Simulator_5120
5 Colias M 2021 GM to Phase Out Gas- and Diesel-Powered Vehicles by 2035 The Wall Street Journal January 28 2021
Available at httpswwwwsjcomarticlesgm-sets-2035-target-to-phase-out-gas-and-diesel-powered-vehicles-
globally-11611850343
6 Energy and Environmental Economics Inc 2018 ldquoDeep Decarbonization in a High Renewables Futurerdquo California Energy
Commission June 18 2018 Available at httpswwwethreecomwp-contentuploads201806Deep_Decarbonization_
in_a_High_Renewables_Future_CEC-500-2018-012-1pdf
7 Severy M Younes A Zoellick J Jacobson A 2020 Northern California Offshore Wind Generation and Load Compatibility
Assessment with Emphasis on Electricity Grid Constraints Mitigation Measures and Associated Costs Final Synthesis Report Schatz
Energy Research Center September 2020
8 Bureau of Ocean Energy Management (BOEM) httpswwwboemgovrenewable-energylease-and-grant-information
9 This calculation is based on a capacity factor of 50 for OSW The exact amount of generating capacity needed to meet state
renewable energy targets in 2050 depends on future demand growth driven by electrification and the capacity factor of the
power source which is rapidly increasing for OSW
10 National Renewable Energy Laboratory (NREL) Annual Technology Baseline 2020 Available at httpsatbnrelgov
electricity2020dataphp
11 A capacity factor of 50 percent is equivalent to achieving the full nameplate capacity of the OSW farm for 12 hours per day
with zero electricity generation for the remaining 12 hours per day
12 American Jobs Project 2019 The California Offshore Wind Project A Vision for Industry Growth February 2019 Available
at httpsoffshorewindhuborgresource1771
13 Myers Amanda 2020 Seven Policies to Tap US Offshore Windrsquos $166 Billion Economic Growth And Emissions Reduction
Potential Forbes August 31 2020 Available at httpswwwforbescomsitesenergyinnovation20200831seven-policies-
the-us-can-use-to-tap-offshore-winds-166-billion-economic-growth-and-emissions-reduction-
potentialsh=5bf30e546f27
14 Energy and Environmental Economics Inc 2019 The Economic Value of Offshore Wind Power in California August 2019
Available at httpcastlewindcomwp-contentuploads2019082019-08-08_E3-CastleWind-OffshoreWindValueReport_
compressedpdf
15 Wang YH Walter RK White C Kehrli MD Hamilton SF Soper PH and Ruttenberg BI 2019 ldquoSpatial and temporal
variation of offshore wind power and its value along the Central California Coastrdquo Environmental Research Communications
1(12) p121001
16 External costs of GHG emissions are captured to some extent in California electricity prices through public regulations for
instance the cap-and-trade program for carbon emissions under AB 32 Similarly higher electricity generation costs are
priced into the California grid indirectly by Californiarsquos commitment to developing renewable sources
17 Musial W Beiter P Tegen S and Smith A 2016 Potential Offshore Wind Energy Areas in California An Assessment of
Locations Technology and Costs National Renewable Energy Laboratory December 2016 Available at httpswwwboem
govsitesdefaultfilesenvironmental-stewardshipEnvironmental-StudiesPacific-RegionStudiesBOEM-2016-074pdf
18 California Energy Commission 2020 UPDATED Notice of Availability of Outreach on Additional Considerations for Offshore Wind
Energy off the Central Coast of CA May 7 2020
Economic Impact of Offshore Wind Farm Development on the Central Coast
75
19 American Wind Energy Association California and Offshore Wind California 2020 Offshore Wind Development in Morro Bay
Letter to the Honorable Salud Carbajal and the Honorable Jimmy Panetta May 27 2020
20 Brightline Defense 2020 California Offshore Wind Winding up for Environmental Growth and Environmental Equity December
2020
21 Ma K Luo Y Thomas KC amp Wu Y 2019 Mooring System Engineering for Offshore Structures Elsevier Science amp
Technology San Diego Available from ProQuest Ebook Central February 2021
22 KampL Gates 2019 Offshore Wind Handbook Version 2 October 2019 Available at httpsfilesklgatescomfilesuploads
documents2019_offshore_wind_handbookpdf
23 If the blades are not already attached to the nacelle-hub each blade is then lifted separately by the crane and connected to
the hub
24 Uraz E 2011 Offshore wind turbine transportation amp installation analyses planning optimal marine operations for offshore
wind projects Available at httpwwwdiva-portalorgsmashgetdiva2691575FULLTEXT01pdf
25 Wang YH Walter RK White C Kehrli MD Hamilton SF Soper PH and Ruttenberg BI 2019 Spatial and temporal
variation of offshore wind power and its value along the Central California Coast Environmental Research Communications
1(12) p121001
26 Wang YH Walter RK White C Kehrli MD Hamilton SF Soper PH and Ruttenberg BI 2019 Spatial and temporal
variation of offshore wind power and its value along the Central California Coast Environmental Research Communications
1(12) p121001
27 The electricity portfolio must include enough firm capacity to meet coincident system peak plus additional 15 of planning
reserve margin (PRM) requirement
28 Hackett S and Anderson J 2020 California North Coast Offshore Wind Studies Economic Development and Impacts
Schatz Energy Research Center September 2020
29 Massachusetts Clean Energy Center 2017 Massachusetts Offshore Wind Ports amp Infrastructure Assessment May 2017 Available
at httpwwwmassceccomports
30 Porter A and Phillips S 2016 Determining the Infrastructure Needs to Support Offshore Floating Wind and Marine Hydrokinetic
Facilities on the Pacific West Coast and Hawaii US Bureau of Offshore Energy Management March 3 2016 Available at http
wwwdataboemgovPIPDFImagesESPIS55503pdf
31 Collier R 2017 High Road for Deep Water Center for Labor Research and Education University of California Berkeley CA
32 Garrick BJ and Wakefield DJ 2020 Probabilistic Risk Assessment of Nuclear Power Plant Spent Fuel Handling and Storage
Programs Methodology and Application to the Diablo Canyon Power Plant The B John Garrick Institute for the Risk Sciences at
UCLA and Pacific Gas and Electric Company February 17 2020
33 California Energy Commission 2019 Total System Electric Generation Available at httpswwwenergycagovdata-reports
energy-almanaccalifornia-electricity-data2019-total-system-electric-generation
34 Severy M and Jacobson A 2020 California North Coast Offshore Wind Studies Interconnection Constraints and Pathways
Schatz Energy Research Center September 2020
35 London Economics International LLC 2013 Analysis of the Macroeconomic Impacts of the Proposed Zephyr Transmission Project
May 20 2013 Available at httpwwwdatcllccomwp-contentuploads201306ZephyrEconomicBenefitsStudy-5212013pdf
36 Collier R 2017 High Road for Deep Water Center for Labor Research and Education University of California Berkeley CA
37 Collier R 2017 High Road for Deep Water Center for Labor Research and Education University of California Berkeley CA
38 Brightline Defense 2020 California Offshore Wind Winding up for Environmental Growth and Environmental Equity December
2020
39 US Census Bureau 2020
Economic Impact of Offshore Wind Farm Development on the Central Coast
76
40 SLO County BW Report 2018
41 SLO County BW Report 2018
42 US Bureau of Economic Analysis
43 SLO County BW Report 2018
44 US Bureau of Economic Analysis
45 wwwslocountycagov 2021 SLO County Monthly Labor Market Information - County of San Luis Obispo Available at https
wwwslocountycagovDepartmentsSocial-ServicesWorkforce-Development-BoardSLO-County-Monthly-Labor-Market-
Informationaspx
46 wwwblsgov 2021 Unemployment Rates for States Available at httpwwwblsgovweblauslaumstrkhtm
47 SLO County BW Report 2018
48 US Bureau of Economic Analysis 2020
49 US Bureau of Economic Analysis 2020
50 Private costs of OSW include the opportunity cost of delaying the time wind turbines spend on the water by the extra travel
days from a more distant port which will be passed through into consumer electricity prices though higher LCOE for the
change in duration the wind turbines produce electricity for the grid (ie the extra days required for transportation during
periods of turbine installation and repair)
51 Roland-Holst DW Behnke D Evans S Froumllund L and Yi-Chen A 2019 Economic Impact Assessment of the
Prospective Closure of the Diablo Canyon Nuclear Power Plant California Public Utilities Commission June 28 2019
52 Garrick BJ and Wakefield DJ 2020 Probabilistic Risk Assessment of Nuclear Power Plant Spent Fuel Handling and Storage
Programs Methodology and Application to the Diablo Canyon Power Plant The B John Garrick Institute for the Risk Sciences at
UCLA and Pacific Gas and Electric Company February 17 2020
53 A specialized wind port for OSW assembly and repair ultimately may be provided in a neighboring county however the
regional economic benefit considered in this report presumes the port is constructed in San Luis Obispo County
54 SLO County Assessorrsquos Office
55 State of California Board of Equalization httpswwwboecagovproptaxespdfPropValues2020pdf
56 NREL 2020 ATB
57 To the extent economies of scale exist in developing the transmission infrastructure for a 7 GW field of OSW using the NREL
cost approximation for a 1 GW OSW farm as a scalar for field development costs will over-estimate actual transmission
infrastructure costs for 7 GW field of OSW
58 The National Defense Authorization Act for FY2021 recently passed by US Congress includes amendments that ensure that
the Outer Continental Shelf Lands Act (OCSLA) applies to offshore wind farms The amendments have the potential to increase
the share of transportation costs captured by American-built vessels in the offshore wind fleet under the Jones Act

Economic Impact of Offshore Wind Farm Development on the Central Coast
3
Table of ContentsExecutive Summary 041 Introduction 12
11 Recent Technological Advances Make Floating Offshore Wind Possible 13
12 Outlook for Offshore Wind in California 14
13 Economic Value of Offshore Wind 15
2 Industry Background amp Requirements 1821 Technology Description23
22 Offshore Wind Power Has a Favorable Time Profile on the Electricty Grid 24
23 Port Infrastructure Requirements 25
24 Transmission Infrastructure Requirements 29
25 Regional Supply Chain Development 30
26 Timing of Proposed Wind Farm Development 32
27 Employment and Output Demographics in San Luis Obispo County 33
3 Methods and Scope 3631 Scope of the Study 37
311 Specialized Wind Port 38
312 Develoment of Representative 1 GW OSW Farm 39
313 Decommissioning and Recommisioning Provisions for a 1 GW OSW Farm 40
32 Methods 42
4 Results 4541 Port Construction Impacts 46
42 Offshore Wind Development Impacts 47
421 OSW 1 GW Baseline with Decommissioning 48
422 OSW 1 GW Baseline with Recommissioning 53
423 Multiple OSW Farms The Case of 7 GW OSW Development 54
424 Smaller Scale Development The Case of 3 GW OSW 59
5 Fiscal Implications 6251 Property Taxes from Land Improvement at the Specialized Wind Port 63
52 Unitary Taxes on Electricity Transmission by PGampE 64
53 Sales and Use Taxes on OSW Spending 65
54 Sales and Use Taxes Corporate Taxes and Income Taxes from Affiliated Spending 65
55 Summary of Fiscal Implications 66
6 Conclusion 68References 71
Economic Impact of Offshore Wind Farm Development on the Central Coast
4
EXECUTIVE SUMMARY
Economic Impact of Offshore Wind Farm Development on the Central Coast
5
EXECUTIVE SUMMARY
As the State of California continues to transition toward being 100 powered by renewable energy by 2045 offshore wind (OSW) is poised to provide a substantial contribution to the statersquos green energy portfolio Developing OSW energy resources along Californiarsquos Central Coast mdash as underpinned by current plans by the US Bureau of Ocean Energy Management (BOEM) to auction federal waters in the OSW planning area for up to 7 gigawatts (GW) of OSW development mdash has the potential not only to reduce carbon emissions on the electricity grid but also to stimulate broad-based economic growth create quality jobs in green energy and benefit regional communities in and around San Luis Obispo County
Recent advances in floating OSW technology have greatly reduced the cost of producing electricity opening the door for commercial OSW farms to be developed in California With the ocean floor along Californiarsquos coast sloping steeply downward into deep waters offshore wind turbines must be installed on floating platforms rather than being fixed to the ocean floor in shallow waters as is done along the East Coast and much of Europe Given the physical scale and logistical complexity of developing floating OSW farms in California including the need to develop an extensive supply chain to capture these benefits meeting Californiarsquos long-term climate goals will require considerable coordination between government and industry to make the economic potential of OSW a reality
This report analyzes the regional economic benefit to San Luis Obispo County for 3 to 7 GW of OSW development along Californiarsquos Central Coast The regional economic benefit considered in this report provides a dynamic summary of the green job opportunities value added and fiscal returns from the project over time as a result of recurring project spending to meet the needs of an emerging OSW industry in the county
The regional economic benefit fits within a larger context of economic benefits from green energy development in the State of California The overarching economic benefit of OSW in California is derived from its ability to deliver electricity to the grid at minimum social cost It is not possible to convert energy into power without cost and minimizing the social cost of producing electricity on the grid must consider both private costs (what electricity suppliers must pay) and external costs (eg greenhouse gas emissions wildlife disruption) The statersquos ambitious goal of achieving a
Meeting Californiarsquos long-term climate goals will require considerable coordination between government and industry to make the economic potential of OSW a reality
Economic Impact of Offshore Wind Farm Development on the Central Coast
6
zero-carbon renewable electricity mix by 2045 implicitly places a large weight on greenhouse gas emissions in the calculation of social cost tilting the economic balance toward the evaluation of carbon-free electricity projects that minimize private costs
Relative to other renewable energy resources OSW has a favorable time profile of electricity delivery OSW farms produce peak electricity during evening hours reducing storage needs when mixed in a renewable energy portfolio with solar power generation that delivers peak energy in the middle of the day Relative to commercial solar power OSW energy can generate electricity around the clock resulting in a capacity factor of 50 almost double that of commercial solar power1 The levelized cost of energy ($MWh) which represents the long-run average cost of electricity generation over the life of a power plant is approaching parity with commercial solar photovoltaic systems and nuclear power as recent technological advances have greatly reduced the cost of floating OSW 2
An important challenge for floating OSW energy development is minimizing transportation and logistical costs between the OSW field and the specialized wind ports that serve them Given the massive size of OSW turbines final assembly must take place in reinforced quays at a port either at a waterfront manufacturing hub (likely in Asia) or at a specialized wind port that receives floating foundations towers and turbines from the manufacturing center and assembles them locally Developing a specialized wind port provides a foothold for regional economic values to be generated in California by providing assembly maintenance and repair jobs for turbines that might otherwise be towed into federal waters off Californiarsquos coast from international manufacturing centers
The economics of OSW development are driven by tremendous fixed costs that must be incurred up front to make floating OSW power a reality The National Renewable Energy Laboratory (NREL) estimates that installing an OSW farm with 1 GW nameplate capacity involves investing largely unrecoverable capital expenditures (CapEx) of more than $55 billion which requires OSW turbines to be maintained and connected to the electricity grid for extended periods of time to recoup the initial upfront investment The economics of energy projects that involve high fixed costs and low variable costs favor maximizing the time OSW turbines spend on the water generating electricity for the grid as the opportunity cost of down time for turbine maintenance and repair can quickly erode the economic value of OSW The need to maintain OSW turbines for a large number of days on the water to recoup the initial capital investment in turn highlights the need to develop specialized
wind ports for assembly and repair of wind turbines in close proximity to the OSW farms
The center for job creation from floating OSW farms will be at the ports For this reason the regional economic value calculated in this report presumes a specialized wind port is available to assemble and repair floating OSW turbines in San Luis Obispo County
Making economic benefits from OSW development a reality for San Luis Obispo County will require developing a specialized wind port as a hub for OSW jobs and regional supply-chain development
Economic Impact of Offshore Wind Farm Development on the Central Coast
7
In the event a specialized port is not constructed in the county the regional economic benefits considered here will not materialize in San Luis Obispo County but instead will occur in the county that provides the port Making economic benefits from OSW development a reality for San Luis Obispo County will require developing a specialized wind port as a hub for OSW jobs and regional supply-chain development An important next step to attaining the economic benefits detailed in this report is to conduct a feasibility study for developing a specialized wind port in San Luis Obispo County
The economic benefit of OSW development on the Central Coast is derived from the following activities port construction planning assembly operation and maintenance (OampM) and decommissioning (recommissioning)
Virtually all the jobs to support these activities will occur at the specialized wind port which is the physical entity that ties OSW farms located in federal waters to a staging area on Californiarsquos coast
Unlocking Californiarsquos offshore wind energy potential is a case study in the challenges and opportunities involved in the 21st-century clean energy transition Deploying floating OSW farms off Californiarsquos coastline will require developing an entirely new industry in California that must surmount major transmission infrastructure requirements address electricity storage needs and provide integrated resource planning to smooth the timing of electricity delivery from solar land-based wind offshore wind hydropower and geothermal sources in a renewable energy portfolio The emerging OSW industry in California currently lags far behind China and the EU in supply-chain development and its success will depend largely on coordinated policy decisions by state and regional government to provide clear market signals for stakeholders
Investor confidence is needed to develop regional supply chains for OSW energy development in California In-state production of the full range of OSW farm components including turbines and floating foundations is not a reality today but is possible if state and federal planners send clear signals to OSW developers that investing in OSW manufacturing capacity in California will be rewarded by long-term market development If state planners fail to provide clear market signals on the outlook for OSW in California it is likely that much of the supply chain will continue to be outsourced to international manufacturing hubs in China and South Korea for turbines and floating foundations reducing the potential for economic benefits to be realized over time in California
The regional economic benefit of OSW development considered in this report does not include additional values that can be created through the long-term development of manufacturing capacity for turbines and floating foundations in California Indeed the current gap between Californiarsquos capability for OSW manufacturing and the rest of the world remains large Instead the report considers the construction and operation of a small specialized wind port in San Luis Obispo County that acts as a receiving point for manufactured components and engages in the assembly repair and maintenance of floating OSW turbines
A key implication of the study is that the regional economic value of OSW farm development off the Central Coast of California will be largely captured by the county that develops a specialized wind port for assembly and repair of OSW turbines Given the large scale of offshore wind turbines which
Economic Impact of Offshore Wind Farm Development on the Central Coast
8
are many times larger than onshore turbines it is not possible to transport OSW turbines by truck or rail requiring these activities to take place directly at a port For this reason installing operating and maintaining a field of 3 - 7 GW of OSW farms in the region will require developing an extensive supply chain to support the hub of economic activity centered at the specialized wind port
The economic benefit to San Luis Obispo County from OSW farm development is defined by several key phases
bull construction of a specialized wind portbull assembly of OSW turbines at the portbull an operation and maintenance (OampM) period that relies on the specialized wind port to repair
and maintain OSW turbinesbull a decommissioning (or alternatively recommissioning) period at the end of each 30-year lease
With current technology all phases of floating OSW development will take place in a port either by making use of a specialized wind port for final assembly of OSW turbines in California or by floating fully assembled structures into place directly from existing manufacturing centers in Asia
The main findings of the report are as follows Table E1 shows regional job and output creation during the 5-year construction phase of the specialized wind port
Table E2 shows the total job and output for a representative 1 GW OSW farm over a 35-year horizon through 2058 that includes planning assembly a 25-year period for operation and maintenance and a 3-year decommissioning period Economic output includes local spending on labor materials and services and does not include the value of the energy created The value of the representative 1 GW OSW farm is in addition to the value created during the 5-year period of port construction
Table E1 Output and Job Creation from Port Construction
RegionFull-Time
Equivalent JobsTotal Output (million $s)
San Luis Obispo County 11825 $202261
Santa Barbara County 234 $3896
Monterey County 28 $577
Rest of California 3837 $92956
California Total 15925 $299689
Economic Impact of Offshore Wind Farm Development on the Central Coast
9
Table E3 provides a breakdown of the regional economic benefit to San Luis Obispo County in terms of average wages employee compensation and total output resulting from direct project spending indirect activity stimulated through supply-chain development and induced economic activity from employee spending Employee compensation includes wages and fringe benefits paid for by employers
Table E4 compares the annual average economic benefit from operating a mature 3 GW vs 7 GW field of OSW farms These values are based on a scenario of perpetual lease renewal in which OSW turbines are floated back to the specialized wind port for recommissioning at the end of each lease followed by redeployment of OSW turbines for subsequent use The values are based on a perpetual OampM period that begins on the date of final installation of the field in a perpetual cycle of maintenance and repair through the end of the service life of each 1 GW OSW farm The annual economic benefit of maintaining a mature field of OSW farms is in addition to the economic benefit from construction of a specialized wind port in Table E1
Table E3 Regional Economic Impact of a 1 GW Wind Farm in San Luis Obispo County
ImpactFull-Time
Equivalent Jobs
Average Job Compensation ($
year)
Employee Compensation
(million $s)Total Output (million $s)
Direct 3490 $88650 $30941 $162674
Indirect 2308 $66076 $15251 $57822
Induced 814 $74884 $6093 $24760
Total Economic Impact 6612 $79076 $52285 $245256
Table E2 Output and Job Creation from a 1 GW Wind Farm with Decommissioning
RegionFull-Time
Equivalent JobsTotal Output (million $s)
San Luis Obispo County 6612 $245256
Santa Barbara County 364 $7766
Monterey County 58 $1189
Rest of California 4333 $116470
California Total 11368 $370681
Economic Impact of Offshore Wind Farm Development on the Central Coast
10
Table E5 compares the annual fiscal benefits from taxes collected at the county and state level from perpetual operation of a mature 3 GW vs 7 GW field of OSW farms Economic benefits are particularly important to San Luis Obispo County given the planned closure of the Diablo Canyon Power Plant (DCPP) The development of OSW farms just beyond sightlines from the Central Coast could be particularly beneficial to San Luis Obispo County by providing jobs in the affiliated green energy sector of the regional economy
Table E5 Summary of Annual Fiscal Benefits from 3 GW vs 7 GW OSW
3 GW Field 7 GW Field
Tax BasisCounty Taxes (million $yr)
State Taxes (million $yr)
County Taxes (million $yr)
State Taxes (million $yr)
Specialized Wind Port
Property Taxes $1700 $2500
OSW Capital Spending $2133 $4978
Transmission Infrastructure
Unitary Taxes $434 $1012
Regional Spending
Corporate Income Tax $170 $421
Personal Income Tax $1826 $5447
Retail Sales Tax $702 $2088
Total $2134 $4831 $3512 $12933
Table E4 Annual Output and Job Creation from Maintaining a 3 GW vs 7 GW Field of OSW Farms in Perpetuity
3 GW Field 7 GW Field
Type of Tax FTE Jobs Output (millions) FTE Jobs Output (millions)
San Luis Obispo County 617 $25454 1389 $68601
Santa Barbara County 33 $795 80 $2114
Monterey County 5 $119 13 $317
Rest of California 443 $13237 1006 $33123
California Total 1098 $39605 2488 $104154
Economic Impact of Offshore Wind Farm Development on the Central Coast
11
Over time economic opportunities can change in ways that are difficult to predict prior to the initial investment As installed wind farm capacity in California increases over time both in Central California as well as other regions it is likely that regional supply chains develop further This would occur through cost-reducing learning effects and potentially even through the creation of a manufacturing industry for floating OSW foundations towers and turbines in California that would allow a greater share of inputs to be locally sourced from producers in the state Coordinated development of OSW in California and elsewhere in the US has the potential to greatly expand the regional economic impact for a given level of capital expenditure
Unlocking Californiarsquos offshore wind energy potential is a case study in the challenges and opportunities involved in the 21st-century clean energy transition
Economic Impact of Offshore Wind Farm Development on the Central Coast
12
SECTION 2
INTRODUCTION
Economic Impact of Offshore Wind Farm Development on the Central Coast
13
1 INTRODUCTION
As the State of California moves toward meeting its ambitious clean energy and climate goals mdash underscored by targets to reduce greenhouse gas (GHG) emissions from 1990 levels by 40 by 2030 and 80 by 2050 and to achieve a zero-carbon renewable electricity mix by 2045 mdash offshore wind (OSW) is poised to provide a substantial contribution With 112 GW of technical offshore wind resource potential along its coastline the OSW energy sector alone is capable of meeting more than 15 times the statersquos annual electricity demand
Californiarsquos current power supply has already started to shift toward renewable zero-carbon sources In 2019 the State of California derived approximately 32 of its electricity from renewable sources (including 12 solar and 10 onshore wind) and 55 GHG-free including 9 nuclear power (16163 GWh) from Diablo Canyon Power Plant (DCPP)3 Yet despite the recent development of commercial solar power in California including four commercial solar plants in San Luis Obispo County the growth of zero-emission electricity supply is not on target to meet Californiarsquos clean energy goals Based on recent emissions inventory data California emitted 424 million metric tons (MMT) of CO2e in 2017 which implies that reducing statewide emissions below the 260 MMT of carbon dioxide equivalent (CO2e) limit by 2030 will require reducing emissions by an average of 13 MMT of CO2e annually nearly double the annual rate of 7 MMT of CO2e achieved over the past decade4
Much of the movement toward clean energy supply will need to take place on Californiarsquos electricity grid On January 28 2021 General Motors Co set an ambitious target to completely phase out gasoline- and diesel-powered vehicles globally by 20355 The movement of large automakers to the electricity grid compounds the findings of recent California Energy Commission (CEC) and California Public Utilities Commission (CPUC) studies that indicate the state will require two to six times more renewable power capacity by 2050 than is installed today to meet its policy goals under AB 32 implying a need for between 100 to 150 GW of new renewable power capacity6
11 RECENT TECHNOLOGICAL ADVANCES MAKE FLOATING OFFSHORE WIND POSSIBLE
Unlike the coastline on the East Coast of the US the ocean floor slopes steeply downward into deep waters off the California coastline requiring the use of floating platforms for OSW Recent advances in floating platform technologies for OSW turbines have greatly reduced the cost of developing floating OSW farms making it possible to build OSW farms to scale in California that rival the generation capacity of fixed platform technologies as used over the past several decades in the shallower waters off the East Coast and Europe Floating wind technology which relies on mooring lines and anchors to tether platforms to the ocean floor has the advantage of allowing offshore wind turbines to be placed further from shore where the wind speeds are generally faster and more consistent allowing greater power generation while limiting sight impacts from shore While the technology for floating OSW has been demonstrated successfully in pilot projects around the world
Economic Impact of Offshore Wind Farm Development on the Central Coast
14
a commercial scale floating offshore wind farm has not yet been deployed in the United States7
The Bureau of Ocean Energy Management (BOEM) recently initiated the leasing process for three potential offshore wind sites in approximately 687832 acres of federal waters off the California coast to be auctioned for commercial OSW production as early as 20228 BOEM identified Call Areas located off the coast of Central California and the northernmost region of the state (Humboldt Bay) Additionally two more sites (Del Norte and Cape Mendocino) were identified in studies by BOEM and the National Renewable Energy Laboratory (NREL) for potential future OSW development Together development of the initial Call Areas identified by BOEM could support approximately 9 GW of offshore wind development up to 7 GW of which is in the OSW planning area on the Central Coast The development of 7 GW of OSW in the Central Coast OSW planning area would provide roughly 11 of the statersquos current electricity needs (30660 GWh out of 277704 GWh in Californiarsquos 2019 energy mix)9
Floating offshore wind technology which is relatively new has already demonstrated impressive capacity factors of over 50 percent roughly twice that of commercial solar10 The capacity factor of OSW is greater than that of commercial solar because OSW can generate electricity 24 hours a day11 and recent engineering studies project that Californiarsquos floating offshore wind turbines could reach capacity factors of over 70 percent of their maximum theoretical output12
12 OUTLOOK FOR OSW IN CALIFORNIA
The development of OSW energy which has not been featured prominently in Californiarsquos resource planning analyses to date offers several distinct advantages over alternative renewable energy sources Unlike commercial-scale solar power and onshore wind where many of the most productive sites in California have already been developed OSW represents a large and highly scalable resource in California that remains largely untapped Although OSW development is subject to siting concerns such as exclusion zones from the Department of Defense and Marine Protected Areas (MPAs) and entails potential impacts to local fisheries marine mammals and ocean shipping lanes the development of OSW remains relatively unimpeded by the property rights concerns associated with developing onshore resources OSW farms can also be located close to coastal load centers and make use of available transmission capacity eliminating the need to install costly transmission lines to deliver electricity to the California grid
Developing OSW technology in California will require significant capital investment In the US total investment in the offshore wind industry is expected to reach $17 billion by 2025 $108 billion by 2030 and $166 billion by 2035 roughly two-thirds of which will go to the construction industry 25 to the turbine OampM and associated supply chain with much of the remainder
Investment in the offshore wind industry in the US is expected to reach $17 billion by 2025 $108 billion by 2030 and $166 billion by 2035
Economic Impact of Offshore Wind Farm Development on the Central Coast
15
allocated to the transportation industry and ports13
As OSW technology continues to develop it is rapidly becoming cost-competitive with traditional energy sources making floating OSW farms capable of achieving acceptable commercial returns A recent study indicates that including offshore wind in the statersquos energy mix would produce ratepayer savings of approximately $1 to $2 billion by 2040 on a net present value (NPV) basis with floating OSW becoming part of the least-cost portfolio by 203014
Before offshore wind platforms can be constructed suitable ports must be established for staging and assembly of floating turbines onshore Because offshore floating turbines are larger than land-based wind turbines with expected heights exceeding 700 ft turbine blades for OSW are too large to be transported on existing highways or rail lines requiring the assembly of turbines on floating platforms to occur quayside with finished wind turbines delivered by ship directly from the specialized wind port to the offshore site where the moorings and anchors are placed For this reason the specialized wind port is the center for job creation from OSW development Virtually all supply chains that develop to meet the unique requirements of offshore wind originate and terminate at the specialized wind port
This report evaluates the economic impact to San Luis Obispo County and the State of California from the development of one or more OSW farms and the associated port and transmission infrastructure in and around the Morro Bay Call Area The Central California region is ideal for offshore wind development for several reasons
bull Wind speeds are generally strong15 bull The region has existing connections to the statersquos electrical grid bull Much of the coast is outside of national marine sanctuaries where disturbance to the seabed is
prohibitedbull The region is favorably positioned between major population centers with high power demand
in Northern and Southern California
13 ECONOMIC VALUE OF OFFSHORE WIND
When evaluating the regional economic stimulus created by OSW development in San Luis Obispo County it is important to place these values in context with the overall economic value of OSW development for California The overall economic benefit of OSW is captured by transactions between electricity providers and consumers (households and businesses) in Californiarsquos electricity market Consumer benefits in the electricity market are greatest when electricity prices are low Because converting energy to power requires cost the most valuable sources of power in an electricity portfolio are those that deliver electricity to the grid at the lowest cost Indeed for a fixed amount of electricity generation to meet consumer demand economic benefits are maximized when electricity is supplied to consumers at minimum cost
One difficulty in assessing the economic value of renewable energy sources is the distinction between private and social cost The economic value is greatest for an energy portfolio that meets consumer demand at minimum social cost which is the sum of private cost and external cost Private costs reflect actual costs incurred by electricity suppliers for instance the levelized cost
Economic Impact of Offshore Wind Farm Development on the Central Coast
16
of electricity (LCOE) used to evaluate energy investments over time while external costs refer to costs society incurs that are not captured in the electricity market for instance the cost imposed on future generations from GHG emissions today16 For this reason a coal-fired electricity plant may have lower private costs than a floating OSW farm while the wind farm nevertheless has lower social costs a distinction that can be lost when comparing different potential energy sources based strictly on private costs such as the LCOE
Another difficulty in assessing the economic value of renewable energy sources is the distinction between fixed and variable cost In the case of OSW energy substantial fixed costs must be sunk up front to assemble install and connect floating wind turbines to the electricity grid however once this investment has been made the turbines generate electricity at extremely low marginal cost during their entire period of operation A relevant factor that underpins the economic value of a renewable energy project is the LCOE which represents the average cost of electricity generation over the life of the project Because fixed costs are so high to install floating OSW turbines and marginal costs are so low the LCOE for OSW is highly sensitive to the duration in which a wind turbine can be deployed Minimizing the LCOE from an OSW project involves maximizing the time a wind turbine is operating on the water providing electricity at low marginal cost to the grid
Economic values considered in this report focus on the regional economic impact of a given level of project spending on job creation and economic output in San Luis Obispo County Specifically the values calculated in this report provide a mapping from a given amount of direct investment in capital and labor in the county to the economic output and jobs that result from regional supply chain development and the affiliated increase in sales and output that spill across other regional industries from the spending of workers and business who derive income from the project (ie the economic ldquomultiplierrdquo)
The regional economic benefit to developing OSW farms in San Luis Obispo County represents only the value captured by the regional supply chain for a given amount of direct spending on OSW The proper interpretation of the results is the projected economic value realized by San Luis Obispo County from a given level of project spending (private cost) rather than the overall economic benefit that results from minimizing the social costs of electricity generation
To understand this distinction consider the effect of increasing the distance between OSW farms off the coast of Central California and the specialized wind port that serves them As the distance increases between the OSW farms and the specialized wind port the LCOE rises due to increased transportation and logistical costs of wind turbine installation and repair reducing time on the water for wind turbines to operate and resulting in higher electricity prices The overall economic value of the OSW project decreases over distance from the specialized wind port compounded by an increase in the external costs of carbon emissions in the transportation sector However because private costs are higher for OSW projects that involve greater distances to the specialized wind port locating OSW farms farther away from the port raises the economic value of the project to the regional economy for instance by adding jobs in the water transportation industry Put differently the economic value to the regional economy will appear larger as the distance increases between the OSW farms and the port whereas the overall economic value of the OSW project is larger when OSW
Economic Impact of Offshore Wind Farm Development on the Central Coast
17
farms are situated in closer proximity to the specialized wind ports
While developing projects with lower LCOE and lower external costs from pollution in the transportation sector provide the greatest overall economic value projects with higher LCOE provide greater stimulus to the regional economy Thus the proper interpretation of the regional economic values calculated in this report are the impacts to San Luis Obispo County from a fixed level of project spending
01 Wind speeds are generally strong
02 The region has existing connections to the statersquos electrical grid
03 Much of the coast is outside of national marine sanctuaries where disturbance to the seabed is prohibited
04 The region is favorably positioned between major population centers with high power demand in Northern and Southern California
THE CENTRAL CALIFORNIA REGION IS IDEAL FOR OFFSHORE WIND
DEVELOPMENT FOR SEVERAL REASONS
Economic Impact of Offshore Wind Farm Development on the Central Coast
18
SECTION 2
INDUSTRY BACKGROUND AND REQUIREMENTS
Economic Impact of Offshore Wind Farm Development on the Central Coast
19
2 INDUSTRY BACKGROUND AND REQUIREMENTS
Interest is growing for the development of OSW in California as large-scale adoption of renewable energy is needed to substitute for fossil fuel-generated electricity under the statersquos ambitious climate goals
Along the coastline of California the ocean floor slopes steeply downward into deep waters requiring the use of floating platforms for OSW as opposed to platforms fixed to the ocean floor like those currently used in shallower waters along the East Coast Recent advances in floating platform technologies have greatly reduced the cost of developing floating OSW farms making it possible to build OSW to scale in California Floating OSW farms have the potential to provide California with a reliable source of renewable energy that can deliver electricity to Californiarsquos homes and business during times of peak energy demand while operating largely at distances beyond the sightlines of coastal property (See Figure 21)
According to NREL Californiarsquos offshore technical resource capacity is about 112 GW17 BOEM has initiated plans to develop OSW power off the coast of California in a recent call for information from companies interested in purchasing commercial wind energy leases in federal waters off the coast of Central and Northern California Specifically the Call Areas for BOEM identify three potential OSW sites off the coast of California Humboldt Bay Morro Bay and Diablo Canyon The Central California Call Area offers a combined electricity generation capacity of 7 GW for OSW
Developing OSW energy on the Central Coast to its full potential will require cooperation from the US Department of Defense (DOD) Following the announcement of the BOEM Call Areas in 2018 DOD assessments found OSW development in the region to be incompatible with the wide array of critical DOD operations citing significant mission activities in the Diablo Canyon Call Area18
Figure 21 Schematic of a Floating Offshore Wind Farm
Source BOEM California Offshore Renewable Energy Fact Sheet February 22 2017
Economic Impact of Offshore Wind Farm Development on the Central Coast
20
Subsequently a group comprised of DOD BOEM NOAAs Office of National Marine Sanctuaries Congressman Carbajal and Congressman Panetta has focused on expanding the OSW planning area by considering potential development areas proximate to and within the Morro Bay Call Area that may be compatible with DOD operations While the Diablo Canyon Call Area may not be developed due to other ocean use and environmental conflicts there is sufficient sea space in and around the Morro Bay Call Area to support 7 GW of OSW
Figure 22 shows the Morro Bay and Diablo Canyon Call Areas initiated by BOEM and Figure 23 shows a proposed modification to the Morro Bay planning area that would accommodate 7 GW of OSW development in and around the Morro Bay Call Area19
Developing up to 7 GW of OSW farm capacity in and around the Morro Bay Call Area has the advantage of making use of available grid interconnections in San Luis Obispo County through the existing 500-kV transmission lines at Diablo Canyon and Morro Bay However realizing the renewable energy potential for floating OSW energy development in and around the Morro Bay Call Area represents a massive undertaking for Central California communities
Figure 22 The Morro Bay and Diablo Canyon Call Areas
Source BOEM California Activities httpswwwboemgovcalifornia
Economic Impact of Offshore Wind Farm Development on the Central Coast
21
The deployment of floating OSW platforms presents complex manufacturing logistical and maintenance challenges Making OSW a reality for California will require development of an extensive regional supply chain much of which has the potential to be centered in San Luis Obispo County To ensure that critical elements of this supply chain take root in California providing jobs and income for Central Coast residents (as opposed to outsourcing these needs to other regions) the development of OSW farms will require major upgrades to Central Californiarsquos infrastructure for ports transportation and transmission
Three elements are imperative for success in OSW development
bull the availability of a specialized wind port and port infrastructurebull ensuring enough transmission capacity and interconnection to the electric gridbull access to a reliable well-trained workforce for wind farm construction and OampM
The payoff to the San Luis Obispo County region for developing a regional supply chain for OSW power is the creation of a green energy sector that can provide head-of-household jobs health and retirement benefits and career opportunities for workers in the green economy including the potential to deliver jobs to workers from disadvantaged communities20
Figure 23 Proposed Expansion to the Morro Bay Call Area
Source American Wind Energy Association California and Offshore Wind California 2020
Economic Impact of Offshore Wind Farm Development on the Central Coast
22
01 The availability of a regional port and port infrastructure
02 Ensuring enough transmission capacity and interconnection to the electric grid
03 Access to a reliable well-trained workforce for wind farm construction and OampM
THREE ELEMENTS ARE IMPERATIVE FOR SUCCESS IN OSW
DEVELOPMENT
The payoff to the San Luis Obispo County region for developing a regional supply chain for OSW power is the creation of a green energy sector that can provide head-of-household jobs health and retirement benefits and career opportunities for workers in the green economy including the potential to deliver jobs to workers from disadvantaged communities
Economic Impact of Offshore Wind Farm Development on the Central Coast
23
21 TECHNOLOGY DESCRIPTION
California differs from the Northeast US in that its deep coastal waters require a different type of offshore wind technology floating platforms for wind turbines Floating platform technology for OSW has been successfully demonstrated in multiple jurisdictions worldwide with larger-scale commercial projects being planned and contracted for deployment in the near future While the cost of floating offshore wind today remains higher than the fixed-bottom offshore wind that prevails on the East Coast the technology is now well understood and the cost of OSW power is expected to decline rapidly with the scale of deployment as commercialization continues
Each floating offshore wind system consists of a commercially available floating support structure and a large offshore wind turbine generator The proposed plant located approximately 45 km offshore is expected to have between 70 and 100 floating windmills
Floating OSW technology requires no piling making it well-suited for deep and variable seabed conditions Each floating windmill is attached by anchor to the sea floor as seen in Figure 24
Floating OSW technology has other benefits over fixed OSW foundations as well Floating wind turbines can be larger anchored in deeper water towed back to shore for major repairs and upgrades and safer for ground risk shore-side assembly and deployment further offshore compared to fixed OSW foundations22
There are four basic components of an OSW turbine the tower nacelle hub and blades These components (OSW turbines to towers and floating platforms) are all delivered by marine vessels for final assembly in bays within the specialized wind port Before any components are attached to
Figure 24 Floating OSW
Source Lou Thomas and Wu (2019)21
Economic Impact of Offshore Wind Farm Development on the Central Coast
24
the floating platform at the specialized wind port the hub is connected to the nacelle and attached to the tower which is typically composed of three or four different segments The bottom segment of the tower is attached to the floating platform the remaining tower segments are stacked on top of the structure and then the assembled nacelle-hub is attached to the top of the tower by a crane where the turbine blades are attached to complete the assembly of the OSW turbine23 Once the turbine is attached to the floating platform as a finished OSW turbine the floating platform is connected to a ship and transported to the offshore windfarm location (see Figure 25) where it is installed to anchors and moorings on the offshore site24
Each OSW farm which is projected to have a nameplate capacity of 1 GW is composed of arrays of individual OSW turbines The capacity of an individual OSW turbine to generate power is currently in the range of 3 MW to 15 MW For the baseline 1 GW OSW farm considered in this report a 1 GW OSW farm consists of 100 individual wind turbines each with a 10 MW nameplate capacity
22 OSW POWER HAS A FAVORABLE TIME PROFILE ON THE ELECTRICITY GRID
OSW power on the Central Coast of California (CCC) provides electricity at favorable times Offshore wind power on the CCC peaks each day during evening hours and reaches its maximum potential during spring and summer months of the year This timing profile for power delivery matches favorably with wholesale energy prices on the California Independent System Operator (CAISO) electricity grid Electricity demand is highest during the summer and peaks at around 6 pm in summer months (Wang et al 2019)25 In contrast solar and onshore wind generation peak at times of relatively low electricity demand creating problems for reliability and functionality of the grid Solar power production peaks around noon whereas land-based wind peaks around midnight
Figure 25 Transportation of an Assembled OSW Turbine
Source Principle Power 2011
Economic Impact of Offshore Wind Farm Development on the Central Coast
25
The timing of peak offshore wind power production aligns well in a portfolio of energy sources that provide peak power at different times Developing a reliable electricity portfolio by combining renewable sources smooths out deliveries on the grid relaxing supply constraints in a system with limited storage capability26
Combining OSW with onshore wind and solar power results in a more reliable delivery profile for renewable energy that better matches with electricity demand Superior matching displaces reliance on carbon-intensive natural gas (ldquopeakerrdquo) plants during evening hours and as fossil-fuel based electricity sources are phased out over time in California reduces reliance on costly grid-scale lithium-ion battery storage
Figure 26 demonstrates the hourly value of OSW in a renewable energy portfolio The value of electricity generated at different times is represented by the RESOLVE price calculated by Energy and Environmental Economics (E3) The RESOLVE model estimates the optimal price of alternative energy solutions during each hour of the day taking into account hourly operations of alternative energy solutions during each hour of the day the intraday variability of load and renewable generation planning reserve requirements and an annual greenhouse gas constraint that the whole system must operate at a level of emissions below the maximum emission cap27
23 PORT INFRASTRUCTURE REQUIREMENTS
The large size of modern OSW turbines limits the transport of finished products over land As a result the final assembly of OSW towers which involves attaching turbine blades to floaters must
Figure 26 The Diurnal Pattern of Offshore Wind Power and Energy Prices
Source Energy and Environmental Economics Inc 2019
Economic Impact of Offshore Wind Farm Development on the Central Coast
26
occur at a waterfront location with a large amount of acreage a specialized wind port facility and quays that have been reinforced to withstand heavy loads
The development of a regional supply chain for OSW in this report assumes that suitable specialized wind port facilities will be available for manufacturing and assembly of OSW turbines Two alternatives appear potentially viable for OSW development on the Central Coast
bull construction of a specialized wind port in San Luis Obispobull assembly at other ports in California such as Oxnard (Port Of Hueneme) Long Beach San
Diego and Eureka where the Port of Humboldt Bay has been proposed to be refurbished as a specialized wind port for the assembly of OSW turbines28
Because the existing capacity for floater assembly is lacking on the West Coast the manufacturing of floating foundations for OSW turbines will likely occur outside of the US The role of the specialized wind port is to conduct final assembly of the wind turbine in a staging area situated as near as possible to the OSW farm to economize on transportation cost and logistical issues during installation repair and decommissioning of OSW farms Based on the experience of OSW farms in the UK the tower pieces are imported from Denmark or Spain with final assembly occurring on-site in reinforced quays For OSW farm development on the Central Coast the height of some components limits the location of a specialized wind port to those without height limitations from features such as bridges which precludes use of the Port of Oakland due to clearance limits on the Bay Bridge and Golden Gate Bridge
As the distance increases between the OSW farm and the specialized wind port where final assembly occurs the levelized cost of energy (LCOE) rises due to the additional transport cost Greater distances between OSW farms and the specialized wind port makes projects less practical for industry partners seeking to provide zero-carbon electricity to consumers at minimal cost The LCOE rises over distance from the port not only due to transportation costs and the related logistical issues associated with scheduling shipping lanes but also due to the high opportunity cost of removing OSW turbines from the water for repair Repair of OSW turbines with existing technology requires removing floating OSW structures from offshore mooring and towing the structures into the specialized wind port which requires scheduling shipping lanes and arranging transport during periods of relatively calm seas
Given the high fixed cost and low variable cost of generating electricity from OSW the economics of OSW favor keeping OSW turbines on the water and connected to the grid for as long a period as possible to recover the sunk cost of installing them Distance from the port reduces the number of days OSW turbines are on the water which erodes the economic benefit to California from developing OSW farms
The Massachusetts Clean Energy Center (MassCEC) conducted a detailed assessment of port construction requirements for OSW in 2017 including the potential for both turbine and foundation manufacturing A major finding of the study was that the sheer distance required to transport OSW components from overseas is likely to incentivize investment in US manufacturing facilities29 At the present time it is anticipated that both floating platforms and turbines for OSW will be shipped
Economic Impact of Offshore Wind Farm Development on the Central Coast
27
to California from overseas likely from South Korea or China then received at a specialized wind port for final assembly and installation on an OSW farm
The specialized wind port where assembly occurs must have protected waters and no overhead obstruction for fully assembled turbines to be towed out standing to the offshore site (see Figure 27) The sheer scale of OSW turbines imposes land requirements for manufacturing to take place in the specialized wind port Providing throughput of 500 MW per year of OSW at the port with the 10-15 MW turbines available today will require about 50 acres of land for movement storage and assembly
In 2016 BOEM commissioned a study on the suitability of various California ports for OSW assembly The study identified Port Of Hueneme as the most suitable existing port for OSW assembly followed by Long Beach and San Diego30 However as Collier (2017) reports all of the recommended ports suitable for OSW assembly are constrained by available land adjacent to the port that would be necessary for manufacturing31 In the case of Port Of Hueneme land constraints limit the ability of the port to take on new manufacturing without making use of land on the existing Navy yard and logistical problems arranging transportation through the Santa Barbara Channel hamper its ability to serve as a specialized wind port for multiple large-scale OSW farms off the Central Coast
Apart from making use of existing ports another possibility is to develop one or more specialized ports for assembly of OSW turbines in California Humboldt Bay in Eureka has a deep-water harbor
Figure 27 Turbine Assembly and Assembled Turbine in Port
Source Principle Power 2011
Economic Impact of Offshore Wind Farm Development on the Central Coast
28
and vast expanses of vacant industrial land that can be developed for OSW turbine (and even floater) assembly however the use of Humboldt Bay for OSW development faces major logistical challenges for land transport and the region lacks grid interconnection as a hub for OSW In contrast the Central California area offers reliable grid interconnection at Morro Bay Power Plant (MBPP) and Diablo Canyon Power Plant (DCPP) but lacks a deep-water port
While it may be possible to serve floating OSW farms in Central California from Port Of Hueneme or an expanded port facility in Humboldt Bay the economic practicality of installing and maintaining OSW farms from distant ports will require a reliability study Given the need to maintain OSW turbines on the water and keep them connected to the grid to recover the significant fixed costs of OSW development further study is needed to model the ability to service OSW farms from these more distant ports The economic viability of serving floating OSW farms from distant ports depends on the repair cycle for OSW turbines including the probability that failed systems can be scheduled for service quickly under port capacity logistic and weather constraints
DCPP decommissioning makes available a potentially suitable site to develop a specialized port facility for OSW The benefits of developing a specialized wind port for OSW on the DCPP property include
bull site availabilitybull potential for brownfield developmentbull a local revenue source from port fees and land improvementsbull reduced accident risk from the proposed DCPP decommissioning
A specialized wind port at DCPP would facilitate removal of DCPP decommissioning material by sea instead of by road A recent UCLA Transportation Risk Analysis finds that barging involves lower transportation risk (ie accidents injuries fatalities) than trucking and rail transport during the period of DCPP decommissioning Specifically combining barge transport for the initial leg of the route with trucking and rail for subsequent legs reduces fatality risks by over 40 percent and injury risk by 32 percent32
In terms of the present study the center for job creation and regional economic stimulus from OSW is at the ports A port facility provides a coordination point in the supply chain for manufacturing assembly transportation and offshore installation of OSW turbines as well as a maintenance yard for periodic repair and ultimately for disassembly and decommissioning During the 25-year operating period of the OSW farm the port provides facilities for turbine repair stimulating the regional supply chain for manufactured components and support for OampM staff Some turbine components can be transported by land which creates incentives for regional supply chain development for a wide range of industrial partsrsquo manufacturers in California and even nationwide However because the sheer size of offshore turbines is so large that they must be transported by water and because connecting the blades to tower sections and floating foundations requires final assembly to take place in reinforced quays the regional supply chains for OSW originate and terminate at the port
Economic Impact of Offshore Wind Farm Development on the Central Coast
29
24 TRANSMISSION INFRASTRUCTURE REQUIREMENTS
Compared with other renewable technologies OSW delivers power directly to coastal load centers where electricity is needed most Much of the existing transmission infrastructure in California was developed during the time of coastal power plants which now have been either decommissioned or slated for retirement The San Onofre Nuclear Generating Station was shut down in 2013 and is currently being decommissioned
In San Luis Obispo County the 650 MW Morro Bay Power Plant (MBPP) closed in 2014 leaving behind valuable transmission infrastructure The retirement of the Diablo Canyon Power Plant (DCPP) in 2025 which has a nameplate capacity of 2256 MW and generated 16163 GWh in 2019 for the California electricity grid33 will free up an additional 6 GW of transmission capacity Utilizing the combined 7 GW transmission capacity at DCPP and MBPP as interconnection points for OSW power reduces the cost of providing electricity on the grid
The existing PGampE transmission infrastructure that connects DCPP and MBPP to the wholesale electricity grid represents a highly valuable economic asset that can be repositioned to receive electricity generated from OSW in Central California The current DCPP transmission infrastructure is comprised of three 500-kilovolt (kV) high voltage direct current transmission lines that will become available for alternative use after closure of DCPP in 2025 The high cost of installing new electricity transmission lines creates an economic opportunity in San Luis Obispo County to repurpose the existing infrastructure for electricity transmission from OSW
For comparison development of a Northern California Call Area specialized wind port in Humboldt Bay will require new electricity transmission infrastructure to connect OSW power generation to the Bay Area with 500 kV transmission lines The estimated cost of installing transmission infrastructure to convey electricity to the grid for the more limited 1836 GW OSW development planned in the region is in the range of $17 billion to $3 billion depending on overland or subsea transmission options34 These costs are roughly in line with the projected cost of other electricity transmission projects in the US For example the projected construction cost for a single 500 kV direct current transmission line to deliver up to 3 GW of energy from Wyoming to the Eldorado Valley in Nevada was $35 billion in April 2013 an average cost of $42 million per mile over the length of the proposed 835-mile transmission line35 The existing transmission structure connecting DCPP to the electricity grid already has three 500 kV direct current transmission lines in place
The existing PGampE transmission infrastructure that connects DCPP and MBPP to the wholesale electricity grid represents a highly valuable economic asset
Economic Impact of Offshore Wind Farm Development on the Central Coast
30
25 REGIONAL SUPPLY CHAIN DEVELOPMENT
The ability of San Luis Obispo County to support the development of an OSW supply chain will greatly affect the regional economic impact of OSW development Simply put the economic impacts of OSW are larger for the region when the OSW industry derives a greater share of employment from the region as local workers who receive paychecks from OSW projects in turn spend their dollars at local businesses in the community
The establishment of a California-based OSW supply chain is an important factor in maximizing economic values derived in the State and San Luis Obispo County regions Underpinning the need for regional supply chain development are the logistics for OSW development which involves the delivery of the extremely large component parts required for turbine assembly into specialized wind ports Due to the significant costs of long-distance ocean transit the central hub for supply chain development will occur around the specialized wind port where OSW turbines are assembled36
In California the initial development of OSW projects is likely to depend on floating foundations imported from abroad with development of a regional supply chain needed for turbine assembly and for smaller machine components that can be manufactured domestically For example the foundations for California projects are likely to be manufactured in China South Korea or Japan due to past investment in developing offshore wind manufacturing capacity with a regional supply chain needed only for the final assembly of turbines that will take place in regional California ports According to a recent UC Berkeley study about 60 percent of all equipment in US wind farms is currently manufactured domestically with equipment suppliers such as GE Siemens and Vestas having manufacturing facilities in South Carolina Iowa and Kansas and Colorado respectively while generators are sourced from Europe or Asia37
In East Asia and Europe governments and wind turbine manufacturers have worked aggressively in recent years to develop complete supply chains for OSW including factories and other facilities for manufacturing turbines blades towers and floating foundations in high-tech clusters developed in specialized wind ports Several states on the East Coast including Connecticut Massachusetts Rhode Island Maryland and South Carolina have taken steps in industrial planning to create manufacturing hubs for OSW although the West Coast has lagged behind in light of the only recent advances in floating OSW technology over fixed platform technologies that can be used in the relatively shallow waters along the East Coast
Deploying commercial-scale floating wind farms will require collaboration between a wide range of occupations including skilled workers (pile drivers divers millwrights plumbers pipefitters welders cutters solderers brazers carpenters crane operators electrical technicians health and safety specialists) engineers (electrical environmental mechanical marine research subsea structure design) various dock and marine laborers vessel crews plant managers sales representatives lawyers and administrative marketing and communications professionals
At least in the initial phases of OSW development in California OSW foundations and wind turbines are likely to be transported from manufacturing facilities in Pacific Rim countries to one or more specialized wind port facilities in California where wind turbines will be attached to floaters and assembled in quays then barged to offshore sites to be anchored and connected to the electrical
Economic Impact of Offshore Wind Farm Development on the Central Coast
31
grid Once the turbines are installed and running employment in the industry will then transition to an operations and maintenance (OampM) phase that will create additional jobs for regular inspection and repair OampM jobs will largely be composed of environmental specialists vessel crews and engineers augmented by skilled workers crane operators and installation workers at the port facility during times when repair and maintenance is needed
Over a longer horizon it is possible that OSW investment in specialized wind ports for assembly of commercial-scale floating wind farms leads to development of expertise in building floating foundations A regional manufacturing facility for assembling floating OSW foundations would greatly reduce transportation and logistical costs However the analysis in this report does not consider the economic value of foundation manufacturing in California because intermediate term options exist to economize on shipping costs by developing this manufacturing expertise elsewhere on the West Coast for instance the Port of Seattle
Several factors affect the level of regional supply chain development for assembling OSW turbines in San Luis Obispo County
bull the existing industrial basebull local content requirementsbull skills of the workforcebull the timing of development
The existing industrial base in the region is important for the ability to source electrical components and other aspects of turbine assembly from local suppliers in California In the case of OSW the project would build on the existing industrial base in the green energy sector of San Luis Obispo County and neighboring Monterey County creating synergies among small businesses construction and electrical workers involved in the construction and operation of the commercial solar farms in these counties providing an immediate source of labor and electrical components that can transition to servicing OSW farms Santa Barbara County has existing workers with experience operating on offshore oil and gas platforms which facilitates the transition of workers in the region to new employment opportunities in the offshore installation component of the OSW industry such as setting anchors and moorings and offshore turbine installation
Local content requirements and government incentives can also be used to stimulate development of a regional supply chain for OSW Under a local content requirement agreements can specify that a minimum share of local employment be maintained For fabricated components that can be locally sourced government investment and financial incentives can accelerate the pace of regional supply chain development While there are legal restrictions to imposing local procurement and hiring requirements in California under the Commerce Clause of the US Constitution there are nevertheless numerous policy tools available to increase local hiring For example Community Benefits Agreements (CBA) and Community Workforce Agreements (CWA) can be used by developers for infrastructure projects such as port construction and improvement The use of local business enterprise (LBE) and disadvantaged business enterprise (DBE) provisions can also result in increased local procurement and hiring38
Economic Impact of Offshore Wind Farm Development on the Central Coast
32
The relevant skills of the local workforce are also important for development of the regional supply chain for OSW San Luis Obispo County is relatively small in terms of population but offers proportioned access for its size to a skilled workforce of construction and electrical workers both due to the recent construction of commercial solar plants in the California Valley and active commercial and residential real estate sectors The region also has businesses engaged in fiberglass manufacturing and marine vessel operators that have the skills needed to find employment in the OSW industry in the event that it develops in the county
Finally the size and timing of supply chain development is important For a regional supply chain to develop manufacturers must specialize in providing products that meet the needs of the industry which in turn requires assurance that consistent demand will materialize for these products before permanent employees are hired and sunk costs are incurred to grow the industry In the case of OSW development investment decisions will be facilitated if regional manufacturers capable of providing labor components and technical expertise to OSW farms have a clear expectation for sequential development of 6-7 GW of OSW farms staged over multiple years relative to the case of a single 1 GW wind farm The timing of OSW projects is also important if multiple wind farms enter production in Central California as a steady flow of projects over time provides stronger incentives for regional supply chain development
26 TIMING OF PROPOSED WIND FARM DEVELOPMENT
Staging and coordinated development of OSW is essential For example a single port harbor facility will become overburdened with multiple projects under construction at the same time The maximum throughput for each quay in the port is one 10 MW wind turbine per week and the wind turbine must be moved before work can begin on the subsequent turbine Therefore developers will need to consider multiple facility strategies and secure their options well ahead of time
Figure 28 Wind Turbine Development Timeline
Economic Impact of Offshore Wind Farm Development on the Central Coast
33
Figure 28 shows the timeline for OSW farm development Following a projectrsquos commissioning and turbine assembly phases the operation and maintenance (OampM) period of OSW will also require ports for transportation of personnel and components (for offshore repairs and upgrades) and for receiving OSW turbines towed back to the port for repair
Given the seasonal logistics of installing OSW turbines throughput at the specialized wind port is expected to be approximately 500 MW per year during the assembly period The assembly period considered in this report uses a more conservative time frame of 3 years for each 1 GW OSW farm The Operations amp Maintenance (OampM) period for each 1 GW OSW farm is then 25 years followed by a decommissioning period of 3 years The spending pattern for a single 1 GW OSW farm is punctuated by two spikes in regional employment the first during the 3-year assembly phase of the OSW farm and a subsequent and larger spike during the 3-year decommissioning phase in which OSW turbines are taken back to the port and disassembled
For a specialized wind port to support a 3 GW field of wind farms the assembly period is prolonged from 3 years to 9 years by staging OSW turbine assembly in successive 3-year periods for each 1 GW OSW farms Accordingly for a specialized wind port to support a 7 GW field of OSW farms the assembly period is prolonged from 3 years to 21 years It is possible that this period would be shortened by bringing OSW turbines to the Central Coast from other nearby ports that develop the manufacturing capacity for OSW andor by floating fully assembled structures into place from ports in Asia
After OSW turbines are assembled and installed in the ocean the specialized wind port conducts maintenance and repair operations for up to 7 GW of OSW during the OampM period for the projects At a failure rate of once every 25 years for 10 MW wind turbines the specialized wind port would need to accommodate the repair of approximately 28 wind turbines per year to support a 7 GW field of OSW farms
27 EMPLOYMENT AND OUTPUT DEMOGRAPHICS IN SAN LUIS OBISPO COUNTY
As of 2019 San Luis Obispo County has a population of 283111 175 of whom are under the age of 18 209 over the age of 65 and 592 veterans39 From 2011 to 2016 the San Luis Obispo County population grew 3840
Educational attainment in San Luis Obispo County (70) is above the statewide average (62) and national average (59) Two out of 5 residents in the county have a bachelorrsquos degree or higher San Luis Obispo County is predominantly white (69) with the second largest ethnicity being Hispanic or Latino at 2241
The San Luis Obispo County labor market supports 178476 total jobs In 2019 employment in the county was 208 farm jobs 8469 private nonfarm jobs and 1323 public sector jobs including state and local government employment and the military42
The average earnings level per worker in the county is $56409 which is lower than both the state and national averages of $78217 and $66029 respectively43 Figure 29 compares the income
Economic Impact of Offshore Wind Farm Development on the Central Coast
34
distribution in San Luis Obispo County compared to California and the US San Luis Obispo County workers are more likely to have medium and medium-high paying jobs in the $35000 to $149000 range than workers in the rest of California and the US but are less likely to have jobs of $150000 or more
In the past 10 years the county has seen significant job growth Figure 210 illustrates the total number of jobs in the county versus the cumulative job growth rate from 2010
Overall about 30000 additional jobs were created in San Luis Obispo County representing a total 21 growth rate and a 191 annual growth rate over the period This figure is considerably larger than the US total over the period (18) although smaller than that of California (25)44 The strong job growth in San Luis Obispo County has led to comparatively low levels of unemployment with an unemployment rate of 67 in December 202045 relative to the state average of 946
The greatest portion of jobs in San Luis Obispo County are in the tourism hospitality and recreation education and knowledge creation and healthcare industries which together make up 41 or 50000 jobs Since 2010 the information and communication technologies industry experienced the greatest growth (51) followed by the building and design industry (41) and the defense aerospace and transportation manufacturing industries (37) These rapidly growing industries provide the mid- to high-wage job growth in the county with average wages ranging from $59069 to $8188047
Figure 29 Income Distribution in San Luis Obispo County Relative to State and National
Economic Impact of Offshore Wind Farm Development on the Central Coast
35
Gross domestic product (GDP) in San Luis Obispo County was $191 billion in 2019 with GDP per capita of $6734048 Figure 211 shows the GDP growth rate in San Luis Obispo County over the last decade Over the period of 2010 to 2019 San Luis Obispo County real GDP growth was 2745 exceeding the growth rate in national real GDP of 2239 but lagging behind the real GDP growth rate of 3615 for California over the period49
Figure 210 10 Year Job Growth in San Luis Obispo
Figure 211 GDP Growth Rate in San Luis Obispo County California and the US
Economic Impact of Offshore Wind Farm Development on the Central Coast
36
SECTION 3
METHODS AND SCOPE
Economic Impact of Offshore Wind Farm Development on the Central Coast
37
3 METHODS AND SCOPE
31 SCOPE OF THE STUDY
The regional economic benefits calculated in this report are predicated on the development of a specialized wind port in San Luis Obispo County to provide service for up to 7 GW in OSW capacity in and around the Morro Bay Call Area In the event that a specialized wind port for OSW assembly is not constructed in San Luis Obispo County the regional economic benefit would instead materialize in whichever county provides the specialized wind port
At the State of California level the value of OSW development combined across all counties will be similar to the value reported here for the state-level impact with one important caveat If the specialized wind port is located farther away from the OSW farms than a neighboring county such as Monterey or Santa Barbara mdash for instance if a specialized wind port is developed in Humboldt Bay as a single hub for OSW assembly in California mdash then additional project cost would be required for water transportation (eg labor and fuel) raising direct spending at the more distant specialized wind port relative to the case considered here for a port in San Luis Obispo County The resulting increase in direct project spending would result in greater job creation and larger regional economic benefits for the more distant county in the transportation industry however because the social cost of OSW increases with distance from the specialized wind port both in terms of private costs and external costs incurred during water transportation50 locating the specialized wind port farther from the OSW field results in lower economic benefits to California Therefore using values from regional economic models to make such a comparison would be misleading
This report considers two phases of offshore wind (OSW) development off the Central Coast
1 An initial planning period that involves construction of a specialized wind port in San Luis Obispo County
2 OSW farm development with staged assembly of up to 7 GW capacity of OSW
For both phases the regional economic value captured in San Luis Obispo County is conditional on construction of a specialized wind port in the county either on the DCPP property or elsewhere in the county
If for example a specialized wind port was located on the existing DCPP property the specialized wind port provides a conduit for job creation in San Luis Obispo County The indirect benefits that would occur in the regional economy from the influx of new jobs at the port would extend to other counties in California for instance through supply chain development to vendors contractors and component manufacturers in Santa Barbara County Ventura County Monterey County and Kern County The indirect purchases stimulated in different counties in California is accounted for in the model however because the regional supply chains for OSW projects likely will extend across state borders the development of OSW in Central California will provide additional economic value for neighboring states in a manner that falls outside the lens of the model
Workers employed at a specialized wind port in San Luis Obispo County will spend much of their
Economic Impact of Offshore Wind Farm Development on the Central Coast
38
disposable income making induced purchases such as food retail items and restaurant meals at establishments near their homes The regional economic model matches employment at the specialized wind port to the available workforce in San Luis Obispo County which implicitly assumes that available workers in San Luis Obispo County are employed at the specialized wind port before jobs are offered to workers outside the county Thus the regional economic value for San Luis Obispo County will attribute a greater share of induced spending by workers to establishments in San Luis Obispo County than if these workers commute to work from residences across county lines Given the proximity between DCPP and nearby population centers in Northern Santa Barbara County such as Santa Maria and Orcutt a share of the regional economic value attributed to San Luis Obispo County in this report will materialize in Santa Barbara County for workers commuting across county lines
The model used to calculate regional economic benefits in this report matches workers employed in San Luis Obispo County to the available workforce in San Luis Obispo County Specifically the model assigns jobs in San Luis Obispo to workers in San Luis Obispo if the labor force exists in the county to meet the job requirements and only reaches outside the county for workers when the industry providing the labor service no longer has available workers in the county to perform the task In practice workers from outside the county may outcompete workers in the county for jobs (eg by being willing to take the job for a lower wage or by having superior skills) in a manner that is not accounted for in the regional model To the extent that workers commuting across county lines compete intensively for these jobs the model will over-attribute induced spending of workers to San Luis Obispo County from household purchases that occur in the neighboring counties where commuting workers reside
311 SPECIALIZED WIND PORT
The scope of the analysis encompasses the value of the regional output and employment effect resulting from the development and use of a specialized port in San Luis Obispo County for the assembly maintenance and repair of OSW farms Because a specialized wind port is necessary to receive the regional economic value from OSW development and San Luis Obispo County does not currently have one it is necessary to model the construction of a specialized wind port jointly with the development of large-scale OSW projects in the region
The goal of the present study is to calculate the regional economic benefit to San Luis Obispo County from the development of 3 and 7 GW OSW capacity in and around the Morro Bay Call Area The model does not encompass the full economic value of constructing a specialized wind port in San Luis Obispo County which might be used for the movement of other goods apart from OSW components Therefore this report considers solely the development of a specialized wind port used only for staging the assembly installation and repair of OSW Any additional regional economic value that can be generated from a specialized wind port from importing and exporting goods unrelated to OSW is not included in the report The scope of economic benefits considered in this report is conservative because developing a specialized wind port for OSW involves construction costs for elements such as a breakwater that would in turn economize on the cost of
Economic Impact of Offshore Wind Farm Development on the Central Coast
39
expanding the footprint of a specialized wind port beyond the specialized needs required to create a hub for OSW
Construction of a specialized wind port on the DCPP property occurs in the model over the 5-year period of 2024-2028 Constructing a specialized wind port for OSW will require an estimated 1100 construction jobs per year at a total direct cost in the range of between $17 and $25 billion The analysis considers only the direct job requirement of port construction (1100 workers per year) to be sourced locally as it is currently unclear where the materials used to construct the port such as the breakwater and pilings will be sourced Considering only the direct job requirement for constructing a specialized port for OSW in San Luis Obispo County results in a conservative measure of the regional economic benefit as all construction material required to be purchased for port construction is implicitly assumed to be sourced from locations outside of California The total project cost which is substantially larger than the direct labor cost component of the project is included only to calculate the fiscal benefit of sales and use taxes in Section 5 which implies project spending on imported material is designated as a California sales transaction at the point of delivery to the port
312 DEVELOPMENT OF A REPRESENTATIVE 1 GW OSW FARM
The timeline of a representative 1 GW OSW farm has 4 phases planning amp permitting (7 years) assembly (3 years) operations and maintenance (25 years) and sunsetdecommissioning (3 years)
Figure 31 shows the average labor requirement for a 1 GW OSW farm during each phase of development in the case of a sunset period involving decommissioning of the OSW farm
Figure 31 Average Labor Requirement for a 1 GW OSW Farm over the Life of the Plant
Economic Impact of Offshore Wind Farm Development on the Central Coast
40
The planning phase for the first OSW farm occurs over the period 2022-2028 which coincides with the granting of a lease through a BOEM auction and the development of a specialized wind port in San Luis Obispo County both of which must also occur over this time period to realize the regional economic benefits of OSW
The assembly phase considers a 3-year assembly period for each 1 GW OSW farm starting with the first 1 GW wind farm over the period 2029-2031 While OSW turbine assembly in the specialized wind port can potentially occur at a faster pace for instance 500 MW per year (or 2 years per 1 GW OSW farm) a longer 3-year period is considered for each OSW farm to account for the logistics involved in arranging installation around weather events and conducting repairs for multiple OSW farms The assembly phase will tend to be shorter for the first 1 GW OSW farm than for subsequent wind farms because of the need to maintain space in the specialized wind port for turbine repair For development of a field of 7 GW OSW farms the assembly period involves staging the assembly of each 1 GW OSW in successive 3-year periods so that assembly occurs for a total of 21 years for a total of seven 1 GW OSW farms
The OampM phase for each 1 GW OSW farm consists of an operating life of 25 years (the OampM period) following turbine assembly and installation For the first 1 GW OSW farm the OampM period is 2032-2058 and the OampM period is set back by 3 years for each subsequent 1 GW OSW farm due to the staging of assembly in successive 3-year periods at the port
313 DECOMMISSIONING AND RECOMMISSIONING PROVISIONS FOR A 1 GW OSW FARM
The representative 1 GW OSW farm is decommissioned over a 3-year period coinciding with partial OSW farm operation and partial disassembly as OSW turbines are removed from the farm For the initial 1 GW OSW farm decommissioning occurs over the period 2057-2059 For each 1 GW OSW farm installed thereafter the assembly period is pushed back 3 years by staged operations at the port pushing back the sunset period by 3 years for each subsequent 1 GW OSW farm During the sunsetting period each 1 GW OSW farm comes back to port to be disassembled Current requirements for decommissioning involve a 3-year decommissioning period however given the strong economic incentive to maximize the length of time on the water for individual OSW turbines it is likely by 2059 that the period will be shorter for decommissioning (as well as for redeployment in the case of lease renewal)
Decommissioning occurs for each OSW farm after 25 years of operation and is accomplished two ways in the model
bull decommissioning as required by BOEM lease agreementsbull or recommissioning which involves renewing or replacing the lease agreement to maintain 1
GW OSW on the leased area for a subsequent 25-years of operation
The economic return for maintaining wind turbines on the water once the capital expenditure is sunk suggests that streamlined processes will be developed for decommissioning and replacing OSW farms by the end of the initial BOEM lease period
Economic Impact of Offshore Wind Farm Development on the Central Coast
41
In the case of decommissioning the value of a 7 GW field of OSW farms is reduced by removing OSW turbines from the water at the end of each lease agreement Under recommissioning the benefit of a field of 7 GW OSW farms can be measured in perpetuity (ie as a renewable resource) by considering the annual benefit under an integrative lease process designed to keep wind turbines generating electricity and connected to the grid In the case of recommissioning each 1 GW OSW farm is replaced in a single 3-year period rather than modeling separate decommissioning and assembly periods where one 1 GW OSW farm is decommissioned for 3 years before the next 1 GW OSW farm can be assembled
The design life of the wind turbine generator and the floating substructure that supports it coincides with an expected operating life of 25 years for OSW After the 25-year life of an OSW farm either the farm would need to be replaced or the turbines would need to be refurbished to extend the life of the units for another 25 years Under the recommissioning option each 1 GW OSW farm in the field of 7 GW OSW remains in service for electricity production either by remaining in operation or by being replaced by another in an integrative fashion that handles the logistical challenges Under recommissioning the model economizes on what would otherwise be a 6-year transition period (3 years for decommissioning of the initial OSW farm plus 3 years assembly for installing the replacement 1 GW OSW farm) with a single 3-year period that integrates the decommissioning and assembly phases The decrease in time required to replace a 1 GW OSW farm with another at the end of each lease capitalizes on the economic benefit of maintaining wind turbines generating electricity for the grid during the transition given the availability of existing anchors and moorings and other fixed investments at the offshore site that reduce the deployment time for a subsequent OSW farm
The labor requirement for an integrated recommissioning process is taken to be two times the onshore labor required during the initial assembly period (once for disassembly and again for reassembly) plus the labor required to reinstall each windmill to the existing cables and moorings at the offshore site The use of two times the onshore labor component is consistent with recent experience at the WindFloat prototype in Aguccediladoura Portugal in which wind turbines were brought back to shore and removed from the foundations for repair and then the entire structures were reassembled cleaned repainted and installed back into service at the offshore site The recommissioning scenario results in conservative regional economic value relative to the case of a decommissioning period for each 1 GW OSW farm followed by approval and installation of an entirely new 1 GW OSW project through an uncoordinated process as an orchestrated process economizes on direct project spending by combining the two phases into a single 3-year period
The economic value from the recommissioning scenario is conservative because it assumes replacement at the end of the 25-year operating horizon with an identical 1 GW OSW farm To the extent that turbine technology is superior 30 years from now the economic value of a replacement 1 GW OSW farm will be larger than the value considered here in the recommissioning scenario however much of this benefit will be captured by an improved capacity factor of turbines that deliver electricity at a lower LCOE That is the benefit of supplying electricity at lower cost is received in the electricity market and not something that would necessarily affect the regional
Economic Impact of Offshore Wind Farm Development on the Central Coast
42
supply chain and labor market that are the focus of this report The labor market requirement to install a replacement 1 GW OSW farm is taken to be the same as the labor requirement for the representative 1 GW OSW farm today in terms of the number of employees needed at each stage of the process in Figure 31 above The regional economic value is conservative by assuming that in 30 years there will still not be manufacturing capability for floating offshore platforms and turbines in California
It should also be noted that conveying the electricity produced at each 1 GW OSW farm will require grid connection costs to provide interconnection and transmission to Californiarsquos electricity grid The cost of constructing transmission lines for a field of 7 GW OSW farms will be lower to the extent that the suggested project makes use of the existing 500 kV transmission cables that currently connect DCPP to the electricity grid This makes the Central California region highly attractive for OSW energy development Nevertheless substantial additional expenses will be needed to develop offshore spur lines to connect OSW farms to landfall via undersea cables that extend many miles out to sea which will also require a supporting structure of sub-stations and terminals to connect cables at landfall with the existing onshore interconnection and transmission structure that exists at DCPP
32 METHODS
The regional economic impacts calculated from OSW farm development in Central California reflect the ldquoripple effectrdquo of new jobs and economic output that occurs when direct investments in the offshore wind industry complex lead to expansion in the production of upstream supply-chain inputs plus induced spending as new employee households increase local spending (eg grocery stores auto dealerships and restaurants) It should be noted that economic impacts are different from economic viability or profitability Economic impacts reflect expenditures and the extent to which inputs are locally sourced Higher costs (that would reduce economic viability and profit) in fact lead to larger economic impacts
Over time economic impacts can change As installed wind farm capacity in California increases one might expect not only cost-reducing learning effects but also an increase in the local share of input sourcing due to in-state investment in manufacturing specialized OSW inputs To the extent that this type of specialized investment occurs for instance if the ability to manufacture floating foundations for OSW develops somewhere in California then the regional economic impact of OSW farm development on the Central Coast would be greater for the State of California than is captured here
Regional economic impacts are increased by greater project expenditures as well as by a larger share of inputs that are locally sourced in the region Thus regional economic values differ from the overall economic value of a project because greater project expenditures raise total costs of electricity generation harming economic value while providing for greater regional stimulus The regional economic value of OSW farms is usually limited to direct wind farm capital and operations and maintenance (OampM) costs which are recovered through revenues derived from power purchase agreements Port and transmission infrastructure improvements typically are
Economic Impact of Offshore Wind Farm Development on the Central Coast
43
not included in regional economic values for OSW which is why the regional economic benefit is calculated separately for the construction of a specialized wind port in San Luis Obispo County Port infrastructure investments would likely be made by a terminal operator with costs of port construction recovered through various fees paid by users of terminal facilities to the terminal operator Similarly transmission infrastructure costs would likely be incurred by PGampE or another electricity provider with costs recovered by way of transmission access charges (TACs) paid by regional energy consumers
Regional economic models are based on a set of input-output (I-O) production relationships in the county (and neighboring counties) where the investment occurs Final goods such as wind energy are the outputs of the model which requires a variety of input purchases to be made in a variety of upstream markets (supply-chain effects) to construct and operate the OSW farm Upstream market purchases include labor from different industries and the purchase of intermediate goods (eg manufactured parts such as turbine blades manufactured electrical components and raw materials such as concrete and steel) Some of these inputs can be locally sourced while other inputs must be imported from outside the region as is presently the case for both turbines and floating foundations I-O models use economic data on current workers and component manufacturers in affiliated industries at the county level to create a simplified quantitative depiction of the ability to locally source inputs to meet the output requirements of a project thereby capturing regional economic value
This study utilizes the Regional Economic Models Inc (ldquoREMIrdquo) Policy Insight Plus (ldquoPI+rdquo) model to estimate the current and future economic impact of OSW development on San Luis Obispo County and neighboring counties REMI PI+ is a sophisticated economic modeling tool used by public agencies consulting firms nonprofit organizations and local governments to simulate the economic impact of a variety of public and private capital investments including infrastructure development energy projects and military bases
The REMI PI+ model calculates the regional economic impact of OSW development in San Luis Obispo County using data on the local labor requirement to install operate and decommission a field of 1 GW OSW farms at the specialized wind port The REMI PI+ model is a dynamic I-O model that uses this data to determine the current impact of OSW farm development as well as its forward-looking impact given historical changes in the business cycle and the ability of future workers and industry to migrate to the region The results of the model are reported for each county individually
The model provides output that quantifies the economic impact of a certain area of study and for the sake of this report allows results to be segmented on a county-wide basis into the number of jobs created benefit to county GDP and the general tax implications In construction of the model REMI PI+ uses audited data from public agencies such as the US Bureau of Economic Analysis and the US Census Bureau as well as user inputted data to construct its larger model
The resulting estimated impacts from the REMI PI+ model are segmented into direct indirect and induced impacts Direct impacts are directly related to the operations and growth of the base for example a contractor who is hired to help build infrastructure for port expansion Indirect impacts
Economic Impact of Offshore Wind Farm Development on the Central Coast
44
are values related to economic growth in upstream industries catalyzed by spending at the port on OSW for example a regional asphalt provider hired to provide road access to the specialized wind port While the asphalt providerrsquos job is directly attributable to the needs of the port it has no direct impact on port operations and therefore represents an indirect impact
Induced impacts are ripple effects that occur at all points in the supply chain catalyzed by both direct and indirect impacts For example an induced impact from the road expansion project would be an asphalt quarry that hires additional employees to help service the increased demand for asphalt from the road expansion project to serve the port While those jobs are created by the increased asphalt demand due to the infrastructure project to connect an existing road to the port the new employees hired at the asphalt quarry are working neither directly at the port facility nor indirectly on the paving project making the creation of this job an induced impact The majority of induced impacts in the model arise from food retail and housing purchases by workers employed directly and indirectly by OSW
Most input-output models are static meaning that inflation employment and expenditures for example remain constant over time However this report uses the dynamic impact model built into REMI PI+ to project the estimated economic impact of OSW development over time As this is a dynamic impact model projections will be made based off the assumption of business cycle fluctuations reflecting historical trends Estimates will be reported both for San Luis Obispo County as well as for the State of California
Finally it should be noted that the regional economic benefits calculated here are gross impacts of the OSW project rather than net impacts and as such may overstate actual benefits as an all-or-nothing comparison That is economic impacts to the region not immediately deriving from the construction and operation of an offshore wind facility are omitted in the report even though the use of regional resources to provide inputs for the OSW project claims these resources from other alternative projects the region could pursue For example expenditure on a wind farm in California may displace expenditures on expansion of a commercial solar power plant A net economic impact assessment of the value of OSW in relation to other potential investments in San Luis Obispo County would need to consider the foregone value of displaced economic activity
The economic values calculated using the REMI PI+ model are presented both in terms of (undiscounted) lifetime job and output impacts and in terms of annual average impacts over various phases of project development Undiscounted lifetime job impacts are calculated by multiplying the operational period of the project by the estimated number of annual operational period jobs and then adding them together into a measure of the total full-time equivalent (FTE) jobs created by the project For example a project that provides 100 full-time jobs each year for a 10-year period provides a total economic benefit to the region of 1000 FTE jobs and an annual average impact of 100 full-time jobs per year
Economic Impact of Offshore Wind Farm Development on the Central Coast
45
SECTION 4
RESULTS
Economic Impact of Offshore Wind Farm Development on the Central Coast
46
4 RESULTS
The regional economic benefit to San Luis Obispo County from OSW development is predicated on the ability to serve floating OSW turbines in and around the Morro Bay Call Area from a specialized wind port The specialized wind port serves as a hub for the assembly maintenance repair and eventually the decommissioning of floating OSW turbines
The economic benefits are calculated in this report for an initial period of port construction Port construction involves direct employment of an average of 1100 workers per year for 5 years at a total cost of between $17 billion and $25 billion Much of the material used to construct the port is projected to be sourced from regions outside the county and delivered to the port by marine vessel For the calculation of regional economic benefits the conservative assumption is made that none of the material is sourced from California which implies the regional economic stimulus is driven only by the direct employment of 1100 construction workers in San Luis Obispo County
Construction of the port occurs over the period coinciding with the 7-year planning phase for the first 1 GW OSW farm 2022-2028 Direct employment for port construction is projected to build over the first few years and reach a peak employment at around the midpoint of the port construction phase however a fully developed time schedule for employment is not available at this time
The measures of economic effects considered in this report are
bull Output ndash business sales less the costs of materials and equipment produced outside of California
bull Employment ndash the full-time equivalent jobs provided to California residents
41 PORT CONSTRUCTION IMPACTS
Table 41 shows the regional economic value realized for San Luis Obispo County and the State of California over the 5-year period of port construction Direct construction spending for a specialized wind port results in local stimulus in San Luis Obispo County of $202 billion ($405 million per year for 5 years) and the creation of approximately 11825 full-time equivalent (FTE) jobs (2365 per year for 5 years) Construction of a specialized wind port in San Luis Obispo County also stimulates the economy of neighboring counties providing 234 jobs and $39 million in economic output for Santa Barbara County and 28 jobs and $58 million in economic output
for Monterey County over the 5-year construction period The overall impact in California considering spill-over impacts to other regions in the state is $300 billion ($599 million per year for 5 years) and the creation of 15925 FTE jobs (3185 annually for 5 years)
Port construction spending would result in a stimulus of $202 billion and the creation of approximately 11825 jobs over 5 years
Economic Impact of Offshore Wind Farm Development on the Central Coast
47
It should be noted that the regional economic impact model assigns available workers in San Luis Obispo County to jobs in San Luis Obispo County before considering workers available to take these jobs in other counties Given the construction of a specialized wind port in San Luis Obispo County jobs are provided to workers in San Luis Obispo County that may ultimately be captured by workers in neighboring counties who are able to outcompete workers in the county This is particularly true for Northern Santa Barbara County given the proximity of the Santa Maria metropolitan area to Arroyo Grande in Southern San Luis Obispo County
For comparison a June 2019 analysis by the California Public Utilities Commission found that current decommissioning plans for DCPP will increase annual economic output in the San Luis Obispo County region by $724 million per year for 10 years and will result in the creation of approximately 4934 FTE jobs annually for ten years (Roland-Holst et al 2019)51
Development of a specialized wind port on the DCPP property may also serve to reduce transportation risks (ie accidents injuries fatalities) from DCPP decommissioning as the use of barge transportation making use of the existing breakwater is projected to lower fatality risks by more than 40 percent52 A more detailed study of specialized wind port construction to jointly meet the goals of DCPP decommissioning and OSW development including potential labor substitution from decommissioning to port construction on the DCPP property is beyond the scope of this report
42 OFFSHORE WIND DEVELOPMENT IMPACTS
After the initial period of port construction assembly can begin in the specialized wind port for the first 1 GW OSW farm in 2029 The economic value of OSW continues from that time through the staged assembly of 1 GW OSW every 3 years Thus the full development of a field of 7 GW OSW from a specialized wind port in San Luis Obispo County will occur over the 21-year period from 2029-2049 While California currently does not have a specialized wind port for assembling OSW turbines it is possible that other specialized wind ports are developed in California during this time allowing OSW turbines to be assembled and dispatched to the Central California region from other nearby
Table 41 Output and Job Creation from Port Construction
RegionFull-Time
Equivalent JobsTotal Output (million $s)
San Luis Obispo County 11825 $202261
Santa Barbara County 234 $3896
Monterey County 28 $577
Rest of California 3837 $92956
California Total 15925 $299689
Economic Impact of Offshore Wind Farm Development on the Central Coast
48
ports This would accelerate the pace of development for installing up to 7 GW OSW in Central California and result in a final completion date prior to 2049
After the initial installation of a field of 7 GW OSW in and around the Morro Bay Call Area proximity between the OSW sites and the specialized wind port in San Luis Obispo will make the specialized wind port the primary area for repair and recommissioning of wind turbines Given the high fixed costs and low variable cost of operating OSW turbines the economics of maintaining 7 GW OSW in the region favor repair from the nearest port with available space to maximize the time turbines spend on the water and connected to the grid
The regional economic value of OSW is constructed by considering the baseline value of a representative 1 GW OSW farm and then modeling the staged development of seven identical 1 GW OSW farms over time The economic value of a representative 1 GW OSW farm is calculated for two cases decommissioning and recommissioning Given that all 7 GW OSW would ultimately be removed from the water following decommissioning the focus of the report is on the long-run economic value to the region from the perpetual renewal of OSW farms over time through recommissioning Recommissioning economizes on redeployment time for the replacement of a 1 GW OSW farm at the end of the lease (from a 6-year period for decommissioning and assembly to a 3-year recommissioning period that bundles these phases together) however bundling decommissioning together with redeployment increases the labor requirement for the 3-year period beyond that required for only decommissioning
421 OSW 1 GW BASELINE WITH DECOMMISSIONING
Table 42 shows the regional economic value realized for San Luis Obispo County neighboring counties and the State of California over the planning assembly and operating horizon of a 1 GW OSW farm through the decommissioning phase The regional economic stimulus provided by the 1 GW OSW farm over its lifetime results in output of $25 billion for San Luis Obispo County and the creation of 6612 full-time equivalent (FTE) jobs over the period 2022-2059 The overall impact in California considering spill-over impacts to other regions in the state is $37 billion and the creation of 11368 FTE jobs during this period
Table 42 Output and Job Creation from a 1 GW Wind Farm with Decommissioning
Region Full-Time Equivalent JobsTotal Output (million $s)
San Luis Obispo County 6612 $245256
Santa Barbara County 364 $7766
Monterey County 58 $1189
Rest of California 4333 $116470
California Total 11368 $370681
Economic Impact of Offshore Wind Farm Development on the Central Coast
49
The majority of the regional economic benefit is derived in San Luis Obispo County because all direct jobs are sourced at the port Santa Barbara County receives economic stimulus of $78 million and 364 FTE jobs over the period due to the alignment of jobs and workers in the model at the location of the specialized wind port In the event that a specialized wind port for OSW assembly and repair is sited in Santa Barbara County rather than San Luis Obispo County the distribution of economic benefits between the two counties essentially would be reversed with Santa Barbara County then becoming the source of output and job creation in the model While some of this outcome is driven by the nature of the model which assigns jobs to workers in the county where direct spending occurs whenever qualified workers in the county are available to provide it the stark difference in regional economic benefits across counties illustrates the fact that direct spending at the specialized wind port is the origin of job creation The regional supply chain to support a 1 GW OSW farm begins and ends at the port
The regional economic benefit realized over this time period is largely concentrated during the assembly and decommissioning phases of the project as shown in Figures 41 and 42 After a small amount of employment and output benefits generated during the planning phase regional employment and output spike during the 3-year assembly period 2029-2031 During the OampM period for the 1 GW OSW farm regional job creation and output falls from the level achieved during assembly and stabilizes Annual jobs and output creation have a positive gradient during this period due to the dynamic adjustment in the REMI PI+ model which builds the regional employment base through population growth in San Luis Obispo County as the 1 GW OSW farm causes labor migration into the county increasing the size of the labor force by providing a reliable source of head-of-household jobs After the 25-year OampM period of the OSW farm regional employment and output spike a second time during the 3-year decommissioning period from 2057-2059
Figure 41 Distribution of Employment Impacts over the Horizon of a 1 GW OSW Farm
Economic Impact of Offshore Wind Farm Development on the Central Coast
50
Figures 43 and 44 show the top sectors stimulated by direct employment at the specialized wind port facility for OSW in San Luis Obispo County for indirect and induced employment respectively In terms of indirect employment the largest industry stimulated by direct spending at the port is administrative and support services (60) followed by regional supply chain development in the professional scientific and technical services industry (14) The increased demand for manufactured components at the specialized port facility for OSW in San Luis Obispo County stimulates regional supply chains for professional scientific and technical support presenting an opportunity for collaboration with Cal Poly and stimulating regional job creation for Cal Poly graduates in engineering fields in local consulting firms and support industries The influx of jobs in professional scientific and technical support fields and other related aspects of the regional supply chain can be further facilitated through independent investment in the Cal Poly Technology Park and furthering industry partnerships in affiliated technical fields that support OSW
Figure 42 Distribution of Output over the Horizon of a 1 GW OSW Farm
The influx of jobs in professional scientific and technical support fields and other related aspects of the regional supply chain can be further facilitated through independent investment in the Cal Poly Technology Park and furthering industry partnerships in affiliated technical fields that support OSW
Economic Impact of Offshore Wind Farm Development on the Central Coast
51
Table 43 shows the distribution of jobs average annual wages total employee compensation and total output for a 1 GW OSW farm in terms of direct indirect and induced impacts Average annual wages and total employee compensation includes wages and fringe benefits paid for by employers
Figure 43 Top 10 Sectors for Indirect Employment from Offshore Wind
Figure 44 Top 10 Sectors for Induced Employment from Offshore Wind
Economic Impact of Offshore Wind Farm Development on the Central Coast
52
Table 44 breaks down output and job creation into annual averages over the various phases of the operating horizon of a 1 GW OSW farm including the final decommissioning phase that removes it from the ocean The regional economic stimulus provided by the 1 GW OSW farm over its lifetime results in the highest annual employment level during the assembly period which provides an average of 589 full-time jobs each year for workers in San Luis Obispo County and 941 full-time jobs each year in California The decommissioning period results in the greatest output creation averaging $218 million per year for San Luis Obispo County and $326 million per year for California during the 3-year decommissioning period
Table 43 Regional Economic Impact of a 1 GW Wind Farm in San Luis Obispo County
ImpactFull-Time
Equivalent Jobs
Average Job Compensation
($year)
Employee Compensation
(millions)Total Output
(millions)
Direct 3490 $88650 $30941 $162674
Indirect 2308 $66076 $15251 $57822
Induced 814 $74884 $6093 $24760
Total Economic Impact 6612 $79076 $52285 $245256
Table 44 Average Annual Output and Job Creation over Key Operating Phases
Economic Stimulus Planning Assembly OampM Decommission
Jobs
San Luis Obispo County 17 589 142 390
Santa Barbara County 1 29 8 24
Monterey County 0 5 1 4
Rest of California 4 318 99 289
Total 22 941 251 707
Output (millions)
San Luis Obispo County $261 $15269 $5288 $21803
Santa Barbara County $010 $502 $167 $670
Monterey County $001 $077 $026 $096
Rest of California $080 $6836 $2618 $9981
Total $352 $22685 $8101 $32550
Economic Impact of Offshore Wind Farm Development on the Central Coast
53
422 OSW 1 GW BASELINE WITH RECOMMISSIONING
In the recommissioning scenario the decommissioning phase for the 1 GW OSW farm is paired with redeployment of a replacement 1 GW OSW farm in the ocean in a new (or renewed) lease agreement Table 45 shows the regional economic value realized for San Luis Obispo County and the State of California over the construction and operating horizon of a 1 GW OSW farm that includes a 3-year recommissioning phase that maintains the 1 GW OSW farm on the water at the end of the period
The regional economic stimulus provided by the 1 GW OSW farm over a lifetime that includes recommissioning and replacement results in output of $268 billion for San Luis Obispo County and the creation of 6999 full-time equivalent (FTE) jobs over the period 2022-2059 The overall impact in California considering spill-over impacts to other regions in the state is $404 billion and the creation of 12059 FTE jobs during this period Comparing entries in Tables 42 and 45 recommissioning the 1 GW OSW farm generates an additional $225 million for San Luis Obispo County ($331 million for California) and the creation of an additional 387 FTE jobs for San Luis Obispo County (692 for California) over the period
Table 46 breaks down output and job creation into annual averages over the various phases of the operating horizon of a recommissioned 1 GW OSW farm that is placed back into service at the end of the horizon The regional economic stimulus provided by a recommissioned 1 GW OSW farm over its lifetime is identical in the first three phases (planning assembly and OampM) with the additional output and job creation concentrated in the final 3-year recommissioning phase Comparing entries in Tables 44 and 46 the added value of recommissioning over decommissioning over the 3-year decommissioning period for the project involves an additional 129 full-time jobs per year in San Luis Obispo County (230 full time jobs per year in California) resulting in additional economic output of $71 million per year in San Luis Obispo County and $110 million per year in California
Table 45 Output and Job Creation from a 1 GW Wind Farm with Recommissioning
Region
Full-Time Equivalent
JobsTotal Output
(millions)
San Luis Obispo County 6999 $267766
Santa Barbara County 387 $8420
Monterey County 62 $1280
Rest of California 4611 $126302
California Total 12059 $403768
Economic Impact of Offshore Wind Farm Development on the Central Coast
54
423 MULTIPLE OSW FARMS THE CASE OF 7 GW OSW DEVELOPMENT
In the case of 7 GW OSW development in Central California the initial spike in output and employment during the assembly phase is extended over a longer period due to the staging of
individual 1 GW OSW farms in successive 3-year periods at the specialized wind port Staged assembly of a field of 7 GW OSW also prolongs the economic benefit from recommissioning multiple OSW farms as the lease period is set back by 3 years for each successive OSW farm through overlapping leases to accommodate available space at the port for assembly The analysis of the 7 GW OSW development includes the
economic value created by constructing a specialized wind port in San Luis Obispo County because it is unlikely that industry partners will materialize to fully develop 7 GW of OSW in Central California without commitment in the region to provide reliable port access for repair and service in proximity to the OSW farms53
Table 46 Average Annual Output and Job Creation over Key Operating Phases
Economic Stimulus Planning Assembly OampM Decommission
Jobs
San Luis Obispo County 17 589 142 519
Santa Barbara County 1 29 8 32
Monterey County 0 5 1 5
Rest of California 4 318 99 382
Total 22 941 251 937
Output (millions)
San Luis Obispo County $261 $15269 $5288 $29306
Santa Barbara County $010 $502 $167 $888
Monterey County $001 $077 $026 $126
Rest of California $080 $6836 $2618 $13259
Total $352 $22685 $8101 $43579
Staged assembly of a field of 7 GW OSW prolongs the economic benefit from recommissioning multiple OSW farms
Economic Impact of Offshore Wind Farm Development on the Central Coast
55
The time horizon for the REMI model extends through 2060 which is not enough to capture the full cycle of development for a 7 GW OSW field given the staged decommissioning horizon that extends through 2077 For this reason the analysis of a 7 GW OSW field is decomposed into two parts First the model is run for staged assembly and deployment of a field of 7 GW OSW farms without decommissioning or recommissioning at the end of the horizon (which would otherwise capture the decommissioning period for only the initial 1 GW OSW farm through 2059) Then the value of a 7 GW OSW field is captured in perpetuity by incorporating the additional value of recommissioning for a representative 1 GW OSW at the end of the lifecycle of each 1 GW OSW farm
This process allows the annual economic value to be calculated in a long-run steady state comprised of a 28-year combined OampM (25 years) and recommissioning (3 years) phase for each OSW farm The long-run steady state value captures the annual value of operating and recommissioning a 7 GW field of OSW farms in a perpetual replacement cycle that begins on the date the final OSW turbine is installed in the 7 GW field
Figures 45 and 46 show the regional economic benefit realized over the time period 2022-2060 without the additional value generated by decommissioning (recommissioning) of each 1 GW OSW farm After an initial spike in regional economic benefits during the period of port construction the economic benefits during the assembly period are prolonged by the staged assembly of 7 GW OSW The annual economic benefit rises steeply during this period both for jobs and output because this period includes OampM for previously assembled 1 GW OSW farms as staging occurs between the assembly phases of each 1 GW OSW farm The regional economic benefit subsequently drops off in 2058 due to removal of the decommissioning (recommissioning) period from the REMI PI+ model runs
Figure 45 Distribution of Employment Impacts over the Horizon of a 7 GW OSW Field
Economic Impact of Offshore Wind Farm Development on the Central Coast
56
The trend toward rising annual output and employment levels during the OampM period in which all 7 OSW farms are in operation reflects the dynamic adjustment elements in the REMI PI+ model which builds up the locally sourced labor pool over time as workers gain experience in the OSW industry For this reason the regional economic value is greater for San Luis Obispo County and for California for the second 1 GW OSW farm than for the first and so on compounding the annual economic benefits realized in the region as a greater level of OSW development occurs over time
Table 47 shows the regional economic value realized for San Luis Obispo County and the State of California over the planning assembly and operating horizon of a 7 GW field of OSW farms absent recommissioning These values include the construction of a specialized wind port during the planning phase prior to assembly of the OSW farms The regional economic stimulus provided by the 7 GW field of OSW farms without decommissioning or replacement results in output of $150 billion for San Luis Obispo County and the creation of 44960 full-time equivalent (FTE) jobs over the period 2022-2060 The overall impact in California is $225 billion and the creation of 72162 FTE jobs during this period
Figure 46 Distribution of Output Impacts over the Horizon of a 7 GW OSW Field
The regional economic value is greater for SLO County and for California for the second 1 GW OSW farm than for the first and so on compounding the annual economic benefits realized in the region as a greater level of OSW development occurs over time
Economic Impact of Offshore Wind Farm Development on the Central Coast
57
The entries in Table 47 encompass the economic value of port construction provided in Table 41 Netting out the port construction impacts in Table 41 the development of a 7 GW field of OSW in the specialized wind port provided an additional 33135 (56238) jobs and additional output of $13 billion ($195 billion) in San Luis Obispo County
Table 48 breaks down output and job creation into annual averages over the various phases of the operating horizon absent recommissioning The port construction period overlaps with planning for the first 1 GW OSW farm and the assembly period is staged over 21 years and involves the transition of assembled OSW farms to OampM toward the end of the assembly period
Table 48 Average Annual Output and Job Creation over Key Operating Phases
Economic Stimulus Port Construction Assembly OampM
Jobs
San Luis Obispo County 2365 1080 1075
Santa Barbara County 47 46 62
Monterey County 6 7 10
Rest of California 767 655 780
California Total 3185 1790 1926
Output (millions)
San Luis Obispo County $40452 $36304 $50331
Santa Barbara County $779 $976 $1583
Monterey County $115 $153 $243
Rest of California $18591 $17134 $25146
California Total $59938 $54566 $77303
Table 47 Output and Job Creation from a 7 GW field of OSW
RegionFull-Time Equivalent
JobsTotal Output
(millions)
San Luis Obispo County 44960 $1500241
Santa Barbara County 2019 $44632
Monterey County 314 $6871
Rest of California 24869 $699440
California Total 72162 $2251185
Economic Impact of Offshore Wind Farm Development on the Central Coast
58
The regional economic stimulus provided by a 7 GW field of OSW farms over its lifetime results in the highest annual employment level during the OampM period The OampM period for a 7 GW field of OSW provides an average of $503 million in annual output and 1075 full-time jobs each year for workers in San Luis Obispo County and $773 million in annual output and 1926 full-time jobs each year in California
Table 49 derives annual steady-state values from periodic recommissioning and redeployment of 7 GW OSW for perpetuity The steady-state values represent the annual OampM value for continued operation of a 7 GW field of OSW farms plus the additional benefit from periodic recommissioning of each 1 GW OSW farm staged in 3-year periods that begin with the first OSW farm in 2059 Specifically the average annual regional economic benefits are derived in perpetuity by calculating the economic value for each variable over a 28-year rolling horizon that begins with the OampM period 2050-2058 in which all 7 OSW farms operate followed by a 21-year recommissioning phase involving the staged reassembly and redeployment of successive 1 GW OSW farms over 3-year intervals at the port
The annual average output level resulting from periodic recommissioning and redeployment of 7 GW OSW is $686 million in annual output and 1389 full-time jobs each year for workers in San Luis Obispo County and $104 billion in annual output and 2488 full-time jobs each year in California The interpretation of these values is the long-run average economic value to the regional economy from operating a mature field of OSW farms that perpetually recommissions and maintains 7 GW of OSW in the Central California region
The steady-state average regional economic values represent an approximation because a fully integrated process for maintaining a 7 GW field of OSW farms would be driven by strong economic incentives to maintain OSW turbines on the water generating electricity for the maximum number of days By the time the first OSW farm begins the recommissioning process in 2059 the solution to this problem may ultimately involve a different staging process for OSW turbine replacement than the one considered here in which each 1 GW OSW farm is recommissioned in a 3-year period following its 25-year operating period
Table 49 Annual Output and Job Creation from 7 GW OSW for Perpetuity
RegionFull-Time
Equivalent Jobs Total Output (millions)
San Luis Obispo County 1389 $68601
Santa Barbara County 80 $2114
Monterey County 13 $317
Rest of California 1006 $33123
California Total 2488 $104154
Economic Impact of Offshore Wind Farm Development on the Central Coast
59
The entries in Table 49 are conservative for two reasons First replacement of each 1 GW OSW farm which begins in the year 2059 is with another baseline 1 GW OSW farm built with currently available technology By 2058 it is possible that technological advances will increase the economic value of reinstalling an OSW farm on a new or renewed lease Second the value during the recommissioning period for each 1 GW OSW farm is taken as the added value of recommissioning for the baseline 1 GW OSW farm considered above This suppresses the dynamic adjustment feature of the REMI model under which the value of subsequent recommissioning periods is elevated based on the experience gained by the regional workforce from recommissioning the first 1 GW OSW farm
424 SMALLER SCALE DEVELOPMENT THE CASE OF 3 GW OSW
The potential to develop 7 GW of OSW in and around the Morro Bay Call Area depends on the ability to reach an agreement with the US Department of Defense (DOD) for an expanded OSW planning area In the event that an expanded OSW planning area is not identified in and around the Morro Bay Call Area it is possible to develop a smaller 3 GW field of OSW farms in the 311 square mile area encompassed by the existing Morro Bay Call Area
In the case of 3 GW OSW development in Central California the initial spike in output and employment during the assembly phase is contracted to a 9-year period due to the staging of individual 1 GW OSW farms in successive 3-year periods at the specialized wind port The analysis of the 3 GW OSW development scenario includes the economic value created by constructing a specialized wind port in San Luis Obispo County because the regional economic benefit of OSW development is centered around job creation at the port
Table 410 shows the regional economic value realized for San Luis Obispo County and the State of California over the planning assembly and operating horizon of a 3 GW field of OSW farms absent recommissioning These values include the construction of a specialized wind port during the planning phase prior to assembly of the OSW farms The regional economic stimulus provided by the 3 GW field of OSW farms generates output of $767 billion for San Luis Obispo County and the creation of 28422 full-time equivalent (FTE) jobs over the period 2022-2060 The overall impact in California is $117 billion and the creation of 44282 FTE jobs during this period
Table 410 Output and Job Creation from a 3 GW field of OSW
RegionFull-Time
Equivalent Jobs Total Output (million $s)
San Luis Obispo County 28422 $766223
Santa Barbara County 1140 $23255
Monterey County 173 $3583
Rest of California 14547 $376664
California Total 44282 $1169724
Economic Impact of Offshore Wind Farm Development on the Central Coast
60
Table 411 breaks down output and job creation into annual averages over the various phases of the operating horizon for a 3 GW field of OSW farms absent recommissioning The port construction period overlaps with planning for the first 1 GW OSW farm and the assembly period is staged over 9 years and involves the transition of assembled OSW farms to OampM toward the end of the assembly period
Following the bump in employment during port construction the regional economic stimulus provided by a 3 GW field of OSW farms over its lifetime results in the highest annual employment level during the assembly period Relative to a 7 GW field of OSW employment and output levels tick downward in the OampM period as the regional economy is less active in supporting the smaller field of OSW farms due to a decreased need for maintenance and repair The OampM period for a 3 GW field of OSW provides an average of $176 million in annual output and 483 full-time jobs each year for workers in San Luis Obispo County and $281 million in annual output and 858 full-time jobs each year in California
Table 412 derives annual steady-state values from periodic recommissioning of a 3 GW field of OSW farms for perpetuity The steady-state values represent the annual OampM value for continued operation of a 3 GW field of OSW farms plus the additional benefit from periodic recommissioning of each 1 GW OSW farm staged in 3-year periods that begin with the first OSW farm in 2059 The
Table 411 Average Annual Output and Job Creation over Key Operating Phases of a 3 GW Field of OSW
Economic Stimulus Port Construction Assembly OampM
Jobs
San Luis Obispo County 2365 768 483
Santa Barbara County 47 22 25
Monterey County 6 4 4
Rest of California 767 454 346
California Total 3185 1249 858
Output (millions)
San Luis Obispo County $40452 $20088 $17624
Santa Barbara County $779 $405 $568
Monterey County $115 $067 $087
Rest of California $18591 $10313 $9819
California Total $59938 $30874 $28098
Economic Impact of Offshore Wind Farm Development on the Central Coast
61
average annual regional economic benefits are derived in perpetuity by calculating the economic value for each variable over a 28-year rolling horizon that begins with the OampM period 2038-2058 in which all three OSW farms operate followed by a 9-year recommissioning phase involving the staged reassembly and redeployment of successive 1 GW OSW farms over 3-year intervals at the port
The annual average output level resulting from periodic recommissioning and redeployment of 3 GW OSW is $255 million in annual output and 617 full-time jobs each year for workers in San Luis Obispo County and $396 million in annual output and 1098 full-time jobs each year in California The interpretation of these values is the long-run average economic value to the regional economy from operating a mature field of OSW farms that perpetually recommissions and maintains 3 GW of OSW from a specialized wind port in San Luis Obispo County
Table 412 Annual Output and Job Creation from 3 GW OSW in Perpetuity
RegionFull-Time
Equivalent Jobs Output (millions)
San Luis Obispo County 617 $25454
Santa Barbara County 33 $795
Monterey County 5 $119
Rest of California 443 $13237
California Total 1098 $39605
Economic Impact of Offshore Wind Farm Development on the Central Coast
62
SECTION 5
FISCAL IMPLICATIONS
Economic Impact of Offshore Wind Farm Development on the Central Coast
63
5 FISCAL IMPLICATIONS
Development of OSW farms in Central California have fiscal implications for San Luis Obispo County The fiscal impact of the project is composed of tax revenue derived from several components
bull property taxes on assessed land improvements at the specialized wind portbull unitary taxes assessed on PGampE from the use of transmission and distribution lines in San Luis
Obispo Countybull sales and use taxes on personal consumption of workers employed at the port facilitybull sales and use taxes on OSW capital expenditurebull income taxes on employee wages
bull corporate taxes on value added in the regional supply chain
The fiscal implications depend on renewable energy credits and other aspects that may result in certain components of project expenditures being exempt from state and local taxes For imported equipment delivered to the port such as turbines towers and floating sub-structures the ability to tax these expenditures depends on the ability of the county to declare imports as an originating transaction that occurs at a specialized wind port For this report fiscal implications are calculated gross of any tax credits that may be applied
Local taxes include property and excise taxes paid to municipalities by workers in the jobs generated by the construction- and operating-period employment reflected in Tables 46-48 as well as property and other local taxes by the companies employing those individuals State taxes include income and sales taxes paid by individuals as well as payroll income and other taxes paid by the companies that employ those individuals The taxes are thus proportional to the total direct indirect and induced economic effects provided in these tables However these totals do not represent all taxes paid by companies whose output is only partly affected by the changes in demand attributable to construction and operating periods of offshore wind energy installation and maintenance port construction and terminal operation
51 PROPERTY TAXES FROM LAND IMPROVEMENTS AT THE SPECIALIZED WIND PORT
Property taxes in San Luis Obispo County are levied at a 1 percent rate on land improvements resulting from development of a specialized wind port in San Luis Obispo County The projected capital expense required to construct the port is in the range of $17 billion to $25 billion Using the cost of developing a specialized wind port as a proxy for the change in assessed land improvements constructing a specialized wind port in San Luis Obispo County would result in annual property taxes to the county of $17-25 million per year
Economic Impact of Offshore Wind Farm Development on the Central Coast
64
52 UNITARY TAXES ON ELECTRICITY TRANSMISSION BY PGampE
The County of San Luis Obispo currently receives unitary taxes and franchise taxes from PGampE from the operation of DCPP In the 2019-2020 tax year unitary tax revenues in San Luis Obispo County accounted for $236 million in annual taxes 85 of which was paid by PGampE By far unitary taxes represent the largest revenue source for the county from DCPP54
California bases the unitary tax on the combined total corporate income of multi-state and multi-national corporations by applying a formula to determine the total amount of income the corporation realized within California The State of California assesses the unitary tax on individual corporations as well as groups of companies who operate together as a ldquounitrdquo and then divides the total tax receipt for each unit at the state-level into shares of taxes received by each county For the case of PGampE unitary taxes are assessed by the State Board of Equalization (BOE) at the same 1 rate as property taxes using Historic Cost Less Depreciation (HCLD) as the basis for the assessment The current board-adopted value for PGampE as the basis for unitary taxes is $312 billion55
With the planned closure of DCPP and potential development of OSW the unitary tax received by San Luis Obispo County will change based both on changes in the HCLD for PGampE and shifts in the share of capital costs attributed to the county from electricity distribution Absent OSW development the prospective closure of DCPP will reduce PGampErsquos HCLD following a decrease in annual operating costs however this drop in operating costs will be offset to some extent by increased storage and maintenance costs for nuclear material As existing power generated by DCPP is replaced by electricity generation elsewhere it is likely that the HCLD of PGampE increases although the share of capital costs attributed to San Luis Obispo County can go up or down depending on capital investment required to upgrade the transmission infrastructure for power delivery from alternative uses such as OSW
The National Renewable Energy Laboratory (NREL) estimates required investments in transmission infrastructure for a 1 GW OSW farm site with an average distance to cable landfall of 45km to be $162 billion56 These costs which include grid connection costs for an offshore spur line would be incurred by PGampE (or another contractor in its unit) as part of the basis for the unitary tax Each region in California would be entitled to a share of the unitary tax revenue proportional to the change in PGampErsquos HCLD realized within the region
Based on the estimated transmission infrastructure cost of $162 billion for a 1 GW OSW farm the total cost of developing a 7 GW field of OSW would be approximately $813 billion57 Of this investment the majority of the transmission line would be situated in federal waters outside the tax jurisdiction of the state The taxable proportion of grid connection costs for an offshore spur line to a 7 GW field of OSW can be calculated according to the share of the transmission infrastructure passing through California waters which is the territory extending 3 nautical miles (56 km) from the shore at mean low tide These costs would include both the share of the transmission line residing in California and the cost of the substation at the cable landfall An approximation of the share of grid connection costs attributed to California would be 1244 (=5645 km) Based on this increment the increase in unitary taxes for San Luis Obispo County from a 7 GW field of OSW would be approximately $10 million per year
Economic Impact of Offshore Wind Farm Development on the Central Coast
65
53 SALES AND USE TAXES ON OSW SPENDING
Sales and use taxes are assessed on taxable sales in California at a rate of 725 In addition counties and municipalities can charge an additional local sales tax of up to 25 through special sales tax jurisdictions Currently special tax jurisdictions in San Luis Obispo County provide an additional assessment of 05 for Grover Beach Arroyo Grande Pismo Beach and Paso Robles for a combined effective tax rate of 775 for purchases made in these communities While it is possible that a specialized wind port authority can levy an additional assessment for OSW spending at the port the values provided here consider sales and use taxes only at the 725 rate
The overnight capital cost for a floating 1 GW OSW farm is projected to be $41 billion of which roughly 30 is comprised of turbine capital cost and 36 for the support structure (including the floating substructure lines and anchors for mooring systems and array cables) These OSW components will be imported at least in the short-term58
Sales and use taxes can be assessed on California transactions at the specialized wind port even for imported goods if the transaction occurs in California If the capital spending on turbines and the support structure for a 7 GW field of OSW farms is taxed taxable spending during the 21-year assembly and installation period for OSW would result in California sales and use taxes of $14 billion Based on a 28-year replacement standard for each 1 GW OSW farm the annual sales and use taxes for California in a long-run steady state with periodic recommissioning would result in $498 million per year in additional sales and use taxes for the State of California at prevailing OSW capital costs
54 SALES AND USE TAXES CORPORATE TAXES AND INCOME TAXES FROM AFFILIATED SPENDING
The development of OSW also generates local taxes from income and induced spending by OSW workers as well as corporate taxes on the value added in the regional supply chain from the companies employing those individuals State taxes include income and sales taxes paid by individuals as well as payroll income and other taxes paid by the companies that employ them
Table 51 presents the estimated annual increase in California state taxes from maintaining a 3 GW vs a 7 GW field of OSW farms for perpetuity Corporate income taxes are based on value-added created in the regional supply chain personal income taxes are levied on worker incomes and sales taxes on retail purchases are derived from disposable income The effective tax rate for each component is calculated using data from the California Legislative Analystrsquos Office as the average tax collected in each category as a share of economic activity that occurred in the state over the period 2017-2019 The effective rate for the corporate income tax is taken to be the corporate tax bill as a share of value-added and the retail sales tax is taken to be the retail sales and use tax revenue as a share of personal consumption expenditures spent on taxable items in the state Development of a 3 GW field of OSW farms results in an additional $27 million per year in California tax revenue whereas a 7 GW field of OSW farms contributes $76 million per year in California tax revenue
Economic Impact of Offshore Wind Farm Development on the Central Coast
66
55 SUMMARY OF FISCAL IMPLICATIONS
Table 52 provides a summary of the annual fiscal implications for maintaining a mature field of 3 GW vs 7 GW OSW in and around the Morro Bay Call Area Estimated property taxes from land improvement from investment in a specialized wind port facility are taken at 1 of the midpoint of the estimated capital investment Unitary taxes on the capital cost of infrastructure is fully attributed to San Luis Obispo County including the share of spending that occurs in state waters in addition to onshore investment State taxes amortize the cost of recurring capital investment for recommissioning OSW farms which assumes imported capital is recorded as a taxable transaction on state land at the port Taxes from regional income and spending are taken from Table 51 and suppress the additional county-level 05 retail sales tax from worker spending in special tax jurisdictions in Grover Beach Arroyo Grande Pismo Beach and Paso Robles
In the case of a 3 GW field of OSW development tax values are proportionally smaller due to the smaller scale of the project with the exception of property taxes from the specialized wind port The basis for the increase in assessed value of the property taxes is taken at the low end of the range of cost estimates for the case of 3 GW OSW development and at the high end of the range for the case of 7 GW OSW development Detailed information at this time is not available to confirm whether or not the cost of port construction would materially differ in the case where the specialized wind port was constructed to support a 3 GW or a 7 GW field of OSW farms
Table 51 Annual Taxes from Regional Economic Development of 3 GW vs 7 GW OSW
3 GW Field 7 GW Field
Type of Tax Effective Rate Basis (millions) Tax (millions) Basis (millions) Tax (millions)
Corporate Income Tax 09078 $18737 $170 $46323 $421
Personal Income Tax 83508 $21861 $1826 $65226 $5447
Retail Sales Tax 37515 $18722 $702 $55654 $2088
Total $2698 $7955
Economic Impact of Offshore Wind Farm Development on the Central Coast
67
Table 52 Summary of Annual Fiscal Benefits from 3 GW vs 7 GW OSW
3 GW Field 7 GW Field
Tax BasisCounty Taxes (millionsyr)
State Taxes (millionsyr)
County Taxes (millionsyr)
State Taxes (millionsyr)
Specialized Wind Port
Property Taxes $1700 $2500
OSW Capital Spending $2133 $4978
Transmission Infrastructure
Unitary Taxes $434 $1012
Regional Spending
Corporate Income Tax $170 $421
Personal Income Tax $1826 $5447
Retail Sales Tax $702 $2088
Total $2134 $4831 $3512 $12933
Economic Impact of Offshore Wind Farm Development on the Central Coast
68
SECTION 6
CONCLUSION
Economic Impact of Offshore Wind Farm Development on the Central Coast
69
6 CONCLUSION
The development of up to 7 GW OSW in and around the Morro Bay Call Area represents a considerable opportunity for job and economic output impacts However the logistical challenges associated with building and operating a field of OSW farms and the associated specialized wind port that supports them are substantial If a specialized wind port for OSW turbine assembly and repair is not constructed in San Luis Obispo County then the regional economic benefits of jobs and economic output creation would occur instead in the county that provides the port In contrast the State of California would retain much of the economic benefit of OSW development if another county in California provides the specialized wind port
Construction-phase impacts during the 5-year period of port construction generate 11825 full-time equivalent (FTE) construction jobs in San Luis Obispo County and 15925 construction jobs overall in California stimulating $202 billion in additional economic output for San Luis Obispo County and $3 billion in economic output for California These impacts on economic output and jobs include port terminal and transmission infrastructure improvements as well as the first stage of wind farm development and planning operations
Following the period of port construction and OSW planning assembly of 1 GW OSW farms is staged over time in a 3-year period for each OSW farm For a 3 GW field of OSW farms construction of a port followed by staged assembly of 1 GW OSW farms over a total of 9 years provides 28422 FTE jobs in San Luis Obispo County and 44282 FTE jobs in California over an operating horizon through 2060 Developing a 3 GW field of OSW farms generates $766 billion in economic output for San Luis Obispo County and $1170 billion in economic output for California through the year 2060 Additional jobs and economic output would be realized during the decommissioning period of the field which extends well beyond the horizon of the REMI model in 2060 and is therefore not considered in the model
For a 7 GW field of OSW farms construction of a port followed by staged assembly of 1 GW OSW farms over a total of 21 years provides 44960 FTE jobs in San Luis Obispo County and 72162 FTE jobs in California over an operating horizon through 2060 Developing a 7 GW field of OSW farms generates $15 billion in economic output for San Luis Obispo County and $2251 billion in economic output for California through the year 2060 As in the case of a 3 GW field of OSW farms additional jobs and economic output would be realized during the decommissioning period which is not considered in the model
Perpetual operation of a mature 3 GW or 7 GW field of OSW farms produces considerable regional economic benefits each year Perpetual operation of a mature 3 GW field of OSW farms results in the creation of 617 jobs per year in San Luis Obispo County and 1098 jobs per year in California and provides additional economic output of $254 million per year in San Luis Obispo County and $396
Economic Impact of Offshore Wind Farm Development on the Central Coast
70
million per year in California Perpetual operation of a mature 7 GW field of OSW farms results in the creation of 1389 jobs per year in San Luis Obispo County and 2488 jobs per year in California and provides additional economic output of $686 million per year in San Luis Obispo County and $104 billion per year in California
Fiscal benefits to San Luis Obispo County are predominantly driven by property taxes on land improvements at the specialized wind port which generates between $17-$25 million per year in local property tax revenues The considerable cost of developing the necessary transmission infrastructure to provide grid connection for a 3-7 GW field of OSW farms to the existing connections at DCPP provides a tax benefit to the county as well Based on the taxable change in the cost of the transmission infrastructure the development of a 3 GW field of OSW farms is projected to result in increased unitary taxes for San Luis Obispo County of $43 million per year whereas the development of a 7 GW field of OSW farms is projected to result in increased unitary taxes for San Luis Obispo County of $101 million per year
The fiscal impact to the State of California is comprised of sales and use taxes on personal consumption expenditures resulting from worker spending corporate income taxes on value added by companies in the regional supply chain and the state income taxes on employed workers Using effective tax rates derived from data provided by the California Legislative Analystrsquos Office perpetual operation of a mature 3 GW field of OSW generates $27 million per year in California tax revenue whereas a 7 GW field of OSW generates $796 million per year in California tax revenue from the projected economic activity created by OSW
Over time economic impacts can change As installed wind farm capacity in California increases through planned developments in Central and Northern California learning effects are likely to further reduce costs and investment in OSW manufacturing capabilities in California would allow a greater share of inputs to be locally sourced Changes along these lines will result in greater regional economic benefits in the long-term for floating OSW development in California
Economic Impact of Offshore Wind Farm Development on the Central Coast
71
REFERENCES
American Jobs Project 2019 The California Offshore Wind Project A Vision for Industry Growth February 2019 Available at httpsoffshorewindhuborgresource1771
American Wind Energy Association California and Offshore Wind California 2020 AWEA-California and Offshore Wind California Comments California Energy Commission Docket 17-MISC-01 June 30 2020 Available at httpsefilingenergycagovGetDocumentaspxtn=233690ampDocumentContentId=66331
Berkeley Lab 2020 Wind Technologies Market Report Available at httpsemplblgovwind-technologies-market-report
Beiter P Musial W Smith A Kilcher L Damiani R Maness M Sirnivas S Stehly T Gevorgian V Mooney M and Scott G 2016 A spatial-economic cost-reduction pathway analysis for US offshore wind energy development from 2015ndash2030 (No NRELTP-6A20-66579) National Renewable Energy Laboratory(NREL) Golden CO (United States)
BOEM California Offshore Wind Energy httpscaoffshorewinddatabasinorgmaps4c-86c5e61e044747ac010102c4787507active
Brightline Defense 2020 California Offshore Wind Winding up for Environmental Growth and Environmental Equity December 2020
Bureau of Ocean Energy Management (BOEM) California Offshore Renewable Energy Fact Sheet February 22 2017 Available at httpswwwboemgovsitesdefaultfilesrenewable-energy-programState-ActivitiesCABOEM-Offshore-Renewables-Factsheet--02-22-17pdf
Busch C and Orvis R 2020 Insights from the California Energy Policy Simulator On the Statersquos Current Greenhouse Gas Emission Trajectory and Six Policy Opportunities for Deepening Emission Reductions Energy Innovation LLC January 2020 Available at httpsenergyinnovationorgwp-contentuploads202005Insights-from-the-California-Energy-Policy-Simulator_5120pdf
California Board of Equalization Unitary Valuation Methods March 2003 Available at httpswwwboecagovproptaxespdfmethodsbook2003pdf
California Energy Commission 2019 Total System Electric Generation Available at httpswwwenergycagovdata-reportsenergy-almanaccalifornia-electricity-data2019-total-system-electric-generation
California Energy Commission 2020 UPDATED Notice of Availability of Outreach on Additional Considerations for Offshore Wind Energy off the Central Coast of CA May 7 2020
Colias M 2021 GM to Phase Out Gas- and Diesel-Powered Vehicles by 2035 The Wall Street Journal January 28 2021 Available at httpswwwwsjcomarticlesgm-sets-2035-target-to-phase-out-gas-and-diesel-powered-vehicles-globally-11611850343
Economic Impact of Offshore Wind Farm Development on the Central Coast
72
Collier R 2017 High Road for Deep Water Center for Labor Research and Education University of California Berkeley CA
Dvorak MJ Archer CL and Jacobson MZ 2010 California offshore wind energy potential Renewable energy 35(6) pp1244-1254
Energy and Environmental Economics Inc 2019 The Economic Value of Offshore Wind Power in California August 2019 Available at httpcastlewindcomwp-contentuploads2019082019-08-08_E3-CastleWind-OffshoreWindValueReport_compressedpdf
Energy and Environmental Economics Inc 2018 ldquoDeep Decarbonization in a High Renewables Futurerdquo California Energy Commission June 18 2018 Available at httpswwwethreecomwp-contentuploads201806Deep_Decarbonization_in_a_High_Renewables_Future_CEC-500-2018-012-1pdf
Fripp M and Wiser RH 2008 Effects of temporal wind patterns on the value of wind-generated electricity in California and the Northwest IEEE Transactions on Power Systems 23(2) pp477-485
Froese M 2019 Why collaboration is critical to offshore wind and port success Windpower Energy and Development August 28 2019 Available at httpswwwwindpowerengineeringcomwhy-collaboration-is-critical-to-offshore-wind-and-port-success
Garrick BJ and Wakefield DJ 2020 Probabilistic Risk Assessment of Nuclear Power Plant Spent Fuel Handling and Storage Programs Methodology and Application to the Diablo Canyon Power Plant The B John Garrick Institute for the Risk Sciences at UCLA and Pacific Gas and Electric Company February 17 2020
Global Wind Energy Council (GWEC) 2020 Global Offshore Wind Report August 5 2020 Available at httpsgwecnetglobal-offshore-wind-report-2020
Hackett S and Anderson J 2020 California North Coast Offshore Wind Studies Economic Development and Impacts Schatz Energy Research Center September 2020
London Economics International LLC 2013 Analysis of the Macroeconomic Impacts of the Proposed Zephyr Transmission Project May 2013 Available at httpwwwdatcllccomwp-contentuploads201306ZephyrEconomicBenefitsStudy-5212013pdf
Lowder K 2021 Wind Power amp Renewables Surge to New Record in China Cleantechnica January 22 2021 Available at httpscleantechnicacom20210122wind-power-renewables-surge-to-new-record-in-china
Massachusetts Clean Energy Center 2017 2017 Massachusetts Offshore Wind Ports amp Infrastructure Assessment May 2017 Available at httpwwwmassceccomports
Musial W Beiter P Tegen S and Smith A 2016 Potential Offshore Wind Energy Areas in California An Assessment of Locations Technology and Costs National Renewable Energy Laboratory December 2016 Available at httpswwwboemgovsitesdefaultfilesenvironmental-stewardshipEnvironmental-StudiesPacific-RegionStudiesBOEM-2016-074pdf
Economic Impact of Offshore Wind Farm Development on the Central Coast
73
National Renewable Energy Laboratory (NREL) Annual Technology Baseline 2020 Available at httpsatbnrelgovelectricity2020dataphp
Porter A and Phillips S 2016 Determining the Infrastructure Needs to Support Offshore Floating Wind and Marine Hydrokinetic Facilities on the Pacific West Coast and Hawaii US Bureau of Offshore Energy Management March 3 2016 Available at httpwwwdataboemgovPIPDFImagesESPIS55503pdf
Reed S 2021 A Monster Wind Turbine is Upending the Industry The New York Times January 1 2021 Available at httpswwwnytimescom20210101businessGE-wind-turbinehtml
Roland-Holst DW Behnke D Evans S Froumllund L and Yi-Chen A 2019 Economic Impact Assessment of the Prospective Closure of the Diablo Canyon Nuclear Power Plant California Public Utilities Commission June 28 2019
Severy M and Jacobson A 2020 California North Coast Offshore Wind Studies Interconnection Constraints and Pathways Schatz Energy Research Center September 2020
Severy M Younes A Zoellick J and Jacobson A 2020 Northern California Offshore Wind Generation and Load Compatibility Assessment with Emphasis on Electricity Grid Constraints Mitigation Measures and Associated Costs Final Synthesis Report Energy Research Center September 2020 OCS Study BOEM 2020-045
Shaner MR Davis SJ Lewis NS and Caldeira K 2018 ldquoGeophysical constraints on the reliability of solar and wind power in the United Statesrdquo Energy amp Environmental Science 11(4) pp914-925
Sinden G 2007 ldquoCharacteristics of the UK wind resource Long-term patterns and relationship to electricity demandrdquo Energy Policy 35(1) pp112-127
Speer B Keyser D and Tegen S 2016 Floating Offshore Wind in California Gross Potential for Jobs and Economic Impacts from Two Future Scenarios (No NRELTP-5000-65352) National Renewable Energy Laboratory (NREL) Golden CO (United States)
Wang YH Walter RK White C Kehrli MD Hamilton SF Soper PH and Ruttenberg BI 2019 ldquoSpatial and temporal variation of offshore wind power and its value along the Central California Coastrdquo Environmental Research Communications 1(12) p121001
1 A power plant with a 50 capacity factor produces twice as much power per day as a power plant with the same nameplate
capacity and a 25 capacity factor
2 The overnight LCOE for floating OSW is currently $67MWh which compared with $69MWh for commercial PV in Los
Angeles $61MWh for nuclear and $57-89MWh for new steam-reach development of hydropower and $123MWh for flash
steam enhanced geothermal systems National Renewable Energy Laboratory (NREL) Annual Technology Baseline 2020
Available at httpsatbnrelgovelectricity2020dataphp
3 California Energy Commission 2019 Total System Electric Generation Available at httpswwwenergycagovdata-reports
energy-almanaccalifornia-electricity-data2019-total-system-electric-generation
Economic Impact of Offshore Wind Farm Development on the Central Coast
74
4 Busch C and Orvis R 2020 Insights from the California Energy Policy Simulator on the Statersquos Current Greenhouse Gas Emission
Trajectory and Six Policy Opportunities for Deepening Emission Reductions Energy Innovation LLC January 2020 Available at
httpsenergyinnovationorgwp-contentuploads202005Insights-from-the-California-Energy-Policy-Simulator_5120
5 Colias M 2021 GM to Phase Out Gas- and Diesel-Powered Vehicles by 2035 The Wall Street Journal January 28 2021
Available at httpswwwwsjcomarticlesgm-sets-2035-target-to-phase-out-gas-and-diesel-powered-vehicles-
globally-11611850343
6 Energy and Environmental Economics Inc 2018 ldquoDeep Decarbonization in a High Renewables Futurerdquo California Energy
Commission June 18 2018 Available at httpswwwethreecomwp-contentuploads201806Deep_Decarbonization_
in_a_High_Renewables_Future_CEC-500-2018-012-1pdf
7 Severy M Younes A Zoellick J Jacobson A 2020 Northern California Offshore Wind Generation and Load Compatibility
Assessment with Emphasis on Electricity Grid Constraints Mitigation Measures and Associated Costs Final Synthesis Report Schatz
Energy Research Center September 2020
8 Bureau of Ocean Energy Management (BOEM) httpswwwboemgovrenewable-energylease-and-grant-information
9 This calculation is based on a capacity factor of 50 for OSW The exact amount of generating capacity needed to meet state
renewable energy targets in 2050 depends on future demand growth driven by electrification and the capacity factor of the
power source which is rapidly increasing for OSW
10 National Renewable Energy Laboratory (NREL) Annual Technology Baseline 2020 Available at httpsatbnrelgov
electricity2020dataphp
11 A capacity factor of 50 percent is equivalent to achieving the full nameplate capacity of the OSW farm for 12 hours per day
with zero electricity generation for the remaining 12 hours per day
12 American Jobs Project 2019 The California Offshore Wind Project A Vision for Industry Growth February 2019 Available
at httpsoffshorewindhuborgresource1771
13 Myers Amanda 2020 Seven Policies to Tap US Offshore Windrsquos $166 Billion Economic Growth And Emissions Reduction
Potential Forbes August 31 2020 Available at httpswwwforbescomsitesenergyinnovation20200831seven-policies-
the-us-can-use-to-tap-offshore-winds-166-billion-economic-growth-and-emissions-reduction-
potentialsh=5bf30e546f27
14 Energy and Environmental Economics Inc 2019 The Economic Value of Offshore Wind Power in California August 2019
Available at httpcastlewindcomwp-contentuploads2019082019-08-08_E3-CastleWind-OffshoreWindValueReport_
compressedpdf
15 Wang YH Walter RK White C Kehrli MD Hamilton SF Soper PH and Ruttenberg BI 2019 ldquoSpatial and temporal
variation of offshore wind power and its value along the Central California Coastrdquo Environmental Research Communications
1(12) p121001
16 External costs of GHG emissions are captured to some extent in California electricity prices through public regulations for
instance the cap-and-trade program for carbon emissions under AB 32 Similarly higher electricity generation costs are
priced into the California grid indirectly by Californiarsquos commitment to developing renewable sources
17 Musial W Beiter P Tegen S and Smith A 2016 Potential Offshore Wind Energy Areas in California An Assessment of
Locations Technology and Costs National Renewable Energy Laboratory December 2016 Available at httpswwwboem
govsitesdefaultfilesenvironmental-stewardshipEnvironmental-StudiesPacific-RegionStudiesBOEM-2016-074pdf
18 California Energy Commission 2020 UPDATED Notice of Availability of Outreach on Additional Considerations for Offshore Wind
Energy off the Central Coast of CA May 7 2020
Economic Impact of Offshore Wind Farm Development on the Central Coast
75
19 American Wind Energy Association California and Offshore Wind California 2020 Offshore Wind Development in Morro Bay
Letter to the Honorable Salud Carbajal and the Honorable Jimmy Panetta May 27 2020
20 Brightline Defense 2020 California Offshore Wind Winding up for Environmental Growth and Environmental Equity December
2020
21 Ma K Luo Y Thomas KC amp Wu Y 2019 Mooring System Engineering for Offshore Structures Elsevier Science amp
Technology San Diego Available from ProQuest Ebook Central February 2021
22 KampL Gates 2019 Offshore Wind Handbook Version 2 October 2019 Available at httpsfilesklgatescomfilesuploads
documents2019_offshore_wind_handbookpdf
23 If the blades are not already attached to the nacelle-hub each blade is then lifted separately by the crane and connected to
the hub
24 Uraz E 2011 Offshore wind turbine transportation amp installation analyses planning optimal marine operations for offshore
wind projects Available at httpwwwdiva-portalorgsmashgetdiva2691575FULLTEXT01pdf
25 Wang YH Walter RK White C Kehrli MD Hamilton SF Soper PH and Ruttenberg BI 2019 Spatial and temporal
variation of offshore wind power and its value along the Central California Coast Environmental Research Communications
1(12) p121001
26 Wang YH Walter RK White C Kehrli MD Hamilton SF Soper PH and Ruttenberg BI 2019 Spatial and temporal
variation of offshore wind power and its value along the Central California Coast Environmental Research Communications
1(12) p121001
27 The electricity portfolio must include enough firm capacity to meet coincident system peak plus additional 15 of planning
reserve margin (PRM) requirement
28 Hackett S and Anderson J 2020 California North Coast Offshore Wind Studies Economic Development and Impacts
Schatz Energy Research Center September 2020
29 Massachusetts Clean Energy Center 2017 Massachusetts Offshore Wind Ports amp Infrastructure Assessment May 2017 Available
at httpwwwmassceccomports
30 Porter A and Phillips S 2016 Determining the Infrastructure Needs to Support Offshore Floating Wind and Marine Hydrokinetic
Facilities on the Pacific West Coast and Hawaii US Bureau of Offshore Energy Management March 3 2016 Available at http
wwwdataboemgovPIPDFImagesESPIS55503pdf
31 Collier R 2017 High Road for Deep Water Center for Labor Research and Education University of California Berkeley CA
32 Garrick BJ and Wakefield DJ 2020 Probabilistic Risk Assessment of Nuclear Power Plant Spent Fuel Handling and Storage
Programs Methodology and Application to the Diablo Canyon Power Plant The B John Garrick Institute for the Risk Sciences at
UCLA and Pacific Gas and Electric Company February 17 2020
33 California Energy Commission 2019 Total System Electric Generation Available at httpswwwenergycagovdata-reports
energy-almanaccalifornia-electricity-data2019-total-system-electric-generation
34 Severy M and Jacobson A 2020 California North Coast Offshore Wind Studies Interconnection Constraints and Pathways
Schatz Energy Research Center September 2020
35 London Economics International LLC 2013 Analysis of the Macroeconomic Impacts of the Proposed Zephyr Transmission Project
May 20 2013 Available at httpwwwdatcllccomwp-contentuploads201306ZephyrEconomicBenefitsStudy-5212013pdf
36 Collier R 2017 High Road for Deep Water Center for Labor Research and Education University of California Berkeley CA
37 Collier R 2017 High Road for Deep Water Center for Labor Research and Education University of California Berkeley CA
38 Brightline Defense 2020 California Offshore Wind Winding up for Environmental Growth and Environmental Equity December
2020
39 US Census Bureau 2020
Economic Impact of Offshore Wind Farm Development on the Central Coast
76
40 SLO County BW Report 2018
41 SLO County BW Report 2018
42 US Bureau of Economic Analysis
43 SLO County BW Report 2018
44 US Bureau of Economic Analysis
45 wwwslocountycagov 2021 SLO County Monthly Labor Market Information - County of San Luis Obispo Available at https
wwwslocountycagovDepartmentsSocial-ServicesWorkforce-Development-BoardSLO-County-Monthly-Labor-Market-
Informationaspx
46 wwwblsgov 2021 Unemployment Rates for States Available at httpwwwblsgovweblauslaumstrkhtm
47 SLO County BW Report 2018
48 US Bureau of Economic Analysis 2020
49 US Bureau of Economic Analysis 2020
50 Private costs of OSW include the opportunity cost of delaying the time wind turbines spend on the water by the extra travel
days from a more distant port which will be passed through into consumer electricity prices though higher LCOE for the
change in duration the wind turbines produce electricity for the grid (ie the extra days required for transportation during
periods of turbine installation and repair)
51 Roland-Holst DW Behnke D Evans S Froumllund L and Yi-Chen A 2019 Economic Impact Assessment of the
Prospective Closure of the Diablo Canyon Nuclear Power Plant California Public Utilities Commission June 28 2019
52 Garrick BJ and Wakefield DJ 2020 Probabilistic Risk Assessment of Nuclear Power Plant Spent Fuel Handling and Storage
Programs Methodology and Application to the Diablo Canyon Power Plant The B John Garrick Institute for the Risk Sciences at
UCLA and Pacific Gas and Electric Company February 17 2020
53 A specialized wind port for OSW assembly and repair ultimately may be provided in a neighboring county however the
regional economic benefit considered in this report presumes the port is constructed in San Luis Obispo County
54 SLO County Assessorrsquos Office
55 State of California Board of Equalization httpswwwboecagovproptaxespdfPropValues2020pdf
56 NREL 2020 ATB
57 To the extent economies of scale exist in developing the transmission infrastructure for a 7 GW field of OSW using the NREL
cost approximation for a 1 GW OSW farm as a scalar for field development costs will over-estimate actual transmission
infrastructure costs for 7 GW field of OSW
58 The National Defense Authorization Act for FY2021 recently passed by US Congress includes amendments that ensure that
the Outer Continental Shelf Lands Act (OCSLA) applies to offshore wind farms The amendments have the potential to increase
the share of transportation costs captured by American-built vessels in the offshore wind fleet under the Jones Act
Economic Impact of Offshore Wind Farm Development on the Central Coast
6
zero-carbon renewable electricity mix by 2045 implicitly places a large weight on greenhouse gas emissions in the calculation of social cost tilting the economic balance toward the evaluation of carbon-free electricity projects that minimize private costs
Relative to other renewable energy resources OSW has a favorable time profile of electricity delivery OSW farms produce peak electricity during evening hours reducing storage needs when mixed in a renewable energy portfolio with solar power generation that delivers peak energy in the middle of the day Relative to commercial solar power OSW energy can generate electricity around the clock resulting in a capacity factor of 50 almost double that of commercial solar power1 The levelized cost of energy ($MWh) which represents the long-run average cost of electricity generation over the life of a power plant is approaching parity with commercial solar photovoltaic systems and nuclear power as recent technological advances have greatly reduced the cost of floating OSW 2
An important challenge for floating OSW energy development is minimizing transportation and logistical costs between the OSW field and the specialized wind ports that serve them Given the massive size of OSW turbines final assembly must take place in reinforced quays at a port either at a waterfront manufacturing hub (likely in Asia) or at a specialized wind port that receives floating foundations towers and turbines from the manufacturing center and assembles them locally Developing a specialized wind port provides a foothold for regional economic values to be generated in California by providing assembly maintenance and repair jobs for turbines that might otherwise be towed into federal waters off Californiarsquos coast from international manufacturing centers
The economics of OSW development are driven by tremendous fixed costs that must be incurred up front to make floating OSW power a reality The National Renewable Energy Laboratory (NREL) estimates that installing an OSW farm with 1 GW nameplate capacity involves investing largely unrecoverable capital expenditures (CapEx) of more than $55 billion which requires OSW turbines to be maintained and connected to the electricity grid for extended periods of time to recoup the initial upfront investment The economics of energy projects that involve high fixed costs and low variable costs favor maximizing the time OSW turbines spend on the water generating electricity for the grid as the opportunity cost of down time for turbine maintenance and repair can quickly erode the economic value of OSW The need to maintain OSW turbines for a large number of days on the water to recoup the initial capital investment in turn highlights the need to develop specialized
wind ports for assembly and repair of wind turbines in close proximity to the OSW farms
The center for job creation from floating OSW farms will be at the ports For this reason the regional economic value calculated in this report presumes a specialized wind port is available to assemble and repair floating OSW turbines in San Luis Obispo County
Making economic benefits from OSW development a reality for San Luis Obispo County will require developing a specialized wind port as a hub for OSW jobs and regional supply-chain development
Economic Impact of Offshore Wind Farm Development on the Central Coast
7
In the event a specialized port is not constructed in the county the regional economic benefits considered here will not materialize in San Luis Obispo County but instead will occur in the county that provides the port Making economic benefits from OSW development a reality for San Luis Obispo County will require developing a specialized wind port as a hub for OSW jobs and regional supply-chain development An important next step to attaining the economic benefits detailed in this report is to conduct a feasibility study for developing a specialized wind port in San Luis Obispo County
The economic benefit of OSW development on the Central Coast is derived from the following activities port construction planning assembly operation and maintenance (OampM) and decommissioning (recommissioning)
Virtually all the jobs to support these activities will occur at the specialized wind port which is the physical entity that ties OSW farms located in federal waters to a staging area on Californiarsquos coast
Unlocking Californiarsquos offshore wind energy potential is a case study in the challenges and opportunities involved in the 21st-century clean energy transition Deploying floating OSW farms off Californiarsquos coastline will require developing an entirely new industry in California that must surmount major transmission infrastructure requirements address electricity storage needs and provide integrated resource planning to smooth the timing of electricity delivery from solar land-based wind offshore wind hydropower and geothermal sources in a renewable energy portfolio The emerging OSW industry in California currently lags far behind China and the EU in supply-chain development and its success will depend largely on coordinated policy decisions by state and regional government to provide clear market signals for stakeholders
Investor confidence is needed to develop regional supply chains for OSW energy development in California In-state production of the full range of OSW farm components including turbines and floating foundations is not a reality today but is possible if state and federal planners send clear signals to OSW developers that investing in OSW manufacturing capacity in California will be rewarded by long-term market development If state planners fail to provide clear market signals on the outlook for OSW in California it is likely that much of the supply chain will continue to be outsourced to international manufacturing hubs in China and South Korea for turbines and floating foundations reducing the potential for economic benefits to be realized over time in California
The regional economic benefit of OSW development considered in this report does not include additional values that can be created through the long-term development of manufacturing capacity for turbines and floating foundations in California Indeed the current gap between Californiarsquos capability for OSW manufacturing and the rest of the world remains large Instead the report considers the construction and operation of a small specialized wind port in San Luis Obispo County that acts as a receiving point for manufactured components and engages in the assembly repair and maintenance of floating OSW turbines
A key implication of the study is that the regional economic value of OSW farm development off the Central Coast of California will be largely captured by the county that develops a specialized wind port for assembly and repair of OSW turbines Given the large scale of offshore wind turbines which
Economic Impact of Offshore Wind Farm Development on the Central Coast
8
are many times larger than onshore turbines it is not possible to transport OSW turbines by truck or rail requiring these activities to take place directly at a port For this reason installing operating and maintaining a field of 3 - 7 GW of OSW farms in the region will require developing an extensive supply chain to support the hub of economic activity centered at the specialized wind port
The economic benefit to San Luis Obispo County from OSW farm development is defined by several key phases
bull construction of a specialized wind portbull assembly of OSW turbines at the portbull an operation and maintenance (OampM) period that relies on the specialized wind port to repair
and maintain OSW turbinesbull a decommissioning (or alternatively recommissioning) period at the end of each 30-year lease
With current technology all phases of floating OSW development will take place in a port either by making use of a specialized wind port for final assembly of OSW turbines in California or by floating fully assembled structures into place directly from existing manufacturing centers in Asia
The main findings of the report are as follows Table E1 shows regional job and output creation during the 5-year construction phase of the specialized wind port
Table E2 shows the total job and output for a representative 1 GW OSW farm over a 35-year horizon through 2058 that includes planning assembly a 25-year period for operation and maintenance and a 3-year decommissioning period Economic output includes local spending on labor materials and services and does not include the value of the energy created The value of the representative 1 GW OSW farm is in addition to the value created during the 5-year period of port construction
Table E1 Output and Job Creation from Port Construction
RegionFull-Time
Equivalent JobsTotal Output (million $s)
San Luis Obispo County 11825 $202261
Santa Barbara County 234 $3896
Monterey County 28 $577
Rest of California 3837 $92956
California Total 15925 $299689
Economic Impact of Offshore Wind Farm Development on the Central Coast
9
Table E3 provides a breakdown of the regional economic benefit to San Luis Obispo County in terms of average wages employee compensation and total output resulting from direct project spending indirect activity stimulated through supply-chain development and induced economic activity from employee spending Employee compensation includes wages and fringe benefits paid for by employers
Table E4 compares the annual average economic benefit from operating a mature 3 GW vs 7 GW field of OSW farms These values are based on a scenario of perpetual lease renewal in which OSW turbines are floated back to the specialized wind port for recommissioning at the end of each lease followed by redeployment of OSW turbines for subsequent use The values are based on a perpetual OampM period that begins on the date of final installation of the field in a perpetual cycle of maintenance and repair through the end of the service life of each 1 GW OSW farm The annual economic benefit of maintaining a mature field of OSW farms is in addition to the economic benefit from construction of a specialized wind port in Table E1
Table E3 Regional Economic Impact of a 1 GW Wind Farm in San Luis Obispo County
ImpactFull-Time
Equivalent Jobs
Average Job Compensation ($
year)
Employee Compensation
(million $s)Total Output (million $s)
Direct 3490 $88650 $30941 $162674
Indirect 2308 $66076 $15251 $57822
Induced 814 $74884 $6093 $24760
Total Economic Impact 6612 $79076 $52285 $245256
Table E2 Output and Job Creation from a 1 GW Wind Farm with Decommissioning
RegionFull-Time
Equivalent JobsTotal Output (million $s)
San Luis Obispo County 6612 $245256
Santa Barbara County 364 $7766
Monterey County 58 $1189
Rest of California 4333 $116470
California Total 11368 $370681
Economic Impact of Offshore Wind Farm Development on the Central Coast
10
Table E5 compares the annual fiscal benefits from taxes collected at the county and state level from perpetual operation of a mature 3 GW vs 7 GW field of OSW farms Economic benefits are particularly important to San Luis Obispo County given the planned closure of the Diablo Canyon Power Plant (DCPP) The development of OSW farms just beyond sightlines from the Central Coast could be particularly beneficial to San Luis Obispo County by providing jobs in the affiliated green energy sector of the regional economy
Table E5 Summary of Annual Fiscal Benefits from 3 GW vs 7 GW OSW
3 GW Field 7 GW Field
Tax BasisCounty Taxes (million $yr)
State Taxes (million $yr)
County Taxes (million $yr)
State Taxes (million $yr)
Specialized Wind Port
Property Taxes $1700 $2500
OSW Capital Spending $2133 $4978
Transmission Infrastructure
Unitary Taxes $434 $1012
Regional Spending
Corporate Income Tax $170 $421
Personal Income Tax $1826 $5447
Retail Sales Tax $702 $2088
Total $2134 $4831 $3512 $12933
Table E4 Annual Output and Job Creation from Maintaining a 3 GW vs 7 GW Field of OSW Farms in Perpetuity
3 GW Field 7 GW Field
Type of Tax FTE Jobs Output (millions) FTE Jobs Output (millions)
San Luis Obispo County 617 $25454 1389 $68601
Santa Barbara County 33 $795 80 $2114
Monterey County 5 $119 13 $317
Rest of California 443 $13237 1006 $33123
California Total 1098 $39605 2488 $104154
Economic Impact of Offshore Wind Farm Development on the Central Coast
11
Over time economic opportunities can change in ways that are difficult to predict prior to the initial investment As installed wind farm capacity in California increases over time both in Central California as well as other regions it is likely that regional supply chains develop further This would occur through cost-reducing learning effects and potentially even through the creation of a manufacturing industry for floating OSW foundations towers and turbines in California that would allow a greater share of inputs to be locally sourced from producers in the state Coordinated development of OSW in California and elsewhere in the US has the potential to greatly expand the regional economic impact for a given level of capital expenditure
Unlocking Californiarsquos offshore wind energy potential is a case study in the challenges and opportunities involved in the 21st-century clean energy transition
Economic Impact of Offshore Wind Farm Development on the Central Coast
12
SECTION 2
INTRODUCTION
Economic Impact of Offshore Wind Farm Development on the Central Coast
13
1 INTRODUCTION
As the State of California moves toward meeting its ambitious clean energy and climate goals mdash underscored by targets to reduce greenhouse gas (GHG) emissions from 1990 levels by 40 by 2030 and 80 by 2050 and to achieve a zero-carbon renewable electricity mix by 2045 mdash offshore wind (OSW) is poised to provide a substantial contribution With 112 GW of technical offshore wind resource potential along its coastline the OSW energy sector alone is capable of meeting more than 15 times the statersquos annual electricity demand
Californiarsquos current power supply has already started to shift toward renewable zero-carbon sources In 2019 the State of California derived approximately 32 of its electricity from renewable sources (including 12 solar and 10 onshore wind) and 55 GHG-free including 9 nuclear power (16163 GWh) from Diablo Canyon Power Plant (DCPP)3 Yet despite the recent development of commercial solar power in California including four commercial solar plants in San Luis Obispo County the growth of zero-emission electricity supply is not on target to meet Californiarsquos clean energy goals Based on recent emissions inventory data California emitted 424 million metric tons (MMT) of CO2e in 2017 which implies that reducing statewide emissions below the 260 MMT of carbon dioxide equivalent (CO2e) limit by 2030 will require reducing emissions by an average of 13 MMT of CO2e annually nearly double the annual rate of 7 MMT of CO2e achieved over the past decade4
Much of the movement toward clean energy supply will need to take place on Californiarsquos electricity grid On January 28 2021 General Motors Co set an ambitious target to completely phase out gasoline- and diesel-powered vehicles globally by 20355 The movement of large automakers to the electricity grid compounds the findings of recent California Energy Commission (CEC) and California Public Utilities Commission (CPUC) studies that indicate the state will require two to six times more renewable power capacity by 2050 than is installed today to meet its policy goals under AB 32 implying a need for between 100 to 150 GW of new renewable power capacity6
11 RECENT TECHNOLOGICAL ADVANCES MAKE FLOATING OFFSHORE WIND POSSIBLE
Unlike the coastline on the East Coast of the US the ocean floor slopes steeply downward into deep waters off the California coastline requiring the use of floating platforms for OSW Recent advances in floating platform technologies for OSW turbines have greatly reduced the cost of developing floating OSW farms making it possible to build OSW farms to scale in California that rival the generation capacity of fixed platform technologies as used over the past several decades in the shallower waters off the East Coast and Europe Floating wind technology which relies on mooring lines and anchors to tether platforms to the ocean floor has the advantage of allowing offshore wind turbines to be placed further from shore where the wind speeds are generally faster and more consistent allowing greater power generation while limiting sight impacts from shore While the technology for floating OSW has been demonstrated successfully in pilot projects around the world
Economic Impact of Offshore Wind Farm Development on the Central Coast
14
a commercial scale floating offshore wind farm has not yet been deployed in the United States7
The Bureau of Ocean Energy Management (BOEM) recently initiated the leasing process for three potential offshore wind sites in approximately 687832 acres of federal waters off the California coast to be auctioned for commercial OSW production as early as 20228 BOEM identified Call Areas located off the coast of Central California and the northernmost region of the state (Humboldt Bay) Additionally two more sites (Del Norte and Cape Mendocino) were identified in studies by BOEM and the National Renewable Energy Laboratory (NREL) for potential future OSW development Together development of the initial Call Areas identified by BOEM could support approximately 9 GW of offshore wind development up to 7 GW of which is in the OSW planning area on the Central Coast The development of 7 GW of OSW in the Central Coast OSW planning area would provide roughly 11 of the statersquos current electricity needs (30660 GWh out of 277704 GWh in Californiarsquos 2019 energy mix)9
Floating offshore wind technology which is relatively new has already demonstrated impressive capacity factors of over 50 percent roughly twice that of commercial solar10 The capacity factor of OSW is greater than that of commercial solar because OSW can generate electricity 24 hours a day11 and recent engineering studies project that Californiarsquos floating offshore wind turbines could reach capacity factors of over 70 percent of their maximum theoretical output12
12 OUTLOOK FOR OSW IN CALIFORNIA
The development of OSW energy which has not been featured prominently in Californiarsquos resource planning analyses to date offers several distinct advantages over alternative renewable energy sources Unlike commercial-scale solar power and onshore wind where many of the most productive sites in California have already been developed OSW represents a large and highly scalable resource in California that remains largely untapped Although OSW development is subject to siting concerns such as exclusion zones from the Department of Defense and Marine Protected Areas (MPAs) and entails potential impacts to local fisheries marine mammals and ocean shipping lanes the development of OSW remains relatively unimpeded by the property rights concerns associated with developing onshore resources OSW farms can also be located close to coastal load centers and make use of available transmission capacity eliminating the need to install costly transmission lines to deliver electricity to the California grid
Developing OSW technology in California will require significant capital investment In the US total investment in the offshore wind industry is expected to reach $17 billion by 2025 $108 billion by 2030 and $166 billion by 2035 roughly two-thirds of which will go to the construction industry 25 to the turbine OampM and associated supply chain with much of the remainder
Investment in the offshore wind industry in the US is expected to reach $17 billion by 2025 $108 billion by 2030 and $166 billion by 2035
Economic Impact of Offshore Wind Farm Development on the Central Coast
15
allocated to the transportation industry and ports13
As OSW technology continues to develop it is rapidly becoming cost-competitive with traditional energy sources making floating OSW farms capable of achieving acceptable commercial returns A recent study indicates that including offshore wind in the statersquos energy mix would produce ratepayer savings of approximately $1 to $2 billion by 2040 on a net present value (NPV) basis with floating OSW becoming part of the least-cost portfolio by 203014
Before offshore wind platforms can be constructed suitable ports must be established for staging and assembly of floating turbines onshore Because offshore floating turbines are larger than land-based wind turbines with expected heights exceeding 700 ft turbine blades for OSW are too large to be transported on existing highways or rail lines requiring the assembly of turbines on floating platforms to occur quayside with finished wind turbines delivered by ship directly from the specialized wind port to the offshore site where the moorings and anchors are placed For this reason the specialized wind port is the center for job creation from OSW development Virtually all supply chains that develop to meet the unique requirements of offshore wind originate and terminate at the specialized wind port
This report evaluates the economic impact to San Luis Obispo County and the State of California from the development of one or more OSW farms and the associated port and transmission infrastructure in and around the Morro Bay Call Area The Central California region is ideal for offshore wind development for several reasons
bull Wind speeds are generally strong15 bull The region has existing connections to the statersquos electrical grid bull Much of the coast is outside of national marine sanctuaries where disturbance to the seabed is
prohibitedbull The region is favorably positioned between major population centers with high power demand
in Northern and Southern California
13 ECONOMIC VALUE OF OFFSHORE WIND
When evaluating the regional economic stimulus created by OSW development in San Luis Obispo County it is important to place these values in context with the overall economic value of OSW development for California The overall economic benefit of OSW is captured by transactions between electricity providers and consumers (households and businesses) in Californiarsquos electricity market Consumer benefits in the electricity market are greatest when electricity prices are low Because converting energy to power requires cost the most valuable sources of power in an electricity portfolio are those that deliver electricity to the grid at the lowest cost Indeed for a fixed amount of electricity generation to meet consumer demand economic benefits are maximized when electricity is supplied to consumers at minimum cost
One difficulty in assessing the economic value of renewable energy sources is the distinction between private and social cost The economic value is greatest for an energy portfolio that meets consumer demand at minimum social cost which is the sum of private cost and external cost Private costs reflect actual costs incurred by electricity suppliers for instance the levelized cost
Economic Impact of Offshore Wind Farm Development on the Central Coast
16
of electricity (LCOE) used to evaluate energy investments over time while external costs refer to costs society incurs that are not captured in the electricity market for instance the cost imposed on future generations from GHG emissions today16 For this reason a coal-fired electricity plant may have lower private costs than a floating OSW farm while the wind farm nevertheless has lower social costs a distinction that can be lost when comparing different potential energy sources based strictly on private costs such as the LCOE
Another difficulty in assessing the economic value of renewable energy sources is the distinction between fixed and variable cost In the case of OSW energy substantial fixed costs must be sunk up front to assemble install and connect floating wind turbines to the electricity grid however once this investment has been made the turbines generate electricity at extremely low marginal cost during their entire period of operation A relevant factor that underpins the economic value of a renewable energy project is the LCOE which represents the average cost of electricity generation over the life of the project Because fixed costs are so high to install floating OSW turbines and marginal costs are so low the LCOE for OSW is highly sensitive to the duration in which a wind turbine can be deployed Minimizing the LCOE from an OSW project involves maximizing the time a wind turbine is operating on the water providing electricity at low marginal cost to the grid
Economic values considered in this report focus on the regional economic impact of a given level of project spending on job creation and economic output in San Luis Obispo County Specifically the values calculated in this report provide a mapping from a given amount of direct investment in capital and labor in the county to the economic output and jobs that result from regional supply chain development and the affiliated increase in sales and output that spill across other regional industries from the spending of workers and business who derive income from the project (ie the economic ldquomultiplierrdquo)
The regional economic benefit to developing OSW farms in San Luis Obispo County represents only the value captured by the regional supply chain for a given amount of direct spending on OSW The proper interpretation of the results is the projected economic value realized by San Luis Obispo County from a given level of project spending (private cost) rather than the overall economic benefit that results from minimizing the social costs of electricity generation
To understand this distinction consider the effect of increasing the distance between OSW farms off the coast of Central California and the specialized wind port that serves them As the distance increases between the OSW farms and the specialized wind port the LCOE rises due to increased transportation and logistical costs of wind turbine installation and repair reducing time on the water for wind turbines to operate and resulting in higher electricity prices The overall economic value of the OSW project decreases over distance from the specialized wind port compounded by an increase in the external costs of carbon emissions in the transportation sector However because private costs are higher for OSW projects that involve greater distances to the specialized wind port locating OSW farms farther away from the port raises the economic value of the project to the regional economy for instance by adding jobs in the water transportation industry Put differently the economic value to the regional economy will appear larger as the distance increases between the OSW farms and the port whereas the overall economic value of the OSW project is larger when OSW
Economic Impact of Offshore Wind Farm Development on the Central Coast
17
farms are situated in closer proximity to the specialized wind ports
While developing projects with lower LCOE and lower external costs from pollution in the transportation sector provide the greatest overall economic value projects with higher LCOE provide greater stimulus to the regional economy Thus the proper interpretation of the regional economic values calculated in this report are the impacts to San Luis Obispo County from a fixed level of project spending
01 Wind speeds are generally strong
02 The region has existing connections to the statersquos electrical grid
03 Much of the coast is outside of national marine sanctuaries where disturbance to the seabed is prohibited
04 The region is favorably positioned between major population centers with high power demand in Northern and Southern California
THE CENTRAL CALIFORNIA REGION IS IDEAL FOR OFFSHORE WIND
DEVELOPMENT FOR SEVERAL REASONS
Economic Impact of Offshore Wind Farm Development on the Central Coast
18
SECTION 2
INDUSTRY BACKGROUND AND REQUIREMENTS
Economic Impact of Offshore Wind Farm Development on the Central Coast
19
2 INDUSTRY BACKGROUND AND REQUIREMENTS
Interest is growing for the development of OSW in California as large-scale adoption of renewable energy is needed to substitute for fossil fuel-generated electricity under the statersquos ambitious climate goals
Along the coastline of California the ocean floor slopes steeply downward into deep waters requiring the use of floating platforms for OSW as opposed to platforms fixed to the ocean floor like those currently used in shallower waters along the East Coast Recent advances in floating platform technologies have greatly reduced the cost of developing floating OSW farms making it possible to build OSW to scale in California Floating OSW farms have the potential to provide California with a reliable source of renewable energy that can deliver electricity to Californiarsquos homes and business during times of peak energy demand while operating largely at distances beyond the sightlines of coastal property (See Figure 21)
According to NREL Californiarsquos offshore technical resource capacity is about 112 GW17 BOEM has initiated plans to develop OSW power off the coast of California in a recent call for information from companies interested in purchasing commercial wind energy leases in federal waters off the coast of Central and Northern California Specifically the Call Areas for BOEM identify three potential OSW sites off the coast of California Humboldt Bay Morro Bay and Diablo Canyon The Central California Call Area offers a combined electricity generation capacity of 7 GW for OSW
Developing OSW energy on the Central Coast to its full potential will require cooperation from the US Department of Defense (DOD) Following the announcement of the BOEM Call Areas in 2018 DOD assessments found OSW development in the region to be incompatible with the wide array of critical DOD operations citing significant mission activities in the Diablo Canyon Call Area18
Figure 21 Schematic of a Floating Offshore Wind Farm
Source BOEM California Offshore Renewable Energy Fact Sheet February 22 2017
Economic Impact of Offshore Wind Farm Development on the Central Coast
20
Subsequently a group comprised of DOD BOEM NOAAs Office of National Marine Sanctuaries Congressman Carbajal and Congressman Panetta has focused on expanding the OSW planning area by considering potential development areas proximate to and within the Morro Bay Call Area that may be compatible with DOD operations While the Diablo Canyon Call Area may not be developed due to other ocean use and environmental conflicts there is sufficient sea space in and around the Morro Bay Call Area to support 7 GW of OSW
Figure 22 shows the Morro Bay and Diablo Canyon Call Areas initiated by BOEM and Figure 23 shows a proposed modification to the Morro Bay planning area that would accommodate 7 GW of OSW development in and around the Morro Bay Call Area19
Developing up to 7 GW of OSW farm capacity in and around the Morro Bay Call Area has the advantage of making use of available grid interconnections in San Luis Obispo County through the existing 500-kV transmission lines at Diablo Canyon and Morro Bay However realizing the renewable energy potential for floating OSW energy development in and around the Morro Bay Call Area represents a massive undertaking for Central California communities
Figure 22 The Morro Bay and Diablo Canyon Call Areas
Source BOEM California Activities httpswwwboemgovcalifornia
Economic Impact of Offshore Wind Farm Development on the Central Coast
21
The deployment of floating OSW platforms presents complex manufacturing logistical and maintenance challenges Making OSW a reality for California will require development of an extensive regional supply chain much of which has the potential to be centered in San Luis Obispo County To ensure that critical elements of this supply chain take root in California providing jobs and income for Central Coast residents (as opposed to outsourcing these needs to other regions) the development of OSW farms will require major upgrades to Central Californiarsquos infrastructure for ports transportation and transmission
Three elements are imperative for success in OSW development
bull the availability of a specialized wind port and port infrastructurebull ensuring enough transmission capacity and interconnection to the electric gridbull access to a reliable well-trained workforce for wind farm construction and OampM
The payoff to the San Luis Obispo County region for developing a regional supply chain for OSW power is the creation of a green energy sector that can provide head-of-household jobs health and retirement benefits and career opportunities for workers in the green economy including the potential to deliver jobs to workers from disadvantaged communities20
Figure 23 Proposed Expansion to the Morro Bay Call Area
Source American Wind Energy Association California and Offshore Wind California 2020
Economic Impact of Offshore Wind Farm Development on the Central Coast
22
01 The availability of a regional port and port infrastructure
02 Ensuring enough transmission capacity and interconnection to the electric grid
03 Access to a reliable well-trained workforce for wind farm construction and OampM
THREE ELEMENTS ARE IMPERATIVE FOR SUCCESS IN OSW
DEVELOPMENT
The payoff to the San Luis Obispo County region for developing a regional supply chain for OSW power is the creation of a green energy sector that can provide head-of-household jobs health and retirement benefits and career opportunities for workers in the green economy including the potential to deliver jobs to workers from disadvantaged communities
Economic Impact of Offshore Wind Farm Development on the Central Coast
23
21 TECHNOLOGY DESCRIPTION
California differs from the Northeast US in that its deep coastal waters require a different type of offshore wind technology floating platforms for wind turbines Floating platform technology for OSW has been successfully demonstrated in multiple jurisdictions worldwide with larger-scale commercial projects being planned and contracted for deployment in the near future While the cost of floating offshore wind today remains higher than the fixed-bottom offshore wind that prevails on the East Coast the technology is now well understood and the cost of OSW power is expected to decline rapidly with the scale of deployment as commercialization continues
Each floating offshore wind system consists of a commercially available floating support structure and a large offshore wind turbine generator The proposed plant located approximately 45 km offshore is expected to have between 70 and 100 floating windmills
Floating OSW technology requires no piling making it well-suited for deep and variable seabed conditions Each floating windmill is attached by anchor to the sea floor as seen in Figure 24
Floating OSW technology has other benefits over fixed OSW foundations as well Floating wind turbines can be larger anchored in deeper water towed back to shore for major repairs and upgrades and safer for ground risk shore-side assembly and deployment further offshore compared to fixed OSW foundations22
There are four basic components of an OSW turbine the tower nacelle hub and blades These components (OSW turbines to towers and floating platforms) are all delivered by marine vessels for final assembly in bays within the specialized wind port Before any components are attached to
Figure 24 Floating OSW
Source Lou Thomas and Wu (2019)21
Economic Impact of Offshore Wind Farm Development on the Central Coast
24
the floating platform at the specialized wind port the hub is connected to the nacelle and attached to the tower which is typically composed of three or four different segments The bottom segment of the tower is attached to the floating platform the remaining tower segments are stacked on top of the structure and then the assembled nacelle-hub is attached to the top of the tower by a crane where the turbine blades are attached to complete the assembly of the OSW turbine23 Once the turbine is attached to the floating platform as a finished OSW turbine the floating platform is connected to a ship and transported to the offshore windfarm location (see Figure 25) where it is installed to anchors and moorings on the offshore site24
Each OSW farm which is projected to have a nameplate capacity of 1 GW is composed of arrays of individual OSW turbines The capacity of an individual OSW turbine to generate power is currently in the range of 3 MW to 15 MW For the baseline 1 GW OSW farm considered in this report a 1 GW OSW farm consists of 100 individual wind turbines each with a 10 MW nameplate capacity
22 OSW POWER HAS A FAVORABLE TIME PROFILE ON THE ELECTRICITY GRID
OSW power on the Central Coast of California (CCC) provides electricity at favorable times Offshore wind power on the CCC peaks each day during evening hours and reaches its maximum potential during spring and summer months of the year This timing profile for power delivery matches favorably with wholesale energy prices on the California Independent System Operator (CAISO) electricity grid Electricity demand is highest during the summer and peaks at around 6 pm in summer months (Wang et al 2019)25 In contrast solar and onshore wind generation peak at times of relatively low electricity demand creating problems for reliability and functionality of the grid Solar power production peaks around noon whereas land-based wind peaks around midnight
Figure 25 Transportation of an Assembled OSW Turbine
Source Principle Power 2011
Economic Impact of Offshore Wind Farm Development on the Central Coast
25
The timing of peak offshore wind power production aligns well in a portfolio of energy sources that provide peak power at different times Developing a reliable electricity portfolio by combining renewable sources smooths out deliveries on the grid relaxing supply constraints in a system with limited storage capability26
Combining OSW with onshore wind and solar power results in a more reliable delivery profile for renewable energy that better matches with electricity demand Superior matching displaces reliance on carbon-intensive natural gas (ldquopeakerrdquo) plants during evening hours and as fossil-fuel based electricity sources are phased out over time in California reduces reliance on costly grid-scale lithium-ion battery storage
Figure 26 demonstrates the hourly value of OSW in a renewable energy portfolio The value of electricity generated at different times is represented by the RESOLVE price calculated by Energy and Environmental Economics (E3) The RESOLVE model estimates the optimal price of alternative energy solutions during each hour of the day taking into account hourly operations of alternative energy solutions during each hour of the day the intraday variability of load and renewable generation planning reserve requirements and an annual greenhouse gas constraint that the whole system must operate at a level of emissions below the maximum emission cap27
23 PORT INFRASTRUCTURE REQUIREMENTS
The large size of modern OSW turbines limits the transport of finished products over land As a result the final assembly of OSW towers which involves attaching turbine blades to floaters must
Figure 26 The Diurnal Pattern of Offshore Wind Power and Energy Prices
Source Energy and Environmental Economics Inc 2019
Economic Impact of Offshore Wind Farm Development on the Central Coast
26
occur at a waterfront location with a large amount of acreage a specialized wind port facility and quays that have been reinforced to withstand heavy loads
The development of a regional supply chain for OSW in this report assumes that suitable specialized wind port facilities will be available for manufacturing and assembly of OSW turbines Two alternatives appear potentially viable for OSW development on the Central Coast
bull construction of a specialized wind port in San Luis Obispobull assembly at other ports in California such as Oxnard (Port Of Hueneme) Long Beach San
Diego and Eureka where the Port of Humboldt Bay has been proposed to be refurbished as a specialized wind port for the assembly of OSW turbines28
Because the existing capacity for floater assembly is lacking on the West Coast the manufacturing of floating foundations for OSW turbines will likely occur outside of the US The role of the specialized wind port is to conduct final assembly of the wind turbine in a staging area situated as near as possible to the OSW farm to economize on transportation cost and logistical issues during installation repair and decommissioning of OSW farms Based on the experience of OSW farms in the UK the tower pieces are imported from Denmark or Spain with final assembly occurring on-site in reinforced quays For OSW farm development on the Central Coast the height of some components limits the location of a specialized wind port to those without height limitations from features such as bridges which precludes use of the Port of Oakland due to clearance limits on the Bay Bridge and Golden Gate Bridge
As the distance increases between the OSW farm and the specialized wind port where final assembly occurs the levelized cost of energy (LCOE) rises due to the additional transport cost Greater distances between OSW farms and the specialized wind port makes projects less practical for industry partners seeking to provide zero-carbon electricity to consumers at minimal cost The LCOE rises over distance from the port not only due to transportation costs and the related logistical issues associated with scheduling shipping lanes but also due to the high opportunity cost of removing OSW turbines from the water for repair Repair of OSW turbines with existing technology requires removing floating OSW structures from offshore mooring and towing the structures into the specialized wind port which requires scheduling shipping lanes and arranging transport during periods of relatively calm seas
Given the high fixed cost and low variable cost of generating electricity from OSW the economics of OSW favor keeping OSW turbines on the water and connected to the grid for as long a period as possible to recover the sunk cost of installing them Distance from the port reduces the number of days OSW turbines are on the water which erodes the economic benefit to California from developing OSW farms
The Massachusetts Clean Energy Center (MassCEC) conducted a detailed assessment of port construction requirements for OSW in 2017 including the potential for both turbine and foundation manufacturing A major finding of the study was that the sheer distance required to transport OSW components from overseas is likely to incentivize investment in US manufacturing facilities29 At the present time it is anticipated that both floating platforms and turbines for OSW will be shipped
Economic Impact of Offshore Wind Farm Development on the Central Coast
27
to California from overseas likely from South Korea or China then received at a specialized wind port for final assembly and installation on an OSW farm
The specialized wind port where assembly occurs must have protected waters and no overhead obstruction for fully assembled turbines to be towed out standing to the offshore site (see Figure 27) The sheer scale of OSW turbines imposes land requirements for manufacturing to take place in the specialized wind port Providing throughput of 500 MW per year of OSW at the port with the 10-15 MW turbines available today will require about 50 acres of land for movement storage and assembly
In 2016 BOEM commissioned a study on the suitability of various California ports for OSW assembly The study identified Port Of Hueneme as the most suitable existing port for OSW assembly followed by Long Beach and San Diego30 However as Collier (2017) reports all of the recommended ports suitable for OSW assembly are constrained by available land adjacent to the port that would be necessary for manufacturing31 In the case of Port Of Hueneme land constraints limit the ability of the port to take on new manufacturing without making use of land on the existing Navy yard and logistical problems arranging transportation through the Santa Barbara Channel hamper its ability to serve as a specialized wind port for multiple large-scale OSW farms off the Central Coast
Apart from making use of existing ports another possibility is to develop one or more specialized ports for assembly of OSW turbines in California Humboldt Bay in Eureka has a deep-water harbor
Figure 27 Turbine Assembly and Assembled Turbine in Port
Source Principle Power 2011
Economic Impact of Offshore Wind Farm Development on the Central Coast
28
and vast expanses of vacant industrial land that can be developed for OSW turbine (and even floater) assembly however the use of Humboldt Bay for OSW development faces major logistical challenges for land transport and the region lacks grid interconnection as a hub for OSW In contrast the Central California area offers reliable grid interconnection at Morro Bay Power Plant (MBPP) and Diablo Canyon Power Plant (DCPP) but lacks a deep-water port
While it may be possible to serve floating OSW farms in Central California from Port Of Hueneme or an expanded port facility in Humboldt Bay the economic practicality of installing and maintaining OSW farms from distant ports will require a reliability study Given the need to maintain OSW turbines on the water and keep them connected to the grid to recover the significant fixed costs of OSW development further study is needed to model the ability to service OSW farms from these more distant ports The economic viability of serving floating OSW farms from distant ports depends on the repair cycle for OSW turbines including the probability that failed systems can be scheduled for service quickly under port capacity logistic and weather constraints
DCPP decommissioning makes available a potentially suitable site to develop a specialized port facility for OSW The benefits of developing a specialized wind port for OSW on the DCPP property include
bull site availabilitybull potential for brownfield developmentbull a local revenue source from port fees and land improvementsbull reduced accident risk from the proposed DCPP decommissioning
A specialized wind port at DCPP would facilitate removal of DCPP decommissioning material by sea instead of by road A recent UCLA Transportation Risk Analysis finds that barging involves lower transportation risk (ie accidents injuries fatalities) than trucking and rail transport during the period of DCPP decommissioning Specifically combining barge transport for the initial leg of the route with trucking and rail for subsequent legs reduces fatality risks by over 40 percent and injury risk by 32 percent32
In terms of the present study the center for job creation and regional economic stimulus from OSW is at the ports A port facility provides a coordination point in the supply chain for manufacturing assembly transportation and offshore installation of OSW turbines as well as a maintenance yard for periodic repair and ultimately for disassembly and decommissioning During the 25-year operating period of the OSW farm the port provides facilities for turbine repair stimulating the regional supply chain for manufactured components and support for OampM staff Some turbine components can be transported by land which creates incentives for regional supply chain development for a wide range of industrial partsrsquo manufacturers in California and even nationwide However because the sheer size of offshore turbines is so large that they must be transported by water and because connecting the blades to tower sections and floating foundations requires final assembly to take place in reinforced quays the regional supply chains for OSW originate and terminate at the port
Economic Impact of Offshore Wind Farm Development on the Central Coast
29
24 TRANSMISSION INFRASTRUCTURE REQUIREMENTS
Compared with other renewable technologies OSW delivers power directly to coastal load centers where electricity is needed most Much of the existing transmission infrastructure in California was developed during the time of coastal power plants which now have been either decommissioned or slated for retirement The San Onofre Nuclear Generating Station was shut down in 2013 and is currently being decommissioned
In San Luis Obispo County the 650 MW Morro Bay Power Plant (MBPP) closed in 2014 leaving behind valuable transmission infrastructure The retirement of the Diablo Canyon Power Plant (DCPP) in 2025 which has a nameplate capacity of 2256 MW and generated 16163 GWh in 2019 for the California electricity grid33 will free up an additional 6 GW of transmission capacity Utilizing the combined 7 GW transmission capacity at DCPP and MBPP as interconnection points for OSW power reduces the cost of providing electricity on the grid
The existing PGampE transmission infrastructure that connects DCPP and MBPP to the wholesale electricity grid represents a highly valuable economic asset that can be repositioned to receive electricity generated from OSW in Central California The current DCPP transmission infrastructure is comprised of three 500-kilovolt (kV) high voltage direct current transmission lines that will become available for alternative use after closure of DCPP in 2025 The high cost of installing new electricity transmission lines creates an economic opportunity in San Luis Obispo County to repurpose the existing infrastructure for electricity transmission from OSW
For comparison development of a Northern California Call Area specialized wind port in Humboldt Bay will require new electricity transmission infrastructure to connect OSW power generation to the Bay Area with 500 kV transmission lines The estimated cost of installing transmission infrastructure to convey electricity to the grid for the more limited 1836 GW OSW development planned in the region is in the range of $17 billion to $3 billion depending on overland or subsea transmission options34 These costs are roughly in line with the projected cost of other electricity transmission projects in the US For example the projected construction cost for a single 500 kV direct current transmission line to deliver up to 3 GW of energy from Wyoming to the Eldorado Valley in Nevada was $35 billion in April 2013 an average cost of $42 million per mile over the length of the proposed 835-mile transmission line35 The existing transmission structure connecting DCPP to the electricity grid already has three 500 kV direct current transmission lines in place
The existing PGampE transmission infrastructure that connects DCPP and MBPP to the wholesale electricity grid represents a highly valuable economic asset
Economic Impact of Offshore Wind Farm Development on the Central Coast
30
25 REGIONAL SUPPLY CHAIN DEVELOPMENT
The ability of San Luis Obispo County to support the development of an OSW supply chain will greatly affect the regional economic impact of OSW development Simply put the economic impacts of OSW are larger for the region when the OSW industry derives a greater share of employment from the region as local workers who receive paychecks from OSW projects in turn spend their dollars at local businesses in the community
The establishment of a California-based OSW supply chain is an important factor in maximizing economic values derived in the State and San Luis Obispo County regions Underpinning the need for regional supply chain development are the logistics for OSW development which involves the delivery of the extremely large component parts required for turbine assembly into specialized wind ports Due to the significant costs of long-distance ocean transit the central hub for supply chain development will occur around the specialized wind port where OSW turbines are assembled36
In California the initial development of OSW projects is likely to depend on floating foundations imported from abroad with development of a regional supply chain needed for turbine assembly and for smaller machine components that can be manufactured domestically For example the foundations for California projects are likely to be manufactured in China South Korea or Japan due to past investment in developing offshore wind manufacturing capacity with a regional supply chain needed only for the final assembly of turbines that will take place in regional California ports According to a recent UC Berkeley study about 60 percent of all equipment in US wind farms is currently manufactured domestically with equipment suppliers such as GE Siemens and Vestas having manufacturing facilities in South Carolina Iowa and Kansas and Colorado respectively while generators are sourced from Europe or Asia37
In East Asia and Europe governments and wind turbine manufacturers have worked aggressively in recent years to develop complete supply chains for OSW including factories and other facilities for manufacturing turbines blades towers and floating foundations in high-tech clusters developed in specialized wind ports Several states on the East Coast including Connecticut Massachusetts Rhode Island Maryland and South Carolina have taken steps in industrial planning to create manufacturing hubs for OSW although the West Coast has lagged behind in light of the only recent advances in floating OSW technology over fixed platform technologies that can be used in the relatively shallow waters along the East Coast
Deploying commercial-scale floating wind farms will require collaboration between a wide range of occupations including skilled workers (pile drivers divers millwrights plumbers pipefitters welders cutters solderers brazers carpenters crane operators electrical technicians health and safety specialists) engineers (electrical environmental mechanical marine research subsea structure design) various dock and marine laborers vessel crews plant managers sales representatives lawyers and administrative marketing and communications professionals
At least in the initial phases of OSW development in California OSW foundations and wind turbines are likely to be transported from manufacturing facilities in Pacific Rim countries to one or more specialized wind port facilities in California where wind turbines will be attached to floaters and assembled in quays then barged to offshore sites to be anchored and connected to the electrical
Economic Impact of Offshore Wind Farm Development on the Central Coast
31
grid Once the turbines are installed and running employment in the industry will then transition to an operations and maintenance (OampM) phase that will create additional jobs for regular inspection and repair OampM jobs will largely be composed of environmental specialists vessel crews and engineers augmented by skilled workers crane operators and installation workers at the port facility during times when repair and maintenance is needed
Over a longer horizon it is possible that OSW investment in specialized wind ports for assembly of commercial-scale floating wind farms leads to development of expertise in building floating foundations A regional manufacturing facility for assembling floating OSW foundations would greatly reduce transportation and logistical costs However the analysis in this report does not consider the economic value of foundation manufacturing in California because intermediate term options exist to economize on shipping costs by developing this manufacturing expertise elsewhere on the West Coast for instance the Port of Seattle
Several factors affect the level of regional supply chain development for assembling OSW turbines in San Luis Obispo County
bull the existing industrial basebull local content requirementsbull skills of the workforcebull the timing of development
The existing industrial base in the region is important for the ability to source electrical components and other aspects of turbine assembly from local suppliers in California In the case of OSW the project would build on the existing industrial base in the green energy sector of San Luis Obispo County and neighboring Monterey County creating synergies among small businesses construction and electrical workers involved in the construction and operation of the commercial solar farms in these counties providing an immediate source of labor and electrical components that can transition to servicing OSW farms Santa Barbara County has existing workers with experience operating on offshore oil and gas platforms which facilitates the transition of workers in the region to new employment opportunities in the offshore installation component of the OSW industry such as setting anchors and moorings and offshore turbine installation
Local content requirements and government incentives can also be used to stimulate development of a regional supply chain for OSW Under a local content requirement agreements can specify that a minimum share of local employment be maintained For fabricated components that can be locally sourced government investment and financial incentives can accelerate the pace of regional supply chain development While there are legal restrictions to imposing local procurement and hiring requirements in California under the Commerce Clause of the US Constitution there are nevertheless numerous policy tools available to increase local hiring For example Community Benefits Agreements (CBA) and Community Workforce Agreements (CWA) can be used by developers for infrastructure projects such as port construction and improvement The use of local business enterprise (LBE) and disadvantaged business enterprise (DBE) provisions can also result in increased local procurement and hiring38
Economic Impact of Offshore Wind Farm Development on the Central Coast
32
The relevant skills of the local workforce are also important for development of the regional supply chain for OSW San Luis Obispo County is relatively small in terms of population but offers proportioned access for its size to a skilled workforce of construction and electrical workers both due to the recent construction of commercial solar plants in the California Valley and active commercial and residential real estate sectors The region also has businesses engaged in fiberglass manufacturing and marine vessel operators that have the skills needed to find employment in the OSW industry in the event that it develops in the county
Finally the size and timing of supply chain development is important For a regional supply chain to develop manufacturers must specialize in providing products that meet the needs of the industry which in turn requires assurance that consistent demand will materialize for these products before permanent employees are hired and sunk costs are incurred to grow the industry In the case of OSW development investment decisions will be facilitated if regional manufacturers capable of providing labor components and technical expertise to OSW farms have a clear expectation for sequential development of 6-7 GW of OSW farms staged over multiple years relative to the case of a single 1 GW wind farm The timing of OSW projects is also important if multiple wind farms enter production in Central California as a steady flow of projects over time provides stronger incentives for regional supply chain development
26 TIMING OF PROPOSED WIND FARM DEVELOPMENT
Staging and coordinated development of OSW is essential For example a single port harbor facility will become overburdened with multiple projects under construction at the same time The maximum throughput for each quay in the port is one 10 MW wind turbine per week and the wind turbine must be moved before work can begin on the subsequent turbine Therefore developers will need to consider multiple facility strategies and secure their options well ahead of time
Figure 28 Wind Turbine Development Timeline
Economic Impact of Offshore Wind Farm Development on the Central Coast
33
Figure 28 shows the timeline for OSW farm development Following a projectrsquos commissioning and turbine assembly phases the operation and maintenance (OampM) period of OSW will also require ports for transportation of personnel and components (for offshore repairs and upgrades) and for receiving OSW turbines towed back to the port for repair
Given the seasonal logistics of installing OSW turbines throughput at the specialized wind port is expected to be approximately 500 MW per year during the assembly period The assembly period considered in this report uses a more conservative time frame of 3 years for each 1 GW OSW farm The Operations amp Maintenance (OampM) period for each 1 GW OSW farm is then 25 years followed by a decommissioning period of 3 years The spending pattern for a single 1 GW OSW farm is punctuated by two spikes in regional employment the first during the 3-year assembly phase of the OSW farm and a subsequent and larger spike during the 3-year decommissioning phase in which OSW turbines are taken back to the port and disassembled
For a specialized wind port to support a 3 GW field of wind farms the assembly period is prolonged from 3 years to 9 years by staging OSW turbine assembly in successive 3-year periods for each 1 GW OSW farms Accordingly for a specialized wind port to support a 7 GW field of OSW farms the assembly period is prolonged from 3 years to 21 years It is possible that this period would be shortened by bringing OSW turbines to the Central Coast from other nearby ports that develop the manufacturing capacity for OSW andor by floating fully assembled structures into place from ports in Asia
After OSW turbines are assembled and installed in the ocean the specialized wind port conducts maintenance and repair operations for up to 7 GW of OSW during the OampM period for the projects At a failure rate of once every 25 years for 10 MW wind turbines the specialized wind port would need to accommodate the repair of approximately 28 wind turbines per year to support a 7 GW field of OSW farms
27 EMPLOYMENT AND OUTPUT DEMOGRAPHICS IN SAN LUIS OBISPO COUNTY
As of 2019 San Luis Obispo County has a population of 283111 175 of whom are under the age of 18 209 over the age of 65 and 592 veterans39 From 2011 to 2016 the San Luis Obispo County population grew 3840
Educational attainment in San Luis Obispo County (70) is above the statewide average (62) and national average (59) Two out of 5 residents in the county have a bachelorrsquos degree or higher San Luis Obispo County is predominantly white (69) with the second largest ethnicity being Hispanic or Latino at 2241
The San Luis Obispo County labor market supports 178476 total jobs In 2019 employment in the county was 208 farm jobs 8469 private nonfarm jobs and 1323 public sector jobs including state and local government employment and the military42
The average earnings level per worker in the county is $56409 which is lower than both the state and national averages of $78217 and $66029 respectively43 Figure 29 compares the income
Economic Impact of Offshore Wind Farm Development on the Central Coast
34
distribution in San Luis Obispo County compared to California and the US San Luis Obispo County workers are more likely to have medium and medium-high paying jobs in the $35000 to $149000 range than workers in the rest of California and the US but are less likely to have jobs of $150000 or more
In the past 10 years the county has seen significant job growth Figure 210 illustrates the total number of jobs in the county versus the cumulative job growth rate from 2010
Overall about 30000 additional jobs were created in San Luis Obispo County representing a total 21 growth rate and a 191 annual growth rate over the period This figure is considerably larger than the US total over the period (18) although smaller than that of California (25)44 The strong job growth in San Luis Obispo County has led to comparatively low levels of unemployment with an unemployment rate of 67 in December 202045 relative to the state average of 946
The greatest portion of jobs in San Luis Obispo County are in the tourism hospitality and recreation education and knowledge creation and healthcare industries which together make up 41 or 50000 jobs Since 2010 the information and communication technologies industry experienced the greatest growth (51) followed by the building and design industry (41) and the defense aerospace and transportation manufacturing industries (37) These rapidly growing industries provide the mid- to high-wage job growth in the county with average wages ranging from $59069 to $8188047
Figure 29 Income Distribution in San Luis Obispo County Relative to State and National
Economic Impact of Offshore Wind Farm Development on the Central Coast
35
Gross domestic product (GDP) in San Luis Obispo County was $191 billion in 2019 with GDP per capita of $6734048 Figure 211 shows the GDP growth rate in San Luis Obispo County over the last decade Over the period of 2010 to 2019 San Luis Obispo County real GDP growth was 2745 exceeding the growth rate in national real GDP of 2239 but lagging behind the real GDP growth rate of 3615 for California over the period49
Figure 210 10 Year Job Growth in San Luis Obispo
Figure 211 GDP Growth Rate in San Luis Obispo County California and the US
Economic Impact of Offshore Wind Farm Development on the Central Coast
36
SECTION 3
METHODS AND SCOPE
Economic Impact of Offshore Wind Farm Development on the Central Coast
37
3 METHODS AND SCOPE
31 SCOPE OF THE STUDY
The regional economic benefits calculated in this report are predicated on the development of a specialized wind port in San Luis Obispo County to provide service for up to 7 GW in OSW capacity in and around the Morro Bay Call Area In the event that a specialized wind port for OSW assembly is not constructed in San Luis Obispo County the regional economic benefit would instead materialize in whichever county provides the specialized wind port
At the State of California level the value of OSW development combined across all counties will be similar to the value reported here for the state-level impact with one important caveat If the specialized wind port is located farther away from the OSW farms than a neighboring county such as Monterey or Santa Barbara mdash for instance if a specialized wind port is developed in Humboldt Bay as a single hub for OSW assembly in California mdash then additional project cost would be required for water transportation (eg labor and fuel) raising direct spending at the more distant specialized wind port relative to the case considered here for a port in San Luis Obispo County The resulting increase in direct project spending would result in greater job creation and larger regional economic benefits for the more distant county in the transportation industry however because the social cost of OSW increases with distance from the specialized wind port both in terms of private costs and external costs incurred during water transportation50 locating the specialized wind port farther from the OSW field results in lower economic benefits to California Therefore using values from regional economic models to make such a comparison would be misleading
This report considers two phases of offshore wind (OSW) development off the Central Coast
1 An initial planning period that involves construction of a specialized wind port in San Luis Obispo County
2 OSW farm development with staged assembly of up to 7 GW capacity of OSW
For both phases the regional economic value captured in San Luis Obispo County is conditional on construction of a specialized wind port in the county either on the DCPP property or elsewhere in the county
If for example a specialized wind port was located on the existing DCPP property the specialized wind port provides a conduit for job creation in San Luis Obispo County The indirect benefits that would occur in the regional economy from the influx of new jobs at the port would extend to other counties in California for instance through supply chain development to vendors contractors and component manufacturers in Santa Barbara County Ventura County Monterey County and Kern County The indirect purchases stimulated in different counties in California is accounted for in the model however because the regional supply chains for OSW projects likely will extend across state borders the development of OSW in Central California will provide additional economic value for neighboring states in a manner that falls outside the lens of the model
Workers employed at a specialized wind port in San Luis Obispo County will spend much of their
Economic Impact of Offshore Wind Farm Development on the Central Coast
38
disposable income making induced purchases such as food retail items and restaurant meals at establishments near their homes The regional economic model matches employment at the specialized wind port to the available workforce in San Luis Obispo County which implicitly assumes that available workers in San Luis Obispo County are employed at the specialized wind port before jobs are offered to workers outside the county Thus the regional economic value for San Luis Obispo County will attribute a greater share of induced spending by workers to establishments in San Luis Obispo County than if these workers commute to work from residences across county lines Given the proximity between DCPP and nearby population centers in Northern Santa Barbara County such as Santa Maria and Orcutt a share of the regional economic value attributed to San Luis Obispo County in this report will materialize in Santa Barbara County for workers commuting across county lines
The model used to calculate regional economic benefits in this report matches workers employed in San Luis Obispo County to the available workforce in San Luis Obispo County Specifically the model assigns jobs in San Luis Obispo to workers in San Luis Obispo if the labor force exists in the county to meet the job requirements and only reaches outside the county for workers when the industry providing the labor service no longer has available workers in the county to perform the task In practice workers from outside the county may outcompete workers in the county for jobs (eg by being willing to take the job for a lower wage or by having superior skills) in a manner that is not accounted for in the regional model To the extent that workers commuting across county lines compete intensively for these jobs the model will over-attribute induced spending of workers to San Luis Obispo County from household purchases that occur in the neighboring counties where commuting workers reside
311 SPECIALIZED WIND PORT
The scope of the analysis encompasses the value of the regional output and employment effect resulting from the development and use of a specialized port in San Luis Obispo County for the assembly maintenance and repair of OSW farms Because a specialized wind port is necessary to receive the regional economic value from OSW development and San Luis Obispo County does not currently have one it is necessary to model the construction of a specialized wind port jointly with the development of large-scale OSW projects in the region
The goal of the present study is to calculate the regional economic benefit to San Luis Obispo County from the development of 3 and 7 GW OSW capacity in and around the Morro Bay Call Area The model does not encompass the full economic value of constructing a specialized wind port in San Luis Obispo County which might be used for the movement of other goods apart from OSW components Therefore this report considers solely the development of a specialized wind port used only for staging the assembly installation and repair of OSW Any additional regional economic value that can be generated from a specialized wind port from importing and exporting goods unrelated to OSW is not included in the report The scope of economic benefits considered in this report is conservative because developing a specialized wind port for OSW involves construction costs for elements such as a breakwater that would in turn economize on the cost of
Economic Impact of Offshore Wind Farm Development on the Central Coast
39
expanding the footprint of a specialized wind port beyond the specialized needs required to create a hub for OSW
Construction of a specialized wind port on the DCPP property occurs in the model over the 5-year period of 2024-2028 Constructing a specialized wind port for OSW will require an estimated 1100 construction jobs per year at a total direct cost in the range of between $17 and $25 billion The analysis considers only the direct job requirement of port construction (1100 workers per year) to be sourced locally as it is currently unclear where the materials used to construct the port such as the breakwater and pilings will be sourced Considering only the direct job requirement for constructing a specialized port for OSW in San Luis Obispo County results in a conservative measure of the regional economic benefit as all construction material required to be purchased for port construction is implicitly assumed to be sourced from locations outside of California The total project cost which is substantially larger than the direct labor cost component of the project is included only to calculate the fiscal benefit of sales and use taxes in Section 5 which implies project spending on imported material is designated as a California sales transaction at the point of delivery to the port
312 DEVELOPMENT OF A REPRESENTATIVE 1 GW OSW FARM
The timeline of a representative 1 GW OSW farm has 4 phases planning amp permitting (7 years) assembly (3 years) operations and maintenance (25 years) and sunsetdecommissioning (3 years)
Figure 31 shows the average labor requirement for a 1 GW OSW farm during each phase of development in the case of a sunset period involving decommissioning of the OSW farm
Figure 31 Average Labor Requirement for a 1 GW OSW Farm over the Life of the Plant
Economic Impact of Offshore Wind Farm Development on the Central Coast
40
The planning phase for the first OSW farm occurs over the period 2022-2028 which coincides with the granting of a lease through a BOEM auction and the development of a specialized wind port in San Luis Obispo County both of which must also occur over this time period to realize the regional economic benefits of OSW
The assembly phase considers a 3-year assembly period for each 1 GW OSW farm starting with the first 1 GW wind farm over the period 2029-2031 While OSW turbine assembly in the specialized wind port can potentially occur at a faster pace for instance 500 MW per year (or 2 years per 1 GW OSW farm) a longer 3-year period is considered for each OSW farm to account for the logistics involved in arranging installation around weather events and conducting repairs for multiple OSW farms The assembly phase will tend to be shorter for the first 1 GW OSW farm than for subsequent wind farms because of the need to maintain space in the specialized wind port for turbine repair For development of a field of 7 GW OSW farms the assembly period involves staging the assembly of each 1 GW OSW in successive 3-year periods so that assembly occurs for a total of 21 years for a total of seven 1 GW OSW farms
The OampM phase for each 1 GW OSW farm consists of an operating life of 25 years (the OampM period) following turbine assembly and installation For the first 1 GW OSW farm the OampM period is 2032-2058 and the OampM period is set back by 3 years for each subsequent 1 GW OSW farm due to the staging of assembly in successive 3-year periods at the port
313 DECOMMISSIONING AND RECOMMISSIONING PROVISIONS FOR A 1 GW OSW FARM
The representative 1 GW OSW farm is decommissioned over a 3-year period coinciding with partial OSW farm operation and partial disassembly as OSW turbines are removed from the farm For the initial 1 GW OSW farm decommissioning occurs over the period 2057-2059 For each 1 GW OSW farm installed thereafter the assembly period is pushed back 3 years by staged operations at the port pushing back the sunset period by 3 years for each subsequent 1 GW OSW farm During the sunsetting period each 1 GW OSW farm comes back to port to be disassembled Current requirements for decommissioning involve a 3-year decommissioning period however given the strong economic incentive to maximize the length of time on the water for individual OSW turbines it is likely by 2059 that the period will be shorter for decommissioning (as well as for redeployment in the case of lease renewal)
Decommissioning occurs for each OSW farm after 25 years of operation and is accomplished two ways in the model
bull decommissioning as required by BOEM lease agreementsbull or recommissioning which involves renewing or replacing the lease agreement to maintain 1
GW OSW on the leased area for a subsequent 25-years of operation
The economic return for maintaining wind turbines on the water once the capital expenditure is sunk suggests that streamlined processes will be developed for decommissioning and replacing OSW farms by the end of the initial BOEM lease period
Economic Impact of Offshore Wind Farm Development on the Central Coast
41
In the case of decommissioning the value of a 7 GW field of OSW farms is reduced by removing OSW turbines from the water at the end of each lease agreement Under recommissioning the benefit of a field of 7 GW OSW farms can be measured in perpetuity (ie as a renewable resource) by considering the annual benefit under an integrative lease process designed to keep wind turbines generating electricity and connected to the grid In the case of recommissioning each 1 GW OSW farm is replaced in a single 3-year period rather than modeling separate decommissioning and assembly periods where one 1 GW OSW farm is decommissioned for 3 years before the next 1 GW OSW farm can be assembled
The design life of the wind turbine generator and the floating substructure that supports it coincides with an expected operating life of 25 years for OSW After the 25-year life of an OSW farm either the farm would need to be replaced or the turbines would need to be refurbished to extend the life of the units for another 25 years Under the recommissioning option each 1 GW OSW farm in the field of 7 GW OSW remains in service for electricity production either by remaining in operation or by being replaced by another in an integrative fashion that handles the logistical challenges Under recommissioning the model economizes on what would otherwise be a 6-year transition period (3 years for decommissioning of the initial OSW farm plus 3 years assembly for installing the replacement 1 GW OSW farm) with a single 3-year period that integrates the decommissioning and assembly phases The decrease in time required to replace a 1 GW OSW farm with another at the end of each lease capitalizes on the economic benefit of maintaining wind turbines generating electricity for the grid during the transition given the availability of existing anchors and moorings and other fixed investments at the offshore site that reduce the deployment time for a subsequent OSW farm
The labor requirement for an integrated recommissioning process is taken to be two times the onshore labor required during the initial assembly period (once for disassembly and again for reassembly) plus the labor required to reinstall each windmill to the existing cables and moorings at the offshore site The use of two times the onshore labor component is consistent with recent experience at the WindFloat prototype in Aguccediladoura Portugal in which wind turbines were brought back to shore and removed from the foundations for repair and then the entire structures were reassembled cleaned repainted and installed back into service at the offshore site The recommissioning scenario results in conservative regional economic value relative to the case of a decommissioning period for each 1 GW OSW farm followed by approval and installation of an entirely new 1 GW OSW project through an uncoordinated process as an orchestrated process economizes on direct project spending by combining the two phases into a single 3-year period
The economic value from the recommissioning scenario is conservative because it assumes replacement at the end of the 25-year operating horizon with an identical 1 GW OSW farm To the extent that turbine technology is superior 30 years from now the economic value of a replacement 1 GW OSW farm will be larger than the value considered here in the recommissioning scenario however much of this benefit will be captured by an improved capacity factor of turbines that deliver electricity at a lower LCOE That is the benefit of supplying electricity at lower cost is received in the electricity market and not something that would necessarily affect the regional
Economic Impact of Offshore Wind Farm Development on the Central Coast
42
supply chain and labor market that are the focus of this report The labor market requirement to install a replacement 1 GW OSW farm is taken to be the same as the labor requirement for the representative 1 GW OSW farm today in terms of the number of employees needed at each stage of the process in Figure 31 above The regional economic value is conservative by assuming that in 30 years there will still not be manufacturing capability for floating offshore platforms and turbines in California
It should also be noted that conveying the electricity produced at each 1 GW OSW farm will require grid connection costs to provide interconnection and transmission to Californiarsquos electricity grid The cost of constructing transmission lines for a field of 7 GW OSW farms will be lower to the extent that the suggested project makes use of the existing 500 kV transmission cables that currently connect DCPP to the electricity grid This makes the Central California region highly attractive for OSW energy development Nevertheless substantial additional expenses will be needed to develop offshore spur lines to connect OSW farms to landfall via undersea cables that extend many miles out to sea which will also require a supporting structure of sub-stations and terminals to connect cables at landfall with the existing onshore interconnection and transmission structure that exists at DCPP
32 METHODS
The regional economic impacts calculated from OSW farm development in Central California reflect the ldquoripple effectrdquo of new jobs and economic output that occurs when direct investments in the offshore wind industry complex lead to expansion in the production of upstream supply-chain inputs plus induced spending as new employee households increase local spending (eg grocery stores auto dealerships and restaurants) It should be noted that economic impacts are different from economic viability or profitability Economic impacts reflect expenditures and the extent to which inputs are locally sourced Higher costs (that would reduce economic viability and profit) in fact lead to larger economic impacts
Over time economic impacts can change As installed wind farm capacity in California increases one might expect not only cost-reducing learning effects but also an increase in the local share of input sourcing due to in-state investment in manufacturing specialized OSW inputs To the extent that this type of specialized investment occurs for instance if the ability to manufacture floating foundations for OSW develops somewhere in California then the regional economic impact of OSW farm development on the Central Coast would be greater for the State of California than is captured here
Regional economic impacts are increased by greater project expenditures as well as by a larger share of inputs that are locally sourced in the region Thus regional economic values differ from the overall economic value of a project because greater project expenditures raise total costs of electricity generation harming economic value while providing for greater regional stimulus The regional economic value of OSW farms is usually limited to direct wind farm capital and operations and maintenance (OampM) costs which are recovered through revenues derived from power purchase agreements Port and transmission infrastructure improvements typically are
Economic Impact of Offshore Wind Farm Development on the Central Coast
43
not included in regional economic values for OSW which is why the regional economic benefit is calculated separately for the construction of a specialized wind port in San Luis Obispo County Port infrastructure investments would likely be made by a terminal operator with costs of port construction recovered through various fees paid by users of terminal facilities to the terminal operator Similarly transmission infrastructure costs would likely be incurred by PGampE or another electricity provider with costs recovered by way of transmission access charges (TACs) paid by regional energy consumers
Regional economic models are based on a set of input-output (I-O) production relationships in the county (and neighboring counties) where the investment occurs Final goods such as wind energy are the outputs of the model which requires a variety of input purchases to be made in a variety of upstream markets (supply-chain effects) to construct and operate the OSW farm Upstream market purchases include labor from different industries and the purchase of intermediate goods (eg manufactured parts such as turbine blades manufactured electrical components and raw materials such as concrete and steel) Some of these inputs can be locally sourced while other inputs must be imported from outside the region as is presently the case for both turbines and floating foundations I-O models use economic data on current workers and component manufacturers in affiliated industries at the county level to create a simplified quantitative depiction of the ability to locally source inputs to meet the output requirements of a project thereby capturing regional economic value
This study utilizes the Regional Economic Models Inc (ldquoREMIrdquo) Policy Insight Plus (ldquoPI+rdquo) model to estimate the current and future economic impact of OSW development on San Luis Obispo County and neighboring counties REMI PI+ is a sophisticated economic modeling tool used by public agencies consulting firms nonprofit organizations and local governments to simulate the economic impact of a variety of public and private capital investments including infrastructure development energy projects and military bases
The REMI PI+ model calculates the regional economic impact of OSW development in San Luis Obispo County using data on the local labor requirement to install operate and decommission a field of 1 GW OSW farms at the specialized wind port The REMI PI+ model is a dynamic I-O model that uses this data to determine the current impact of OSW farm development as well as its forward-looking impact given historical changes in the business cycle and the ability of future workers and industry to migrate to the region The results of the model are reported for each county individually
The model provides output that quantifies the economic impact of a certain area of study and for the sake of this report allows results to be segmented on a county-wide basis into the number of jobs created benefit to county GDP and the general tax implications In construction of the model REMI PI+ uses audited data from public agencies such as the US Bureau of Economic Analysis and the US Census Bureau as well as user inputted data to construct its larger model
The resulting estimated impacts from the REMI PI+ model are segmented into direct indirect and induced impacts Direct impacts are directly related to the operations and growth of the base for example a contractor who is hired to help build infrastructure for port expansion Indirect impacts
Economic Impact of Offshore Wind Farm Development on the Central Coast
44
are values related to economic growth in upstream industries catalyzed by spending at the port on OSW for example a regional asphalt provider hired to provide road access to the specialized wind port While the asphalt providerrsquos job is directly attributable to the needs of the port it has no direct impact on port operations and therefore represents an indirect impact
Induced impacts are ripple effects that occur at all points in the supply chain catalyzed by both direct and indirect impacts For example an induced impact from the road expansion project would be an asphalt quarry that hires additional employees to help service the increased demand for asphalt from the road expansion project to serve the port While those jobs are created by the increased asphalt demand due to the infrastructure project to connect an existing road to the port the new employees hired at the asphalt quarry are working neither directly at the port facility nor indirectly on the paving project making the creation of this job an induced impact The majority of induced impacts in the model arise from food retail and housing purchases by workers employed directly and indirectly by OSW
Most input-output models are static meaning that inflation employment and expenditures for example remain constant over time However this report uses the dynamic impact model built into REMI PI+ to project the estimated economic impact of OSW development over time As this is a dynamic impact model projections will be made based off the assumption of business cycle fluctuations reflecting historical trends Estimates will be reported both for San Luis Obispo County as well as for the State of California
Finally it should be noted that the regional economic benefits calculated here are gross impacts of the OSW project rather than net impacts and as such may overstate actual benefits as an all-or-nothing comparison That is economic impacts to the region not immediately deriving from the construction and operation of an offshore wind facility are omitted in the report even though the use of regional resources to provide inputs for the OSW project claims these resources from other alternative projects the region could pursue For example expenditure on a wind farm in California may displace expenditures on expansion of a commercial solar power plant A net economic impact assessment of the value of OSW in relation to other potential investments in San Luis Obispo County would need to consider the foregone value of displaced economic activity
The economic values calculated using the REMI PI+ model are presented both in terms of (undiscounted) lifetime job and output impacts and in terms of annual average impacts over various phases of project development Undiscounted lifetime job impacts are calculated by multiplying the operational period of the project by the estimated number of annual operational period jobs and then adding them together into a measure of the total full-time equivalent (FTE) jobs created by the project For example a project that provides 100 full-time jobs each year for a 10-year period provides a total economic benefit to the region of 1000 FTE jobs and an annual average impact of 100 full-time jobs per year
Economic Impact of Offshore Wind Farm Development on the Central Coast
45
SECTION 4
RESULTS
Economic Impact of Offshore Wind Farm Development on the Central Coast
46
4 RESULTS
The regional economic benefit to San Luis Obispo County from OSW development is predicated on the ability to serve floating OSW turbines in and around the Morro Bay Call Area from a specialized wind port The specialized wind port serves as a hub for the assembly maintenance repair and eventually the decommissioning of floating OSW turbines
The economic benefits are calculated in this report for an initial period of port construction Port construction involves direct employment of an average of 1100 workers per year for 5 years at a total cost of between $17 billion and $25 billion Much of the material used to construct the port is projected to be sourced from regions outside the county and delivered to the port by marine vessel For the calculation of regional economic benefits the conservative assumption is made that none of the material is sourced from California which implies the regional economic stimulus is driven only by the direct employment of 1100 construction workers in San Luis Obispo County
Construction of the port occurs over the period coinciding with the 7-year planning phase for the first 1 GW OSW farm 2022-2028 Direct employment for port construction is projected to build over the first few years and reach a peak employment at around the midpoint of the port construction phase however a fully developed time schedule for employment is not available at this time
The measures of economic effects considered in this report are
bull Output ndash business sales less the costs of materials and equipment produced outside of California
bull Employment ndash the full-time equivalent jobs provided to California residents
41 PORT CONSTRUCTION IMPACTS
Table 41 shows the regional economic value realized for San Luis Obispo County and the State of California over the 5-year period of port construction Direct construction spending for a specialized wind port results in local stimulus in San Luis Obispo County of $202 billion ($405 million per year for 5 years) and the creation of approximately 11825 full-time equivalent (FTE) jobs (2365 per year for 5 years) Construction of a specialized wind port in San Luis Obispo County also stimulates the economy of neighboring counties providing 234 jobs and $39 million in economic output for Santa Barbara County and 28 jobs and $58 million in economic output
for Monterey County over the 5-year construction period The overall impact in California considering spill-over impacts to other regions in the state is $300 billion ($599 million per year for 5 years) and the creation of 15925 FTE jobs (3185 annually for 5 years)
Port construction spending would result in a stimulus of $202 billion and the creation of approximately 11825 jobs over 5 years
Economic Impact of Offshore Wind Farm Development on the Central Coast
47
It should be noted that the regional economic impact model assigns available workers in San Luis Obispo County to jobs in San Luis Obispo County before considering workers available to take these jobs in other counties Given the construction of a specialized wind port in San Luis Obispo County jobs are provided to workers in San Luis Obispo County that may ultimately be captured by workers in neighboring counties who are able to outcompete workers in the county This is particularly true for Northern Santa Barbara County given the proximity of the Santa Maria metropolitan area to Arroyo Grande in Southern San Luis Obispo County
For comparison a June 2019 analysis by the California Public Utilities Commission found that current decommissioning plans for DCPP will increase annual economic output in the San Luis Obispo County region by $724 million per year for 10 years and will result in the creation of approximately 4934 FTE jobs annually for ten years (Roland-Holst et al 2019)51
Development of a specialized wind port on the DCPP property may also serve to reduce transportation risks (ie accidents injuries fatalities) from DCPP decommissioning as the use of barge transportation making use of the existing breakwater is projected to lower fatality risks by more than 40 percent52 A more detailed study of specialized wind port construction to jointly meet the goals of DCPP decommissioning and OSW development including potential labor substitution from decommissioning to port construction on the DCPP property is beyond the scope of this report
42 OFFSHORE WIND DEVELOPMENT IMPACTS
After the initial period of port construction assembly can begin in the specialized wind port for the first 1 GW OSW farm in 2029 The economic value of OSW continues from that time through the staged assembly of 1 GW OSW every 3 years Thus the full development of a field of 7 GW OSW from a specialized wind port in San Luis Obispo County will occur over the 21-year period from 2029-2049 While California currently does not have a specialized wind port for assembling OSW turbines it is possible that other specialized wind ports are developed in California during this time allowing OSW turbines to be assembled and dispatched to the Central California region from other nearby
Table 41 Output and Job Creation from Port Construction
RegionFull-Time
Equivalent JobsTotal Output (million $s)
San Luis Obispo County 11825 $202261
Santa Barbara County 234 $3896
Monterey County 28 $577
Rest of California 3837 $92956
California Total 15925 $299689
Economic Impact of Offshore Wind Farm Development on the Central Coast
48
ports This would accelerate the pace of development for installing up to 7 GW OSW in Central California and result in a final completion date prior to 2049
After the initial installation of a field of 7 GW OSW in and around the Morro Bay Call Area proximity between the OSW sites and the specialized wind port in San Luis Obispo will make the specialized wind port the primary area for repair and recommissioning of wind turbines Given the high fixed costs and low variable cost of operating OSW turbines the economics of maintaining 7 GW OSW in the region favor repair from the nearest port with available space to maximize the time turbines spend on the water and connected to the grid
The regional economic value of OSW is constructed by considering the baseline value of a representative 1 GW OSW farm and then modeling the staged development of seven identical 1 GW OSW farms over time The economic value of a representative 1 GW OSW farm is calculated for two cases decommissioning and recommissioning Given that all 7 GW OSW would ultimately be removed from the water following decommissioning the focus of the report is on the long-run economic value to the region from the perpetual renewal of OSW farms over time through recommissioning Recommissioning economizes on redeployment time for the replacement of a 1 GW OSW farm at the end of the lease (from a 6-year period for decommissioning and assembly to a 3-year recommissioning period that bundles these phases together) however bundling decommissioning together with redeployment increases the labor requirement for the 3-year period beyond that required for only decommissioning
421 OSW 1 GW BASELINE WITH DECOMMISSIONING
Table 42 shows the regional economic value realized for San Luis Obispo County neighboring counties and the State of California over the planning assembly and operating horizon of a 1 GW OSW farm through the decommissioning phase The regional economic stimulus provided by the 1 GW OSW farm over its lifetime results in output of $25 billion for San Luis Obispo County and the creation of 6612 full-time equivalent (FTE) jobs over the period 2022-2059 The overall impact in California considering spill-over impacts to other regions in the state is $37 billion and the creation of 11368 FTE jobs during this period
Table 42 Output and Job Creation from a 1 GW Wind Farm with Decommissioning
Region Full-Time Equivalent JobsTotal Output (million $s)
San Luis Obispo County 6612 $245256
Santa Barbara County 364 $7766
Monterey County 58 $1189
Rest of California 4333 $116470
California Total 11368 $370681
Economic Impact of Offshore Wind Farm Development on the Central Coast
49
The majority of the regional economic benefit is derived in San Luis Obispo County because all direct jobs are sourced at the port Santa Barbara County receives economic stimulus of $78 million and 364 FTE jobs over the period due to the alignment of jobs and workers in the model at the location of the specialized wind port In the event that a specialized wind port for OSW assembly and repair is sited in Santa Barbara County rather than San Luis Obispo County the distribution of economic benefits between the two counties essentially would be reversed with Santa Barbara County then becoming the source of output and job creation in the model While some of this outcome is driven by the nature of the model which assigns jobs to workers in the county where direct spending occurs whenever qualified workers in the county are available to provide it the stark difference in regional economic benefits across counties illustrates the fact that direct spending at the specialized wind port is the origin of job creation The regional supply chain to support a 1 GW OSW farm begins and ends at the port
The regional economic benefit realized over this time period is largely concentrated during the assembly and decommissioning phases of the project as shown in Figures 41 and 42 After a small amount of employment and output benefits generated during the planning phase regional employment and output spike during the 3-year assembly period 2029-2031 During the OampM period for the 1 GW OSW farm regional job creation and output falls from the level achieved during assembly and stabilizes Annual jobs and output creation have a positive gradient during this period due to the dynamic adjustment in the REMI PI+ model which builds the regional employment base through population growth in San Luis Obispo County as the 1 GW OSW farm causes labor migration into the county increasing the size of the labor force by providing a reliable source of head-of-household jobs After the 25-year OampM period of the OSW farm regional employment and output spike a second time during the 3-year decommissioning period from 2057-2059
Figure 41 Distribution of Employment Impacts over the Horizon of a 1 GW OSW Farm
Economic Impact of Offshore Wind Farm Development on the Central Coast
50
Figures 43 and 44 show the top sectors stimulated by direct employment at the specialized wind port facility for OSW in San Luis Obispo County for indirect and induced employment respectively In terms of indirect employment the largest industry stimulated by direct spending at the port is administrative and support services (60) followed by regional supply chain development in the professional scientific and technical services industry (14) The increased demand for manufactured components at the specialized port facility for OSW in San Luis Obispo County stimulates regional supply chains for professional scientific and technical support presenting an opportunity for collaboration with Cal Poly and stimulating regional job creation for Cal Poly graduates in engineering fields in local consulting firms and support industries The influx of jobs in professional scientific and technical support fields and other related aspects of the regional supply chain can be further facilitated through independent investment in the Cal Poly Technology Park and furthering industry partnerships in affiliated technical fields that support OSW
Figure 42 Distribution of Output over the Horizon of a 1 GW OSW Farm
The influx of jobs in professional scientific and technical support fields and other related aspects of the regional supply chain can be further facilitated through independent investment in the Cal Poly Technology Park and furthering industry partnerships in affiliated technical fields that support OSW
Economic Impact of Offshore Wind Farm Development on the Central Coast
51
Table 43 shows the distribution of jobs average annual wages total employee compensation and total output for a 1 GW OSW farm in terms of direct indirect and induced impacts Average annual wages and total employee compensation includes wages and fringe benefits paid for by employers
Figure 43 Top 10 Sectors for Indirect Employment from Offshore Wind
Figure 44 Top 10 Sectors for Induced Employment from Offshore Wind
Economic Impact of Offshore Wind Farm Development on the Central Coast
52
Table 44 breaks down output and job creation into annual averages over the various phases of the operating horizon of a 1 GW OSW farm including the final decommissioning phase that removes it from the ocean The regional economic stimulus provided by the 1 GW OSW farm over its lifetime results in the highest annual employment level during the assembly period which provides an average of 589 full-time jobs each year for workers in San Luis Obispo County and 941 full-time jobs each year in California The decommissioning period results in the greatest output creation averaging $218 million per year for San Luis Obispo County and $326 million per year for California during the 3-year decommissioning period
Table 43 Regional Economic Impact of a 1 GW Wind Farm in San Luis Obispo County
ImpactFull-Time
Equivalent Jobs
Average Job Compensation
($year)
Employee Compensation
(millions)Total Output
(millions)
Direct 3490 $88650 $30941 $162674
Indirect 2308 $66076 $15251 $57822
Induced 814 $74884 $6093 $24760
Total Economic Impact 6612 $79076 $52285 $245256
Table 44 Average Annual Output and Job Creation over Key Operating Phases
Economic Stimulus Planning Assembly OampM Decommission
Jobs
San Luis Obispo County 17 589 142 390
Santa Barbara County 1 29 8 24
Monterey County 0 5 1 4
Rest of California 4 318 99 289
Total 22 941 251 707
Output (millions)
San Luis Obispo County $261 $15269 $5288 $21803
Santa Barbara County $010 $502 $167 $670
Monterey County $001 $077 $026 $096
Rest of California $080 $6836 $2618 $9981
Total $352 $22685 $8101 $32550
Economic Impact of Offshore Wind Farm Development on the Central Coast
53
422 OSW 1 GW BASELINE WITH RECOMMISSIONING
In the recommissioning scenario the decommissioning phase for the 1 GW OSW farm is paired with redeployment of a replacement 1 GW OSW farm in the ocean in a new (or renewed) lease agreement Table 45 shows the regional economic value realized for San Luis Obispo County and the State of California over the construction and operating horizon of a 1 GW OSW farm that includes a 3-year recommissioning phase that maintains the 1 GW OSW farm on the water at the end of the period
The regional economic stimulus provided by the 1 GW OSW farm over a lifetime that includes recommissioning and replacement results in output of $268 billion for San Luis Obispo County and the creation of 6999 full-time equivalent (FTE) jobs over the period 2022-2059 The overall impact in California considering spill-over impacts to other regions in the state is $404 billion and the creation of 12059 FTE jobs during this period Comparing entries in Tables 42 and 45 recommissioning the 1 GW OSW farm generates an additional $225 million for San Luis Obispo County ($331 million for California) and the creation of an additional 387 FTE jobs for San Luis Obispo County (692 for California) over the period
Table 46 breaks down output and job creation into annual averages over the various phases of the operating horizon of a recommissioned 1 GW OSW farm that is placed back into service at the end of the horizon The regional economic stimulus provided by a recommissioned 1 GW OSW farm over its lifetime is identical in the first three phases (planning assembly and OampM) with the additional output and job creation concentrated in the final 3-year recommissioning phase Comparing entries in Tables 44 and 46 the added value of recommissioning over decommissioning over the 3-year decommissioning period for the project involves an additional 129 full-time jobs per year in San Luis Obispo County (230 full time jobs per year in California) resulting in additional economic output of $71 million per year in San Luis Obispo County and $110 million per year in California
Table 45 Output and Job Creation from a 1 GW Wind Farm with Recommissioning
Region
Full-Time Equivalent
JobsTotal Output
(millions)
San Luis Obispo County 6999 $267766
Santa Barbara County 387 $8420
Monterey County 62 $1280
Rest of California 4611 $126302
California Total 12059 $403768
Economic Impact of Offshore Wind Farm Development on the Central Coast
54
423 MULTIPLE OSW FARMS THE CASE OF 7 GW OSW DEVELOPMENT
In the case of 7 GW OSW development in Central California the initial spike in output and employment during the assembly phase is extended over a longer period due to the staging of
individual 1 GW OSW farms in successive 3-year periods at the specialized wind port Staged assembly of a field of 7 GW OSW also prolongs the economic benefit from recommissioning multiple OSW farms as the lease period is set back by 3 years for each successive OSW farm through overlapping leases to accommodate available space at the port for assembly The analysis of the 7 GW OSW development includes the
economic value created by constructing a specialized wind port in San Luis Obispo County because it is unlikely that industry partners will materialize to fully develop 7 GW of OSW in Central California without commitment in the region to provide reliable port access for repair and service in proximity to the OSW farms53
Table 46 Average Annual Output and Job Creation over Key Operating Phases
Economic Stimulus Planning Assembly OampM Decommission
Jobs
San Luis Obispo County 17 589 142 519
Santa Barbara County 1 29 8 32
Monterey County 0 5 1 5
Rest of California 4 318 99 382
Total 22 941 251 937
Output (millions)
San Luis Obispo County $261 $15269 $5288 $29306
Santa Barbara County $010 $502 $167 $888
Monterey County $001 $077 $026 $126
Rest of California $080 $6836 $2618 $13259
Total $352 $22685 $8101 $43579
Staged assembly of a field of 7 GW OSW prolongs the economic benefit from recommissioning multiple OSW farms
Economic Impact of Offshore Wind Farm Development on the Central Coast
55
The time horizon for the REMI model extends through 2060 which is not enough to capture the full cycle of development for a 7 GW OSW field given the staged decommissioning horizon that extends through 2077 For this reason the analysis of a 7 GW OSW field is decomposed into two parts First the model is run for staged assembly and deployment of a field of 7 GW OSW farms without decommissioning or recommissioning at the end of the horizon (which would otherwise capture the decommissioning period for only the initial 1 GW OSW farm through 2059) Then the value of a 7 GW OSW field is captured in perpetuity by incorporating the additional value of recommissioning for a representative 1 GW OSW at the end of the lifecycle of each 1 GW OSW farm
This process allows the annual economic value to be calculated in a long-run steady state comprised of a 28-year combined OampM (25 years) and recommissioning (3 years) phase for each OSW farm The long-run steady state value captures the annual value of operating and recommissioning a 7 GW field of OSW farms in a perpetual replacement cycle that begins on the date the final OSW turbine is installed in the 7 GW field
Figures 45 and 46 show the regional economic benefit realized over the time period 2022-2060 without the additional value generated by decommissioning (recommissioning) of each 1 GW OSW farm After an initial spike in regional economic benefits during the period of port construction the economic benefits during the assembly period are prolonged by the staged assembly of 7 GW OSW The annual economic benefit rises steeply during this period both for jobs and output because this period includes OampM for previously assembled 1 GW OSW farms as staging occurs between the assembly phases of each 1 GW OSW farm The regional economic benefit subsequently drops off in 2058 due to removal of the decommissioning (recommissioning) period from the REMI PI+ model runs
Figure 45 Distribution of Employment Impacts over the Horizon of a 7 GW OSW Field
Economic Impact of Offshore Wind Farm Development on the Central Coast
56
The trend toward rising annual output and employment levels during the OampM period in which all 7 OSW farms are in operation reflects the dynamic adjustment elements in the REMI PI+ model which builds up the locally sourced labor pool over time as workers gain experience in the OSW industry For this reason the regional economic value is greater for San Luis Obispo County and for California for the second 1 GW OSW farm than for the first and so on compounding the annual economic benefits realized in the region as a greater level of OSW development occurs over time
Table 47 shows the regional economic value realized for San Luis Obispo County and the State of California over the planning assembly and operating horizon of a 7 GW field of OSW farms absent recommissioning These values include the construction of a specialized wind port during the planning phase prior to assembly of the OSW farms The regional economic stimulus provided by the 7 GW field of OSW farms without decommissioning or replacement results in output of $150 billion for San Luis Obispo County and the creation of 44960 full-time equivalent (FTE) jobs over the period 2022-2060 The overall impact in California is $225 billion and the creation of 72162 FTE jobs during this period
Figure 46 Distribution of Output Impacts over the Horizon of a 7 GW OSW Field
The regional economic value is greater for SLO County and for California for the second 1 GW OSW farm than for the first and so on compounding the annual economic benefits realized in the region as a greater level of OSW development occurs over time
Economic Impact of Offshore Wind Farm Development on the Central Coast
57
The entries in Table 47 encompass the economic value of port construction provided in Table 41 Netting out the port construction impacts in Table 41 the development of a 7 GW field of OSW in the specialized wind port provided an additional 33135 (56238) jobs and additional output of $13 billion ($195 billion) in San Luis Obispo County
Table 48 breaks down output and job creation into annual averages over the various phases of the operating horizon absent recommissioning The port construction period overlaps with planning for the first 1 GW OSW farm and the assembly period is staged over 21 years and involves the transition of assembled OSW farms to OampM toward the end of the assembly period
Table 48 Average Annual Output and Job Creation over Key Operating Phases
Economic Stimulus Port Construction Assembly OampM
Jobs
San Luis Obispo County 2365 1080 1075
Santa Barbara County 47 46 62
Monterey County 6 7 10
Rest of California 767 655 780
California Total 3185 1790 1926
Output (millions)
San Luis Obispo County $40452 $36304 $50331
Santa Barbara County $779 $976 $1583
Monterey County $115 $153 $243
Rest of California $18591 $17134 $25146
California Total $59938 $54566 $77303
Table 47 Output and Job Creation from a 7 GW field of OSW
RegionFull-Time Equivalent
JobsTotal Output
(millions)
San Luis Obispo County 44960 $1500241
Santa Barbara County 2019 $44632
Monterey County 314 $6871
Rest of California 24869 $699440
California Total 72162 $2251185
Economic Impact of Offshore Wind Farm Development on the Central Coast
58
The regional economic stimulus provided by a 7 GW field of OSW farms over its lifetime results in the highest annual employment level during the OampM period The OampM period for a 7 GW field of OSW provides an average of $503 million in annual output and 1075 full-time jobs each year for workers in San Luis Obispo County and $773 million in annual output and 1926 full-time jobs each year in California
Table 49 derives annual steady-state values from periodic recommissioning and redeployment of 7 GW OSW for perpetuity The steady-state values represent the annual OampM value for continued operation of a 7 GW field of OSW farms plus the additional benefit from periodic recommissioning of each 1 GW OSW farm staged in 3-year periods that begin with the first OSW farm in 2059 Specifically the average annual regional economic benefits are derived in perpetuity by calculating the economic value for each variable over a 28-year rolling horizon that begins with the OampM period 2050-2058 in which all 7 OSW farms operate followed by a 21-year recommissioning phase involving the staged reassembly and redeployment of successive 1 GW OSW farms over 3-year intervals at the port
The annual average output level resulting from periodic recommissioning and redeployment of 7 GW OSW is $686 million in annual output and 1389 full-time jobs each year for workers in San Luis Obispo County and $104 billion in annual output and 2488 full-time jobs each year in California The interpretation of these values is the long-run average economic value to the regional economy from operating a mature field of OSW farms that perpetually recommissions and maintains 7 GW of OSW in the Central California region
The steady-state average regional economic values represent an approximation because a fully integrated process for maintaining a 7 GW field of OSW farms would be driven by strong economic incentives to maintain OSW turbines on the water generating electricity for the maximum number of days By the time the first OSW farm begins the recommissioning process in 2059 the solution to this problem may ultimately involve a different staging process for OSW turbine replacement than the one considered here in which each 1 GW OSW farm is recommissioned in a 3-year period following its 25-year operating period
Table 49 Annual Output and Job Creation from 7 GW OSW for Perpetuity
RegionFull-Time
Equivalent Jobs Total Output (millions)
San Luis Obispo County 1389 $68601
Santa Barbara County 80 $2114
Monterey County 13 $317
Rest of California 1006 $33123
California Total 2488 $104154
Economic Impact of Offshore Wind Farm Development on the Central Coast
59
The entries in Table 49 are conservative for two reasons First replacement of each 1 GW OSW farm which begins in the year 2059 is with another baseline 1 GW OSW farm built with currently available technology By 2058 it is possible that technological advances will increase the economic value of reinstalling an OSW farm on a new or renewed lease Second the value during the recommissioning period for each 1 GW OSW farm is taken as the added value of recommissioning for the baseline 1 GW OSW farm considered above This suppresses the dynamic adjustment feature of the REMI model under which the value of subsequent recommissioning periods is elevated based on the experience gained by the regional workforce from recommissioning the first 1 GW OSW farm
424 SMALLER SCALE DEVELOPMENT THE CASE OF 3 GW OSW
The potential to develop 7 GW of OSW in and around the Morro Bay Call Area depends on the ability to reach an agreement with the US Department of Defense (DOD) for an expanded OSW planning area In the event that an expanded OSW planning area is not identified in and around the Morro Bay Call Area it is possible to develop a smaller 3 GW field of OSW farms in the 311 square mile area encompassed by the existing Morro Bay Call Area
In the case of 3 GW OSW development in Central California the initial spike in output and employment during the assembly phase is contracted to a 9-year period due to the staging of individual 1 GW OSW farms in successive 3-year periods at the specialized wind port The analysis of the 3 GW OSW development scenario includes the economic value created by constructing a specialized wind port in San Luis Obispo County because the regional economic benefit of OSW development is centered around job creation at the port
Table 410 shows the regional economic value realized for San Luis Obispo County and the State of California over the planning assembly and operating horizon of a 3 GW field of OSW farms absent recommissioning These values include the construction of a specialized wind port during the planning phase prior to assembly of the OSW farms The regional economic stimulus provided by the 3 GW field of OSW farms generates output of $767 billion for San Luis Obispo County and the creation of 28422 full-time equivalent (FTE) jobs over the period 2022-2060 The overall impact in California is $117 billion and the creation of 44282 FTE jobs during this period
Table 410 Output and Job Creation from a 3 GW field of OSW
RegionFull-Time
Equivalent Jobs Total Output (million $s)
San Luis Obispo County 28422 $766223
Santa Barbara County 1140 $23255
Monterey County 173 $3583
Rest of California 14547 $376664
California Total 44282 $1169724
Economic Impact of Offshore Wind Farm Development on the Central Coast
60
Table 411 breaks down output and job creation into annual averages over the various phases of the operating horizon for a 3 GW field of OSW farms absent recommissioning The port construction period overlaps with planning for the first 1 GW OSW farm and the assembly period is staged over 9 years and involves the transition of assembled OSW farms to OampM toward the end of the assembly period
Following the bump in employment during port construction the regional economic stimulus provided by a 3 GW field of OSW farms over its lifetime results in the highest annual employment level during the assembly period Relative to a 7 GW field of OSW employment and output levels tick downward in the OampM period as the regional economy is less active in supporting the smaller field of OSW farms due to a decreased need for maintenance and repair The OampM period for a 3 GW field of OSW provides an average of $176 million in annual output and 483 full-time jobs each year for workers in San Luis Obispo County and $281 million in annual output and 858 full-time jobs each year in California
Table 412 derives annual steady-state values from periodic recommissioning of a 3 GW field of OSW farms for perpetuity The steady-state values represent the annual OampM value for continued operation of a 3 GW field of OSW farms plus the additional benefit from periodic recommissioning of each 1 GW OSW farm staged in 3-year periods that begin with the first OSW farm in 2059 The
Table 411 Average Annual Output and Job Creation over Key Operating Phases of a 3 GW Field of OSW
Economic Stimulus Port Construction Assembly OampM
Jobs
San Luis Obispo County 2365 768 483
Santa Barbara County 47 22 25
Monterey County 6 4 4
Rest of California 767 454 346
California Total 3185 1249 858
Output (millions)
San Luis Obispo County $40452 $20088 $17624
Santa Barbara County $779 $405 $568
Monterey County $115 $067 $087
Rest of California $18591 $10313 $9819
California Total $59938 $30874 $28098
Economic Impact of Offshore Wind Farm Development on the Central Coast
61
average annual regional economic benefits are derived in perpetuity by calculating the economic value for each variable over a 28-year rolling horizon that begins with the OampM period 2038-2058 in which all three OSW farms operate followed by a 9-year recommissioning phase involving the staged reassembly and redeployment of successive 1 GW OSW farms over 3-year intervals at the port
The annual average output level resulting from periodic recommissioning and redeployment of 3 GW OSW is $255 million in annual output and 617 full-time jobs each year for workers in San Luis Obispo County and $396 million in annual output and 1098 full-time jobs each year in California The interpretation of these values is the long-run average economic value to the regional economy from operating a mature field of OSW farms that perpetually recommissions and maintains 3 GW of OSW from a specialized wind port in San Luis Obispo County
Table 412 Annual Output and Job Creation from 3 GW OSW in Perpetuity
RegionFull-Time
Equivalent Jobs Output (millions)
San Luis Obispo County 617 $25454
Santa Barbara County 33 $795
Monterey County 5 $119
Rest of California 443 $13237
California Total 1098 $39605
Economic Impact of Offshore Wind Farm Development on the Central Coast
62
SECTION 5
FISCAL IMPLICATIONS
Economic Impact of Offshore Wind Farm Development on the Central Coast
63
5 FISCAL IMPLICATIONS
Development of OSW farms in Central California have fiscal implications for San Luis Obispo County The fiscal impact of the project is composed of tax revenue derived from several components
bull property taxes on assessed land improvements at the specialized wind portbull unitary taxes assessed on PGampE from the use of transmission and distribution lines in San Luis
Obispo Countybull sales and use taxes on personal consumption of workers employed at the port facilitybull sales and use taxes on OSW capital expenditurebull income taxes on employee wages
bull corporate taxes on value added in the regional supply chain
The fiscal implications depend on renewable energy credits and other aspects that may result in certain components of project expenditures being exempt from state and local taxes For imported equipment delivered to the port such as turbines towers and floating sub-structures the ability to tax these expenditures depends on the ability of the county to declare imports as an originating transaction that occurs at a specialized wind port For this report fiscal implications are calculated gross of any tax credits that may be applied
Local taxes include property and excise taxes paid to municipalities by workers in the jobs generated by the construction- and operating-period employment reflected in Tables 46-48 as well as property and other local taxes by the companies employing those individuals State taxes include income and sales taxes paid by individuals as well as payroll income and other taxes paid by the companies that employ those individuals The taxes are thus proportional to the total direct indirect and induced economic effects provided in these tables However these totals do not represent all taxes paid by companies whose output is only partly affected by the changes in demand attributable to construction and operating periods of offshore wind energy installation and maintenance port construction and terminal operation
51 PROPERTY TAXES FROM LAND IMPROVEMENTS AT THE SPECIALIZED WIND PORT
Property taxes in San Luis Obispo County are levied at a 1 percent rate on land improvements resulting from development of a specialized wind port in San Luis Obispo County The projected capital expense required to construct the port is in the range of $17 billion to $25 billion Using the cost of developing a specialized wind port as a proxy for the change in assessed land improvements constructing a specialized wind port in San Luis Obispo County would result in annual property taxes to the county of $17-25 million per year
Economic Impact of Offshore Wind Farm Development on the Central Coast
64
52 UNITARY TAXES ON ELECTRICITY TRANSMISSION BY PGampE
The County of San Luis Obispo currently receives unitary taxes and franchise taxes from PGampE from the operation of DCPP In the 2019-2020 tax year unitary tax revenues in San Luis Obispo County accounted for $236 million in annual taxes 85 of which was paid by PGampE By far unitary taxes represent the largest revenue source for the county from DCPP54
California bases the unitary tax on the combined total corporate income of multi-state and multi-national corporations by applying a formula to determine the total amount of income the corporation realized within California The State of California assesses the unitary tax on individual corporations as well as groups of companies who operate together as a ldquounitrdquo and then divides the total tax receipt for each unit at the state-level into shares of taxes received by each county For the case of PGampE unitary taxes are assessed by the State Board of Equalization (BOE) at the same 1 rate as property taxes using Historic Cost Less Depreciation (HCLD) as the basis for the assessment The current board-adopted value for PGampE as the basis for unitary taxes is $312 billion55
With the planned closure of DCPP and potential development of OSW the unitary tax received by San Luis Obispo County will change based both on changes in the HCLD for PGampE and shifts in the share of capital costs attributed to the county from electricity distribution Absent OSW development the prospective closure of DCPP will reduce PGampErsquos HCLD following a decrease in annual operating costs however this drop in operating costs will be offset to some extent by increased storage and maintenance costs for nuclear material As existing power generated by DCPP is replaced by electricity generation elsewhere it is likely that the HCLD of PGampE increases although the share of capital costs attributed to San Luis Obispo County can go up or down depending on capital investment required to upgrade the transmission infrastructure for power delivery from alternative uses such as OSW
The National Renewable Energy Laboratory (NREL) estimates required investments in transmission infrastructure for a 1 GW OSW farm site with an average distance to cable landfall of 45km to be $162 billion56 These costs which include grid connection costs for an offshore spur line would be incurred by PGampE (or another contractor in its unit) as part of the basis for the unitary tax Each region in California would be entitled to a share of the unitary tax revenue proportional to the change in PGampErsquos HCLD realized within the region
Based on the estimated transmission infrastructure cost of $162 billion for a 1 GW OSW farm the total cost of developing a 7 GW field of OSW would be approximately $813 billion57 Of this investment the majority of the transmission line would be situated in federal waters outside the tax jurisdiction of the state The taxable proportion of grid connection costs for an offshore spur line to a 7 GW field of OSW can be calculated according to the share of the transmission infrastructure passing through California waters which is the territory extending 3 nautical miles (56 km) from the shore at mean low tide These costs would include both the share of the transmission line residing in California and the cost of the substation at the cable landfall An approximation of the share of grid connection costs attributed to California would be 1244 (=5645 km) Based on this increment the increase in unitary taxes for San Luis Obispo County from a 7 GW field of OSW would be approximately $10 million per year
Economic Impact of Offshore Wind Farm Development on the Central Coast
65
53 SALES AND USE TAXES ON OSW SPENDING
Sales and use taxes are assessed on taxable sales in California at a rate of 725 In addition counties and municipalities can charge an additional local sales tax of up to 25 through special sales tax jurisdictions Currently special tax jurisdictions in San Luis Obispo County provide an additional assessment of 05 for Grover Beach Arroyo Grande Pismo Beach and Paso Robles for a combined effective tax rate of 775 for purchases made in these communities While it is possible that a specialized wind port authority can levy an additional assessment for OSW spending at the port the values provided here consider sales and use taxes only at the 725 rate
The overnight capital cost for a floating 1 GW OSW farm is projected to be $41 billion of which roughly 30 is comprised of turbine capital cost and 36 for the support structure (including the floating substructure lines and anchors for mooring systems and array cables) These OSW components will be imported at least in the short-term58
Sales and use taxes can be assessed on California transactions at the specialized wind port even for imported goods if the transaction occurs in California If the capital spending on turbines and the support structure for a 7 GW field of OSW farms is taxed taxable spending during the 21-year assembly and installation period for OSW would result in California sales and use taxes of $14 billion Based on a 28-year replacement standard for each 1 GW OSW farm the annual sales and use taxes for California in a long-run steady state with periodic recommissioning would result in $498 million per year in additional sales and use taxes for the State of California at prevailing OSW capital costs
54 SALES AND USE TAXES CORPORATE TAXES AND INCOME TAXES FROM AFFILIATED SPENDING
The development of OSW also generates local taxes from income and induced spending by OSW workers as well as corporate taxes on the value added in the regional supply chain from the companies employing those individuals State taxes include income and sales taxes paid by individuals as well as payroll income and other taxes paid by the companies that employ them
Table 51 presents the estimated annual increase in California state taxes from maintaining a 3 GW vs a 7 GW field of OSW farms for perpetuity Corporate income taxes are based on value-added created in the regional supply chain personal income taxes are levied on worker incomes and sales taxes on retail purchases are derived from disposable income The effective tax rate for each component is calculated using data from the California Legislative Analystrsquos Office as the average tax collected in each category as a share of economic activity that occurred in the state over the period 2017-2019 The effective rate for the corporate income tax is taken to be the corporate tax bill as a share of value-added and the retail sales tax is taken to be the retail sales and use tax revenue as a share of personal consumption expenditures spent on taxable items in the state Development of a 3 GW field of OSW farms results in an additional $27 million per year in California tax revenue whereas a 7 GW field of OSW farms contributes $76 million per year in California tax revenue
Economic Impact of Offshore Wind Farm Development on the Central Coast
66
55 SUMMARY OF FISCAL IMPLICATIONS
Table 52 provides a summary of the annual fiscal implications for maintaining a mature field of 3 GW vs 7 GW OSW in and around the Morro Bay Call Area Estimated property taxes from land improvement from investment in a specialized wind port facility are taken at 1 of the midpoint of the estimated capital investment Unitary taxes on the capital cost of infrastructure is fully attributed to San Luis Obispo County including the share of spending that occurs in state waters in addition to onshore investment State taxes amortize the cost of recurring capital investment for recommissioning OSW farms which assumes imported capital is recorded as a taxable transaction on state land at the port Taxes from regional income and spending are taken from Table 51 and suppress the additional county-level 05 retail sales tax from worker spending in special tax jurisdictions in Grover Beach Arroyo Grande Pismo Beach and Paso Robles
In the case of a 3 GW field of OSW development tax values are proportionally smaller due to the smaller scale of the project with the exception of property taxes from the specialized wind port The basis for the increase in assessed value of the property taxes is taken at the low end of the range of cost estimates for the case of 3 GW OSW development and at the high end of the range for the case of 7 GW OSW development Detailed information at this time is not available to confirm whether or not the cost of port construction would materially differ in the case where the specialized wind port was constructed to support a 3 GW or a 7 GW field of OSW farms
Table 51 Annual Taxes from Regional Economic Development of 3 GW vs 7 GW OSW
3 GW Field 7 GW Field
Type of Tax Effective Rate Basis (millions) Tax (millions) Basis (millions) Tax (millions)
Corporate Income Tax 09078 $18737 $170 $46323 $421
Personal Income Tax 83508 $21861 $1826 $65226 $5447
Retail Sales Tax 37515 $18722 $702 $55654 $2088
Total $2698 $7955
Economic Impact of Offshore Wind Farm Development on the Central Coast
67
Table 52 Summary of Annual Fiscal Benefits from 3 GW vs 7 GW OSW
3 GW Field 7 GW Field
Tax BasisCounty Taxes (millionsyr)
State Taxes (millionsyr)
County Taxes (millionsyr)
State Taxes (millionsyr)
Specialized Wind Port
Property Taxes $1700 $2500
OSW Capital Spending $2133 $4978
Transmission Infrastructure
Unitary Taxes $434 $1012
Regional Spending
Corporate Income Tax $170 $421
Personal Income Tax $1826 $5447
Retail Sales Tax $702 $2088
Total $2134 $4831 $3512 $12933
Economic Impact of Offshore Wind Farm Development on the Central Coast
68
SECTION 6
CONCLUSION
Economic Impact of Offshore Wind Farm Development on the Central Coast
69
6 CONCLUSION
The development of up to 7 GW OSW in and around the Morro Bay Call Area represents a considerable opportunity for job and economic output impacts However the logistical challenges associated with building and operating a field of OSW farms and the associated specialized wind port that supports them are substantial If a specialized wind port for OSW turbine assembly and repair is not constructed in San Luis Obispo County then the regional economic benefits of jobs and economic output creation would occur instead in the county that provides the port In contrast the State of California would retain much of the economic benefit of OSW development if another county in California provides the specialized wind port
Construction-phase impacts during the 5-year period of port construction generate 11825 full-time equivalent (FTE) construction jobs in San Luis Obispo County and 15925 construction jobs overall in California stimulating $202 billion in additional economic output for San Luis Obispo County and $3 billion in economic output for California These impacts on economic output and jobs include port terminal and transmission infrastructure improvements as well as the first stage of wind farm development and planning operations
Following the period of port construction and OSW planning assembly of 1 GW OSW farms is staged over time in a 3-year period for each OSW farm For a 3 GW field of OSW farms construction of a port followed by staged assembly of 1 GW OSW farms over a total of 9 years provides 28422 FTE jobs in San Luis Obispo County and 44282 FTE jobs in California over an operating horizon through 2060 Developing a 3 GW field of OSW farms generates $766 billion in economic output for San Luis Obispo County and $1170 billion in economic output for California through the year 2060 Additional jobs and economic output would be realized during the decommissioning period of the field which extends well beyond the horizon of the REMI model in 2060 and is therefore not considered in the model
For a 7 GW field of OSW farms construction of a port followed by staged assembly of 1 GW OSW farms over a total of 21 years provides 44960 FTE jobs in San Luis Obispo County and 72162 FTE jobs in California over an operating horizon through 2060 Developing a 7 GW field of OSW farms generates $15 billion in economic output for San Luis Obispo County and $2251 billion in economic output for California through the year 2060 As in the case of a 3 GW field of OSW farms additional jobs and economic output would be realized during the decommissioning period which is not considered in the model
Perpetual operation of a mature 3 GW or 7 GW field of OSW farms produces considerable regional economic benefits each year Perpetual operation of a mature 3 GW field of OSW farms results in the creation of 617 jobs per year in San Luis Obispo County and 1098 jobs per year in California and provides additional economic output of $254 million per year in San Luis Obispo County and $396
Economic Impact of Offshore Wind Farm Development on the Central Coast
70
million per year in California Perpetual operation of a mature 7 GW field of OSW farms results in the creation of 1389 jobs per year in San Luis Obispo County and 2488 jobs per year in California and provides additional economic output of $686 million per year in San Luis Obispo County and $104 billion per year in California
Fiscal benefits to San Luis Obispo County are predominantly driven by property taxes on land improvements at the specialized wind port which generates between $17-$25 million per year in local property tax revenues The considerable cost of developing the necessary transmission infrastructure to provide grid connection for a 3-7 GW field of OSW farms to the existing connections at DCPP provides a tax benefit to the county as well Based on the taxable change in the cost of the transmission infrastructure the development of a 3 GW field of OSW farms is projected to result in increased unitary taxes for San Luis Obispo County of $43 million per year whereas the development of a 7 GW field of OSW farms is projected to result in increased unitary taxes for San Luis Obispo County of $101 million per year
The fiscal impact to the State of California is comprised of sales and use taxes on personal consumption expenditures resulting from worker spending corporate income taxes on value added by companies in the regional supply chain and the state income taxes on employed workers Using effective tax rates derived from data provided by the California Legislative Analystrsquos Office perpetual operation of a mature 3 GW field of OSW generates $27 million per year in California tax revenue whereas a 7 GW field of OSW generates $796 million per year in California tax revenue from the projected economic activity created by OSW
Over time economic impacts can change As installed wind farm capacity in California increases through planned developments in Central and Northern California learning effects are likely to further reduce costs and investment in OSW manufacturing capabilities in California would allow a greater share of inputs to be locally sourced Changes along these lines will result in greater regional economic benefits in the long-term for floating OSW development in California
Economic Impact of Offshore Wind Farm Development on the Central Coast
71
REFERENCES
American Jobs Project 2019 The California Offshore Wind Project A Vision for Industry Growth February 2019 Available at httpsoffshorewindhuborgresource1771
American Wind Energy Association California and Offshore Wind California 2020 AWEA-California and Offshore Wind California Comments California Energy Commission Docket 17-MISC-01 June 30 2020 Available at httpsefilingenergycagovGetDocumentaspxtn=233690ampDocumentContentId=66331
Berkeley Lab 2020 Wind Technologies Market Report Available at httpsemplblgovwind-technologies-market-report
Beiter P Musial W Smith A Kilcher L Damiani R Maness M Sirnivas S Stehly T Gevorgian V Mooney M and Scott G 2016 A spatial-economic cost-reduction pathway analysis for US offshore wind energy development from 2015ndash2030 (No NRELTP-6A20-66579) National Renewable Energy Laboratory(NREL) Golden CO (United States)
BOEM California Offshore Wind Energy httpscaoffshorewinddatabasinorgmaps4c-86c5e61e044747ac010102c4787507active
Brightline Defense 2020 California Offshore Wind Winding up for Environmental Growth and Environmental Equity December 2020
Bureau of Ocean Energy Management (BOEM) California Offshore Renewable Energy Fact Sheet February 22 2017 Available at httpswwwboemgovsitesdefaultfilesrenewable-energy-programState-ActivitiesCABOEM-Offshore-Renewables-Factsheet--02-22-17pdf
Busch C and Orvis R 2020 Insights from the California Energy Policy Simulator On the Statersquos Current Greenhouse Gas Emission Trajectory and Six Policy Opportunities for Deepening Emission Reductions Energy Innovation LLC January 2020 Available at httpsenergyinnovationorgwp-contentuploads202005Insights-from-the-California-Energy-Policy-Simulator_5120pdf
California Board of Equalization Unitary Valuation Methods March 2003 Available at httpswwwboecagovproptaxespdfmethodsbook2003pdf
California Energy Commission 2019 Total System Electric Generation Available at httpswwwenergycagovdata-reportsenergy-almanaccalifornia-electricity-data2019-total-system-electric-generation
California Energy Commission 2020 UPDATED Notice of Availability of Outreach on Additional Considerations for Offshore Wind Energy off the Central Coast of CA May 7 2020
Colias M 2021 GM to Phase Out Gas- and Diesel-Powered Vehicles by 2035 The Wall Street Journal January 28 2021 Available at httpswwwwsjcomarticlesgm-sets-2035-target-to-phase-out-gas-and-diesel-powered-vehicles-globally-11611850343
Economic Impact of Offshore Wind Farm Development on the Central Coast
72
Collier R 2017 High Road for Deep Water Center for Labor Research and Education University of California Berkeley CA
Dvorak MJ Archer CL and Jacobson MZ 2010 California offshore wind energy potential Renewable energy 35(6) pp1244-1254
Energy and Environmental Economics Inc 2019 The Economic Value of Offshore Wind Power in California August 2019 Available at httpcastlewindcomwp-contentuploads2019082019-08-08_E3-CastleWind-OffshoreWindValueReport_compressedpdf
Energy and Environmental Economics Inc 2018 ldquoDeep Decarbonization in a High Renewables Futurerdquo California Energy Commission June 18 2018 Available at httpswwwethreecomwp-contentuploads201806Deep_Decarbonization_in_a_High_Renewables_Future_CEC-500-2018-012-1pdf
Fripp M and Wiser RH 2008 Effects of temporal wind patterns on the value of wind-generated electricity in California and the Northwest IEEE Transactions on Power Systems 23(2) pp477-485
Froese M 2019 Why collaboration is critical to offshore wind and port success Windpower Energy and Development August 28 2019 Available at httpswwwwindpowerengineeringcomwhy-collaboration-is-critical-to-offshore-wind-and-port-success
Garrick BJ and Wakefield DJ 2020 Probabilistic Risk Assessment of Nuclear Power Plant Spent Fuel Handling and Storage Programs Methodology and Application to the Diablo Canyon Power Plant The B John Garrick Institute for the Risk Sciences at UCLA and Pacific Gas and Electric Company February 17 2020
Global Wind Energy Council (GWEC) 2020 Global Offshore Wind Report August 5 2020 Available at httpsgwecnetglobal-offshore-wind-report-2020
Hackett S and Anderson J 2020 California North Coast Offshore Wind Studies Economic Development and Impacts Schatz Energy Research Center September 2020
London Economics International LLC 2013 Analysis of the Macroeconomic Impacts of the Proposed Zephyr Transmission Project May 2013 Available at httpwwwdatcllccomwp-contentuploads201306ZephyrEconomicBenefitsStudy-5212013pdf
Lowder K 2021 Wind Power amp Renewables Surge to New Record in China Cleantechnica January 22 2021 Available at httpscleantechnicacom20210122wind-power-renewables-surge-to-new-record-in-china
Massachusetts Clean Energy Center 2017 2017 Massachusetts Offshore Wind Ports amp Infrastructure Assessment May 2017 Available at httpwwwmassceccomports
Musial W Beiter P Tegen S and Smith A 2016 Potential Offshore Wind Energy Areas in California An Assessment of Locations Technology and Costs National Renewable Energy Laboratory December 2016 Available at httpswwwboemgovsitesdefaultfilesenvironmental-stewardshipEnvironmental-StudiesPacific-RegionStudiesBOEM-2016-074pdf
Economic Impact of Offshore Wind Farm Development on the Central Coast
73
National Renewable Energy Laboratory (NREL) Annual Technology Baseline 2020 Available at httpsatbnrelgovelectricity2020dataphp
Porter A and Phillips S 2016 Determining the Infrastructure Needs to Support Offshore Floating Wind and Marine Hydrokinetic Facilities on the Pacific West Coast and Hawaii US Bureau of Offshore Energy Management March 3 2016 Available at httpwwwdataboemgovPIPDFImagesESPIS55503pdf
Reed S 2021 A Monster Wind Turbine is Upending the Industry The New York Times January 1 2021 Available at httpswwwnytimescom20210101businessGE-wind-turbinehtml
Roland-Holst DW Behnke D Evans S Froumllund L and Yi-Chen A 2019 Economic Impact Assessment of the Prospective Closure of the Diablo Canyon Nuclear Power Plant California Public Utilities Commission June 28 2019
Severy M and Jacobson A 2020 California North Coast Offshore Wind Studies Interconnection Constraints and Pathways Schatz Energy Research Center September 2020
Severy M Younes A Zoellick J and Jacobson A 2020 Northern California Offshore Wind Generation and Load Compatibility Assessment with Emphasis on Electricity Grid Constraints Mitigation Measures and Associated Costs Final Synthesis Report Energy Research Center September 2020 OCS Study BOEM 2020-045
Shaner MR Davis SJ Lewis NS and Caldeira K 2018 ldquoGeophysical constraints on the reliability of solar and wind power in the United Statesrdquo Energy amp Environmental Science 11(4) pp914-925
Sinden G 2007 ldquoCharacteristics of the UK wind resource Long-term patterns and relationship to electricity demandrdquo Energy Policy 35(1) pp112-127
Speer B Keyser D and Tegen S 2016 Floating Offshore Wind in California Gross Potential for Jobs and Economic Impacts from Two Future Scenarios (No NRELTP-5000-65352) National Renewable Energy Laboratory (NREL) Golden CO (United States)
Wang YH Walter RK White C Kehrli MD Hamilton SF Soper PH and Ruttenberg BI 2019 ldquoSpatial and temporal variation of offshore wind power and its value along the Central California Coastrdquo Environmental Research Communications 1(12) p121001
1 A power plant with a 50 capacity factor produces twice as much power per day as a power plant with the same nameplate
capacity and a 25 capacity factor
2 The overnight LCOE for floating OSW is currently $67MWh which compared with $69MWh for commercial PV in Los
Angeles $61MWh for nuclear and $57-89MWh for new steam-reach development of hydropower and $123MWh for flash
steam enhanced geothermal systems National Renewable Energy Laboratory (NREL) Annual Technology Baseline 2020
Available at httpsatbnrelgovelectricity2020dataphp
3 California Energy Commission 2019 Total System Electric Generation Available at httpswwwenergycagovdata-reports
energy-almanaccalifornia-electricity-data2019-total-system-electric-generation
Economic Impact of Offshore Wind Farm Development on the Central Coast
74
4 Busch C and Orvis R 2020 Insights from the California Energy Policy Simulator on the Statersquos Current Greenhouse Gas Emission
Trajectory and Six Policy Opportunities for Deepening Emission Reductions Energy Innovation LLC January 2020 Available at
httpsenergyinnovationorgwp-contentuploads202005Insights-from-the-California-Energy-Policy-Simulator_5120
5 Colias M 2021 GM to Phase Out Gas- and Diesel-Powered Vehicles by 2035 The Wall Street Journal January 28 2021
Available at httpswwwwsjcomarticlesgm-sets-2035-target-to-phase-out-gas-and-diesel-powered-vehicles-
globally-11611850343
6 Energy and Environmental Economics Inc 2018 ldquoDeep Decarbonization in a High Renewables Futurerdquo California Energy
Commission June 18 2018 Available at httpswwwethreecomwp-contentuploads201806Deep_Decarbonization_
in_a_High_Renewables_Future_CEC-500-2018-012-1pdf
7 Severy M Younes A Zoellick J Jacobson A 2020 Northern California Offshore Wind Generation and Load Compatibility
Assessment with Emphasis on Electricity Grid Constraints Mitigation Measures and Associated Costs Final Synthesis Report Schatz
Energy Research Center September 2020
8 Bureau of Ocean Energy Management (BOEM) httpswwwboemgovrenewable-energylease-and-grant-information
9 This calculation is based on a capacity factor of 50 for OSW The exact amount of generating capacity needed to meet state
renewable energy targets in 2050 depends on future demand growth driven by electrification and the capacity factor of the
power source which is rapidly increasing for OSW
10 National Renewable Energy Laboratory (NREL) Annual Technology Baseline 2020 Available at httpsatbnrelgov
electricity2020dataphp
11 A capacity factor of 50 percent is equivalent to achieving the full nameplate capacity of the OSW farm for 12 hours per day
with zero electricity generation for the remaining 12 hours per day
12 American Jobs Project 2019 The California Offshore Wind Project A Vision for Industry Growth February 2019 Available
at httpsoffshorewindhuborgresource1771
13 Myers Amanda 2020 Seven Policies to Tap US Offshore Windrsquos $166 Billion Economic Growth And Emissions Reduction
Potential Forbes August 31 2020 Available at httpswwwforbescomsitesenergyinnovation20200831seven-policies-
the-us-can-use-to-tap-offshore-winds-166-billion-economic-growth-and-emissions-reduction-
potentialsh=5bf30e546f27
14 Energy and Environmental Economics Inc 2019 The Economic Value of Offshore Wind Power in California August 2019
Available at httpcastlewindcomwp-contentuploads2019082019-08-08_E3-CastleWind-OffshoreWindValueReport_
compressedpdf
15 Wang YH Walter RK White C Kehrli MD Hamilton SF Soper PH and Ruttenberg BI 2019 ldquoSpatial and temporal
variation of offshore wind power and its value along the Central California Coastrdquo Environmental Research Communications
1(12) p121001
16 External costs of GHG emissions are captured to some extent in California electricity prices through public regulations for
instance the cap-and-trade program for carbon emissions under AB 32 Similarly higher electricity generation costs are
priced into the California grid indirectly by Californiarsquos commitment to developing renewable sources
17 Musial W Beiter P Tegen S and Smith A 2016 Potential Offshore Wind Energy Areas in California An Assessment of
Locations Technology and Costs National Renewable Energy Laboratory December 2016 Available at httpswwwboem
govsitesdefaultfilesenvironmental-stewardshipEnvironmental-StudiesPacific-RegionStudiesBOEM-2016-074pdf
18 California Energy Commission 2020 UPDATED Notice of Availability of Outreach on Additional Considerations for Offshore Wind
Energy off the Central Coast of CA May 7 2020
Economic Impact of Offshore Wind Farm Development on the Central Coast
75
19 American Wind Energy Association California and Offshore Wind California 2020 Offshore Wind Development in Morro Bay
Letter to the Honorable Salud Carbajal and the Honorable Jimmy Panetta May 27 2020
20 Brightline Defense 2020 California Offshore Wind Winding up for Environmental Growth and Environmental Equity December
2020
21 Ma K Luo Y Thomas KC amp Wu Y 2019 Mooring System Engineering for Offshore Structures Elsevier Science amp
Technology San Diego Available from ProQuest Ebook Central February 2021
22 KampL Gates 2019 Offshore Wind Handbook Version 2 October 2019 Available at httpsfilesklgatescomfilesuploads
documents2019_offshore_wind_handbookpdf
23 If the blades are not already attached to the nacelle-hub each blade is then lifted separately by the crane and connected to
the hub
24 Uraz E 2011 Offshore wind turbine transportation amp installation analyses planning optimal marine operations for offshore
wind projects Available at httpwwwdiva-portalorgsmashgetdiva2691575FULLTEXT01pdf
25 Wang YH Walter RK White C Kehrli MD Hamilton SF Soper PH and Ruttenberg BI 2019 Spatial and temporal
variation of offshore wind power and its value along the Central California Coast Environmental Research Communications
1(12) p121001
26 Wang YH Walter RK White C Kehrli MD Hamilton SF Soper PH and Ruttenberg BI 2019 Spatial and temporal
variation of offshore wind power and its value along the Central California Coast Environmental Research Communications
1(12) p121001
27 The electricity portfolio must include enough firm capacity to meet coincident system peak plus additional 15 of planning
reserve margin (PRM) requirement
28 Hackett S and Anderson J 2020 California North Coast Offshore Wind Studies Economic Development and Impacts
Schatz Energy Research Center September 2020
29 Massachusetts Clean Energy Center 2017 Massachusetts Offshore Wind Ports amp Infrastructure Assessment May 2017 Available
at httpwwwmassceccomports
30 Porter A and Phillips S 2016 Determining the Infrastructure Needs to Support Offshore Floating Wind and Marine Hydrokinetic
Facilities on the Pacific West Coast and Hawaii US Bureau of Offshore Energy Management March 3 2016 Available at http
wwwdataboemgovPIPDFImagesESPIS55503pdf
31 Collier R 2017 High Road for Deep Water Center for Labor Research and Education University of California Berkeley CA
32 Garrick BJ and Wakefield DJ 2020 Probabilistic Risk Assessment of Nuclear Power Plant Spent Fuel Handling and Storage
Programs Methodology and Application to the Diablo Canyon Power Plant The B John Garrick Institute for the Risk Sciences at
UCLA and Pacific Gas and Electric Company February 17 2020
33 California Energy Commission 2019 Total System Electric Generation Available at httpswwwenergycagovdata-reports
energy-almanaccalifornia-electricity-data2019-total-system-electric-generation
34 Severy M and Jacobson A 2020 California North Coast Offshore Wind Studies Interconnection Constraints and Pathways
Schatz Energy Research Center September 2020
35 London Economics International LLC 2013 Analysis of the Macroeconomic Impacts of the Proposed Zephyr Transmission Project
May 20 2013 Available at httpwwwdatcllccomwp-contentuploads201306ZephyrEconomicBenefitsStudy-5212013pdf
36 Collier R 2017 High Road for Deep Water Center for Labor Research and Education University of California Berkeley CA
37 Collier R 2017 High Road for Deep Water Center for Labor Research and Education University of California Berkeley CA
38 Brightline Defense 2020 California Offshore Wind Winding up for Environmental Growth and Environmental Equity December
2020
39 US Census Bureau 2020
Economic Impact of Offshore Wind Farm Development on the Central Coast
76
40 SLO County BW Report 2018
41 SLO County BW Report 2018
42 US Bureau of Economic Analysis
43 SLO County BW Report 2018
44 US Bureau of Economic Analysis
45 wwwslocountycagov 2021 SLO County Monthly Labor Market Information - County of San Luis Obispo Available at https
wwwslocountycagovDepartmentsSocial-ServicesWorkforce-Development-BoardSLO-County-Monthly-Labor-Market-
Informationaspx
46 wwwblsgov 2021 Unemployment Rates for States Available at httpwwwblsgovweblauslaumstrkhtm
47 SLO County BW Report 2018
48 US Bureau of Economic Analysis 2020
49 US Bureau of Economic Analysis 2020
50 Private costs of OSW include the opportunity cost of delaying the time wind turbines spend on the water by the extra travel
days from a more distant port which will be passed through into consumer electricity prices though higher LCOE for the
change in duration the wind turbines produce electricity for the grid (ie the extra days required for transportation during
periods of turbine installation and repair)
51 Roland-Holst DW Behnke D Evans S Froumllund L and Yi-Chen A 2019 Economic Impact Assessment of the
Prospective Closure of the Diablo Canyon Nuclear Power Plant California Public Utilities Commission June 28 2019
52 Garrick BJ and Wakefield DJ 2020 Probabilistic Risk Assessment of Nuclear Power Plant Spent Fuel Handling and Storage
Programs Methodology and Application to the Diablo Canyon Power Plant The B John Garrick Institute for the Risk Sciences at
UCLA and Pacific Gas and Electric Company February 17 2020
53 A specialized wind port for OSW assembly and repair ultimately may be provided in a neighboring county however the
regional economic benefit considered in this report presumes the port is constructed in San Luis Obispo County
54 SLO County Assessorrsquos Office
55 State of California Board of Equalization httpswwwboecagovproptaxespdfPropValues2020pdf
56 NREL 2020 ATB
57 To the extent economies of scale exist in developing the transmission infrastructure for a 7 GW field of OSW using the NREL
cost approximation for a 1 GW OSW farm as a scalar for field development costs will over-estimate actual transmission
infrastructure costs for 7 GW field of OSW
58 The National Defense Authorization Act for FY2021 recently passed by US Congress includes amendments that ensure that
the Outer Continental Shelf Lands Act (OCSLA) applies to offshore wind farms The amendments have the potential to increase
the share of transportation costs captured by American-built vessels in the offshore wind fleet under the Jones Act

Economic Impact of Offshore Wind Farm Development on the Central Coast
13
1 INTRODUCTION
As the State of California moves toward meeting its ambitious clean energy and climate goals mdash underscored by targets to reduce greenhouse gas (GHG) emissions from 1990 levels by 40 by 2030 and 80 by 2050 and to achieve a zero-carbon renewable electricity mix by 2045 mdash offshore wind (OSW) is poised to provide a substantial contribution With 112 GW of technical offshore wind resource potential along its coastline the OSW energy sector alone is capable of meeting more than 15 times the statersquos annual electricity demand
Californiarsquos current power supply has already started to shift toward renewable zero-carbon sources In 2019 the State of California derived approximately 32 of its electricity from renewable sources (including 12 solar and 10 onshore wind) and 55 GHG-free including 9 nuclear power (16163 GWh) from Diablo Canyon Power Plant (DCPP)3 Yet despite the recent development of commercial solar power in California including four commercial solar plants in San Luis Obispo County the growth of zero-emission electricity supply is not on target to meet Californiarsquos clean energy goals Based on recent emissions inventory data California emitted 424 million metric tons (MMT) of CO2e in 2017 which implies that reducing statewide emissions below the 260 MMT of carbon dioxide equivalent (CO2e) limit by 2030 will require reducing emissions by an average of 13 MMT of CO2e annually nearly double the annual rate of 7 MMT of CO2e achieved over the past decade4
Much of the movement toward clean energy supply will need to take place on Californiarsquos electricity grid On January 28 2021 General Motors Co set an ambitious target to completely phase out gasoline- and diesel-powered vehicles globally by 20355 The movement of large automakers to the electricity grid compounds the findings of recent California Energy Commission (CEC) and California Public Utilities Commission (CPUC) studies that indicate the state will require two to six times more renewable power capacity by 2050 than is installed today to meet its policy goals under AB 32 implying a need for between 100 to 150 GW of new renewable power capacity6
11 RECENT TECHNOLOGICAL ADVANCES MAKE FLOATING OFFSHORE WIND POSSIBLE
Unlike the coastline on the East Coast of the US the ocean floor slopes steeply downward into deep waters off the California coastline requiring the use of floating platforms for OSW Recent advances in floating platform technologies for OSW turbines have greatly reduced the cost of developing floating OSW farms making it possible to build OSW farms to scale in California that rival the generation capacity of fixed platform technologies as used over the past several decades in the shallower waters off the East Coast and Europe Floating wind technology which relies on mooring lines and anchors to tether platforms to the ocean floor has the advantage of allowing offshore wind turbines to be placed further from shore where the wind speeds are generally faster and more consistent allowing greater power generation while limiting sight impacts from shore While the technology for floating OSW has been demonstrated successfully in pilot projects around the world
Economic Impact of Offshore Wind Farm Development on the Central Coast
14
a commercial scale floating offshore wind farm has not yet been deployed in the United States7
The Bureau of Ocean Energy Management (BOEM) recently initiated the leasing process for three potential offshore wind sites in approximately 687832 acres of federal waters off the California coast to be auctioned for commercial OSW production as early as 20228 BOEM identified Call Areas located off the coast of Central California and the northernmost region of the state (Humboldt Bay) Additionally two more sites (Del Norte and Cape Mendocino) were identified in studies by BOEM and the National Renewable Energy Laboratory (NREL) for potential future OSW development Together development of the initial Call Areas identified by BOEM could support approximately 9 GW of offshore wind development up to 7 GW of which is in the OSW planning area on the Central Coast The development of 7 GW of OSW in the Central Coast OSW planning area would provide roughly 11 of the statersquos current electricity needs (30660 GWh out of 277704 GWh in Californiarsquos 2019 energy mix)9
Floating offshore wind technology which is relatively new has already demonstrated impressive capacity factors of over 50 percent roughly twice that of commercial solar10 The capacity factor of OSW is greater than that of commercial solar because OSW can generate electricity 24 hours a day11 and recent engineering studies project that Californiarsquos floating offshore wind turbines could reach capacity factors of over 70 percent of their maximum theoretical output12
12 OUTLOOK FOR OSW IN CALIFORNIA
The development of OSW energy which has not been featured prominently in Californiarsquos resource planning analyses to date offers several distinct advantages over alternative renewable energy sources Unlike commercial-scale solar power and onshore wind where many of the most productive sites in California have already been developed OSW represents a large and highly scalable resource in California that remains largely untapped Although OSW development is subject to siting concerns such as exclusion zones from the Department of Defense and Marine Protected Areas (MPAs) and entails potential impacts to local fisheries marine mammals and ocean shipping lanes the development of OSW remains relatively unimpeded by the property rights concerns associated with developing onshore resources OSW farms can also be located close to coastal load centers and make use of available transmission capacity eliminating the need to install costly transmission lines to deliver electricity to the California grid
Developing OSW technology in California will require significant capital investment In the US total investment in the offshore wind industry is expected to reach $17 billion by 2025 $108 billion by 2030 and $166 billion by 2035 roughly two-thirds of which will go to the construction industry 25 to the turbine OampM and associated supply chain with much of the remainder
Investment in the offshore wind industry in the US is expected to reach $17 billion by 2025 $108 billion by 2030 and $166 billion by 2035
Economic Impact of Offshore Wind Farm Development on the Central Coast
15
allocated to the transportation industry and ports13
As OSW technology continues to develop it is rapidly becoming cost-competitive with traditional energy sources making floating OSW farms capable of achieving acceptable commercial returns A recent study indicates that including offshore wind in the statersquos energy mix would produce ratepayer savings of approximately $1 to $2 billion by 2040 on a net present value (NPV) basis with floating OSW becoming part of the least-cost portfolio by 203014
Before offshore wind platforms can be constructed suitable ports must be established for staging and assembly of floating turbines onshore Because offshore floating turbines are larger than land-based wind turbines with expected heights exceeding 700 ft turbine blades for OSW are too large to be transported on existing highways or rail lines requiring the assembly of turbines on floating platforms to occur quayside with finished wind turbines delivered by ship directly from the specialized wind port to the offshore site where the moorings and anchors are placed For this reason the specialized wind port is the center for job creation from OSW development Virtually all supply chains that develop to meet the unique requirements of offshore wind originate and terminate at the specialized wind port
This report evaluates the economic impact to San Luis Obispo County and the State of California from the development of one or more OSW farms and the associated port and transmission infrastructure in and around the Morro Bay Call Area The Central California region is ideal for offshore wind development for several reasons
bull Wind speeds are generally strong15 bull The region has existing connections to the statersquos electrical grid bull Much of the coast is outside of national marine sanctuaries where disturbance to the seabed is
prohibitedbull The region is favorably positioned between major population centers with high power demand
in Northern and Southern California
13 ECONOMIC VALUE OF OFFSHORE WIND
When evaluating the regional economic stimulus created by OSW development in San Luis Obispo County it is important to place these values in context with the overall economic value of OSW development for California The overall economic benefit of OSW is captured by transactions between electricity providers and consumers (households and businesses) in Californiarsquos electricity market Consumer benefits in the electricity market are greatest when electricity prices are low Because converting energy to power requires cost the most valuable sources of power in an electricity portfolio are those that deliver electricity to the grid at the lowest cost Indeed for a fixed amount of electricity generation to meet consumer demand economic benefits are maximized when electricity is supplied to consumers at minimum cost
One difficulty in assessing the economic value of renewable energy sources is the distinction between private and social cost The economic value is greatest for an energy portfolio that meets consumer demand at minimum social cost which is the sum of private cost and external cost Private costs reflect actual costs incurred by electricity suppliers for instance the levelized cost
Economic Impact of Offshore Wind Farm Development on the Central Coast
16
of electricity (LCOE) used to evaluate energy investments over time while external costs refer to costs society incurs that are not captured in the electricity market for instance the cost imposed on future generations from GHG emissions today16 For this reason a coal-fired electricity plant may have lower private costs than a floating OSW farm while the wind farm nevertheless has lower social costs a distinction that can be lost when comparing different potential energy sources based strictly on private costs such as the LCOE
Another difficulty in assessing the economic value of renewable energy sources is the distinction between fixed and variable cost In the case of OSW energy substantial fixed costs must be sunk up front to assemble install and connect floating wind turbines to the electricity grid however once this investment has been made the turbines generate electricity at extremely low marginal cost during their entire period of operation A relevant factor that underpins the economic value of a renewable energy project is the LCOE which represents the average cost of electricity generation over the life of the project Because fixed costs are so high to install floating OSW turbines and marginal costs are so low the LCOE for OSW is highly sensitive to the duration in which a wind turbine can be deployed Minimizing the LCOE from an OSW project involves maximizing the time a wind turbine is operating on the water providing electricity at low marginal cost to the grid
Economic values considered in this report focus on the regional economic impact of a given level of project spending on job creation and economic output in San Luis Obispo County Specifically the values calculated in this report provide a mapping from a given amount of direct investment in capital and labor in the county to the economic output and jobs that result from regional supply chain development and the affiliated increase in sales and output that spill across other regional industries from the spending of workers and business who derive income from the project (ie the economic ldquomultiplierrdquo)
The regional economic benefit to developing OSW farms in San Luis Obispo County represents only the value captured by the regional supply chain for a given amount of direct spending on OSW The proper interpretation of the results is the projected economic value realized by San Luis Obispo County from a given level of project spending (private cost) rather than the overall economic benefit that results from minimizing the social costs of electricity generation
To understand this distinction consider the effect of increasing the distance between OSW farms off the coast of Central California and the specialized wind port that serves them As the distance increases between the OSW farms and the specialized wind port the LCOE rises due to increased transportation and logistical costs of wind turbine installation and repair reducing time on the water for wind turbines to operate and resulting in higher electricity prices The overall economic value of the OSW project decreases over distance from the specialized wind port compounded by an increase in the external costs of carbon emissions in the transportation sector However because private costs are higher for OSW projects that involve greater distances to the specialized wind port locating OSW farms farther away from the port raises the economic value of the project to the regional economy for instance by adding jobs in the water transportation industry Put differently the economic value to the regional economy will appear larger as the distance increases between the OSW farms and the port whereas the overall economic value of the OSW project is larger when OSW
Economic Impact of Offshore Wind Farm Development on the Central Coast
17
farms are situated in closer proximity to the specialized wind ports
While developing projects with lower LCOE and lower external costs from pollution in the transportation sector provide the greatest overall economic value projects with higher LCOE provide greater stimulus to the regional economy Thus the proper interpretation of the regional economic values calculated in this report are the impacts to San Luis Obispo County from a fixed level of project spending
01 Wind speeds are generally strong
02 The region has existing connections to the statersquos electrical grid
03 Much of the coast is outside of national marine sanctuaries where disturbance to the seabed is prohibited
04 The region is favorably positioned between major population centers with high power demand in Northern and Southern California
THE CENTRAL CALIFORNIA REGION IS IDEAL FOR OFFSHORE WIND
DEVELOPMENT FOR SEVERAL REASONS
Economic Impact of Offshore Wind Farm Development on the Central Coast
18
SECTION 2
INDUSTRY BACKGROUND AND REQUIREMENTS
Economic Impact of Offshore Wind Farm Development on the Central Coast
19
2 INDUSTRY BACKGROUND AND REQUIREMENTS
Interest is growing for the development of OSW in California as large-scale adoption of renewable energy is needed to substitute for fossil fuel-generated electricity under the statersquos ambitious climate goals
Along the coastline of California the ocean floor slopes steeply downward into deep waters requiring the use of floating platforms for OSW as opposed to platforms fixed to the ocean floor like those currently used in shallower waters along the East Coast Recent advances in floating platform technologies have greatly reduced the cost of developing floating OSW farms making it possible to build OSW to scale in California Floating OSW farms have the potential to provide California with a reliable source of renewable energy that can deliver electricity to Californiarsquos homes and business during times of peak energy demand while operating largely at distances beyond the sightlines of coastal property (See Figure 21)
According to NREL Californiarsquos offshore technical resource capacity is about 112 GW17 BOEM has initiated plans to develop OSW power off the coast of California in a recent call for information from companies interested in purchasing commercial wind energy leases in federal waters off the coast of Central and Northern California Specifically the Call Areas for BOEM identify three potential OSW sites off the coast of California Humboldt Bay Morro Bay and Diablo Canyon The Central California Call Area offers a combined electricity generation capacity of 7 GW for OSW
Developing OSW energy on the Central Coast to its full potential will require cooperation from the US Department of Defense (DOD) Following the announcement of the BOEM Call Areas in 2018 DOD assessments found OSW development in the region to be incompatible with the wide array of critical DOD operations citing significant mission activities in the Diablo Canyon Call Area18
Figure 21 Schematic of a Floating Offshore Wind Farm
Source BOEM California Offshore Renewable Energy Fact Sheet February 22 2017
Economic Impact of Offshore Wind Farm Development on the Central Coast
20
Subsequently a group comprised of DOD BOEM NOAAs Office of National Marine Sanctuaries Congressman Carbajal and Congressman Panetta has focused on expanding the OSW planning area by considering potential development areas proximate to and within the Morro Bay Call Area that may be compatible with DOD operations While the Diablo Canyon Call Area may not be developed due to other ocean use and environmental conflicts there is sufficient sea space in and around the Morro Bay Call Area to support 7 GW of OSW
Figure 22 shows the Morro Bay and Diablo Canyon Call Areas initiated by BOEM and Figure 23 shows a proposed modification to the Morro Bay planning area that would accommodate 7 GW of OSW development in and around the Morro Bay Call Area19
Developing up to 7 GW of OSW farm capacity in and around the Morro Bay Call Area has the advantage of making use of available grid interconnections in San Luis Obispo County through the existing 500-kV transmission lines at Diablo Canyon and Morro Bay However realizing the renewable energy potential for floating OSW energy development in and around the Morro Bay Call Area represents a massive undertaking for Central California communities
Figure 22 The Morro Bay and Diablo Canyon Call Areas
Source BOEM California Activities httpswwwboemgovcalifornia
Economic Impact of Offshore Wind Farm Development on the Central Coast
21
The deployment of floating OSW platforms presents complex manufacturing logistical and maintenance challenges Making OSW a reality for California will require development of an extensive regional supply chain much of which has the potential to be centered in San Luis Obispo County To ensure that critical elements of this supply chain take root in California providing jobs and income for Central Coast residents (as opposed to outsourcing these needs to other regions) the development of OSW farms will require major upgrades to Central Californiarsquos infrastructure for ports transportation and transmission
Three elements are imperative for success in OSW development
bull the availability of a specialized wind port and port infrastructurebull ensuring enough transmission capacity and interconnection to the electric gridbull access to a reliable well-trained workforce for wind farm construction and OampM
The payoff to the San Luis Obispo County region for developing a regional supply chain for OSW power is the creation of a green energy sector that can provide head-of-household jobs health and retirement benefits and career opportunities for workers in the green economy including the potential to deliver jobs to workers from disadvantaged communities20
Figure 23 Proposed Expansion to the Morro Bay Call Area
Source American Wind Energy Association California and Offshore Wind California 2020
Economic Impact of Offshore Wind Farm Development on the Central Coast
22
01 The availability of a regional port and port infrastructure
02 Ensuring enough transmission capacity and interconnection to the electric grid
03 Access to a reliable well-trained workforce for wind farm construction and OampM
THREE ELEMENTS ARE IMPERATIVE FOR SUCCESS IN OSW
DEVELOPMENT
The payoff to the San Luis Obispo County region for developing a regional supply chain for OSW power is the creation of a green energy sector that can provide head-of-household jobs health and retirement benefits and career opportunities for workers in the green economy including the potential to deliver jobs to workers from disadvantaged communities
Economic Impact of Offshore Wind Farm Development on the Central Coast
23
21 TECHNOLOGY DESCRIPTION
California differs from the Northeast US in that its deep coastal waters require a different type of offshore wind technology floating platforms for wind turbines Floating platform technology for OSW has been successfully demonstrated in multiple jurisdictions worldwide with larger-scale commercial projects being planned and contracted for deployment in the near future While the cost of floating offshore wind today remains higher than the fixed-bottom offshore wind that prevails on the East Coast the technology is now well understood and the cost of OSW power is expected to decline rapidly with the scale of deployment as commercialization continues
Each floating offshore wind system consists of a commercially available floating support structure and a large offshore wind turbine generator The proposed plant located approximately 45 km offshore is expected to have between 70 and 100 floating windmills
Floating OSW technology requires no piling making it well-suited for deep and variable seabed conditions Each floating windmill is attached by anchor to the sea floor as seen in Figure 24
Floating OSW technology has other benefits over fixed OSW foundations as well Floating wind turbines can be larger anchored in deeper water towed back to shore for major repairs and upgrades and safer for ground risk shore-side assembly and deployment further offshore compared to fixed OSW foundations22
There are four basic components of an OSW turbine the tower nacelle hub and blades These components (OSW turbines to towers and floating platforms) are all delivered by marine vessels for final assembly in bays within the specialized wind port Before any components are attached to
Figure 24 Floating OSW
Source Lou Thomas and Wu (2019)21
Economic Impact of Offshore Wind Farm Development on the Central Coast
24
the floating platform at the specialized wind port the hub is connected to the nacelle and attached to the tower which is typically composed of three or four different segments The bottom segment of the tower is attached to the floating platform the remaining tower segments are stacked on top of the structure and then the assembled nacelle-hub is attached to the top of the tower by a crane where the turbine blades are attached to complete the assembly of the OSW turbine23 Once the turbine is attached to the floating platform as a finished OSW turbine the floating platform is connected to a ship and transported to the offshore windfarm location (see Figure 25) where it is installed to anchors and moorings on the offshore site24
Each OSW farm which is projected to have a nameplate capacity of 1 GW is composed of arrays of individual OSW turbines The capacity of an individual OSW turbine to generate power is currently in the range of 3 MW to 15 MW For the baseline 1 GW OSW farm considered in this report a 1 GW OSW farm consists of 100 individual wind turbines each with a 10 MW nameplate capacity
22 OSW POWER HAS A FAVORABLE TIME PROFILE ON THE ELECTRICITY GRID
OSW power on the Central Coast of California (CCC) provides electricity at favorable times Offshore wind power on the CCC peaks each day during evening hours and reaches its maximum potential during spring and summer months of the year This timing profile for power delivery matches favorably with wholesale energy prices on the California Independent System Operator (CAISO) electricity grid Electricity demand is highest during the summer and peaks at around 6 pm in summer months (Wang et al 2019)25 In contrast solar and onshore wind generation peak at times of relatively low electricity demand creating problems for reliability and functionality of the grid Solar power production peaks around noon whereas land-based wind peaks around midnight
Figure 25 Transportation of an Assembled OSW Turbine
Source Principle Power 2011
Economic Impact of Offshore Wind Farm Development on the Central Coast
25
The timing of peak offshore wind power production aligns well in a portfolio of energy sources that provide peak power at different times Developing a reliable electricity portfolio by combining renewable sources smooths out deliveries on the grid relaxing supply constraints in a system with limited storage capability26
Combining OSW with onshore wind and solar power results in a more reliable delivery profile for renewable energy that better matches with electricity demand Superior matching displaces reliance on carbon-intensive natural gas (ldquopeakerrdquo) plants during evening hours and as fossil-fuel based electricity sources are phased out over time in California reduces reliance on costly grid-scale lithium-ion battery storage
Figure 26 demonstrates the hourly value of OSW in a renewable energy portfolio The value of electricity generated at different times is represented by the RESOLVE price calculated by Energy and Environmental Economics (E3) The RESOLVE model estimates the optimal price of alternative energy solutions during each hour of the day taking into account hourly operations of alternative energy solutions during each hour of the day the intraday variability of load and renewable generation planning reserve requirements and an annual greenhouse gas constraint that the whole system must operate at a level of emissions below the maximum emission cap27
23 PORT INFRASTRUCTURE REQUIREMENTS
The large size of modern OSW turbines limits the transport of finished products over land As a result the final assembly of OSW towers which involves attaching turbine blades to floaters must
Figure 26 The Diurnal Pattern of Offshore Wind Power and Energy Prices
Source Energy and Environmental Economics Inc 2019
Economic Impact of Offshore Wind Farm Development on the Central Coast
26
occur at a waterfront location with a large amount of acreage a specialized wind port facility and quays that have been reinforced to withstand heavy loads
The development of a regional supply chain for OSW in this report assumes that suitable specialized wind port facilities will be available for manufacturing and assembly of OSW turbines Two alternatives appear potentially viable for OSW development on the Central Coast
bull construction of a specialized wind port in San Luis Obispobull assembly at other ports in California such as Oxnard (Port Of Hueneme) Long Beach San
Diego and Eureka where the Port of Humboldt Bay has been proposed to be refurbished as a specialized wind port for the assembly of OSW turbines28
Because the existing capacity for floater assembly is lacking on the West Coast the manufacturing of floating foundations for OSW turbines will likely occur outside of the US The role of the specialized wind port is to conduct final assembly of the wind turbine in a staging area situated as near as possible to the OSW farm to economize on transportation cost and logistical issues during installation repair and decommissioning of OSW farms Based on the experience of OSW farms in the UK the tower pieces are imported from Denmark or Spain with final assembly occurring on-site in reinforced quays For OSW farm development on the Central Coast the height of some components limits the location of a specialized wind port to those without height limitations from features such as bridges which precludes use of the Port of Oakland due to clearance limits on the Bay Bridge and Golden Gate Bridge
As the distance increases between the OSW farm and the specialized wind port where final assembly occurs the levelized cost of energy (LCOE) rises due to the additional transport cost Greater distances between OSW farms and the specialized wind port makes projects less practical for industry partners seeking to provide zero-carbon electricity to consumers at minimal cost The LCOE rises over distance from the port not only due to transportation costs and the related logistical issues associated with scheduling shipping lanes but also due to the high opportunity cost of removing OSW turbines from the water for repair Repair of OSW turbines with existing technology requires removing floating OSW structures from offshore mooring and towing the structures into the specialized wind port which requires scheduling shipping lanes and arranging transport during periods of relatively calm seas
Given the high fixed cost and low variable cost of generating electricity from OSW the economics of OSW favor keeping OSW turbines on the water and connected to the grid for as long a period as possible to recover the sunk cost of installing them Distance from the port reduces the number of days OSW turbines are on the water which erodes the economic benefit to California from developing OSW farms
The Massachusetts Clean Energy Center (MassCEC) conducted a detailed assessment of port construction requirements for OSW in 2017 including the potential for both turbine and foundation manufacturing A major finding of the study was that the sheer distance required to transport OSW components from overseas is likely to incentivize investment in US manufacturing facilities29 At the present time it is anticipated that both floating platforms and turbines for OSW will be shipped
Economic Impact of Offshore Wind Farm Development on the Central Coast
27
to California from overseas likely from South Korea or China then received at a specialized wind port for final assembly and installation on an OSW farm
The specialized wind port where assembly occurs must have protected waters and no overhead obstruction for fully assembled turbines to be towed out standing to the offshore site (see Figure 27) The sheer scale of OSW turbines imposes land requirements for manufacturing to take place in the specialized wind port Providing throughput of 500 MW per year of OSW at the port with the 10-15 MW turbines available today will require about 50 acres of land for movement storage and assembly
In 2016 BOEM commissioned a study on the suitability of various California ports for OSW assembly The study identified Port Of Hueneme as the most suitable existing port for OSW assembly followed by Long Beach and San Diego30 However as Collier (2017) reports all of the recommended ports suitable for OSW assembly are constrained by available land adjacent to the port that would be necessary for manufacturing31 In the case of Port Of Hueneme land constraints limit the ability of the port to take on new manufacturing without making use of land on the existing Navy yard and logistical problems arranging transportation through the Santa Barbara Channel hamper its ability to serve as a specialized wind port for multiple large-scale OSW farms off the Central Coast
Apart from making use of existing ports another possibility is to develop one or more specialized ports for assembly of OSW turbines in California Humboldt Bay in Eureka has a deep-water harbor
Figure 27 Turbine Assembly and Assembled Turbine in Port
Source Principle Power 2011
Economic Impact of Offshore Wind Farm Development on the Central Coast
28
and vast expanses of vacant industrial land that can be developed for OSW turbine (and even floater) assembly however the use of Humboldt Bay for OSW development faces major logistical challenges for land transport and the region lacks grid interconnection as a hub for OSW In contrast the Central California area offers reliable grid interconnection at Morro Bay Power Plant (MBPP) and Diablo Canyon Power Plant (DCPP) but lacks a deep-water port
While it may be possible to serve floating OSW farms in Central California from Port Of Hueneme or an expanded port facility in Humboldt Bay the economic practicality of installing and maintaining OSW farms from distant ports will require a reliability study Given the need to maintain OSW turbines on the water and keep them connected to the grid to recover the significant fixed costs of OSW development further study is needed to model the ability to service OSW farms from these more distant ports The economic viability of serving floating OSW farms from distant ports depends on the repair cycle for OSW turbines including the probability that failed systems can be scheduled for service quickly under port capacity logistic and weather constraints
DCPP decommissioning makes available a potentially suitable site to develop a specialized port facility for OSW The benefits of developing a specialized wind port for OSW on the DCPP property include
bull site availabilitybull potential for brownfield developmentbull a local revenue source from port fees and land improvementsbull reduced accident risk from the proposed DCPP decommissioning
A specialized wind port at DCPP would facilitate removal of DCPP decommissioning material by sea instead of by road A recent UCLA Transportation Risk Analysis finds that barging involves lower transportation risk (ie accidents injuries fatalities) than trucking and rail transport during the period of DCPP decommissioning Specifically combining barge transport for the initial leg of the route with trucking and rail for subsequent legs reduces fatality risks by over 40 percent and injury risk by 32 percent32
In terms of the present study the center for job creation and regional economic stimulus from OSW is at the ports A port facility provides a coordination point in the supply chain for manufacturing assembly transportation and offshore installation of OSW turbines as well as a maintenance yard for periodic repair and ultimately for disassembly and decommissioning During the 25-year operating period of the OSW farm the port provides facilities for turbine repair stimulating the regional supply chain for manufactured components and support for OampM staff Some turbine components can be transported by land which creates incentives for regional supply chain development for a wide range of industrial partsrsquo manufacturers in California and even nationwide However because the sheer size of offshore turbines is so large that they must be transported by water and because connecting the blades to tower sections and floating foundations requires final assembly to take place in reinforced quays the regional supply chains for OSW originate and terminate at the port
Economic Impact of Offshore Wind Farm Development on the Central Coast
29
24 TRANSMISSION INFRASTRUCTURE REQUIREMENTS
Compared with other renewable technologies OSW delivers power directly to coastal load centers where electricity is needed most Much of the existing transmission infrastructure in California was developed during the time of coastal power plants which now have been either decommissioned or slated for retirement The San Onofre Nuclear Generating Station was shut down in 2013 and is currently being decommissioned
In San Luis Obispo County the 650 MW Morro Bay Power Plant (MBPP) closed in 2014 leaving behind valuable transmission infrastructure The retirement of the Diablo Canyon Power Plant (DCPP) in 2025 which has a nameplate capacity of 2256 MW and generated 16163 GWh in 2019 for the California electricity grid33 will free up an additional 6 GW of transmission capacity Utilizing the combined 7 GW transmission capacity at DCPP and MBPP as interconnection points for OSW power reduces the cost of providing electricity on the grid
The existing PGampE transmission infrastructure that connects DCPP and MBPP to the wholesale electricity grid represents a highly valuable economic asset that can be repositioned to receive electricity generated from OSW in Central California The current DCPP transmission infrastructure is comprised of three 500-kilovolt (kV) high voltage direct current transmission lines that will become available for alternative use after closure of DCPP in 2025 The high cost of installing new electricity transmission lines creates an economic opportunity in San Luis Obispo County to repurpose the existing infrastructure for electricity transmission from OSW
For comparison development of a Northern California Call Area specialized wind port in Humboldt Bay will require new electricity transmission infrastructure to connect OSW power generation to the Bay Area with 500 kV transmission lines The estimated cost of installing transmission infrastructure to convey electricity to the grid for the more limited 1836 GW OSW development planned in the region is in the range of $17 billion to $3 billion depending on overland or subsea transmission options34 These costs are roughly in line with the projected cost of other electricity transmission projects in the US For example the projected construction cost for a single 500 kV direct current transmission line to deliver up to 3 GW of energy from Wyoming to the Eldorado Valley in Nevada was $35 billion in April 2013 an average cost of $42 million per mile over the length of the proposed 835-mile transmission line35 The existing transmission structure connecting DCPP to the electricity grid already has three 500 kV direct current transmission lines in place
The existing PGampE transmission infrastructure that connects DCPP and MBPP to the wholesale electricity grid represents a highly valuable economic asset
Economic Impact of Offshore Wind Farm Development on the Central Coast
30
25 REGIONAL SUPPLY CHAIN DEVELOPMENT
The ability of San Luis Obispo County to support the development of an OSW supply chain will greatly affect the regional economic impact of OSW development Simply put the economic impacts of OSW are larger for the region when the OSW industry derives a greater share of employment from the region as local workers who receive paychecks from OSW projects in turn spend their dollars at local businesses in the community
The establishment of a California-based OSW supply chain is an important factor in maximizing economic values derived in the State and San Luis Obispo County regions Underpinning the need for regional supply chain development are the logistics for OSW development which involves the delivery of the extremely large component parts required for turbine assembly into specialized wind ports Due to the significant costs of long-distance ocean transit the central hub for supply chain development will occur around the specialized wind port where OSW turbines are assembled36
In California the initial development of OSW projects is likely to depend on floating foundations imported from abroad with development of a regional supply chain needed for turbine assembly and for smaller machine components that can be manufactured domestically For example the foundations for California projects are likely to be manufactured in China South Korea or Japan due to past investment in developing offshore wind manufacturing capacity with a regional supply chain needed only for the final assembly of turbines that will take place in regional California ports According to a recent UC Berkeley study about 60 percent of all equipment in US wind farms is currently manufactured domestically with equipment suppliers such as GE Siemens and Vestas having manufacturing facilities in South Carolina Iowa and Kansas and Colorado respectively while generators are sourced from Europe or Asia37
In East Asia and Europe governments and wind turbine manufacturers have worked aggressively in recent years to develop complete supply chains for OSW including factories and other facilities for manufacturing turbines blades towers and floating foundations in high-tech clusters developed in specialized wind ports Several states on the East Coast including Connecticut Massachusetts Rhode Island Maryland and South Carolina have taken steps in industrial planning to create manufacturing hubs for OSW although the West Coast has lagged behind in light of the only recent advances in floating OSW technology over fixed platform technologies that can be used in the relatively shallow waters along the East Coast
Deploying commercial-scale floating wind farms will require collaboration between a wide range of occupations including skilled workers (pile drivers divers millwrights plumbers pipefitters welders cutters solderers brazers carpenters crane operators electrical technicians health and safety specialists) engineers (electrical environmental mechanical marine research subsea structure design) various dock and marine laborers vessel crews plant managers sales representatives lawyers and administrative marketing and communications professionals
At least in the initial phases of OSW development in California OSW foundations and wind turbines are likely to be transported from manufacturing facilities in Pacific Rim countries to one or more specialized wind port facilities in California where wind turbines will be attached to floaters and assembled in quays then barged to offshore sites to be anchored and connected to the electrical
Economic Impact of Offshore Wind Farm Development on the Central Coast
31
grid Once the turbines are installed and running employment in the industry will then transition to an operations and maintenance (OampM) phase that will create additional jobs for regular inspection and repair OampM jobs will largely be composed of environmental specialists vessel crews and engineers augmented by skilled workers crane operators and installation workers at the port facility during times when repair and maintenance is needed
Over a longer horizon it is possible that OSW investment in specialized wind ports for assembly of commercial-scale floating wind farms leads to development of expertise in building floating foundations A regional manufacturing facility for assembling floating OSW foundations would greatly reduce transportation and logistical costs However the analysis in this report does not consider the economic value of foundation manufacturing in California because intermediate term options exist to economize on shipping costs by developing this manufacturing expertise elsewhere on the West Coast for instance the Port of Seattle
Several factors affect the level of regional supply chain development for assembling OSW turbines in San Luis Obispo County
bull the existing industrial basebull local content requirementsbull skills of the workforcebull the timing of development
The existing industrial base in the region is important for the ability to source electrical components and other aspects of turbine assembly from local suppliers in California In the case of OSW the project would build on the existing industrial base in the green energy sector of San Luis Obispo County and neighboring Monterey County creating synergies among small businesses construction and electrical workers involved in the construction and operation of the commercial solar farms in these counties providing an immediate source of labor and electrical components that can transition to servicing OSW farms Santa Barbara County has existing workers with experience operating on offshore oil and gas platforms which facilitates the transition of workers in the region to new employment opportunities in the offshore installation component of the OSW industry such as setting anchors and moorings and offshore turbine installation
Local content requirements and government incentives can also be used to stimulate development of a regional supply chain for OSW Under a local content requirement agreements can specify that a minimum share of local employment be maintained For fabricated components that can be locally sourced government investment and financial incentives can accelerate the pace of regional supply chain development While there are legal restrictions to imposing local procurement and hiring requirements in California under the Commerce Clause of the US Constitution there are nevertheless numerous policy tools available to increase local hiring For example Community Benefits Agreements (CBA) and Community Workforce Agreements (CWA) can be used by developers for infrastructure projects such as port construction and improvement The use of local business enterprise (LBE) and disadvantaged business enterprise (DBE) provisions can also result in increased local procurement and hiring38
Economic Impact of Offshore Wind Farm Development on the Central Coast
32
The relevant skills of the local workforce are also important for development of the regional supply chain for OSW San Luis Obispo County is relatively small in terms of population but offers proportioned access for its size to a skilled workforce of construction and electrical workers both due to the recent construction of commercial solar plants in the California Valley and active commercial and residential real estate sectors The region also has businesses engaged in fiberglass manufacturing and marine vessel operators that have the skills needed to find employment in the OSW industry in the event that it develops in the county
Finally the size and timing of supply chain development is important For a regional supply chain to develop manufacturers must specialize in providing products that meet the needs of the industry which in turn requires assurance that consistent demand will materialize for these products before permanent employees are hired and sunk costs are incurred to grow the industry In the case of OSW development investment decisions will be facilitated if regional manufacturers capable of providing labor components and technical expertise to OSW farms have a clear expectation for sequential development of 6-7 GW of OSW farms staged over multiple years relative to the case of a single 1 GW wind farm The timing of OSW projects is also important if multiple wind farms enter production in Central California as a steady flow of projects over time provides stronger incentives for regional supply chain development
26 TIMING OF PROPOSED WIND FARM DEVELOPMENT
Staging and coordinated development of OSW is essential For example a single port harbor facility will become overburdened with multiple projects under construction at the same time The maximum throughput for each quay in the port is one 10 MW wind turbine per week and the wind turbine must be moved before work can begin on the subsequent turbine Therefore developers will need to consider multiple facility strategies and secure their options well ahead of time
Figure 28 Wind Turbine Development Timeline
Economic Impact of Offshore Wind Farm Development on the Central Coast
33
Figure 28 shows the timeline for OSW farm development Following a projectrsquos commissioning and turbine assembly phases the operation and maintenance (OampM) period of OSW will also require ports for transportation of personnel and components (for offshore repairs and upgrades) and for receiving OSW turbines towed back to the port for repair
Given the seasonal logistics of installing OSW turbines throughput at the specialized wind port is expected to be approximately 500 MW per year during the assembly period The assembly period considered in this report uses a more conservative time frame of 3 years for each 1 GW OSW farm The Operations amp Maintenance (OampM) period for each 1 GW OSW farm is then 25 years followed by a decommissioning period of 3 years The spending pattern for a single 1 GW OSW farm is punctuated by two spikes in regional employment the first during the 3-year assembly phase of the OSW farm and a subsequent and larger spike during the 3-year decommissioning phase in which OSW turbines are taken back to the port and disassembled
For a specialized wind port to support a 3 GW field of wind farms the assembly period is prolonged from 3 years to 9 years by staging OSW turbine assembly in successive 3-year periods for each 1 GW OSW farms Accordingly for a specialized wind port to support a 7 GW field of OSW farms the assembly period is prolonged from 3 years to 21 years It is possible that this period would be shortened by bringing OSW turbines to the Central Coast from other nearby ports that develop the manufacturing capacity for OSW andor by floating fully assembled structures into place from ports in Asia
After OSW turbines are assembled and installed in the ocean the specialized wind port conducts maintenance and repair operations for up to 7 GW of OSW during the OampM period for the projects At a failure rate of once every 25 years for 10 MW wind turbines the specialized wind port would need to accommodate the repair of approximately 28 wind turbines per year to support a 7 GW field of OSW farms
27 EMPLOYMENT AND OUTPUT DEMOGRAPHICS IN SAN LUIS OBISPO COUNTY
As of 2019 San Luis Obispo County has a population of 283111 175 of whom are under the age of 18 209 over the age of 65 and 592 veterans39 From 2011 to 2016 the San Luis Obispo County population grew 3840
Educational attainment in San Luis Obispo County (70) is above the statewide average (62) and national average (59) Two out of 5 residents in the county have a bachelorrsquos degree or higher San Luis Obispo County is predominantly white (69) with the second largest ethnicity being Hispanic or Latino at 2241
The San Luis Obispo County labor market supports 178476 total jobs In 2019 employment in the county was 208 farm jobs 8469 private nonfarm jobs and 1323 public sector jobs including state and local government employment and the military42
The average earnings level per worker in the county is $56409 which is lower than both the state and national averages of $78217 and $66029 respectively43 Figure 29 compares the income
Economic Impact of Offshore Wind Farm Development on the Central Coast
34
distribution in San Luis Obispo County compared to California and the US San Luis Obispo County workers are more likely to have medium and medium-high paying jobs in the $35000 to $149000 range than workers in the rest of California and the US but are less likely to have jobs of $150000 or more
In the past 10 years the county has seen significant job growth Figure 210 illustrates the total number of jobs in the county versus the cumulative job growth rate from 2010
Overall about 30000 additional jobs were created in San Luis Obispo County representing a total 21 growth rate and a 191 annual growth rate over the period This figure is considerably larger than the US total over the period (18) although smaller than that of California (25)44 The strong job growth in San Luis Obispo County has led to comparatively low levels of unemployment with an unemployment rate of 67 in December 202045 relative to the state average of 946
The greatest portion of jobs in San Luis Obispo County are in the tourism hospitality and recreation education and knowledge creation and healthcare industries which together make up 41 or 50000 jobs Since 2010 the information and communication technologies industry experienced the greatest growth (51) followed by the building and design industry (41) and the defense aerospace and transportation manufacturing industries (37) These rapidly growing industries provide the mid- to high-wage job growth in the county with average wages ranging from $59069 to $8188047
Figure 29 Income Distribution in San Luis Obispo County Relative to State and National
Economic Impact of Offshore Wind Farm Development on the Central Coast
35
Gross domestic product (GDP) in San Luis Obispo County was $191 billion in 2019 with GDP per capita of $6734048 Figure 211 shows the GDP growth rate in San Luis Obispo County over the last decade Over the period of 2010 to 2019 San Luis Obispo County real GDP growth was 2745 exceeding the growth rate in national real GDP of 2239 but lagging behind the real GDP growth rate of 3615 for California over the period49
Figure 210 10 Year Job Growth in San Luis Obispo
Figure 211 GDP Growth Rate in San Luis Obispo County California and the US
Economic Impact of Offshore Wind Farm Development on the Central Coast
36
SECTION 3
METHODS AND SCOPE
Economic Impact of Offshore Wind Farm Development on the Central Coast
37
3 METHODS AND SCOPE
31 SCOPE OF THE STUDY
The regional economic benefits calculated in this report are predicated on the development of a specialized wind port in San Luis Obispo County to provide service for up to 7 GW in OSW capacity in and around the Morro Bay Call Area In the event that a specialized wind port for OSW assembly is not constructed in San Luis Obispo County the regional economic benefit would instead materialize in whichever county provides the specialized wind port
At the State of California level the value of OSW development combined across all counties will be similar to the value reported here for the state-level impact with one important caveat If the specialized wind port is located farther away from the OSW farms than a neighboring county such as Monterey or Santa Barbara mdash for instance if a specialized wind port is developed in Humboldt Bay as a single hub for OSW assembly in California mdash then additional project cost would be required for water transportation (eg labor and fuel) raising direct spending at the more distant specialized wind port relative to the case considered here for a port in San Luis Obispo County The resulting increase in direct project spending would result in greater job creation and larger regional economic benefits for the more distant county in the transportation industry however because the social cost of OSW increases with distance from the specialized wind port both in terms of private costs and external costs incurred during water transportation50 locating the specialized wind port farther from the OSW field results in lower economic benefits to California Therefore using values from regional economic models to make such a comparison would be misleading
This report considers two phases of offshore wind (OSW) development off the Central Coast
1 An initial planning period that involves construction of a specialized wind port in San Luis Obispo County
2 OSW farm development with staged assembly of up to 7 GW capacity of OSW
For both phases the regional economic value captured in San Luis Obispo County is conditional on construction of a specialized wind port in the county either on the DCPP property or elsewhere in the county
If for example a specialized wind port was located on the existing DCPP property the specialized wind port provides a conduit for job creation in San Luis Obispo County The indirect benefits that would occur in the regional economy from the influx of new jobs at the port would extend to other counties in California for instance through supply chain development to vendors contractors and component manufacturers in Santa Barbara County Ventura County Monterey County and Kern County The indirect purchases stimulated in different counties in California is accounted for in the model however because the regional supply chains for OSW projects likely will extend across state borders the development of OSW in Central California will provide additional economic value for neighboring states in a manner that falls outside the lens of the model
Workers employed at a specialized wind port in San Luis Obispo County will spend much of their
Economic Impact of Offshore Wind Farm Development on the Central Coast
38
disposable income making induced purchases such as food retail items and restaurant meals at establishments near their homes The regional economic model matches employment at the specialized wind port to the available workforce in San Luis Obispo County which implicitly assumes that available workers in San Luis Obispo County are employed at the specialized wind port before jobs are offered to workers outside the county Thus the regional economic value for San Luis Obispo County will attribute a greater share of induced spending by workers to establishments in San Luis Obispo County than if these workers commute to work from residences across county lines Given the proximity between DCPP and nearby population centers in Northern Santa Barbara County such as Santa Maria and Orcutt a share of the regional economic value attributed to San Luis Obispo County in this report will materialize in Santa Barbara County for workers commuting across county lines
The model used to calculate regional economic benefits in this report matches workers employed in San Luis Obispo County to the available workforce in San Luis Obispo County Specifically the model assigns jobs in San Luis Obispo to workers in San Luis Obispo if the labor force exists in the county to meet the job requirements and only reaches outside the county for workers when the industry providing the labor service no longer has available workers in the county to perform the task In practice workers from outside the county may outcompete workers in the county for jobs (eg by being willing to take the job for a lower wage or by having superior skills) in a manner that is not accounted for in the regional model To the extent that workers commuting across county lines compete intensively for these jobs the model will over-attribute induced spending of workers to San Luis Obispo County from household purchases that occur in the neighboring counties where commuting workers reside
311 SPECIALIZED WIND PORT
The scope of the analysis encompasses the value of the regional output and employment effect resulting from the development and use of a specialized port in San Luis Obispo County for the assembly maintenance and repair of OSW farms Because a specialized wind port is necessary to receive the regional economic value from OSW development and San Luis Obispo County does not currently have one it is necessary to model the construction of a specialized wind port jointly with the development of large-scale OSW projects in the region
The goal of the present study is to calculate the regional economic benefit to San Luis Obispo County from the development of 3 and 7 GW OSW capacity in and around the Morro Bay Call Area The model does not encompass the full economic value of constructing a specialized wind port in San Luis Obispo County which might be used for the movement of other goods apart from OSW components Therefore this report considers solely the development of a specialized wind port used only for staging the assembly installation and repair of OSW Any additional regional economic value that can be generated from a specialized wind port from importing and exporting goods unrelated to OSW is not included in the report The scope of economic benefits considered in this report is conservative because developing a specialized wind port for OSW involves construction costs for elements such as a breakwater that would in turn economize on the cost of
Economic Impact of Offshore Wind Farm Development on the Central Coast
39
expanding the footprint of a specialized wind port beyond the specialized needs required to create a hub for OSW
Construction of a specialized wind port on the DCPP property occurs in the model over the 5-year period of 2024-2028 Constructing a specialized wind port for OSW will require an estimated 1100 construction jobs per year at a total direct cost in the range of between $17 and $25 billion The analysis considers only the direct job requirement of port construction (1100 workers per year) to be sourced locally as it is currently unclear where the materials used to construct the port such as the breakwater and pilings will be sourced Considering only the direct job requirement for constructing a specialized port for OSW in San Luis Obispo County results in a conservative measure of the regional economic benefit as all construction material required to be purchased for port construction is implicitly assumed to be sourced from locations outside of California The total project cost which is substantially larger than the direct labor cost component of the project is included only to calculate the fiscal benefit of sales and use taxes in Section 5 which implies project spending on imported material is designated as a California sales transaction at the point of delivery to the port
312 DEVELOPMENT OF A REPRESENTATIVE 1 GW OSW FARM
The timeline of a representative 1 GW OSW farm has 4 phases planning amp permitting (7 years) assembly (3 years) operations and maintenance (25 years) and sunsetdecommissioning (3 years)
Figure 31 shows the average labor requirement for a 1 GW OSW farm during each phase of development in the case of a sunset period involving decommissioning of the OSW farm
Figure 31 Average Labor Requirement for a 1 GW OSW Farm over the Life of the Plant
Economic Impact of Offshore Wind Farm Development on the Central Coast
40
The planning phase for the first OSW farm occurs over the period 2022-2028 which coincides with the granting of a lease through a BOEM auction and the development of a specialized wind port in San Luis Obispo County both of which must also occur over this time period to realize the regional economic benefits of OSW
The assembly phase considers a 3-year assembly period for each 1 GW OSW farm starting with the first 1 GW wind farm over the period 2029-2031 While OSW turbine assembly in the specialized wind port can potentially occur at a faster pace for instance 500 MW per year (or 2 years per 1 GW OSW farm) a longer 3-year period is considered for each OSW farm to account for the logistics involved in arranging installation around weather events and conducting repairs for multiple OSW farms The assembly phase will tend to be shorter for the first 1 GW OSW farm than for subsequent wind farms because of the need to maintain space in the specialized wind port for turbine repair For development of a field of 7 GW OSW farms the assembly period involves staging the assembly of each 1 GW OSW in successive 3-year periods so that assembly occurs for a total of 21 years for a total of seven 1 GW OSW farms
The OampM phase for each 1 GW OSW farm consists of an operating life of 25 years (the OampM period) following turbine assembly and installation For the first 1 GW OSW farm the OampM period is 2032-2058 and the OampM period is set back by 3 years for each subsequent 1 GW OSW farm due to the staging of assembly in successive 3-year periods at the port
313 DECOMMISSIONING AND RECOMMISSIONING PROVISIONS FOR A 1 GW OSW FARM
The representative 1 GW OSW farm is decommissioned over a 3-year period coinciding with partial OSW farm operation and partial disassembly as OSW turbines are removed from the farm For the initial 1 GW OSW farm decommissioning occurs over the period 2057-2059 For each 1 GW OSW farm installed thereafter the assembly period is pushed back 3 years by staged operations at the port pushing back the sunset period by 3 years for each subsequent 1 GW OSW farm During the sunsetting period each 1 GW OSW farm comes back to port to be disassembled Current requirements for decommissioning involve a 3-year decommissioning period however given the strong economic incentive to maximize the length of time on the water for individual OSW turbines it is likely by 2059 that the period will be shorter for decommissioning (as well as for redeployment in the case of lease renewal)
Decommissioning occurs for each OSW farm after 25 years of operation and is accomplished two ways in the model
bull decommissioning as required by BOEM lease agreementsbull or recommissioning which involves renewing or replacing the lease agreement to maintain 1
GW OSW on the leased area for a subsequent 25-years of operation
The economic return for maintaining wind turbines on the water once the capital expenditure is sunk suggests that streamlined processes will be developed for decommissioning and replacing OSW farms by the end of the initial BOEM lease period
Economic Impact of Offshore Wind Farm Development on the Central Coast
41
In the case of decommissioning the value of a 7 GW field of OSW farms is reduced by removing OSW turbines from the water at the end of each lease agreement Under recommissioning the benefit of a field of 7 GW OSW farms can be measured in perpetuity (ie as a renewable resource) by considering the annual benefit under an integrative lease process designed to keep wind turbines generating electricity and connected to the grid In the case of recommissioning each 1 GW OSW farm is replaced in a single 3-year period rather than modeling separate decommissioning and assembly periods where one 1 GW OSW farm is decommissioned for 3 years before the next 1 GW OSW farm can be assembled
The design life of the wind turbine generator and the floating substructure that supports it coincides with an expected operating life of 25 years for OSW After the 25-year life of an OSW farm either the farm would need to be replaced or the turbines would need to be refurbished to extend the life of the units for another 25 years Under the recommissioning option each 1 GW OSW farm in the field of 7 GW OSW remains in service for electricity production either by remaining in operation or by being replaced by another in an integrative fashion that handles the logistical challenges Under recommissioning the model economizes on what would otherwise be a 6-year transition period (3 years for decommissioning of the initial OSW farm plus 3 years assembly for installing the replacement 1 GW OSW farm) with a single 3-year period that integrates the decommissioning and assembly phases The decrease in time required to replace a 1 GW OSW farm with another at the end of each lease capitalizes on the economic benefit of maintaining wind turbines generating electricity for the grid during the transition given the availability of existing anchors and moorings and other fixed investments at the offshore site that reduce the deployment time for a subsequent OSW farm
The labor requirement for an integrated recommissioning process is taken to be two times the onshore labor required during the initial assembly period (once for disassembly and again for reassembly) plus the labor required to reinstall each windmill to the existing cables and moorings at the offshore site The use of two times the onshore labor component is consistent with recent experience at the WindFloat prototype in Aguccediladoura Portugal in which wind turbines were brought back to shore and removed from the foundations for repair and then the entire structures were reassembled cleaned repainted and installed back into service at the offshore site The recommissioning scenario results in conservative regional economic value relative to the case of a decommissioning period for each 1 GW OSW farm followed by approval and installation of an entirely new 1 GW OSW project through an uncoordinated process as an orchestrated process economizes on direct project spending by combining the two phases into a single 3-year period
The economic value from the recommissioning scenario is conservative because it assumes replacement at the end of the 25-year operating horizon with an identical 1 GW OSW farm To the extent that turbine technology is superior 30 years from now the economic value of a replacement 1 GW OSW farm will be larger than the value considered here in the recommissioning scenario however much of this benefit will be captured by an improved capacity factor of turbines that deliver electricity at a lower LCOE That is the benefit of supplying electricity at lower cost is received in the electricity market and not something that would necessarily affect the regional
Economic Impact of Offshore Wind Farm Development on the Central Coast
42
supply chain and labor market that are the focus of this report The labor market requirement to install a replacement 1 GW OSW farm is taken to be the same as the labor requirement for the representative 1 GW OSW farm today in terms of the number of employees needed at each stage of the process in Figure 31 above The regional economic value is conservative by assuming that in 30 years there will still not be manufacturing capability for floating offshore platforms and turbines in California
It should also be noted that conveying the electricity produced at each 1 GW OSW farm will require grid connection costs to provide interconnection and transmission to Californiarsquos electricity grid The cost of constructing transmission lines for a field of 7 GW OSW farms will be lower to the extent that the suggested project makes use of the existing 500 kV transmission cables that currently connect DCPP to the electricity grid This makes the Central California region highly attractive for OSW energy development Nevertheless substantial additional expenses will be needed to develop offshore spur lines to connect OSW farms to landfall via undersea cables that extend many miles out to sea which will also require a supporting structure of sub-stations and terminals to connect cables at landfall with the existing onshore interconnection and transmission structure that exists at DCPP
32 METHODS
The regional economic impacts calculated from OSW farm development in Central California reflect the ldquoripple effectrdquo of new jobs and economic output that occurs when direct investments in the offshore wind industry complex lead to expansion in the production of upstream supply-chain inputs plus induced spending as new employee households increase local spending (eg grocery stores auto dealerships and restaurants) It should be noted that economic impacts are different from economic viability or profitability Economic impacts reflect expenditures and the extent to which inputs are locally sourced Higher costs (that would reduce economic viability and profit) in fact lead to larger economic impacts
Over time economic impacts can change As installed wind farm capacity in California increases one might expect not only cost-reducing learning effects but also an increase in the local share of input sourcing due to in-state investment in manufacturing specialized OSW inputs To the extent that this type of specialized investment occurs for instance if the ability to manufacture floating foundations for OSW develops somewhere in California then the regional economic impact of OSW farm development on the Central Coast would be greater for the State of California than is captured here
Regional economic impacts are increased by greater project expenditures as well as by a larger share of inputs that are locally sourced in the region Thus regional economic values differ from the overall economic value of a project because greater project expenditures raise total costs of electricity generation harming economic value while providing for greater regional stimulus The regional economic value of OSW farms is usually limited to direct wind farm capital and operations and maintenance (OampM) costs which are recovered through revenues derived from power purchase agreements Port and transmission infrastructure improvements typically are
Economic Impact of Offshore Wind Farm Development on the Central Coast
43
not included in regional economic values for OSW which is why the regional economic benefit is calculated separately for the construction of a specialized wind port in San Luis Obispo County Port infrastructure investments would likely be made by a terminal operator with costs of port construction recovered through various fees paid by users of terminal facilities to the terminal operator Similarly transmission infrastructure costs would likely be incurred by PGampE or another electricity provider with costs recovered by way of transmission access charges (TACs) paid by regional energy consumers
Regional economic models are based on a set of input-output (I-O) production relationships in the county (and neighboring counties) where the investment occurs Final goods such as wind energy are the outputs of the model which requires a variety of input purchases to be made in a variety of upstream markets (supply-chain effects) to construct and operate the OSW farm Upstream market purchases include labor from different industries and the purchase of intermediate goods (eg manufactured parts such as turbine blades manufactured electrical components and raw materials such as concrete and steel) Some of these inputs can be locally sourced while other inputs must be imported from outside the region as is presently the case for both turbines and floating foundations I-O models use economic data on current workers and component manufacturers in affiliated industries at the county level to create a simplified quantitative depiction of the ability to locally source inputs to meet the output requirements of a project thereby capturing regional economic value
This study utilizes the Regional Economic Models Inc (ldquoREMIrdquo) Policy Insight Plus (ldquoPI+rdquo) model to estimate the current and future economic impact of OSW development on San Luis Obispo County and neighboring counties REMI PI+ is a sophisticated economic modeling tool used by public agencies consulting firms nonprofit organizations and local governments to simulate the economic impact of a variety of public and private capital investments including infrastructure development energy projects and military bases
The REMI PI+ model calculates the regional economic impact of OSW development in San Luis Obispo County using data on the local labor requirement to install operate and decommission a field of 1 GW OSW farms at the specialized wind port The REMI PI+ model is a dynamic I-O model that uses this data to determine the current impact of OSW farm development as well as its forward-looking impact given historical changes in the business cycle and the ability of future workers and industry to migrate to the region The results of the model are reported for each county individually
The model provides output that quantifies the economic impact of a certain area of study and for the sake of this report allows results to be segmented on a county-wide basis into the number of jobs created benefit to county GDP and the general tax implications In construction of the model REMI PI+ uses audited data from public agencies such as the US Bureau of Economic Analysis and the US Census Bureau as well as user inputted data to construct its larger model
The resulting estimated impacts from the REMI PI+ model are segmented into direct indirect and induced impacts Direct impacts are directly related to the operations and growth of the base for example a contractor who is hired to help build infrastructure for port expansion Indirect impacts
Economic Impact of Offshore Wind Farm Development on the Central Coast
44
are values related to economic growth in upstream industries catalyzed by spending at the port on OSW for example a regional asphalt provider hired to provide road access to the specialized wind port While the asphalt providerrsquos job is directly attributable to the needs of the port it has no direct impact on port operations and therefore represents an indirect impact
Induced impacts are ripple effects that occur at all points in the supply chain catalyzed by both direct and indirect impacts For example an induced impact from the road expansion project would be an asphalt quarry that hires additional employees to help service the increased demand for asphalt from the road expansion project to serve the port While those jobs are created by the increased asphalt demand due to the infrastructure project to connect an existing road to the port the new employees hired at the asphalt quarry are working neither directly at the port facility nor indirectly on the paving project making the creation of this job an induced impact The majority of induced impacts in the model arise from food retail and housing purchases by workers employed directly and indirectly by OSW
Most input-output models are static meaning that inflation employment and expenditures for example remain constant over time However this report uses the dynamic impact model built into REMI PI+ to project the estimated economic impact of OSW development over time As this is a dynamic impact model projections will be made based off the assumption of business cycle fluctuations reflecting historical trends Estimates will be reported both for San Luis Obispo County as well as for the State of California
Finally it should be noted that the regional economic benefits calculated here are gross impacts of the OSW project rather than net impacts and as such may overstate actual benefits as an all-or-nothing comparison That is economic impacts to the region not immediately deriving from the construction and operation of an offshore wind facility are omitted in the report even though the use of regional resources to provide inputs for the OSW project claims these resources from other alternative projects the region could pursue For example expenditure on a wind farm in California may displace expenditures on expansion of a commercial solar power plant A net economic impact assessment of the value of OSW in relation to other potential investments in San Luis Obispo County would need to consider the foregone value of displaced economic activity
The economic values calculated using the REMI PI+ model are presented both in terms of (undiscounted) lifetime job and output impacts and in terms of annual average impacts over various phases of project development Undiscounted lifetime job impacts are calculated by multiplying the operational period of the project by the estimated number of annual operational period jobs and then adding them together into a measure of the total full-time equivalent (FTE) jobs created by the project For example a project that provides 100 full-time jobs each year for a 10-year period provides a total economic benefit to the region of 1000 FTE jobs and an annual average impact of 100 full-time jobs per year
Economic Impact of Offshore Wind Farm Development on the Central Coast
45
SECTION 4
RESULTS
Economic Impact of Offshore Wind Farm Development on the Central Coast
46
4 RESULTS
The regional economic benefit to San Luis Obispo County from OSW development is predicated on the ability to serve floating OSW turbines in and around the Morro Bay Call Area from a specialized wind port The specialized wind port serves as a hub for the assembly maintenance repair and eventually the decommissioning of floating OSW turbines
The economic benefits are calculated in this report for an initial period of port construction Port construction involves direct employment of an average of 1100 workers per year for 5 years at a total cost of between $17 billion and $25 billion Much of the material used to construct the port is projected to be sourced from regions outside the county and delivered to the port by marine vessel For the calculation of regional economic benefits the conservative assumption is made that none of the material is sourced from California which implies the regional economic stimulus is driven only by the direct employment of 1100 construction workers in San Luis Obispo County
Construction of the port occurs over the period coinciding with the 7-year planning phase for the first 1 GW OSW farm 2022-2028 Direct employment for port construction is projected to build over the first few years and reach a peak employment at around the midpoint of the port construction phase however a fully developed time schedule for employment is not available at this time
The measures of economic effects considered in this report are
bull Output ndash business sales less the costs of materials and equipment produced outside of California
bull Employment ndash the full-time equivalent jobs provided to California residents
41 PORT CONSTRUCTION IMPACTS
Table 41 shows the regional economic value realized for San Luis Obispo County and the State of California over the 5-year period of port construction Direct construction spending for a specialized wind port results in local stimulus in San Luis Obispo County of $202 billion ($405 million per year for 5 years) and the creation of approximately 11825 full-time equivalent (FTE) jobs (2365 per year for 5 years) Construction of a specialized wind port in San Luis Obispo County also stimulates the economy of neighboring counties providing 234 jobs and $39 million in economic output for Santa Barbara County and 28 jobs and $58 million in economic output
for Monterey County over the 5-year construction period The overall impact in California considering spill-over impacts to other regions in the state is $300 billion ($599 million per year for 5 years) and the creation of 15925 FTE jobs (3185 annually for 5 years)
Port construction spending would result in a stimulus of $202 billion and the creation of approximately 11825 jobs over 5 years
Economic Impact of Offshore Wind Farm Development on the Central Coast
47
It should be noted that the regional economic impact model assigns available workers in San Luis Obispo County to jobs in San Luis Obispo County before considering workers available to take these jobs in other counties Given the construction of a specialized wind port in San Luis Obispo County jobs are provided to workers in San Luis Obispo County that may ultimately be captured by workers in neighboring counties who are able to outcompete workers in the county This is particularly true for Northern Santa Barbara County given the proximity of the Santa Maria metropolitan area to Arroyo Grande in Southern San Luis Obispo County
For comparison a June 2019 analysis by the California Public Utilities Commission found that current decommissioning plans for DCPP will increase annual economic output in the San Luis Obispo County region by $724 million per year for 10 years and will result in the creation of approximately 4934 FTE jobs annually for ten years (Roland-Holst et al 2019)51
Development of a specialized wind port on the DCPP property may also serve to reduce transportation risks (ie accidents injuries fatalities) from DCPP decommissioning as the use of barge transportation making use of the existing breakwater is projected to lower fatality risks by more than 40 percent52 A more detailed study of specialized wind port construction to jointly meet the goals of DCPP decommissioning and OSW development including potential labor substitution from decommissioning to port construction on the DCPP property is beyond the scope of this report
42 OFFSHORE WIND DEVELOPMENT IMPACTS
After the initial period of port construction assembly can begin in the specialized wind port for the first 1 GW OSW farm in 2029 The economic value of OSW continues from that time through the staged assembly of 1 GW OSW every 3 years Thus the full development of a field of 7 GW OSW from a specialized wind port in San Luis Obispo County will occur over the 21-year period from 2029-2049 While California currently does not have a specialized wind port for assembling OSW turbines it is possible that other specialized wind ports are developed in California during this time allowing OSW turbines to be assembled and dispatched to the Central California region from other nearby
Table 41 Output and Job Creation from Port Construction
RegionFull-Time
Equivalent JobsTotal Output (million $s)
San Luis Obispo County 11825 $202261
Santa Barbara County 234 $3896
Monterey County 28 $577
Rest of California 3837 $92956
California Total 15925 $299689
Economic Impact of Offshore Wind Farm Development on the Central Coast
48
ports This would accelerate the pace of development for installing up to 7 GW OSW in Central California and result in a final completion date prior to 2049
After the initial installation of a field of 7 GW OSW in and around the Morro Bay Call Area proximity between the OSW sites and the specialized wind port in San Luis Obispo will make the specialized wind port the primary area for repair and recommissioning of wind turbines Given the high fixed costs and low variable cost of operating OSW turbines the economics of maintaining 7 GW OSW in the region favor repair from the nearest port with available space to maximize the time turbines spend on the water and connected to the grid
The regional economic value of OSW is constructed by considering the baseline value of a representative 1 GW OSW farm and then modeling the staged development of seven identical 1 GW OSW farms over time The economic value of a representative 1 GW OSW farm is calculated for two cases decommissioning and recommissioning Given that all 7 GW OSW would ultimately be removed from the water following decommissioning the focus of the report is on the long-run economic value to the region from the perpetual renewal of OSW farms over time through recommissioning Recommissioning economizes on redeployment time for the replacement of a 1 GW OSW farm at the end of the lease (from a 6-year period for decommissioning and assembly to a 3-year recommissioning period that bundles these phases together) however bundling decommissioning together with redeployment increases the labor requirement for the 3-year period beyond that required for only decommissioning
421 OSW 1 GW BASELINE WITH DECOMMISSIONING
Table 42 shows the regional economic value realized for San Luis Obispo County neighboring counties and the State of California over the planning assembly and operating horizon of a 1 GW OSW farm through the decommissioning phase The regional economic stimulus provided by the 1 GW OSW farm over its lifetime results in output of $25 billion for San Luis Obispo County and the creation of 6612 full-time equivalent (FTE) jobs over the period 2022-2059 The overall impact in California considering spill-over impacts to other regions in the state is $37 billion and the creation of 11368 FTE jobs during this period
Table 42 Output and Job Creation from a 1 GW Wind Farm with Decommissioning
Region Full-Time Equivalent JobsTotal Output (million $s)
San Luis Obispo County 6612 $245256
Santa Barbara County 364 $7766
Monterey County 58 $1189
Rest of California 4333 $116470
California Total 11368 $370681
Economic Impact of Offshore Wind Farm Development on the Central Coast
49
The majority of the regional economic benefit is derived in San Luis Obispo County because all direct jobs are sourced at the port Santa Barbara County receives economic stimulus of $78 million and 364 FTE jobs over the period due to the alignment of jobs and workers in the model at the location of the specialized wind port In the event that a specialized wind port for OSW assembly and repair is sited in Santa Barbara County rather than San Luis Obispo County the distribution of economic benefits between the two counties essentially would be reversed with Santa Barbara County then becoming the source of output and job creation in the model While some of this outcome is driven by the nature of the model which assigns jobs to workers in the county where direct spending occurs whenever qualified workers in the county are available to provide it the stark difference in regional economic benefits across counties illustrates the fact that direct spending at the specialized wind port is the origin of job creation The regional supply chain to support a 1 GW OSW farm begins and ends at the port
The regional economic benefit realized over this time period is largely concentrated during the assembly and decommissioning phases of the project as shown in Figures 41 and 42 After a small amount of employment and output benefits generated during the planning phase regional employment and output spike during the 3-year assembly period 2029-2031 During the OampM period for the 1 GW OSW farm regional job creation and output falls from the level achieved during assembly and stabilizes Annual jobs and output creation have a positive gradient during this period due to the dynamic adjustment in the REMI PI+ model which builds the regional employment base through population growth in San Luis Obispo County as the 1 GW OSW farm causes labor migration into the county increasing the size of the labor force by providing a reliable source of head-of-household jobs After the 25-year OampM period of the OSW farm regional employment and output spike a second time during the 3-year decommissioning period from 2057-2059
Figure 41 Distribution of Employment Impacts over the Horizon of a 1 GW OSW Farm
Economic Impact of Offshore Wind Farm Development on the Central Coast
50
Figures 43 and 44 show the top sectors stimulated by direct employment at the specialized wind port facility for OSW in San Luis Obispo County for indirect and induced employment respectively In terms of indirect employment the largest industry stimulated by direct spending at the port is administrative and support services (60) followed by regional supply chain development in the professional scientific and technical services industry (14) The increased demand for manufactured components at the specialized port facility for OSW in San Luis Obispo County stimulates regional supply chains for professional scientific and technical support presenting an opportunity for collaboration with Cal Poly and stimulating regional job creation for Cal Poly graduates in engineering fields in local consulting firms and support industries The influx of jobs in professional scientific and technical support fields and other related aspects of the regional supply chain can be further facilitated through independent investment in the Cal Poly Technology Park and furthering industry partnerships in affiliated technical fields that support OSW
Figure 42 Distribution of Output over the Horizon of a 1 GW OSW Farm
The influx of jobs in professional scientific and technical support fields and other related aspects of the regional supply chain can be further facilitated through independent investment in the Cal Poly Technology Park and furthering industry partnerships in affiliated technical fields that support OSW
Economic Impact of Offshore Wind Farm Development on the Central Coast
51
Table 43 shows the distribution of jobs average annual wages total employee compensation and total output for a 1 GW OSW farm in terms of direct indirect and induced impacts Average annual wages and total employee compensation includes wages and fringe benefits paid for by employers
Figure 43 Top 10 Sectors for Indirect Employment from Offshore Wind
Figure 44 Top 10 Sectors for Induced Employment from Offshore Wind
Economic Impact of Offshore Wind Farm Development on the Central Coast
52
Table 44 breaks down output and job creation into annual averages over the various phases of the operating horizon of a 1 GW OSW farm including the final decommissioning phase that removes it from the ocean The regional economic stimulus provided by the 1 GW OSW farm over its lifetime results in the highest annual employment level during the assembly period which provides an average of 589 full-time jobs each year for workers in San Luis Obispo County and 941 full-time jobs each year in California The decommissioning period results in the greatest output creation averaging $218 million per year for San Luis Obispo County and $326 million per year for California during the 3-year decommissioning period
Table 43 Regional Economic Impact of a 1 GW Wind Farm in San Luis Obispo County
ImpactFull-Time
Equivalent Jobs
Average Job Compensation
($year)
Employee Compensation
(millions)Total Output
(millions)
Direct 3490 $88650 $30941 $162674
Indirect 2308 $66076 $15251 $57822
Induced 814 $74884 $6093 $24760
Total Economic Impact 6612 $79076 $52285 $245256
Table 44 Average Annual Output and Job Creation over Key Operating Phases
Economic Stimulus Planning Assembly OampM Decommission
Jobs
San Luis Obispo County 17 589 142 390
Santa Barbara County 1 29 8 24
Monterey County 0 5 1 4
Rest of California 4 318 99 289
Total 22 941 251 707
Output (millions)
San Luis Obispo County $261 $15269 $5288 $21803
Santa Barbara County $010 $502 $167 $670
Monterey County $001 $077 $026 $096
Rest of California $080 $6836 $2618 $9981
Total $352 $22685 $8101 $32550
Economic Impact of Offshore Wind Farm Development on the Central Coast
53
422 OSW 1 GW BASELINE WITH RECOMMISSIONING
In the recommissioning scenario the decommissioning phase for the 1 GW OSW farm is paired with redeployment of a replacement 1 GW OSW farm in the ocean in a new (or renewed) lease agreement Table 45 shows the regional economic value realized for San Luis Obispo County and the State of California over the construction and operating horizon of a 1 GW OSW farm that includes a 3-year recommissioning phase that maintains the 1 GW OSW farm on the water at the end of the period
The regional economic stimulus provided by the 1 GW OSW farm over a lifetime that includes recommissioning and replacement results in output of $268 billion for San Luis Obispo County and the creation of 6999 full-time equivalent (FTE) jobs over the period 2022-2059 The overall impact in California considering spill-over impacts to other regions in the state is $404 billion and the creation of 12059 FTE jobs during this period Comparing entries in Tables 42 and 45 recommissioning the 1 GW OSW farm generates an additional $225 million for San Luis Obispo County ($331 million for California) and the creation of an additional 387 FTE jobs for San Luis Obispo County (692 for California) over the period
Table 46 breaks down output and job creation into annual averages over the various phases of the operating horizon of a recommissioned 1 GW OSW farm that is placed back into service at the end of the horizon The regional economic stimulus provided by a recommissioned 1 GW OSW farm over its lifetime is identical in the first three phases (planning assembly and OampM) with the additional output and job creation concentrated in the final 3-year recommissioning phase Comparing entries in Tables 44 and 46 the added value of recommissioning over decommissioning over the 3-year decommissioning period for the project involves an additional 129 full-time jobs per year in San Luis Obispo County (230 full time jobs per year in California) resulting in additional economic output of $71 million per year in San Luis Obispo County and $110 million per year in California
Table 45 Output and Job Creation from a 1 GW Wind Farm with Recommissioning
Region
Full-Time Equivalent
JobsTotal Output
(millions)
San Luis Obispo County 6999 $267766
Santa Barbara County 387 $8420
Monterey County 62 $1280
Rest of California 4611 $126302
California Total 12059 $403768
Economic Impact of Offshore Wind Farm Development on the Central Coast
54
423 MULTIPLE OSW FARMS THE CASE OF 7 GW OSW DEVELOPMENT
In the case of 7 GW OSW development in Central California the initial spike in output and employment during the assembly phase is extended over a longer period due to the staging of
individual 1 GW OSW farms in successive 3-year periods at the specialized wind port Staged assembly of a field of 7 GW OSW also prolongs the economic benefit from recommissioning multiple OSW farms as the lease period is set back by 3 years for each successive OSW farm through overlapping leases to accommodate available space at the port for assembly The analysis of the 7 GW OSW development includes the
economic value created by constructing a specialized wind port in San Luis Obispo County because it is unlikely that industry partners will materialize to fully develop 7 GW of OSW in Central California without commitment in the region to provide reliable port access for repair and service in proximity to the OSW farms53
Table 46 Average Annual Output and Job Creation over Key Operating Phases
Economic Stimulus Planning Assembly OampM Decommission
Jobs
San Luis Obispo County 17 589 142 519
Santa Barbara County 1 29 8 32
Monterey County 0 5 1 5
Rest of California 4 318 99 382
Total 22 941 251 937
Output (millions)
San Luis Obispo County $261 $15269 $5288 $29306
Santa Barbara County $010 $502 $167 $888
Monterey County $001 $077 $026 $126
Rest of California $080 $6836 $2618 $13259
Total $352 $22685 $8101 $43579
Staged assembly of a field of 7 GW OSW prolongs the economic benefit from recommissioning multiple OSW farms
Economic Impact of Offshore Wind Farm Development on the Central Coast
55
The time horizon for the REMI model extends through 2060 which is not enough to capture the full cycle of development for a 7 GW OSW field given the staged decommissioning horizon that extends through 2077 For this reason the analysis of a 7 GW OSW field is decomposed into two parts First the model is run for staged assembly and deployment of a field of 7 GW OSW farms without decommissioning or recommissioning at the end of the horizon (which would otherwise capture the decommissioning period for only the initial 1 GW OSW farm through 2059) Then the value of a 7 GW OSW field is captured in perpetuity by incorporating the additional value of recommissioning for a representative 1 GW OSW at the end of the lifecycle of each 1 GW OSW farm
This process allows the annual economic value to be calculated in a long-run steady state comprised of a 28-year combined OampM (25 years) and recommissioning (3 years) phase for each OSW farm The long-run steady state value captures the annual value of operating and recommissioning a 7 GW field of OSW farms in a perpetual replacement cycle that begins on the date the final OSW turbine is installed in the 7 GW field
Figures 45 and 46 show the regional economic benefit realized over the time period 2022-2060 without the additional value generated by decommissioning (recommissioning) of each 1 GW OSW farm After an initial spike in regional economic benefits during the period of port construction the economic benefits during the assembly period are prolonged by the staged assembly of 7 GW OSW The annual economic benefit rises steeply during this period both for jobs and output because this period includes OampM for previously assembled 1 GW OSW farms as staging occurs between the assembly phases of each 1 GW OSW farm The regional economic benefit subsequently drops off in 2058 due to removal of the decommissioning (recommissioning) period from the REMI PI+ model runs
Figure 45 Distribution of Employment Impacts over the Horizon of a 7 GW OSW Field
Economic Impact of Offshore Wind Farm Development on the Central Coast
56
The trend toward rising annual output and employment levels during the OampM period in which all 7 OSW farms are in operation reflects the dynamic adjustment elements in the REMI PI+ model which builds up the locally sourced labor pool over time as workers gain experience in the OSW industry For this reason the regional economic value is greater for San Luis Obispo County and for California for the second 1 GW OSW farm than for the first and so on compounding the annual economic benefits realized in the region as a greater level of OSW development occurs over time
Table 47 shows the regional economic value realized for San Luis Obispo County and the State of California over the planning assembly and operating horizon of a 7 GW field of OSW farms absent recommissioning These values include the construction of a specialized wind port during the planning phase prior to assembly of the OSW farms The regional economic stimulus provided by the 7 GW field of OSW farms without decommissioning or replacement results in output of $150 billion for San Luis Obispo County and the creation of 44960 full-time equivalent (FTE) jobs over the period 2022-2060 The overall impact in California is $225 billion and the creation of 72162 FTE jobs during this period
Figure 46 Distribution of Output Impacts over the Horizon of a 7 GW OSW Field
The regional economic value is greater for SLO County and for California for the second 1 GW OSW farm than for the first and so on compounding the annual economic benefits realized in the region as a greater level of OSW development occurs over time
Economic Impact of Offshore Wind Farm Development on the Central Coast
57
The entries in Table 47 encompass the economic value of port construction provided in Table 41 Netting out the port construction impacts in Table 41 the development of a 7 GW field of OSW in the specialized wind port provided an additional 33135 (56238) jobs and additional output of $13 billion ($195 billion) in San Luis Obispo County
Table 48 breaks down output and job creation into annual averages over the various phases of the operating horizon absent recommissioning The port construction period overlaps with planning for the first 1 GW OSW farm and the assembly period is staged over 21 years and involves the transition of assembled OSW farms to OampM toward the end of the assembly period
Table 48 Average Annual Output and Job Creation over Key Operating Phases
Economic Stimulus Port Construction Assembly OampM
Jobs
San Luis Obispo County 2365 1080 1075
Santa Barbara County 47 46 62
Monterey County 6 7 10
Rest of California 767 655 780
California Total 3185 1790 1926
Output (millions)
San Luis Obispo County $40452 $36304 $50331
Santa Barbara County $779 $976 $1583
Monterey County $115 $153 $243
Rest of California $18591 $17134 $25146
California Total $59938 $54566 $77303
Table 47 Output and Job Creation from a 7 GW field of OSW
RegionFull-Time Equivalent
JobsTotal Output
(millions)
San Luis Obispo County 44960 $1500241
Santa Barbara County 2019 $44632
Monterey County 314 $6871
Rest of California 24869 $699440
California Total 72162 $2251185
Economic Impact of Offshore Wind Farm Development on the Central Coast
58
The regional economic stimulus provided by a 7 GW field of OSW farms over its lifetime results in the highest annual employment level during the OampM period The OampM period for a 7 GW field of OSW provides an average of $503 million in annual output and 1075 full-time jobs each year for workers in San Luis Obispo County and $773 million in annual output and 1926 full-time jobs each year in California
Table 49 derives annual steady-state values from periodic recommissioning and redeployment of 7 GW OSW for perpetuity The steady-state values represent the annual OampM value for continued operation of a 7 GW field of OSW farms plus the additional benefit from periodic recommissioning of each 1 GW OSW farm staged in 3-year periods that begin with the first OSW farm in 2059 Specifically the average annual regional economic benefits are derived in perpetuity by calculating the economic value for each variable over a 28-year rolling horizon that begins with the OampM period 2050-2058 in which all 7 OSW farms operate followed by a 21-year recommissioning phase involving the staged reassembly and redeployment of successive 1 GW OSW farms over 3-year intervals at the port
The annual average output level resulting from periodic recommissioning and redeployment of 7 GW OSW is $686 million in annual output and 1389 full-time jobs each year for workers in San Luis Obispo County and $104 billion in annual output and 2488 full-time jobs each year in California The interpretation of these values is the long-run average economic value to the regional economy from operating a mature field of OSW farms that perpetually recommissions and maintains 7 GW of OSW in the Central California region
The steady-state average regional economic values represent an approximation because a fully integrated process for maintaining a 7 GW field of OSW farms would be driven by strong economic incentives to maintain OSW turbines on the water generating electricity for the maximum number of days By the time the first OSW farm begins the recommissioning process in 2059 the solution to this problem may ultimately involve a different staging process for OSW turbine replacement than the one considered here in which each 1 GW OSW farm is recommissioned in a 3-year period following its 25-year operating period
Table 49 Annual Output and Job Creation from 7 GW OSW for Perpetuity
RegionFull-Time
Equivalent Jobs Total Output (millions)
San Luis Obispo County 1389 $68601
Santa Barbara County 80 $2114
Monterey County 13 $317
Rest of California 1006 $33123
California Total 2488 $104154
Economic Impact of Offshore Wind Farm Development on the Central Coast
59
The entries in Table 49 are conservative for two reasons First replacement of each 1 GW OSW farm which begins in the year 2059 is with another baseline 1 GW OSW farm built with currently available technology By 2058 it is possible that technological advances will increase the economic value of reinstalling an OSW farm on a new or renewed lease Second the value during the recommissioning period for each 1 GW OSW farm is taken as the added value of recommissioning for the baseline 1 GW OSW farm considered above This suppresses the dynamic adjustment feature of the REMI model under which the value of subsequent recommissioning periods is elevated based on the experience gained by the regional workforce from recommissioning the first 1 GW OSW farm
424 SMALLER SCALE DEVELOPMENT THE CASE OF 3 GW OSW
The potential to develop 7 GW of OSW in and around the Morro Bay Call Area depends on the ability to reach an agreement with the US Department of Defense (DOD) for an expanded OSW planning area In the event that an expanded OSW planning area is not identified in and around the Morro Bay Call Area it is possible to develop a smaller 3 GW field of OSW farms in the 311 square mile area encompassed by the existing Morro Bay Call Area
In the case of 3 GW OSW development in Central California the initial spike in output and employment during the assembly phase is contracted to a 9-year period due to the staging of individual 1 GW OSW farms in successive 3-year periods at the specialized wind port The analysis of the 3 GW OSW development scenario includes the economic value created by constructing a specialized wind port in San Luis Obispo County because the regional economic benefit of OSW development is centered around job creation at the port
Table 410 shows the regional economic value realized for San Luis Obispo County and the State of California over the planning assembly and operating horizon of a 3 GW field of OSW farms absent recommissioning These values include the construction of a specialized wind port during the planning phase prior to assembly of the OSW farms The regional economic stimulus provided by the 3 GW field of OSW farms generates output of $767 billion for San Luis Obispo County and the creation of 28422 full-time equivalent (FTE) jobs over the period 2022-2060 The overall impact in California is $117 billion and the creation of 44282 FTE jobs during this period
Table 410 Output and Job Creation from a 3 GW field of OSW
RegionFull-Time
Equivalent Jobs Total Output (million $s)
San Luis Obispo County 28422 $766223
Santa Barbara County 1140 $23255
Monterey County 173 $3583
Rest of California 14547 $376664
California Total 44282 $1169724
Economic Impact of Offshore Wind Farm Development on the Central Coast
60
Table 411 breaks down output and job creation into annual averages over the various phases of the operating horizon for a 3 GW field of OSW farms absent recommissioning The port construction period overlaps with planning for the first 1 GW OSW farm and the assembly period is staged over 9 years and involves the transition of assembled OSW farms to OampM toward the end of the assembly period
Following the bump in employment during port construction the regional economic stimulus provided by a 3 GW field of OSW farms over its lifetime results in the highest annual employment level during the assembly period Relative to a 7 GW field of OSW employment and output levels tick downward in the OampM period as the regional economy is less active in supporting the smaller field of OSW farms due to a decreased need for maintenance and repair The OampM period for a 3 GW field of OSW provides an average of $176 million in annual output and 483 full-time jobs each year for workers in San Luis Obispo County and $281 million in annual output and 858 full-time jobs each year in California
Table 412 derives annual steady-state values from periodic recommissioning of a 3 GW field of OSW farms for perpetuity The steady-state values represent the annual OampM value for continued operation of a 3 GW field of OSW farms plus the additional benefit from periodic recommissioning of each 1 GW OSW farm staged in 3-year periods that begin with the first OSW farm in 2059 The
Table 411 Average Annual Output and Job Creation over Key Operating Phases of a 3 GW Field of OSW
Economic Stimulus Port Construction Assembly OampM
Jobs
San Luis Obispo County 2365 768 483
Santa Barbara County 47 22 25
Monterey County 6 4 4
Rest of California 767 454 346
California Total 3185 1249 858
Output (millions)
San Luis Obispo County $40452 $20088 $17624
Santa Barbara County $779 $405 $568
Monterey County $115 $067 $087
Rest of California $18591 $10313 $9819
California Total $59938 $30874 $28098
Economic Impact of Offshore Wind Farm Development on the Central Coast
61
average annual regional economic benefits are derived in perpetuity by calculating the economic value for each variable over a 28-year rolling horizon that begins with the OampM period 2038-2058 in which all three OSW farms operate followed by a 9-year recommissioning phase involving the staged reassembly and redeployment of successive 1 GW OSW farms over 3-year intervals at the port
The annual average output level resulting from periodic recommissioning and redeployment of 3 GW OSW is $255 million in annual output and 617 full-time jobs each year for workers in San Luis Obispo County and $396 million in annual output and 1098 full-time jobs each year in California The interpretation of these values is the long-run average economic value to the regional economy from operating a mature field of OSW farms that perpetually recommissions and maintains 3 GW of OSW from a specialized wind port in San Luis Obispo County
Table 412 Annual Output and Job Creation from 3 GW OSW in Perpetuity
RegionFull-Time
Equivalent Jobs Output (millions)
San Luis Obispo County 617 $25454
Santa Barbara County 33 $795
Monterey County 5 $119
Rest of California 443 $13237
California Total 1098 $39605
Economic Impact of Offshore Wind Farm Development on the Central Coast
62
SECTION 5
FISCAL IMPLICATIONS
Economic Impact of Offshore Wind Farm Development on the Central Coast
63
5 FISCAL IMPLICATIONS
Development of OSW farms in Central California have fiscal implications for San Luis Obispo County The fiscal impact of the project is composed of tax revenue derived from several components
bull property taxes on assessed land improvements at the specialized wind portbull unitary taxes assessed on PGampE from the use of transmission and distribution lines in San Luis
Obispo Countybull sales and use taxes on personal consumption of workers employed at the port facilitybull sales and use taxes on OSW capital expenditurebull income taxes on employee wages
bull corporate taxes on value added in the regional supply chain
The fiscal implications depend on renewable energy credits and other aspects that may result in certain components of project expenditures being exempt from state and local taxes For imported equipment delivered to the port such as turbines towers and floating sub-structures the ability to tax these expenditures depends on the ability of the county to declare imports as an originating transaction that occurs at a specialized wind port For this report fiscal implications are calculated gross of any tax credits that may be applied
Local taxes include property and excise taxes paid to municipalities by workers in the jobs generated by the construction- and operating-period employment reflected in Tables 46-48 as well as property and other local taxes by the companies employing those individuals State taxes include income and sales taxes paid by individuals as well as payroll income and other taxes paid by the companies that employ those individuals The taxes are thus proportional to the total direct indirect and induced economic effects provided in these tables However these totals do not represent all taxes paid by companies whose output is only partly affected by the changes in demand attributable to construction and operating periods of offshore wind energy installation and maintenance port construction and terminal operation
51 PROPERTY TAXES FROM LAND IMPROVEMENTS AT THE SPECIALIZED WIND PORT
Property taxes in San Luis Obispo County are levied at a 1 percent rate on land improvements resulting from development of a specialized wind port in San Luis Obispo County The projected capital expense required to construct the port is in the range of $17 billion to $25 billion Using the cost of developing a specialized wind port as a proxy for the change in assessed land improvements constructing a specialized wind port in San Luis Obispo County would result in annual property taxes to the county of $17-25 million per year
Economic Impact of Offshore Wind Farm Development on the Central Coast
64
52 UNITARY TAXES ON ELECTRICITY TRANSMISSION BY PGampE
The County of San Luis Obispo currently receives unitary taxes and franchise taxes from PGampE from the operation of DCPP In the 2019-2020 tax year unitary tax revenues in San Luis Obispo County accounted for $236 million in annual taxes 85 of which was paid by PGampE By far unitary taxes represent the largest revenue source for the county from DCPP54
California bases the unitary tax on the combined total corporate income of multi-state and multi-national corporations by applying a formula to determine the total amount of income the corporation realized within California The State of California assesses the unitary tax on individual corporations as well as groups of companies who operate together as a ldquounitrdquo and then divides the total tax receipt for each unit at the state-level into shares of taxes received by each county For the case of PGampE unitary taxes are assessed by the State Board of Equalization (BOE) at the same 1 rate as property taxes using Historic Cost Less Depreciation (HCLD) as the basis for the assessment The current board-adopted value for PGampE as the basis for unitary taxes is $312 billion55
With the planned closure of DCPP and potential development of OSW the unitary tax received by San Luis Obispo County will change based both on changes in the HCLD for PGampE and shifts in the share of capital costs attributed to the county from electricity distribution Absent OSW development the prospective closure of DCPP will reduce PGampErsquos HCLD following a decrease in annual operating costs however this drop in operating costs will be offset to some extent by increased storage and maintenance costs for nuclear material As existing power generated by DCPP is replaced by electricity generation elsewhere it is likely that the HCLD of PGampE increases although the share of capital costs attributed to San Luis Obispo County can go up or down depending on capital investment required to upgrade the transmission infrastructure for power delivery from alternative uses such as OSW
The National Renewable Energy Laboratory (NREL) estimates required investments in transmission infrastructure for a 1 GW OSW farm site with an average distance to cable landfall of 45km to be $162 billion56 These costs which include grid connection costs for an offshore spur line would be incurred by PGampE (or another contractor in its unit) as part of the basis for the unitary tax Each region in California would be entitled to a share of the unitary tax revenue proportional to the change in PGampErsquos HCLD realized within the region
Based on the estimated transmission infrastructure cost of $162 billion for a 1 GW OSW farm the total cost of developing a 7 GW field of OSW would be approximately $813 billion57 Of this investment the majority of the transmission line would be situated in federal waters outside the tax jurisdiction of the state The taxable proportion of grid connection costs for an offshore spur line to a 7 GW field of OSW can be calculated according to the share of the transmission infrastructure passing through California waters which is the territory extending 3 nautical miles (56 km) from the shore at mean low tide These costs would include both the share of the transmission line residing in California and the cost of the substation at the cable landfall An approximation of the share of grid connection costs attributed to California would be 1244 (=5645 km) Based on this increment the increase in unitary taxes for San Luis Obispo County from a 7 GW field of OSW would be approximately $10 million per year
Economic Impact of Offshore Wind Farm Development on the Central Coast
65
53 SALES AND USE TAXES ON OSW SPENDING
Sales and use taxes are assessed on taxable sales in California at a rate of 725 In addition counties and municipalities can charge an additional local sales tax of up to 25 through special sales tax jurisdictions Currently special tax jurisdictions in San Luis Obispo County provide an additional assessment of 05 for Grover Beach Arroyo Grande Pismo Beach and Paso Robles for a combined effective tax rate of 775 for purchases made in these communities While it is possible that a specialized wind port authority can levy an additional assessment for OSW spending at the port the values provided here consider sales and use taxes only at the 725 rate
The overnight capital cost for a floating 1 GW OSW farm is projected to be $41 billion of which roughly 30 is comprised of turbine capital cost and 36 for the support structure (including the floating substructure lines and anchors for mooring systems and array cables) These OSW components will be imported at least in the short-term58
Sales and use taxes can be assessed on California transactions at the specialized wind port even for imported goods if the transaction occurs in California If the capital spending on turbines and the support structure for a 7 GW field of OSW farms is taxed taxable spending during the 21-year assembly and installation period for OSW would result in California sales and use taxes of $14 billion Based on a 28-year replacement standard for each 1 GW OSW farm the annual sales and use taxes for California in a long-run steady state with periodic recommissioning would result in $498 million per year in additional sales and use taxes for the State of California at prevailing OSW capital costs
54 SALES AND USE TAXES CORPORATE TAXES AND INCOME TAXES FROM AFFILIATED SPENDING
The development of OSW also generates local taxes from income and induced spending by OSW workers as well as corporate taxes on the value added in the regional supply chain from the companies employing those individuals State taxes include income and sales taxes paid by individuals as well as payroll income and other taxes paid by the companies that employ them
Table 51 presents the estimated annual increase in California state taxes from maintaining a 3 GW vs a 7 GW field of OSW farms for perpetuity Corporate income taxes are based on value-added created in the regional supply chain personal income taxes are levied on worker incomes and sales taxes on retail purchases are derived from disposable income The effective tax rate for each component is calculated using data from the California Legislative Analystrsquos Office as the average tax collected in each category as a share of economic activity that occurred in the state over the period 2017-2019 The effective rate for the corporate income tax is taken to be the corporate tax bill as a share of value-added and the retail sales tax is taken to be the retail sales and use tax revenue as a share of personal consumption expenditures spent on taxable items in the state Development of a 3 GW field of OSW farms results in an additional $27 million per year in California tax revenue whereas a 7 GW field of OSW farms contributes $76 million per year in California tax revenue
Economic Impact of Offshore Wind Farm Development on the Central Coast
66
55 SUMMARY OF FISCAL IMPLICATIONS
Table 52 provides a summary of the annual fiscal implications for maintaining a mature field of 3 GW vs 7 GW OSW in and around the Morro Bay Call Area Estimated property taxes from land improvement from investment in a specialized wind port facility are taken at 1 of the midpoint of the estimated capital investment Unitary taxes on the capital cost of infrastructure is fully attributed to San Luis Obispo County including the share of spending that occurs in state waters in addition to onshore investment State taxes amortize the cost of recurring capital investment for recommissioning OSW farms which assumes imported capital is recorded as a taxable transaction on state land at the port Taxes from regional income and spending are taken from Table 51 and suppress the additional county-level 05 retail sales tax from worker spending in special tax jurisdictions in Grover Beach Arroyo Grande Pismo Beach and Paso Robles
In the case of a 3 GW field of OSW development tax values are proportionally smaller due to the smaller scale of the project with the exception of property taxes from the specialized wind port The basis for the increase in assessed value of the property taxes is taken at the low end of the range of cost estimates for the case of 3 GW OSW development and at the high end of the range for the case of 7 GW OSW development Detailed information at this time is not available to confirm whether or not the cost of port construction would materially differ in the case where the specialized wind port was constructed to support a 3 GW or a 7 GW field of OSW farms
Table 51 Annual Taxes from Regional Economic Development of 3 GW vs 7 GW OSW
3 GW Field 7 GW Field
Type of Tax Effective Rate Basis (millions) Tax (millions) Basis (millions) Tax (millions)
Corporate Income Tax 09078 $18737 $170 $46323 $421
Personal Income Tax 83508 $21861 $1826 $65226 $5447
Retail Sales Tax 37515 $18722 $702 $55654 $2088
Total $2698 $7955
Economic Impact of Offshore Wind Farm Development on the Central Coast
67
Table 52 Summary of Annual Fiscal Benefits from 3 GW vs 7 GW OSW
3 GW Field 7 GW Field
Tax BasisCounty Taxes (millionsyr)
State Taxes (millionsyr)
County Taxes (millionsyr)
State Taxes (millionsyr)
Specialized Wind Port
Property Taxes $1700 $2500
OSW Capital Spending $2133 $4978
Transmission Infrastructure
Unitary Taxes $434 $1012
Regional Spending
Corporate Income Tax $170 $421
Personal Income Tax $1826 $5447
Retail Sales Tax $702 $2088
Total $2134 $4831 $3512 $12933
Economic Impact of Offshore Wind Farm Development on the Central Coast
68
SECTION 6
CONCLUSION
Economic Impact of Offshore Wind Farm Development on the Central Coast
69
6 CONCLUSION
The development of up to 7 GW OSW in and around the Morro Bay Call Area represents a considerable opportunity for job and economic output impacts However the logistical challenges associated with building and operating a field of OSW farms and the associated specialized wind port that supports them are substantial If a specialized wind port for OSW turbine assembly and repair is not constructed in San Luis Obispo County then the regional economic benefits of jobs and economic output creation would occur instead in the county that provides the port In contrast the State of California would retain much of the economic benefit of OSW development if another county in California provides the specialized wind port
Construction-phase impacts during the 5-year period of port construction generate 11825 full-time equivalent (FTE) construction jobs in San Luis Obispo County and 15925 construction jobs overall in California stimulating $202 billion in additional economic output for San Luis Obispo County and $3 billion in economic output for California These impacts on economic output and jobs include port terminal and transmission infrastructure improvements as well as the first stage of wind farm development and planning operations
Following the period of port construction and OSW planning assembly of 1 GW OSW farms is staged over time in a 3-year period for each OSW farm For a 3 GW field of OSW farms construction of a port followed by staged assembly of 1 GW OSW farms over a total of 9 years provides 28422 FTE jobs in San Luis Obispo County and 44282 FTE jobs in California over an operating horizon through 2060 Developing a 3 GW field of OSW farms generates $766 billion in economic output for San Luis Obispo County and $1170 billion in economic output for California through the year 2060 Additional jobs and economic output would be realized during the decommissioning period of the field which extends well beyond the horizon of the REMI model in 2060 and is therefore not considered in the model
For a 7 GW field of OSW farms construction of a port followed by staged assembly of 1 GW OSW farms over a total of 21 years provides 44960 FTE jobs in San Luis Obispo County and 72162 FTE jobs in California over an operating horizon through 2060 Developing a 7 GW field of OSW farms generates $15 billion in economic output for San Luis Obispo County and $2251 billion in economic output for California through the year 2060 As in the case of a 3 GW field of OSW farms additional jobs and economic output would be realized during the decommissioning period which is not considered in the model
Perpetual operation of a mature 3 GW or 7 GW field of OSW farms produces considerable regional economic benefits each year Perpetual operation of a mature 3 GW field of OSW farms results in the creation of 617 jobs per year in San Luis Obispo County and 1098 jobs per year in California and provides additional economic output of $254 million per year in San Luis Obispo County and $396
Economic Impact of Offshore Wind Farm Development on the Central Coast
70
million per year in California Perpetual operation of a mature 7 GW field of OSW farms results in the creation of 1389 jobs per year in San Luis Obispo County and 2488 jobs per year in California and provides additional economic output of $686 million per year in San Luis Obispo County and $104 billion per year in California
Fiscal benefits to San Luis Obispo County are predominantly driven by property taxes on land improvements at the specialized wind port which generates between $17-$25 million per year in local property tax revenues The considerable cost of developing the necessary transmission infrastructure to provide grid connection for a 3-7 GW field of OSW farms to the existing connections at DCPP provides a tax benefit to the county as well Based on the taxable change in the cost of the transmission infrastructure the development of a 3 GW field of OSW farms is projected to result in increased unitary taxes for San Luis Obispo County of $43 million per year whereas the development of a 7 GW field of OSW farms is projected to result in increased unitary taxes for San Luis Obispo County of $101 million per year
The fiscal impact to the State of California is comprised of sales and use taxes on personal consumption expenditures resulting from worker spending corporate income taxes on value added by companies in the regional supply chain and the state income taxes on employed workers Using effective tax rates derived from data provided by the California Legislative Analystrsquos Office perpetual operation of a mature 3 GW field of OSW generates $27 million per year in California tax revenue whereas a 7 GW field of OSW generates $796 million per year in California tax revenue from the projected economic activity created by OSW
Over time economic impacts can change As installed wind farm capacity in California increases through planned developments in Central and Northern California learning effects are likely to further reduce costs and investment in OSW manufacturing capabilities in California would allow a greater share of inputs to be locally sourced Changes along these lines will result in greater regional economic benefits in the long-term for floating OSW development in California
Economic Impact of Offshore Wind Farm Development on the Central Coast
71
REFERENCES
American Jobs Project 2019 The California Offshore Wind Project A Vision for Industry Growth February 2019 Available at httpsoffshorewindhuborgresource1771
American Wind Energy Association California and Offshore Wind California 2020 AWEA-California and Offshore Wind California Comments California Energy Commission Docket 17-MISC-01 June 30 2020 Available at httpsefilingenergycagovGetDocumentaspxtn=233690ampDocumentContentId=66331
Berkeley Lab 2020 Wind Technologies Market Report Available at httpsemplblgovwind-technologies-market-report
Beiter P Musial W Smith A Kilcher L Damiani R Maness M Sirnivas S Stehly T Gevorgian V Mooney M and Scott G 2016 A spatial-economic cost-reduction pathway analysis for US offshore wind energy development from 2015ndash2030 (No NRELTP-6A20-66579) National Renewable Energy Laboratory(NREL) Golden CO (United States)
BOEM California Offshore Wind Energy httpscaoffshorewinddatabasinorgmaps4c-86c5e61e044747ac010102c4787507active
Brightline Defense 2020 California Offshore Wind Winding up for Environmental Growth and Environmental Equity December 2020
Bureau of Ocean Energy Management (BOEM) California Offshore Renewable Energy Fact Sheet February 22 2017 Available at httpswwwboemgovsitesdefaultfilesrenewable-energy-programState-ActivitiesCABOEM-Offshore-Renewables-Factsheet--02-22-17pdf
Busch C and Orvis R 2020 Insights from the California Energy Policy Simulator On the Statersquos Current Greenhouse Gas Emission Trajectory and Six Policy Opportunities for Deepening Emission Reductions Energy Innovation LLC January 2020 Available at httpsenergyinnovationorgwp-contentuploads202005Insights-from-the-California-Energy-Policy-Simulator_5120pdf
California Board of Equalization Unitary Valuation Methods March 2003 Available at httpswwwboecagovproptaxespdfmethodsbook2003pdf
California Energy Commission 2019 Total System Electric Generation Available at httpswwwenergycagovdata-reportsenergy-almanaccalifornia-electricity-data2019-total-system-electric-generation
California Energy Commission 2020 UPDATED Notice of Availability of Outreach on Additional Considerations for Offshore Wind Energy off the Central Coast of CA May 7 2020
Colias M 2021 GM to Phase Out Gas- and Diesel-Powered Vehicles by 2035 The Wall Street Journal January 28 2021 Available at httpswwwwsjcomarticlesgm-sets-2035-target-to-phase-out-gas-and-diesel-powered-vehicles-globally-11611850343
Economic Impact of Offshore Wind Farm Development on the Central Coast
72
Collier R 2017 High Road for Deep Water Center for Labor Research and Education University of California Berkeley CA
Dvorak MJ Archer CL and Jacobson MZ 2010 California offshore wind energy potential Renewable energy 35(6) pp1244-1254
Energy and Environmental Economics Inc 2019 The Economic Value of Offshore Wind Power in California August 2019 Available at httpcastlewindcomwp-contentuploads2019082019-08-08_E3-CastleWind-OffshoreWindValueReport_compressedpdf
Energy and Environmental Economics Inc 2018 ldquoDeep Decarbonization in a High Renewables Futurerdquo California Energy Commission June 18 2018 Available at httpswwwethreecomwp-contentuploads201806Deep_Decarbonization_in_a_High_Renewables_Future_CEC-500-2018-012-1pdf
Fripp M and Wiser RH 2008 Effects of temporal wind patterns on the value of wind-generated electricity in California and the Northwest IEEE Transactions on Power Systems 23(2) pp477-485
Froese M 2019 Why collaboration is critical to offshore wind and port success Windpower Energy and Development August 28 2019 Available at httpswwwwindpowerengineeringcomwhy-collaboration-is-critical-to-offshore-wind-and-port-success
Garrick BJ and Wakefield DJ 2020 Probabilistic Risk Assessment of Nuclear Power Plant Spent Fuel Handling and Storage Programs Methodology and Application to the Diablo Canyon Power Plant The B John Garrick Institute for the Risk Sciences at UCLA and Pacific Gas and Electric Company February 17 2020
Global Wind Energy Council (GWEC) 2020 Global Offshore Wind Report August 5 2020 Available at httpsgwecnetglobal-offshore-wind-report-2020
Hackett S and Anderson J 2020 California North Coast Offshore Wind Studies Economic Development and Impacts Schatz Energy Research Center September 2020
London Economics International LLC 2013 Analysis of the Macroeconomic Impacts of the Proposed Zephyr Transmission Project May 2013 Available at httpwwwdatcllccomwp-contentuploads201306ZephyrEconomicBenefitsStudy-5212013pdf
Lowder K 2021 Wind Power amp Renewables Surge to New Record in China Cleantechnica January 22 2021 Available at httpscleantechnicacom20210122wind-power-renewables-surge-to-new-record-in-china
Massachusetts Clean Energy Center 2017 2017 Massachusetts Offshore Wind Ports amp Infrastructure Assessment May 2017 Available at httpwwwmassceccomports
Musial W Beiter P Tegen S and Smith A 2016 Potential Offshore Wind Energy Areas in California An Assessment of Locations Technology and Costs National Renewable Energy Laboratory December 2016 Available at httpswwwboemgovsitesdefaultfilesenvironmental-stewardshipEnvironmental-StudiesPacific-RegionStudiesBOEM-2016-074pdf
Economic Impact of Offshore Wind Farm Development on the Central Coast
73
National Renewable Energy Laboratory (NREL) Annual Technology Baseline 2020 Available at httpsatbnrelgovelectricity2020dataphp
Porter A and Phillips S 2016 Determining the Infrastructure Needs to Support Offshore Floating Wind and Marine Hydrokinetic Facilities on the Pacific West Coast and Hawaii US Bureau of Offshore Energy Management March 3 2016 Available at httpwwwdataboemgovPIPDFImagesESPIS55503pdf
Reed S 2021 A Monster Wind Turbine is Upending the Industry The New York Times January 1 2021 Available at httpswwwnytimescom20210101businessGE-wind-turbinehtml
Roland-Holst DW Behnke D Evans S Froumllund L and Yi-Chen A 2019 Economic Impact Assessment of the Prospective Closure of the Diablo Canyon Nuclear Power Plant California Public Utilities Commission June 28 2019
Severy M and Jacobson A 2020 California North Coast Offshore Wind Studies Interconnection Constraints and Pathways Schatz Energy Research Center September 2020
Severy M Younes A Zoellick J and Jacobson A 2020 Northern California Offshore Wind Generation and Load Compatibility Assessment with Emphasis on Electricity Grid Constraints Mitigation Measures and Associated Costs Final Synthesis Report Energy Research Center September 2020 OCS Study BOEM 2020-045
Shaner MR Davis SJ Lewis NS and Caldeira K 2018 ldquoGeophysical constraints on the reliability of solar and wind power in the United Statesrdquo Energy amp Environmental Science 11(4) pp914-925
Sinden G 2007 ldquoCharacteristics of the UK wind resource Long-term patterns and relationship to electricity demandrdquo Energy Policy 35(1) pp112-127
Speer B Keyser D and Tegen S 2016 Floating Offshore Wind in California Gross Potential for Jobs and Economic Impacts from Two Future Scenarios (No NRELTP-5000-65352) National Renewable Energy Laboratory (NREL) Golden CO (United States)
Wang YH Walter RK White C Kehrli MD Hamilton SF Soper PH and Ruttenberg BI 2019 ldquoSpatial and temporal variation of offshore wind power and its value along the Central California Coastrdquo Environmental Research Communications 1(12) p121001
1 A power plant with a 50 capacity factor produces twice as much power per day as a power plant with the same nameplate
capacity and a 25 capacity factor
2 The overnight LCOE for floating OSW is currently $67MWh which compared with $69MWh for commercial PV in Los
Angeles $61MWh for nuclear and $57-89MWh for new steam-reach development of hydropower and $123MWh for flash
steam enhanced geothermal systems National Renewable Energy Laboratory (NREL) Annual Technology Baseline 2020
Available at httpsatbnrelgovelectricity2020dataphp
3 California Energy Commission 2019 Total System Electric Generation Available at httpswwwenergycagovdata-reports
energy-almanaccalifornia-electricity-data2019-total-system-electric-generation
Economic Impact of Offshore Wind Farm Development on the Central Coast
74
4 Busch C and Orvis R 2020 Insights from the California Energy Policy Simulator on the Statersquos Current Greenhouse Gas Emission
Trajectory and Six Policy Opportunities for Deepening Emission Reductions Energy Innovation LLC January 2020 Available at
httpsenergyinnovationorgwp-contentuploads202005Insights-from-the-California-Energy-Policy-Simulator_5120
5 Colias M 2021 GM to Phase Out Gas- and Diesel-Powered Vehicles by 2035 The Wall Street Journal January 28 2021
Available at httpswwwwsjcomarticlesgm-sets-2035-target-to-phase-out-gas-and-diesel-powered-vehicles-
globally-11611850343
6 Energy and Environmental Economics Inc 2018 ldquoDeep Decarbonization in a High Renewables Futurerdquo California Energy
Commission June 18 2018 Available at httpswwwethreecomwp-contentuploads201806Deep_Decarbonization_
in_a_High_Renewables_Future_CEC-500-2018-012-1pdf
7 Severy M Younes A Zoellick J Jacobson A 2020 Northern California Offshore Wind Generation and Load Compatibility
Assessment with Emphasis on Electricity Grid Constraints Mitigation Measures and Associated Costs Final Synthesis Report Schatz
Energy Research Center September 2020
8 Bureau of Ocean Energy Management (BOEM) httpswwwboemgovrenewable-energylease-and-grant-information
9 This calculation is based on a capacity factor of 50 for OSW The exact amount of generating capacity needed to meet state
renewable energy targets in 2050 depends on future demand growth driven by electrification and the capacity factor of the
power source which is rapidly increasing for OSW
10 National Renewable Energy Laboratory (NREL) Annual Technology Baseline 2020 Available at httpsatbnrelgov
electricity2020dataphp
11 A capacity factor of 50 percent is equivalent to achieving the full nameplate capacity of the OSW farm for 12 hours per day
with zero electricity generation for the remaining 12 hours per day
12 American Jobs Project 2019 The California Offshore Wind Project A Vision for Industry Growth February 2019 Available
at httpsoffshorewindhuborgresource1771
13 Myers Amanda 2020 Seven Policies to Tap US Offshore Windrsquos $166 Billion Economic Growth And Emissions Reduction
Potential Forbes August 31 2020 Available at httpswwwforbescomsitesenergyinnovation20200831seven-policies-
the-us-can-use-to-tap-offshore-winds-166-billion-economic-growth-and-emissions-reduction-
potentialsh=5bf30e546f27
14 Energy and Environmental Economics Inc 2019 The Economic Value of Offshore Wind Power in California August 2019
Available at httpcastlewindcomwp-contentuploads2019082019-08-08_E3-CastleWind-OffshoreWindValueReport_
compressedpdf
15 Wang YH Walter RK White C Kehrli MD Hamilton SF Soper PH and Ruttenberg BI 2019 ldquoSpatial and temporal
variation of offshore wind power and its value along the Central California Coastrdquo Environmental Research Communications
1(12) p121001
16 External costs of GHG emissions are captured to some extent in California electricity prices through public regulations for
instance the cap-and-trade program for carbon emissions under AB 32 Similarly higher electricity generation costs are
priced into the California grid indirectly by Californiarsquos commitment to developing renewable sources
17 Musial W Beiter P Tegen S and Smith A 2016 Potential Offshore Wind Energy Areas in California An Assessment of
Locations Technology and Costs National Renewable Energy Laboratory December 2016 Available at httpswwwboem
govsitesdefaultfilesenvironmental-stewardshipEnvironmental-StudiesPacific-RegionStudiesBOEM-2016-074pdf
18 California Energy Commission 2020 UPDATED Notice of Availability of Outreach on Additional Considerations for Offshore Wind
Energy off the Central Coast of CA May 7 2020
Economic Impact of Offshore Wind Farm Development on the Central Coast
75
19 American Wind Energy Association California and Offshore Wind California 2020 Offshore Wind Development in Morro Bay
Letter to the Honorable Salud Carbajal and the Honorable Jimmy Panetta May 27 2020
20 Brightline Defense 2020 California Offshore Wind Winding up for Environmental Growth and Environmental Equity December
2020
21 Ma K Luo Y Thomas KC amp Wu Y 2019 Mooring System Engineering for Offshore Structures Elsevier Science amp
Technology San Diego Available from ProQuest Ebook Central February 2021
22 KampL Gates 2019 Offshore Wind Handbook Version 2 October 2019 Available at httpsfilesklgatescomfilesuploads
documents2019_offshore_wind_handbookpdf
23 If the blades are not already attached to the nacelle-hub each blade is then lifted separately by the crane and connected to
the hub
24 Uraz E 2011 Offshore wind turbine transportation amp installation analyses planning optimal marine operations for offshore
wind projects Available at httpwwwdiva-portalorgsmashgetdiva2691575FULLTEXT01pdf
25 Wang YH Walter RK White C Kehrli MD Hamilton SF Soper PH and Ruttenberg BI 2019 Spatial and temporal
variation of offshore wind power and its value along the Central California Coast Environmental Research Communications
1(12) p121001
26 Wang YH Walter RK White C Kehrli MD Hamilton SF Soper PH and Ruttenberg BI 2019 Spatial and temporal
variation of offshore wind power and its value along the Central California Coast Environmental Research Communications
1(12) p121001
27 The electricity portfolio must include enough firm capacity to meet coincident system peak plus additional 15 of planning
reserve margin (PRM) requirement
28 Hackett S and Anderson J 2020 California North Coast Offshore Wind Studies Economic Development and Impacts
Schatz Energy Research Center September 2020
29 Massachusetts Clean Energy Center 2017 Massachusetts Offshore Wind Ports amp Infrastructure Assessment May 2017 Available
at httpwwwmassceccomports
30 Porter A and Phillips S 2016 Determining the Infrastructure Needs to Support Offshore Floating Wind and Marine Hydrokinetic
Facilities on the Pacific West Coast and Hawaii US Bureau of Offshore Energy Management March 3 2016 Available at http
wwwdataboemgovPIPDFImagesESPIS55503pdf
31 Collier R 2017 High Road for Deep Water Center for Labor Research and Education University of California Berkeley CA
32 Garrick BJ and Wakefield DJ 2020 Probabilistic Risk Assessment of Nuclear Power Plant Spent Fuel Handling and Storage
Programs Methodology and Application to the Diablo Canyon Power Plant The B John Garrick Institute for the Risk Sciences at
UCLA and Pacific Gas and Electric Company February 17 2020
33 California Energy Commission 2019 Total System Electric Generation Available at httpswwwenergycagovdata-reports
energy-almanaccalifornia-electricity-data2019-total-system-electric-generation
34 Severy M and Jacobson A 2020 California North Coast Offshore Wind Studies Interconnection Constraints and Pathways
Schatz Energy Research Center September 2020
35 London Economics International LLC 2013 Analysis of the Macroeconomic Impacts of the Proposed Zephyr Transmission Project
May 20 2013 Available at httpwwwdatcllccomwp-contentuploads201306ZephyrEconomicBenefitsStudy-5212013pdf
36 Collier R 2017 High Road for Deep Water Center for Labor Research and Education University of California Berkeley CA
37 Collier R 2017 High Road for Deep Water Center for Labor Research and Education University of California Berkeley CA
38 Brightline Defense 2020 California Offshore Wind Winding up for Environmental Growth and Environmental Equity December
2020
39 US Census Bureau 2020
Economic Impact of Offshore Wind Farm Development on the Central Coast
76
40 SLO County BW Report 2018
41 SLO County BW Report 2018
42 US Bureau of Economic Analysis
43 SLO County BW Report 2018
44 US Bureau of Economic Analysis
45 wwwslocountycagov 2021 SLO County Monthly Labor Market Information - County of San Luis Obispo Available at https
wwwslocountycagovDepartmentsSocial-ServicesWorkforce-Development-BoardSLO-County-Monthly-Labor-Market-
Informationaspx
46 wwwblsgov 2021 Unemployment Rates for States Available at httpwwwblsgovweblauslaumstrkhtm
47 SLO County BW Report 2018
48 US Bureau of Economic Analysis 2020
49 US Bureau of Economic Analysis 2020
50 Private costs of OSW include the opportunity cost of delaying the time wind turbines spend on the water by the extra travel
days from a more distant port which will be passed through into consumer electricity prices though higher LCOE for the
change in duration the wind turbines produce electricity for the grid (ie the extra days required for transportation during
periods of turbine installation and repair)
51 Roland-Holst DW Behnke D Evans S Froumllund L and Yi-Chen A 2019 Economic Impact Assessment of the
Prospective Closure of the Diablo Canyon Nuclear Power Plant California Public Utilities Commission June 28 2019
52 Garrick BJ and Wakefield DJ 2020 Probabilistic Risk Assessment of Nuclear Power Plant Spent Fuel Handling and Storage
Programs Methodology and Application to the Diablo Canyon Power Plant The B John Garrick Institute for the Risk Sciences at
UCLA and Pacific Gas and Electric Company February 17 2020
53 A specialized wind port for OSW assembly and repair ultimately may be provided in a neighboring county however the
regional economic benefit considered in this report presumes the port is constructed in San Luis Obispo County
54 SLO County Assessorrsquos Office
55 State of California Board of Equalization httpswwwboecagovproptaxespdfPropValues2020pdf
56 NREL 2020 ATB
57 To the extent economies of scale exist in developing the transmission infrastructure for a 7 GW field of OSW using the NREL
cost approximation for a 1 GW OSW farm as a scalar for field development costs will over-estimate actual transmission
infrastructure costs for 7 GW field of OSW
58 The National Defense Authorization Act for FY2021 recently passed by US Congress includes amendments that ensure that
the Outer Continental Shelf Lands Act (OCSLA) applies to offshore wind farms The amendments have the potential to increase
the share of transportation costs captured by American-built vessels in the offshore wind fleet under the Jones Act