Embed Size (px)
Citation preview
Independent project · 15 hec · Basic level Economics and Management - Bachelor’s Programme Degree thesis No 752 · ISSN 1401-4084 Uppsala 2012
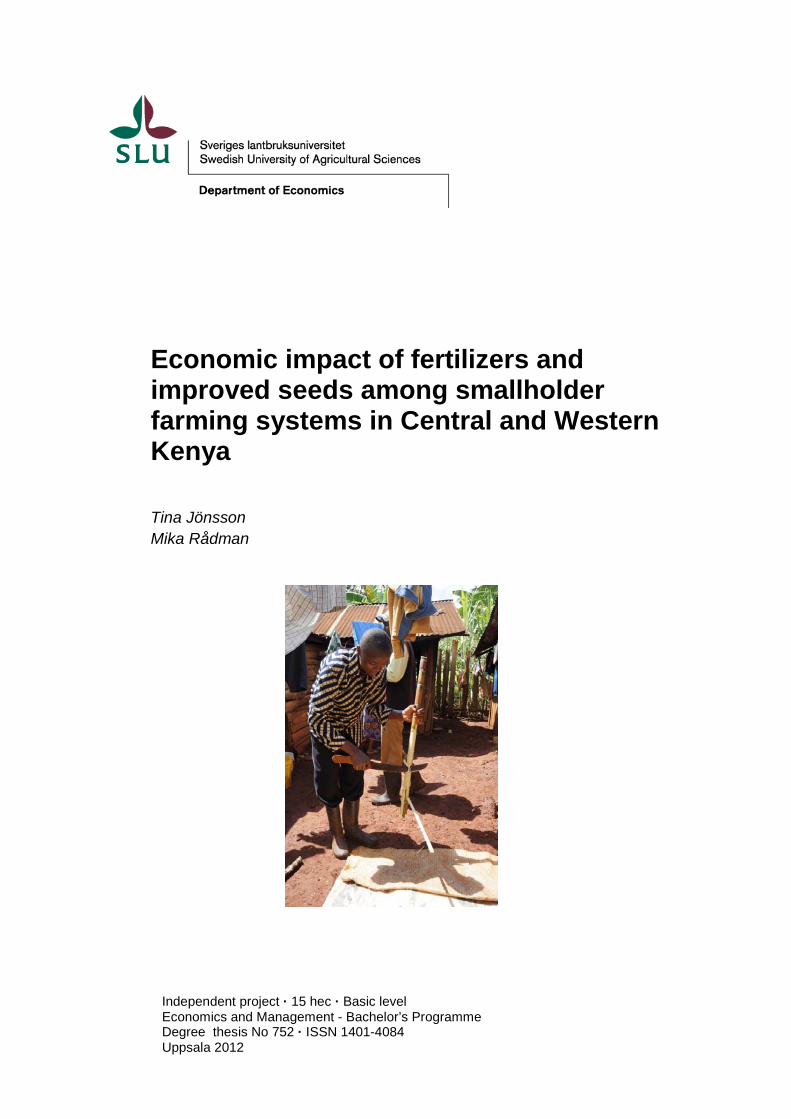
Economic impact of fertilizers and improved seeds among smallholder farming systems in Central and Western Kenya Tina Jönsson Mika Rådman
Economic impact of the use of fertilizers and improved seeds among smallholder farming systems in Kenya Tina Jönsson, Mika Rådman Supervisor: Carl Johan Lagerkvist, Swedish University of Agricultural Sciences, Department of Economics Assist. Supervisor: Kristina Röing de Nowina, International Centre for Tropical Agriculture Examiner: Karin Hakelius, Swedish University of Agricultural Sciences, Department of Economics Credits: 15 hec Level: G2E Course title: Degree project in Business Administration Course code: EX0538 Programme/Education: Economics and Management – Bachelor’s Programme Faculty: Faculty of Natural Resources and Agricultural Sciences
Place of publication: Uppsala Year of publication: 2012 Cover picture: Mika Rådman Name of Series: Degree project/SLU, Department of Economics No: 752 ISSN 1401-4084 Online publication: http://stud.epsilon.slu.se Key words: Kenya, Smallholder farmers, Economic impact, Fertilizers, Improved seeds, Crops, Maize, Beans

iii
Acknowledgements First of all we want to thank Sida for providing us with a scholarship and thereby enabling this opportunity to go to Kenya and do a Minor Field Study (MFS). This work was in part made possible through funding from the Swedish Ministry of Foreign Affairs as part of its special allocation on global food security (UD40). We also want to thank: our supervisors Carl Johan Lagerkvist and Kristina Röing de Nowina for their support, Thord Nilsson for his dedication and help during this study, our travelling companions and friends Anna Lenksjö, Henrik Nordzell, Siri Lindqvist Ståhle and Madelene Casselbrant. Without you, this experience would not have been the same. This project would not have been as successful without the help of our assistant Livingstone Chibole and our Kenyan student colleagues Godfrey Nambafu, Geoffrey Kimutai, and Patric Abasanjo. Also thanks to those who objected to our thesis and contributed with useful feedback. Last, we give a special thank you to all farmers who participated as respondents in this study. Thank you all. Nairobi, June 2012 ________________________ ________________________ Tina Jönsson Mika Rådman
iv
Abstract In Kenya, many families subsist on agriculture and of the country's around 40 million residents 70% work in the agricultural sector. 50 % of the country's gross domestic production (GDP) comes from farming, and thus the country is largely dependent on income from this sector. Kenya's population has tripled in recent decades, which have led to that food availability is a growing problem. To ensure food security, it is important that the return from crops increases. The aim of this study is to evaluate what impact the use of fertilizers and improved seeds has for farmer’s economic situation and income generation. The study is concerning the production of maize and beans. These two research questions were used to answer the aim:
• How do smallholder farmers in Kibugu and Bondo generate income in general?
• How does the use of fertilizers and improved seeds contribute to the income generation and economic situation for smallholder farmers in Kibugu and Bondo?
This study was carried out during the second period of spring term in 2012. In order to provide the information needed to fulfil the purpose of this project, the study includes two parts of data collection. The first part contains interviews with smallholder farmers in Western and Central Kenya, and the other part is a literature review. The interviews have been conducted to create a general overview of farmers’ financial situation, and to see how fertilizers and improved seeds contribute to the income generation. Literature has been reviewed in order to gain a basic understanding of what kind of inputs farmers in Kenya are using, and the input characteristics. In total, 37 farmers were interviewed in Kibugu and Bondo. Kibugu is located in Central Kenya while Bondo is located in Western Kenya. According to the literature review there would be a clear yield improvement when using fertilizers and improved seeds. The higher yield would in turn allow farmers to sell a larger part of the production, and consequently improve their economic situation. The results from this survey show that the outcome from using fertilizers and/or improved seeds does not always exceed the yield from using non-improved seeds. The study also shows that there is not always a clear advantage with using fertilizers instead of manure.
v
Sammanfattning I Kenya livnär sig många familjer på jordbruk och av landets runt 40 miljoner invånare arbetar 70 % inom jordbrukssektorn. Landets bruttonationalproduktion (BNP) kommer till hälften från jordbruk och gör därmed att landet till stor del är beroende av den inkomst lantbruket inbringar. Kenyas population har under de senaste decennierna tredubblats vilket har lett till att tillgången på mat är ett växande problem.
För att säkra tillgången på mat är det viktigt att avkastningen bland de grödor som odlas ökar. Syftet med denna studie är att utvärdera vilken inverkan användningen av gödningsmedel och förbättrat utsäde har för småskaliga jordbrukares ekonomiska situation och hur de genererar inkomster. Arbetet belyser produktionen av majs och bönor. För att besvara syftet formulerades dessa två frågeställningar:
• Hur genererar småskaliga jordbrukare i Kibugu och Bondo inkomst generellt?
• Hur påverkar användningen av handelsgödsel och förbättrat utsäde den ekonomiska situationen och intäktsgenereringen för småbrukare i Kibugu och Bondo?
Denna studie genomfördes under vårterminens andra period 2012. För att tillhandahålla den information som behövdes för att fullfölja syftet med projektet innehåller det två delar för insamling av data. En del bestod av intervjuer med småskaliga lantbrukare i västra och centrala Kenya samt en del med litteraturgenomgång. Intervjuerna har genomförts för att få en översikt över jordbrukarnas ekonomiska situation och se hur handelsgödsel och förbättrat utsäde bidrar till deras inkomster. Litteratur har granskats för att få en grundläggande förståelse för vilken typ av insatsvaror bönder i Kenya använder och vilka egenskaper dessa har. Totalt 37 småbrukare intervjuade i Kibugu och Bondo. Kibugu ligger i centrala Kenya, medan Bondo ligger i västra Kenya.
Enligt litteraturen skulle användningen av handelsgödsel och förbättrat utsäde leda till att avkastningen ökar. Den högre avkastningen skulle i sin tur möjliggöra för jordbrukarna att sälja en större del av produktionen, och därmed förbättra sin ekonomiska situation. Resultatet från denna uppsats visar att avkastningen från användningen av handelsgödsel och förbättrat utsäde inte alltid överstiger avkastningen från konventionella frön. Studien visar också att det inte alltid finns en klar fördel med att använda handelsgödsel gentemot att använda djurgödsel.

vi
Acronyms ECA United Nations Economic Commission for Africa FAO Food and Agriculture Organization GDP Gross Domestic Product IFAD International Fund for Agricultural Development KSH Kenya Shilling MFS Minor Field Study SCODP The Sustainable Community Oriented Development Programme Sida Swedish International Development Cooperation Agency SRO-SA Southern Africa Office UNECA United Nations Economic Commission for Africa Terms Cash crop Crops mainly produced for sale. Extension officer Works as a link between researchers and farmers and gives advice on how to achieve best possible results. Farming system In this study the term farming system is used to describe if the farmer has animal- and/or crop production. Fertilizer In this study the term fertilizer refers to chemical fertilizers that can be bought from an agro-vet. Improved seeds Hybrid seeds or treaded seeds are less sensitive to environmental changes. These seeds are designed to adapt to local conditions and can also be resistant against fungus and different diseases. Improved seeds are produced though conventional breeding but can also be hybrid

vii
seed that is a crossing between two or more separate inbred lines. The treated seeds can be covered in a chemical solution, often fungicides, herbicides or insecticides, prior to planting. The treated seeds can also be covered to enhance the nutritional value. Improved seeds can be bought from an agro-vet (a shop were seeds and fertilizers can be bought). Local variety Non-improved seeds or seeds that have been reused from previous yields and are being planted again (recycled improved seeds). Manure Animal manure. Smallholder farmer Throughout the study the term “farmer” is used instead of smallholder farmer. The definition of a smallholder farmer in this study is a farming system with limited production abilities. The farm sizes are a maximum of 2 hectares. Conversion 11 KSH ≈ approximately 1 SEK 1 Wheel barrow = 40 kg manure This study was financed by Sida Swedish International Development Cooperation Agency
viii
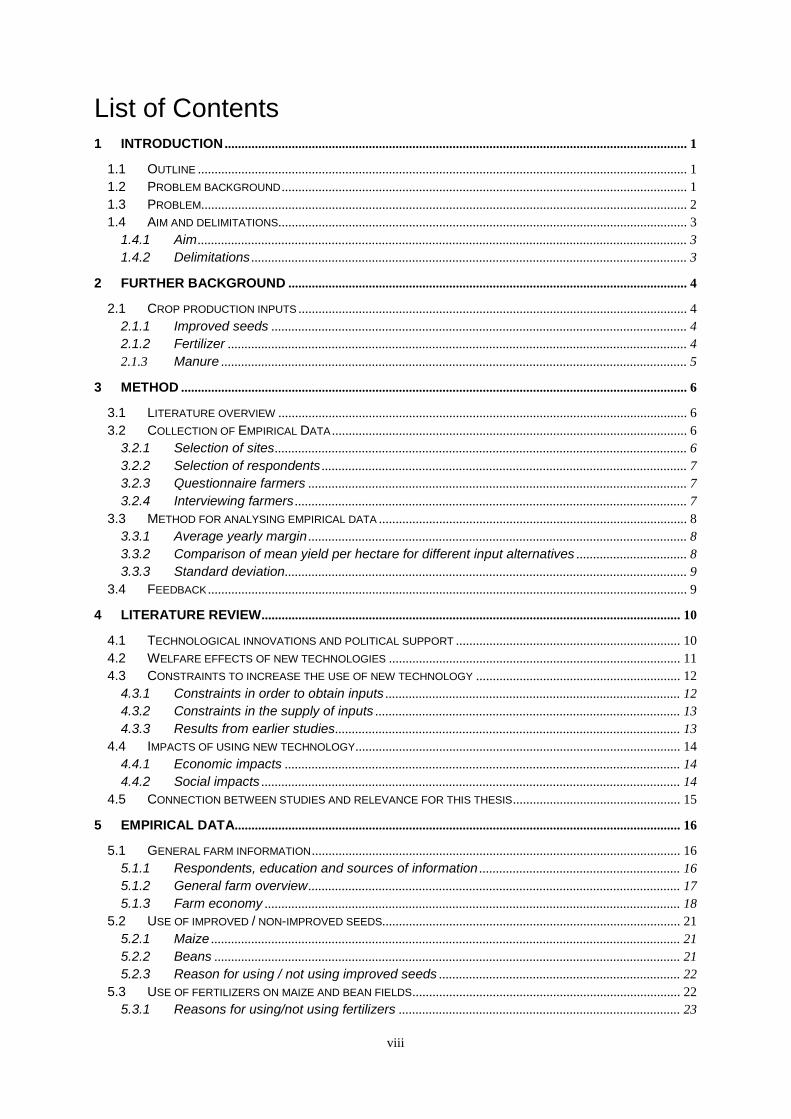
List of Contents
1 INTRODUCTION .......................................................................................................................................... 1
1.1 OUTLINE .................................................................................................................................................. 11.2 PROBLEM BACKGROUND ......................................................................................................................... 11.3 PROBLEM ................................................................................................................................................. 21.4 AIM AND DELIMITATIONS .......................................................................................................................... 3
1.4.1 Aim .................................................................................................................................................. 31.4.2 Delimitations .................................................................................................................................. 3
2 FURTHER BACKGROUND ....................................................................................................................... 4
2.1 CROP PRODUCTION INPUTS .................................................................................................................... 42.1.1 Improved seeds ............................................................................................................................ 42.1.2 Fertilizer ......................................................................................................................................... 42.1.3 Manure ........................................................................................................................................... 5
3 METHOD ....................................................................................................................................................... 6
3.1 LITERATURE OVERVIEW .......................................................................................................................... 63.2 COLLECTION OF EMPIRICAL DATA .......................................................................................................... 6
3.2.1 Selection of sites ........................................................................................................................... 63.2.2 Selection of respondents ............................................................................................................. 73.2.3 Questionnaire farmers ................................................................................................................. 73.2.4 Interviewing farmers ..................................................................................................................... 7
3.3 METHOD FOR ANALYSING EMPIRICAL DATA ............................................................................................ 83.3.1 Average yearly margin ................................................................................................................. 83.3.2 Comparison of mean yield per hectare for different input alternatives ................................. 83.3.3 Standard deviation ........................................................................................................................ 9
3.4 FEEDBACK ............................................................................................................................................... 9
4 LITERATURE REVIEW ............................................................................................................................. 10
4.1 TECHNOLOGICAL INNOVATIONS AND POLITICAL SUPPORT ................................................................... 104.2 WELFARE EFFECTS OF NEW TECHNOLOGIES ....................................................................................... 114.3 CONSTRAINTS TO INCREASE THE USE OF NEW TECHNOLOGY ............................................................. 12
4.3.1 Constraints in order to obtain inputs ........................................................................................ 124.3.2 Constraints in the supply of inputs ........................................................................................... 134.3.3 Results from earlier studies ....................................................................................................... 13
4.4 IMPACTS OF USING NEW TECHNOLOGY ................................................................................................. 144.4.1 Economic impacts ...................................................................................................................... 144.4.2 Social impacts ............................................................................................................................. 14
4.5 CONNECTION BETWEEN STUDIES AND RELEVANCE FOR THIS THESIS .................................................. 15
5 EMPIRICAL DATA ..................................................................................................................................... 16
5.1 GENERAL FARM INFORMATION .............................................................................................................. 165.1.1 Respondents, education and sources of information ............................................................ 165.1.2 General farm overview ............................................................................................................... 175.1.3 Farm economy ............................................................................................................................ 18
5.2 USE OF IMPROVED / NON-IMPROVED SEEDS ......................................................................................... 215.2.1 Maize ............................................................................................................................................ 215.2.2 Beans ........................................................................................................................................... 215.2.3 Reason for using / not using improved seeds ........................................................................ 22
5.3 USE OF FERTILIZERS ON MAIZE AND BEAN FIELDS ................................................................................ 225.3.1 Reasons for using/not using fertilizers .................................................................................... 23

ix
5.4 YIELD PRODUCED, KG/HECTARE ........................................................................................................... 235.4.1 Improved maize .......................................................................................................................... 235.4.2 Non-improved maize .................................................................................................................. 235.4.3 Improved Beans .......................................................................................................................... 245.4.4 Non-improved beans .................................................................................................................. 24
5.5 YIELD SOLD ........................................................................................................................................... 255.6 SOURCES OF ERROR ............................................................................................................................. 26
6 ANALYSIS AND DISCUSSION ............................................................................................................... 27
6.1 HOW DO SMALLHOLDER FARMERS IN KIBUGU AND BONDO GENERATE INCOME? ................................ 276.2 HOW DOES USE OF FERTILIZERS AND IMPROVED SEEDS CONTRIBUTE TO THE INCOME GENERATION AND ECONOMIC SITUATION FOR SMALLHOLDER FARMERS IN KIBUGU AND BONDO? ....................................... 28
6.2.1 Yield impact ................................................................................................................................. 286.2.2 Economic impact ........................................................................................................................ 30
6.3 DISCUSSION .......................................................................................................................................... 306.3.1 Economic effects of inputs ........................................................................................................ 306.3.2 Importance of information .......................................................................................................... 326.3.3 Conditions for future economic growth .................................................................................... 336.3.4 Future research ........................................................................................................................... 33
7 CONCLUSIONS ......................................................................................................................................... 34
BIBLIOGRAPHY ................................................................................................................................................ 36
APPENDIX 1: FARMER QUESTIONNAIRE ................................................................................................. 40
APPENDIX 2: FEEDBACK .............................................................................................................................. 45
Appendix 2.1 Feedback Bondo ................................................................................................................ 45Appendix 2.2 Feedback Kibugu ............................................................................................................... 45
APPENDIX 3: EMPIRICAL DATA .................................................................................................................. 46
Appendix 3.1 General household information ........................................................................................ 46Appendix 3.2 General farm information .................................................................................................. 47
List of Figures Figure 1: Paper outline. ........................................................................................................................................... 1 Figure 2: Map of Africa, showing Kenya (www, nationsonline, 1, 2012). ............................................................. 1 Figure 3: Map of Kenya showing the Kibugu and Bondo areas. Altered by authors (www, nationsonline, 2,
2012). .............................................................................................................................................................. 6 Figure 4: Different input alternatives for improved and non-improved maize and bean seeds. .............................. 9 Figure 5: Average yield (kg/ha) per year for maize when grown with different combinations of inputs, (ECA-SA,
year unknown) ............................................................................................................................................... 13 Figure 6: Most common sources of information about farming in Kibugu and Bondo. ....................................... 17 Figure 7: Income generating activities, % of total income, KSH. ......................................................................... 18 Figure 8 Farmers own perception of how much they consume from the yearly farm production (100 % on the x-
axis means that they consume all of the production and 0% that they sell all of it). ..................................... 20 Figure 9: Usage of improved / non- improved maize seeds .................................................................................. 21 Figure 10: Use of improved / non-improved bean seeds ....................................................................................... 21 Figure 11: Usage of different input combinations, %, on maize and bean fields in Kibugu and Bondo ............... 22 Figure 12: Average yield, kg/ha, for improved maize in Kibugu and Bondo, with different input combinations.
Standard deviation is shown within brackets. ............................................................................................... 23 Figure 13: Average yield, kg/ha, for non-improved maize seeds in Bondo, with different input combinations. No
respondent grew this crop in Kibugu. Standard deviation is shown within brackets. ................................... 24
x
Figure 14: Average yield, kg/ha, for non-improved bean seeds with different input combinations. Standard deviation is shown within brackets. .............................................................................................................. 24
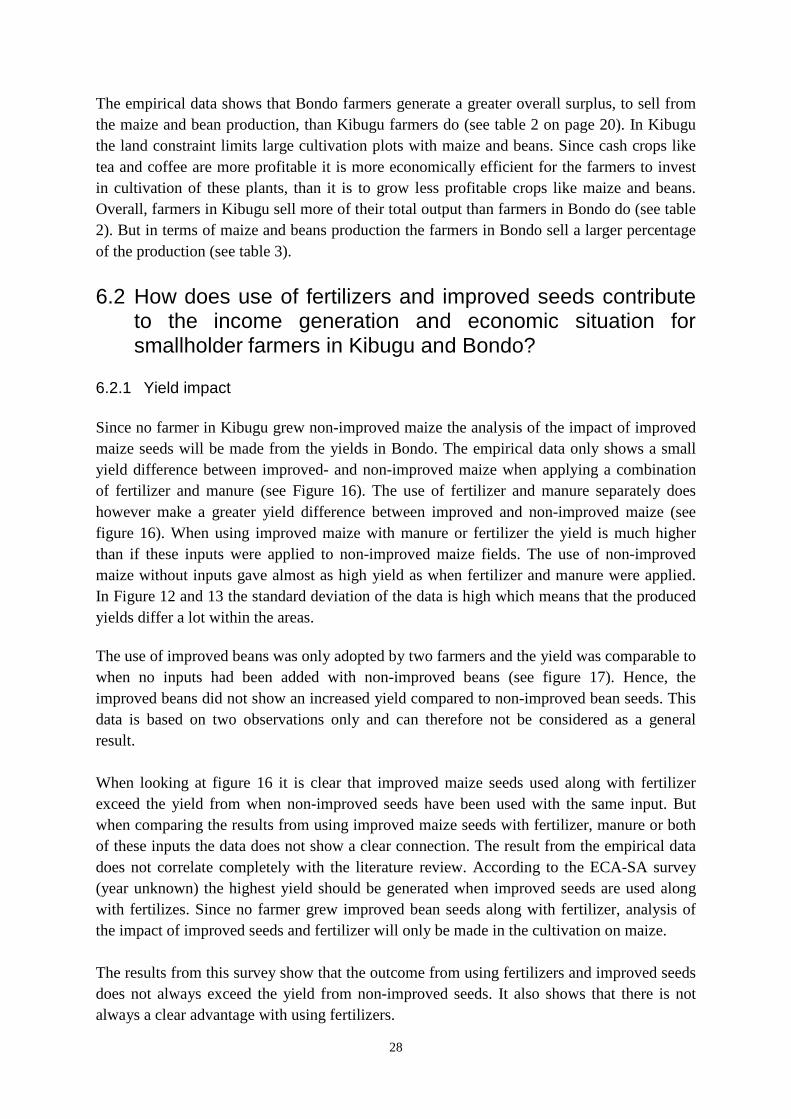
Figure 15 Income generation activities, % of total income, KSH. ........................................................................ 27 Figure 16 Yield from improved and non-improved maize in Bondo and Kibugu, kg/ha This Figure is a merged
summary of Figure 12 and 13 ....................................................................................................................... 29 Figure 17 Yields from improved and non-improved beans in Bondo and Kibugu, kg/ha This Figure is a merged
summary of Figure 12 and 13 ....................................................................................................................... 29
List of Tables Table 1: Summary of where the interviews were conducted and number of respondents in each area ................. 16Table 2: Income and cost overview ....................................................................................................................... 19Table 3: Percentage of the total yield from each input combination in each area that has been sold during the
year. ............................................................................................................................................................... 25Table 4: Percentage of the total maize yield from each input combination in each area that has been sold during
the year. ......................................................................................................................................................... 30
1
Introduction
Further background
Method
Literature review
Empirical data
Analysis and discussion Conclusion
1 Introduction
This chapter begins with an overview of the paper outline. It then continues by describing the general situation in Kenya and explains the problem and problem background. The chapter ends with the aim and delimitations of the project.
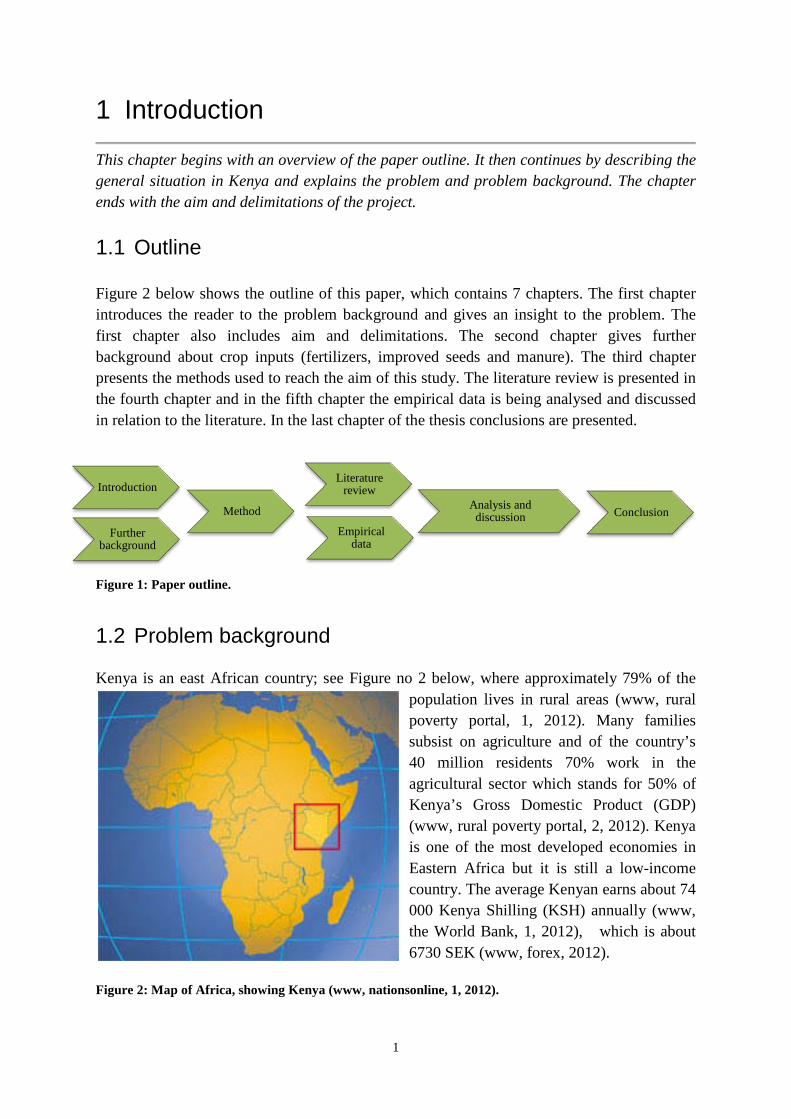
1.1 Outline Figure 2 below shows the outline of this paper, which contains 7 chapters. The first chapter introduces the reader to the problem background and gives an insight to the problem. The first chapter also includes aim and delimitations. The second chapter gives further background about crop inputs (fertilizers, improved seeds and manure). The third chapter presents the methods used to reach the aim of this study. The literature review is presented in the fourth chapter and in the fifth chapter the empirical data is being analysed and discussed in relation to the literature. In the last chapter of the thesis conclusions are presented.
Figure 1: Paper outline.
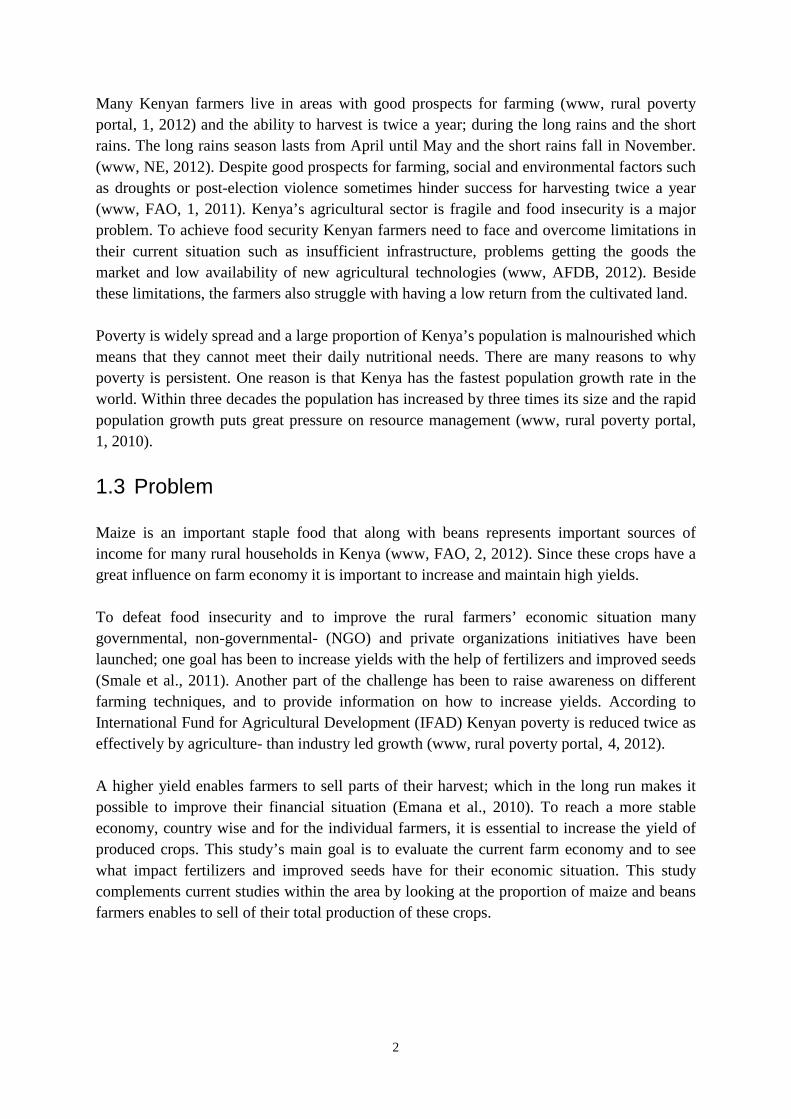
1.2 Problem background Kenya is an east African country; see Figure no 2 below, where approximately 79% of the
population lives in rural areas (www, rural poverty portal, 1, 2012). Many families subsist on agriculture and of the country’s 40 million residents 70% work in the agricultural sector which stands for 50% of Kenya’s Gross Domestic Product (GDP) (www, rural poverty portal, 2, 2012). Kenya is one of the most developed economies in Eastern Africa but it is still a low-income country. The average Kenyan earns about 74 000 Kenya Shilling (KSH) annually (www, the World Bank, 1, 2012), which is about 6730 SEK (www, forex, 2012).
Figure 2: Map of Africa, showing Kenya (www, nationsonline, 1, 2012).
2
Many Kenyan farmers live in areas with good prospects for farming (www, rural poverty portal, 1, 2012) and the ability to harvest is twice a year; during the long rains and the short rains. The long rains season lasts from April until May and the short rains fall in November. (www, NE, 2012). Despite good prospects for farming, social and environmental factors such as droughts or post-election violence sometimes hinder success for harvesting twice a year (www, FAO, 1, 2011). Kenya’s agricultural sector is fragile and food insecurity is a major problem. To achieve food security Kenyan farmers need to face and overcome limitations in their current situation such as insufficient infrastructure, problems getting the goods the market and low availability of new agricultural technologies (www, AFDB, 2012). Beside these limitations, the farmers also struggle with having a low return from the cultivated land. Poverty is widely spread and a large proportion of Kenya’s population is malnourished which means that they cannot meet their daily nutritional needs. There are many reasons to why poverty is persistent. One reason is that Kenya has the fastest population growth rate in the world. Within three decades the population has increased by three times its size and the rapid population growth puts great pressure on resource management (www, rural poverty portal, 1, 2010). 1.3 Problem Maize is an important staple food that along with beans represents important sources of income for many rural households in Kenya (www, FAO, 2, 2012). Since these crops have a great influence on farm economy it is important to increase and maintain high yields. To defeat food insecurity and to improve the rural farmers’ economic situation many governmental, non-governmental- (NGO) and private organizations initiatives have been launched; one goal has been to increase yields with the help of fertilizers and improved seeds (Smale et al., 2011). Another part of the challenge has been to raise awareness on different farming techniques, and to provide information on how to increase yields. According to International Fund for Agricultural Development (IFAD) Kenyan poverty is reduced twice as effectively by agriculture- than industry led growth (www, rural poverty portal, 4, 2012). A higher yield enables farmers to sell parts of their harvest; which in the long run makes it possible to improve their financial situation (Emana et al., 2010). To reach a more stable economy, country wise and for the individual farmers, it is essential to increase the yield of produced crops. This study’s main goal is to evaluate the current farm economy and to see what impact fertilizers and improved seeds have for their economic situation. This study complements current studies within the area by looking at the proportion of maize and beans farmers enables to sell of their total production of these crops.
3
1.4 Aim and delimitations 1.4.1 Aim The aim of this MFS is to evaluate what impact the use of fertilizers and improved seeds have for farmer’s economic situation. To reach the aim the following questions have been formulated:
• How do smallholder farmers in Kibugu and Bondo generate income in general?
• How does the use of fertilizers and improved seeds contribute to the income generation and economic situation for smallholder farmers in Kibugu and Bondo?
1.4.2 Delimitations This thesis is mainly focusing on maize because it is an important food security crop in Kenya (Ouma, et al., 2006). Beans are also considered since many farmers use legumes as a major food grain (www, KARI, 2012). The main reason for only focusing on two different crops is the restricted amount of time for collecting data. The study is covering the general economic situation on the farm, and includes an estimation of income and expenses from sold crops. This thesis is focusing on economic measurements and does not take into account other factors such as land preparation or precipitation. Many agricultural and socioeconomic factors are important to take into account to understand farmers’ overall economic situation, but are not covered here due to the restricted amount of time and limited extent of the thesis. The study compares the yields between fields where improved seeds have been used and where non-improved seeds have been used. No consideration is taken to what different kinds of varieties that are used. Different kinds of fertilizer and manure are also not considered in this study; only a comparison in yield between using fertilizer and manure is conducted. The reason for not including a more detailed differentiation between various varieties of improved and non-improved seeds, fertilizers and manure, is due to the restricted extent of the thesis and that the main aim is to evaluate what effects different general techniques have.

4
2 Further background
To give the reader an understanding of improved seeds, fertilizers and manure this chapter contains basic information regarding these inputs. General facts about the different inputs are presented as well as expected advantages and disadvantages from using them.
2.1 Crop production inputs 2.1.1 Improved seeds An important prerequisite for creating high quality crops with good growth and high yield is good seeds, and therefore improved seeds have been developed (www, rootcapital, 2012). Improved seeds, such as hybrids or treated seeds are designed to adapt to local conditions and can also be resistant against fungus, pests and different diseases. Therefore, they are less sensitive to environmental changes and harsh weather conditions. In order to create hybrid seeds two or more different inbred lines are crossed (Smale, et al., 2009). Treated seeds can be covered in a chemical solution, often fungicides or insecticides, prior to planting (McMullen, et al., 2001). A disadvantage of improved seeds is that the ability to increase the yields drops when improved seeds are recycled (Smale, et al., 2009). This means that if the seeds are planted a second or third time the yield will be lower than when the seeds are new. New seeds must therefore be purchased prior to each sowing period to get the higher yield. The need for new seeds means additional costs for farmers, but the advantage is a higher yield, which increases the farm income. 2.1.2 Fertilizer An important prerequisite to produce high quality crops, with good growth, is to add nutrition. The crops extract nutrients from the soil and it is important to combine a broad variety of nutrition in the right quantity to get a good yield. When growing crops on the same plot year after year it is necessary to add extra nutrients to the soil to restore the nutrient level (Morris, et al., 2007). Fertilizers contain nutrients for plants and are used to strengthen and maintain the soil’s ability to improve the fertility. Fertilizers often include phosphorus, potassium and nitrogen, which are three nutrients that help to restore the soil fertility. Fertilizer is also used to achieve a sustainable and profitable production; when applying 1 kg of fertilizer the yield can increase by 7-10 times (ECA-SA, year unknown). Other advantages with fertilizers compared to manure are that they do not require much storage space, which makes them easy to store and transport. Neither do fertilizers require as big workloads as manure because fertilizers are not so heavy to apply since the volume to apply is smaller. Moreover, fertilizers do not have to decompose before the crops can absorb the nutrients and it dissolves readily in water. This makes it easier for crops to absorb the nutrients, and for the farmer to apply a sufficient dosage of nutrients (Morris et al., 2007).

5
The use of fertilizers is not always profitable. Firstly, it is an expensive investment, which means increased costs. Secondly, if it is not handled properly, fertilizers will have a negative impact on the nature and can be harmful for both animals and human’s health (Emana et al., 2010). 2.1.3 Manure In East Africa manure is a more common source of nutrition for plants than fertilizers. The main reason for this is poor financial assets. Some farmers cannot afford to buy fertilizers at all, and others cannot afford to buy enough to meet the recommended amount of fertilizer to gain a higher yield. Cow manure is the most common type of manure used by farmers in eastern Africa. The nutrient content of manure can vary depending on factors such as what kind of animal it comes from, the animal’s diet and manure processing. Proper collection and storage of manure are important prerequisites for reducing losses of nutrients in manure (Snijders, et al., 2009). The advantage of using manure is that nutrients are being released successively and thereby increase the organic matter in the soil (Morris et al., 2007). However, the disadvantages of using manure instead of fertilizer are that manure contains lower levels of nutrients than fertilizer and sometimes there is not enough manure to meet the recommended amount of nutrient that the crops need.
6
3 Method
This chapter contains pictorial and narrative descriptions of the methods that were used to answer the aim of this study. 3.1 Literature overview In the beginning of the study, a deeper understanding of the underlying problem, “food insecurity in Africa”, was needed. Information was gathered through visiting well-known Internet sites such as IFAD and FAO. Thereafter a “further background” was written to get an understanding of the advantages and disadvantages of improved seeds, fertilizer and manure. This was done to give the authors and readers a general overview of the subject. A literature review was made to obtain an overview of earlier studies within the field. Different published articles were chosen to get a broader understanding of how improved seeds and fertilizers can improve economic growth, and what factors come into play for yield growth. The articles were taken from google.com which is considered to be the broadest database, but only up to date and well-known articles were selected to avoid incorrect information. Many of the articles reviewed prior to the study address the same issues, and the information overlap. To avoid repetition of facts and arguments the presentation of articles are made to cover different aspects of the subject, and to complement each other. The articles revolve around what impact technologies such as improved seeds and fertilizers have, but the presentation is conducted to easily overview various effects. 3.2 Collection of Empirical Data 3.2.1 Selection of sites
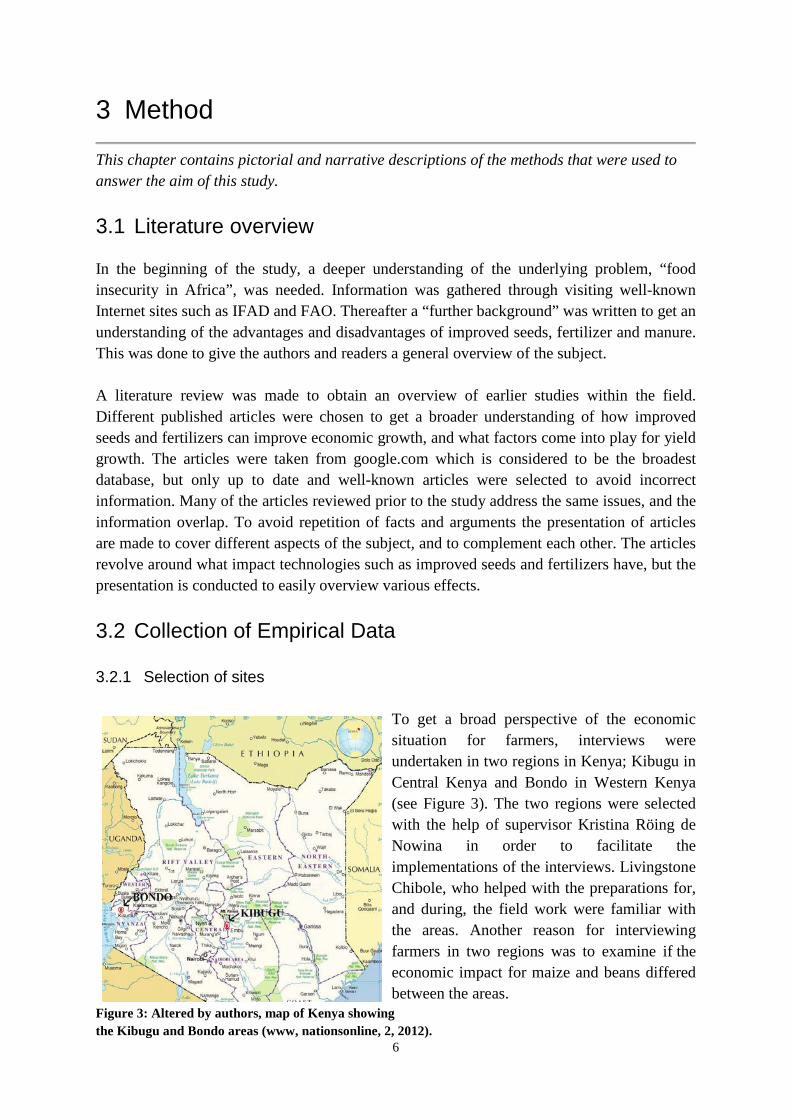
To get a broad perspective of the economic situation for farmers, interviews were undertaken in two regions in Kenya; Kibugu in Central Kenya and Bondo in Western Kenya (see Figure 3). The two regions were selected with the help of supervisor Kristina Röing de Nowina in order to facilitate the implementations of the interviews. Livingstone Chibole, who helped with the preparations for, and during, the field work were familiar with the areas. Another reason for interviewing farmers in two regions was to examine if the economic impact for maize and beans differed between the areas.
Figure 3: Altered by authors, map of Kenya showing the Kibugu and Bondo areas (www, nationsonline, 2, 2012).

7
3.2.2 Selection of respondents The interviewed farmers were randomly selected and the interviews were conducted with farmers situated with at least 300 meters distance from each other. The distance between the farmers was determined before the fieldwork had begun. 3.2.3 Questionnaire farmers To collect empirical data from farmers a questionnaire was designed (see appendix 1). The questionnaire consisted of three parts and covered mostly economic issues. The outline for the questionnaire was based on a questionnaire used in one of Professor Carl Johan Lagerkvist’s on-going projects. The questionnaire was redesigned in order to answer the questions in the Aim of the thesis. On April 10Th, a test interview was conducted with a farmer situated just outside of Nairobi. The test interview was conducted to see if the questions in the survey worked well in practice, and to rehearse for the upcoming fieldwork. After conducting the test interview the questionnaire was processed and altered a second time. 3.2.4 Interviewing farmers The fieldwork was conducted during the beginning of April to the beginning of June 2012 and a total of 37 farmers were interviewed in Central and Western Kenya. Due to low response rate in the 3 questionnaires only 34 interviews were included in the final report. The interviews took place on each respondent’s farm and lasted about one to one and a half hours. An interpreter was used to make sure that the respondent understood the questions correctly, and that the interviewers understood the answers. The questions were based on a summary from last year’s farm events (2011) to make all information as accurate as possible. The interview method was mainly quantitative, where a standardized questionnaire was used (Ekholm et al., 2002). A smaller part of the interview was qualitative, where a fast transect walk was made. A transect walk is when the respondent and interviewer walk together through the intended project area (www, the world bank, 2, 2012). The transect walk was made in the end of the interview and a sketch of each farm was drawn. This part of the interview was important to verify the respondent's answers in the first part of the interview, but sometimes also revealed new information.

8
3.3 Method for analysing empirical data All collected empirical data was put into a contribution spread sheet and was later analysed according to the methods described below. 3.3.1 Average yearly margin To evaluate the average farmer’s general economic situation a profit loss statement for the two areas was calculated. The calculation was made in two steps: The first step was to calculate the individual farmers profit loss statement (PLS). The yearly total revenue (TR) for each farm was calculated by adding all income generated from farming. All farm-related variable and fixed costs were added together to calculate total costs (TC). TC was thereafter subtracted from the TR for each farm (Ax, Johansson, Kullvén, 2005).
𝑃𝐿𝑆 = 𝑇𝑅 − 𝑇𝐶 The second step was to calculate the mean PLS in each of the two areas. All farmers’ yearly profits were summarized and then divided with the number of farmers interviewed (Körner, Wahlgren, 2002).
𝑃𝐿𝑆 =∑ 𝑃𝐿𝑆𝑖𝑛𝑖=1
𝑛
3.3.2 Comparison of mean yield per hectare for different input alternatives A mean yield kg per hectare analysis was completed to determine how the use of fertilizers and/or improved seeds contributes to the farmers’ economic situation. The mean yield (�) was calculated according to the formula below (Körner, Wahlgren, 2002):
S 𝑌 = ∑ 𝑦𝑖𝑛𝑖=1𝑛
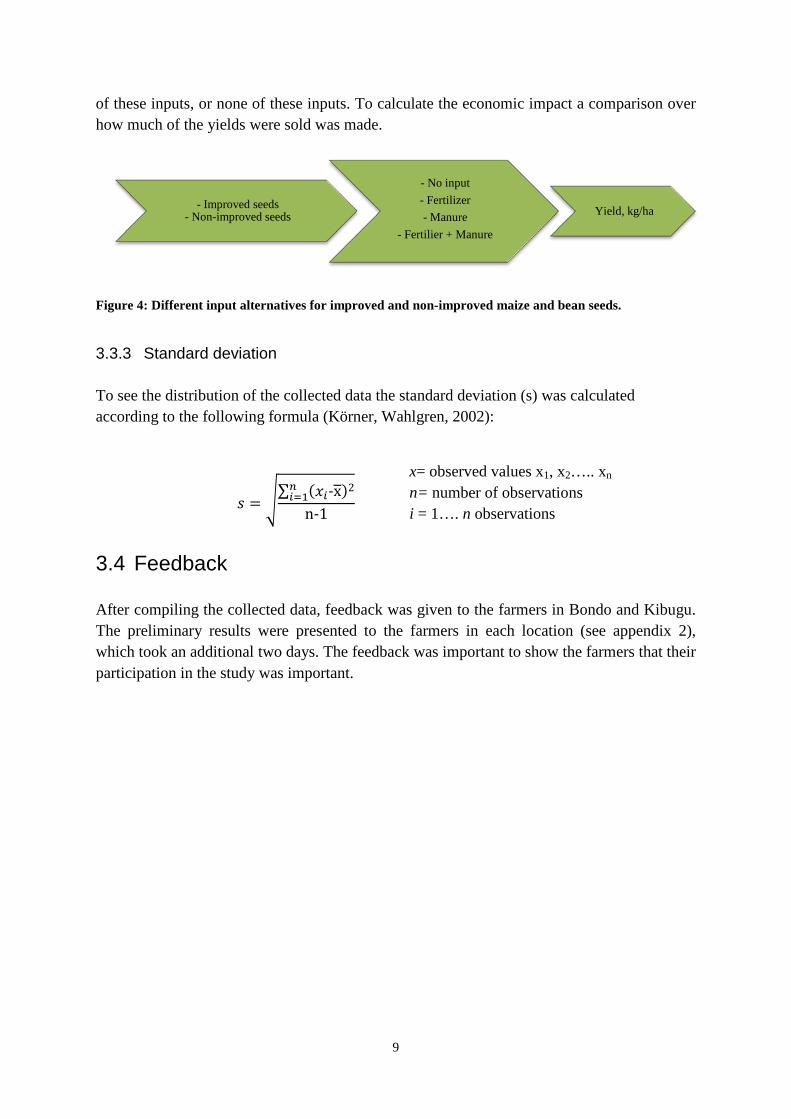
The mean yields of fields with different inputs were compared in order to differentiate which farming system that seemed to be most successful (in terms of high yield). Figure 4 below shows the different input alternatives. The options were to use improved seeds or non-improved seeds for maize and beans. The seeds could be grown with fertilizer, manure, both
y= observed values (kg/ha) on field y1, y2..yn n= number of observations i = 1…. n fields
PLS= observed values PLS1, PLS2….. PLSn n= number of observations i = 1…. n farmers
9
of these inputs, or none of these inputs. To calculate the economic impact a comparison over how much of the yields were sold was made.
Figure 4: Different input alternatives for improved and non-improved maize and bean seeds.
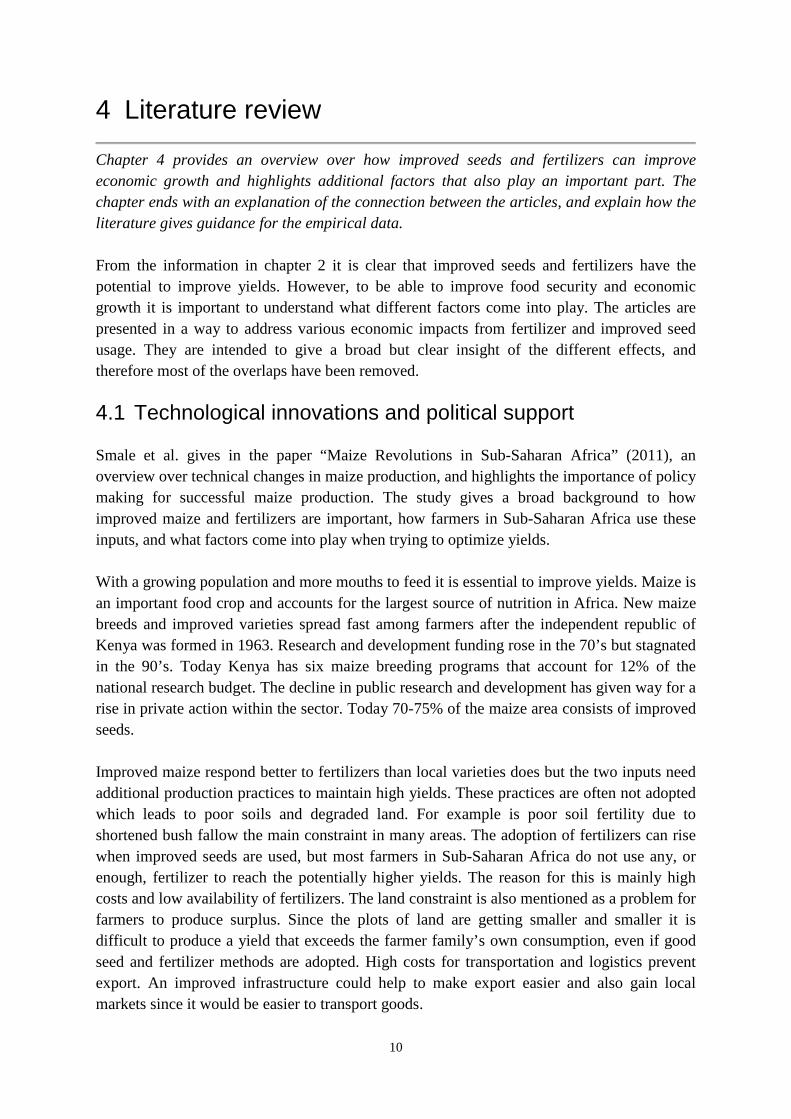
3.3.3 Standard deviation To see the distribution of the collected data the standard deviation (s) was calculated according to the following formula (Körner, Wahlgren, 2002):
𝑠 = �∑ (𝑥𝑖-x)2𝑛𝑖=1
n-1
3.4 Feedback After compiling the collected data, feedback was given to the farmers in Bondo and Kibugu. The preliminary results were presented to the farmers in each location (see appendix 2), which took an additional two days. The feedback was important to show the farmers that their participation in the study was important.
- Improved seeds - Non-improved seeds
- No input - Fertilizer - Manure
- Fertilier + Manure
Yield, kg/ha
x= observed values x1, x2….. xn n= number of observations i = 1…. n observations
10
4 Literature review
Chapter 4 provides an overview over how improved seeds and fertilizers can improve economic growth and highlights additional factors that also play an important part. The chapter ends with an explanation of the connection between the articles, and explain how the literature gives guidance for the empirical data. From the information in chapter 2 it is clear that improved seeds and fertilizers have the potential to improve yields. However, to be able to improve food security and economic growth it is important to understand what different factors come into play. The articles are presented in a way to address various economic impacts from fertilizer and improved seed usage. They are intended to give a broad but clear insight of the different effects, and therefore most of the overlaps have been removed.
4.1 Technological innovations and political support Smale et al. gives in the paper “Maize Revolutions in Sub-Saharan Africa” (2011), an overview over technical changes in maize production, and highlights the importance of policy making for successful maize production. The study gives a broad background to how improved maize and fertilizers are important, how farmers in Sub-Saharan Africa use these inputs, and what factors come into play when trying to optimize yields. With a growing population and more mouths to feed it is essential to improve yields. Maize is an important food crop and accounts for the largest source of nutrition in Africa. New maize breeds and improved varieties spread fast among farmers after the independent republic of Kenya was formed in 1963. Research and development funding rose in the 70’s but stagnated in the 90’s. Today Kenya has six maize breeding programs that account for 12% of the national research budget. The decline in public research and development has given way for a rise in private action within the sector. Today 70-75% of the maize area consists of improved seeds. Improved maize respond better to fertilizers than local varieties does but the two inputs need additional production practices to maintain high yields. These practices are often not adopted which leads to poor soils and degraded land. For example is poor soil fertility due to shortened bush fallow the main constraint in many areas. The adoption of fertilizers can rise when improved seeds are used, but most farmers in Sub-Saharan Africa do not use any, or enough, fertilizer to reach the potentially higher yields. The reason for this is mainly high costs and low availability of fertilizers. The land constraint is also mentioned as a problem for farmers to produce surplus. Since the plots of land are getting smaller and smaller it is difficult to produce a yield that exceeds the farmer family’s own consumption, even if good seed and fertilizer methods are adopted. High costs for transportation and logistics prevent export. An improved infrastructure could help to make export easier and also gain local markets since it would be easier to transport goods.
11
In addition to technological tools, political and social initiatives are needed. To provide information about how to increase yields and to maintain good soil and crops, extension officers have played an important role. Due to poor management the access to extension services has declined from 58 % in 1992 to only 30 % in 2006. Many different projects about how farmers can gain information about crop management have been conducted. Farmer field schools, demonstration of different technologies and other extension experiments have been tested, but the evaluation of whether these extension systems are successful or not are limited. Economic strategies such as input subsidies, fertilizers and seed market policies and efforts to stabilize the maize market have had a great influence on the maize market. The conclusion of the study suggests that if fertilizers and improved seeds are used more effectively, with good soil and land management, an economic upswing will follow. Although, good economic growth will only follow if the retail maize market is dependable and if large long-term investments are made. Technological innovations alone are not enough to obtain a secure food supply, but political support and commitment along with private initiatives and advisory systems are just as important over the long term.
4.2 Welfare effects of new technologies In the article “Welfare effects of maize technologies in marginal and high potential regions of Kenya” from 2003, Karanja et al. examines how marginal and high potential regions in Kenya respond to improved maize technologies. In Kenya the debate regarding the impact of research efforts in marginal and high potential production environments is on-going. The fast population growth has made more and more people move from agronomic high potential areas to agronomic marginal regions. The study was made to help evaluate where research resources should be allocated to gain the highest benefits. The article is relevant to this thesis in order to understand the importance of research and allocating of resources. A multi-market model was used to examine how the welfare of different rural and urban households is affected when new technologies are used. In the study economic behaviour of small and large farms plus urban households in six ecological zones in Kenya was featured. Two zones were classed as marginal regions and four as high potential regions. The result of the study was that new maize technologies, fitted for each area, had greater economic impact in high potential areas than in marginal regions. It was also found that a diffusion of technologies in high potential areas had a greater impact than in marginal regions. The article highlighted the importance of maize prices as an important factor for the gains and losses of technology adoption. But even though the income rose with a diffusion of technologies, the income distributions was more unequal in high potential areas than in marginal areas. The dilemma for where research should be allocated withstands; is it better to maximize income or are distributional goals more important?
12
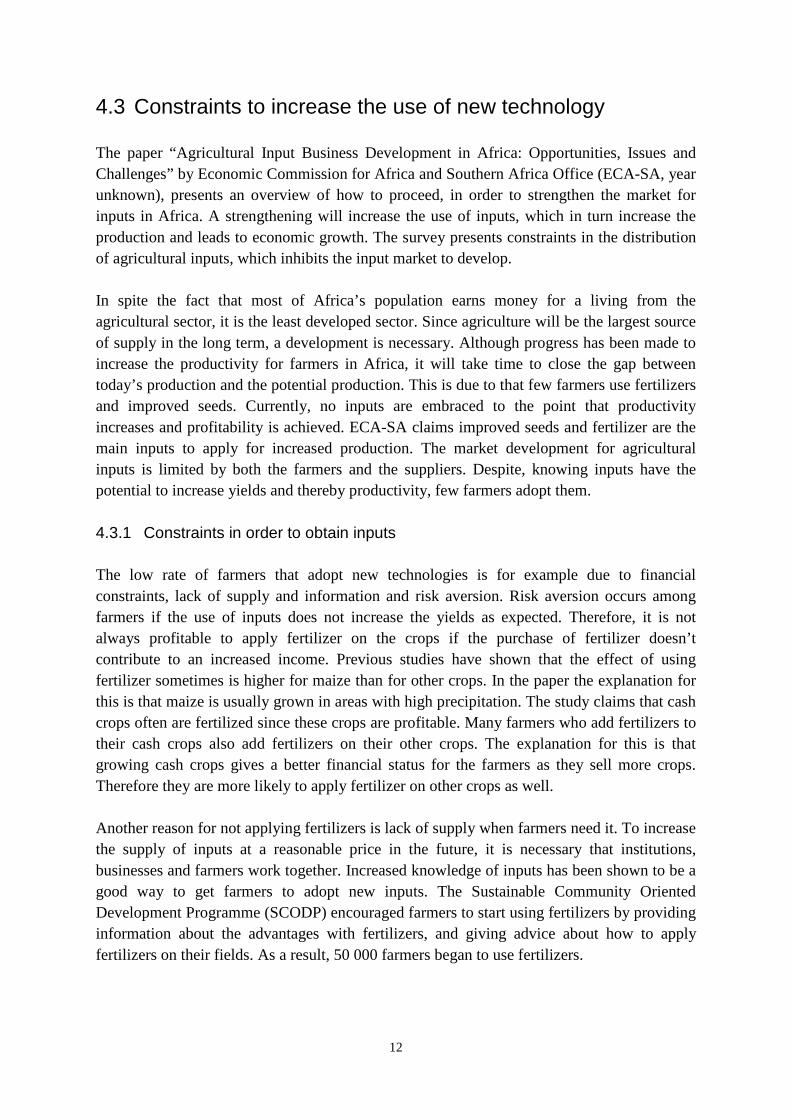
4.3 Constraints to increase the use of new technology The paper “Agricultural Input Business Development in Africa: Opportunities, Issues and Challenges” by Economic Commission for Africa and Southern Africa Office (ECA-SA, year unknown), presents an overview of how to proceed, in order to strengthen the market for inputs in Africa. A strengthening will increase the use of inputs, which in turn increase the production and leads to economic growth. The survey presents constraints in the distribution of agricultural inputs, which inhibits the input market to develop. In spite the fact that most of Africa’s population earns money for a living from the agricultural sector, it is the least developed sector. Since agriculture will be the largest source of supply in the long term, a development is necessary. Although progress has been made to increase the productivity for farmers in Africa, it will take time to close the gap between today’s production and the potential production. This is due to that few farmers use fertilizers and improved seeds. Currently, no inputs are embraced to the point that productivity increases and profitability is achieved. ECA-SA claims improved seeds and fertilizer are the main inputs to apply for increased production. The market development for agricultural inputs is limited by both the farmers and the suppliers. Despite, knowing inputs have the potential to increase yields and thereby productivity, few farmers adopt them. 4.3.1 Constraints in order to obtain inputs The low rate of farmers that adopt new technologies is for example due to financial constraints, lack of supply and information and risk aversion. Risk aversion occurs among farmers if the use of inputs does not increase the yields as expected. Therefore, it is not always profitable to apply fertilizer on the crops if the purchase of fertilizer doesn’t contribute to an increased income. Previous studies have shown that the effect of using fertilizer sometimes is higher for maize than for other crops. In the paper the explanation for this is that maize is usually grown in areas with high precipitation. The study claims that cash crops often are fertilized since these crops are profitable. Many farmers who add fertilizers to their cash crops also add fertilizers on their other crops. The explanation for this is that growing cash crops gives a better financial status for the farmers as they sell more crops. Therefore they are more likely to apply fertilizer on other crops as well. Another reason for not applying fertilizers is lack of supply when farmers need it. To increase the supply of inputs at a reasonable price in the future, it is necessary that institutions, businesses and farmers work together. Increased knowledge of inputs has been shown to be a good way to get farmers to adopt new inputs. The Sustainable Community Oriented Development Programme (SCODP) encouraged farmers to start using fertilizers by providing information about the advantages with fertilizers, and giving advice about how to apply fertilizers on their fields. As a result, 50 000 farmers began to use fertilizers.

13
4.3.2 Constraints in the supply of inputs As a result of low consumption, few companies choose to produce fertilizer in Africa because of no economies of scale. This means that a large proportion of the inputs must be imported from other countries outside Africa, which contributes to the high price. It is difficult for suppliers to reach out to farmers in rural areas, due to long supply chains, which lead to high marketing costs. Marketing costs account for half of the costs arising from the imported inputs until the inputs have reached the farmers. Another constraint is a misunderstanding between suppliers and farmers that the demand for fertilizers is low. As a result in the SCODP study mentioned above, when more farmers began to adopt fertilizer and the suppliers became aware that the demand for inputs actually existed, the misunderstanding decreased. The affordability is an important presumption for the farmers to enable adoption of new inputs. The government’s efforts to support the availability of inputs sometimes hinder more than it helps. Instead of strengthening the infrastructure as needed to increase the use of new inputs, subsidies have been introduced to solve the problem of the high cost of inputs. These measures are only short-term solutions because private companies are discouraged to enter the market. If companies would enter the market it would enable farmers to get access to the inputs easier and the prices would also decrease. 4.3.3 Results from earlier studies The benefit in terms of increased yields when using two inputs at once, instead of one, is shown in the figure below. Figure 5 shows the average yield per kg/ha/year in cultivation of maize, when grown together with different combinations of inputs. The Figure shows the link between the use of improved seeds and fertilizer used together, and higher yield. The highest yield was generated when improved seeds were used along with fertilizer.
Figure 5: Average yield (kg/ha) per year for maize when grown with different combinations of inputs, (ECA-SA, year unknown)

14
4.4 Impacts of using new technology Emana et al. gives in the report “Impacts of Improved Seeds and Agrochemicals on Food Security and Environment in the Rift Valley of Ethiopia: Implications for the Application of an African Green Revolution” (2010) an overview over positive and negative impacts from adopting new technologies in agricultural production. The study also emphasizes the importance of new and improved technologies to increase production and achieve food security. It is also of essence to highlight the agricultural production since almost half of the Ethiopian GDP is generated from the agricultural sector, the same as in Kenya. In the study comparisons were made between users and non-users of improved seeds and fertilizer. Interviews were conducted with farmers, researchers and institutions to examine their experience of input use. The adoption of new technologies cause positive impacts affecting people, the economy and society, while the negative impacts affects the environment. 4.4.1 Economic impacts According to the study, users of improved seeds and fertilizer increased the household income with twice as much compared with non-users. The standard of living and health were better because they have been able to eat a more varied diet and to improve their houses. Food security is better for the users than non-users since more food are available because of their higher yields. As more farmers improve their production by adopting new technologies the incentives for adoption increase. The fact that cash crops have increased is due to the introduction of new technologies. The growth has contributed to increased market integration because these crops are destined to be sold on the market. Market integration is good in terms of farmers starts cooperate. Also the use of improved seeds along with fertilizer increase the market integration since the crops are not only consumed by the farmers themselves but also sold in the market.
Negative impacts with the introduction of new technology include the fact that not everyone can afford, or want to adopt them. Some farmers cannot afford to buy enough fertilizer, resulting in that a too low level of these inputs is applied. When all farmers do not adopt new inputs it creates larger gaps between the economic situations for the users and non-users. In the paper some respondents said that once they had begun to use fertilizer, it was impossible to stop using it because the use of fertilizer disturbs the natural balance and soil structure.
4.4.2 Social impacts It is difficult for farmers to obtain inputs when needed. The use of inputs has improved the supply and therefore increased the supply. Also the exports of outputs have increased as a result of input use. With the introduction of machinery, the need for labour has declined while the use of improved seeds and fertilizer increased the need for labour. More need for
15
labour is beneficial for rural areas in view of rural migration and for young and landless people in need of employment.
4.5 Connection between studies and relevance for this thesis The connection between the articles mentioned above are that they all revolve around how fertilizers and improved seeds contribute to economic growth. The articles all mention that techniques, such as improved seeds and fertilizers, have the ability to improve yields and thereby enable farmers to improve their economic situation. But the articles also state that adoption of new technologies alone is not enough to improve economic growth. The importance of sufficient information about how to apply fertilizers is mentioned as an essential condition for economic growth. The guidance from extension- and research programs to develop technologies fitted for different areas were also mentioned as important factors to consider. Firstly the literature review gave guidance for the empirical data collection as it provided an insight into what positive effects that could be expected from using fertilizers and improved seeds. Secondly the restraints for successful adoption of these inputs were addressed. When collecting the empirical data economic questions regarding how fertilizers and improved seeds actually made a difference in farmers’ everyday life were asked. Information about how farmers got information regarding various farming techniques was also collected. This thesis complements previous studies within the area by looking at how much maize and beans adopters/ non-adopters of improved seeds and fertilizers are able to sell.
16
5 Empirical Data
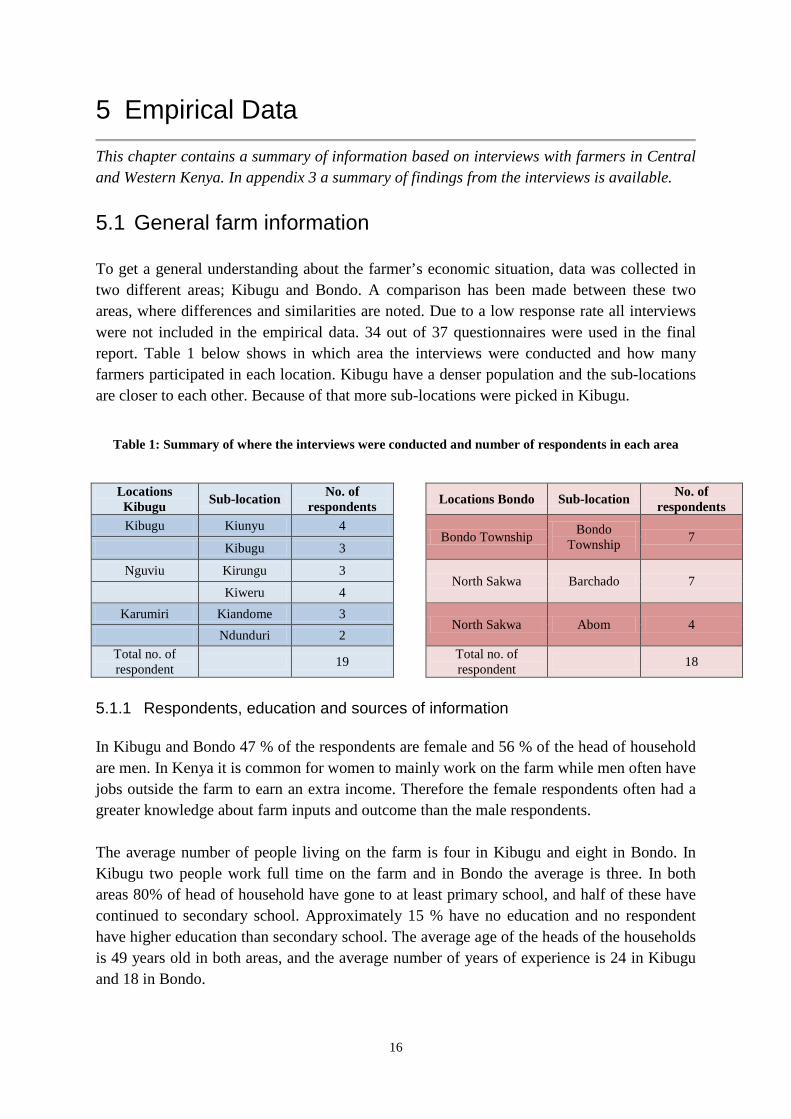
This chapter contains a summary of information based on interviews with farmers in Central and Western Kenya. In appendix 3 a summary of findings from the interviews is available. 5.1 General farm information To get a general understanding about the farmer’s economic situation, data was collected in two different areas; Kibugu and Bondo. A comparison has been made between these two areas, where differences and similarities are noted. Due to a low response rate all interviews were not included in the empirical data. 34 out of 37 questionnaires were used in the final report. Table 1 below shows in which area the interviews were conducted and how many farmers participated in each location. Kibugu have a denser population and the sub-locations are closer to each other. Because of that more sub-locations were picked in Kibugu.
Table 1: Summary of where the interviews were conducted and number of respondents in each area
Locations Kibugu Sub-location No. of
respondents
Locations Bondo Sub-location No. of respondents
Kibugu Kiunyu 4 Bondo Township Bondo
Township 7 Kibugu 3
Nguviu Kirungu 3
North Sakwa Barchado 7 Kiweru 4
Karumiri Kiandome 3 North Sakwa Abom 4
Ndunduri 2 Total no. of
respondent 19
Total no. of respondent 18
5.1.1 Respondents, education and sources of information In Kibugu and Bondo 47 % of the respondents are female and 56 % of the head of household are men. In Kenya it is common for women to mainly work on the farm while men often have jobs outside the farm to earn an extra income. Therefore the female respondents often had a greater knowledge about farm inputs and outcome than the male respondents. The average number of people living on the farm is four in Kibugu and eight in Bondo. In Kibugu two people work full time on the farm and in Bondo the average is three. In both areas 80% of head of household have gone to at least primary school, and half of these have continued to secondary school. Approximately 15 % have no education and no respondent have higher education than secondary school. The average age of the heads of the households is 49 years old in both areas, and the average number of years of experience is 24 in Kibugu and 18 in Bondo.
17
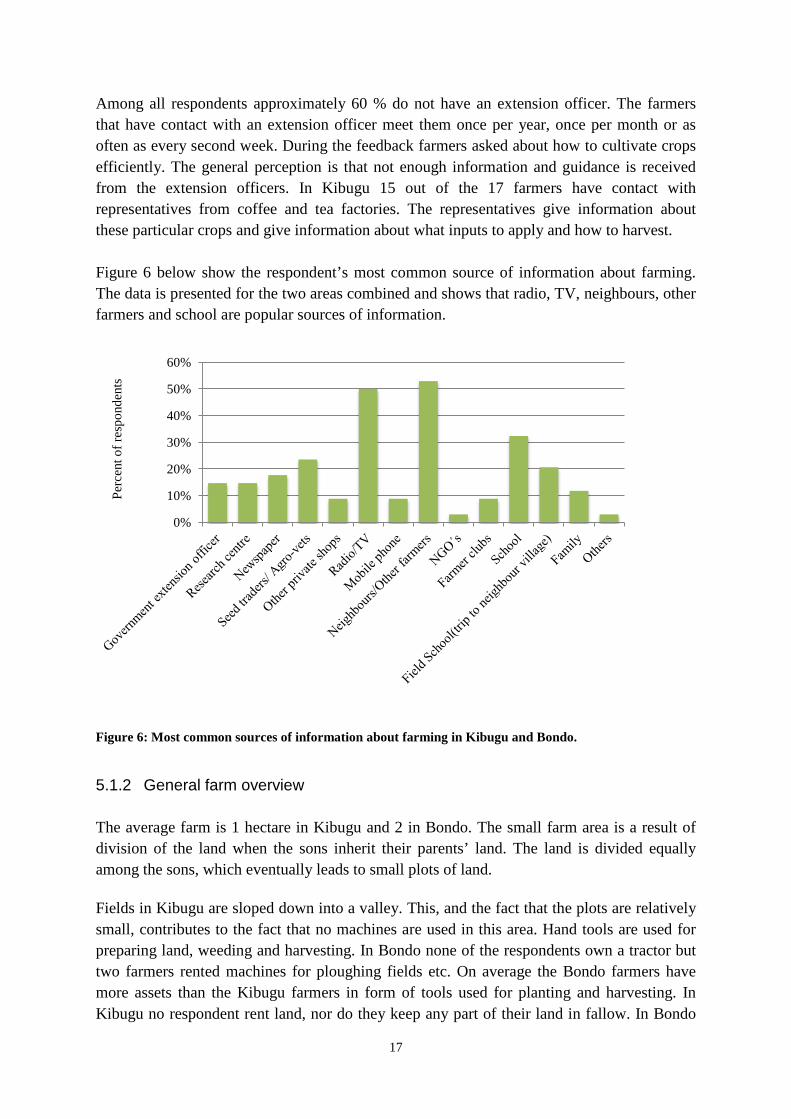
Among all respondents approximately 60 % do not have an extension officer. The farmers that have contact with an extension officer meet them once per year, once per month or as often as every second week. During the feedback farmers asked about how to cultivate crops efficiently. The general perception is that not enough information and guidance is received from the extension officers. In Kibugu 15 out of the 17 farmers have contact with representatives from coffee and tea factories. The representatives give information about these particular crops and give information about what inputs to apply and how to harvest. Figure 6 below show the respondent’s most common source of information about farming. The data is presented for the two areas combined and shows that radio, TV, neighbours, other farmers and school are popular sources of information.
Figure 6: Most common sources of information about farming in Kibugu and Bondo.
5.1.2 General farm overview The average farm is 1 hectare in Kibugu and 2 in Bondo. The small farm area is a result of division of the land when the sons inherit their parents’ land. The land is divided equally among the sons, which eventually leads to small plots of land. Fields in Kibugu are sloped down into a valley. This, and the fact that the plots are relatively small, contributes to the fact that no machines are used in this area. Hand tools are used for preparing land, weeding and harvesting. In Bondo none of the respondents own a tractor but two farmers rented machines for ploughing fields etc. On average the Bondo farmers have more assets than the Kibugu farmers in form of tools used for planting and harvesting. In Kibugu no respondent rent land, nor do they keep any part of their land in fallow. In Bondo
0%
10%
20%
30%
40%
50%
60%
Perc
ent o
f res
pond
ents

18
60% 19%
21%
Bondo Income from mazie and beans
Income from other crops
Income from animal production
11%
78%
11%
Kibugu
almost 50 % of the farmers rent land and the average cost for this is 11 614 KSH/hectare/year. In Bondo 41 % of the farmers keep parts of their land in fallow. Although farms are bigger in Bondo, fewer farmers hire labour in Bondo than in Kibugu. Approximately 70 % of the Bondo farmers hire labour, while this number is close to 90% in Kibugu. In Kibugu all farmers produce at least one kind of cash crop such as tea, coffee and sugarcane. In addition to cash crops, maize, beans and bananas are commonly grown in this area. Macadamia and avocado are also common and a majority of these crops are sold. In Bondo no respondent cultivate cash crops and basic food crops like millet, cassava and potatoes, in addition to maize and beans, dominate the fields. The most common fruit tree in Bondo is mango, avocado and papaya but sale of fruit from trees are not as common in Bondo as in Kibugu. Intercropping is a common planting method and maize and beans are often grown together. All respondents have mixed production i.e. both livestock and crop production. Animals are kept on the farm in order to produce meat and milk, and are also an important source of manure. Cattle and poultry are the most commonly kept animals in both areas. More farmers in Kibugu than in Bondo buy extra feed and minerals for their livestock and a larger percentage of the farmers keep animals on the farm. Fewer farmers in Bondo than in Kibugu have livestock, but those who do generally keep more animals on the farm. 5.1.3 Farm economy The Kibugu farmers sell cash crops to the nearby factories and this is their biggest source of income. Figure 7 below is a summary of farmer’s income generating activities in Kibugu and Bondo. The figure shows how much each income-driven activity contributes to the overall household income. In Bondo the main farm income comes from selling maize and beans followed by income from animal production and other crops.
Figure 7: Income generating activities, % of total income, KSH.
19
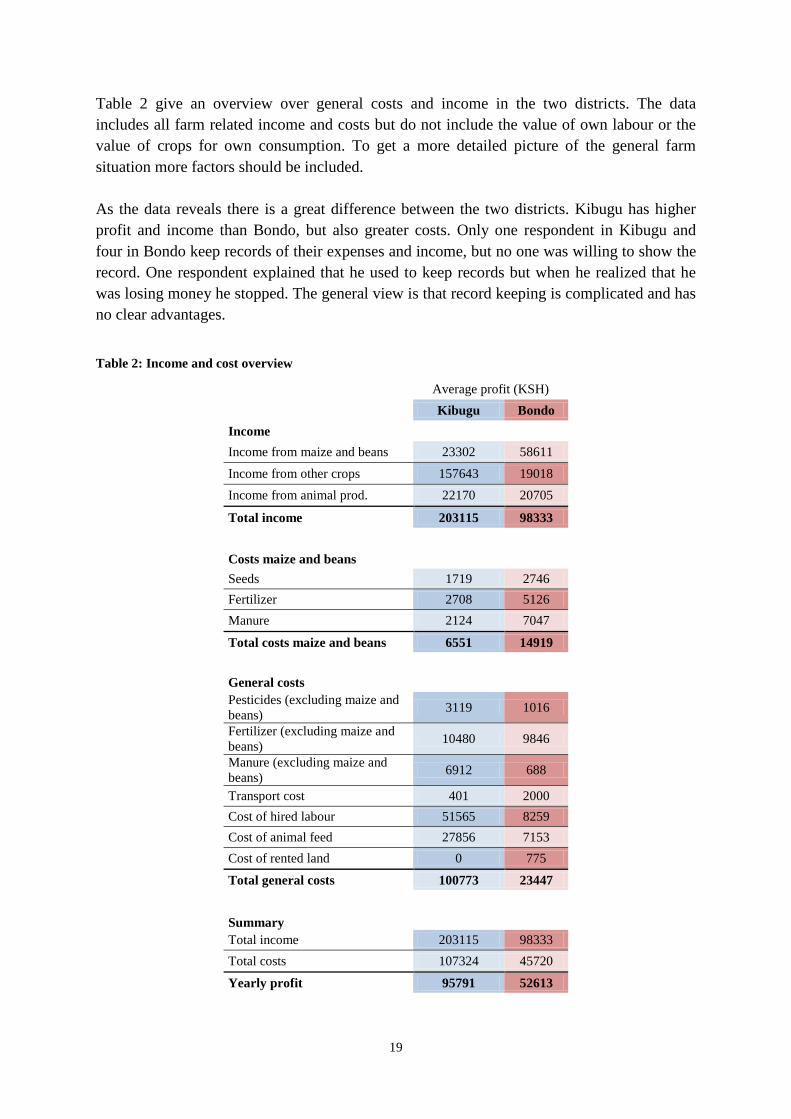
Table 2 give an overview over general costs and income in the two districts. The data includes all farm related income and costs but do not include the value of own labour or the value of crops for own consumption. To get a more detailed picture of the general farm situation more factors should be included. As the data reveals there is a great difference between the two districts. Kibugu has higher profit and income than Bondo, but also greater costs. Only one respondent in Kibugu and four in Bondo keep records of their expenses and income, but no one was willing to show the record. One respondent explained that he used to keep records but when he realized that he was losing money he stopped. The general view is that record keeping is complicated and has no clear advantages.
Table 2: Income and cost overview
Average profit (KSH) Kibugu Bondo Income Income from maize and beans 23302 58611 Income from other crops 157643 19018 Income from animal prod. 22170 20705
Total income 203115 98333
Costs maize and beans Seeds 1719 2746 Fertilizer 2708 5126 Manure 2124 7047
Total costs maize and beans 6551 14919
General costs Pesticides (excluding maize and beans) 3119 1016
Fertilizer (excluding maize and beans) 10480 9846
Manure (excluding maize and beans) 6912 688
Transport cost 401 2000 Cost of hired labour 51565 8259 Cost of animal feed 27856 7153 Cost of rented land 0 775
Total general costs 100773 23447
Summary Total income 203115 98333
Total costs 107324 45720
Yearly profit 95791 52613
20
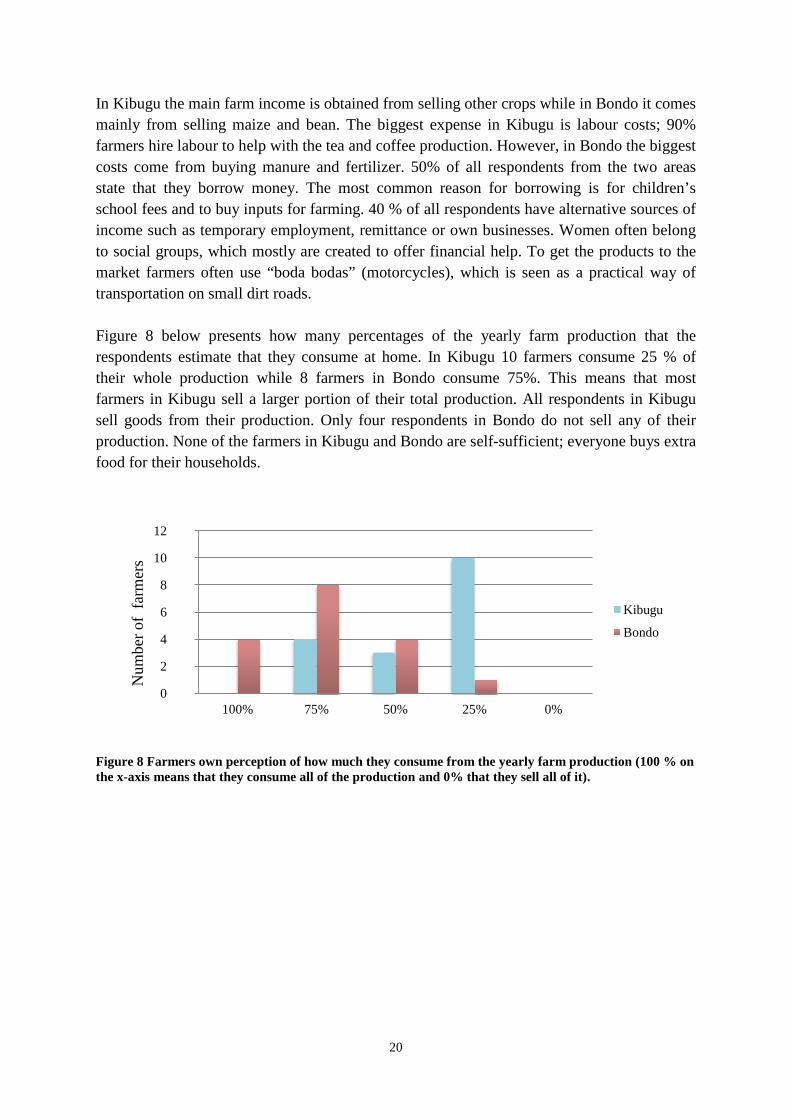
In Kibugu the main farm income is obtained from selling other crops while in Bondo it comes mainly from selling maize and bean. The biggest expense in Kibugu is labour costs; 90% farmers hire labour to help with the tea and coffee production. However, in Bondo the biggest costs come from buying manure and fertilizer. 50% of all respondents from the two areas state that they borrow money. The most common reason for borrowing is for children’s school fees and to buy inputs for farming. 40 % of all respondents have alternative sources of income such as temporary employment, remittance or own businesses. Women often belong to social groups, which mostly are created to offer financial help. To get the products to the market farmers often use “boda bodas” (motorcycles), which is seen as a practical way of transportation on small dirt roads. Figure 8 below presents how many percentages of the yearly farm production that the respondents estimate that they consume at home. In Kibugu 10 farmers consume 25 % of their whole production while 8 farmers in Bondo consume 75%. This means that most farmers in Kibugu sell a larger portion of their total production. All respondents in Kibugu sell goods from their production. Only four respondents in Bondo do not sell any of their production. None of the farmers in Kibugu and Bondo are self-sufficient; everyone buys extra food for their households.
Figure 8 Farmers own perception of how much they consume from the yearly farm production (100 % on the x-axis means that they consume all of the production and 0% that they sell all of it).
0
2
4
6
8
10
12
100% 75% 50% 25% 0%
Num
ber o
f fa
rmer
s
Kibugu
Bondo
21
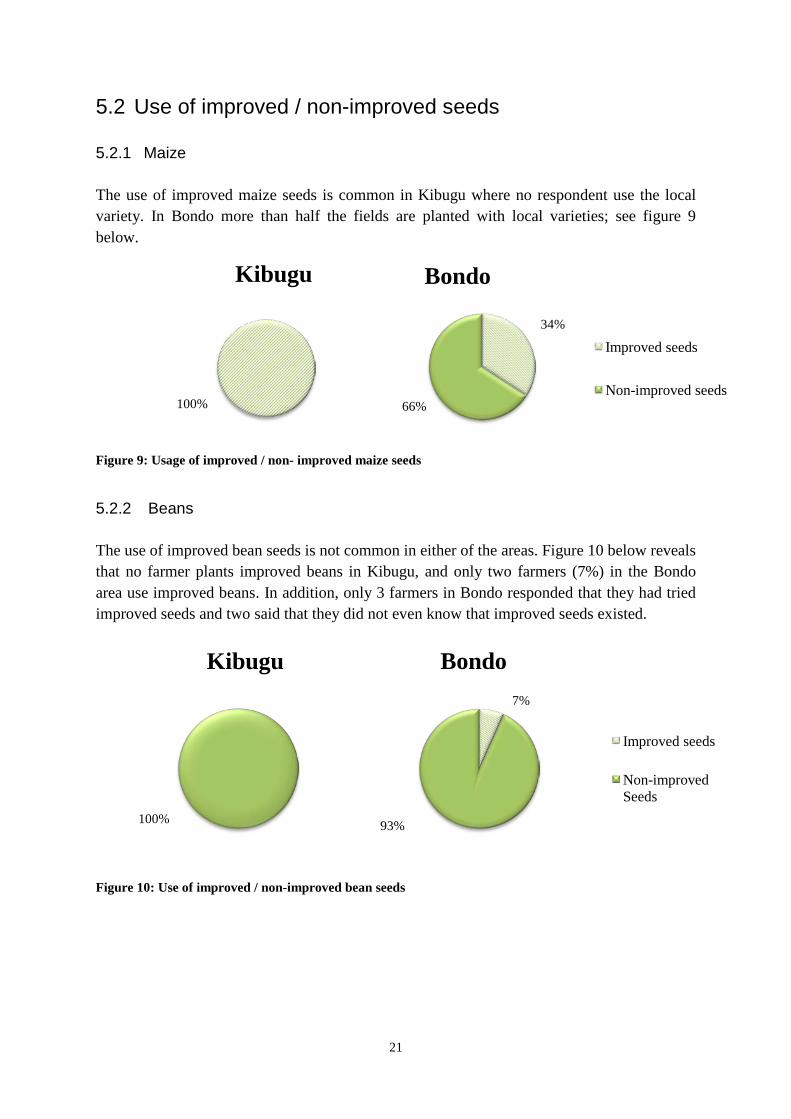
5.2 Use of improved / non-improved seeds 5.2.1 Maize The use of improved maize seeds is common in Kibugu where no respondent use the local variety. In Bondo more than half the fields are planted with local varieties; see figure 9 below.
Figure 9: Usage of improved / non- improved maize seeds
5.2.2 Beans The use of improved bean seeds is not common in either of the areas. Figure 10 below reveals that no farmer plants improved beans in Kibugu, and only two farmers (7%) in the Bondo area use improved beans. In addition, only 3 farmers in Bondo responded that they had tried improved seeds and two said that they did not even know that improved seeds existed.
Figure 10: Use of improved / non-improved bean seeds
100%
Kibugu
100%
Kibugu 7%
93%
Bondo
Improved seeds
Non-improved Seeds
34%
66%
Bondo
Improved seeds
Non-improved seeds

22
5.2.3 Reason for using / not using improved seeds The general reasons for not using improved seeds (both maize and beans), are the high costs involved. Another common answer was that the local variety does just as good, sometimes even better, than improved varieties. Weather conditions and the amount of precipitation in the area play a great part, when it comes to which yield quality different kinds of seeds produce. 25% of the farmers said that the reason for not trying to grow improved seeds was traditionally bonded. If no one in the family or extended family had tried the seeds the farmer was more reluctant to try it him/herself. In Kibugu respondents have not tried the local maize variety at all, or tried it a long time ago. The general perception in Kibugu is that the local variety does not do as well as improved maize seeds. The most common reason for not using improved maize seeds in Bondo are that the seeds need a fair amount of rain to give a good yield. The farmers said that when there is a drought, the local variety does well, while the improved seeds do not produce anything at all. 5.3 Use of fertilizers on maize and bean fields Figure 11 shows that 69% of the studied maize and bean fields in Kibugu are planted with some type of input (fertilizer, manure or both of these inputs). In Bondo 41 % of the fields are planted without any inputs at all.
Figure 11: Usage of different input combinations, %, on maize and bean fields in Kibugu and Bondo
31%
17% 10%
42%
Kibugu
41%
9% 25%
25%
Bondo
No inputs
Fertilizer
Manure
Fertilizer + Manure

23
5.3.1 Reasons for using/not using fertilizers A majority of the farmers see a big positive difference in crop production when using fertilizers. The biggest reason for not using fertilizers is insufficient funds to buy it. Five farmers responded that when there is not enough irrigation for the crops it is bad to use fertilizers; hence they do not use it. Respondents mentioned that when using fertilizer during a drought crops “burn”, which leaves nothing to harvest. Another reason for not using fertilizers was that if fertilizer is used once, the soil needs this input the coming years also to maintain good yields. 5.4 Yield produced, kg/hectare 5.4.1 Improved maize Figure 12 shows the yearly mean yield per hectare for improved maize seeds with different input combinations. None of the farmers in Kibugu and Bondo use improved maize seeds without adding fertilizer or manure. The highest yield, with a mean of 1387 kg/hectare, was obtained in Kibugu when only fertilizer was used. This result differs from Bondo, where improved seeds combined with manure produced the highest yield, i.e. 1255 kg/hectare.
Figure 12: Average yield, kg/ha, for improved maize in Kibugu and Bondo, with different input combinations. Standard deviation is shown within brackets.
5.4.2 Non-improved maize No farmer in Kibugu is using non-improved maize seeds while in Bondo all combinations of inputs for non-improved maize seeds are represented. As figure 13 reveals, the highest yield for non-improved seeds is 1156 kg/ha, which was obtained when fertilizer and manure was added. The lowest yield, 222 kg/ha, was obtained when only fertilizer was added.
N/A 1387
(1145) 334 (0)
866 (647) N/A
1063 (798)
1255 (223)
1153 (367)
0 200 400 600 800
1000 1200 1400 1600
No input Fertilizer Manure Fertilizer + Manure
Aver
age
yiel
d, k
g/ha
Kibugu
Bondo
24
1137 (878)
222 (0)
903 (518)
1156 (1694)
0
200
400
600
800
1000
1200
1400
No input Fertilizer Manure Fertilizer + Manure
Bondo
272 (214)
165 (47)
460 (152)
264 (269)
240 (448) N/A
368 (137)
371 (170)
0
50
100
150
200
250
300
350
400
450
500
No input Fertilizer Manure Fertilizer + Manure
Kibugu
Bondo
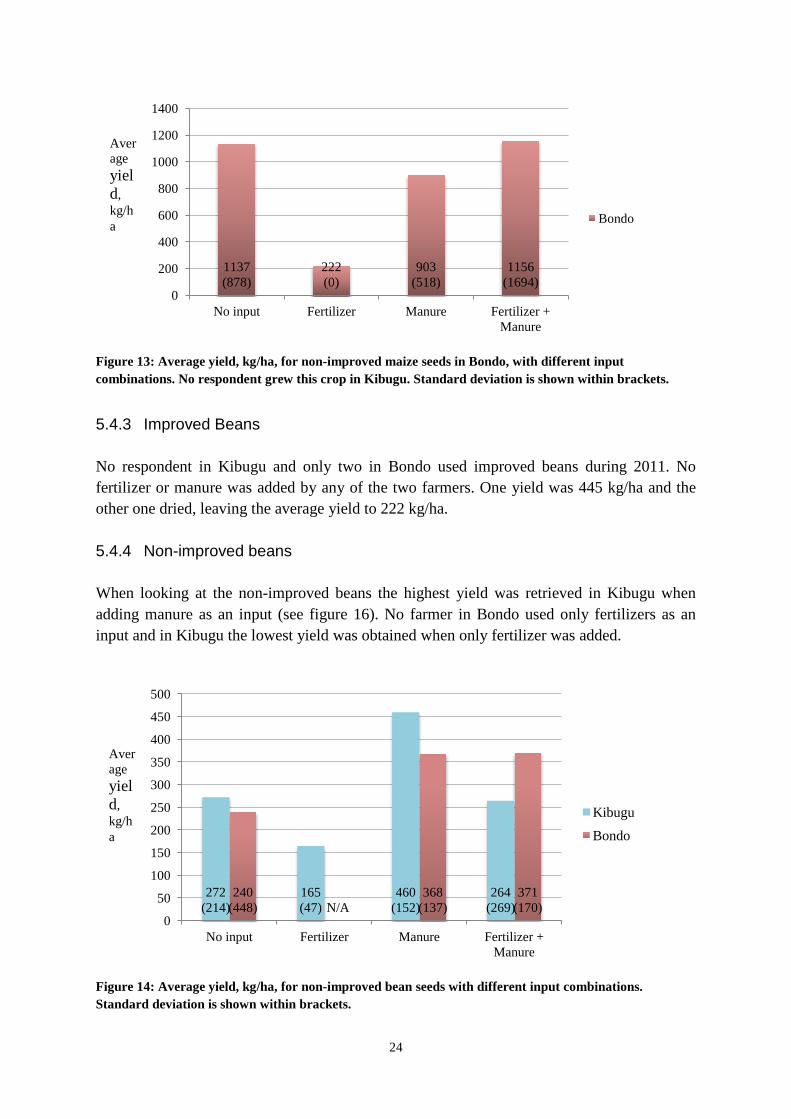
Figure 13: Average yield, kg/ha, for non-improved maize seeds in Bondo, with different input combinations. No respondent grew this crop in Kibugu. Standard deviation is shown within brackets.
5.4.3 Improved Beans No respondent in Kibugu and only two in Bondo used improved beans during 2011. No fertilizer or manure was added by any of the two farmers. One yield was 445 kg/ha and the other one dried, leaving the average yield to 222 kg/ha. 5.4.4 Non-improved beans When looking at the non-improved beans the highest yield was retrieved in Kibugu when adding manure as an input (see figure 16). No farmer in Bondo used only fertilizers as an input and in Kibugu the lowest yield was obtained when only fertilizer was added.
Figure 14: Average yield, kg/ha, for non-improved bean seeds with different input combinations. Standard deviation is shown within brackets.
Average yield, kg/ha
Average yield, kg/ha

25
5.5 Yield sold Table 3 show how many percentages of the total yield produced in each area that has been sold. The table reveals that more farmers in Bondo sell maize and beans, than the Kibugu farmers do. Of the total amount of produced maize and beans the Bondo farmers also sell a larger part of the yield. The selling price in Kibugu is 45 KSH/kg for maize and 90 KSH/kg for beans. The prices in Bondo are 30 KSH/kg for maize and 60 KSH/kg for beans.
Table 3: Percentage of the total yield from each input combination in each area that has been sold during the year.
% Sold Kibugu % Sold Bondo Improved maize No input N/A N/A Fertilizer 6 49 Manure 0 67 Fertilizer + Manure 8 20
Non-Improved maize No input N/A 11 Fertilizer N/A 0 Manure N/A 14 Fertilizer + Manure N/A 55
Improved beans No input N/A 67 Fertilizer N/A N/A Manure N/A N/A Fertilizer + Manure N/A N/A
Non-improved beans No input 21 17 Fertilizer 0 N/A Manure 0 26 Fertilizer + Manure 0 70

26
5.6 Sources of error A majority of the farmers interviewed do not keep any records of expenses and incomes. Of those who do, no one wanted to show them. Therefore all data about farmers’ costs and incomes are based on the respondents’ memory and makes the collected data less than 100% accurate. All questions in the questionnaire regard the last year (2011), to make it easier for the farmers to remember costs and income as vividly as possible. The interpreters are also sources of error since information may have been lost in translation. Due to that the nature of the questions are private (regarding personal farm economy), there is a risk that respondents highlight of conceal information about their income and property. This contributes to that the information could be bias. Since the farmers sporadically consume part of the production before crops are ripe, it is difficult to fully assess how big the total harvest was. Farmers could estimate the maize yield but since some of the cobs were eaten before they were fully mature it was difficult to estimate the final yield. These limitations must be taken into account when analysing the data. In view of the above sources of error, the study is nevertheless considered to be of good credibility.
27
60% 19%
21%
Bondo Income from mazie and beans
Income from other crops
Income from animal production
11%
78%
11%
Kibugu
6 Analysis and discussion
In this chapter the questions formulated in chapter 1 are answered by analysing the empirical data and by bringing this information into a discussion in relation to the literature review.
6.1 How do smallholder farmers in Kibugu and Bondo generate income?
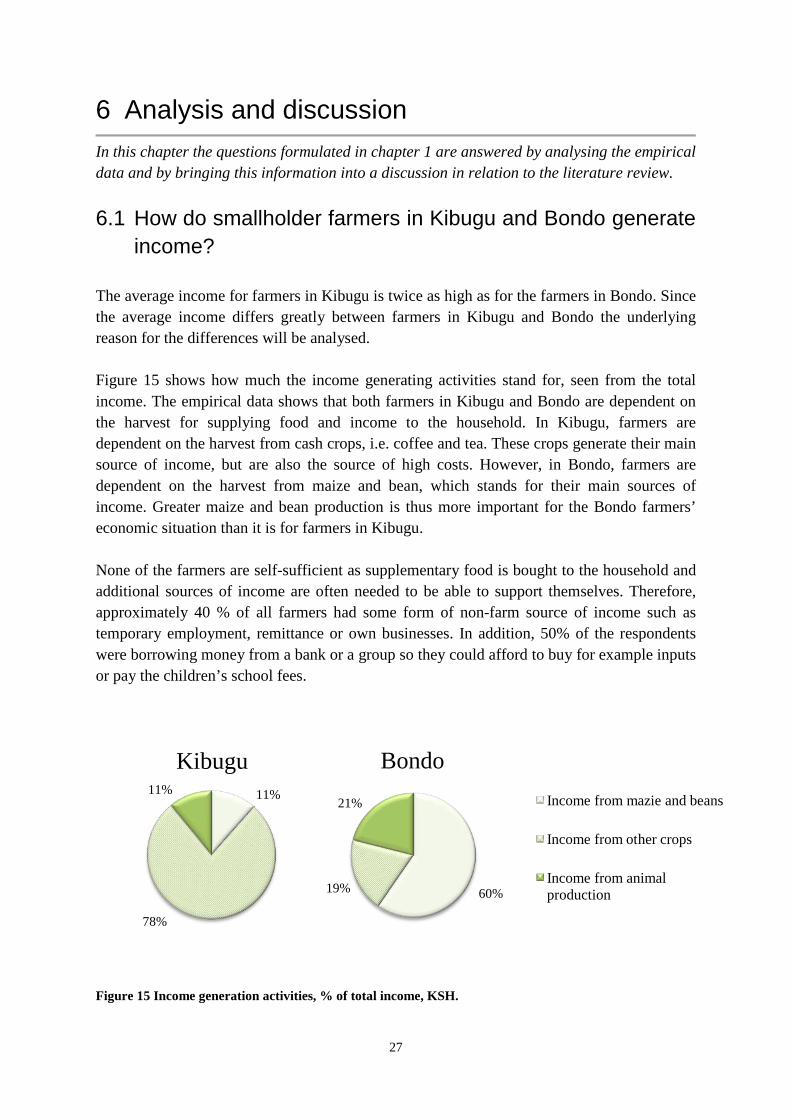
The average income for farmers in Kibugu is twice as high as for the farmers in Bondo. Since the average income differs greatly between farmers in Kibugu and Bondo the underlying reason for the differences will be analysed. Figure 15 shows how much the income generating activities stand for, seen from the total income. The empirical data shows that both farmers in Kibugu and Bondo are dependent on the harvest for supplying food and income to the household. In Kibugu, farmers are dependent on the harvest from cash crops, i.e. coffee and tea. These crops generate their main source of income, but are also the source of high costs. However, in Bondo, farmers are dependent on the harvest from maize and bean, which stands for their main sources of income. Greater maize and bean production is thus more important for the Bondo farmers’ economic situation than it is for farmers in Kibugu. None of the farmers are self-sufficient as supplementary food is bought to the household and additional sources of income are often needed to be able to support themselves. Therefore, approximately 40 % of all farmers had some form of non-farm source of income such as temporary employment, remittance or own businesses. In addition, 50% of the respondents were borrowing money from a bank or a group so they could afford to buy for example inputs or pay the children’s school fees.
Figure 15 Income generation activities, % of total income, KSH.
28
The empirical data shows that Bondo farmers generate a greater overall surplus, to sell from the maize and bean production, than Kibugu farmers do (see table 2 on page 20). In Kibugu the land constraint limits large cultivation plots with maize and beans. Since cash crops like tea and coffee are more profitable it is more economically efficient for the farmers to invest in cultivation of these plants, than it is to grow less profitable crops like maize and beans. Overall, farmers in Kibugu sell more of their total output than farmers in Bondo do (see table 2). But in terms of maize and beans production the farmers in Bondo sell a larger percentage of the production (see table 3). 6.2 How does use of fertilizers and improved seeds contribute
to the income generation and economic situation for smallholder farmers in Kibugu and Bondo?
6.2.1 Yield impact Since no farmer in Kibugu grew non-improved maize the analysis of the impact of improved maize seeds will be made from the yields in Bondo. The empirical data only shows a small yield difference between improved- and non-improved maize when applying a combination of fertilizer and manure (see Figure 16). The use of fertilizer and manure separately does however make a greater yield difference between improved and non-improved maize (see figure 16). When using improved maize with manure or fertilizer the yield is much higher than if these inputs were applied to non-improved maize fields. The use of non-improved maize without inputs gave almost as high yield as when fertilizer and manure were applied. In Figure 12 and 13 the standard deviation of the data is high which means that the produced yields differ a lot within the areas. The use of improved beans was only adopted by two farmers and the yield was comparable to when no inputs had been added with non-improved beans (see figure 17). Hence, the improved beans did not show an increased yield compared to non-improved bean seeds. This data is based on two observations only and can therefore not be considered as a general result. When looking at figure 16 it is clear that improved maize seeds used along with fertilizer exceed the yield from when non-improved seeds have been used with the same input. But when comparing the results from using improved maize seeds with fertilizer, manure or both of these inputs the data does not show a clear connection. The result from the empirical data does not correlate completely with the literature review. According to the ECA-SA survey (year unknown) the highest yield should be generated when improved seeds are used along with fertilizes. Since no farmer grew improved bean seeds along with fertilizer, analysis of the impact of improved seeds and fertilizer will only be made in the cultivation on maize. The results from this survey show that the outcome from using fertilizers and improved seeds does not always exceed the yield from non-improved seeds. It also shows that there is not always a clear advantage with using fertilizers.
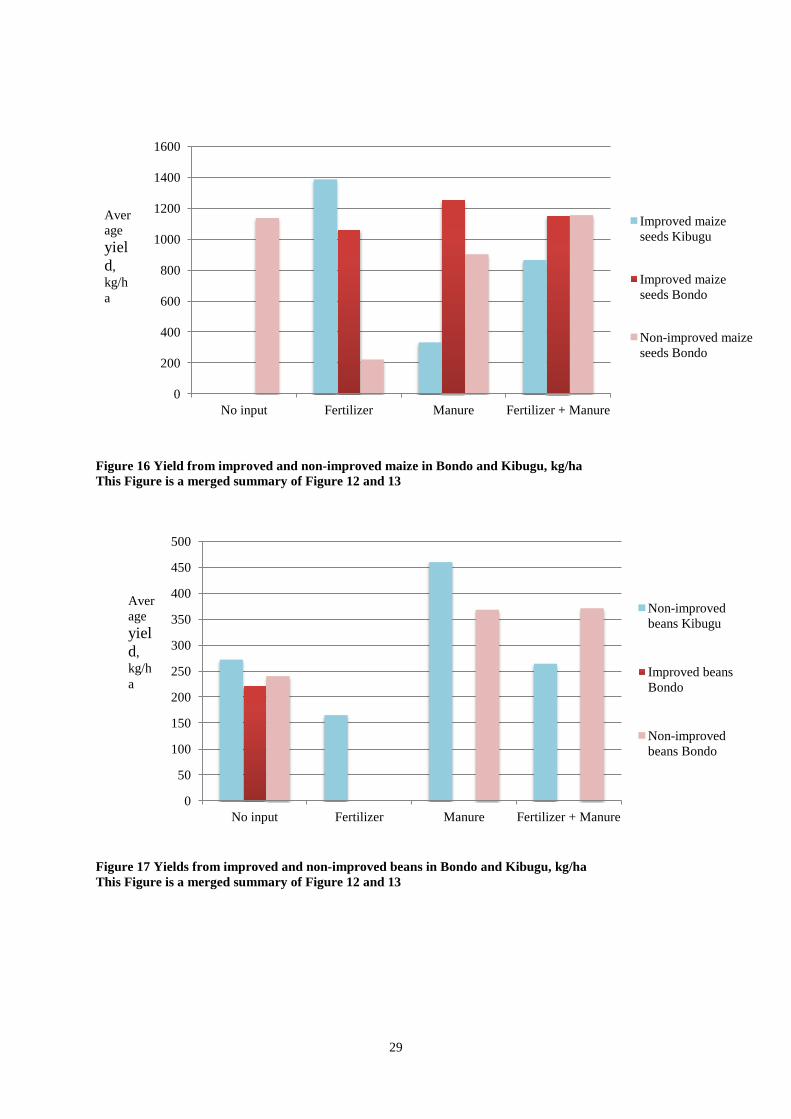
29
0
200
400
600
800
1000
1200
1400
1600
No input Fertilizer Manure Fertilizer + Manure
Improved maize seeds Kibugu
Improved maize seeds Bondo
Non-improved maize seeds Bondo
0
50
100
150
200
250
300
350
400
450
500
No input Fertilizer Manure Fertilizer + Manure
Non-improved beans Kibugu
Improved beans Bondo
Non-improved beans Bondo
Figure 16 Yield from improved and non-improved maize in Bondo and Kibugu, kg/ha This Figure is a merged summary of Figure 12 and 13
Figure 17 Yields from improved and non-improved beans in Bondo and Kibugu, kg/ha This Figure is a merged summary of Figure 12 and 13
Average yield, kg/ha
Average yield, kg/ha
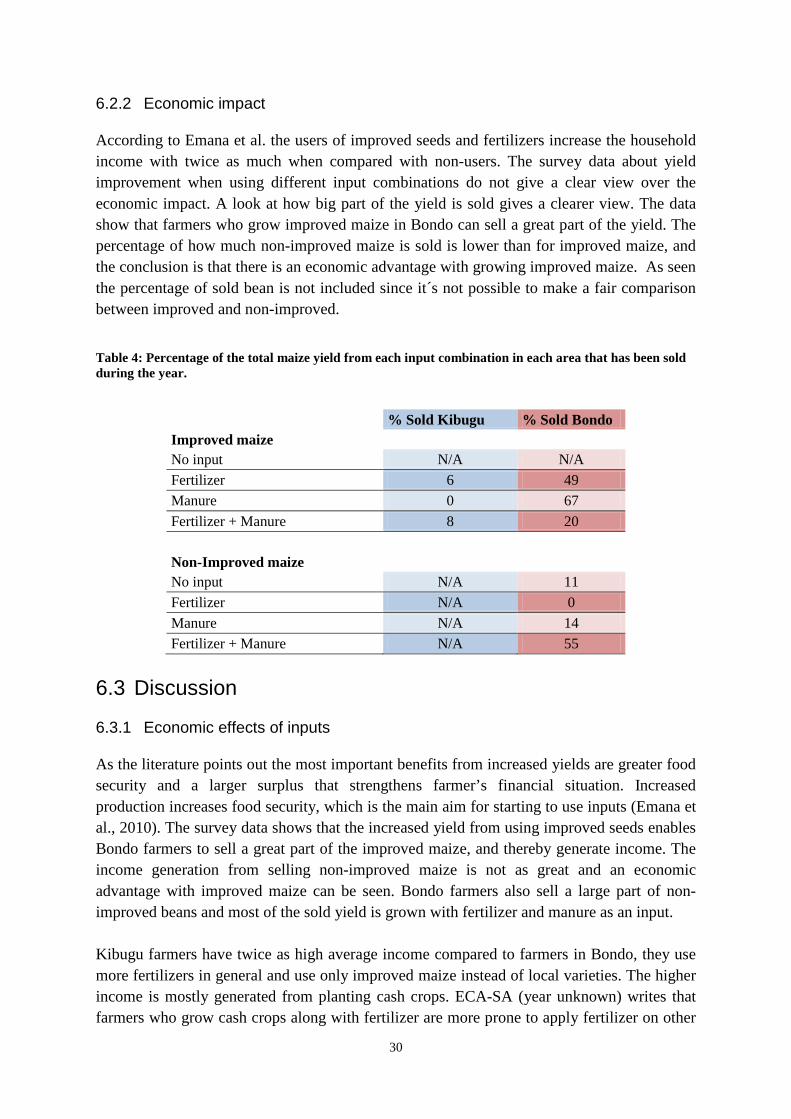
30
6.2.2 Economic impact According to Emana et al. the users of improved seeds and fertilizers increase the household income with twice as much when compared with non-users. The survey data about yield improvement when using different input combinations do not give a clear view over the economic impact. A look at how big part of the yield is sold gives a clearer view. The data show that farmers who grow improved maize in Bondo can sell a great part of the yield. The percentage of how much non-improved maize is sold is lower than for improved maize, and the conclusion is that there is an economic advantage with growing improved maize. As seen the percentage of sold bean is not included since it´s not possible to make a fair comparison between improved and non-improved.
Table 4: Percentage of the total maize yield from each input combination in each area that has been sold during the year.
% Sold Kibugu % Sold Bondo Improved maize No input N/A N/A Fertilizer 6 49 Manure 0 67 Fertilizer + Manure 8 20
Non-Improved maize No input N/A 11 Fertilizer N/A 0 Manure N/A 14 Fertilizer + Manure N/A 55
6.3 Discussion 6.3.1 Economic effects of inputs As the literature points out the most important benefits from increased yields are greater food security and a larger surplus that strengthens farmer’s financial situation. Increased production increases food security, which is the main aim for starting to use inputs (Emana et al., 2010). The survey data shows that the increased yield from using improved seeds enables Bondo farmers to sell a great part of the improved maize, and thereby generate income. The income generation from selling non-improved maize is not as great and an economic advantage with improved maize can be seen. Bondo farmers also sell a large part of non-improved beans and most of the sold yield is grown with fertilizer and manure as an input. Kibugu farmers have twice as high average income compared to farmers in Bondo, they use more fertilizers in general and use only improved maize instead of local varieties. The higher income is mostly generated from planting cash crops. ECA-SA (year unknown) writes that farmers who grow cash crops along with fertilizer are more prone to apply fertilizer on other
31
crops too. The reason for this is because cash crops results in a good financial status, as the farmers can sell more crops. As the empirical data shows, all farmers in Kibugu grow at least one kind of cash crop and are more likely to apply fertilizer in their cultivation of maize and beans. Their willingness to apply fertilizer on other crops than their cash crops might be due to that they generate a high income from their cash crops. The small farm size in Kibugu was not a problem to create income in the sense Smale et al. describes it. The surplus from maize and beans was relatively small, but financially it was not a problem since cash crops generate sufficient income. Kibugu farmers are not as dependent on maize and beans for generating income as Bondo farmers are. Because the two areas have different conditions for farming, fertilizers and improved seeds generate diverse effects. A greater yield in Bondo enables farmers to generate more income and the economic effect of this is greater since maize and beans is the major source of income. The empirical data show a connection with the Karanja et al. (2003) article; different techniques do not have the same economic effect in all areas. Although farms are larger in Bondo, 20% more farmers in Kibugu than in Bondo hire labour. According to Emana et al. the need for workers increases with the use of new technology. This statement could have been confirmed since twice as many maize and bean fields in Kibugu, compared to Bondo, are planted with fertilizer (see Figure 13 page 23). However, according to the empirical data the farmers employ people for picking tea and coffee and the increased workforce is not due to the use of improved seeds and fertilizer. Usage of improved seeds and fertilizers mean that yields have more potential to increase. Emana et al., (2010) show that increased yields cause farmers’ income to increase and thereby the farmers economic situation is improved. But use of fertilizer and improved seeds do not necessarily improve the farmer’s economic situation. In general farmers in Kibugu have a higher yearly profit than farmers in Bondo (see table 2) and thereby more money to invest. But even if farmers in Kibugu had higher income, they also had higher costs. Both the increased income and higher costs are a result of using new technologies. Since the use of improved seeds and fertilizers mean increased costs, an increased yield is necessary for the investments to pay off. The paper from ECA-SA (year unknown) show that fertilizer is often used more in the cultivation of maize since the effect of using fertilizer sometimes is higher for maize than for other crops. As Smale et al., 2011 claims, the use of fertilizers does not necessarily correlate with the use of improved seeds. Improved maize is often grown without fertilizers and is not dependent on inputs to grow. For the cultivation of improved maize seeds in both areas, the empirical data does however show that all farmers grow improved maize with additional inputs. This shows that the use of improved maize seeds in these areas increase the use of fertilizers and manure.
32
6.3.2 Importance of information The use of fertilizers and improved seeds do not necessarily increase yields. According to Emana et al. (2010) and Smale et al. (2011) farmers cannot always afford to buy the recommended amount of fertilizers, and the full effect of this input is not utilized. The empirical data also strongly points in this direction since the main reasons for not buying improved seeds are financial constraints. More information about the benefits from using different inputs can help the adoption of new technologies. Both these articles also points out that only with knowledge about how to apply fertilizers correctly the yields can increase. When fertilizer usage is mismanaged there is a greater risk for problems like poor soils and degraded land. In addition, according to Emana et al. lack of knowledge on how to apply fertilizer properly can poison humans, wildlife and livestock. The use of fertilizers and improved seeds need additional production practices to maintain high yields (Smale et al., 2011). The importance of information is pointed out by the respondents as well. Many farmers did not have regular contact with extension officers although the need for guidance about farming was great. As the empirical data shows, 40 % of the farmers in Kibugu and Bondo say that they are in contact with an extension officer, but they are not completely satisfied with the service. Farmers who grew tea and coffee in Kibugu got guidance from factory representatives about how to grow these crops and what inputs to use. The result was good management and large profits from these crops. When feedback was presented farmers asked about information on how to plant in order to achieve good yield, and this clearly shows the need for guidance. Lack of information about how to grow staple crops like maize and beans efficiently contributes to food insecurity and that farmers’ economy does not improve. If information from extension officers would reach farmers as efficiently as it does from private actors, the result would be greater food security and hopefully a more sustainable usage of inputs like fertilizers and improved seeds. Just like Smale et al. (2011) point out, it is necessary to provide more support from extension systems to achieve higher yields and thereby increase the economic level. Karanja et al. (2003) states that the economic impact is greater in high potential regions, and that technological improvement, research and efforts in these areas would make a bigger difference than in marginal regions. From this thesis it is evident that technology and information investments made in Bondo would have a greater impact on farm economy than if these efforts were made in Kibugu. The reason for this is that the Kibugu farmers already have cash crops as a big source of income, while Bondo farmers is more dependent on maize and beans to create an income. Welfare effects and economic impact of different cultivation technologies is thus not only a question of high potential/marginal areas, but is also a question about what resources and systems that are already in place in the area.
33
6.3.3 Conditions for future economic growth Although farmers in Kenya have good growing conditions and improved seeds and fertilizers help to increase yields, other factors also influence economic growth. According to ECA-SA (year unknown), and Emana et al. (2010) a constraint for applying fertilizers is partly due to difficulties of buying fertilizers. It is hard to get a hold of fertilizers since the market is not fully developed. The empirical data does not show any difficulties for the respondents to be able buy fertilizers on time. If a great surplus is produced the importance of sufficient transportation systems are necessary. Motorcycles are often used for transportation of farmer goods. This vehicle is good for transporting crops to the market and suitable for small dirt roads, but is a relatively expensive mean of transport. Smale et al. (2011) writes that the infrastructure is poor in Africa, and that the lack of sufficient roads and transport systems are a disadvantage for the farmers’ economy. The need for well-functioning large-scale transportation systems is going to increase as crop production increases. To know where new technology and research should be placed it is important to know what inputs are invested today and what the results of these investments are. This is essential information in order to know where to invest research and to know where farmers can benefit from adopting new technologies. Extension officers can play a key role in this development since they have the opportunity to give specific information and can evaluate whether it is worthwhile for a farmer to invest in a particular technology or not. Today many recommendations are regarding bigger areas but as Karanja et al. (2003) points out it is important to give tailored information about cultivation techniques for different areas in order to raise productivity. Political initiatives can thus make a big difference when trying to increase productivity and efficiency. 6.3.4 Future research In order to fully evaluate the economic impact of fertilizers and improved seeds more information and factors like intercropping, soil fertility, amount of rain and other growing conditions needs to be analysed. To ensure a more accurate picture of Kenyan farmers’ economy a bigger sample size is needed. A follow-up survey would be preferable to determine what impact the use of fertilizers and improved seed have over a longer period of time, and to be able to compare the results. A continuous contact with respondents during the year would ensure more accurate details regarding yield size and production methods. The main focus has been on maize and beans and because the time spent on each interview was limited, all farm facts were not collected. In this thesis the value of own labour is not included, neither is the value of all crops produced. These factors are important to get a full picture of the economic situation but were not included in this thesis since this information could not be collected.

34
7 Conclusions
This chapter presents a conclusion found with the help from the research questions. The aim of this study was to evaluate what impact the use of fertilizers and improved seeds have for farmers’ economic situation. According to the literature review there would be a clear yield improvement when using fertilizer and improved seeds. The higher yield would in turn allow farmers to sell a larger part of the production, and consequently improve their economic situation. The results from the study show that the highest yield for improved maize was obtained when planted along with fertilizer in Kibugu. But overall the empirical data only show a small yield difference between improved- and non-improved maize and the data is not consistent. When applying fertilizer on improved maize seeds a yield improvement could be seen. But when also looking at yields where no input had been applied or where a combination of fertilizer and manure was applied, there was not a clear advantage with improved maize seeds. The yield obtained from improved and non-improved maize in Bondo was the same when applying a combination of fertilizer and manure. The same yield is also obtained when using non-improved maize without adding an input. This shows that the results from the empirical data do not correlate completely with the literature review – there is not always a clear advantage with using improved seeds. For improved bean seeds the yield was not higher than with non-improved seeds. Only two farmers grew improved bean seeds so this data is not a good representation for the use of improved bean seeds. A yield improvement can be seen when looking at improved and non-improved maize seeds used with fertilizer; the yield difference is substantially higher when using fertilizer with improved seeds. But the overall data for fertilizer usage is also inconsistent. For example are maize yields in Bondo the same when using a combination of fertilizer and manure as for when applying no inputs at all. All respondents in the researched areas depend on farm production in order to generate income. In Kibugu the average income is twice as high as for the farmers in Bondo and the explanation for this is different main sources of income. In Kibugu farmers have the ability to produce and sell cash crops to generate more income. Bondo farmers sell maize and beans to a larger extent and this income is more important for the income generation. The empirical data shows that a large part of the maize and bean yield in Bondo is sold, and especially a large part of the improved maize is sold. Growing improved maize instead of non-improved makes it more advantageous for farmers in Bondo as a larger part can be sold. Although farmers in both areas produce a surplus to sell, none of the farms are self-sufficient and all need additional sources of income.

35
As a conclusion it is clear that fertilizers and improved seeds do have an impact on farm economy. When yields are higher a surplus can be produced and sold. But as the literature points out, technological improvements like these inputs alone are not enough to increase the economic standard of these households. More knowledge about how to use different techniques is needed to utilize the full effect of the inputs.

36
Bibliography
Literature and publications Ax, C., Johansson, C., Kullvén, H., 2005, Den nya ekonomistyrningen, edition 3:3, Liber AB, Malmö, ISBN 978-91-47-07585-0 CRA, Commission on Revenue Allocation, 2011, Kenya: County fact sheets ECA-SA, Economic Commission for Africa (ECA), year unknown, Southern Africa Office (SRO-SA), Agricultural Input Business Development in Africa: Opportunities, Issues and Challenges Ekholm, M., Fransson, A., Sandström, B., 2002, Praktisk intervjuteknik, ePan, Nordstedt, Stocholm (ISBN 91-7297-566-0) Emana,B., Gebremedhin, H., Regassa, N., 2010, Impacts of improved seeds and agrochemicals on food security and environment in the rift valley of Ethiopia: implications for the application of an African green revolution, Report No. 56, Drylands coordination group Karanja, D., Renkow, M., Crawford, E., 2003, Welfare effects of maize technologies in marginal and high potential regions of Kenya, Agricultural Economics, 2003:29, pp. 331-341 Körner, S., Wahlgren, L., 2002, Praktisk statistik, edition 3:9, Studentlitteratur AB, Lund, ISBN: 987-91-44-01915-4
McMullen, M., Lamey, A., Plant diseases development and management, 2001, North Dakota State University, EB-31 Morris, M., Kelly, V., Kopicki, R., Byerlee, D., 2007, Fertilizer Use in African Agriculture - Lessons Learned and Good Practice Guidelines, The World Bank, Washington, D.C., (ISBN 0-8213-6880-X) Ouma, J, De Groote, H., Owuor, G., 2006, Determinants of Improved Maize Seed and Fertilizer use In Kenya: Policy Implications Smale, M., Byerlee, D., Jayne, T., 2011, Maize Revolutions in Sub-Saharan Africa, Policy Research Working Paper 5659, The World Bank Smale, M., Cohen, J., Nagarajan, L., 2009, Local markets, local varieties – rising food prices and small farmers’ access to seed, IFPRI Issue Brief 59
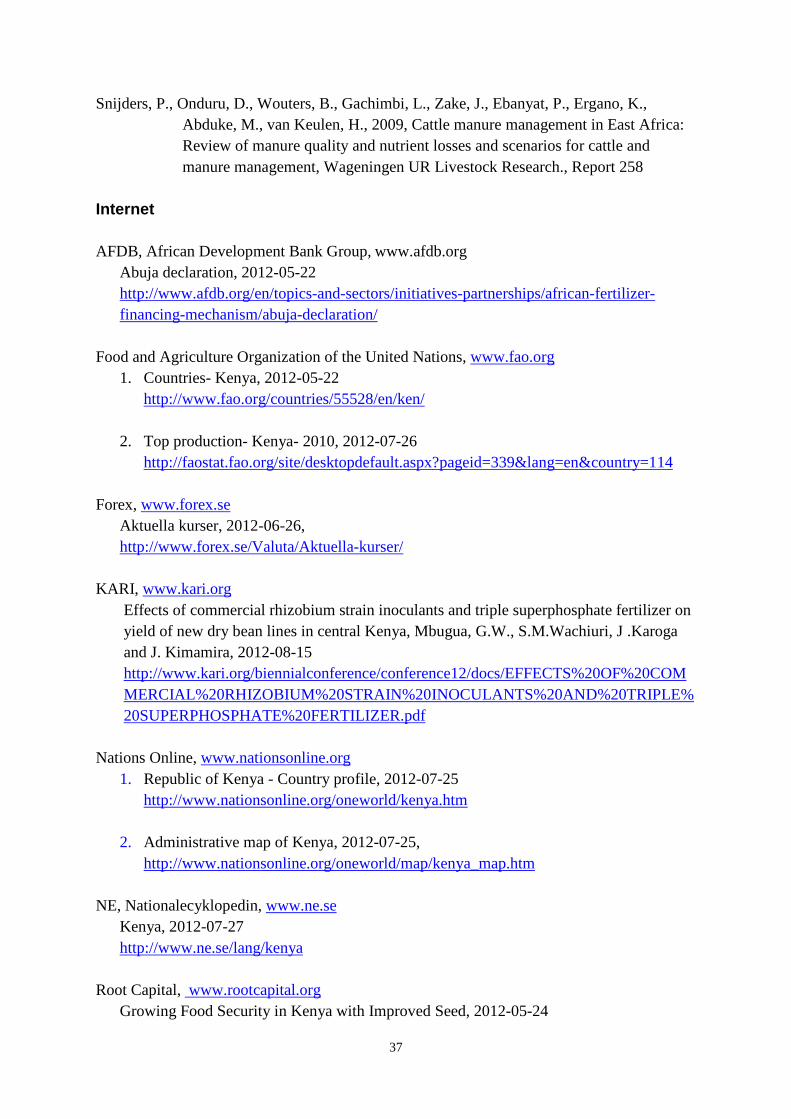
37
Snijders, P., Onduru, D., Wouters, B., Gachimbi, L., Zake, J., Ebanyat, P., Ergano, K., Abduke, M., van Keulen, H., 2009, Cattle manure management in East Africa: Review of manure quality and nutrient losses and scenarios for cattle and manure management, Wageningen UR Livestock Research., Report 258 Internet AFDB, African Development Bank Group, www.afdb.org
Abuja declaration, 2012-05-22 http://www.afdb.org/en/topics-and-sectors/initiatives-partnerships/african-fertilizer-financing-mechanism/abuja-declaration/
Food and Agriculture Organization of the United Nations,
1. Countries- Kenya, 2012-05-22 www.fao.org
http://www.fao.org/countries/55528/en/ken/
2. Top production- Kenya- 2010, 2012-07-26 http://faostat.fao.org/site/desktopdefault.aspx?pageid=339&lang=en&country=114
Forex, www.forex.se
Aktuella kurser, 2012-06-26,
http://www.forex.se/Valuta/Aktuella-kurser/
KARI, www.kari.org Effects of commercial rhizobium strain inoculants and triple superphosphate fertilizer on yield of new dry bean lines in central Kenya, Mbugua, G.W., S.M.Wachiuri, J .Karoga and J. Kimamira, 2012-08-15 http://www.kari.org/biennialconference/conference12/docs/EFFECTS%20OF%20COMMERCIAL%20RHIZOBIUM%20STRAIN%20INOCULANTS%20AND%20TRIPLE%20SUPERPHOSPHATE%20FERTILIZER.pdf
Nations Online, 1. Republic of Kenya - Country profile, 2012-07-25
www.nationsonline.org
http://www.nationsonline.org/oneworld/kenya.htm
2. Administrative map of Kenya, 2012-07-25,
http://www.nationsonline.org/oneworld/map/kenya_map.htm
NE, Nationalecyklopedin, www.ne.se Kenya, 2012-07-27 http://www.ne.se/lang/kenya
Root Capital,
Growing Food Security in Kenya with Improved Seed, 2012-05-24 www.rootcapital.org

38
http://www.rootcapital.org/portfolio/stories/growing-food-security-kenya-improved-seed Rural poverty portal, http://www.ruralpovertyportal.org,
1. Rural poverty in Kenya, 2012-05-24
http://www.ruralpovertyportal.org/web/rural-poverty-portal/country/home/tags/kenya
2. Kenya Statistics, 2012-05-24 http://www.ruralpovertyportal.org/web/rural-poverty-portal/country/statistics/tags/kenya
3. Geography, agriculture and the economy http://www.ruralpovertyportal.org/web/rural-poverty-portal/country/geography/tags/kenya
4. Rural poverty approaches, policies & strategies in Kenya, 2012-05-24 http://www.ruralpovertyportal.org/web/rural-poverty-portal/country/approaches/tags/kenya
The World Bank, www.worldbank.org,
1. Country and Lending Groups, 2012-07-26
http://data.worldbank.org/about/country-classifications/country-and-lending-groups#Low_income
2. Tool Name: Transect Walk, 2012-07-26 http://siteresources.worldbank.org/EXTTOPPSISOU/Resources/1424002-1185304794278/4026035-1185375653056/4028835-1185375678936/1_Transect_walk.pdf
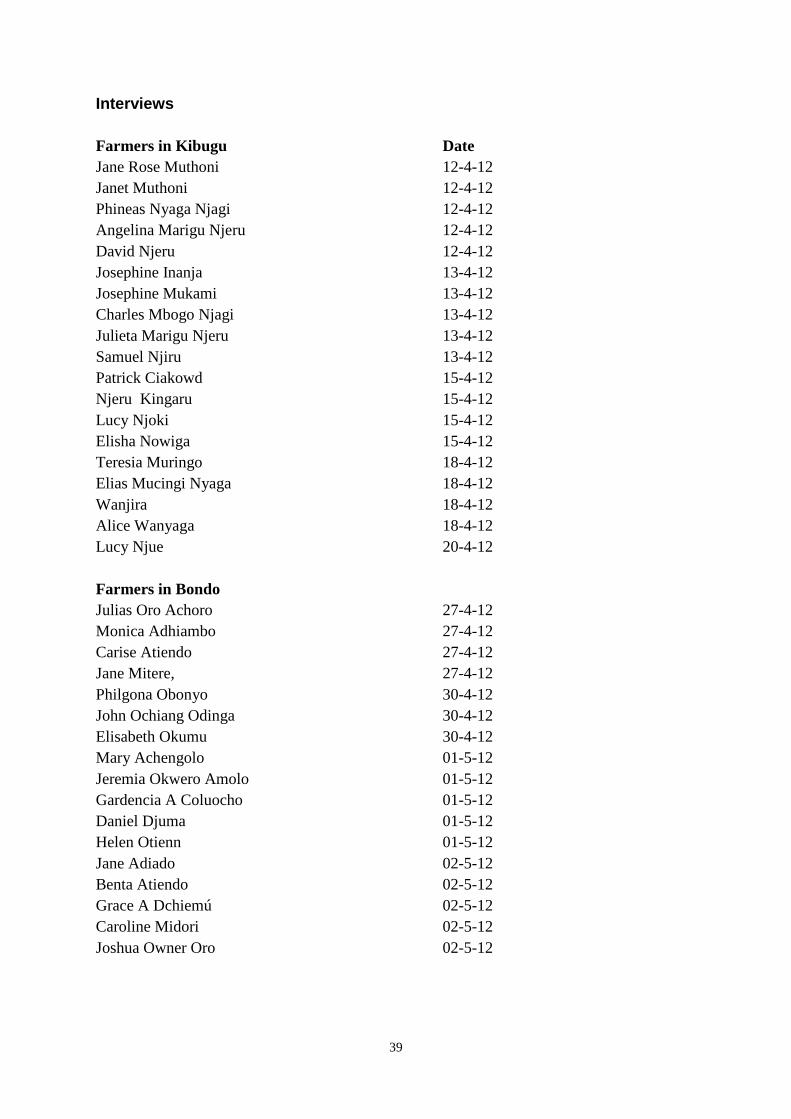
39
Interviews Farmers in Kibugu Date Jane Rose Muthoni 12-4-12 Janet Muthoni 12-4-12 Phineas Nyaga Njagi 12-4-12 Angelina Marigu Njeru 12-4-12 David Njeru 12-4-12 Josephine Inanja 13-4-12 Josephine Mukami 13-4-12 Charles Mbogo Njagi 13-4-12 Julieta Marigu Njeru 13-4-12 Samuel Njiru 13-4-12 Patrick Ciakowd 15-4-12 Njeru Kingaru 15-4-12 Lucy Njoki 15-4-12 Elisha Nowiga 15-4-12 Teresia Muringo 18-4-12 Elias Mucingi Nyaga 18-4-12 Wanjira 18-4-12 Alice Wanyaga 18-4-12 Lucy Njue 20-4-12 Farmers in Bondo Julias Oro Achoro 27-4-12 Monica Adhiambo 27-4-12 Carise Atiendo 27-4-12 Jane Mitere, 27-4-12 Philgona Obonyo 30-4-12 John Ochiang Odinga 30-4-12 Elisabeth Okumu 30-4-12 Mary Achengolo 01-5-12 Jeremia Okwero Amolo 01-5-12 Gardencia A Coluocho 01-5-12 Daniel Djuma 01-5-12 Helen Otienn 01-5-12 Jane Adiado 02-5-12 Benta Atiendo 02-5-12 Grace A Dchiemú 02-5-12 Caroline Midori 02-5-12 Joshua Owner Oro 02-5-12
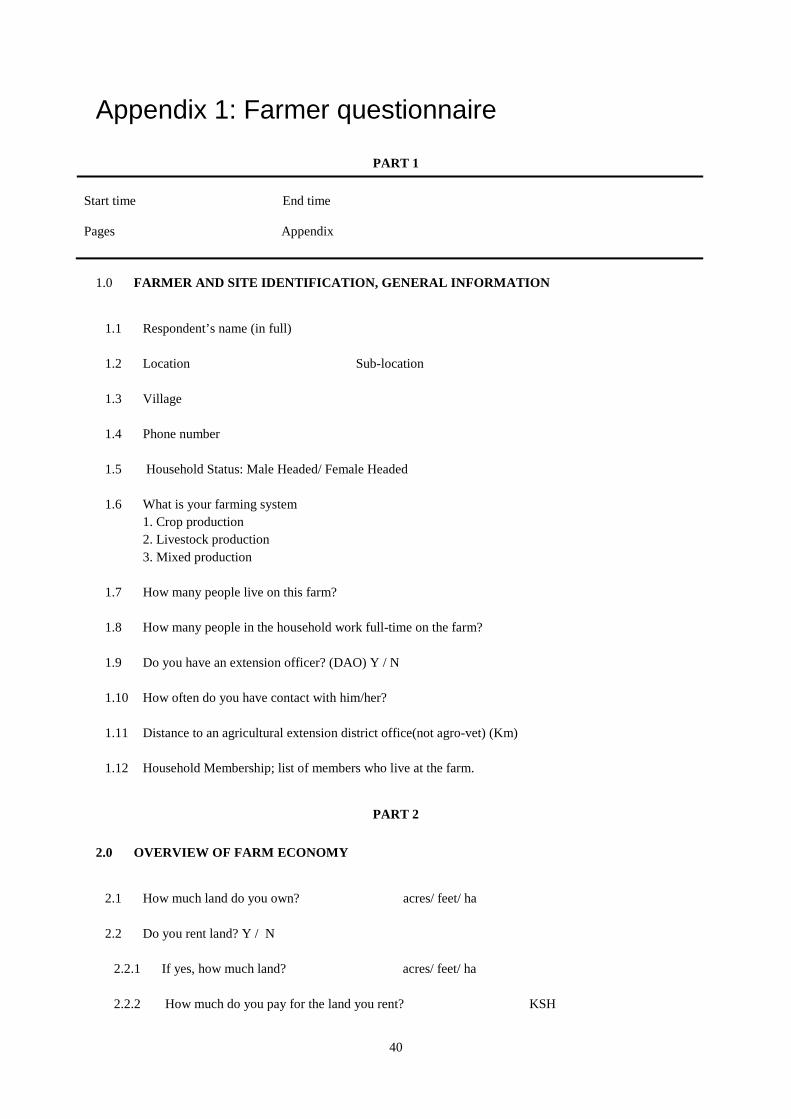
40
Appendix 1: Farmer questionnaire
PART 1
1.0 FARMER AND SITE IDENTIFICATION, GENERAL INFORMATION
1.1 Respondent’s name (in full)
1.2 Location Sub-location
1.3 Village
1.4 Phone number
1.5 Household Status: Male Headed/ Female Headed
1.6 What is your farming system 1. Crop production 2. Livestock production 3. Mixed production
1.7 How many people live on this farm?
1.8 How many people in the household work full-time on the farm?
1.9 Do you have an extension officer? (DAO) Y / N
1.10 How often do you have contact with him/her?
1.11 Distance to an agricultural extension district office(not agro-vet) (Km)
1.12 Household Membership; list of members who live at the farm.
PART 2
2.0 OVERVIEW OF FARM ECONOMY
2.1 How much land do you own? acres/ feet/ ha
2.2 Do you rent land? Y / N
2.2.1 If yes, how much land? acres/ feet/ ha
2.2.2 How much do you pay for the land you rent? KSH
Start time End time Pages Appendix

41
2.3 Do you keep some of your land in fallow? Y / N
2.3.1 If yes how much land is in fallow? acres/ feet/ ha
2.4 For how many years have you been farming? years
2.5 Do you keep record of your expenses and income? Y / N 2.5.1 If YES, is it ok if we look at the records?
2.6 Map of the Farm
*Size: Feet = F, Acres = A
2.1 Crop information – Short Rains
2.2 Please explain why :
A you don’t use any chemical fertilizer on your crops. B you don´t use chemical fertilizer on all your crops.
1. High Cost 2. Lack of labour to apply 3. My soils don´t need fertilizer to produce a good yield 4. I don’t believe it will make any difference for my yield 5. Organic fertilizer is good enough 6. Transportation difficulties/Costs 7. Other, specify
2.3 Do you think fertilizer increases /will increase your yield a lot? Y / N
2.4 Please explain why:
A you don’t use any Improved seeds? B you don’t use Improved seeds for all your crops.
1. High Cost 2. My own seeds produces a good yield 3. I don’t believe it will make any difference for my yield 4. Transportation difficulties/Costs 5. Other, specify
Field Nr. Size of plot * Type of Crop Short Rains
Field Nr. Type of Crop Short Rains
Total
Field Nr.
Type of
Seed
Code A
Price of Bought Seeds Short Rains
(KSH / (Kg/ Bag))
Fertilizer
Used Short Rains Code
B
Price of Fertilizer Short Rains
(KSH/Bag)
Quantity Produced
Short rains
(Unit)
Quantity Sold Short
Rains
(Unit)
Price of Sold Crop Short
Rains (KSH /Unit)
Sum. I N C O

42
2.5 Have you used non-improved seeds (if you use improved seeds now)? Y / N 2.5.1 If YES, what was the result?
2.6 Have you used improved seeds (if you use non-improved seeds now)? Y / N
2.6.1 If YES, what was the result?
2.7 Do you use any other inputs to increase your yield? Y / N
2.8 If YES, what were the costs of the inputs?
2.9 To summarize your production: How much of your production did you sell?
2.10 Do you buy extra food to for your household, (or is your own production enough)? Y / N
2.11 What do you think the reason is to get a good yield? 1.………………………… 2…………………………. 3.…………………………
Eat
Sell
Eat
Sell
2 Eat
Sell
3
Eat
Sell
4 Eat
Sell
5
Type of input (use codes from 2.19)
Cost of input (KSH)
1. Irrigation water 2. Pesticides 3. Other
1

43
2.12 Division of labour on the farm Can you make a timeline over a typical year?
Jan Feb Mar Apr May June July Aug Sept Oct Nov Dec
Land Preparatio
n
Planting
Weeding
Irrigation
Harvesting
2.13 Did you employ people during the year? Y / N
If YES, how many and what was the cost for the whole year?
2.14 Livestock production activities (Record from Feb 2011 – January 2012)
What type of livestock do you keep on your farm? Please do not report livestock that does not belong to this household. Livestock type Number of
livestock per category
Livestock product other than live animals
Production and Sales
Quantity produced
Quantity Consumed at home
Quantity Sold to market
Price per unit
1. Animals…
Milk
Meat
Skin
Manure
2.15 Do you buy food for your livestock or is your own production enough? Y / N
If YES, for how much KSH/month? Cattle, sheep and goats KSH/month Poultry and rabbits KSH/month
2.16 Marketing activities
To whom do you sell your crops?
CROPS
Target market
Distance to point of sale (Km)
Mode of transport
Transport Cost Return Trip (KSH.)
Do you split the transport cost with other people?
If yes, with how many people?
ANIMALS
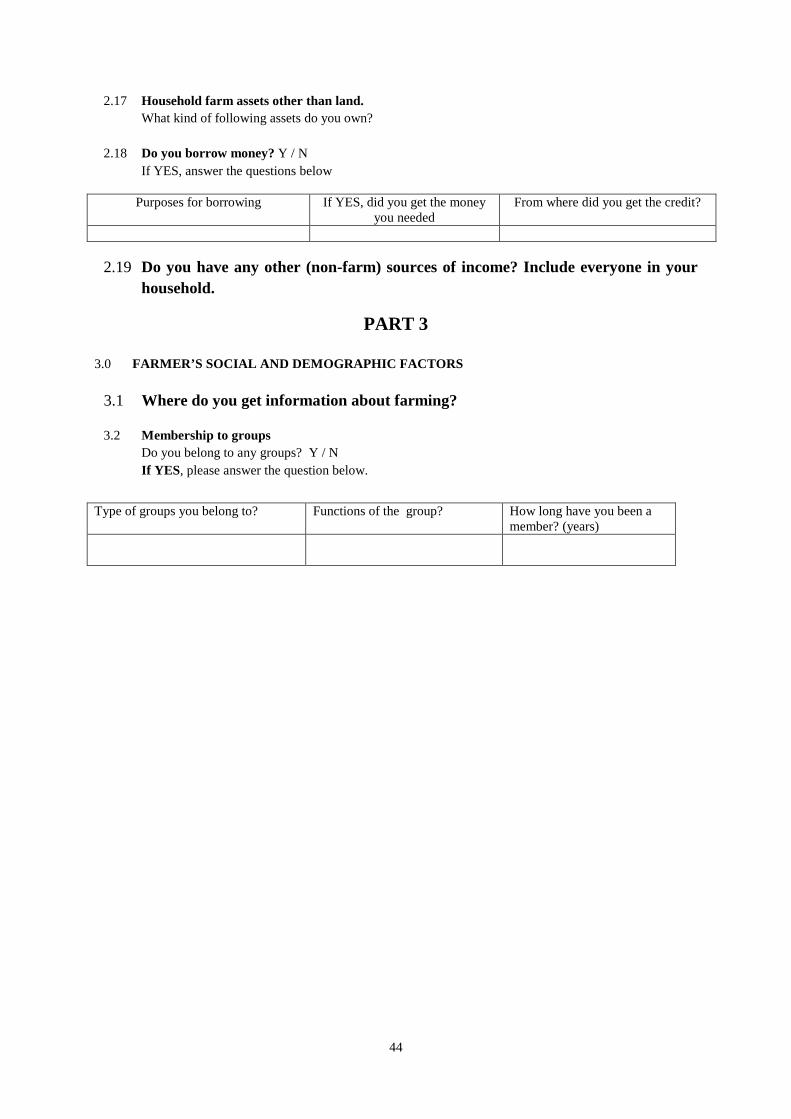
44
2.17 Household farm assets other than land. What kind of following assets do you own?
2.18 Do you borrow money? Y / N If YES, answer the questions below
Purposes for borrowing
If YES, did you get the money you needed
From where did you get the credit?
2.19 Do you have any other (non-farm) sources of income? Include everyone in your household.
PART 3
3.0 FARMER’S SOCIAL AND DEMOGRAPHIC FACTORS
3.1 Where do you get information about farming?
3.2 Membership to groups Do you belong to any groups? Y / N If YES, please answer the question below.
Type of groups you belong to? Functions of the group? How long have you been a member? (years)

45
Appendix 2: Feedback Appendix 2.1 Feedback Bondo Feedback of the preliminary results in Bondo, 8-5-2012 During the last week we have interviewed 17 farmers in the Bondo area about their economic situation. Our aim was to evaluate how the use of improved seeds and chemical fertilizers affects the farm economy. We focused on maize and beans since many farmers grow these crops. In our preliminary results we found that most farms have 3,5 acres of land, and has an average margin of 25 100 KSH/year. In the short rains the improved maize seeds produced the best yield when manure was used, while the non-improved maize seeds did best when no manure or fertilizer was used. In the long rains the improved seeds did best when no fertilizer or manure was used, and the non-improved seeds did best when fertilizer and manure was used. The non-improved beans did best when fertilizer and manure was used. Only one farmer used improved been seeds (with no other inputs added) and the result was as good as if manure had been used with non-improved seeds. Appendix 2.2 Feedback Kibugu Feedback of the preliminary results in Kibugu, 15-5-2012 During the last month we have interviewed 17 farmers in the Kigubu area about their economic situation. Our aim was to evaluate how the use of improved seeds and chemical fertilizers affects the farm economy. We focused on maize and beans since many farmers grow these crops. In our preliminary results we found that most farms have 1,5 acres of land, and has an average margin of 37 000 KSH/year. In both the short rains and the long rains the improved maize seeds produced the best yield when both fertilizer and manure was used. The non-improved beans did best when only manure was used in both the short rains and the long rains. No farmer in Kibugu used non-improved maize seeds or improved bean seeds.
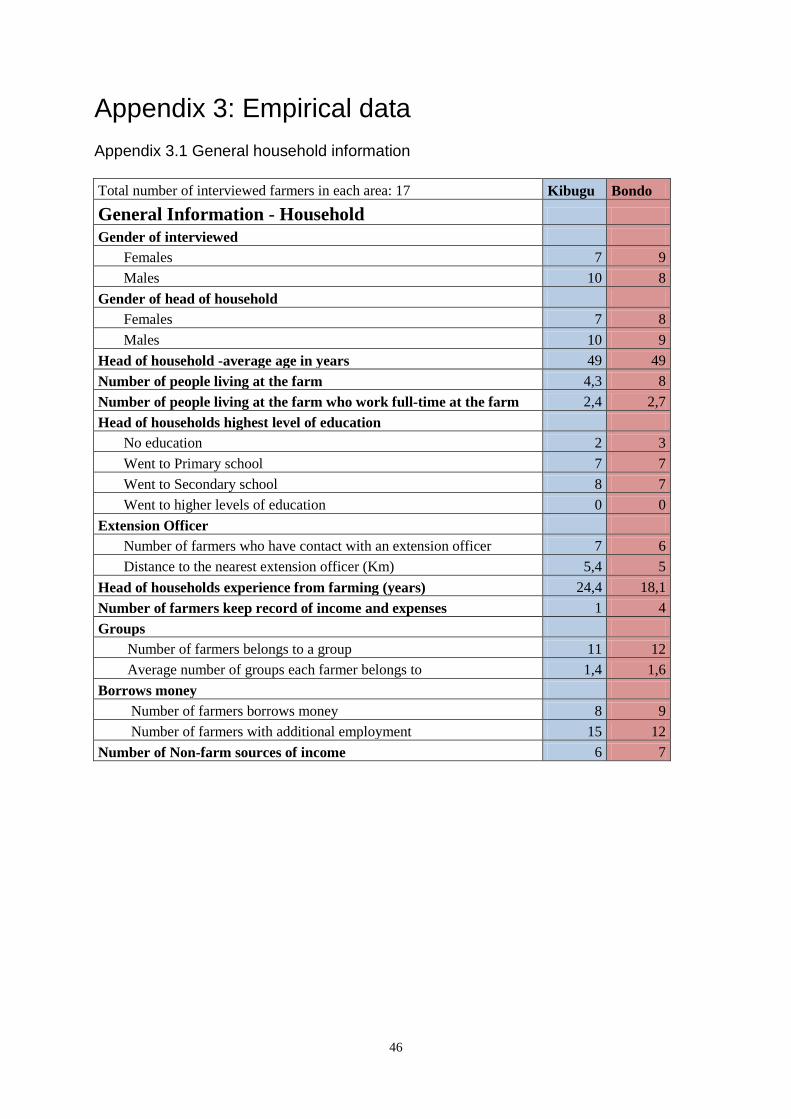
46
Appendix 3: Empirical data Appendix 3.1 General household information Total number of interviewed farmers in each area: 17 Kibugu Bondo
General Information - Household Gender of interviewed Females 7 9 Males 10 8 Gender of head of household Females 7 8 Males 10 9 Head of household -average age in years 49 49 Number of people living at the farm 4,3 8 Number of people living at the farm who work full-time at the farm 2,4 2,7 Head of households highest level of education No education 2 3 Went to Primary school 7 7 Went to Secondary school 8 7 Went to higher levels of education 0 0 Extension Officer Number of farmers who have contact with an extension officer 7 6 Distance to the nearest extension officer (Km) 5,4 5 Head of households experience from farming (years) 24,4 18,1 Number of farmers keep record of income and expenses 1 4 Groups Number of farmers belongs to a group 11 12 Average number of groups each farmer belongs to 1,4 1,6 Borrows money Number of farmers borrows money 8 9 Number of farmers with additional employment 15 12 Number of Non-farm sources of income 6 7
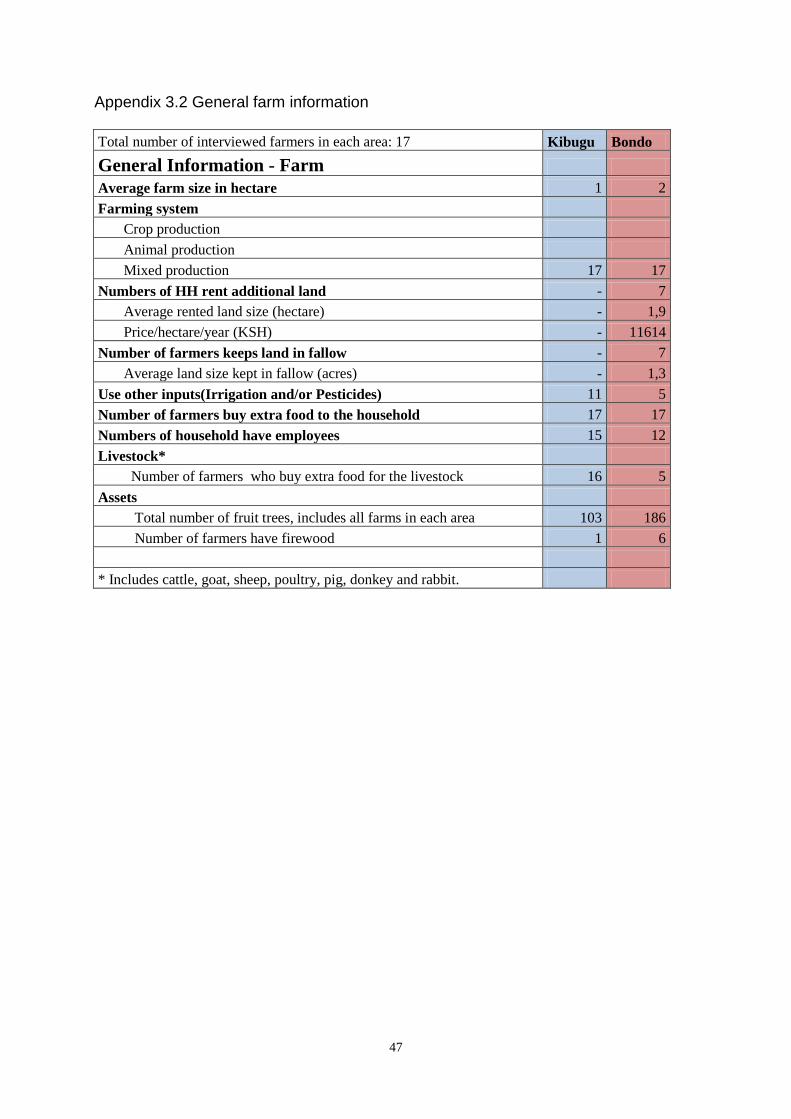
47
Appendix 3.2 General farm information Total number of interviewed farmers in each area: 17 Kibugu Bondo
General Information - Farm Average farm size in hectare 1 2 Farming system Crop production Animal production Mixed production 17 17 Numbers of HH rent additional land - 7 Average rented land size (hectare) - 1,9 Price/hectare/year (KSH) - 11614 Number of farmers keeps land in fallow - 7 Average land size kept in fallow (acres) - 1,3 Use other inputs(Irrigation and/or Pesticides) 11 5 Number of farmers buy extra food to the household 17 17 Numbers of household have employees 15 12 Livestock* Number of farmers who buy extra food for the livestock 16 5 Assets Total number of fruit trees, includes all farms in each area 103 186 Number of farmers have firewood 1 6 * Includes cattle, goat, sheep, poultry, pig, donkey and rabbit.