Embed Size (px)
Citation preview

DRAFT
CALIFORNIA HIGH SPEED RAIL AUTHORITY 1
California High-Speed Rail Project
Economic Impact Analysis Report
October, 2011
Prepared By:

DRAFT
CALIFORNIA HIGH SPEED RAIL AUTHORITY 2

DRAFT
CALIFORNIA HIGH SPEED RAIL AUTHORITY 3
Table of Contents
1) Introduction .......................................................................................................................................... 4
2) Economic Impact Workshop Overview ................................................................................................. 5
a. Southern California Workshop ......................................................................................................... 5
b. Central Valley Workshop .................................................................................................................. 6
c. Northern California Workshop .......................................................................................................... 7
d. Sacramento Workshops .................................................................................................................... 8
3) Literature Review .................................................................................................................................. 9
a. Capacity Benefits ............................................................................................................................... 9
b. Wider Economic Impacts ................................................................................................................ 10
c. Station Area Development .............................................................................................................. 13
d. Implications for California ............................................................................................................... 15
e. Methodologies for Wider Economic Benefits ................................................................................. 16
4) State of the California Economy ......................................................................................................... 19
a. Statewide ........................................................................................................................................ 19
b. Bay Area .......................................................................................................................................... 21
c. Central (San Joaquin) Valley ............................................................................................................ 22
d. Southern California (Los Angeles Basin) ......................................................................................... 23
5) Jobs from Construction ....................................................................................................................... 25
6) Productivity, Output, and Employment Impacts ................................................................................ 30
7) Station Area Impacts ........................................................................................................................... 32
a. Key Literature Review Findings ....................................................................................................... 32
b. Prior Studies of California High Speed Rail Station Impacts ........................................................... 35
c. Business Plan Study Approach and Inputs ...................................................................................... 36

DRAFT
CALIFORNIA HIGH SPEED RAIL AUTHORITY 4
1) Introduction
This report analyzes corridor wide economic impacts – i.e., the jobs created from construction,
the impacts on productivity, output, and competitiveness, and station area impacts. This
includes longer term economic impacts of HSR on productivity, business competitiveness,
market extension, and economies of specialization and business interaction (sometimes
referred to as agglomeration effects). The report includes the following sections:
Economic Impact Workshop Overview – describes the results of a series of workshops
that were held across the state to gather input from industry experts and stakeholders
on measuring the economic impacts of California High-speed Rail.
Literature Review – looks into the full range of economic impacts studied and observed
around the world and the methodologies for how they were measured.
State of the California Economy – describes the state and trends of the California
economy to provide background for the rest of the analysis.
Jobs from Construction – provides the background and sources used to develop the
construction jobs estimates in the 2012 Business Plan.
Productivity, Output, and Employment Impacts – provides an overview of potential long-
term transformational changes that the California economy could experience from high-
speed rail.
Station Area Impacts – examines the potential for stations to serve as catalysts for
development.
Together, these studies are designed to provide an understanding of how the high-speed rail
will transform the California economy and what long-term impacts it will have on California’s
economy and cities.
A formal benefit cost analysis of the HSR project was prepared and is available as a separate
document in the California High-speed Rail Benefit-Cost Analysis (BCA) report available at
www.cahighspeedrail.ca.gov.
DRAFT
CALIFORNIA HIGH SPEED RAIL AUTHORITY 5
2) Economic Impact Workshop Overview
The 2011 California High-Speed Rail Business Plan set out to answer a series of questions about the
financing, economics, operations, and other elements related to the implementation of the California
High Speed Rail System (HSR). In developing its economic analysis, the team held a series of workshops
across the state to listen and gather feedback on the methodology being used to assess the economic
impacts of the high-speed rail program. The regional workshops were held in Southern California on July
19, the Central Valley on July 20, Northern California on July 21, and Sacramento on July 22.
Close to 100 members of local governments, economic development corporations, transit agencies,
legislative staff, universities, and other organizations were invited to attend the workshops. Each
participant was asked to provide feedback on the methodology, critical issues for consideration, and
available studies that would improve the analysis. Methodologies presented and discussed in the
workshops included benefit cost analysis, wider economic impacts analysis, and station area economic
impacts. The discussions that were generated helped the project team fine-tune its analysis and
develop a more context-specific final product.
Attending Organizations
Southern California July 19, 2011
Central Valley July 20, 2011
Gateway Cities Council of Governments California State University, Fresno Los Angeles County Metropolitan Transportation Authority County of Merced Los Angeles Economic Development Corporation Fresno Economic Development Corporation Orange County Transportation Authority Fresno Office of the Mayor Southern California Association of Governments Kern County Council of Governments Kern County Economic Development Corporation San Joaquin County Council of Governments Stanislaus County Council of Governments
Northern California July 21, 2011
Sacramento July 22, 2011
Metropolitan Transportation Commission California Department of Finance Bay Area Economic Institute California Legislative Analyst’s Office Public Policy Institute of California University of California, Berkeley Center of Continuing Study of the California Economy City of Elk Grove
a. Southern California Workshop In general, the Southern California Workshop focused on the importance of local, context-specific
analysis in the Business Plan, as well as a balanced portrayal that identified potential negative impacts,

DRAFT
CALIFORNIA HIGH SPEED RAIL AUTHORITY 6
especially at the local level. There were concerns that these impacts would be absent from the Business
Plan.
Several specific key issues were noted for consideration in the Business Plan and the Economic Impact
Analysis:
1. As noted, participants stressed the importance of identifying localized impacts. This was expressed in comments about the economic impact of station and alignment choices, as well as the importance to Southern California stakeholders of disaggregated benefit-cost and economic impact results by region.
2. The localities are being asked to contribute a lot of money. As a result, they want to know what return they get on their investment and when will they see the benefits? This is an important consideration in the station-area impacts analysis and in the allocation of benefits to different parts of the state. Cities and regions are looking carefully at what they are asked to contribute and what they will get in return. They want the Business Plan and the Economic Impact Analysis to more clearly identify both their costs and benefits.
3. While most of the representatives perceived large economic development potential from HSR, they wanted to know after the Central Valley construction was completed if there are plans to extend construction to the Bay Area or south to the Los Angeles basin and what factors would drive that decision. Consequently, in addition to a clearer discussion of the benefits they would receive from HSR, participants wanted guidance on what they needed to do to prepare and when they might start to realize some of those benefits. Ideally, they asked for those decisions to be clearly spelled out in the Business Plan and to be based on the economic impacts of these choices.
4. Another key topic raised by the participants of the Southern California Workshop was a request for the Authority to acknowledge potential negative impacts of the program. In particular, participants cited possible negative impacts at the local level, including loss of tax revenue from land appropriations that might have a significant impact on the budgets of small cities along the route. Additionally, participants wanted the Economic Impact Analysis to include an evaluation of the impact of the Grapevine versus Antelope Valley alignments and the numerous Southern California station options.
5. There was an extensive discussion of the linkages between the financial and Economic Impact Analyses. For example, with limited outside funds, can some of the economic benefits be monetized and used to pay for the construction of the system?
Overall, the workshop provided valuable insight into local factors that might affect what economic
impacts HSR will have in Southern California. While largely affirming that the overall statewide
methodology is appropriate, participants stressed the need to study the details of the system and its
impacts more closely.
b. Central Valley Workshop The participants in the Central Valley Workshop wanted the Business Plan to clearly identify the
system’s benefits to the Central Valley. They view HSR as a tremendous infusion of money into the

DRAFT
CALIFORNIA HIGH SPEED RAIL AUTHORITY 7
Central Valley economy and hope that it can help spur growth and development. The following were the
main issues raised in the Central Valley workshop:
1. The jobs numbers cited in the Business Plan need to be credible, easy to understand, and broadly accepted.
2. Mirroring some of the questions from the Southern California workshop, participants in the Central Valley workshop asked what they would need to do to prepare for HSR in terms of housing and training the labor force. While some of the needed housing might be available due to the depressed economy in the Central Valley, will the counties need to plan for more housing construction? Additionally, they raised the issue of what happens to the economy, housing market, and employment market after construction is complete and the temporary jobs are gone. What permanent jobs will HSR create for the Central Valley?
3. The participants also wanted the Business Plan to address some of the negative impacts that HSR will, directly and indirectly, have on the agriculture industry. They raised concern about how much land will have appropriated for construction, and how many farms will lose value if their fields are split. Will HSR create more sprawl and accelerate the loss of agricultural land? To combat some of the criticisms from the agriculture industry, the participants wanted additional analysis of the potential benefits to the agriculture industry from improvements in goods movement and lower levels of congestion on the highway system.1
Similar to the Southern California Workshop, the Central Valley Workshop helped frame some of the
local issues that will need to be addressed in the Business Plan and in the Economic Impact Analysis.
Although the participants highlighted issues involving goods movement, housing, agricultural impacts,
and employment, on the whole they approved of the methodology used in the Economic Impact
Analysis.
c. Northern California Workshop The main theme of the Northern California workshop was the uncertainty of forecasting the impacts
from HSR. The uncertainty was expressed both in discussions of the Business Plan components, such as
the fare structures, ridership forecasts, and dates of construction completion, and through fluctuations
in wider economic conditions, such as higher driving/flight prices in the future. The following are the key
points from the Northern California Workshop:
1. Some participants saw HSR as an insurance policy to ensure that the California economy can adjust if other transportation modes become insufficient.
2. With numerous inputs and assumptions leading to varying results from investment in HSR, workshop participants wanted to see more sensitivity testing around some of the key assumptions going into the models.
3. Another important area of discussion centered on the costs of alternative investments. How much would it cost to build equivalent highway lanes and runways? How else could this money be spent to accelerate California’s economic growth? Although some of these broader
1 Most of these impacts, including land takings and impacts on agriculture are addressed in the Environmental
Impact Studies now being prepared for the Merced-Fresno and Fresno-Bakersfield sections.

DRAFT
CALIFORNIA HIGH SPEED RAIL AUTHORITY 8
frameworks are beyond the scope of the Business Plan, they are important rationales for why HSR is the right investment at the right time for the state.
4. Like the other workshops, the Northern California workshop discussed disaggregated negative impacts of HSR, specifically in those cities along the right-of-way that will not have stations. How will they be impacted by land appropriation, noise, and other environmental impacts?
5. Unlike the other workshops, the Northern California workshop participants did not express concerns about potential significant negative impacts in their communities.
With less focus on local issues, the Northern California workshop delved into the broader impacts on the
state as a whole as a result of constructing the system. Although they wanted the Business Plan to be
more cautious by testing different future scenarios, workshop participants mostly viewed HSR as an
important element of the investment in California’s infrastructure.
d. Sacramento Workshops The two Sacramento workshops were geared toward getting feedback from legislative staff on the
methodology for the assessment of economic impacts. The following were the main issues raised in the
Sacramento Workshops:
1. Echoing the comments made in the Northern California Workshop, both Sacramento workshops suggested looking at different scenarios to provide a clearer picture of the likely outcomes from the construction of HSR. The emphasis on sensitivity analysis centered on the ridership, revenue, and capital cost assumptions.
2. Additionally, participants wanted the Business Plan to provide a more thorough financing plan that focused on initial construction in the Central Valley, the system as a whole, and the role of the private sector.
3. Building on the question from the Southern California Workshop, the participants asked if there are any plans to extend construction after the Central Valley and if so, where would the money come from?
4. The Sacramento workshops reemphasized the importance of credible assumptions feeding the Economic Impact Analysis. They actively supported more transparent methodologies and were interested in greater access to the models being used in the Economic Impact Analysis. In particular, they asked that assumptions include citations for sources.
Similar to the other workshops, the Sacramento workshops approved of the overall methodology being
used in the Economic Impact Analysis. In addition, they wanted the Business Plan to provide more
details on implementation options, including the sensitivity of the results to various future scenarios. By
admitting a level of uncertainty and listing the assumptions that feed the best and worst case scenarios,
the Business Plan should include different visions for the future and provide a more nuanced analysis of
the program’s impacts.

DRAFT
CALIFORNIA HIGH SPEED RAIL AUTHORITY 9
3) Literature Review
a. Capacity Benefits Since Japan built the first high speed rail line between Tokyo and Osaka in 1964, largely motivated by
congestion on the existing rail infrastructure, countries in Europe and Asia have been motivated to
develop similar systems for a variety of reasons. As high speed rail systems around the world mature,
there is an increasing amount of empirical evidence that supports these major investments based on a
wide range of factors. These factors that motivate investment in high speed rail differ by country and
generally include several of the following: time savings, safety, environmental concerns, road and air
congestion, and impact on the regional economy and employment (SDG, 2004).
As in Japan, development of the original TGV line between Paris and Lyon was largely motivated by
congestion on the existing rail line. It was also driven by the desire to divert the growing air market
between Paris and Lyon to rail (Nash, 2009). Empirical evidence from Europe shows that this line, as well
as other in France and Spain, has been successful in diverting air passengers to rail (Nash, 2009). With
some of the largest regional air markets in the country, California is a good candidate for air to rail
diversion. Los Angeles to San Francisco is by far the largest air market in the country of less than 500
miles, with more than 2,500 passengers per day traveling between the two markets. This is almost 50
percent more than the New York to Boston market, the second largest short-haul market in the country.
Table 1: Before and After High Speed Market Shares
TGV Sud-Est AVE Madrid-Seville
Before After Before After Plane 31% 7% 40% 13% Train 40% 72% 16% 51% Car and Bus 29% 21% 44% 36%
Source: Nash 2009
These short haul flights occupy key air slots and gate capacity that could be better utilized by higher
value transcontinental or international flights. A study of the New York Metro Region found that as a
result of airport congestion over the next 18 years, 5,600 full-time jobs will not be created, resulting in
over $16 billion in lost output and $5.5 billion in lost labor income (PFNYC, 2009). These losses are in
addition to costs incurred by system users and reflect costs to the regional economy as a whole that
result from productivity losses that are directly attributable to air traffic congestion. Similar conditions
exist at the major airports in California, with flight delays threatening comparable losses to the regional
economies in the Bay Area, Los Angeles, and San Diego. According to the Bureau of Transportation
Statistics, over the first six months of 2011, flight delays in three major California airports were:
SFO – 27% of flights delayed
SAN – 25% of flights delayed
LAX – 24% of flights delayed

DRAFT
CALIFORNIA HIGH SPEED RAIL AUTHORITY 10
These delays are indicative of the inability to handle the growth in regional air travel at the region’s
airports. Available slots at these airports are becoming an increasingly scarce commodity. Because of the
scarcity of air slots and the focus on premium long-haul travel, several International airports have severe
constraints on short-haul flights, including London Heathrow, Paris Orly and Milan Linate (SDG, 2006).
All three of these cities have high speed rail links to important short-haul markets. The City of Los
Angeles has limited the capacity of LAX by restricting the number of gates to 153, thus impeding its
ability for the airport to handle the 156 million annual passengers expected for the region in 2015
(LAXMP, 2004). Given the capacity constraints at LAX and the demand for international flights, travel
between Northern and Southern California will be pushed to outlying airports or reduced altogether if
alternative new capacity is not provided between the two primary economic engines of the state.
b. Wider Economic Impacts Economic development has also played an important role in motivating investment in high speed rail
and is prominent in the evaluation criteria utilized in most countries (SDG, 2004). Although these major
investments in high speed rail have the potential to greatly reduce travel time and improve market
accessibility, attempts to quantify the economic impact that will result from changes in accessibility
remain difficult to predict and quantify (Amos, 2010). These wider economic benefits that result from
increased market accessibility can be described as the increase in total welfare above the measured
increases in net user benefits. These impacts can be measured by the increase in GDP that occurs as a
result of changes in economic activity due to the changes in transportation (de Rus, 2009).
A growing body of literature suggests that traditional economic models underestimate the economic
impact of high speed rail investment associated with agglomeration benefits by 10 to 80 percent
(Preston, 2006). Agglomeration benefits in an economy arise because of the advantages that result to
firms from the spatial concentration of economic activities (Graham, 2007). Increasing the size of a labor
market, by improving accessibility with the introduction of new transportation infrastructure, can
increase productivity by allowing a greater degree of specialization. With larger labor sheds, firms have
access to a greater number of potential workers, increasing the likelihood of filling jobs with the best
candidates. Agglomeration benefits are also said to occur as increases in effective market reach and
density reduce firms’ barriers to entry, increasing competition and lowering costs (UK, Department for
Transport, 2009).
The extent to which high speed rail will change the economic landscape is not fully understood, but
investments in transportation infrastructure throughout history have created fundamental shifts in the
spatial relationship between places.
“The Interstate System provided a new envelope of space, time, and cost, in which our economy
could reorganize. No one who designed the Interstate Highway System could have predicted exactly
what would happen to the overall economy as a result of the investment in the Interstate System”
(NCHRP, 2006).

DRAFT
CALIFORNIA HIGH SPEED RAIL AUTHORITY 11
Indeed, studies of the wider economic impacts of the Interstate System demonstrated rates of return
and productivity gains that reached as much as 35 percent per year during the first 15 years after WW II
– well above rates of economic return for private investments (Nadiri and Manuneas, Contributions of
Highway Capital to Industry and National Productivity Growth, 1996 and Contribution of Highway
Capital to Output and Productivity Growth in the U.S. Economy and Industries, 1998).
While the nation’s transport system is far more complete now than it was 50 years ago, intercity rail has
barely expanded and continues to operate mainly regionally and at relatively lower speeds. By
completing this “gap” in the transportation network, benefits of high speed rail development can extend
well beyond direct user benefits and diversions from air and highway. New economic relationships
develop between places when they are brought within two to four hours by rail. In France, a two hour
trip time has been critical to diverting air passengers to rail. It has also generated a significant amount of
new trips that reflect new economic activities and synergies between Paris and Lyon (de Rus, 2009).
Nearly fifty percent of the additional traffic between Paris and Lyons in the first four years was newly
generated, not merely a redistribution of the existing travel market (Bonnafous, 1987). Accounting for
these newly generated trips is becoming more important in the planning phase of these megaprojects.
In the planned in the high speed rail corridor between Sao Paolo and Rio de Janeiro, twenty percent of
total projected trips are estimated to be induced by the new service as a result of new economic
opportunities and new developments in the corridor (Halcrow, TAV, 2009).
Research from Europe suggests that although the contribution to total EU GDP from high speed rail
investment is relatively modest at 0.25 percent, regional impact can be much larger. Using a general
equilibrium model to estimate regional impact, Preston estimates that total impact can equal up to
three percent of regional GDP (Preston, 2006). Empirical evidence on wider user benefits from Europe
using the LUTI (Land Use Transportation Interaction) and CGE (Computable General Equilibrium) models
suggests that wider economic benefits will account for up to 40 percent of total benefits, with a likely
range of 10 to 20 percent (Gines de Rus, 2009). These wider effects will also be greater in larger markets
resulting from agglomeration effects (ibid). The main economic impacts from HSR in California will likely
occur in the areas close to the major economic centers – the Peninsula and Los Angeles Metro areas.
Whether these agglomeration benefits will be at the high end or low end of the estimated range will be
determined by the level of integration between the San Francisco and Los Angeles economies (Landis,
2011).
Applying the method developed for the Department for Transport, KPMG, in a study performed for
Greengauge21, estimated that the wider economic benefits from investment in a high speed rail
network in the UK would add 10 to 20 percent of benefits in addition to the assessed impact and
increase total GDP by up to two percent (Greengauge, 2010). With a total state GDP of $1.9 T in 2010, a
two percent expansion in California’s Gross State Product (GSP) would amount to an additional $38
billion in economic activity in the state directly attributable to the high speed network (data from
Bureau of Economic Analysis).

DRAFT
CALIFORNIA HIGH SPEED RAIL AUTHORITY 12
In line with the French experience, high speed rail in the UK has “had substantial and demonstrable
effects” in generating new economic activity in cities brought within two hours of London. (Lin, Hall,
2009). These benefits, however, have not been evenly distributed. Cities with service economies
generate many more benefits from HSR development than cities with a primarily manufacturing based
economy, which see relatively few agglomeration effects (Albalate, 2009). Research conducted for the
OECD estimates an average agglomeration elasticity of 0.12 for the economy as a whole. These
elasticities were highest for the banking, finance & insurance (.24), and other service-related industries;
and lowest for manufacturing and construction (0.08) (Graham, 2007). This study confirms the 10 to 20
percent expectation in additional economic benefits that agglomeration impacts can add in addition to
conventional user benefits.
Reducing travel time and improving the ease of travel between major economic centers will broaden the
metro scale markets for companies in the service sector and facilitate an integrated statewide economy
for these firms. Greengauge21 argues that in the UK high speed rail investments will support the long
term structural change towards the knowledge economy, accelerating economic growth and enhancing
productivity (Greengauge21, 2010). California is well positioned to leverage investments that enhance
productivity in the service sector. Thirty-seven percent of the state’s $1.9 trillion GDP is attributable to
service industries, including information; finance and insurance; real estate; and professional and
technical services (BEA). The share of these industries is even higher in Los Angeles and San Francisco,
44 percent and 42 percent respectively.
It is not only Los Angeles and San Francisco, however, that can benefit from this new economic
geography created by high speed rail. The experience of smaller cities from Japan and Europe that lie
along a high speed route between two major metropolitan regions can offer lessons for cities in the
Central Valley. Kakegawa, Japan is a medium sized city of 72,000 people midway between Tokyo and
Osaka. When Shinkansen was originally developed, the service did not stop in the city and, thus,
generated no local benefits. Following the construction of a station in 1988, the city experienced an
increase in employment, tourism, and conference activity (Okada, 1994). This experience could offer
lessons for the Central Valley cities of Bakersfield and Fresno, both larger than Kakegawa (350,000 and
110,000 respectively) located between the major metropolitan areas of Los Angeles and San Francisco.
In general, Japanese cities with high speed rail stations achieved average population growth rates of 1.6
percent while bypassed cities grew at one percent. These increases were more pronounced in cities with
information exchange industry and access to higher education (Albalate, 2010). Similarly, the German
cities of Montabaur and Limburg, with populations of 12,500 and 34,000 respectively, have benefited
from being connected via HSR to Frankfurt and Cologne. Counties in which these towns are located
experienced a 2.7 percent increase in GDP due to the increase market accessibility to the larger cities
(Ahfeldt, 2010).
Size and density also impact the extent to which a region can leverage investment in transportation
infrastructure into economic gain. Effective density is a more important influence than absolute size in
DRAFT
CALIFORNIA HIGH SPEED RAIL AUTHORITY 13
the development of agglomeration. Large sprawling areas of low density development fail to show the
benefits of agglomeration (Halcrow, Scotland, 2009). This suggests that similar levels of investment in
California’s transportation infrastructure in highways that will tend to further the development of low
density sprawl and maintain the geographic isolation of existing economies of Southern, Central, and
Northern California are unlikely to contribute the same agglomeration benefits as investments in the
high speed rail network. Unlike investment in highways, rail is by its nature a nodal system that
reinforces accessibility to key points on the network, connecting these points to each other.
c. Station Area Development There is no grounded empirical work to date on the economic development impacts of high speed rail in
the United States, since such services do not exist (Levinson, 2010). The theme of the literature available
on the impacts of high speed rail and development of station areas recognize success is not certain.
Examples from European and Japanese cities have demonstrated how a high speed rail station can be a
catalyst for improved urban environments, both in the form of great architecture for the train stations
and through well-designed new development in the surrounding area (SPUR Report, 2011). One
uncertainty is the conditions under which HSR can cause accelerated economic growth in terms of jobs,
households, or real estate values (generally), and further, the extent to which HSR results in new
economic growth or shifting of growth from one area to another.
Levinson (2010) summarizes the effects of local transit systems on land use in a variety of US cases.
Most of these cases find that commercial and residential values have been uplifted by rail transit access
but findings are not uniform. For instance, Landis (1995) found no incremental increases in commercial
property values around BART but did find residential impacts on land value and development densities.
Others (Cervero, 1994; Weinberger, 2001) concluded that commercial properties near transit stations
are likely to demand higher rents if transit users directly interact with the property (i.e. there are no
impassable barriers to access like major roadways or sewer culverts).
Generally, specialty retail shops and office properties are most likely to realize higher rents compared to
grocery or other big box retail centers, due to the difficulty of carrying large quantities of goods on the
train; plus, larger retail centers are often located where auto access is not impeded by congestion and
parking issues.
Residential properties tend to also have value premiums the closer they are to transit stations, so long
as the trains or immediate station area activities are not overly disruptive to the residences (nuisance
effects), though Chen et. al. (1998) found that positive benefits outweigh nuisance effects in the case of
Portland Streetcar. Multifamily property and rental units may be less sensitive to station area noise due
to the preferences of people living in these structures being oriented toward location rather than resale
value.
Downtown HSR stations can experience , land use benefits in the form of higher local densities and
higher local rents. However, the conclusion is widely held that enhanced transit alone may not cause a

DRAFT
CALIFORNIA HIGH SPEED RAIL AUTHORITY 14
significant change to the real estate within some proximity of a station. Existing land uses, the transit
mode and service provided, and local planning policies, among other things, all contribute to the success
or failure of a transit station’s ability to positively affect its surroundings. The user market that the HSR
facility serves and its relation to a given station area, perhaps more so than local transit, will help
determine the magnitude of impacts to the station area.
In a study commissioned by Banco Interamericano de Desenvolvimento, HSR was found to increase
property value when improved convenience of accessing other parts of the region is presented, and
when intensified land uses are valued. The increased accessibility of railway station areas – especially
the high speed railway stations due to the connectivity effect – leads to a higher attractiveness of
railway station locations and therefore to a higher concentration of offices around stations (Willigers, et.
al., 2005). Again, this report notes the importance of market factors and land use planning for positive
station area (or sub-regional) real estate changes to occur.
Other research supports the notion that station area development alone will not bring about economic
development. Simply providing high speed rail does not in itself strengthen the economy of the city, nor
necessarily support it (Greengauge, 2006). In a study commissioned by the City of Birmingham (UK) and
Greengauge21, HSR was found to reinforce existing conditions and hence had a “regeneration” effect.
Increased commercial activity, real estate values and lower vacancy rates may be evident, but would not
occur without displacement.
Cervero and Murakami’s (2010) study also realized economic impacts concentrate in global cities. They
found that increased density of jobs in knowledge industries had formed around stations (more so than
control areas), suggesting that HSR can be more favorable to these particular types of industry sectors
than commercial/service sectors in general.
Cervero and Murakami also found that large edge cities appear to benefit from increased knowledge
industry activity and that intermediate cities require policy partnered development and intra-city
connections to realize growth above the trend. Most of the decision-making powers regarding land use
are held by local governments. Yet in order for the entire state’s high speed rail system to work, each
local community must support an appropriate land-use response. This means planning for growth,
accumulating and rezoning parcels, and approving specific development projects (SPUR Report, 2011).
To further support our literature survey of station area impacts, we interviewed Professor John Landis at
the University of Pennsylvania. Landis is one of the leading researchers in this area, and has conducted a
number of important hedonic price studies of the impacts of rail station proximity on property values
and development, including studies of BART. Landis felt that cities in the Central Valley could see a small
amount of clustering around stations, as a result of better connections to San Francisco and Los Angeles,
for selected uses such as business or medical services. This clustering, however, might represent a shift
in demand which would otherwise be more dispersed around the region (Landis, 2011). Landis
acknowledged the potential for manufacturing in the Central Valley for some types of higher value

DRAFT
CALIFORNIA HIGH SPEED RAIL AUTHORITY 15
added products, and some possible synergies with the intermodal/logistics hubs being planned in the
Central Valley. These cities may also see some back office development, but major population growth
was not foreseen, due to poor development patterns (Landis, 2011).
d. Implications for California International experience suggests that the large regional air markets tied to large dynamic metropolitan
areas in California will likely result in ridership levels on California’s high speed rail network well in
excess of 8 to 10 million passengers for a line of 500 km that de Rus and Nombela estimate is necessary
to justify high speed rail investment (de Rus, Nombela, 2007). The state is also well positioned to
leverage these investments in high speed rail. Unlike many European systems in which smaller provincial
towns are connected to dominant economic centers (as is the case in France) the linking of two large
relatively independent metro regions in California could result in agglomerations benefits at the high
end of the estimated range.
Empirical evidence has shown that cities brought within two hours of a major economic center show the
most economic benefit from rail. This has important implications for Bakersfield, Fresno, and other
Central Valley cities, all of which will be within two hours by rail to both San Francisco and Los Angeles.
The high speed rail network in California has the potential to increase business-to-business interaction
between Southern and Northern California, integrate the economies of the Central Valley, and provide
capacity in the congested airport hubs for higher value international connections.
The greatest volume of urban redevelopment attributable to HSR – together with other factors – will
likely occur in the major metropolitan regions of the Bay Area and the LA Basin. Major economic centers
such as San Jose and San Francisco will become more fully integrated with each other and with cities on
the other side of the state such as Los Angeles and Anaheim. At the same time, cities in the Central
Valley could see moderate clustering of development around stations and general downtown
redevelopment , as a result of better connections to San Francisco and Los Angeles. In some areas, such
as Fresno, formal downtown development plans and/or planning processes have been actively advanced
and local support is strong. Moreover, HSR stations represent the single largest positive change factor in
these downtowns in many years. Specific development opportunities include selected uses such as
business or medical services, and back office development. There may also be good potential for
manufacturing in the Central Valley for some types of higher value added products, and some possible
synergies with the intermodal/logistics hubs being planned in the Central Valley. The extent of such
downtown and station area redevelopment effects in the Central Valley cities will be a function of
market factors, but equally, the extent to which local officials and planners create the right conditions,
including planning and infrastructure support, zoning support, financial incentives, and other factors.
With six metro regions in the state with a population of over one million, high rates of service sector
employment, and commitments throughout the state to supportive local and regional transit systems,
international experience suggests that high speed rail in California is a worthwhile investment.

DRAFT
CALIFORNIA HIGH SPEED RAIL AUTHORITY 16
e. Methodologies for Wider Economic Benefits Department for Transport
http://www.dft.gov.uk/webtag/documents/expert/pdf/unit3.5.14c.pdf
Accounts for:
Agglomeration
Increased or decreased output in imperfectly competitive markets
Labor market impacts – more or less people working and the move to more or less productive
jobs
HEATCO – Developing Harmonized European Approaches for Transport Costing and Project
Assessment
http://heatco.ier.uni-stuttgart.de/
This is an attempt to standardize the guidelines for project assessment on EU level and to provide a consistent framework for monetary valuation.
Greengauge21: High Speed Rail Consequences for Employment and Economic Growth
http://www.greengauge21.net/wp-content/uploads/employment-methodology.pdf
Empirical estimates of impacts on wages from increased labor and firm market density. Wages are
utilized as a proxy for productivity. The study includes econometric estimation of elasticities of wages,
productivity, and output with respect to market density (effective market reach) for Great Britain,
utilizing small area economic data for the entire country. Changes in effective market size/density are
modeled against a no HSR option.
BRAZIL TAV PROJECT Halcrow – Sinergia Consortium Volume 3 Economic Benefits Appraisal
Method for wider economic development benefits: Using the “rule of half,” new travelers experience
the same travel time saving benefits as other users of TAV and are assumed to experience half of the
average benefit accruing to other travelers.
Estimate these benefits by:
1. Extracting induced demand forecasts from our demand model for each forecast year
2. Multiplying these traffic forecasts by average time savings for both express and regional markets
3. Multiplying by the average value of time for each market (see earlier in this chapter)
4. Dividing by two
Graham (2007)
External benefits from transport investments related to agglomeration that can be quantified using
elasticities of productivity.

DRAFT
CALIFORNIA HIGH SPEED RAIL AUTHORITY 17
Sources Ahlfeldt, Gabriel M. and Feddersen, Arne From Periphery to Core: Economic Adjustments to High Speed
RailLSE, University of Hamburg
Albalate, Daniel and Bel, Germa (2010) High-Speed Rail: Lessons for Policy Makers from Experiences
Abroad, GiM-IREA Universitat de Barcelona
Amos, P. Bullock, D. and Sondhi, J. (2010) High speed Rail: The Fast Track to Economic Development? The
World Bank.
Bonnafous A. “The Regional Impact of the TGV”. Transportation Vol 14 (1987): 127-137
Bröcker, J. (1998) Spatial Effects of Transeuropean Networks: preliminary results from a spatial
computable general equilibrium analysis
Chen, Chia-Lin; Hall, Peter (2009), “The Impacts of High speed Trains on British Economic Geography: A
Study of the UK’s IC125/225 and its Effects” University College London, London, UK.
de Rus, G. (ed.), Economic Analysis of High Speed Rail in Europe, Fundacion BBVA, Bilbao Spain 2009.
de Rus, G., and G. Nombela (2007), “Is investment in high speed rail socially profitable?”, Journal of
Transport Economics and Policy, 14(1): 3-23.
de Rus, G “The Economic Effects of High Speed Rail Investment”, Discussion Paper No. 2008-16,
International Transport Forum, Joint Transport Research Centre, OECD, (October, 2008)
Givoni, M. (2006), “Development and impact of the modern high speed train: A review,” Transport
Reviews 26(5): 593-611
Greengauge21 (2010) “High Speed Rail in Britain, Consequences for Employment and Economic Growth”
Graham, Daniel J. “Agglomeration Economies and Transport Investment”, Discussion Paper No. 2007-11,
International Transport Forum, Joint Transport Research Centre, OECD, (December, 2007)
Halcrow. Brazil TAV Project. Economic Benefits Appraisal, Vol. 3 Final Report. (September, 2009)
Halcrow. High Speed Rail Wider Economic Benefits Study Final Report, Glasgow: Edinburgh Collaboration
Initiative. (October, 2009)
Harman, Reg. “High Speed Trains and the Development and Regeneration of Cities.” Greengauge 21.
June 2006
Levinson, David (2010) Economic Development Impacts of High Speed Rail. University of Minnesota.
Landis, John. University of Pennsylvania. Interview July 25th 2011.

DRAFT
CALIFORNIA HIGH SPEED RAIL AUTHORITY 18
Nash, Chris, When to invest in high speed rail links and networks ? Institute for Transport Studies,
University of Leed. Paper given at the International Transport Forum Symposium on Transport
Economics, Madrid, November 2009
NCHRP Project 20-24 (52), FY 2006. Future Options for the National System of Interstate and Defense
Highways, Technical Memorandum Task 2: The Economic Impact of the Interstate Highway System.
(July, 2006)
Nuworsoo, Cornelius and Elizabeth Deakin. “Transforming High speed Rail Stations to Major Activity Hubs: Lessons for California.” Transportation Research Board. January 2009 Okada, Hiroshi. “Features and Economic and Social Effects of the Shinkansen.” Japan Railway &
Transport Review. October 1994
Partnership for New York City, GROUNDED: The High Cost of Air Traffic Congestion, (February 2009)
Preston, John; Larbie, Adam; Wall, Graham. The Impact of High Speed Trains on Socio-Economic Activity:
The case of Ashford (Kent). 4th Annual Conference on Railroad Industry Structure, Competition and
Investment, Universidad Carlos III. Madrid, 2006.
Steere Davies Gleave (2006), “Air and Rail Competition and Complementarity”/ European Commission.
Steere Davies Gleave (2004), “High Speed Rail: International Comparisons”.
United Kingdom, Department for Tr ansport (Sept. 2009), The Wider Impacts Sub-Objective TAG Unit
3.5.14 (part of Transport Analysis Guidance – TAG)
DRAFT
CALIFORNIA HIGH SPEED RAIL AUTHORITY 19
4) State of the California Economy
The economic impacts of the HSR project will take place in the context of the larger conditions
and forces shaping California’s economy now and into the future. This section provides a
snapshot of the current conditions, industry structure, and recent trends in the California
economy as a whole and the three major economic regions that will be impacted by Phase 1 of
the high-speed rail system: the San Francisco Bay Area, the Central (San Joaquin) Valley, and
Southern California (Los Angeles Basin). The main sources of data include the U.S. Census, the
American Community Survey, Bureau of Economic Analysis, Bureau of Labor Statistics, the
California Department of Finance, and the California Department of Labor.
a. Statewide California is home to a vibrant and diverse economy. If California was a country, its $1.9 trillion
economy in 2010 would rank 9th in the world2. California’s Gross State Product (GSP) is 30%
larger than the GDP of Russia, 143% larger than Holland, and 341% larger than Taiwan – all
countries that have already built high-speed rail3.
With 37.3 million residents or 12% of the U.S. population, California contributes 13% to U.S.
GDP. California’s larger contribution to GDP than population in large measure reflects a higher
concentration of knowledge industries in the state, and the high value added associated with
those industries4. The location quotients for all but one of the six knowledge industries in
California are either 1 or higher with the information industry being the highest at 1.45. This
means that California has a 40% larger share of workers in the information industry than the
country as a whole. While knowledge industries accounted for 18% of the jobs in California in
2008, they contributed 40% of the state GSP. Knowledge industries often depend on face-to-
face communication for collaboration and productivity so they would stand to gain the most
from the connectivity offered by high-speed rail.
2 U.S. Bureau of Economic Analysis. GDP by State. 3 Aug. 2011.
http://www.bea.gov/iTable/iTable.cfm?reqid=70&step=1&isuri=1&acrdn=1. 3 The CIA World Factbook, 2011. U. S. Central Intelligence Agency. Web. 3 Aug. 2011.
<https://www.cia.gov/library/publications/the-world-factbook/index.html>. 4 For purposes of this analysis, knowledge industries are defined as Information, Finance and Insurance,
Professional and Technical Services, Real Estate, Management, and Education. 5 Location quotients compare the concentration of something, in this case employment, in one area (California) to
a larger area that it is a part of (the United States).

DRAFT
CALIFORNIA HIGH SPEED RAIL AUTHORITY 20
Despite the bursting of the high-tech bubble in 2000 and the global financial crisis in 2008,
California’s economy grew by $530 billion or 40% from 2000 to 2009. However, the state as a
whole was outpaced by the knowledge industries, which grew by 49% or $244 billion over the
same time period. The overall growth in GSP led to an increase in median household income
from $47,500 to $59,000 or 24%6.
While California prospered for most of the past decade, the recent recession has led to
tremendous hardship for many Californians. As of July 2011, the California unemployment rate
stood at 12%—second highest of any state in the nation. This is down from an all-time high rate
of 12.5% in December 2010. There are currently over two million Californians looking for work.
Out of all the industries, the construction industry was one of the hardest hit by this recession.
The $6 billion investment in CHS 1 over the next five years will put thousands of Californians
back to work and provide much-needed relief while the rest of the economy continues to
recover.
6Table P53: Median Household Income. U.S. Census Bureau, 2000. And Table B19013: Median Household Income in
the Past 12 Months. American Community Survey, 2009.

DRAFT
CALIFORNIA HIGH SPEED RAIL AUTHORITY 21
Table 2 California Private Sector Employment and Productivity by Industry
Industry Employees
(thousands) Industry Contribution
to GSP ( $ millions)
Total for all sectors 12834 $1,620,000
Agriculture, forestry, fishing, and hunting 25 $24,753
Mining 22 $16,723
Utilities 59 $30,652
Construction 669 $67,236
Manufacturing 1246 $206,152
Wholesale trade 827 $97,730
Retail trade 1544 $107,063
Transportation and warehousing 429 $42,918
Information 528 $122,695
Finance and insurance 610 $104,761
Real estate and rental and leasing 283 $309,359
Professional and technical services 1134 $166,840
Management of companies and enterprises 265 $24,987
Administrative and waste services 989 $50,690
Educational services 341 $17,953
Health care and social assistance 1679 $118,058
Arts, entertainment, and recreation 296 $22,010
Accommodation and food services 1333 $49,166
Other services, except government 551 $43,855
b. Bay Area The California Economic Strategy Panel from the California Department of Labor breaks down
California into nine analysis regions. The Bay Area region consists of Alameda, Contra Costa,
Marin, Napa, San Benito, San Francisco, San Mateo, Santa Clara, Santa Cruz, Solano and
Sonoma Counties.
By almost every metric, the Bay Area is one of the most economically concentrated areas of
both the state and the country. In 2010, the Bay Area population was 7.5 million or 20% of the
state’s 37.3 million people, but the region’s three million jobs represented 24% of the state’s

DRAFT
CALIFORNIA HIGH SPEED RAIL AUTHORITY 22
total. The weighted average median household income in the Bay Area was $75,000, 27%
higher than the rest of the state. Throughout the recession, the Bay Area unemployment rate
has been about 1-1.5% less than the state as a whole. The Bay Area is home to ten companies
on the Forbes 100 list and 30 companies on the Forbes 500 list of the largest companies in the
U.S.7 Thus the Bay Area is producing more jobs per capita than the rest of the state at higher
wages and with subsequently lower unemployment rates.
The Bay Area is known for the Silicon Valley and the high-tech sector. One of the main reasons
for the Bay Area’s economic strength is its disproportionately high level of employment in the
knowledge industries. The location quotients for employment in all six knowledge industries are
at least 1, with Professional Services and Management the highest at 1.4. Almost 30% of the
state’s knowledge industry workers are in the Bay Area, compared to 20% of the state’s
population. Many major knowledge industry companies are headquartered in the Bay Area
including Google, Apple, Facebook, Hewlett Packard, Genentech, Visa, and Wells Fargo Bank, as
well as newer startups such as Zynga and Dropbox. In 2009, $7 billion out of $9 billion in
statewide venture capital investment was in the Bay Area. Through even the hard economic
times of the early 2000s, the Bay Area has been able to maintain its edge as a leader in
innovation thanks largely to the strengths of its knowledge industries—both in terms of
professional services and manufacturing.
Despite the overall strength of the Bay Area economy, the region is growing slower than the
rest of the state. While the California population grew by 9% from 2000 to 2009, the Bay Area
only grew by 4%. Growth in median household income outpaced the state by about $1,000 but
because incomes were significantly higher to begin with, the 20% growth in the Bay Area was
slower than the 24% growth statewide. This might indicate that the Bay Area is reaching a
plateau of growth and could benefit from greater integration with the rest of the state’s
economy to produce more synergies among firms and industries centered in different parts of
the state.
c. Central (San Joaquin) Valley The California Economic Strategy Panel includes eight counties in its San Joaquin Valley region:
Fresno, Kern, Kings, Madera, Merced, San Joaquin, Stanislaus, and Tulare. These counties
represent California’s agricultural heartland but most have endured long periods of weak
economic performance by many measures of economic well being. 7"Fortune 500 2011: States: California Companies - FORTUNE on CNNMoney.com."Business, Financial, Personal
Finance News - CNNMoney. Web. 08 Aug. 2011. <http://money.cnn.com/magazines/fortune/fortune500/2011/states/CA.html>.

DRAFT
CALIFORNIA HIGH SPEED RAIL AUTHORITY 23
In almost the reverse of the Bay Area, the Central Valley has underperformed by most
economic metrics. With 10% of the state’s population, the Central Valley has only 7% of the
state’s jobs and 4% of the state’s knowledge industry employees. In 2009, average median
household income in the Central Valley was $46,600, 21% lower than the median statewide.
Unemployment rates in the Central Valley are the highest in the state and currently stand at
close to 18%—over 5% higher than the state as a whole. No Forbes 500 companies are
headquartered in the Central Valley and few of them even have offices in the region. The
location quotients for all of the knowledge industries are below 1 and real estate is the highest
at 0.7. In fact, the Central Valley economy is extremely concentrated in the extraction industries
of agriculture and mining, both of which have location quotients close to 5.
The most promising aspects of the Central Valley economy are its trends over the past decade.
The region’s population grew almost twice as fast as the rest of the state (17% vs. 9%) and the
Central Valley accounted for almost 20% of the total population growth in the state from 2000
to 2009. Additionally, the median household income grew by 27%, which is 3% higher than the
rest of the state. However, in absolute terms, median income growth was still over $1,500
lower than the rest of the state. Thus while the Central Valley showed some promising growth
in population and income, it remains the weakest region of California’s economy.
The poor economic conditions in the Central Valley will not be turned around overnight and no
one program will be enough on its own. However the almost immediate $6 billion of
infrastructure investment in the region from the construction of high-speed rail will provide a
much-needed infusion of capital into the regional economy, will create a significant number of
jobs, and can help lay the groundwork for the Central Valley to catch up to the rest of the state.
Additionally, the Central Valley might see some development of knowledge industry back
offices or manufacturing activities thanks to its cheaper land and labor costs and improved
connectivity from high-speed rail.
d. Southern California (Los Angeles Basin) The Southern California region consists of five counties—Los Angeles, Orange, Riverside, San
Bernardino, and Ventura—and makes up nearly half of the state’s population. With such a large
share of the state’s population, the performance of the Southern California economy tracks
closer to the state as a whole than any other region.
The characteristics of the Southern California economy are most representative of the state.
With 48% of the state’s population, Southern California is home to 49% of the state’s workers
and 49% of its employees in knowledge industries. The weighted average household income in

DRAFT
CALIFORNIA HIGH SPEED RAIL AUTHORITY 24
Southern California is 1% lower than the state as a whole but it grew by 7% more from 2000 to
2009. For the past several years, unemployment in Southern California has fluctuated within a
one percent range of the statewide rate. The location quotients for all industries except the
extraction industries—agriculture and mining—ranged from 0.9 to 1.2, again showing that the
Southern California is markedly similar to the state. The Southern California region is home to
three companies on the Forbes 100 list and 25 companies on the Forbes 500 list.
The size and diversity of the Southern California economy makes it an ideal partner for the
more focused Northern California economy. High-speed rail will improve access and
connectivity between the two megaregions and can create interconnected clusters of activities
on both sides of the network. The areas in Southern California with quality connections to the
system will be able to retain and attract businesses that l provide their services locally and to
clients in the Bay Area. In turn, businesses in Northern California will have larger markets for
their goods and reduced costs of production from competition among input providers.
Improved access between the Bay Area and Southern California can potentially create
specialization of activities around stations in each region focused on the linkages between the
two economies. Knowledge industries will be the most likely to benefit from the improved
connectivity and to subsequently group into clusters designed to promote collaboration and
efficiency.

DRAFT
CALIFORNIA HIGH SPEED RAIL AUTHORITY 25
5) Jobs from Construction
This section estimates the range of employment impacts to the economy as a function of construction
spending. Because the California High Speed Rail Project (CA HSR) is expected to be a significant
investment, it is necessary to have an estimate of how many jobs the project is expected to generate as
a result of capital construction. The CA HSR Business Plan 2012 uses a figure of 20,000 jobs generated
per $1 billion in capital expenditures, a figure that falls within the acceptable range of employment
impacts cited by other sources. This employment factor should be compared to jobs estimates for
construction / capital spending and not be mixed with O&M spending.
Job Estimation Methodology
There are various models used to develop job estimates, and most involve input-output modeling
whereby industry-by-industry requirements and purchases through an economy are aggregated. By
using employment-to-output ratios, the employment effects of additional spending in a certain industry
can be identified.
Models may include three types of employment impacts:
Direct: jobs created directly from the expenditure, such as hiring construction workers.
Indirect: jobs created by secondary activity related to the expenditures, such as the jobs
generated in the professional services industry in support of the larger construction project.
Induced: jobs created by additional spending through the economy. These are the employment
effects that occur when employees spend their money in other industries, such as wages being
used for retail purchases.
While direct and indirect jobs are commonly produced, multiplier effects for induced jobs vary, resulting
in differing estimates. Furthermore, because multipliers represent a snapshot in time of an economy,
they represent only current or recent economic relationships and technologies. . They do not capture
structural changes to the economy, new technologies, or changes in wages that have occurred since
those data were produced, or that may occur in the future. Thus, numbers can vary as differing sets of
multipliers are used, and as costs are adjusted to reflect models from previous years.
Finally, jobs estimates always represent “job-years.” This refers to the idea that one person working a
job for 20 years would represent 20 “job years.” Thus, these figures should be interpreted as
employment in years, and not necessarily equated to the number of individuals.
Job impact estimates from different sources must be used with caution, as differences in methods can
produce results that are not perfectly comparable. Among these methodological differences are the
following:

DRAFT
CALIFORNIA HIGH SPEED RAIL AUTHORITY 26
Different base years – Employment impacts per billion dollars (or any other fixed amount) will vary
somewhat depending on the base year, as a result of inflation. Assuming constant technology and
real dollar earnings per worker, a billion dollars in one year will be equivalent, in real terms, to
something less than one billion in subsequent years. Workers per billion will decline somewhat over
time as a result of this inflationary effect.
Regional/state impacts vs. national impacts – In most cases, job estimates for the nation as a whole
will be higher than a specific state or region, as most states do not produce every type of equipment
needed for transit operations, and thus must procure these from out of state or even import them.
Different input output (IO) models and multipliers – IO models require intensive data collection and
manipulation. Most regional or state models are not developed from local surveys of actual
economic data and relationships specific to the area, but are rather based on national input output
inter-industry relationships, adjusted using various short cut techniques. Moreover, some input
models are “closed” while others are open, interregional models which reflect regional input and
output flows. Models are available form different sources, and these will generally differ.
Choice of multipliers – A full set of IO based multipliers will disaggregate impacts into direct,
indirect, and induced employment, and other economic impacts. Jobs per billion dollars of spending
reported in various sources may not always include all three of these outcomes.
Changes in technology and economic structures – Input output models and their associated
multipliers are static – they reflect current or at least recent economic relationships among
industries. However, as the economy and technologies evolve in the future, these relationships will
change. For example, in the future, as construction becomes more heavily automated, fewer
workers per dollar of construction output may be needed. Or as raw materials such as cement or
steel may be imported from outside the US more than at present, domestic flows will change, and
domestic effects will be reduced.
The following is a summary of jobs estimates from construction commonly referred to.
APTA (2009) – In a report for the American Public Transit Association (APTA), job impacts of public
transportation expenditures (both capital and operations) were examined. This report serves as an
update to a previous APTA study (1999) where the economic impacts and jobs estimates of capital and
operations spending were estimated using a regional economic impact model from Regional Economics
Models Incorporated (REMI). The allocations of expenditures were estimated given average FTA data.
In 2009, APTA updated the previous figures to reflect changes in producer price indices for transit costs.
The analysis adjusted figures for 2007 producer prices, and estimated 24,000 jobs per $1 billion in
capital spending in transit; 41,000 jobs for operations spending in transit; and an average mix of 36,000
jobs per $1 billion dollars of combined spending in transit.

DRAFT
CALIFORNIA HIGH SPEED RAIL AUTHORITY 27
It is important to note that the number that should be used for comparison is 24,000 jobs per $1 billion
in capital spending. This is because these represent temporary construction jobs, while O&M jobs are
long-term and occur over a period of many years of operations.
The APTA figures include direct, indirect and induced jobs.
American Association of Railroads (2011) – According the American Association of Railroads, a $1 billion
dollar investment in railroad infrastructure leads to 20,000 jobs. This is based off on “a U.S. Department
of Commerce / Bureau of Economic Analysis model of the U.S. economy.” The model is not specifically
identified in this report, and it is not stated whether indirect and induced jobs are included. It is possible
that the model referred to is the Department of Commerce’s Bureau of Economic Analysis RIMS model.
This model, which stands for Regional Input-Output Modeling System, is a commonly used source of
economic multipliers, and is based on national input output tables, adjusted to a degree for local
conditions. Various generations of RIMS models have been produced, including RIMS II, a second
generation of models.
Federal Highway Administration (2011) – The FHWA estimates that for every $1 billion in highway
spending (including right of way purchases), approximately 27,800 jobs would be created. This includes
direct, indirect, and induced jobs. Of these jobs, 14,975 are direct and indirect jobs, while 15,094 are
induced. This analysis was conducted using input-output modeling, though the specifics of which model
used were not included.
Washington Department of Transportation (2011) – Using the Washington State Input-Output model,
WSDOT estimates 11,400 jobs per billion in construction spending and 16,000 per billion in
transportation operations. These figures include direct, induced and indirect jobs.
Council of Economic Advisors (2009)– For the American Recovery and Reinvestment Act, the President’s
Council of Economic Advisors estimated the likely jobs impacts of increases in governments spending.
The methodology used was to take a typical reinvestment package and apply various GDP multipliers to
the package in order to estimate the effects on the economy. Changes in GDP were then translated to
increases in jobs. This report estimated that for every $1 billion in government spending there would be
nearly 10,854 jobs created. It is unclear whether this indicates only direct jobs, or includes indirect and
induced jobs.
Congressional Research Service (2009)- Levine (2009)examined the employment effects of
infrastructure spending using the Bureau of Economic Analysis employment requirements table, as well
as RIMS II tables.
Levine finds that the BEA Employment Requirements Table estimates 11,786 direct and indirect jobs per
$1 billion in infrastructure spending. RIMS II, she finds that the U.S. as a whole produces 14,315 jobs
per $1 billion in spending; and for California in particular, 12,289 jobs per $1 billion. These estimates do
not include induced jobs.

DRAFT
CALIFORNIA HIGH SPEED RAIL AUTHORITY 28
Parsons Brinckerhoff (2008). For the California High Speed Rail Authority in 2008, Parsons Brinckerhoff
conducted a jobs analysis of construction expenditures using RIMS II multipliers. Disaggregating
construction costs into various industries and applying the RIMS II multipliers, this report estimated job
impacts between 20,097 to 20,748 jobs per $1 billion in spending. These impacts reflect jobs at a
national level, rather than specifically for California. In most cases, job estimates for the nation as a
whole will be higher than a specific state or region, as most states do not produce every type of
equipment needed for transit operations, and thus must procure these from out of state or even import
them.
Results
The results presented in this section are broken down by each step in the implementation strategy. The
full description of each step is available in the 2012 Business Plan, Chapter 2, A Phased Implementation
Strategy.
Step 1—Start construction of an Initial Operating Section with the Initial Construction Section
(ICS) in the Central Valley.
Step 2—Introduce the state’s (and nation’s) first fully operational high-speed service with the
Initial Operating Section. The IOS is achieved through expansion of the ICS into an operating
high-speed rail line between the Valley (from Merced to Bakersfield) to the north or south:
The north extension will expand the system to San Jose; The south extension will expand the system
to the San Fernando Valley through Sylmar, Burbank, or Santa Clarita.
Step 3—Bay to Basin will complete the remaining extension from Step 2, to the north or the
south.
Step 4—Phase 1 will provide HSR service along a 520-mile route between San Francisco and Los
Angeles/Anaheim.
Starting in the Central Valley in 2012, construction of the Initial Construction Section will create 33,000
direct jobs and another 65,000 jobs from multiplier effects in the economy over the next five years. The
Central Valley has some of the lowest incomes and highest unemployment rates in California, so early
investment in that region will have a greater relative impact there than anywhere else.
Building the Phase 1 system will generate an additional 1.2 to 1.3 million jobs over the next two decades
(Exhibit ). The program’s long-term nature means that the employment impacts in construction will
continue for years. Throughout that time, the system will continue to generate jobs in construction and
through multiplier effects in the wider economy.
Exhibit 1. Incremental construction job-years and multipliers by step, spread over the implementation schedule

DRAFT
CALIFORNIA HIGH SPEED RAIL AUTHORITY 29
Step Direct Construction
Job-Years
Indirect Multiplier
Job-Years
Total Employment Job-
Years
Initial Construction Section 33,000 66,000 99,000
IOS – North (Valley to Bay) 124,000-168,000 248,000-336,000 372,000-504,000
IOS – South (Valley to Basin) 135,000-164,000 270,000-328,000 405,000-492,000
Bay to Basin 104,000-113,000 208,000-226,000 312,000-33,9000
Phase 1 149,000-159000 298,000-318,000 447,000-477,000
Total 410,000-473,000 820,000-946,000 1,230,000-1,419,000
Note: The low Bay to Basin, Phase 1, and Total figures include the lowest increment from the two IOS
options, the high Bay to Basin, Phase 1, and Total figures include the highest increment from the two IOS
options.
Citations: American Association of Railroads. (2011). Tax Incentives for Freight Railroad Infrastructure Investments
Retrieved September 15, 2011, from http://www.aar.org/KeyIssues/~/media/aar/Background-Papers/Tax-Incentives.ashx
American Public Transportation Association, Cambridge Systematics, & Economic Development Research Group. (1999). Public Transportation and the Nation's Economy: A Quantitative Analysis of Public Transportation's Economic Impact. Washington: American Public Transportation Association.
American Public Transportation Association, & Economic Development Research Group. (2009). Jobs Impact of Spending on Public Transportation: An Update. Washington: American Public Transportation Association.
Council of Economic Advisors. (2009). Estimates of Jobs Creation From the American Recovery and Reinvestment Act of 2009. Washington: Executive Office of the President.
Federal Highway Administration. (2011, April 15). Employment Impacts of Highway Infrastructure Investments Retrieved September 15, 2011, from http://www.fhwa.dot.gov/policy/otps/pubs/impacts/index.htm
Levine, L. (2009). Job Loss and Infrastructure Job Creation Spending During the Recession. (R40080). Washington: Congressional Research Service.
Parsons Brinckerhoff. (2008). California High-Speed Rail Economic Analysis. Sacramento: California High Speed Rail Authority.
Washington Department of Transportation (2011, April 4). 2002 Washington Input Output Model Retrieved September 15, 2011, from http://www.ofm.wa.gov/economy/io/2002/impact_worksheets.xls

DRAFT
CALIFORNIA HIGH SPEED RAIL AUTHORITY 30
6) Productivity, Output, and Employment Impacts
In California, HSR has the potential to help create a new economic geography. In the past, the Los
Angeles and San Francisco Bay metropolitan areas have acted as prominent but generally separate
economic engines. However, adding HSR to the state’s transportation network will create new
opportunities for collaboration and innovation that are currently more difficult to achieve. While
advances in communications technology help to reduce effective distance and facilitate the flow of
information and ideas, many businesses—including some of the most crucial high value-added sectors—
require substantial in-person interaction. Connecting California’s urban areas with efficient and reliable
HSR will create economic synergies critical for success in the knowledge-based industries of today and
tomorrow.
High-speed rail will increase productivity and specialization by giving businesses access to larger labor
markets. Larger labor pools lead to better matching of skills, which means that firms are better able to
find workers with the right qualifications.
High-speed rail service will improve market access; companies that operate locally or regionally will be
able to expand their operations statewide. The increased market size will subsequently increase
competition among businesses, lowering production costs and improving market efficiency. Research
indicates that high value-added sectors benefit from the increased access and proximity brought about
by HSR. Economists have identified business clusters within high value-added sectors that comprise
combinations of businesses that benefit from increased interaction and proximity.
Through these processes, transportation economists have increasingly focused on these wider economic
impacts, referred to as “agglomeration economies.” This refers to benefits of bringing economic
activities and markets closer by reducing travel times. As an example, if the available labor market
within a one-hour travel time can be increased, the potential pool of workers grows, and workers have
more employment options.
The HSR system will provide greatly improved connectivity and reduced congestion and, as a result,
California’s economy will become more efficient, productive, and competitive, and businesses will have
much greater access to labor and other markets. Key economic sectors and clusters, such as technology,
will expand output and hire more workers as businesses gain better access to legal, financial, and other
services, and can work more effectively with research institutions, vendors, suppliers, and others. Job
impacts will increase over the long term as highway and aviation congestion worsen and the travel
benefits of high-speed rail service increase. The research is generally (but not uniformly) positive with
respect to major long-term economic impacts, but methods and results can vary widely.
While results and methods vary greatly and cannot be considered precise, some consistency can be
identified. For example, an oft-cited study conducted by the U.S. Conference of Mayors estimated
creation of about 55,000 jobs in the Greater Los Angeles metropolitan area from the full California HSR
investment (USCM 2010). That study did not provide a complete estimation of job creation for the entire
DRAFT
CALIFORNIA HIGH SPEED RAIL AUTHORITY 31
California HSR corridor, but if extrapolated based on the Los Angeles Basin’s share of the corridor’s
economy, that study finding would imply a full corridor economic impact of about 100,000 to 150,000
jobs.
Other studies, indeed the majority of studies that attempt to estimate these impacts numerically, lead
to similar conclusions while also indicating the variability in estimates and results. For example, a report
by the APTA, The Case for Business Investment in High-Speed and Intercity Passenger Rail, cites the U.S.
Conference of Mayors Report (as noted above) as well as academic studies (APTA 2011) to try to
estimate impacts. One report noted prominently in APTA’s business case is a case study of HSR impacts
in the Frankfurt-Cologne corridor in Germany. As noted in the lessons from international experience
above, Ahlfeldt and Feddersen of the London School of Economics in From Periphery to Core: Economic
Adjustments to High-Speed Rail, 2010, the following two findings are reported by APTA:
Counties that are adjacent to intermediate rail stations in the Frankfurt-Cologne corridor were
found to have a 2.7-percent premium in GDP compared to areas not having rail access.
For the much larger economic area served by the Frankfurt-Cologne HSR, the researchers found
0.25-percent growth in GDP for every 1-percent increase in access.
The initial finding, if assumed applicable in California and then extended to the entire California HSR
economic impact area, would yield estimates of around 400,000 jobs created. The second finding—with
the 0.25 elasticity—closely mirrors the estimate of about 100,000 jobs, as extrapolated from APTA’s
results.

DRAFT
CALIFORNIA HIGH SPEED RAIL AUTHORITY 32
7) Station Area Impacts In the previous section, the potential for wider economic growth and transformation in California – as
measured by total employment was considered, and evidence from other studies was presented. That
analysis does not, however, consider more local impacts. This section addresses this, focusing in
particular on the growth potential within an immediate “impact area” surrounding proposed High Speed
Rail stations. Here, impacts may be experienced as higher property values, increased development and
employment densities, different and higher value development, and higher local property tax revenues.
Station, development “impact areas” can vary among stations. For the two largest metropolitan areas
(the LA Basin and the San Francisco Bay Area), impact zones are more clearly delineated, focusing on
distances around stations of typically less than a mile in each direction. In a number of such cases,
station areas are defined by existing development plans, such as the Transbay Terminal development
area in San Francisco. Here, the station surroundings can be defined by formal development districts. In
such zones, public and private sector interest, planning, and financing are concentrated and
coordinated, and specific plans, while fluid, exist “on paper”. In some cases, development authorities
have been created specifically for the purpose. For the largest metropolitan areas, the ability to
differentiate between development stimulated by the High Speed Rail and other development forces
falls sharply as one moves beyond these formal development areas, as the station zone begins to merge
with the general grid of the city itself, and the importance of the station declines relative to other
ambient market forces.
In other cases, especially the smaller intermediate areas farther from the major metropolitan areas,
station areas might be defined more broadly, with larger capture areas. Indeed, for some cities, such as
Fresno, the zone of station influence is large relative to the City as a whole. Thus, the station
development area might be conceived as extending to large sections of the entire downtown area,
which is smaller and less subject to other development factors than the major cities. In these cases,
development of a High Speed Rail station might constitute the single most important change in
development conditions in years.
a. Key Literature Review Findings
High-speed rail projects in Europe and Japan have demonstrated that a station can be a focus and
catalyst for new development in the surrounding area. Local station area development, which can
include higher property values, more and denser development, and higher employment densities, relies
on travel time savings and increased accessibility among city pairs (especially connectivity to the major
metropolitan areas), availability of connecting transit and transportation services for local and regional
distribution of riders, as well as available land, compatible land uses, and local planning policies and
development incentives. Equally important, strong background market demand, including not just
passenger demand but also strong development forces within the larger surrounding region, must
already be present for increased station development to occur.
DRAFT
CALIFORNIA HIGH SPEED RAIL AUTHORITY 33
Specific findings from the literature review include the following:
The improved accessibility offered by high-speed rail tends to concentrate development most
intensively around stations in the largest metropolitan areas with the widest reaching economies.
At the same time, evidence suggests that medium-sized cities located between major economic
centers can significantly benefit, particularly “edge cities”; observations from high-speed rail
systems in Europe indicate that cities brought within two hours of major economic centers receive
the most economic benefit from high-speed rail service. Some evidence also exists that in some
intermediate cities, HSR can siphon off development potential to the major metropolitan areas, but
this effect is more likely to occur where no particular planning measures are undertaken to leverage
development opportunities or where new market niche opportunities are neither identified nor
supported.
Evidence from Japan’s Shinkansen shows strong premiums in development and employment
densities around stations compared to similar areas not served by high-speed rail. This has
important implications for Bakersfield, Fresno, and other Central Valley cities, all of which will be
within two hours by rail to both San Francisco and Los Angeles. However, city/station visioning and
planning will be critical to realizing such positive benefits in station areas.
A significant share of job and population growth in station areas will result from regional or local
shifts in location. More specifically, this means that a significant proportion of businesses and
residences locating near HST stations would have occurred in other parts of the region regardless of
the HSR station, but are shifting to the station area due to the new HST service.
Empirical evidence has shown that cities brought within two hours of a major economic center show
the most economic benefit from rail. This has important implications for Bakersfield, Fresno, and
other Central Valley cities, all of which will be within two hours by rail of both San Francisco and Los
Angeles. Central Valley cities also do not compete with low cost air service for within-California trips.
France and Spain particularly offer important lessons on the potential of HSR to create development
around stations. However, results are not uniform and rely on numerous factors including station
location, transit connections, local market conditions, and others. Some cities, such as Lille and Lyon in
France and Zaragoza in Spain, have created or expanded their business districts with the arrival of HSR.
At the same time, others, such as Macon in France and Guadalajara in Spain have seen very little growth
years or even decades after the introduction of HSR service.
Albalate and Bel cite the concentration of economic activities in Paris and Lyon to assert that the
improved accessibility offered by HSR tends to concentrate development in the strongest economic
nodes. The introduction of the high-speed rail service in France (TGV) has increased business trip-
making between the two cities and has given firms greater options for office locations (Albalate and
Bel, 2010). These types of impacts could occur at major employment centers along the Phase 1
corridor, such as San Francisco, San Jose, and Los Angeles, though it’s uncertain whether the HST

DRAFT
CALIFORNIA HIGH SPEED RAIL AUTHORITY 34
will induce new growth or capture growth which would otherwise have occurred in other areas of
the respective cities.
Additionally, there is evidence that some medium-sized cities located between major economic
centers can also benefit. Zaragoza, which is located roughly half-way between Madrid and
Barcelona, created a new business district centered on its high-speed rail station. Zaragoza
benefited from its central location on the HSR network, the availability of publicly-owned land for
development, the International Exposition, which was held in Zaragoza in 2008, and other local
factors. See http://www.reconnectingamerica.org/assets/Uploads/TOD-HSR-Bakersfield-Fresno-
Report.pdf Similar to Zaragoza, Lille has been able to generate development, in part because of its
central location on the HSR network. Lille sits at the intersection of HSR lines going to three major
economic and political hubs – Paris, London, and Brussels. In planning for HSR, Lille used publicly-
owned land to redevelop its downtown into a mixed-use intermodal international business hub. The
HSR connections in the city helped raise Lille’s profile, which in turn increased overall economic
activity in the city (Krause, 2010).
However, some intermediate cities on the French and Spanish HSR networks have seen little to no
development since HSR service was introduced. Almost all intermediate cities that sited their HSR
stations outside their city centers saw little to no new development. Examples of such stations
include Macon in France and Guadalajara and Segovia in Spain. Cordoba, which is located at the
intersection of the Madrid-Seville and Madrid-Malaga lines, saw very little new development in part
because the area around its station had little available land and aggressive redevelopment was not
pushed.
In a study commissioned by Banco Interamericano de Desenvolvimento, HSR was found to increase
property value when improved convenience accessing other parts of the region was achieved, and
when intensified land uses were valued by the market. The increased accessibility of railway station
areas – especially the high-speed railway stations due to the connectivity effect – leads to a higher
attractiveness of railway station locations and therefore to a higher concentration of development
around stations (Willigers, et. al., 2005). Again, this report notes the importance of market factors
and land use planning for positive station area (or sub-regional) real estate changes to occur.
In Japan, studies by Robert Cervero and James Murakami (2010) suggested that economic impacts
of HSR concentrate in largest measure in global cities – i.e., large metro areas with internationally
reaching economies. They found that increased density of jobs in knowledge industries had formed
around stations on Japan’s Shinkansen (more so than control areas), suggesting that HSR can be
more favorable to these particular types of industry sectors than commercial/service sectors in
general. Cervero and Murakami also found that large edge cities (or shoulder cities near the largest
cities in a corridor) appear to benefit from increased knowledge-industry activity and that other
smaller cities further away from major metro areas (intermediate cities) require policy partnered
development and intra-city connections to realize growth above the trend. In Japan, partnerships
have been particularly direct, where the railroad operator/owner has the authority to develop
around stations by land assembly and joint investments with developers.

DRAFT
CALIFORNIA HIGH SPEED RAIL AUTHORITY 35
Implications for California High Speed Rail station locations
Important implications for CHSR station development can be drawn from the above studies, and from
the experiences in Europe and Japan.
Businesses that are most likely to benefit from the expanded access offered by high-speed rail will
locate near stations. As has been found in many cases around the world, with proper planning and
complementary investments in local transit, high-speed rail can generate development in the
vicinity of its stations. California’s cities could leverage the increase in development and density
around high-speed rail stations for urban regeneration and an increase in the local tax base.
Proposed stations in the major metropolitan areas – especially within greater San Francisco and Los
Angeles -- will experience the most significant development impact in terms of absolute volume of
growth attraction.
At the same time, intermediate cities brought to within about two hours rail travel time of major
metropolitan areas have a very good opportunity to see significant economic development around
their stations – provided other active local planning and land use actions are also brought into play.
As noted, empirical evidence from existing HSR systems internationally has shown that cities
brought within two hours of a major economic center show the most economic benefit from rail.
This has important implications for Bakersfield, Fresno, and other Central Valley cities, all of which
will be within two hours by rail of both San Francisco and Los Angeles. Central Valley cities also do
not compete with low cost air service for within-California trips.
Visioning and city planning, such as coordination with large businesses in San Francisco and Los
Angeles, targeting of specific industries to form industry clusters, and making large developable
attractive parcels available near the station area will be critical to realizing positive station area
benefits.
b. Prior Studies of California High Speed Rail Station Impacts
Several studies focusing specifically on transit oriented station development potential in the Central
Valley-- in Fresno, Bakersfield and Merced – were undertaken on behalf of the California High Speed Rail
Authority by researchers from the University of California Berkeley.8 These reports – “Sustainability:
Design Concepts for Fresno” and “Sustainability: Design Concepts for Stockton and Merced”, prepared
with the financial support of the CHSRA, examine the potential for transit-oriented development (TOD)
around high speed rail stations in the cities of Stockton, Merced, and Fresno. They present planning
8 http://www.cahighspeedrail.ca.gov/CHSRTemplate_STDwoBanner.aspx?pageid=8895

DRAFT
CALIFORNIA HIGH SPEED RAIL AUTHORITY 36
approaches and design concepts for land use, urban design, and multimodal access and circulation in
and around the proposed HSR station areas in these Central Valley cities.
The studies identified opportunities for substantially higher density transit oriented development in the
downtowns of these cities. Fresno, for example, was found to have significant opportunities for high
density mixed use, residential and commercial development, clustered around a transit hub
incorporating the High Speed Rail station. Similar conclusions were drawn in Merced and Stockton. At
the same time, these studies pointed out that the market for such higher density development has yet
to be clearly demonstrated by detailed market studies.
In general, the UC Berkeley studies concluded that downtown high speed rail stations, as part of larger
transit hub concepts, will “dramatically increase the accessibility of the Central Valley to the rest of
California, but the extent to which Central Valley cities realize additional local benefits … is dependent
upon their establishing a supportive framework of planning and development policies (including) transit-
supportive land use designations and zoning in the station areas, downtown revitalization efforts,
proactive parking policies, … and the creation of commerce incentive zones…The cit(ies) could take
advantage of the accessibility benefits provided by the HSR station to reduce the costs of development,
allowing higher densities with lower parking requirements and lower traffic mitigation fees..”
In addition to the UC studies, the planning firm Calthorpe, Inc. has undertaken extensive analysis on
behalf of the Authority and the State of California to establish a “vision” for long term California land use
and development. The Calthorpe analyses and associated programs of stakeholder outreach, which are
described elsewhere in the Business Plan, are known collectively as Visions California. As the title
suggests, Calthorpe’s consulting and advocacy work reflects an expansive concept of the long time line
potential for transformational effects in California, which would be stimulated and focused around a
wide array of infrastructure, planning and policy changes, a key one of these being development of the
California High Speed Rail.
c. Evidence for Potential CHSR Station Development
Making use of the insights from the literature review covering the European and Japanese experience,
as well as the prior California High Speed rail station development research cited above, the fifteen
proposed Phase I rail stations were examined according to a set of criteria that are key determinants of
station area development potential. About half of these stations, including those in San Francisco,
Millbrae, San Jose, Fresno, Bakersfield, LA Union Station, and Anaheim, are firmly planned at their
respective cities; other stations, such as Fresno, have redevelopment processes in place but have not yet
coalesced around a specific redevelopment plan; others do not yet have a set station location, but
rather have narrowed the choice to two possible options. The main factors likely to effect station area
development are:

DRAFT
CALIFORNIA HIGH SPEED RAIL AUTHORITY 37
ridership levels forecast for each station (station boardings)
existing and historic economic and demographic conditions and trends
inter-modal connections, existing station area plans (including known build out potential); and
real estate absorption potential
Based on these, real estate development potential around stations has been highlighted. Specific
estimates of development potential on an annual basis have been made, focusing on the potential for
more rapid construction and absorption of commercial and residential development, and a greater
clustering of projected region wide development around the station itself. These estimates should be
regarded as potential which could be realized, given the various criteria considered. Upside
development potential reflects existing station area plans and development capacity, as well as
anticipated real estate absorption rates. The forecasts are not based on rigorous modeling but
represent potential assuming proactive public policies to support such development.
Regional Employment and Population Growth
An analysis of county-level job and population growth was performed to highlight growth trends at
station locations. The data used in this analysis is from a third party forecasting service, Global Insight.
This data was used in lieu of adopted MPO forecasts from various local agencies in order to maintain
consistency of assumptions with regard to land use policies and anticipation of major project
development, such as HST service.
Historical and forecast total population and employment data were examined for the period from 1990
to 2030 for nine counties where stations are planned in the corridor. The goal of this analysis was to
identify which counties have grown vigorously in the past and are expected to experience steady growth
in the future. These findings reveal the degree to which other underlying positive economic
characteristics of the areas exist and will provide a solid base of economic activity for HST service to
further catalyze them. The following bullets summarize relationships between population and job
growth between the historical and forecast periods.9
1) All counties in the corridor are forecast to have higher average annual percentage job growth
between 2010 and 2030 than they experienced between 1990 and 2010. Due to the recent
recession and related job losses between 2007and 2009, zero growth was realized in the
aggregated nine counties between 1990 and 2010. This area is forecast to grow by 0.9%
annually between 2010 and 2030. It is notable that significant losses in Los Angeles County
between 1990 and 2010 counterbalanced relatively small gains in most of the other counties.10
9 Employment and population data from Global Insight, US Regional – 30 Year County Forecasts, 7/6/2011.
10 It is notable that significant losses in Los Angeles County between 1990 and 2010 counterbalanced relatively
small gains in most of the other counties. If Los Angeles County and the 365,000 jobs it lost between 1990 and 2010 are excluded from this calculation, the remaining 8 counties grew at a CAGR of 0.5%.

DRAFT
CALIFORNIA HIGH SPEED RAIL AUTHORITY 38
2) All counties in the corridor are forecast to have lower percentage population growth between
2010 and 2030 than they experienced between 1990 and 2010. The CAGR of the total of the
nine counties was 0.8% between 1990 and 2010 and is forecast to be 0.6% between 2010 and
2030.
3) Between 1990 and 2010, all of the nine counties experienced higher average annual population
growth than job growth. Seven of the nine counties are forecast to have higher job growth than
population growth between 2010 and 2030 (Merced and Tulare do not).
4) Some of the most populous counties (including the SF peninsula counties, Los Angeles, and
Orange counties) are expected to achieve slower percentage job and population growth than
the other counties in the corridor, however, Los Angeles and Orange counties alone are
expected to account for 51% of and 59% of total corridor population and job growth,
respectively.
As noted in Figure 1, the highest quantity job growth is expected in Santa Clara, Los Angeles, and Orange
counties which are expected to add 255,000, 553,000, and 344,000 jobs between 2010 and 2030,
respectively. Higher percentage growth is expected in some of the San Joaquin Valley counties but
these counties have relatively small bases from which to grow.
FIGURE 1: Historical and Forecast Job Growth in Phase 1 Corridor Counties
Source: Global Insight / PB Analysis
Forecast population growth trends by geography, shown in Figure 2, are similar to those of jobs outlined
above. San Francisco and San Mateo counties are the only two of the nine with higher quantities of jobs
expected between 2010 and 2030 than population.
Station Name County Absolute CAGR Absolute CAGR 2030 Total
San Francisco (Transbay) San Francisco County -28.8 -0.3% 106.8 0.9% 634.9
San Francisco (4th & King) San Francisco County -28.8 -0.3% 106.8 0.9% 634.9
Millbrae San Mateo County 11.1 0.2% 49.5 0.7% 357.7
Mid-Peninsula San Mateo County 11.1 0.2% 49.5 0.7% 357.7
San Jose Santa Clara County 25.7 0.2% 254.5 1.3% 1,093.4
Gilroy Santa Clara County 25.7 0.2% 254.5 1.3% 1,093.4
Merced Merced County 12.4 1.3% 21.4 1.6% 76.9
Fresno Fresno County 55.3 1.1% 83.6 1.3% 363.3
Visalia Tulare County 22.9 1.2% 35.5 1.5% 140.8
Bakersfield Kern County 53.7 1.4% 83.9 1.6% 308.3
Palmdale Los Angeles County -365.2 -0.5% 552.5 0.7% 4,323.3
San Fernando Valley Los Angeles County -365.2 -0.5% 552.5 0.7% 4,323.3
Los Angeles Union Station Los Angeles County -365.2 -0.5% 552.5 0.7% 4,323.3
Norwalk Los Angeles County -365.2 -0.5% 552.5 0.7% 4,323.3
Anaheim Orange County 180.3 0.7% 343.9 1.1% 1,696.9
-32.6 0.0% 1,531.6 0.9% 8,995.6
1990-2010 (historical) 2010-2030 (forecast)Surrounding County Employment Growth (thousands)

DRAFT
CALIFORNIA HIGH SPEED RAIL AUTHORITY 39
FIGURE 2: Historical and Forecast Population Growth in Phase 1 Corridor Counties
Source: Global Insight / PB Analysis
Ridership Potential and Multimodal Connections
Literature on HSR station development suggests that stations served by HSR in combination with other
modes of transportation (including local and regional transit, automobiles, and bike/pedestrian access)
are more likely to realize high concentrations of mixed use development in the immediate vicinity. This
finding is supported by the market view that the more modes of transportation are present in a given
area, the greater diversity of peoples’ transportation needs can be met and the more valuable the area
becomes from a development standpoint. Given this assertion and the potential ability to evaluate
Phase 1 station development prospects based on the number of additional transportation modes that
would be available, analysis was performed to test the value of multimodal connections using job
growth in certain Bay Area counties.
Local transit connections are expected to be critical to the success of the HST service, with about 16%
(17,500 trips) of Phase 1 system boardings expected to be fed to the stations by regional and local
transit, as noted in Figure 6. At stations where transit is more prevalent, such as San Francisco, San Jose,
and Los Angeles, this percentage is expected to be high, e.g. 25% to 30%. Convenient transit
connections will expand the catchment area for high-speed rail, allow travelers to easily get to their
destinations, and attract more riders to the system. Generally, rail service and/or dense bus networks
will serve to draw passengers out of their cars. Further, adequate transit connections will reduce the
need for parking around stations, leaving more land for development. Finally, large inter-modal hubs
have the potential to become destinations in their own right, beyond their function as a central node on
the transportation network.
Station Name County Absolute CAGR Absolute CAGR 2030 Total
San Francisco (Transbay) San Francisco County 82.1 0.5% 74.0 0.4% 880.8
San Francisco (4th & King) San Francisco County 82.1 0.5% 74.0 0.4% 880.8
Millbrae San Mateo County 68.6 0.5% 47.2 0.3% 767.0
Mid-Peninsula San Mateo County 68.6 0.5% 47.2 0.3% 767.0
San Jose Santa Clara County 289.0 0.9% 339.8 0.9% 2,129.8
Gilroy Santa Clara County 289.0 0.9% 339.8 0.9% 2,129.8
Merced Merced County 76.9 1.8% 104.9 1.7% 362.4
Fresno Fresno County 260.5 1.6% 256.4 1.2% 1,191.4
Visalia Tulare County 129.5 1.7% 165.4 1.6% 610.2
Bakersfield Kern County 292.6 2.1% 294.8 1.5% 1,139.3
Palmdale Los Angeles County 949.2 0.5% 734.6 0.4% 10,569.5
San Fernando Valley Los Angeles County 949.2 0.5% 734.6 0.4% 10,569.5
Los Angeles Union Station Los Angeles County 949.2 0.5% 734.6 0.4% 10,569.5
Norwalk Los Angeles County 949.2 0.5% 734.6 0.4% 10,569.5
Anaheim Orange County 598.6 1.1% 484.6 0.7% 3,506.3
2,746.9 0.8% 2,501.7 0.6% 21,156.5
1990-2010 (historical) 2010-2030 (forecast)County Population Growth (thousands)
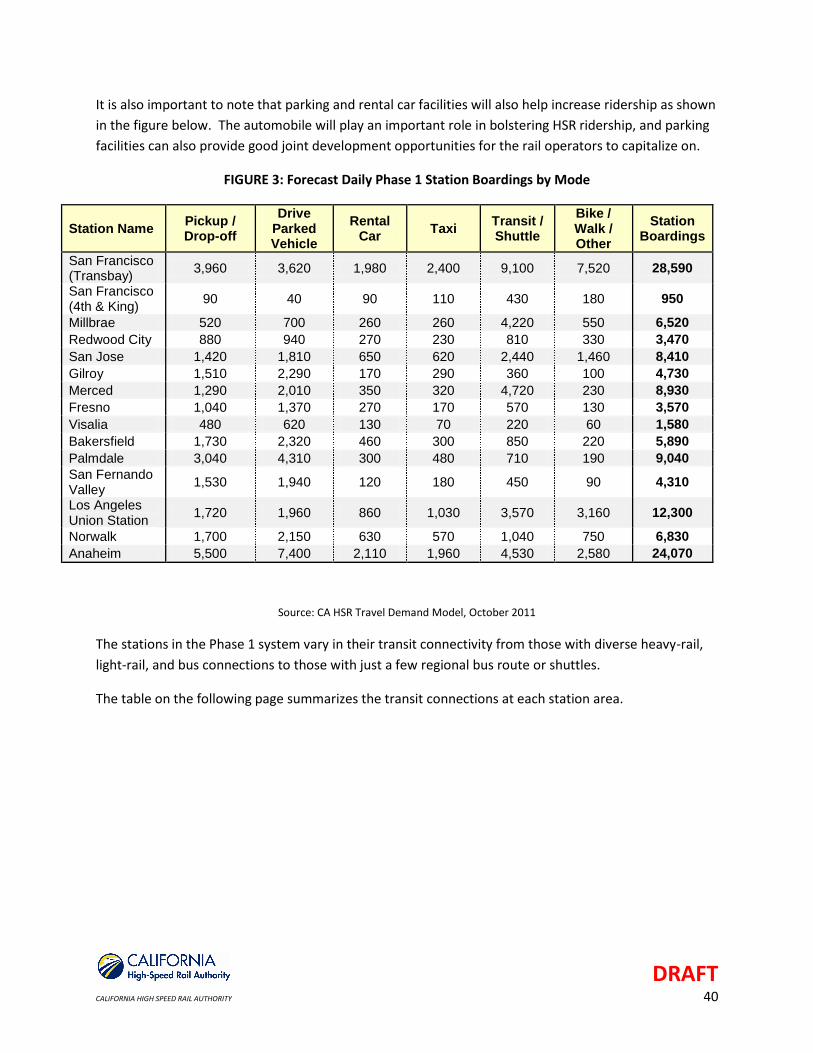
DRAFT
CALIFORNIA HIGH SPEED RAIL AUTHORITY 40
It is also important to note that parking and rental car facilities will also help increase ridership as shown
in the figure below. The automobile will play an important role in bolstering HSR ridership, and parking
facilities can also provide good joint development opportunities for the rail operators to capitalize on.
FIGURE 3: Forecast Daily Phase 1 Station Boardings by Mode
Station Name Pickup / Drop-off
Drive Parked Vehicle
Rental Car
Taxi Transit / Shuttle
Bike / Walk / Other
Station Boardings
San Francisco (Transbay)
3,960 3,620 1,980 2,400 9,100 7,520 28,590
San Francisco (4th & King)
90 40 90 110 430 180 950
Millbrae 520 700 260 260 4,220 550 6,520
Redwood City 880 940 270 230 810 330 3,470
San Jose 1,420 1,810 650 620 2,440 1,460 8,410
Gilroy 1,510 2,290 170 290 360 100 4,730
Merced 1,290 2,010 350 320 4,720 230 8,930
Fresno 1,040 1,370 270 170 570 130 3,570
Visalia 480 620 130 70 220 60 1,580
Bakersfield 1,730 2,320 460 300 850 220 5,890
Palmdale 3,040 4,310 300 480 710 190 9,040
San Fernando Valley
1,530 1,940 120 180 450 90 4,310
Los Angeles Union Station
1,720 1,960 860 1,030 3,570 3,160 12,300
Norwalk 1,700 2,150 630 570 1,040 750 6,830
Anaheim 5,500 7,400 2,110 1,960 4,530 2,580 24,070
Source: CA HSR Travel Demand Model, October 2011
The stations in the Phase 1 system vary in their transit connectivity from those with diverse heavy-rail,
light-rail, and bus connections to those with just a few regional bus route or shuttles.
The table on the following page summarizes the transit connections at each station area.

DRAFT
CALIFORNIA HIGH SPEED RAIL AUTHORITY 41
FIGURE 4 – Multimodal Connections
Station Agency Bus Light Rail Heavy Rail Intercity Bus Intercity Rail Airport
SFMTA (Muni)
BART
Caltrain
AC Transit
Golden Gate Transit
Greyhound
Amtrak Shuttle Likely
SFMTA (Muni) Weekday Only
Caltrain
Amtrak Shuttle
Caltrain
BART
SamTrans
SFO Airport Via BART
Caltrain
SamTrans
VTA Only if MV
Caltrain
VTA
MST
ACE
Amtrak
Caltrain Limited Service
VTA Limited Service
MST Limited Service
County Express
Amtrak
Greyhound
The Bus
YARTS Route to Yosemite
Greyhound
Amtrak Yosemite Only
FAX
Clovis Stage Line Limited Service
Coalinga Transit Limited Service
Amtrak
KART/TCAT
Greyhound
Amtrak Hanford & Visalia Only if Hanford
GET Bus
Kern Regional Transit
Greyhound
Amtrak
AVTA
Santa Clarita Transit Limited Service
Metrolink
Greyhound
Amtrak
PMD Airport Planned Access
LA MTA (Metro)
Burbank Bus/Beeline Limited Service
Metrolink
Greyhound
Amtrak
BUR Airport
LA MTA (Metro) LRT and BRT
Big Blue Bus
Foothill Transit
Torrance Transit
LA DOT Limited Service
OCTA Limited Service
AVTA Limited Service
Santa Clarita Transit Limited Service
Metrolink
California Shuttle Bus
Amtrak
LAX Airport Via Shuttle
Metro
Norwalk Transit
Metrolink
OCTA
Metrolink
Amtrak
Los Angeles Union Station
Norwalk (Potential)
Anaheim
Merced (Downtown Transportation
Center)
Fresno
Visalia/Hanford/Tulare
Bakersfield
Palmdale
San Fernando Valley
(Sylmar/Burbank/Burbank
Airport/Glendale)
Gilroy (ONLY FOR DOWNTOWN
STATION)
San Francisco (Transbay)
San Francisco (4th & King)
Millbrae
Mid-Peninsula (Redwood City/Palo
Alto/Mountain View)
San Jose

DRAFT
CALIFORNIA HIGH SPEED RAIL AUTHORITY 42
Planning and Development Capacity
To help evaluate potential development around stations on the California High-Speed Rail system,
existing plans were identified and included in the analysis. Like the stations themselves, the station plans
vary greatly among the different cities. Some stations, such as the San Francisco Transbay Terminal and
Anaheim Platinum Triangle, are part of larger redevelopment plans that encompass whole
neighborhoods. Meanwhile, there are other cities, such as the Mid-Peninsula station and San Fernando
station(s), where the station locations have not yet been finalized. Given the range of station locations
(downtown or city edge), purposes (hub, terminus, or pass-through), and surrounding neighborhoods
(commercial, residential, industrial, or mixed use), it was important to evaluate both the stations and
the station plans in the context of their surroundings. The following is a summary of the existing status
of station area plans for the Phase 1 corridor. It is important to note that these station area plans are
likely to change in the near future as the Authority is preparing to sign several Station Area Planning
Funding Agreements cities in the corridor.

DRAFT
CALIFORNIA HIGH SPEED RAIL AUTHORITY 43
FIGURE 5 - Station Area Development Plans
San Francisco Transbay Terminal – Preliminary construction work has begun on the redevelopment of
the old Transbay Terminal into the Transbay Transit Center. The plans call for a new inter-modal hub and
Station Name Station Category
Station Specific Plan Capacity
Competitive Factor
San Francisco (Transbay) City Center Yes -
Advanced
- 2600 Residential DU - 3 million SF Office - 100,000 SF Retail
San Francisco (4th & King) Urban Activity Center No Station site not
identified
Millbrae Urban Activity Center Yes - Advanced
- 640 Residential DU - 1.1 Million SF Mixed Commercial (PB estimate)
Mid-Peninsula Developed Urban Area No Station site not identified
San Jose Urban Activity Center Yes - Advanced
- 2590 Residential DU - 5 million SF Office - 420,000 SF Retail
Gilroy Outlying Area - Rail Transit No Station site not identified
Merced Outlying Downtown No Station site not identified
Fresno Outlying Downtown Yes - Preliminary
- 685 Residential DU - 320,000 SF Office - 141,000 SF Retail
Visalia Outlying Area - No Rail Transit No Station site not
identified
Bakersfield Outlying Downtown Yes - Preliminary
- 300 Residential DU - 900,000 SF Mixed Commercial (PB estimate)
Palmdale Outlying Area - Rail Transit No Station site not identified
San Fernando Valley Outlying Area - Rail Transit No Station site not
identified
Los Angeles Union Station City Center Yes -
Preliminary
- Residential DU - Entitlements for 5+ million SF of Commercial Space
Norwalk Developed Urban Area No
Anaheim Urban Activity Center Yes - Advanced
- 520 Residential DU - 2.2 million SF Office - 360,000 SF Retail

DRAFT
CALIFORNIA HIGH SPEED RAIL AUTHORITY 44
several new towers that will expand the Financial District south of Market Street. The plan includes
2,600 residential units, 3 million sq. ft. of commercial space, and 100,000 sq. ft. of retail. The Transbay
Transit Center is located in a mature area of San Francisco County where very dense office, retail, and
residential development already exists. The redevelopment being contemplated would add a significant
amount of new space and could be large enough to impact residential and office rents in the extended
station area.
San Francisco (4th and King) – The City of San Francisco is currently studying development
opportunities in the 4th and King Station area. In 2010, the City embarked on a “Fourth and King Street
Railyards” study which to-date has published a draft “Opportunities and Constraints” Report. Some of
the stated goals of the Fourth and King redevelopment area are to: “…capitalize on the potential for air-
rights development over the station in order to forge new connections in the fabric of the city, celebrate
transit, promote a mixed-use 24-hour neighborhood center, provide much needed open space
amenities and create a landmark gateway at the downtown’s south-eastern entrance.” San Francisco is
delaying the completion of the analysis pending the completion of the high speed train environmental
process which includes the 4th and King station area.
Millbrae – The Millbrae station is part of the Millbrae Station Area Specific Plan (MSASP), which
promotes transit-oriented development around the BART and Caltrain station in Millbrae. The plan lays
the groundwork for successful station-area development but will need to be updated to include HSR. In
the immediate station area there are several surface parking lots and underdeveloped parcels totaling
about 16 acres that could be developed at medium to high densities under a TOD plan. This station has
a relatively high percentage of expected HST intra-regional boardings to San Francisco and San Jose.
This could make the Millbrae station a candidate for higher density residential development supported
by population serving commercial development at ground floors. Parking would need to be addressed
with development, possibly through a joint development agreement. BART is currently looking into
several development opportunities on the existing parking lot areas to the east side of the existing rail
line. Hotel and other similar proposals are under evaluation by BART. BART, Samtrans, the City of
Millbrae and the CHSTP project team have been conducting a detailed access study of the site to
understand better the transportation issues and how they would possibly be affected by additional
development and transportation options at the station.
Mid-Peninsula – Redwood City, Palo Alto and Mountain View are all under consideration as potential
HST station locations. Each of the cities has investigated, to some degree, the implications of having a
HST station in their downtowns. Redwood City has long planned for transit oriented development
around its current Caltrain station. The Redwood City Caltrain station is one of the potential sites where
the HST station would be located.
San Jose Diridon Station – San Jose has developed the Diridon Station Area Plan, which proposes the
creation of a new multi-modal station and business center at the location. The plans call for a maximum
development scenario of 4,950,000 sq. ft. of office/commercial, 420,000 sq. ft. of retail/restaurant; 2588

DRAFT
CALIFORNIA HIGH SPEED RAIL AUTHORITY 45
residential units; and 900 hotels rooms. This aggressive plan will require a significant amount of
redevelopment of underutilized sites, including parcels currently containing residences. Coordination
between land use and transportation will be crucial as there are many highway and other transit uses
connecting near the station, along with existing land uses and recreational uses (baseball stadium) that
could result in significantly higher than capacity peak demands during special events.
Gilroy – The station location has not been finalized. The options being evaluated are either a downtown
station or a green-field station outside of Gilroy.
Merced –The HSR line through Merced is located in an industrial portion of the city that the city wishes
to redevelop. The City has applied for station area development funding and will put up local funds. Is
working with the Authority and supports the station and location of the station to promote economic
growth in downtown Merced. California High Speed Rail has also been looking to connect to
conventional rail service coming from the north, but not a rerouting of the San Joaquin.
Fresno – The city has developed a Downtown Plan centered on the HSR station. The plans call for an
increase in density and new mixed-use development with up to 141,000 sq. ft. of retail, 320,000 sq. ft. of
office space, and 705 new residential units.
San Joaquin Valley - The station location has not been finalized. Visalia, Hanford, and Tulare are
possibilities so no concrete station plans have been developed. This is a unique case where the station
is not viewed as promoting TOD, but rather will become a multi-modal hub for bus and ultimately rail
service for Visalia, Tulare, Hanford, Lemore, and even Corcoran.
Bakersfield – Current plans call for the station to be located at the site of the existing Amtrak station on
Truxtun Avenue. The plans point out the potential for concentrating business development in the area
but stop short of identifying specific sites for development. Plans that are now somewhat aged suggest
redevelopment areas that total over a million square feet of development, which would probably occur
over a long horizon with little acceleration resulting from HST service, similar to expectations in Fresno.
Palmdale – Like Gilroy, there are two alternative station locations, and a selection is still to be made.
New development will be dependent both on the success of the station and the new terminal as a
reliever for LAX. There are existing TOD plans for the Metrolink Station about 2.5 miles away but they do
not encompass HST plans.
San Fernando Valley - The station location has not been finalized. Current plans call for a single station
in San Fernando, or near Burbank Bob Hope Airport. The Bob Hope Airport is currently creating
development plans for available land next to the airport that may include HST. Research indicates that
HSR stations can leverage airport serving locations to increase both ridership and development
potential.

DRAFT
CALIFORNIA HIGH SPEED RAIL AUTHORITY 46
Los Angeles Union Station – Catellus, a private development LLC and former owner of LA Union Station
sold the 38 acres and development rights totaling close to 6 million square feet of transit oriented
development to the Los Angeles County Metropolitan Transportation Authority (MTA) in 2011 for
approximately $75 million. Currently three buildings totaling 728,000 square feet of office development
and a small amount of multifamily residential development are located on the site. HST service in this
market has the potential to drive further demand for development, but the relative (to San Francisco)
lack of highly utilized local transit services in Los Angeles and the generally less dense development
pattern may cause redevelopment in the station area to be spread over a longer period of time.
Gateway Cities - The station location has not been finalized. Options include the Norwalk/Santa Fe
Springs or Fullerton Metrolink station sites. While at least some small-scale industrial redevelopment
opportunities exist, the magnitude of large scale redevelopment potential in certain Gateway Cities
communities may be limited.
Anaheim – The Anaheim Station (ARTIC intermodal station) is planned as part of the 20-plus million
square feet Platinum Triangle redevelopment project, which currently has 15 projects at or past the
design stage totaling over 8,000 new residential units, 600,000 square feet of commercial space, and
130 hotel rooms. The 17 acre portion of the Platinum Triangle in the ARTIC zone is expected to be
office-oriented with some retail and residential space, specifically allowing for 520 residential units, 2.2
million square feet of office space, and 360,000 square feet of retail. Overall, the Platinum Triangle
redevelopment program has momentum and is expected to continue regardless of HST access. This is
one of the few stations that could see some more significant office density in the station vicinity with
the addition of HST service, though the HST service is not expected to create demand for net new
development in the area which is heavily developed with office space. One major attribute that the
Anaheim station and HST ridership will benefit from is the concentration of recreational destinations
within close proximity to the station, including Disney Land, Angeles Stadium and the Honda Center.
Summary of Findings
As summarized in Figure 6, known station area plans through the high speed rail corridor identify
approximately 18 million square feet of potential commercial development, and over 7,000 potential
dwelling units, combined for all stations with known plans. Virtually all of this planned development
would be built in transit oriented, more clustered development configurations.
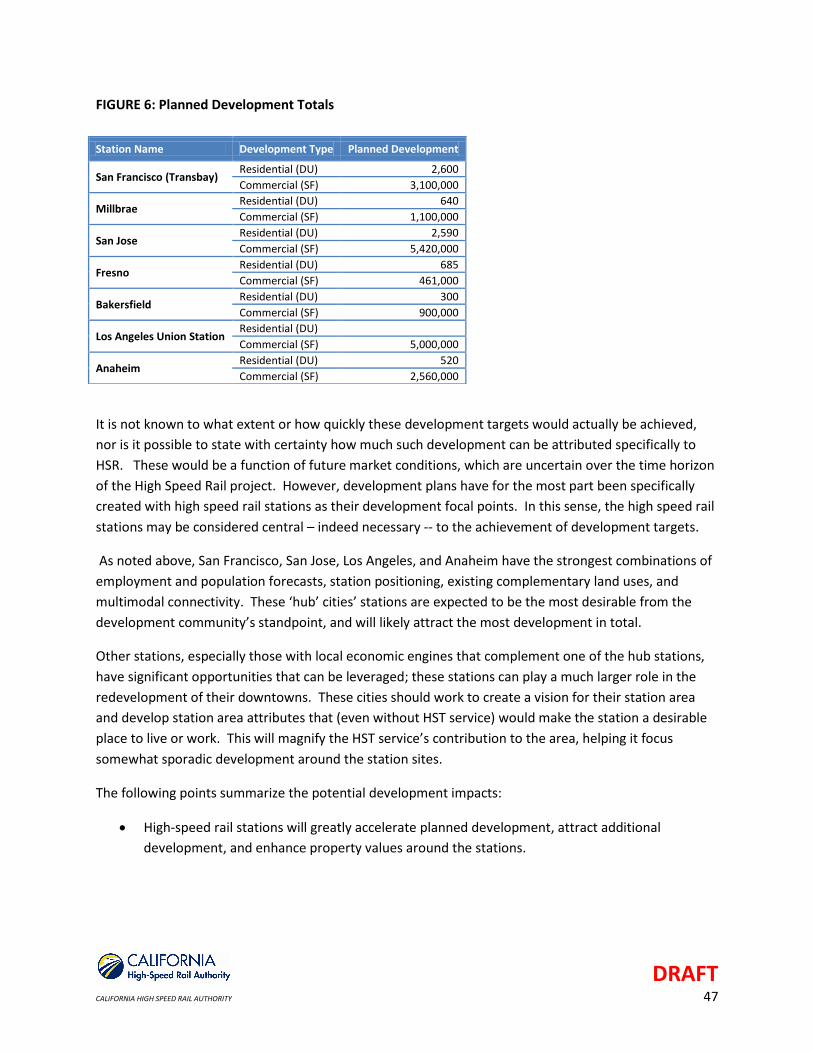
DRAFT
CALIFORNIA HIGH SPEED RAIL AUTHORITY 47
FIGURE 6: Planned Development Totals
It is not known to what extent or how quickly these development targets would actually be achieved,
nor is it possible to state with certainty how much such development can be attributed specifically to
HSR. These would be a function of future market conditions, which are uncertain over the time horizon
of the High Speed Rail project. However, development plans have for the most part been specifically
created with high speed rail stations as their development focal points. In this sense, the high speed rail
stations may be considered central – indeed necessary -- to the achievement of development targets.
As noted above, San Francisco, San Jose, Los Angeles, and Anaheim have the strongest combinations of
employment and population forecasts, station positioning, existing complementary land uses, and
multimodal connectivity. These ‘hub’ cities’ stations are expected to be the most desirable from the
development community’s standpoint, and will likely attract the most development in total.
Other stations, especially those with local economic engines that complement one of the hub stations,
have significant opportunities that can be leveraged; these stations can play a much larger role in the
redevelopment of their downtowns. These cities should work to create a vision for their station area
and develop station area attributes that (even without HST service) would make the station a desirable
place to live or work. This will magnify the HST service’s contribution to the area, helping it focus
somewhat sporadic development around the station sites.
The following points summarize the potential development impacts:
High-speed rail stations will greatly accelerate planned development, attract additional
development, and enhance property values around the stations.
Station Name Development Type Planned Development
San Francisco (Transbay) Residential (DU) 2,600
Commercial (SF) 3,100,000
Millbrae Residential (DU) 640
Commercial (SF) 1,100,000
San Jose Residential (DU) 2,590
Commercial (SF) 5,420,000
Fresno Residential (DU) 685
Commercial (SF) 461,000
Bakersfield Residential (DU) 300
Commercial (SF) 900,000
Los Angeles Union Station Residential (DU)
Commercial (SF) 5,000,000
Anaheim Residential (DU) 520
Commercial (SF) 2,560,000

DRAFT
CALIFORNIA HIGH SPEED RAIL AUTHORITY 48
The majority of development will occur at selected major downtown stations in the Bay Area
(e.g., Transbay Terminal), around Union Station in Los Angeles, and in cities that are close to the
hubs such as San Jose.
Central Valley stations can capitalize on advantages from lower land and labor costs. New
manufacturing, recreational, tourism, and residential development and back office uses can be
especially suitable for Central Valley locations.
Station area development will include acceleration of planned development, higher commercial
densities, increased property valuation, and higher employment densities.
While the full development potential of the station sites is very large based on station area planning
objectives, there are many external factors that must be coordinated for strong positive station area
development impacts to occur, including:
Proper station area land use planning to create capacity for development, either through
redevelopment or supporting new local infrastructure development,
Station identity and positioning within the rail system, for instance, developing a station as an
origin, destination, or combination of both could help coordinate and guide development
Provisions for tax relieve or other development incentives,
Providing multimodal connections to the station site to increase ridership and user friendliness,
Local economic strength, meaning that industrial diversity and a healthy job base are important
for any community to grow, regardless of its transportation options to other areas.


![The Arts: A Competitive Advantage for California IIcac.ca.gov/artsinfo/files/Economic Impact [Full].pdfA Competitive Advantage for California II, will reveal that the impact of nonprofit](https://img.pdfslide.us/doc/110x75/5e2920cf4d1c243df25cf8cd/the-arts-a-competitive-advantage-for-california-iicaccagovartsinfofileseconomic.jpg)