Embed Size (px)
Citation preview

Economic Growth & Poverty in Nigeria Caitlin Aylward, Pierre Biscaye, EPAR Technical Report #327 Audrey Lawrence, Mia Neidhardt
C. Leigh Anderson, & Travis Reynolds Professor C. Leigh Anderson, Principal Investigator
Professor Travis Reynolds, co-Principal Investigator March 22, 2016
EPAR uses an innovative student-faculty team model to provide rigorous, applied research and analysis to international development stakeholders. Established in 2008, the EPAR model has since been emulated by other UW schools and
programs to further enrich the international development community and enhance student learning.
Please direct comments or questions about this research to Principal Investigators Leigh Anderson and Travis Reynolds at [email protected].
EVANS SCHOOL POLICY ANALYSIS AND RESEARCH (EPAR) 1
Key findings
Many scholars find empirically that in cross-country studies economic growth is associated with poverty
reduction, yet countries such as Nigeria provide exceptions.
Some studies identify factors that appear to limit the impact of economic growth on poverty reduction,
including high initial income inequality, a reliance on non-labor-intensive sectors for growth, low human
capital, low government expenditure on social services, and lack of openness to the world economy.
Scholars studying Nigeria do not agree on the relationship between economic growth and poverty in the
country. Some find a positive association between GDP and poverty reduction, though there is
disagreement on the direction of causality. Most studies, however, find that GDP and poverty are
unrelated, or that poor quality data make it difficult to empirically test the relationship.
Factors hypothesized to influence the relationship between economic growth and poverty in Nigeria
include the large role of the crude oil sector in the economy, persistent high unemployment, corruption,
and poor educational and health status. These same factors may drive the country’s high economic
inequality, mentioned as both a factor in growth failing to reduce poverty, and an indicator.
Using data from the World Bank and the Nigerian National Bureau of Statistics, we find that Nigeria’s
GDP per capita (PPP) grew by nearly 70% from 1992-2009, but that the poverty headcount ratio was
relatively stagnant, falling by 6% during this period. These trends are generally robust to different
measures of economic growth and poverty.
We observe that the growth elasticity of poverty (the ratio of change in poverty to change in the size of
the economy or average incomes) varies widely across time periods where poverty data are available.
We find some differences in this growth elasticity depending on the measure of poverty and growth, but
observe that overall there is no consistent relationship.
Growth elasticities of poverty are generally positive from 1992-1996, indicating rising poverty along with
economic growth, but are negative from 1996-2003 and are close to 0 from 2003-2009. While economic
growth is associated with poverty reduction over the full 1992-2009 period, the elasticities generally fall
between 0 and -0.5, meaning that poverty measures have fallen by only a fraction of the amount that
Nigeria’s economy has grown.
Findings suggest that movements in per capita income may not be a valid or consistent proxy for poverty
reduction in aid allocation formulas that exclude poverty measures.
EVANS SCHOOL POLICY ANALYSIS AND RESEARCH (EPAR)
2
Abstract
Common aid allocation formulas incorporate measures of income per capita but not measures of poverty, likely
based on the assumption that rising average incomes are associated with reduced poverty. If declining poverty
is the outcome of interest, however, the case of Nigeria illustrates that such aid allocation formulas could lead
to poorly targeted or inefficient aid disbursements. Using data from the World Bank and the Nigerian National
Bureau of Statistics, we find that while the relationship between economic growth and poverty in Nigeria varies
depending on the time period studied, overall from 1992-2009 Nigeria’s poverty rate has only declined by 6%
despite a 70% increase in per capita gross domestic product (GDP). A review of the literature indicates that
income inequality, the prominence of the oil sector, unemployment, corruption, and poor education and health
in Nigeria may help to explain the pattern of high ongoing poverty rates in the country even in the presence of
economic growth. Our analysis is limited by substantial gaps in the availability of quality data on measures of
poverty and economic growth in Nigeria, an issue also raised in the literature we reviewed, but our findings
support arguments that economic growth should not be assumed to lead to poverty reduction and that the
relationship between these outcomes likely depends on contextual factors.
Introduction
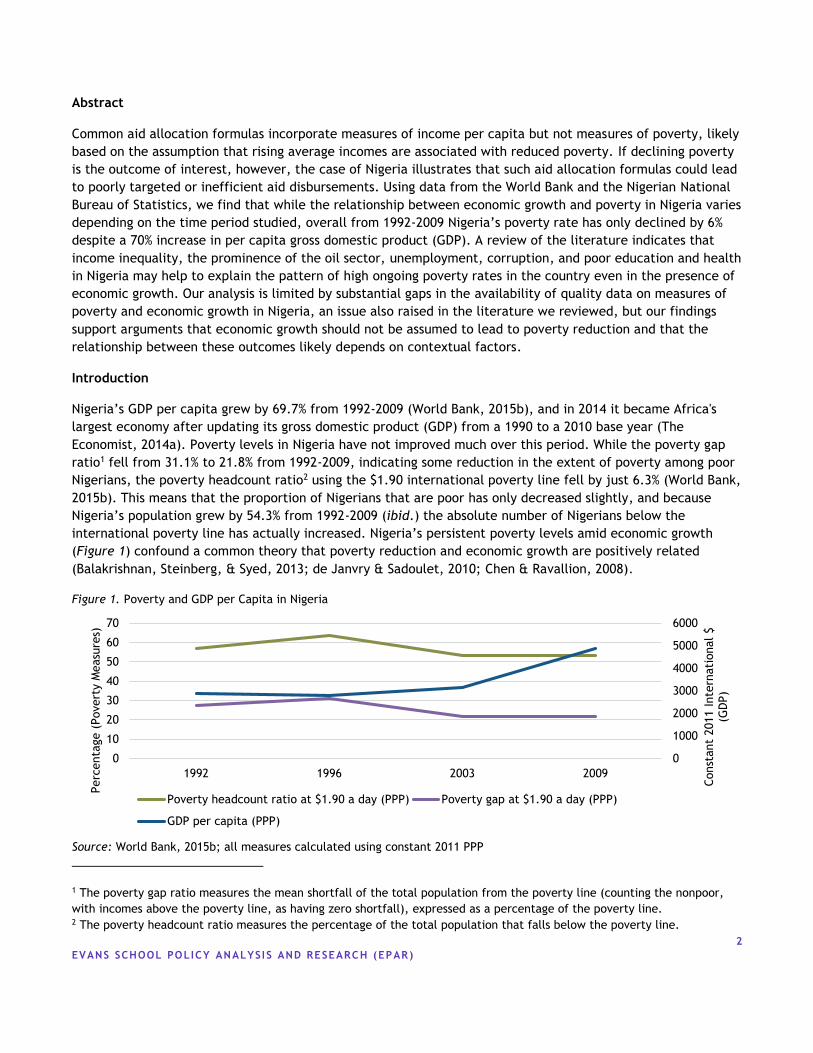
Nigeria’s GDP per capita grew by 69.7% from 1992-2009 (World Bank, 2015b), and in 2014 it became Africa's
largest economy after updating its gross domestic product (GDP) from a 1990 to a 2010 base year (The
Economist, 2014a). Poverty levels in Nigeria have not improved much over this period. While the poverty gap
ratio1 fell from 31.1% to 21.8% from 1992-2009, indicating some reduction in the extent of poverty among poor
Nigerians, the poverty headcount ratio2 using the $1.90 international poverty line fell by just 6.3% (World Bank,
2015b). This means that the proportion of Nigerians that are poor has only decreased slightly, and because
Nigeria’s population grew by 54.3% from 1992-2009 (ibid.) the absolute number of Nigerians below the
international poverty line has actually increased. Nigeria’s persistent poverty levels amid economic growth
(Figure 1) confound a common theory that poverty reduction and economic growth are positively related
(Balakrishnan, Steinberg, & Syed, 2013; de Janvry & Sadoulet, 2010; Chen & Ravallion, 2008).
Figure 1. Poverty and GDP per Capita in Nigeria
Source: World Bank, 2015b; all measures calculated using constant 2011 PPP
1 The poverty gap ratio measures the mean shortfall of the total population from the poverty line (counting the nonpoor,
with incomes above the poverty line, as having zero shortfall), expressed as a percentage of the poverty line. 2 The poverty headcount ratio measures the percentage of the total population that falls below the poverty line.
0
1000
2000
3000
4000
5000
6000
0
10
20
30
40
50
60
70
1992 1996 2003 2009
Const
ant
2011 Inte
rnati
onal $
(GD
P)
Perc
enta
ge (
Povert
y M
easu
res)
Poverty headcount ratio at $1.90 a day (PPP) Poverty gap at $1.90 a day (PPP)
GDP per capita (PPP)
EVANS SCHOOL POLICY ANALYSIS AND RESEARCH (EPAR)
3
A review of recent literature offers several hypotheses about what factors affect the relationship between GDP
and poverty in Nigeria. Oil exports from the Niger Delta played a large role in Nigerian economic growth over
the past few decades but the unequal distribution of revenues has contributed to economic inequality (Oseni &
Osen, 2015). Growth from more labor-intensive sectors such as agriculture, which is more likely to support the
employment and incomes of the poor, has not kept pace with rural population growth (World Bank, 2014c). In
addition, the government relies heavily on tax revenues from the oil industry which make up nearly 75% of the
government's revenue, hence fluctuations in oil prices hamper the government's ability to invest in health,
education, and infrastructure, which presents a challenge to poor Nigerians seeking public services as part of
an escape from poverty (Kottasova, 2015; Leo, 2014). Economic conditions are particularly bleak in the rural
north and have worsened due to ongoing security concerns related to the Boko Haram insurgency, exacerbating
geographic income inequality (Johnson, 2013; Bourne, 2015). Though the 2014 GDP rebasing revealed growth in
sectors other than oil, such as telecommunications and other services, unemployment remains high as job
creation has not kept up with population growth (World Bank, 2013a). Further, corruption is argued to have
hindered employment opportunities and the provision of public services such as health and education (Bakare,
2015; Leke et al, 2014; Barungi, 2014).
In this paper, we explore the arguments and evidence for which factors influence the relationship between
economic growth and poverty in Nigeria. We begin with a review of the literature on growth and poverty,
including what factors are commonly hypothesized to affect this relationship. Next, we discuss the implications
of different approaches to measuring economic growth and poverty and calculate growth elasticities of poverty
using data from the World Bank and Nigerian Bureau of Statistics, to estimate the association between
measures of economic growth and poverty reduction in Nigeria. Then, we review the literature on economic
growth and poverty in Nigeria and summarize the arguments on what factors may be influencing the
relationship between these outcomes. Finally, we review aid allocation trends to Nigeria and consider how aid
allocation formulas that include measures of income per capita but not poverty may lead to less efficient aid
disbursements.
Literature Review
In an early empirical study of economic growth and income, Kuznets (1963) found that there was greater
income inequality in developing countries than in developed countries, especially in the non-agricultural
sector. While he argued that income inequality could either support or hinder economic growth, he found that
generally as national wealth grew there was evidence of declining income inequality in developed countries,
but increasing income inequality in developing countries, at least up to a threshold (“turning point”) per capita
income level after which additional economic growth would again be associated with declining inequality. He
hypothesized that “in the early stages of economic development, income distribution tends to worsen and does
not improve until countries reach middle-income status.” Other scholars used this hypothesis as a basis for
arguing that the poor might not benefit from economic growth in developing countries below this middle-
income status (Adams, 2004). Cross-country studies from the 1970s supported this hypothesis, finding in
general that economic growth did increase income inequality - and did not reduce poverty - in low-income
countries (Chenery et al., 1974; Adelman & Morris, 1973).
More recently, several studies using cross-country time series data have found a positive relationship between
economic growth and poverty reduction (Dollar & Kraay, 2002; Bourguignon, 2002; Chen & Ravallion, 2008; de
Janvry & Sadoulet, 2010; Balakrishnan, Steinberg, & Syed, 2013). These studies generally find that economic
growth is not significantly associated with rising income inequality in developing countries, and has some
positive association with poverty reduction (Adams, 2004). Most of these studies measure country inequality

EVANS SCHOOL POLICY ANALYSIS AND RESEARCH (EPAR)
4
with the Gini coefficient - a commonly used measure that varies between 0, which reflects complete equality,
and 1, which indicates complete inequality (World Bank, 2015c). According to Deininger & Squire (1996), GDP
per capita increased by 2.16% per year in the developing world during 1985-95, while the average annual
change in the Gini coefficient was only 0.28% over the same period. Ferreira & Ravallion (2008) find that
between 1981 and 2004 there was no correlation between economic growth rates and changes in inequality
worldwide.
Several authors report direct associations between economic growth and poverty reduction. Kraay (2006) finds
that “between 69 percent and 97 percent of cross-country differences in poverty changes [across 49 developing
countries] can be accounted for by growth” (p. 215). De Janvry & Sadoulet (2010) find that GDP growth
originating in agriculture across 42 countries induces significant expenditure growth among the poorest 40% of
the population, and estimate an impact on this poorer population approximately on the order o three times
larger than the effect of growth originating in the rest of the economy. Roemer & Gugerty (1997) use data from
26 developing countries from the 1960s-1990s and find that GDP growth of 10% per year is associated with
income growth of 10% per year for the poorest 40% of the population. Balakrishnan, Steinberg, & Syed (2013)
use regression analysis to examine the log share of the income distribution of the bottom quintile across Brazil,
China, India, Indonesia, Russia and Mexico from 1990 to 2010, concluding that per capita income growth is a
key driver of incomes in the poorest fifth of these populations, despite significant variation among countries.
Some studies emphasize that the relationship between economic growth and poverty reduction varies between
countries. Chen & Ravallion (2008) highlight that global estimates are heavily influenced by trends in the
largest countries. They find that high growth in populous countries like China and India has contributed much
to the fall of absolute poverty worldwide from 1981-2005, even as poverty reduction in other countries has
stalled. Wieser (2011) finds that many countries experience limited poverty reduction in spite of high growth
rates, and argues that economic growth is not a sufficient condition for reductions in poverty.
The growth elasticity of poverty is one representation of the relationship between economic growth and
poverty in a given country. Wieser (2011) defines the growth elasticity of poverty as the percentage change in
the poverty headcount index, divided by the total percentage change in per capita GDP within the same time
frame. The general World Bank (2011) formula is below, where P is a poverty measure (often the headcount
index), and Y is an income measure (often per capita GDP):
∈ = 𝜕𝑃
𝜕𝑌 𝑌
𝑃
Estimates of the mean growth elasticity of poverty in developing countries range from -2 (Bruno et al., 1998) to
-5 (Bhalla, 2002), indicating that a 1% increase in GDP would lead to between a 2% and 5% reduction in the
proportion of the population that is poor. Adams (2004) analyzes GDP and poverty data of 60 developing
countries and finds that the growth elasticity of poverty tends to range from -1 to -5. He adds that the choice
of measures can significantly affect the results, noting that if economic growth is measured using changes in
survey mean income or consumption, there is a much stronger statistical association between growth and
reduced poverty than if growth is measured by changes in GDP per capita.
Several authors argue that the size of the effect of economic growth on poverty reduction depends on initial
levels of income inequality (Adams, 2004; Balakrishnan, Steinberg, & Syed, 2013). Islam (2004) contends that
high growth is “not a sufficient condition for poverty reduction; the pattern and sources of growth as well as
the manner in which its benefits are distributed are equally important.” In a recent analysis of economic
inequality and growth in Asia, Balakrishnan, Steinberg, & Syed (2013) find that “inequality interacts with
income, meaning that a higher level of inequality tends to reduce the impact of income growth on poverty
EVANS SCHOOL POLICY ANALYSIS AND RESEARCH (EPAR)
5
reduction” (p. 28). Specifically, they find that poverty fell fastest in China during a period of low initial income
inequality from the early 1980s through mid-1990s, after which poverty reduction slowed as inequality
increased. The authors also look at India during the same period, and cite higher initial levels of inequality—
particularly education, health and gender inequality—as a factor influencing less inclusive, or sector-specific,
growth that resulted in slower poverty reduction in disadvantaged groups. Gupta, Davoodi, & Alonso-Terme
(2002) find that an increase of one standard deviation in corruption increases income inequality and reduces
income growth of the poor.
Ravallion (1997) uses data from household surveys in 23 developing countries and finds that the higher the
initial income inequality, the smaller the association between a fall in the poverty headcount and economic
growth, and that in countries with particularly high inequality, economic growth may lead to increased
poverty. Adams (2004) uses time series household data from 60 developing countries, and finds that the growth
elasticity of poverty in countries with a low initial Gini (below 0.40) is -5.866, compared to -2.461 in countries
a higher initial Gini (above 0.40), indicating that for a given rate of economic growth, poverty reduction will be
much greater in low-inequality countries.
In a related argument, some authors contend that a country’s initial level of development affects the degree to
which economic growth reduces poverty. They find that countries with higher initial income levels experience
larger poverty reductions for a given rate of economic growth (Son & Kakwani, 2004; Bourguignon, 2003). De
Janvry & Sadoulet (2000) use data from 12 Latin American countries from 1970-1994 and find that income
growth is more effective in reducing poverty if initial levels of poverty are lower.
Researchers have noted that the size of any economic growth and poverty reduction effect depends on a
variety of factors beyond initial inequality (Wieser, 2011). The sectoral composition and diversification of the
economy is a commonly mentioned factor. Van der Ploeg (2011) observes that countries whose economic
growth derives from natural resource endowments, however, still have different economic outcomes. For
example, he argues that while Nigeria’s oil endowments increased oil revenues between 1965 and 2000, weak
institutions and bad macroeconomic performance increased inequality among its citizens, whereas Botswana’s
diamond endowment may have contributed to reduced inequality due in part to strong institutions and public
spending. Though there are several examples of countries escaping the resource curse, like Botswana,
Indonesia, and Thailand, Gylfason & Zoega (2002) generally find that resource dependence in countries with
large natural resource endowments (like oil or diamonds) is correlated with a higher Gini index of inequality,
which in turn is correlated with a lower impact of economic growth on poverty.
Loayza & Raddatz (2010) use data from 55 developing countries from the 1980s-1990s and find that the sectoral
composition of economic growth affects how growth translates into poverty reduction. Their results suggest
that growth driven by labor-intensive sectors such as agriculture, construction, and manufacturing, is
associated with greater reductions in poverty. Dollar & Kraay (2002) hypothesize that “greater labor
productivity in agriculture relative to the rest of the economy may benefit poor people disproportionately to
the extent that the poor are more likely to live in rural areas and derive their livelihood from agriculture” (p.
218). As previously noted, de Janvry & Sadoulet (2010) find that the impact of GDP growth originating in
agriculture on expenditure growth among the poorest 40% of the population is approximately three times larger
than the effect of growth originating in the rest of the economy.
Wieser (2011) identifies several additional hypothesized determinants of the growth elasticity of poverty:
“human capital, foreign direct investment (FDI), government expenditure, investment rate, private sector
composition, institutional quality, urbanization, democracy, and population growth” (p.12). The arguments
related to private sector composition and urbanization are similar to those noted above, namely that growth in
EVANS SCHOOL POLICY ANALYSIS AND RESEARCH (EPAR)
6
labor-intensive employment, all else equal, would lead to greater reductions in poverty. He hypothesizes that
countries with higher levels of human capital are better able to produce higher-paying jobs through social
innovations and diffusion of knowledge, and thereby increase incomes. He postulates that openness to trade
allows developing countries to specialize in production of labor-intensive goods, increasing employment and
thereby reducing poverty. He further hypothesizes that foreign direct investment (FDI) is a source of
knowledge and technology spillovers as well as infrastructure investment for developing countries, reducing
production costs and attracting businesses, thereby increasing employment and reducing poverty. He considers
that government expenditure on health and education and higher investment rates may both reduce poverty
through increases in human capital and productivity. He suggests that institutions and democracy “facilitate
and promote innovation, efficient allocation of resources, investments in infrastructure, education, health and
technology” contribute to poverty reduction by giving individuals the opportunity to benefit from employment
opportunities to increase incomes. Finally, he hypothesizes that population growth would reduce the impact of
economic growth on poverty as less capital is available per worker and therefore productivity and employment
are lower. Balakrishnan, Steinberg, & Syed (2013) similarly highlight government spending on health and
education, the share of income from labor, and returns to human capital as key factors that may limit the
impact of economic growth on poverty reduction in China and India.
Wieser (2011) uses data from 1983-2009 for 65 developing countries to test these hypotheses. He finds that
higher levels of human capital, openness to trade, government expenditure on health and education, and
institutional quality and democracy are all significantly associated with a higher growth elasticity of poverty
reduction. His findings are robust to multiple specifications, though the author notes that he does not adjust
for population size, and uses a measure of the breadth of poverty, the headcount ratio, rather than a measure
of the depth of poverty such as the poverty gap.
The author finds that the biggest contributors to the growth elasticity of poverty are human capital and
openness to the world economy. For human capital, Wieser reports that secondary education has a greater role
in poverty reduction in developing countries than years of schooling or tertiary education, and that the lower
the income of a country, the greater the importance of secondary education. de Janvry & Sadoulet (2000)
support this argument, finding that the effect of income growth on poverty reduction is greater in countries
with higher levels of secondary education. The second factor that Wieser (2011) highlights is openness to trade,
as he finds that countries with a higher ratio of exports to GDP have a significantly higher growth elasticity of
poverty reduction. Roemer & Gugerty (1997) support this argument, finding that countries with sound
macroeconomic policies and greater openness to the world economy may experience a greater impact of
economic growth on poverty reduction.
Economic Growth & Poverty in Nigeria
Measuring Economic Growth
As indicated by Adams (2004), the choice of economic growth measures can significantly affect analyses of the
association between growth and poverty reduction. Though most studies use growth in GDP per capita (e.g.,
Balakrishnan, Steinberg, & Syed, 2013; Wieser, 2011; Bourguignon, 2003; Kraemer & Gugerty, 1997), others use
growth in average incomes from household surveys (e.g., De Janvry & Sadoulet, 2010; Kraay, 2006; Adams,
2004). Some studies also use growth in sectoral value added to GDP to compare the impacts of growth in
different sectors (e.g., De Janvry & Sadoulet, 2010; Loayza & Raddatz, 2010). Adams (2004) finds that
economic growth measured by changes in mean income or consumption from household survey data has a
stronger statistical association with poverty reduction than growth measured by changes in GDP per capita.

EVANS SCHOOL POLICY ANALYSIS AND RESEARCH (EPAR)
7
In this report we begin by considering how the choice of measures may affect estimates of economic growth in
Nigeria. Although there are important accounting and therefore naming distinctions among measures, Gross
Domestic Product (GDP) as a general concept was developed in 1944 to measure the total value of goods and
services produced, and is still used as one of the primary measures of the health of a country’s economy and its
development (Dickinson, 2011). One important distinction among measures is the term “domestic” versus
“national”. GDP measures the flow of income, goods, and services among individuals, firms, and the
government within a nation’s borders regardless of the nationality of the individual or firm. On the other hand,
Gross National Product (GNP) accounts for expenditures or production by a country’s citizens, regardless of
where the activity occurs.
Another alternative measure based on the economic activity of a country’s citizens is Gross National Income
(GNI), which calculates income earned by citizens domestically and adds income earned by citizens working
outside the country less income payments to non-residents in the domestic economy. GNI is considered the
most comprehensive measure of a nation’s income (Bureau of Economic Analysis, 2007). All else equal, the
more a country’s economy attracts inward investment and foreign labor with profits and revenues that flow
back to the countries of origin, the less closely measures of GDP and GNI will track one another. None of the
studies we reviewed use GNI as their measure of economic growth.
Figure 2. Measures of Economic Growth in Nigeria
Source: World Bank, 2015b
We find that World Bank measures of Gross National Income (GNI) and Gross Domestic Product (GDP) in Nigeria
are relatively consistent but differ over time (Figure 2), indicating that there are differences between income
earned domestically by non-citizens and income earned by Nigerians abroad. GDP per capita was greater from
1990-2001, but the relative magnitude of GNI and GDP measures alternated from 2002-2006 and appear nearly
identical from 2006-2013. Trends in per capita measures of GNI and GDP mirror those in total GNI and GDP. All
of these figures are adjusted for Purchasing Power Parity (PPP), a calculation which uses the cost of a common
basket of goods and services to eliminate the differences in price levels between countries, supporting
comparability (OECD, 2015b).
0
1000
2000
3000
4000
5000
6000
0
200
400
600
800
1000
1200
GN
I/G
IP p
er
capit
a,
$
Tota
l G
NI/
GD
P,
$ b
illions
GNI, PPP (constant 2011 international $) GDP, PPP (constant 2011 international $)
GNI per capita, PPP (constant 2011 $) GDP per capita, PPP (constant 2011 $)
EVANS SCHOOL POLICY ANALYSIS AND RESEARCH (EPAR)
8
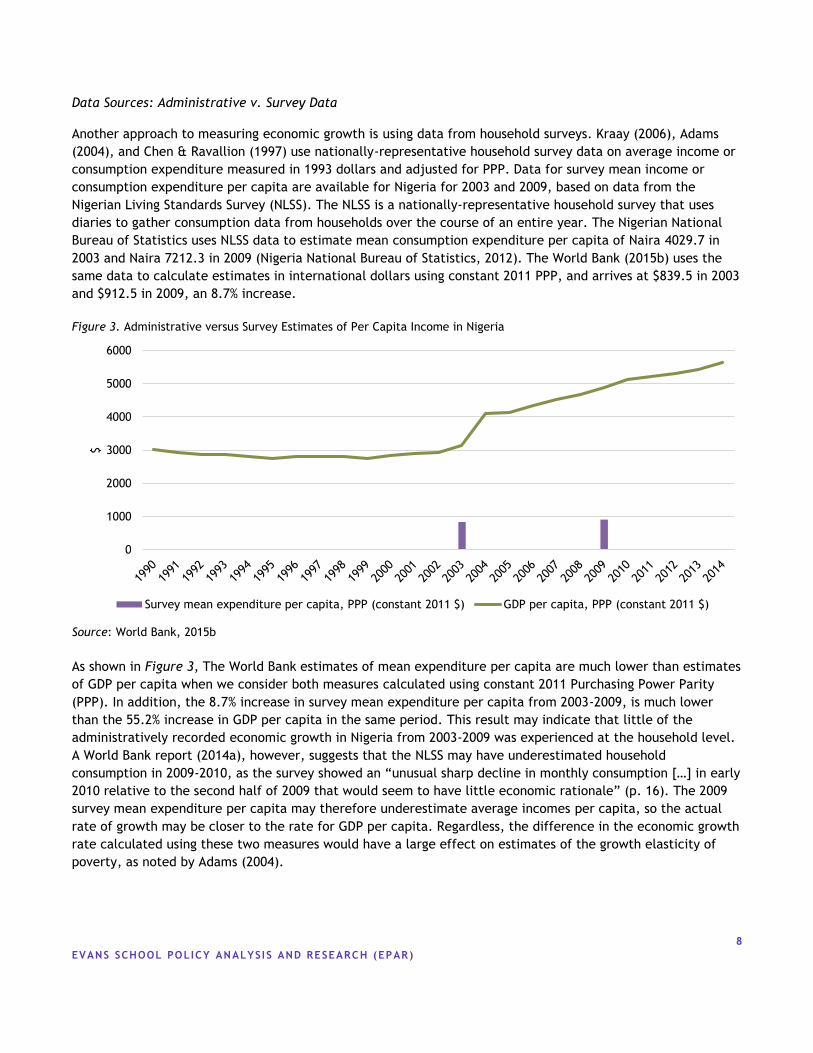
Data Sources: Administrative v. Survey Data
Another approach to measuring economic growth is using data from household surveys. Kraay (2006), Adams
(2004), and Chen & Ravallion (1997) use nationally-representative household survey data on average income or
consumption expenditure measured in 1993 dollars and adjusted for PPP. Data for survey mean income or
consumption expenditure per capita are available for Nigeria for 2003 and 2009, based on data from the
Nigerian Living Standards Survey (NLSS). The NLSS is a nationally-representative household survey that uses
diaries to gather consumption data from households over the course of an entire year. The Nigerian National
Bureau of Statistics uses NLSS data to estimate mean consumption expenditure per capita of Naira 4029.7 in
2003 and Naira 7212.3 in 2009 (Nigeria National Bureau of Statistics, 2012). The World Bank (2015b) uses the
same data to calculate estimates in international dollars using constant 2011 PPP, and arrives at $839.5 in 2003
and $912.5 in 2009, an 8.7% increase.
Figure 3. Administrative versus Survey Estimates of Per Capita Income in Nigeria
Source: World Bank, 2015b
As shown in Figure 3, The World Bank estimates of mean expenditure per capita are much lower than estimates
of GDP per capita when we consider both measures calculated using constant 2011 Purchasing Power Parity
(PPP). In addition, the 8.7% increase in survey mean expenditure per capita from 2003-2009, is much lower
than the 55.2% increase in GDP per capita in the same period. This result may indicate that little of the
administratively recorded economic growth in Nigeria from 2003-2009 was experienced at the household level.
A World Bank report (2014a), however, suggests that the NLSS may have underestimated household
consumption in 2009-2010, as the survey showed an “unusual sharp decline in monthly consumption […] in early
2010 relative to the second half of 2009 that would seem to have little economic rationale” (p. 16). The 2009
survey mean expenditure per capita may therefore underestimate average incomes per capita, so the actual
rate of growth may be closer to the rate for GDP per capita. Regardless, the difference in the economic growth
rate calculated using these two measures would have a large effect on estimates of the growth elasticity of
poverty, as noted by Adams (2004).
0
1000
2000
3000
4000
5000
6000
$
Survey mean expenditure per capita, PPP (constant 2011 $) GDP per capita, PPP (constant 2011 $)

EVANS SCHOOL POLICY ANALYSIS AND RESEARCH (EPAR)
9
Data Deflation: Current v. Constant
According to the OECD (Schreye & Koechlin, 2002), comparisons based on current PPP are generally most useful
for analyses of a country’s current situation, as they reflect the most recent and relevant price structure.
Estimates using current PPP capture changes in volume of GDP as well as changes in relative prices, as the
measure for each period is based on prices in that period. On the other hand, comparisons based on constant
PPP fix a “base” year and extrapolate for other years by applying the relative rates of inflation observed in
different countries to the base year estimates. Time series using constant PPP have the advantage of exactly
tracking the relative movements of volume GDP growth of different countries (ibid.). The OECD recommends
using constant PPP for comparisons over time as there may be methodological changes to how PPP is calculated
in different years, though they observe that GDP comparisons calculated at constant prices may change over
time due to changes in price structures, especially for countries that are large producers and exporters of
products with large price changes, such as oil (ibid.).
Figure 4. Estimates of Per Capita Income in Nigeria in Current and Constant 2011 $
Source: World Bank, 2015b
Measures of GDP per capita, PPP using constant 2011 US$ are greater than measures using current US$ from 1990-
2010, though the gap between the two measures becomes increasingly smaller during this period (Figure 4). The
two measures are equal in 2011, as they both use 2011 conversion rates for that time period, and measures using
current US$ are greater starting in 2011.
Data Currency Conversion: Purchasing Power Parity (PPP) versus Market Exchange Rate Conversions
Estimates of the PPP-adjusted size of an economy use the cost of a common basket of goods and services to
account for differences in price levels between countries, and to better reflect the value of a given level of
income in a given country (OECD, 2015b). PPP measures are considered preferable for evaluating poverty
because exchange rates only reflect internationally traded goods, while the poor often have rural subsistence
livelihoods comprised of goods that are not traded internationally (Deaton, 2010). Despite this advantage, PPP
is believed to generally overestimate the incomes of the poor due to quality bias and substitution bias (Almås,
2012). Quality bias arises from the use of a homogenous basket of goods to compare across countries, which
does not account for cross-national quality differences in the products available and consumed. Substitution
0
1000
2000
3000
4000
5000
6000
$
GDP per capita, PPP (constant 2011 $) GDP per capita, PPP (current $)

EVANS SCHOOL POLICY ANALYSIS AND RESEARCH (EPAR)
10
bias arises from applying cross-country reference prices to a consumption basket containing constant base year
quantities, which does not account for consumers in different contexts switching their consumption quantities
or patterns from relatively expensive goods toward relatively less expensive goods (i.e., different baskets) as
prices change.
Figure 5. PPP-Adjusted versus Unadjusted Estimates of Per Capita Income in Nigeria
Source: World Bank, 2015b
Alternatively, exchange rates based on internationally traded goods can be used to convert the national
currency to USD, instead of Purchasing Power Parity (PPP). As illustrated in Figure 6, PPP-adjusted estimates of
the size of the Nigerian economy are significantly greater than estimates calculated using market exchange
rates. This result indicates that the purchasing power of US$1 in Nigeria is greater than in the rest of the
world, and that per capita incomes at market exchange rates may be underestimating the ability of Nigerians
to purchase goods and services.
PPP-adjusted GDP per capita in current US$ increased by 33.9% between 2003 and 2004. This increase can be
partly explained by a combination of rising oil prices, oil exports, and growing remittances that doubled to
$2.26 billion and represented 3.15% of GDP in 2004 (World Bank, 2007). Since then remittances have remained
a significant contributor to Nigerian GDP, peaking at 13% of GDP in 2005. In 2014 remittances comprised 3.7%
of GDP, but this represented a nearly $21 billion inflow (World Bank, 2015b).
GDP per capita at market prices in current US$, on the other hand, shows a dramatic 112% jump from 2009 to
2010, which is likely due to the selection in 2014 by the Nigerian Bureau of Statistics of 2010 as its new “base
year” for GDP measures, and its subsequent revision of GDP estimates starting from 2010 (The Economist,
2014a). PPP-adjusted GDP per capita does not display a similar sudden increase from 2009 to 2010.
Rebasing involves re-evaluating the composition of the economy and changing the weights of the sectors
comprising the estimates of GDP. In data-poor and resource-poor contexts (including many government
statistical offices in Sub-Saharan Africa) it is common to generate a “base year” estimate of GDP as a reference
point for subsequent estimates of GDP. The base year may be chosen because of above-average availability of
information on the economy, often due to the timing of national household or sectoral surveys (Jerven, 2012).
Countries typically aim to rebase their GDP estimates every five years, but in Nigeria, the last GDP rebasing
0
1000
2000
3000
4000
5000
6000
$
GDP per capita, PPP (current $) GDP per capita (current $)

EVANS SCHOOL POLICY ANALYSIS AND RESEARCH (EPAR)
11
was in 1990, representing a 20-year gap (Cobham, 2014; Leo, 2014; Jerven, 2012). Nigeria had intended to
rebase in 2000, but delayed the procedure in order to focus on obtaining debt relief from the Paris Club
(Omanuefeme, 2014).
Figure 6. Share of Different Sectors in Nigeria’s Economy in 1990 and 2010
Source: Nigeria National Bureau of Statistics, 2015
Figure 6 illustrates how the contribution of different sectors of the Nigerian economy changed from 1990 to
2010. The crude oil sector, though still a significant portion of the Nigerian economy and the largest
component of Nigeria’s industry sector, shrank from 39% of GDP to 16%, and the services sector (including
telecommunications and motion pictures) rose from 26% to 51%.
The large increase in GDP per capita at market prices following the rebasing of Nigeria’s economy, which does
not appear in the PPP-adjusted measures, further demonstrates how sensitive estimates of economic growth
are to how the economy is measured. Accordingly, our calculations of the growth elasticity of poverty in
Nigeria compare estimates using the various measures to flag any potentially important differences.
Measuring Poverty
Just as with the choice of an economic growth measure, different approaches to measuring poverty may also
influence estimates and alter interpretations. Poverty measures attempt to represent the welfare of individuals
who are living below some minimally acceptable level of consumption or income (World Bank, 2015a). The
poverty headcount, for example, considers the number of people that fall below a poverty line – thus in order
to make cross-country poverty comparisons using poverty headcounts, local currencies are converted to a
common currency (usually USD) using purchasing power parity (PPP) rates (World Bank, 2015a). The current
international poverty level is set at $1.90 per day at PPP rates (ibid.). The poverty headcount ratio,
meanwhile, measures the incidence of poverty by dividing the number of people under the poverty line by the
total population. The most recent data on Nigeria’s poverty headcount indicate there were 82.99 million
people living below $1.90 per day in 2009, for a poverty headcount ratio of 53.47% (World Bank, 2015b).
Studies on economic growth and poverty most commonly use the poverty headcount ratio as the measure of
poverty (e.g., Wieser, 2011; Loayza & Raddatz, 2010; Adams, 2004; Kraemer & Gugerty, 1997).
0%
10%
20%
30%
40%
50%
60%
Agriculture Industry Total Crude Industry ManufacturingIndustry
Services Total Telecom. & InfoServices
Motion PicturesServices
1990 Composition 2010 Composition

EVANS SCHOOL POLICY ANALYSIS AND RESEARCH (EPAR)
12
While both of the above poverty measures indicate the breadth of poverty in a population, neither represents
the depth of poverty: how far individuals are below the poverty line. For example, an individual living on $1.50
a day is $0.40 below the international poverty line, whereas an individual living on $0.80 a day has a shortfall
of $1.10, but both individuals count as a “1” in a poverty headcount measure (Morduch, 2005). The poverty gap
ratio measures the extent to which individuals fall below the poverty line and is calculated by dividing the
shortfall between each person’s income and the poverty line by the poverty line itself (Schaffner, 2014). The
poverty gap can be interpreted as the amount of money required to bring those living in poverty to the poverty
line. This measure is an important comparative tool when headcount ratios are similar across countries or sub-
populations, but the depth of poverty differs. In the poverty gap ratio formula below, N is the total population,
q is the total population of poor who are living at or below the poverty line, z is the poverty line, and yj is the
income of individual j. In this calculation, any individual whose income is at or above the poverty line has a
poverty gap of zero (World Bank, 2009).
𝐴 =1
N∑(
𝑞
𝑗=1
𝑧 − 𝑦𝑗
𝑧)
Nonlinear variations on poverty measures, such as the squared poverty gap, weight larger shortfalls more than
smaller shortfalls in an attempt to capture “severity” or inequality among the poor (Morduch, 2005).
A different approach to measuring poverty, the Multidimensional Poverty Index (MPI), incorporates measures of
health, education, and living standards (Morrell, 2011). The MPI is calculated by multiplying the incidence of
poverty (headcount ratio) by the average intensity of deprivation across the MPI’s 10 weighted indicators for
households that are considered “deprived” in at least a third of the indicators, covering education, health, and
living standards (EPAR, 2015). In the formula below, H is the incidence or poverty headcount ratio, and the
parenthetical includes the sum of deprivation scores ci, across the q people who are multidimensionally poor,
divided by q.
MPI = H x (∑ 𝑐𝑖
𝑞𝑖
𝑞)
Including MPI in the UNDP’s Human Development Report 2010 suggests a growing interest in alternative
measures of poverty that include multiple aspects of well-being not captured in the simpler poverty measures
discussed above (EPAR, 2015). Studies of economic growth and poverty do not, however, commonly estimate
the effect of economic growth on either the poverty gap index of the MPI.
Though Nigeria GDP and GNI data are measured annually and are available through 2013, the poverty
headcount ratio and poverty gap are estimated less regularly. Both the World Bank and the Nigerian National
Bureau of Statistics (NBS) use data from the nationally-representative Nigerian Living Standards Survey (NLSS)
to estimate the poverty rate. This household survey (or a similar previous version) has been collected
approximately every five years, and the latest available data are from the 2009-2010 survey wave. In addition
to these poverty data, UNDP estimates of the MPI in Nigeria are available for 2008, 2011, and 2013. Figure 7
presents poverty estimates from these three sources.

EVANS SCHOOL POLICY ANALYSIS AND RESEARCH (EPAR)
13
Figure 7. Nigeria Poverty Estimates
Source: World Bank, 2015b; Nigerian Bureau of Statistics (NBS), 2015; UNDP, 2015
Note: For the three headcount ratios, the graph presents the percentage of the population that is considered poor. For the poverty gap, the graph presents the
average percentage by which the poor population falls below the poverty line.
0
1000
2000
3000
4000
5000
6000
0
10
20
30
40
50
60
70
1985 1990 1991 1992 1993 1994 1995 1996 1997 1998 1999 2000 2001 2002 2003 2004 2005 2006 2007 2008 2009 2010 2011 2012 2013 2014
GD
P p
er
capit
a
Povert
y r
ati
o o
r gap,
%
Poverty gap at $1.90/day (World Bank) Poverty headcount ratio at $1.90/day (World Bank)
Poverty headcount ratio at national poverty line (NBS) MPI headcount ratio (UNDP)
GDP per capita, PPP (constant 2011 international $)

EVANS SCHOOL POLICY ANALYSIS AND RESEARCH (EPAR)
14
The World Bank poverty headcount ratio and poverty gap ratio estimates have a correlation of 0.96, indicating
that by these measures the depth and breadth of poverty move similarly in Nigeria. The World Bank estimates
that 53.47% of Nigerians lived below the international poverty line of $1.90 per day (2011 PPP) in 2009 and that
Nigerians fell an average of 21.76% below this poverty line in terms of daily expenditures. The data show that
poverty increased from 1985 to 1996 before falling between 1996 and 2003. Estimates of the poverty
headcount ratio and poverty gap ratio in 2009 are similar to those in 2003, indicating that poverty did not
continue to fall after 2003.
Estimates of the poverty headcount ratio from the NBS and the Multidimensional Poverty Index (MPI) measure
from the UNDP further indicate that poverty does not appear to have fallen in the last ten years. The NBS
poverty headcount ratio estimate is slightly lower in 2009 (62.6%) than in 2003 (64.2%), but is higher than in
1985 or 1992. The UNDP MPI estimate fell from 2008 to 2011 but increased in 2013. The MPI measure indicates
that 53.8% of Nigeria’s population was multi-dimensionally poor in 2008, very near the World Bank estimate of
53.5% of the population below the $1.90/day (PPP) poverty line in 2009.
We note that NBS poverty estimates using the Nigerian national poverty line are not consistent with the World
Bank estimates that use an international poverty line. The main difference is in 1992 when the NBS estimate is
over 14 percentage points lower than the World Bank estimate. In all other years, the NBS estimate is higher
than the World Bank estimate. The NBS data from 2003 and 2009 are from their 2012 Annual Abstract of
Statistics (the most recent available), which notes that the poverty line was set at 28,836.7 Naira per person
per year in 2003-2004, and that the 2009-2010 poverty line was adjusted for inflation using the 2003-2004
poverty line as the reference. The NBS data for 1985, 1992, and 1996 are from their 2011 Annual Abstract of
Statistics, which does not indicate the methodology for calculating the poverty line in those years. Differences
in inflation or in how the base Nigerian poverty line was defined would mean that different poverty lines would
be used in the NBS estimates, and may help explain why the NBS and World Bank measures do not show the
same trends. The differences in these estimates also highlight the importance of using a consistent poverty line
for comparisons over time.
Since the four measures of poverty presented in Figure 7 all yield different estimates of the extent of poverty
in Nigeria, we use all of the measures in our calculations of the growth elasticity of poverty.
Growth Elasticities of Poverty in Nigeria
A common method to measure the association between economic growth and poverty reduction is the growth
elasticity of poverty, defined as the percentage change in a poverty measure divided by the percentage change
in the size of the economy or average incomes within the same time frame (Wieser, 2011). Adams (2004) finds
that the growth elasticity of poverty in 60 developing countries tends to range from -1 to -5, indicating that a
1% increase in GDP would lead to a 1-5% reduction in the proportion of the population that is poor. He notes
that there is a much stronger statistical association between growth and reduced poverty if economic growth is
measured using changes in survey mean income or consumption than if it is measured by changes in GDP per
capita. Based on this result and on our discussion of the differences between various measures of economic
growth and poverty, we calculate growth elasticities of poverty in Nigeria using a wide variety of measures.
We calculate elasticities for all intervals between consecutive periods where poverty and economic growth or
income data for Nigeria are available from the World Bank. We also calculate a “long” interval for the growth
elasticity of poverty between the first and last years of data. Loayza & Raddatz (2010) argue that the
relationship between poverty reduction and economic growth is the most stable over long horizons, and only
EVANS SCHOOL POLICY ANALYSIS AND RESEARCH (EPAR)
15
estimate their growth elasticities of poverty for the longest period for which initial and final poverty data are
available for a country. For Nigeria, we have data for the poverty headcount ratios and the poverty gap in
1992, 1996, 2003, and 2009, allowing us to calculate elasticities for three short intervals and one long interval.
We have data for the MPI in 2008, 2011, and 2013, providing for two short intervals and one long interval with
this poverty measure.
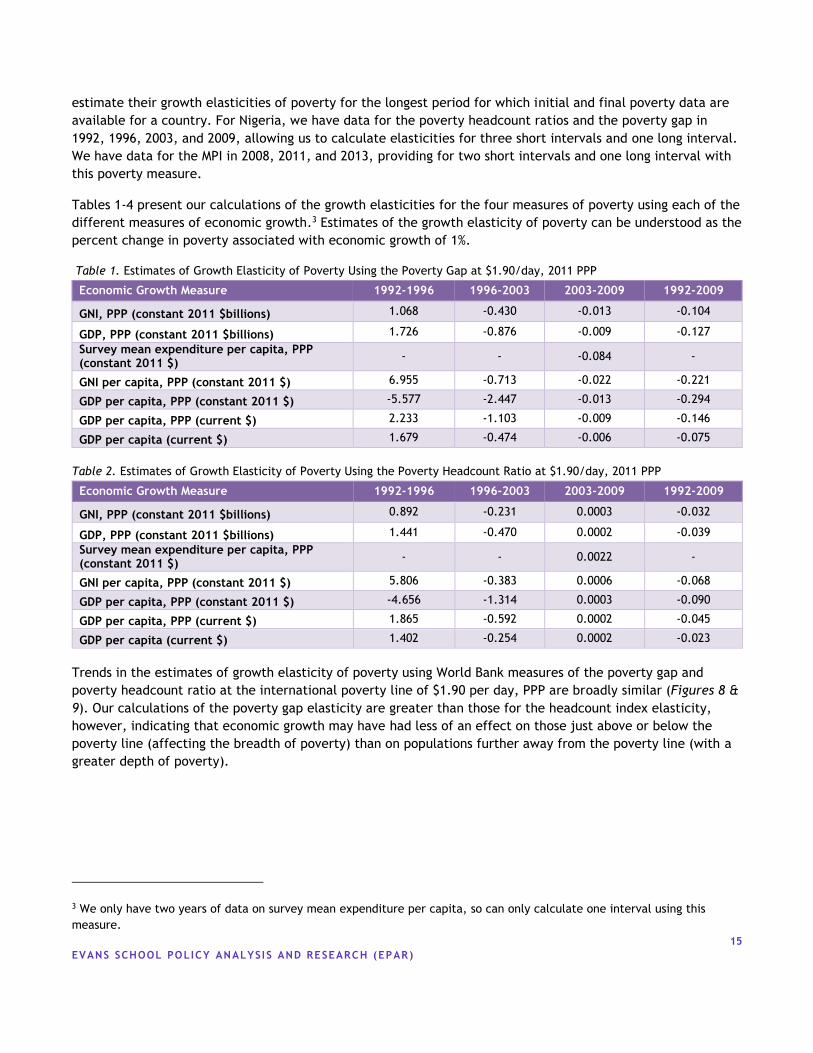
Tables 1-4 present our calculations of the growth elasticities for the four measures of poverty using each of the
different measures of economic growth.3 Estimates of the growth elasticity of poverty can be understood as the
percent change in poverty associated with economic growth of 1%.
Table 1. Estimates of Growth Elasticity of Poverty Using the Poverty Gap at $1.90/day, 2011 PPP
Economic Growth Measure 1992-1996 1996-2003 2003-2009 1992-2009
GNI, PPP (constant 2011 $billions) 1.068 -0.430 -0.013 -0.104
GDP, PPP (constant 2011 $billions) 1.726 -0.876 -0.009 -0.127
Survey mean expenditure per capita, PPP (constant 2011 $)
- - -0.084 -
GNI per capita, PPP (constant 2011 $) 6.955 -0.713 -0.022 -0.221
GDP per capita, PPP (constant 2011 $) -5.577 -2.447 -0.013 -0.294
GDP per capita, PPP (current $) 2.233 -1.103 -0.009 -0.146
GDP per capita (current $) 1.679 -0.474 -0.006 -0.075
Table 2. Estimates of Growth Elasticity of Poverty Using the Poverty Headcount Ratio at $1.90/day, 2011 PPP
Economic Growth Measure 1992-1996 1996-2003 2003-2009 1992-2009
GNI, PPP (constant 2011 $billions) 0.892 -0.231 0.0003 -0.032
GDP, PPP (constant 2011 $billions) 1.441 -0.470 0.0002 -0.039
Survey mean expenditure per capita, PPP (constant 2011 $)
- - 0.0022 -
GNI per capita, PPP (constant 2011 $) 5.806 -0.383 0.0006 -0.068
GDP per capita, PPP (constant 2011 $) -4.656 -1.314 0.0003 -0.090
GDP per capita, PPP (current $) 1.865 -0.592 0.0002 -0.045
GDP per capita (current $) 1.402 -0.254 0.0002 -0.023
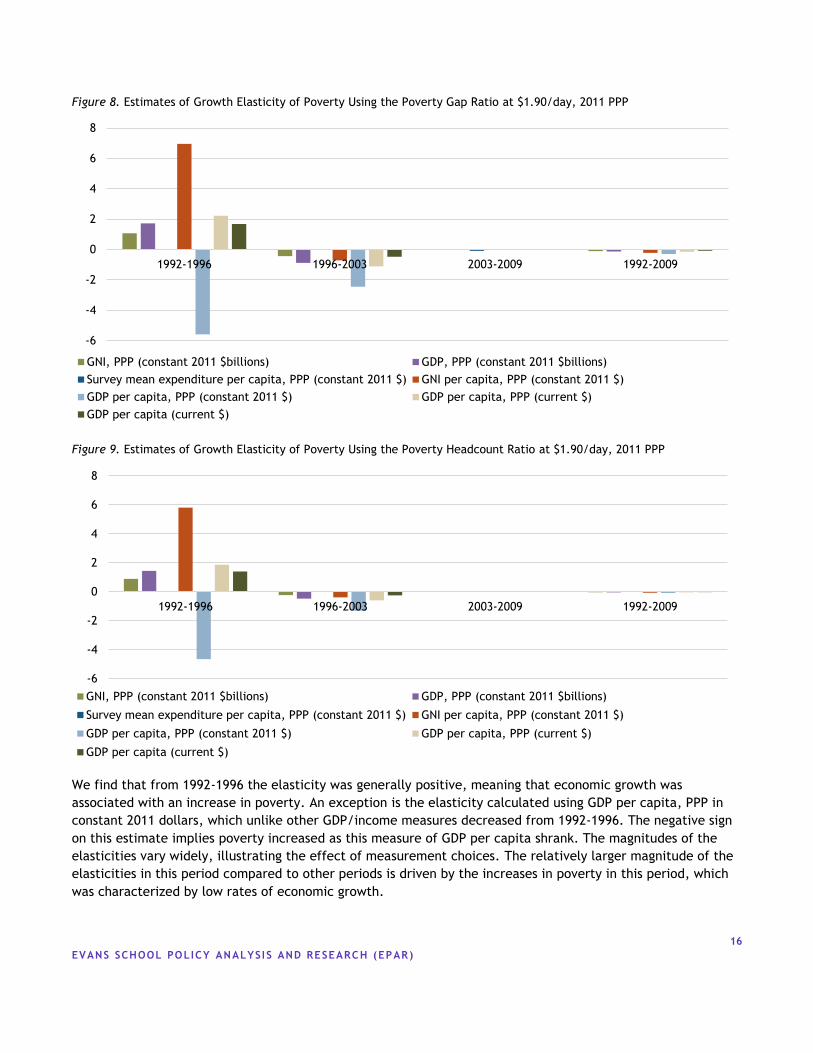
Trends in the estimates of growth elasticity of poverty using World Bank measures of the poverty gap and
poverty headcount ratio at the international poverty line of $1.90 per day, PPP are broadly similar (Figures 8 &
9). Our calculations of the poverty gap elasticity are greater than those for the headcount index elasticity,
however, indicating that economic growth may have had less of an effect on those just above or below the
poverty line (affecting the breadth of poverty) than on populations further away from the poverty line (with a
greater depth of poverty).
3 We only have two years of data on survey mean expenditure per capita, so can only calculate one interval using this
measure.
EVANS SCHOOL POLICY ANALYSIS AND RESEARCH (EPAR)
16
Figure 8. Estimates of Growth Elasticity of Poverty Using the Poverty Gap Ratio at $1.90/day, 2011 PPP
Figure 9. Estimates of Growth Elasticity of Poverty Using the Poverty Headcount Ratio at $1.90/day, 2011 PPP
We find that from 1992-1996 the elasticity was generally positive, meaning that economic growth was
associated with an increase in poverty. An exception is the elasticity calculated using GDP per capita, PPP in
constant 2011 dollars, which unlike other GDP/income measures decreased from 1992-1996. The negative sign
on this estimate implies poverty increased as this measure of GDP per capita shrank. The magnitudes of the
elasticities vary widely, illustrating the effect of measurement choices. The relatively larger magnitude of the
elasticities in this period compared to other periods is driven by the increases in poverty in this period, which
was characterized by low rates of economic growth.
-6
-4
-2
0
2
4
6
8
1992-1996 1996-2003 2003-2009 1992-2009
GNI, PPP (constant 2011 $billions) GDP, PPP (constant 2011 $billions)
Survey mean expenditure per capita, PPP (constant 2011 $) GNI per capita, PPP (constant 2011 $)
GDP per capita, PPP (constant 2011 $) GDP per capita, PPP (current $)
GDP per capita (current $)

EVANS SCHOOL POLICY ANALYSIS AND RESEARCH (EPAR)
17
From 1996-2003 we find the opposite relationship to 1992-1996, with economic growth associated with
decreased poverty. Both poverty measures fell during this period while the measures of economic growth
increased. GDP per capita, PPP in constant 2011 dollars increased the least during this period, so the
elasticities calculated using this measure are greater than those calculated with other measures. With the
exception of this measure, all elasticities are smaller than 1, indicating that the percentage reductions in
poverty were smaller than the percentage growth of the economy.
Between 2003-2009 we find that the elasticity of poverty is nearly 0, indicating that economic growth was not
associated with any changes in poverty. The poverty headcount ratio increased slightly from 53.46% to 53.47%
in this period, while the poverty gap ratio fell slightly from 21.92% to 21.76%, which explains the difference in
the signs of the elasticities. We therefore observe wide variations in the growth elasticity of poverty across
these time intervals, as the elasticities switch from positive to negative before nearing 0. This result indicates
no consistent association between economic growth and poverty in Nigeria.
Even though the elasticity estimates for the full period from 1992-2009 are negative, indicating that economic
growth is associated with poverty reduction, the magnitudes of the elasticities are very small. The full-period
elasticities imply that economic growth of 1% from 1992-2009 would be associated with a fall in the poverty
gap ratio of between 0.075% and 0.294% and a fall in the poverty headcount ratio of between 0.023% and
0.090%. These elasticities are much smaller than the Adams (2004) estimates for developing countries, which
indicate that economic growth of 1% would be associated with reductions in poverty of between 1% and 5%.
Table 3. Estimates of Growth Elasticity of Poverty Using the Poverty Headcount Ratio at the Nigerian National Poverty Line
Economic Growth Measure 1992-1996 1996-2003 2003-2009 1992-2009
GNI, PPP (constant 2011 $billions) 4.237 -0.031 -0.044 0.236
GDP, PPP (constant 2011 $billions) 6.848 -0.063 -0.030 0.288
Survey mean expenditure per capita, PPP (constant 2011 $)
- - -0.287 -
GNI per capita, PPP (constant 2011 $) 27.590 -0.052 -0.074 0.502
GDP per capita, PPP (constant 2011 $) -22.124 -0.177 -0.045 0.669
GDP per capita, PPP (current $) 8.861 -0.080 -0.032 0.332
GDP per capita (current $) 6.660 -0.034 -0.022 0.170
Calculations of the growth elasticity of poverty using the NBS poverty headcount ratio at the Nigerian national
poverty line (Table 3) differ from estimates using the World Bank international poverty line. The magnitudes of
the elasticities in 1992-1996 are much greater, reflecting the relatively larger increase in the NBS poverty
measure in this period, from 42.7% to 65.6%. We see a very small association between economic growth and
poverty reduction from 1996-2003 and 2003-2009, as the NBS poverty measure fell only slightly in these
periods. Contrary to the previous calculations, the growth elasticity of the NBS poverty measure for the full
1992-2009 period is positive, indicating that poverty grew as the economy grew. This result is related to the
particularly low estimate of the NBS poverty headcount ratio in 1992.
For all three poverty measures, the one growth elasticity we are able to calculate using survey mean
expenditure per capita (for 2003-2009) has a much larger magnitude than the other growth elasticity
calculations for that time period. In all three tables, we see that the elasticity calculated using survey mean
expenditure per capita in 2003-2009 is nearly four times larger than the next largest estimated elasticity,
indicating that economic growth is associated with a percentage reduction in poverty four times greater using
this measure. For example, in Table 1 using the poverty gap ratio, we observe that the elasticity using survey
mean expenditure per capita is -0.0839, while the next-largest elasticity is -0.0216, calculated using GNI per

EVANS SCHOOL POLICY ANALYSIS AND RESEARCH (EPAR)
18
capita. Using the headcount ratio for the Nigerian poverty line, the elasticity using survey mean expenditure
per capita is -0.2866, while the next-largest elasticity is -0.0736, again using GNI per capita. This result mirrors
the finding of Adams (2004) that growth elasticity of poverty is higher when growth is defined using survey
mean data as opposed to national accounts data such as GDP or GNI per capita.
Table 4. Estimates of Growth Elasticity of Poverty Using the Multidimensional Poverty Index (MPI) Headcount Ratio, 2011
PPP
Economic Growth Measure 2008-2011 2011-2013 2008-2013
GNI, PPP (constant 2011 $billions) -0.866 1.266 -0.134
GDP, PPP (constant 2011 $billions) -0.936 1.793 -0.162
Survey mean expenditure per capita, PPP (constant 2011 $) - - -
GNI per capita, PPP (constant 2011 $) -1.490 2.203 -0.240
GDP per capita, PPP (constant 2011 $) -1.690 4.278 -0.329
GDP per capita, PPP (current $) -1.212 2.336 -0.214
GDP per capita (current $) -0.238 0.959 -0.046
Calculations of growth elasticity using the MPI headcount ratio (Table 4) are not directly comparable to the
other calculations, as the MPI headcount ratio is not available for the same intervals of years as the other
poverty measures. We find that small overall associations between economic growth and poverty reduction for
the full 2008-2013 period mask differences across the individual time intervals. Economic growth is associated
with poverty reduction from 2008-2011, but with increases in poverty from 2011-2013. The Nigerian economy
grew significantly during both periods, yet the MPI headcount ratio rose from 2011 to 2013 after falling from
2008 to 2011. Similar to the other poverty measures, these results suggest no consistent association between
economic growth and poverty reduction. They also support the finding that estimates of the growth elasticity
of poverty in Nigeria over the full period with data available are lower than other developing country
estimates, which generally find poverty falling by a greater percentage than the economy is growing (Adams,
2004; Bhalla, 2002; Bruno et al., 1998).
Part of the inconsistency in the growth elasticity of poverty may be related to changes in the sectoral
composition of Nigeria’s economy. Previous studies find that economic growth based on resource endowments
has a lower impact on poverty reduction (Gylfaso & Zoega, 2002), while growth originating in agriculture and
other labor-intensive sectors, such as manufacturing, has a greater impact (de Janvry & Sadoulet, 2010; Loayza
& Raddatz, 2010; Dollar & Kraay, 2002). As previously discussed, the Nigerian economy changed significantly
from 1990 to 2010. The crude oil sector, which is not labor-intensive and therefore contributes less to
employment and income opportunities for Nigerian households, shrank from 39% of GDP to 16%. The labor-
intensive agriculture sector shrank from 32% of GDP to 23%, though the manufacturing sector grew from 2% to
7% and the services sector rose from 26% to 51%.
The World Bank (2015b) provides data on the value added in constant 2005 US$ of four sectors of the Nigerian
economy: manufacturing, agriculture, services, and industry (including oil exports). Table 5 shows calculations
of elasticities of poverty for each of these sectors using the World Bank’s poverty headcount ratio at the
international poverty line of $1.90 per day, in constant 2011 PPP. These elasticities generally mirror the trends
using total economic growth (Table 1), with positive elasticities from 1992-1996, negative elasticities from
1996-2003, elasticities of approximately zero from 2003-2009, and negative but small elasticities over the full
1992-2009 period.

EVANS SCHOOL POLICY ANALYSIS AND RESEARCH (EPAR)
19
Table 5. Estimates of Sectoral Growth Elasticity of Poverty Using the Poverty Headcount Ratio at $1.90/day, 2011 PPP
Sector 1992-1996 1996-2003 2003-2009 1992-2009
Manufacturing, value added (constant 2005 US$) -1.2354 -0.646 0.0003 -0.066
Agriculture, value added (constant 2005 US$) 0.928 -0.154 0.0004 -0.027
Services, etc., value added (constant 2005 US$) 1.366 -0.404 0.0001 -0.025
Industry, value added (constant 2005 US$) 2.165 -0.367 0.0025 -0.102
Contrary to what is hypothesized in the literature, we do not observe that growth originating in agriculture has
had a greater impact on poverty reduction in Nigeria. In fact, the agriculture growth elasticity of poverty is
smaller than the industry growth elasticity in all periods, and is similar to the services growth elasticity for the
full 1992-2009 period. Overall, though, there is no consistent association between growth in any sector and
poverty reduction in Nigeria.
Hypothesized Factors Affecting the Relationship between Economic Growth & Poverty in Nigeria
In order to explore factors affecting the relationship between economic growth and poverty in Nigeria, we
reviewed the theoretical and empirical literature, both globally and with a particular focus on Nigeria. We
searched for both academic and grey literature on Google Scholar, Scopus, Econlit, Social Science Research
Network, the University of Washington Library System, World Bank, OECD iLibrary, CGAP, CGDEV, 3ie, and J-
PAL, using the following search strings or related variants: (GDP OR “gross domestic product” OR GNI OR GNP)
AND (poverty OR poor*) AND (impact OR effect OR association OR relationship) AND Nigeria. We retrieved a
total of 84 articles and screened for articles that explicitly discussed economic growth and poverty in Nigeria,
resulting in 26 relevant articles. We coded each article for information on measuring economic growth and
poverty, methodology used, and potential factors hypothesized to affect the relationship between economic
growth and poverty.
Some authors argue that there is a significant association between economic growth and poverty reduction in
Nigeria. Kolawole, Omobitan, & Yaqub (2015) analyze the relationship between poverty, inequality, and
economic growth in Nigeria between 1980-2012, and find that the “GDP growth rate increases inequality, but
reduces poverty [headcount ratio] in the country” (p. 51). Using data from 1981-2012, Bakare & Edozie (2015)
argue that economic growth did not lead to decreased poverty, but rather that a decreasing poverty rate
supported increased economic growth.
The majority of the literature we identified, however, finds that economic growth has had no consistent
impact on poverty in Nigeria (Oseni & Osen, 2015; Leke et al., 2014; Yusuf, 2014, Dabalen et al., 2013;
Oshikoya, 2008). For example, A 2006 OECD report on the economic outlook in Nigeria reported that economic
growth was leading to substantial reductions in poverty, but more recent reports in 2014 and 2015 report that
poverty remains an ongoing challenge to Nigeria, finding that “the benefits of economic growth have not
sufficiently trickled down to the poor (OECD, 2014). Oseni & Osen (2015) find that the impact of growth on
Nigerian citizens has been insignificant, and argue that the continuing high levels of poverty and
unemployment require “urgent and drastic measures.”
4 The negative elasticity for growth originating in manufacturing from 1992-1996 is due to a fall in manufacturing value
added in this period.

EVANS SCHOOL POLICY ANALYSIS AND RESEARCH (EPAR)
20
These researchers posit several hypothesized explanatory factors for the lack of effect of economic growth on
poverty reduction, including:
Economic inequality (Barungi, 2014; Leke et al., 2014; World Bank, 2014c; Johnson, 2013; World Bank,
2013b)
The “oil curse” (Bourne, 2015; Oseni & Osen, 2015; Adojo, 2014; Leke, et al., 2014)
High unemployment (Bakare, 2015; Bourne, 2015; Hassan, 2015; Leke et al., 2014; World Bank, 2013a)
Corruption, particularly in government and in the oil industry (Bourne, 2015; Yusuf, 2014; Johnson,
2013; Nwabuzor, 2005)
Poor education and health (Kottasova, 2015; Cobham, 2014; Kolawole et al., 2014; Leo, 2014; Dabalen
et al., 2013)
The poor quality of data on growth and poverty in Nigeria (Leo, 2014; Devarajan, 2013; World Bank,
2013b)
The following sections expand upon these themes and their relationship to Nigeria’s GDP growth and persistent
poverty.
Economic Inequality
In a recent report, the World Bank (2013b) reports that inequality helps explain the limited poverty reduction
in Nigeria between 2004-2010: “[P]overty reduction in Nigeria would have been 5 percentage points (rather
than the current 2 percentage points) during the period if there was no increase in inequality” (p. v). de Wit &
Crookes (2013) find that the Gini coefficient of income inequality in Nigeria increased from 0.40 in 2003 to 0.43
in 2009, and World Bank data indicate that the income share held by the poorest 20% of the population fell
5.67% to 5.37% of all income in Nigeria (World Bank, 2015b). These high levels of income inequality may help
explain growth elasticities of poverty near 0 in this period.
Economic inequality in Nigeria is exacerbated by the ever-increasing economic gap between the relatively
affluent urban southern region and the comparatively poor rural populations in the north (World Bank, 2014a;
World Bank, 2014b; World Bank, 2014c; Johnson, 2013; Leke et al., 2014; Dabalen et al., 2013). Barungi (2014)
notes that there remains a gap between rich and poor owing to a lack of equal access to infrastructure and
amenities, particularly for rural Nigerians in the northern part of the country, 90% of whom are subsistence
farmers with limited access to public services or markets. As economic conditions worsen for Nigerians in the
rural north, related in part to ongoing security concerns with the Boko Haram insurgency, more rural Nigerians
migrate to urban areas in the south, placing greater pressure on the fragile infrastructure in Nigerian cities
(Johnson, 2013).
The growing economic divide between the northern and southern regions of Nigeria is puzzling to development
experts (World Bank, 2013). Recent years have been met with favorable harvests and good rainfall as well as
benefits from the Nigerian Government’s Agriculture Transformation Agenda (Barungi, 2014). According to the
World Bank (2014c), growth from small-scale agriculture in the last decade is estimated to be around 6% and is
on par with Nigeria's overall economic growth. With the GDP rebasing, the new average agriculture growth rate
for 2011-2013 fell slightly to 4.2%, with growth rates falling to under 3% in 2011 and 2013 (World Bank, 2014c).
As a result, economic growth from agriculture has kept pace with rural population growth (World Bank, 2014c).
However, Leke et al. (2014) find that the land under cultivation in the rural northern region has not kept pace
with population growth, and that cropland per worker has actually decreased by 1.7% per years, restricting
potential productivity benefits to individual farmers.

EVANS SCHOOL POLICY ANALYSIS AND RESEARCH (EPAR)
21
The importance of oil to the Nigerian economy, ongoing struggles with unemployment, corruption, and poor
education and health are all argued to contribute to inequality in Nigeria, in addition to contributing to
ongoing poverty. We discuss each of these factors in turn in the following sections.
The “Oil Curse”
Nigeria's vast oil wealth is a frequently cited contributor to Nigeria's economic inequality and stagnant poverty
rates, and is sometimes referred to as Nigeria's “oil curse.” The “oil curse,” also known as the “paradox of
plenty” or “resource curse,” refers to the paradox in which resource driven economies tend to be vulnerable to
instability, corruption and slow development outcomes (Ross, 2012; Dabalen et al., 2013).
In line with the predicted outcomes of the “oil curse” theory, Oseni & Osen (2015) assert: “The inability of the
economic growth to make positive significant impact on the citizenry can be explained [by] the huge
contribution of the oil sector to the GDP because the oil sector is not labour intensive” (p. 30). The authors do
not quantify the oil sector’s contribution to Nigeria’s GDP, but argue that the oil sector’s capital-intensive
nature contributes to unemployment and therefore poverty and economic inequality in Nigeria.
In addition to Oseni & Osen’s argument about the capital-intensity of the oil sector, Bourne (2015) argues that:
“The rewards [of oil wealth] have been kept too narrowly, the trickle-down effect has been too limited, and
the availability of oil wealth has squeezed out other types of investment that might generate more
employment, especially in agriculture” (p. 263). Adojo (2014) further argues that conflict between
multinational oil companies and economically frustrated militant youths from the Niger Delta’s minority ethnic
groups, has contributed to depressed economic growth and heightened unemployment. The resulting conflicts
in the Niger Delta region are both a cause and effect of the continued impoverishment of Nigerians living in
these conflict zones.
However, even as the non-oil share of Nigeria's economy has grown in recent years (Barungi, 2014; World Bank,
2014a; World Bank 2014c), as previously discussed (Figure 6), poverty measures have not fallen. Between 2011
and 2013, Nigeria's oil sector accounted for only 2% of the 7% real GDP growth Nigeria experienced – even
contributing negative growth in 2012 (OECD, 2013; Leke et al., 2014). Moreover, Nigeria’s recent GDP rebasing
exercise reveals that Nigeria’s oil sector represents a smaller share of the economy than previously understood,
falling from 40% to 15% of GDP (Leke et al., 2014). Nigeria's oil production and global oil prices have also
declined in recent years, further hindering the oil sector’s contributions to Nigeria’s economic growth (Leke et
al., 2014; Barungi, 2014; World Bank, 2014a; World Bank, 2014c). Figure 10 shows that while in 1992 and 1996,
industry (including oil revenues) was the largest source of value added to the Nigerian economy, but that by
2009 the value added by industry, agriculture, and services were all similar.

EVANS SCHOOL POLICY ANALYSIS AND RESEARCH (EPAR)
22
Figure 10. Changes in Sectoral Value Added and Population in Nigeria, 1992-2009
Source: World Bank, 2015b
The, manufacturing, construction, real estate, agricultural production, and the service sector, including
booming telecommunications and entertainment sectors have all contributed greatly to Nigeria’s recent
economic growth and diversification. In aggregate, economic growth from the non-oil sector hovered between
5.4-8.3% real GDP growth between 2011 and 2013 (Barungi, 2015; Leke et al., 2014). Moreover, Nigeria's
economic growth is concentrated in trade and agriculture, which, unlike the capital-intensive oil sector,
suggests improved economic opportunities and welfare for a greater number of Nigerians, as these are more
labor-intensive sectors (World Bank, 2013).
Oshikoya (2008) finds that over the past several decades, the agricultural growth rate has not kept pace with
population growth, limiting the benefits to the estimated 60% of the labor force employed in agriculture. Data
from the World Bank, however, indicate that the value added from agriculture has grown more rapidly than
Nigeria’s population (World Bank, 2015b). The World Bank (2013a) finds that even though recent growth rates
of GDP in the non-oil sector exceed population growth in Nigeria, GDP growth has not led to reduction in
poverty levels. Our findings that the growth elasticities of poverty in Nigeria do not vary significantly across
sectors support this result. The discrepancy between real GDP growth in the non-oil sector and persistent
economic inequality suggests that economic benefits from non-oil sector growth may also not be evenly
distributed (World Bank, 2013).
Unemployment
The literature suggests that unemployment and lack of economic opportunity continues to be a challenge for
many in Nigeria, and may be one mechanism partially explaining the persistence of stagnant poverty levels
despite non-oil economic growth (Leke et al., 2014; Johnson, 2013; World Bank, 2013a; Oseni & Osen, 2015;
Bakare, 2015; Hassan, 2015; Abedwole, 2011). Hassan (2015) finds a negative relationship between the
unemployment rate, which rose from 13.4% in 2004 onto 23.9% in 2011, and GDP, which grew 6% on average
during the same time period. The author further argues that the paradox of jobless growth poses a significant
threat to economic, social, and political stability.
0
25
50
75
100
125
150
175
0
5
10
15
20
25
30
35
40
45
50
1992 1996 2003 2009
Count
of
Popula
tion a
nd L
abor
Forc
e
Secto
ral valu
e a
dded (
const
ant
2005
US$)
Manufacturing Agriculture Services Industry Population

EVANS SCHOOL POLICY ANALYSIS AND RESEARCH (EPAR)
23
The World Bank (2013a) reports that the official unemployment rate rose from 12% in 2006 to 24% in 2011, and
argues that job creation is inadequate to keep pace with population growth. World Bank data further indicates
that the labor force participation rate has fallen, from 56.9% of the population age 15+ to 55.5% from 1992-
2009, even as population grew by 54.3% over this period (World Bank, 2015b). This result indicates that there
have been very large increases in the absolute number of Nigerians that are not in the labor force, and that
therefore may have lower levels of income or expenditure.
Leke et al. (2014) similarly report “jobless growth” in Nigeria, finding that "[i]n Nigeria, urbanisation has not
raised incomes the way it has in other developing economies" (18). They argue that formal job creation and
skill development are insufficient to meet the demand for jobs in Nigeria's cities, resulting in depressed
incomes and persistent urban poverty. The authors further identify “informality among small business, a lack of
permanent hiring by large businesses, and a high cost of living” (p. 19) as the three major reasons for
persistent urban poverty in Nigeria. Few employment opportunities in Nigeria's cities has further ramifications
for the country's rural population. Leke et al. (2014) describe how typically, when countries urbanize,
remittances from urban relatives are sent back home to help family members in rural areas to supplement
their incomes and invest in implements and machinery for improved agricultural productivity. However,
unemployment and low wages in the cities have limited remittances back to rural family members, which
further depresses rural incomes. Moreover, with an increasing rural population, there are more people to
support, which further dilutes the potential effects of remittances on reducing rural poverty.
There is growing evidence that youth unemployment is a particular challenge for Nigeria. The World Bank
reports that the youth unemployment rate was 1.8 times greater than the overall unemployment rate, and
Johnson (2013) finds that 38% of Nigerians aged 15 to 44 are unemployed. Bourne (2015) recounts several
tragedies that further highlight the unemployment problem in Nigeria. In March 2014, “Immigration Services
invited youngsters to aptitude tests to fill 3,000 positions. In Abuja around 68,000 turned up at the national
stadium, and eight were killed in a stampede; in Port Harcourt, another 20,000 came for the same jobs, and
four were killed in another stampede. Three pregnant young women and three young men were killed in similar
crushes in Benin City in Edo state, and Minna in Niger state” (p. 261). The stampedes and tragic deaths of these
individuals highlight the desperation for employment among young Nigerians. In addition, Bakare (2015) argues
that unemployment in Nigeria is due not only to lack of employment opportunities, but also in part to
widespread corruption: “Many offices hire solely by preference, not by merit, preferential treatment has
become the order of the day” (p. 255). He finds that as a result, many Nigerians graduate with degrees and
remain unemployed for years.
These findings suggest that even though growth in the Nigerian economy is increasingly driven by more labor-
intensive sectors such as agriculture and services rather than by industry, employment and income
opportunities have been limited and are not sufficient to meet the need for improved living standards for
Nigeria’s growing population.
Corruption
Mauro (1995) finds empirical evidence from a cross-country analysis that corruption contributes to lowered
economic growth due to decreased investment, which he argues contributes to poverty. In his analysis, Mauro
ranks Nigeria in the lowest quintile for bureaucratic efficiency, which includes a weak judiciary system, red
tape, and corruption. Though prosecutions of high-profile corruption cases have increased and Nigeria’s
reputation for corruption has improved over the years, it nonetheless ranks in the bottom quartile of countries
for levels of corruption (Leke et al., 2014; Barungi, 2014), and several authors argue that corruption has
contributed to Nigeria’s lack of poverty reduction (Johnson, 2013; Yusuf, 2014; Nwabuzor, 2005).

EVANS SCHOOL POLICY ANALYSIS AND RESEARCH (EPAR)
24
Johnson (2013) contends that political instability and corruption undermines Nigeria’s development outcomes
and widens the inequality gap, despite steady GDP growth and a booming economy. Nwabuzor (2005) argues
that corruption both facilitates conditions for mass poverty as well as disproportionately burdens the poor.
Yusuf et al.’s (2014) empirical study further indicates a relationship between corruption, economic growth, and
poverty in Nigeria, suggesting that economic growth causes corruption in the short and medium term, and that
both economic growth and corruption are associated with increased poverty (p. 104). The authors argue that
corruption reduces the quality of social infrastructure and diverts public expenditure away from social spending
as officials engage in rent-seeking.
The literature also suggests that corruption in the oil sector may contribute to ongoing poverty in Nigeria. Oil
and gas production contributes over 75% of Nigeria’s federal revenues, providing opportunities for corruption
(Leke et al., 2014; Oseni, 2015). Johnson (2013) contends that “Corruption, especially concerning the country’s
oil industry, has significantly increased the economic inequality gap. Nigeria is Africa’s leading oil producer,
yet few citizens have benefited from the trade. The majority of the money is divided between politicians and
wealthy oil executives and fighting over control of oil fields is causing increasing instability in the Niger Delta.”
Thus, while oil revenues have contributed to increased GDP per capita, the benefits to the poor are limited.
Bourne (2015) argues that Nigeria’s oil corruption along with the global crackdown on money laundering may
have had a positive impact on Nigeria’s economic growth. He contends that “Rich Nigerians, less able to take
their ill-gotten gains to the safety of London, Zurich or New York, were actually forced to invest in Nigeria. The
growth of a stronger domestic capitalism was the outcome” (p. 264). He further argues that this growth,
however, has primarily served to increase the wealth of the investors rather than benefit the poor.
Education and Health
The Nigerian government’s reliance on oil revenues (estimated to contribute 75% of government revenue) not
only contributes to opportunities for corruption but results in an undiversified revenue base subject to largely
exogenously determined price fluctuations. Nigeria’s low and shrinking tax-to-GDP ratio (estimated at 10.6% in
2013) limits the Nigerian government’s capacity to invest in social programs such as education and health
(Cobham, 2014). According to the IMF, a tax-to-GDP ratio less than 15% is cause for significant concern (ibid.).
Kottasova (2015) finds that the reliance on oil revenues has been directly associated with decreasing public
investment in education and health programs as oil prices have declined in recent years.
Leo (2014) notes that although Nigeria’s social spending was among the lowest in the world prior to the GDP re-
basing 2010, it proved to be even lower afterward. For example, public health spending was reported at 2% of
GDP prior to the rebasing, but post-rebasing it is only 1% of GDP. In addition, he states that “we still have no
clue about public education spending because the Nigerian government doesn’t publish those figures.”
Research suggests that there is a negative correlation between education levels and income poverty (Dabalen
et al., 2013). An estimated 10 million Nigerian children (42%) were not attending school even before the Boko
Haram insurgency in northern Nigeria (Johnson, 2013; Bourne, 2015). Moreover, the overall literacy rate among
Nigerians is quite low at an estimated 61% of the population (Johnson, 2013). While the World Bank (Dabelen et
al., 2013) applauds the Nigerian government for making significant strides in recent years to promote
education and literacy, they note that educational outcomes are nevertheless distributed unequally, including
between Nigeria’s northern and southern populations. The World Bank (2013c) reports that in the southern
state of Akwa Ibom nearly 90% of adults are literate, whereas only 40% of adults are literate in northern states,
such as in Kano and Katsina.

EVANS SCHOOL POLICY ANALYSIS AND RESEARCH (EPAR)
25
Access to healthcare is an additional social welfare problem in Nigeria (Johnson, 2013; Bourne, 2015). Unlike
some Middle Eastern oil-states, Nigeria does not have a world-class health service (Bourne, 2015). Poor
healthcare has contributed to Nigeria’s high infant mortality rate (88.4 for every 1,000 live births), as well as
the spread of preventable diseases (Johnson, 2013). Malaria is the leading cause of annual deaths (300,000),
followed closely by HIV/AIDS (215,000) (Bourne 2015). Efforts to provide reliable basic healthcare have been
hindered due to corruption and lack of funding as far back as the 1980s (Bourne, 2015). Kolawole et al. (2014)
find that a hypothetical 100 percent increase in government health expenditure would bring a 21.9 percent
increase in per capita income. The authors recommend increased government spending for both education and
public health facilities to shore up the growing economic inequality that their analysis shows has resulted from
economic growth.
Poor Data Quality for Key Economic Growth and Poverty Measures
Some researchers argue that because of questionable data quality we cannot be certain about the relationship
between economic growth and poverty in Nigeria. Devarajan (2013) observes that as we consider the
relationship between economic growth and poverty, “the ‘statistical tragedy’ is that we cannot be sure of
either of these phenomena.” He highlights issues with measures of Nigeria’s populationa key component of
both per capita GDP and poverty measureswhich are widely prone to inflation since they affect fiscal
transfers from the central government to each state.
Leo (2014) contends that “bad Nigerian GDP and population data [is] being used to produce even worse
estimates for things like poverty rates,” and that econometric studies have repeatedly based their estimates on
poor data, pointing out that data quality issues raise “fundamental questions about the explanatory power of
studies related to almost every development, financial, or economic issue.” Supporting Leo’s assertion, The
World Bank (2013b) has included: “inadequate statistical information,” combined with governance problems
and partisan politics, as one of three main obstacles to Nigeria’s Development.5
The World Bank posits that the poor quality of the underlying data may partly explain the counterintuitive
results of studies of poverty and economic growth in Nigeria: “If data quality is poor it is difficult to establish
the magnitudes of these changes even if the general story line still holds” (p. 32). Because of poor data and
analysis, the World Bank speculates that Nigeria’s “Poverty levels may be lower and poverty reduction faster
than the official estimates suggest” (p. i). Throughout their 2013 report, the World Bank repeatedly calls for
greater collaboration with the National Bureau of Statistics to provide better data collection and management
so as to better enable an accurate analysis of Nigeria’s economic growth and development outcomes.
Aid Allocations to Nigeria
To understand how the relationship between economic growth and poverty may affect the efficiency of donors’
aid allocation decisions, we searched organizational websites of major international aid donors and the grey
literature for publicly-available aid allocation formulas, retrieving formulas for the World Bank’s International
Development Association (IDA) and the African Development Fund. In addition, we also analyzed trends in aid
disbursements in Nigeria using data from OECDStat.
5 The other two obstacles to development in Nigeria as identified by The World Bank (2013b) are “Very high dependence on
oil and inherently volatile oil prices,” and “Infrastructural and institutional deficiencies that hinder the development of the nonoil economy and job creation,” both of which have been previously discussed in this review.
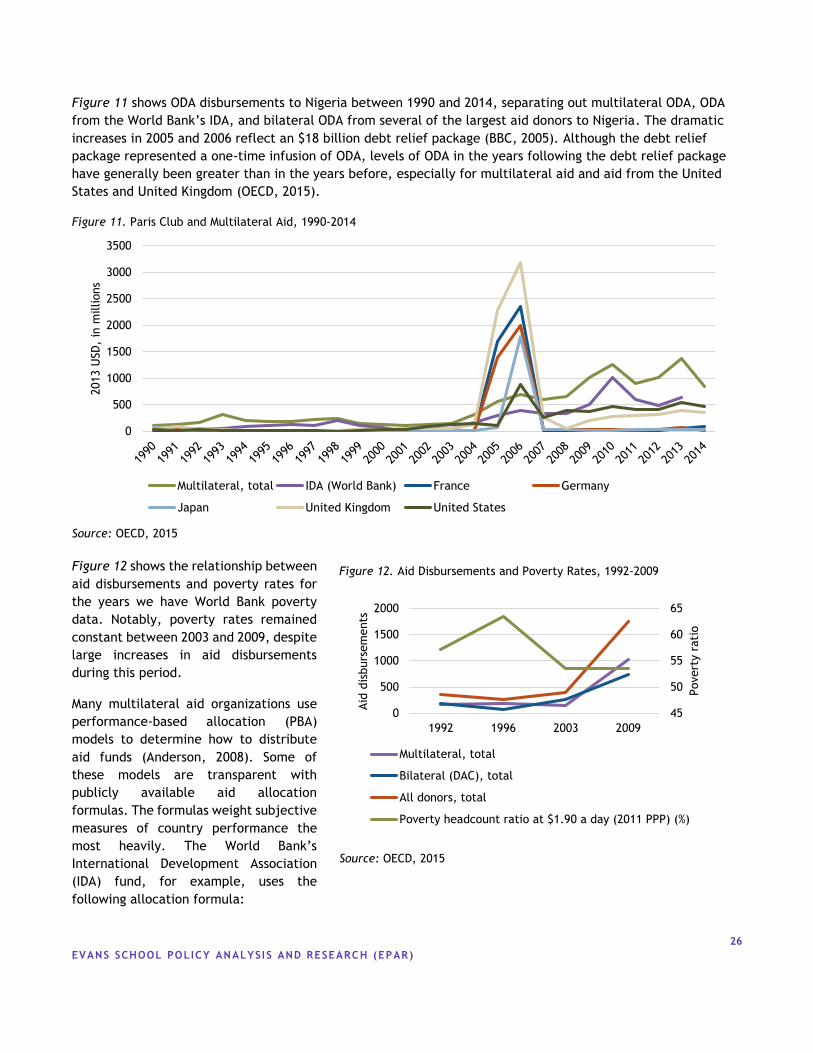
EVANS SCHOOL POLICY ANALYSIS AND RESEARCH (EPAR)
26
Figure 11 shows ODA disbursements to Nigeria between 1990 and 2014, separating out multilateral ODA, ODA
from the World Bank’s IDA, and bilateral ODA from several of the largest aid donors to Nigeria. The dramatic
increases in 2005 and 2006 reflect an $18 billion debt relief package (BBC, 2005). Although the debt relief
package represented a one-time infusion of ODA, levels of ODA in the years following the debt relief package
have generally been greater than in the years before, especially for multilateral aid and aid from the United
States and United Kingdom (OECD, 2015).
Figure 11. Paris Club and Multilateral Aid, 1990-2014
Source: OECD, 2015
Figure 12 shows the relationship between
aid disbursements and poverty rates for
the years we have World Bank poverty
data. Notably, poverty rates remained
constant between 2003 and 2009, despite
large increases in aid disbursements
during this period.
Many multilateral aid organizations use
performance-based allocation (PBA)
models to determine how to distribute
aid funds (Anderson, 2008). Some of
these models are transparent with
publicly available aid allocation
formulas. The formulas weight subjective
measures of country performance the
most heavily. The World Bank’s
International Development Association
(IDA) fund, for example, uses the
following allocation formula:
0
500
1000
1500
2000
2500
3000
3500
2013 U
SD
, in
millions
Multilateral, total IDA (World Bank) France Germany
Japan United Kingdom United States
Figure 12. Aid Disbursements and Poverty Rates, 1992-2009
Source: OECD, 2015
45
50
55
60
65
0
500
1000
1500
2000
1992 1996 2003 2009
Povert
y r
ati
o
Aid
dis
burs
em
ents
Multilateral, total
Bilateral (DAC), total
All donors, total
Poverty headcount ratio at $1.90 a day (2011 PPP) (%)

EVANS SCHOOL POLICY ANALYSIS AND RESEARCH (EPAR)
27
PBA = f(CPR5 , Pop, GNIpc-0.125)
In this formula, the performance-based allocation (PBA) is a function of the country performance rating (CPR),
population (Pop), and GNI per capita (GNIpc). The CPR is determined by the Country Policy and Institutional
Assessment Index (CPIA) and the portfolio performance rating (PPR) using the following formula:
CPR = 0.24CPIAA-C + 0.68CPIAD + 0.08PPR
According to this formula, 24% weight is placed on economic, social, and structural policies (as represented by
parts A-C of the CPIA) and 68% weight is placed on governance, management and institutions (as represented
by part D of the CPIA). Appendix B includes more detail on the CPIA. The remaining 8% is based on the
country’s Portfolio Performance Rating (PPR), which is the proportion of a country’s World Bank projects that
were classified as successful or “problem projects” during evaluation (International Development Association,
2010).
Utz (2015) finds that Nigeria is in the bottom ten of aid recipients in terms of aid per capita and ratio of aid to
GDP. He attributes this gap to Nigeria’s relatively high per capita income and below-average rating on the
Country Policy and Institutional Assessment Index, compared to other aid recipients. He further notes that aid
to Nigeria may be affected by donor tendencies to spend resources where other donors are already active
(resulting in large shares of aid targeting a select group of countries). Utz finds that Nigeria only received 0.3%
of GDP in aid in 2005-2006, and that this allocation is 0.7% of GDP less in aid than it would have if all donors
strictly followed the PBA formula.
The author also compares Nigeria’s aid allocation with Collier & Dollar’s poverty-efficient aid allocation
formula. This cross-country allocation formula is intended to maximize poverty reduction by allocating aid
dollars where the marginal efficiency of aid in reducing poverty is the greatest, and is based on a country’s
poverty headcount ratio, population, per capita income, and the quality of its policies and institutions. Utz
finds that the poverty-efficient formula does not indicate that Nigeria should have received any additional aid.
This result does not imply that Nigeria’s poverty levels do not warrant additional aid, but rather that the
marginal efficiency of aid for poverty reduction is higher in other countries than in Nigeria, and that limited aid
flows would have a greater impact on poverty if they were allocated to those countries.
A 2015 UN report argues that Nigeria receives insufficient aid compared to other fragile states (UN, 2015). The
FFP (Fund for Fragile Peace) classifies fragile states based on 12 indicators, including demographic pressures,
uneven economic development, rule of law, and public services (FFP, 2015). Nigeria is ranked as the 14th most
fragile out of 178 countries. Of the 12 indicators, Nigeria scored most poorly on group grievances, security,
factionalized elites, state legitimacy, and public services. The UN report compares humanitarian aid received
by Nigeria and the Democratic Republic of the Congo (DRC) and finds that despite their similar fragility scores
and similar number of people living in extreme poverty, the DRC receives more than 20 times more
humanitarian assistance than Nigeria (UN, 2015). This gap may be due to differences in how “fragile” states are
defined. The World Bank classifies countries with average CPIA scores below 3.2 as “fragile states,” making
them eligible for additional grant funding. However, since 2007 Nigeria’s average score has ranged from 3.4 to
3.5, excluding it from fragile state classification for World Bank aid allocation (World Bank, 2015d).
Conclusion
Our analysis of data on economic growth and poverty in Nigeria supports the conclusions of recent studies
suggesting that poverty levels do not appear to have fallen even as GDP and GNI per capita measures have
increased. Though poor and inconsistent data quality for these and other measures affects analyses, the

EVANS SCHOOL POLICY ANALYSIS AND RESEARCH (EPAR)
28
literature indicates that Nigeria’s high unemployment, corruption, and poor educational and health outcomes
may help explain why economic growth has not led to expected reductions in poverty.
This finding supports arguments that the general cross-country association between economic growth and
reduced poverty does not necessarily hold for individual countries. The case of Nigeria indicates that aid
allocation formulas that do not separately consider measures of poverty or that place significant weight on
measures of income per capita may result in reduced aid flows to countries where economic growth is not
accompanied by reduced poverty.
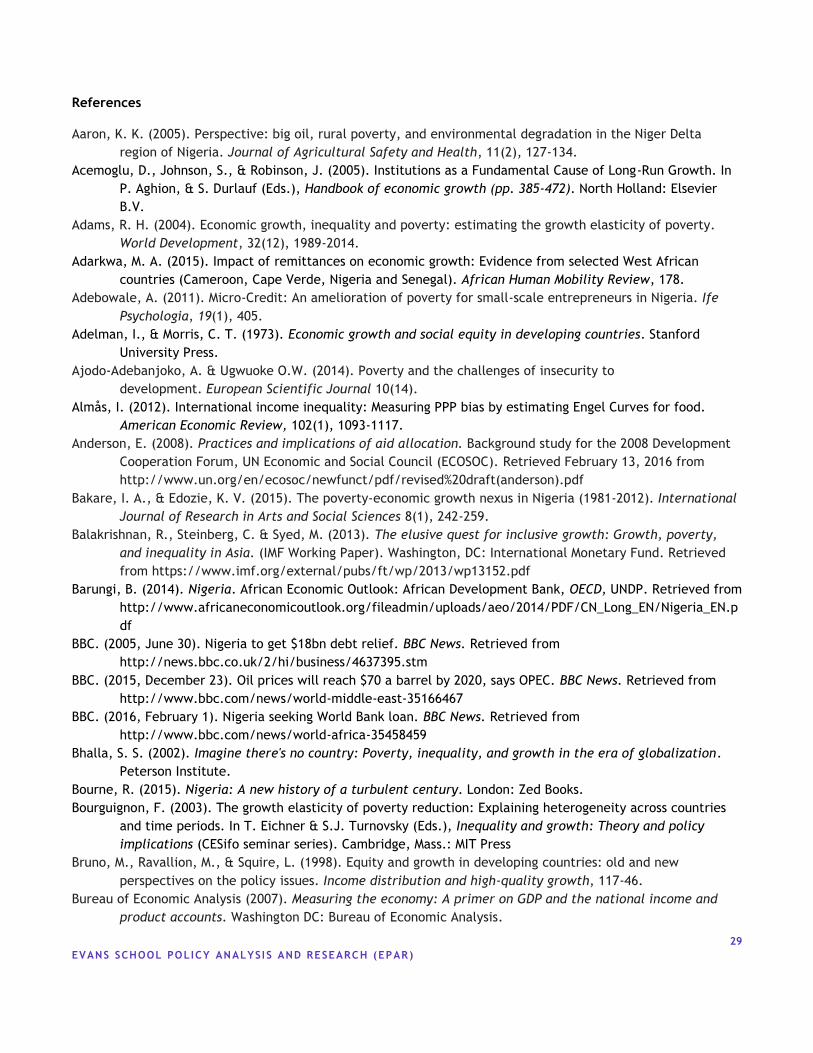
EVANS SCHOOL POLICY ANALYSIS AND RESEARCH (EPAR)
29
References
Aaron, K. K. (2005). Perspective: big oil, rural poverty, and environmental degradation in the Niger Delta
region of Nigeria. Journal of Agricultural Safety and Health, 11(2), 127-134.
Acemoglu, D., Johnson, S., & Robinson, J. (2005). Institutions as a Fundamental Cause of Long-Run Growth. In
P. Aghion, & S. Durlauf (Eds.), Handbook of economic growth (pp. 385-472). North Holland: Elsevier
B.V.
Adams, R. H. (2004). Economic growth, inequality and poverty: estimating the growth elasticity of poverty.
World Development, 32(12), 1989-2014.
Adarkwa, M. A. (2015). Impact of remittances on economic growth: Evidence from selected West African
countries (Cameroon, Cape Verde, Nigeria and Senegal). African Human Mobility Review, 178.
Adebowale, A. (2011). Micro-Credit: An amelioration of poverty for small-scale entrepreneurs in Nigeria. Ife
Psychologia, 19(1), 405.
Adelman, I., & Morris, C. T. (1973). Economic growth and social equity in developing countries. Stanford
University Press.
Ajodo-Adebanjoko, A. & Ugwuoke O.W. (2014). Poverty and the challenges of insecurity to
development. European Scientific Journal 10(14).
Almås, I. (2012). International income inequality: Measuring PPP bias by estimating Engel Curves for food.
American Economic Review, 102(1), 1093-1117.
Anderson, E. (2008). Practices and implications of aid allocation. Background study for the 2008 Development
Cooperation Forum, UN Economic and Social Council (ECOSOC). Retrieved February 13, 2016 from
http://www.un.org/en/ecosoc/newfunct/pdf/revised%20draft(anderson).pdf
Bakare, I. A., & Edozie, K. V. (2015). The poverty-economic growth nexus in Nigeria (1981-2012). International
Journal of Research in Arts and Social Sciences 8(1), 242-259.
Balakrishnan, R., Steinberg, C. & Syed, M. (2013). The elusive quest for inclusive growth: Growth, poverty,
and inequality in Asia. (IMF Working Paper). Washington, DC: International Monetary Fund. Retrieved
from https://www.imf.org/external/pubs/ft/wp/2013/wp13152.pdf
Barungi, B. (2014). Nigeria. African Economic Outlook: African Development Bank, OECD, UNDP. Retrieved from
http://www.africaneconomicoutlook.org/fileadmin/uploads/aeo/2014/PDF/CN_Long_EN/Nigeria_EN.p
df
BBC. (2005, June 30). Nigeria to get $18bn debt relief. BBC News. Retrieved from
http://news.bbc.co.uk/2/hi/business/4637395.stm
BBC. (2015, December 23). Oil prices will reach $70 a barrel by 2020, says OPEC. BBC News. Retrieved from
http://www.bbc.com/news/world-middle-east-35166467
BBC. (2016, February 1). Nigeria seeking World Bank loan. BBC News. Retrieved from
http://www.bbc.com/news/world-africa-35458459
Bhalla, S. S. (2002). Imagine there's no country: Poverty, inequality, and growth in the era of globalization.
Peterson Institute.
Bourne, R. (2015). Nigeria: A new history of a turbulent century. London: Zed Books.
Bourguignon, F. (2003). The growth elasticity of poverty reduction: Explaining heterogeneity across countries
and time periods. In T. Eichner & S.J. Turnovsky (Eds.), Inequality and growth: Theory and policy
implications (CESifo seminar series). Cambridge, Mass.: MIT Press
Bruno, M., Ravallion, M., & Squire, L. (1998). Equity and growth in developing countries: old and new
perspectives on the policy issues. Income distribution and high-quality growth, 117-46.
Bureau of Economic Analysis (2007). Measuring the economy: A primer on GDP and the national income and
product accounts. Washington DC: Bureau of Economic Analysis.

EVANS SCHOOL POLICY ANALYSIS AND RESEARCH (EPAR)
30
Burnside, C., & Dollar, D. (2000). Aid, policies, and growth. American Economic Review, 847-868.
Callen, T. (2012). Gross domestic product: An economy’s all. Washington DC: International Monetary Fund.
Retrieved from http://www.imf.org/external/pubs/ft/fandd/basics/gdp.htm
Ravallion, M., & Chen, S. (1997). What can new survey data tell us about recent changes in distribution and
poverty?. The World Bank Economic Review, 11(2), 357-382.
Chen, S., & Ravallion, M. (2010). The developing world is poorer than we thought, but no less successful in the
fight against poverty. (Policy Research Working Paper, 4703). Washington, DC: The World Bank.
Retrieved from http://siteresources.worldbank.org/JAPANINJAPANESEEXT/Resources/515497-
1201490097949/080827_The_Developing_World_is_Poorer_than_we_Thought.pdf
Chen, S., & Ravallion, M. (2012). More relatively-poor people in a less absolutely-poor world. (Policy Research
Working Paper No. 6114). Washington, DC: The World Bank. doi: 10.1111/j.1475-4991.2012.00520.x
Chenery, H., Ahluwalia, M. S., Duloy, J. H., Bell, C. L. G., & Jolly, R. (1974). Redistribution with growth;
policies to improve income distribution in developing countries in the context of economic growth.
Oxford University Press.
Cobham, A. (2014). Nigeria’s upward revision of GDP should sound alarm on tax-to-GDP ratio. Center for
Global Development Blog. Retrieved from http://www.cgdev.org/blog/nigerias-upward-revision-gdp-
should-sound-alarm-tax-gdp-ratio
Dabalen, A., Molini, V., & Mungai, R. (2013). Nigeria: Where has all the growth?: A Policy Note. Washington
DC: The World Bank. Retrieved from http://www-
wds.worldbank.org/external/default/WDSContentServer/WDSP/IB/2014/07/21/000470435_2014072111
5331/Rendered/PDF/789080REVISED00Box0377361B00PUBLIC0.pdf
Deaton, A. (2010). Price indexes, inequality, and the measurement of world poverty. The American Economic
Review, 100(1), i-34. doi: 10.1257/aer.100.1.5
Deininger, K., & Squire, L. (1996). A new data set measuring income inequality. The World Bank Economic
Review, 10(3), 565-591. doi: 10.1093/wber/10.3.565
De Janvry, A., & Sadoulet, E. (2010). Agricultural growth and poverty reduction: Additional evidence. The
World Bank Research Observer, 25(1), 1-20. doi: 10.1093/wbro/lkp015
de Wit & Crookes. (2013). Oil shock vulnerabilities & impacts: Nigeria case study. Report for the United
Kingdom for International Develoment (DFID). Retrieved from
http://r4d.dfid.gov.uk/pdf/outputs/Misc_EcoDev/61062Case-Study-Nigeria.pdf
Dickinson, E. (2011). GDP: a brief history. Foreign Policy. Retrieved from:
http://foreignpolicy.com/2011/01/03/gdp-a-brief-history/
Dollar, D., & Kraay, A. (2002). Growth is good for the poor. Journal of Economic Growth, 7(3), pp. 195-225.
doi: 10.1023/A:1020139631000
Donaldson, J. A. (2008). Growth is good for whom, when, how? Economic growth and poverty reduction in
exceptional cases. World Development, 36(11), 2127-2143. doi: doi:10.1016/j.worlddev.2007.10.020
The Economist (2014a). Step change: Revised figures show that Nigeria is Africa’s largest economy. The
Economist. Retrieved from: http://www.economist.com/news/finance-and-economics/21600734-
revised-figures-show-nigeria-africas-largest-economy-step-change
The Economist (2014b). Africa’s new number one. The Economist. Retrieved from:
http://www.economist.com/news/leaders/21600685-nigerias-suddenly-supersized-economy-indeed-
wonder-so-are-its-still-huge
EPAR (2015). Review of human development indices. EPAR Technical Report #309. Evans School of Public Policy
& Governance, University of Washington. http://evans.uw.edu/centers-projects/epar/research/epar-
technical-report-309-review-human-development-indicators

EVANS SCHOOL POLICY ANALYSIS AND RESEARCH (EPAR)
31
Fatukasi, B., & Kudaisi, B. V. (2015). What influences US official development aid to Nigeria? Journal of
Economics and Finance, 6(5), p. 21-26. Retrieved from http://www.iosrjournals.org/iosr-
jef/papers/Vol6-Issue5/Version-1/C06512126.pdf
Feng, J. & Nguyen, M.C. (2014). Relative versus absolute poverty headcount ratios: the full breakdown. Open
Data: The World Bank Data Blog. Retrieved from http://blogs.worldbank.org/opendata/relative-versus-
absolute-poverty-headcount-ratios-full-breakdown
Ferreira, F.H., & Ravallion, M. (2008). Global poverty and inequality: A review of the evidence. (Policy
Research Working Paper, 4623). Washington, DC: The World Bank. doi: 10.1596/1813-9450-4623
FFP (2015). Fragile states index 2015. Fund for Fragile Peace. Retrieved from
http://fsi.fundforpeace.org/rankings-2015
Garroway, C. & de Laiglesia, J.R. (2012). On the relevance of relative poverty for developing countries.
(Working Paper No. 314). Paris, France: OECD Development Centre. doi: 10.1787/18151949
Gupta, S., Davoodi, H., & Alonso-Terme, R. (2002). Does corruption affect income inequality and poverty?.
Economics of governance, 3(1), 23-45.
Gylfason, Thorvaldur, and Gylfi Zoega. 2003. "Inequality and Economic Growth: Do Natural Resources Matter?"
In Inequality and Growth: Theory and Policy Implications, (Eds.) Theo S. Eicher and Stephen J.
Turnovsky, 255-92. Cambridge and London: MIT Press, 255-92
Hassan, O. M. (2015). The impact of the growth rate of the gross domestic product (GDP) on poverty reduction
in Nigeria. International Journal of Business Administration, 6(5), 90. doi:10.5430/ijba.v6n5p90
Imoughele, L. E., & Ismaila, M. (2013). Effect of public educational expenditure on economic growth in Nigeria
(1980-2010). Interdisciplinary Journal of Contemporary Research In Business, 4(11), 237.
Iorja, G. V., Charles, U. E., & Ibrahim, J. E. (2014). The impact of political reform programme on the
development of the Nigerian economy (1999-2013). International Journal of Physical and Social
Sciences, 4(10), 14.
Islam, R. (2004). The nexus of economic growth, employment and poverty reduction: An empirical analysis.
Recovery and Reconstruction Department, International Labour Office.
Jerven, M. (2012). For richer, for poorer: GDP revisions and Africa's statistical tragedy. African Affairs,
112(446), p. 138-147. doi: 10.1093/afraf/ads063
Johnson, A. (2014). Poverty in Nigeria increasing despite GDP growth. The Borgen Project.
http://borgenproject.org/poverty-in-nigeria/
Kolawole, B. O., Omobitan, O. A., & Yaqub, J. O. (2015). Poverty, inequality and rising growth in Nigeria:
Further Empirical Evidence. International Journal of Economics and Finance, 7(2), 51. doi:
10.5539/ijef.v7n2p51
Kottasova, I. (2015). Nigeria is running out of cash. CNN Money. Retrieved from
http://money.cnn.com/2016/02/01/investing/nigeria-opec-oil/
Kuznets, S. (1963). Quantitative aspects of the economic growth of nations: VIII. Distribution of income by size.
Economic development and cultural change, 11(2), 1-80.
Leke, A., Fiorini, R., Dobbs, R., Thompson, F., Suleiman, A., & Wright, D. (2014). Nigeria’s renewal: Delivering
inclusive growth. McKinsey Global Institute Insight and Publications.
Leo, B. (2014). Beyond the headlines: 3 under-reported stories about Nigeria’s 90% GDP boost. Center for
Global Development Blog, 8. Retrieved from: http://www.cgdev.org/blog/beyond-headlines-3-under-
reported-stories-about-nigerias-90-gdp-boost
Loayza, N. V., & Raddatz, C. (2010). The composition of growth matters for poverty alleviation. Journal of
Development Economics, 93, 137-151.

EVANS SCHOOL POLICY ANALYSIS AND RESEARCH (EPAR)
32
Mathews, R. (2012). GDP and the US economy: 3 ways to measure economic production. Policy.Mic. Retrieved
from: http://mic.com/articles/14943/gdp-and-the-us-economy-3-ways-to-measure-economic-
production#.PSaVqWf6s
Mauro, P. (1995). Corruption and growth. The quarterly journal of economics, 681-712. Retrieved from
http://www.jstor.org/stable/2946696
Milanovic, B. (2013). Global income inequality in numbers: In history and now. Global Policy, 4(2). doi:
10.1111/1758-5899.12032
Morduch, J. (2005). Poverty measures. In United Nations Statistics Division (Ed.), Handbook on Poverty
Statistics: Concepts Methods and Policy Use (pp. 52-84). Retrieved from
http://unstats.un.org/unsd/methods/poverty/pdf/un_book%20final%2030%20dec%2005.pdf
Morell, D. (2011, January-February). Who is poor? Harvard Magazine. Retrieved from
http://harvardmagazine.com/2011/01/who-is-poor
Nigeria National Bureau of Statistics (NBS) (2012). Annual Abstract of Statistics. Retrieved from
http://www.nigerianstat.gov.ng/pdfuploads/annual_abstract_2012.pdf
Nigeria National Bureau of Statistics (NBS) (2015). Measuring Better: Frequently asked questions on the
rebasing/re-benchmarking of Nigeria’s gross domestic product. Nigeria National Bureau of Statistics.
Nwabuzor, A. (2005). Corruption and development: new initiatives in economic openness and strengthened rule
of law. Journal of Business Ethics, 59(1-2), 121-138. doi: 10.1007/s10551-005-3402-3
Nwankwo, O. F. (2014). Impact of corruption on economic growth in Nigeria. Mediterranean Journal of Social
Sciences, 5(6), 41. doi: 10.5901/mjss.2014.v5n6p41
OECD (2006). African Economic Outlook: Nigeria. Retrieved from http://www.oecd.org/dev/36741748.pdf
OECD (2014). African Economic Outlook: Nigeria. Retrieved from
http://www.africaneconomicoutlook.org/fileadmin/uploads/aeo/2014/PDF/CN_Long_EN/Nigeria_EN.p
df
OECD (2015). OECD.Stat: Development flows by provider and recipient. Retrieved from http://stats.oecd.org/
OECD (2015b). Purchasing power parities: Frequently asked questions (FAQs). Retrieved from
http://www.oecd.org/std/prices-ppp/purchasingpowerparities-frequentlyaskedquestionsfaqs.htm
Omanuefeme, S. (2014). Why Nigeria delayed GDP rebasing for twenty-four years. This Day Live. Retrieved
from http://www.thisdaylive.com/articles/why-nigeria-delayed-gdp-rebasing-for-twenty-four-
years/175494/
Offiong, I. A., & Atsu, I. A. (2014). Determinants of foreign direct investment in Nigeria. International Review
of Management and Business Research,3(3), 1538. Retrieved from
http://www.irmbrjournal.com/papers/1411277790.pdf
Oseni, E., & Oseni, E. F. (2015). Achieving inclusive economic growth and development in Nigeria through
MSMEs. Journal of Economic & Financial Studies, 3(04), 30-40. doi: 10.18533/jefs.v3i03.126
Oshikoya, T. W. (2008). Nigeria in the global economy: Nigeria’ s integration into the global economy is below
its potential. Business Economics.
Oyewale, I., & Amusat, W. (2013). Impact of globalisation on poverty reduction in Nigeria. Interdisciplinary
Journal of Contemporary Research In Business, 4(11), 475-484.
Ravallion, M. (1997). Can high-inequality developing countries escape absolute poverty?. Economics letters,
56(1), 51-57.
Roemer, M., & Gugerty, M. K. (1997). Does economic growth reduce poverty?. CAER II, 499.
Ross, M. (2012). The oil curse: how petroleum wealth shapes the development of nations. Princeton University
Press.
Schaffner, J. (2014). Development economics: Theory, empirical research, and policy analysis. Hoboken, NJ:
John Wiley & Sons, Inc.

EVANS SCHOOL POLICY ANALYSIS AND RESEARCH (EPAR)
33
Schreye, P., & Koechlin, F. (2002). Purchasing power parities – measurement and uses. OECD. Retrieved from
http://www.oecd.org/std/prices-ppp/2078177.pdf
Siddig, K., Aguiar, A., Grethe, H., Minor, P., & Walmsley, T. (2014). Impacts of removing fuel import subsidies
in Nigeria on poverty. Energy Policy, 69, 165-178. doi:10.1016/j.enpol.2014.02.006
Son, H. H., & Kakwani, N. (2004). Economic growth and poverty reduction: Initial conditions matter.
(International Poverty Centre Working Paper 2). New York, NY: United Nations Development
Programme [UNDP].
UN (2015). Improving ODA allocation for a post-2015 world. United Nations. Retrieved from
http://www.un.org/en/ecosoc/newfunct/pdf15/un_improving_oda_allocation_for_post-
2015_world.pdf
UNDP (2011). The real wealth of nations: Pathways to human development, 2010. United Nations Development
Program. pp. 72–74. Retrieved from
http://hdr.undp.org/sites/default/files/reports/270/hdr_2010_en_complete_reprint.pdf
UNDP (2015). Multidimensional poverty index: Changes over time. Human Development Reports. United Nations
Development Program. Retrieved from http://hdr.undp.org/en/composite/MPIchanges
Utz, R. J. (2011). Will countries that receive insufficient aid please stand up. IDA Resource Mobilization
Department. Retrieved from http://www.oecd.org/development/effectiveness/46859477.pdf
Van der Ploeg, F. (2011). Natural resources: Curse or blessing? Journal of Economic Literature, 366-420. doi:
10.1257/jel.49.2.366
Wieser, C. (2011). Determinants of the growth elasticity of poverty reduction: Why the impact on poverty
reduction is large in some developing countries and small in others. Paper presented at the 15th Annual
Conference on Global Economic Analysis, Geneva, Switzerland. Retrieved from
www.gtap.agecon.purdue.edu
World Bank (2007). The UK-Nigeria remittance corridor: Challenges of embracing formal transfer systems in a
dual financial environment. Washington DC: The World Bank. Retrieved from
http://hdl.handle.net/10986/6654
World Bank (2009). Poverty measures [PowerPoint slides]. Retrieved from
http://info.worldbank.org/etools/docs/library/93518/Hung_0603/Hu_0603/Module4MeasuringPovertyM
easures.pdf
World Bank Operations Policy and Country Services. (2010). Country Policy and Institutional Assessments: 2010
Assessment Questionnaire. Retrieved from http://www.worldbank.org/ida/IRAI/2010/CPIA-criteria-
2010.pdf
World Bank (2011). Growth elasticity of poverty. Washington DC: The World Bank. Retrieved from
http://web.worldbank.org/WBSITE/EXTERNAL/TOPICS/EXTPOVERTY/EXTPGI/0,,contentMDK:21932026~
menuPK:5461555~pagePK:210058~piPK:210062~theSitePK:342771,00.html
World Bank (2013). Nigeria economic report No. 1. Washington DC: The World Bank. Retrieved from
https://openknowledge.worldbank.org/bitstream/handle/10986/16568/776840WP0Niger0Box0342041B
00PUBLIC0.pdf?sequence=1
World Bank (2014a). Nigeria economic report: Improved economic outlook in 2014, and prospects for continued
growth look good. Washington DC: The World Bank. Retrieved from
http://www.worldbank.org/en/country/nigeria/publication/nigeria-economic-report-improved-
economic-outlook-in-2014-and-prospects-for-continued-growth-look-good
World Bank (2014b). Nigeria economic update: World Bank cites positive economic trends and progress in
poverty reduction. Washington DC: The World Bank. Retrieved from
http://www.worldbank.org/en/news/press-release/2014/07/22/nigeria-economic-update-world-bank-
cites-positive-economic-trends-and-progress-in-poverty-reduction

EVANS SCHOOL POLICY ANALYSIS AND RESEARCH (EPAR)
34
World Bank (2014c). Nigeria economic report No. 2. Washington DC: The World Bank. Retrieved from
https://openknowledge.worldbank.org/bitstream/handle/10986/19980/896300WP0Niger0Box0385289B
00PUBLIC0.pdf?sequence=1
World Bank (2015a). FAQs: Global poverty line update. Washington DC: The World Bank. Retrieved from
http://www.worldbank.org/en/topic/poverty/brief/global-poverty-line-faq
World Bank (2015b). World Bank data: Nigeria. Washington DC: The World Bank. Retrieved from
http://data.worldbank.org/country/nigeria
World Bank (2015c). Measuring inequality. Washington DC: The World Bank. Retrieved from
http://go.worldbank.org/3SLYUTVY00
Yohanna, P. (n.d.). Macroeconomic determinants of foreign direct investment and economic transformation in
Nigeria, 1981–2010: An Empirical Evidence. Insight on Africa, 5(1), 55-82. doi:
10.1177/0975087813512055
Yusuf, M., Malarvizhi, C., Mazumder, M., & Su, Z. (2014). Corruption, poverty, and economic growth
relationship in the Nigerian economy. The Journal of Developing Areas, 48(3), 95-107. doi:
10.1353/jda.2014.0042
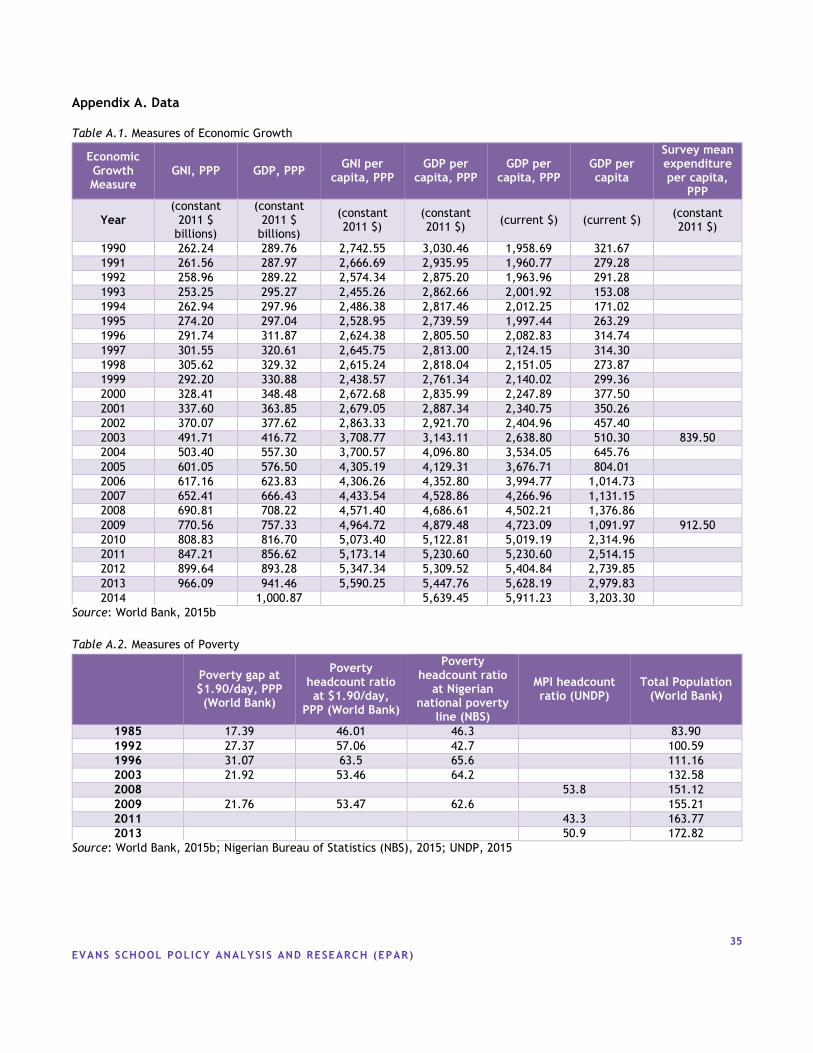
EVANS SCHOOL POLICY ANALYSIS AND RESEARCH (EPAR)
35
Appendix A. Data
Table A.1. Measures of Economic Growth
Economic Growth Measure
GNI, PPP GDP, PPP GNI per
capita, PPP GDP per
capita, PPP GDP per
capita, PPP GDP per capita
Survey mean expenditure per capita,
PPP
Year (constant
2011 $ billions)
(constant 2011 $
billions)
(constant 2011 $)
(constant 2011 $)
(current $) (current $) (constant 2011 $)
1990 262.24 289.76 2,742.55 3,030.46 1,958.69 321.67
1991 261.56 287.97 2,666.69 2,935.95 1,960.77 279.28
1992 258.96 289.22 2,574.34 2,875.20 1,963.96 291.28
1993 253.25 295.27 2,455.26 2,862.66 2,001.92 153.08
1994 262.94 297.96 2,486.38 2,817.46 2,012.25 171.02
1995 274.20 297.04 2,528.95 2,739.59 1,997.44 263.29
1996 291.74 311.87 2,624.38 2,805.50 2,082.83 314.74
1997 301.55 320.61 2,645.75 2,813.00 2,124.15 314.30
1998 305.62 329.32 2,615.24 2,818.04 2,151.05 273.87
1999 292.20 330.88 2,438.57 2,761.34 2,140.02 299.36
2000 328.41 348.48 2,672.68 2,835.99 2,247.89 377.50
2001 337.60 363.85 2,679.05 2,887.34 2,340.75 350.26
2002 370.07 377.62 2,863.33 2,921.70 2,404.96 457.40
2003 491.71 416.72 3,708.77 3,143.11 2,638.80 510.30 839.50
2004 503.40 557.30 3,700.57 4,096.80 3,534.05 645.76
2005 601.05 576.50 4,305.19 4,129.31 3,676.71 804.01
2006 617.16 623.83 4,306.26 4,352.80 3,994.77 1,014.73
2007 652.41 666.43 4,433.54 4,528.86 4,266.96 1,131.15
2008 690.81 708.22 4,571.40 4,686.61 4,502.21 1,376.86
2009 770.56 757.33 4,964.72 4,879.48 4,723.09 1,091.97 912.50
2010 808.83 816.70 5,073.40 5,122.81 5,019.19 2,314.96
2011 847.21 856.62 5,173.14 5,230.60 5,230.60 2,514.15
2012 899.64 893.28 5,347.34 5,309.52 5,404.84 2,739.85
2013 966.09 941.46 5,590.25 5,447.76 5,628.19 2,979.83
2014 1,000.87 5,639.45 5,911.23 3,203.30
Source: World Bank, 2015b
Table A.2. Measures of Poverty
Poverty gap at $1.90/day, PPP (World Bank)
Poverty headcount ratio at $1.90/day,
PPP (World Bank)
Poverty headcount ratio
at Nigerian national poverty
line (NBS)
MPI headcount ratio (UNDP)
Total Population (World Bank)
1985 17.39 46.01 46.3 83.90
1992 27.37 57.06 42.7 100.59
1996 31.07 63.5 65.6 111.16
2003 21.92 53.46 64.2 132.58
2008 53.8 151.12
2009 21.76 53.47 62.6 155.21
2011 43.3 163.77
2013 50.9 172.82
Source: World Bank, 2015b; Nigerian Bureau of Statistics (NBS), 2015; UNDP, 2015

EVANS SCHOOL POLICY ANALYSIS AND RESEARCH (EPAR)
36
Appendix B. Country Policy and Institutional Assessment (CPIA)6
The Country Policy and Institutional Assessment (CPIA) is an annual rating of countries against a set of 16
criteria grouped in four clusters: economic management, structural policies, policies for social inclusion and
equity, and public sector management and institutions. The CPIA covers 95 countries in the following regions:
East Asia & Pacific, Europe & Central Asia, Latin America & Caribbean, Middle East & North Africa, South Asia,
and Sub-Saharan Africa. The CPIA was significantly revised in 2004, reducing the number of criteria from 20 to
16, changing the ratings from a 5 to a 6 point scale, and introducing an equal weighting procedure for
calculating the CPIA.
The CPIA “ratings process involves two key phases. In the benchmarking phase a small, representative sample
of countries drawn from all Regions is rated; in the second phase, staff rate the remaining countries using
benchmark countries’ scores as guideposts.” According to the World Bank Operations Policy and Country
Services department, “The benchmarking phase helps ensure that, given the criteria, the ratings are set at the
right level and are consistent across countries and Regions.” Following the benchmarking phase, “Country
teams prepare ratings proposals that are accompanied by a written justification. These proposals are reviewed
within the respective Region by the Chief Economist and then submitted to a Bank-wide review by the
Networks and Central Departments.”
The 16 CPIA criteria are grouped into four clusters:
A. Economic Management (3): macroeconomic management, fiscal policy, and debt policy B. Structural Policies (3): trade, financial sector, and business regulatory environment C. Policies for Social Inclusion and Equity (5): gender equality, equity of public resource use, building
human resources, social protection and labor, and policies and institutions for environmental sustainability
D. Public Sector Management and Institutions (5): property rights and rule-based governance, quality of budgetary and financial management, efficiency of revenue mobilization, quality of public administration, and transparency, accountability, and corruption in the public sector
Countries are rated on their current status in relation to the criteria and to the benchmark countries. The
ratings are intended to measure a country’s level of performance rather than any improvement in performance
compared to previous ratings, and are based on actual policies and institutions as opposed to proposals or
plans.
6 Source: World Bank Operations Policy and Country Services’ 2010 CPIA Assessment Questionnaire