Embed Size (px)
Citation preview
DPRIETI Discussion Paper Series 03-E-015
Economic Growth of Japan and the United Statesin the Information Age
Dale W. JORGENSONHarvard University
MOTOHASHI KazuyukiRIETI
The Research Institute of Economy, Trade and Industryhttp://www.rieti.go.jp/en/

1
RIETI Discussion Paper Series 03-E-015
Economic Growth of Japan and the United States in the Information Age
By Dale W. Jorgenson1 and Kazuyuki Motohashi2
July 2003
Abstract
In this paper we compare sources of economic growth in Japan and the United States from
1973 through 2000, focusing on the role of information technology (IT). We have adjusted
Japanese data to conform to U.S. definitions in order to provide a rigorous comparison
between the two economies. The contribution of information technology to economic growth
was strikingly similar in Japan and the United States in the last half of the 1990’s. The
growth rate of the Japanese economy declined drastically in the early 1990’s, but revived
modestly during the last half of the decade. In this period the share of the Japanese gross
domestic product devoted to investment in computers, telecommunications equipment, and
software rose sharply and the rate of total factor productivity growth increased. However, the
contributions of labor input and other sources of growth in Japan lagged far behind those in
the United States.
JEL Classification: D24, 30, O57
1 Samuel W. Morris University Professor, Department of Economics, Harvard University 2 Associate Professor, Institute of Innovation Research of Hitotsubashi University and Senior Fellow of Research Institute of Economy, Trade and Industry. E-mail: [email protected]

2
1. Introduction
Jorgenson (2002b) has shown that a substantial portion of the growth resurgence of the U.S.
economy after 1995 can be attributed to advances in information technology (IT). The rapid
growth in U.S. labor productivity during the economic slowdown that began in 2001 suggests
that prospects for potential growth of the U.S. economy have been considerably enhanced.3
By contrast, the Japanese economy of the 1990’s appeared to be mired in a slump that
followed the collapse of the “bubble economy” of the 1980’s. This leads to the question, has
the Japanese economy failed to benefit from advances in information technology?
There are many examples of cutting-edge businesses in the U.S., such as Dell and Wal-Mart,
that produce and use information technology effectively. While it is often argued that major
Japanese businesses do not fully utilize information systems, research conducted in Japan
shows that the burgeoning levels of IT investment by businesses during the last half of the
1990’s did contribute substantially to increased labor productivity growth.4 It is clear that
the impact of investment in IT on both the Japanese and U.S. economies has been very
substantial. But how and to what degree do the effects of this investment differ between the
two countries?
In order to compare the relationships between investment in information technology
equipment and software and productivity growth in Japan and the United States, it is
essential to eliminate the differences in treatment of IT in the official statistics. Under the
United Nations System of National Accounts of 1993 (SNA93)5 Software is recognized as an
investment in both countries, but the definitions are different. Second, prices of equipment
and software must be measured in a consistent way, reflecting the advances in information
3 Jorgenson, Ho, and Stiroh (2002b) have analyzed the potential growth of the U.S. economy. 4 See Economic Research Institute, Economic Planning Agency (2000). 5 See United Nations (1993).

3
technology that are taking place.
We have adopted the framework of Jorgenson (2002a) for analyzing the relationship between
investment in information technology and economic growth, incorporating the effects of IT
investment by the household and government sectors as well as the business sector. An
important objective of this paper is to develop data for Japan that are comparable to those of
the U.S. National Income and Product Accounts (NIPA). We have constructed new data on
software investment for Japan and “internationally harmonized” IT prices in order to
generate comparable data on IT investments for Japan and the U.S. Finally, we have
compared the results with the official Japanese statistics.
In the following section we present an analytical framework based on the production
possibility frontier introduced by Jorgenson (1995c).6 In Section 3 we describe the data on
investment in information technology equipment and software for Japan and the U.S. and
address the issues that must be resolved in order to harmonize the data for the two countries.
In Section 4 we present the results of our analysis of the role of information technology in the
growth of the Japanese and U.S. economies. Finally, we summarize our conclusions and
outline the agenda for future research.
2. Theoretical framework
(1) Role of Information Technology in Economic Growth
Moore’s Law states that the density of semiconductor chips doubles in every 18-24 months
and this pace of technological progress has continued for more than three decades. Doubling
every 18 months is equivalent to increasing the density of chips by 100 times every 10 years.
The staggering rate of technical progress in the IT-producing industries -- semiconductors,
computers, software, and telecommunications equipment – has led to a very rapid decline in
IT prices. This price decline has continually stimulated the deployment of IT equipment and
6 This framework is used by Jorgenson and Stiroh (2002), Jorgenson (2002), and Jorgenson, Ho, and Stiroh (2002a).

4
software by the IT-using industries in Japan and the United States.
For example, in 1990 a typical personal computer (PC) used Intel’s 386 microprocessor with a
clock speed of 20 megahertz (MHz) for the central processing unit. Intel’s Pentium 4
processor, used in today’s PCs, has a clock speed of 2.8 gigahertz (GHz) -- 140 times as fast.
However, the price of a personal computer in Japan has changed very little, varying within a
range of 200,000-500,000 yen. The technological progress in PC’s can be observed in the rapid
improvements in performance, rather than the decline in the price of a typical machine.
The key to capturing the rapid development of information technology is the construction of a
constant-quality price index for IT equipment and software that holds performance constant.
Economic statisticians in Japan and the United States have used prices for matched models
of IT products in overlapping time periods, as well as hedonic models of IT prices, to
construct constant-quality price indexes. However, the methodology for price statistics differs
between the two countries, making international comparisons difficult. We will return to this
issue in the section on price data for Japan and the United States.
(2) Production Possibility Frontier Approach
In order to capture the rapid pace of decline of IT prices, we employ the production possibility
frontier introduced by Jorgenson (1995c).
),,,,(),C , , , ,( n LKKKKXACIIIIY tscnctscn ⋅= . (1)
Aggregate output Y consists of non-IT investment goods nI , computer investment cI , software
investment sI , investment in communications equipment tI , consumption of non-IT goods
and services nC , and consumption of IT capital services by governments and households cC .
Aggregate input X consists of non-IT capital services nK , computer services cK , software
services sK , communications equipment services tK , and labor services L. Total factor
productivity (TFP) is denoted A.

5
The major advantage of this approach is the explicit role it provides for modeling the impacts
of relative price changes between IT and non-IT outputs and inputs. For example, a
constant-quality price index for computers is used in constructing computer investment data
on the output side. In addition, the computer price index is included in the rental price of
computer capital services on the input side and computer investment is incorporated into the
estimate of the stock of computers used in production. These data are used on modeling the
substitution between computers and other outputs, as well as the substitution between the
services of computers and other productive inputs.
Since the production possibility frontier describes the efficient combinations of outputs and
inputs for the economy as a whole, the external costs of adjustment in levels of output or
input are fully reflected in the prices of these components. For this reason the production
possibility frontier is preferable to the principal competing methodology, based on the
aggregate production function. The aggregate production function approach fails to treat
relative price differences in output components explicitly and does not incorporate costs of
adjustments in output or input components.7
Under the assumption that product and factor markets are competitive, producer
equilibrium implies that the sum of share weighted growth of outputs is the sum of
share-weighted growth of inputs and growth in total factor productivity:
ALvKvKvKvKvCwCwIwIwIwIw
LttKssKccKnnK
cccnncttIssIccInnI
lnlnlnlnlnlnlnlnlnlnlnln
,,,,
,,,,,,
∆+∆+∆+∆+∆+∆
=∆+∆+∆+∆+∆+∆ (2)
where w and v denote average value shares of outputs and inputs, respectively, in adjacent
time periods.
The shares of outputs and inputs add to one under the assumption of constant returns:
1....,,,,,, =++++=+++++ LtKsKcKnKcCnCtIsIcInI vvvvvwwwwww (3)
7 See Jorgenson, Ho, and Stiroh (2002a) for more detail on this point.

6
In equation (2), the growth rate of outputs is a weighted average of growth rate of
investments and consumption goods outputs. Similarly, the growth rate of inputs is a
weighted average of growth rates of capital and labor services inputs. The contribution of
TFP is derived as the difference between growth rates of output and input.
(2) Theory of Capital Service Inputs
Data on output and labor input can be collected directly from transactions in product and
labor markets. By contrast data for capital stock and capital service prices must be imputed
from market transactions in investment goods. We next review the measurement of capital
stock and capital service prices.8 Since capital stock in the current time period tK , is
comprised of capital goods acquired in previous time periods τ−tA and the efficiency of capital
services τd varies with the vintage τ of capital goods, tK may be expressed as follows:
∑∞
=−=
0τττ tt AdK (4)
If we define the mortality rate τm as the rate of decline in efficiency τd for each vintage, the
difference in capital stock between two adjacent periods is:
tttttttt RAAmAAddAKK −=−=−+=− ∑∑∞
=−
∞
=−−−
1111 )(
τττ
ττττ , (5)
where tR represents the replacement requirement or the decrease in capital stock due to
morality. If, in addition, efficiency declines at a constant rate δ, capital stock takes the form:
11 )1( −− −+=−+= tttttt KARKAK δ (6)
Similarly, the price of capital services or the rental price of using a unit of capital stock for
one time period is derived from the following capital-market non-arbitrage condition: the
price of capital goods is the sum of future capital rentals. The price of capital goods can be
8 Description of this section is based on the duality between investment and capital service prices developed by Jorgenson (1996b).
7
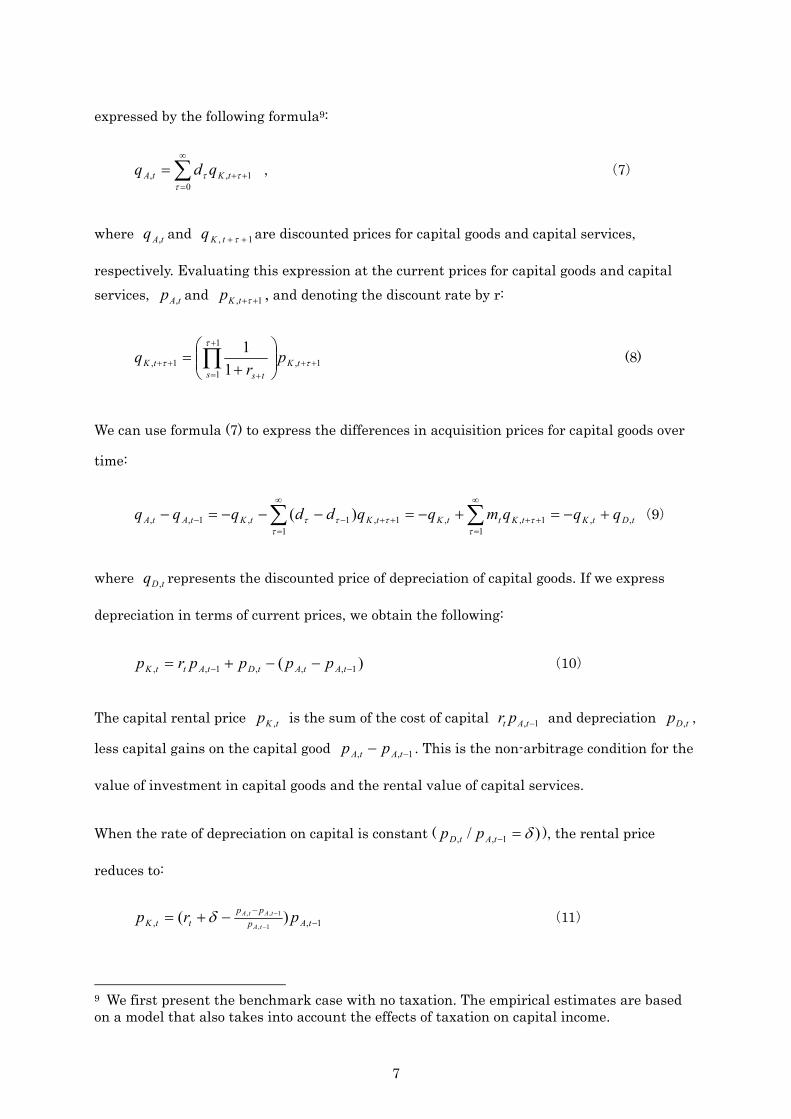
expressed by the following formula9:
∑∞
=++=
01,,
τττ tKtA qdq , (7)
where tAq , and 1, ++τtKq are discounted prices for capital goods and capital services,
respectively. Evaluating this expression at the current prices for capital goods and capital services, tAp , and 1, ++τtKp , and denoting the discount rate by r:
1,
1
11, 1
1++
+
= +++
+
= ∏ τ
τ
τ tKs ts
tK pr
q (8)
We can use formula (7) to express the differences in acquisition prices for capital goods over
time:
tDtKtKttKtKtKtAtA qqqmqqddqqq ,,1
1,,1
1,1,1,, )( +−=+−=−−−=− ∑∑∞
=++
∞
=++−−
ττ
ττττ (9)
where tDq , represents the discounted price of depreciation of capital goods. If we express
depreciation in terms of current prices, we obtain the following:
)( 1,,,1,, −− −−+= tAtAtDtAttK pppprp (10)
The capital rental price tKp , is the sum of the cost of capital 1, −tAt pr and depreciation tDp , ,
less capital gains on the capital good 1,, −− tAtA pp . This is the non-arbitrage condition for the
value of investment in capital goods and the rental value of capital services.
When the rate of depreciation on capital is constant ( )/ 1,, δ=−tAtD pp ), the rental price
reduces to:
1,, )(1,
1,,−
−
−
−−+= tAppp
ttK prptA
tAtAδ (11)
9 We first present the benchmark case with no taxation. The empirical estimates are based on a model that also takes into account the effects of taxation on capital income.

8
A higher rate of depreciation requires the recovery of investment over a shorter period of
time and the capital rental cost increases. Similarly, if the price of a capital good is
decreasing more rapidly, a greater future capital loss must be anticipated and the capital
rental cost increases.
Even if the prices of two capital goods are the same, the rates of depreciation and rates of
change in the prices of capital goods may differ, leading to different capital rental costs.
Equation (11) is the formula we use for imputing the rental prices of capital services from the
prices of investment goods. However, this formula ignores the effects of taxation of capital
income. The formula must be modified possibility to incorporate taxes, as shown by
Jorgenson and Yun (2001). The actual formulas used in this study will be described in a later
section.
3. Data
(1) Output data
The data for Japan used in our analysis are comparable to the U.S. data presented in (2002b).
We distinguish three sectors of the Japanese economy – businesses, governments, and
households. The structure of the data is presented in Table 1.
(Table 1)
Output data are based on official estimates of gross domestic product (GDP) published by the
Economic and Social Research Institute (ESRI) in the Cabinet of Office of the Japanese
Government.
In 2000 the Japanese System of National Accounts was revised to comply with United
Nations (1993) System of National Accounts (SNA93). The major points of revision of the
nominal value of GDP were (1) adding custom-made software to private and public
investments and (2) adding depreciation of public infrastructure to government consumption.

9
ESRI estimated that the impact of these accounting changes led to a 2.0% upward shift in
the level of GDP in 1995 and an upward shift of 0.2% in the annual growth rate GDP in
constant prices in 1998 and 1999.
Our study uses the SNA93 current price GDP for Japan as a starting point10. We adjust these
data in order to achieve comparability with U.S. data, based on the U.S. National Income
and Product Accounts (NIPA). One major difference between the Japanese SNA93 and NIPA
is in the treatment of software. The Japanese SNA93 treats custom software as an
investment, while the U.S. NIPA also includes prepackaged and own-account software in
investment. Therefore, we have estimated investment in prepackaged and own-account
software in Japan and added this to the official Japanese GDP.
Since the household sector is included in the production sector, the capital service flow from
consumer durables must be treated as both an output and input of households. In the
Japanese SNA and the U.S. NIPA only capital services from owner-occupied housing is
imputed and included in the GDP. We have treated other types of consumer durables,
including information technology equipment and software, in the same way as housing. We
have imputed the value of capital services for households and governments and added this to
GDP for Japan and the U.S., following Jorgenson (2002b).
The government sector is also included in the production sector, so that the capital services
from government capital must be treated as an output and input of governments. In the
Japanese SNA and the U.S. NIPA only depreciation from government capital is imputed and
included in the GDP. However, depreciation is only one component of the price of capital
services (11), so that we add the cost of capital and capital losses due to declines in asset
prices to the value of government capital services. This makes the treatment of government
capital symmetrical to business and household capital.
Table 2 compares output data for Japan in current prices of 2000 used in this study with the
10 ESRI published historical SNA93 data back to 1980. Prior to 1980 only SNA68 data are available. Therefore, we extend SNA93 data backward by using growth rates of SNA68 data.

10
official Japanese GDP. The value of GDP in this study in 2000 is about 533 trillion yen,
which is about 20 trillion yen greater than the official GDP based on SNA93. About four
trillion yen comes from adding prepackaged and own-account software investment in
business, government, and household sectors and about 15 trillion yen comes from the
capital service flow from consumer durables.
(Table 2)
We also note the difference between methods for deflating the current value of GDP to obtain
GDP in constant prices in the Japanese SNA and the U.S. NIPA. In Japan a fixed-weight
system of price deflators, based on weights of 1995, is used; the base year is revised every
five years. By contrast the U.S. NIPA applies a chain-weighted price index as a deflator.
Since the share of information technology equipment and software in GDP is increasing, the
role of IT in the Japanese economy will be under-estimated relative to the U.S. In order to
achieve greater comparability with U.S. data, we estimate IT and non-IT components
separately for Japan and apply a flexible weighting scheme to estimate the rate of growth of
output.
(2) Input data
(a) investment in information technology equipment and software
In order to make comparisons of the impact of investment in information technology
equipment and software between countries, it is important to use a common definition of IT.
The U.S. NIPA publishes both nominal and real values of investment by category of capital
goods. Jorgenson (2002b) used the following categories of IT-related investment: computers
and equipment, software, and communication equipment. In this study, we have defined
IT-related investment for Japan in the same way11.
11 Specifically, the categories for computers (1995 IO category: 3311011) and computer peripherals (3311021) correspond to "computers and equipment," and television and radio (3211021), video (3211031), cable communications devices (3321011), and wireless communications devices (3321021) correspond to “communications equipment.”

11
We have generated investment in IT equipment for Japan that is comparable to the U.S.
NIPA by using the existing Japanese input-output tables. However, as discussed in the
previous section, the definition of software in the Japanese SNA is different from the
definition in the U.S. NIPA. Japanese GDP data, based on SNA93, include only custom-made
software; prepackaged and own-account software are excluded. Therefore, we have estimated
the software investments in these categories in order to match the U.S. definition.
Since investment in prepackaged software is treated as an intermediate input in the
Japanese input-output tables, it is straightforward to calculate public-sector and
private-sector capital formation. In addition, the Ministry of Economy, Trade, and Industry’s
(METI) Survey on Selected Service Industries provides data on investment in prepackaged
and custom-made software. Therefore, we estimate investment in both prepackaged software
and custom-made software from this survey, as well as benchmark input-output tables for
every five years.
Neither Japan’s input-output tables nor METI’s Survey of Selected Service Industries
includes investment in own-account software. For this reason, we have estimated investment
using methods similar to those used for the U.S. NIPA, described in Parker and Grimm
(2000). Specifically, we have estimated labor expenses for software development by
employees in industries other than the information technology sector, which produces
custom-made and prepackaged software.
Finally, Jorgenson (2002b) used expenditures on computers and software from Private
Consumption Expenditure (PCE) in NIPA to estimate investment in IT equipment and
software in the household sector12. Similarly, government expenditures on IT equipment and
software were taken from NIPA. We have employed data from the Survey of Selected Service
Industries as well as household and government consumption of software in the Japanese
benchmark input-output tables to estimate investment in IT equipment and software in the
12 The corresponding sectors of the Japanese input-output tables are those for computers (1995 IO category: 3311011), computer peripherals (3311021), cable communications devices (3321011), wireless communications devices (3321021), and software (8512011).

12
household and government sectors.
(b) Capital services
In order to estimate capital services as precisely as possible, we have estimated capital stock
and capital service prices by detailed category of investment goods. This enables us to take
into account changes in the composition of capital stock. We have captured the process of
improvement in the quality of capital associated with the substitution of investment goods
with high marginal products, such as information technology equipment and software, for
goods with lower marginal products, such as non-IT investment goods.
Based on Japan’s benchmark input-output tables every five years, as well as METI’s annual
extension tables with more than 500 commodity categories, we have estimated investment by
62 commodity groups for business and government sectors and 20 commodity groups for the
household sector from 1970 to 1990. We have deflated this current price investment by the
Wholesale Price Index constructed by the Bank of Japan for business and government
investment and by the Consumer Price Index constructed by Japanese Statistical Bureau for
household durables. 13
As described in a later section, we have found significant discrepancies between the pace of
price declines for IT products in Japan and the United States. We have substituted
“internationally harmonized prices” for these products, based on U.S. price deflators, for the
official price deflators in Japan. We have compared the resulting estimates of investment in
real terms with those from the Japanese official statistics.
We have estimated capital stocks by the perpetual inventory method. Initial values of
capital stock for 1973 are estimated by assuming that the real investment for each type
of capital goods increased continuously in the past by the same growth rate as that for
13 The Japanese WPI and CPI are Laspeyres price indexes, with new benchmarks every five years. We constructed similar deflators for the period of our analysis. After the 2000 benchmark the WPI will be re-named as the CGPI (Corporate Goods Price Index).

13
the period 1970-1973.14 We have used U.S. NIPA depreciation rates for each type of
capital goods presented by Fraumeni (1997).
In imputing capital service prices, Equation (11) has to be modified to incorporate the
taxation of capital income for each type of investment good in each sector. For example,
there is a special acquisition tax for automobiles and there is no corporate tax in
government and household sectors. Nomura (1998) took into consideration these effects
of the Japanese tax system and many others. In this paper, we have applied the formulas
for capital service prices used by Nomura (1998) for business, government and household
sectors, separately.15
(c) Labor input
Labor input data are derived from KEIO database. This database includes the number of
persons engaged, the number of hours worked, and average compensation per hour,
cross-classified by age, sex, education, and the type of employee16. As in the case of data for
capital services, the change in the quality of labor input associated with upgrading of the
labor force can be captured by comparing the growth of hours worked with the growth of the
labor input index. The KEIO index of labor input is based on hours worked for detailed
categories of labor input, weighted by labor compensation per hour for each category.
(3) Prices for investment in IT equipment and software
We employ the production possibility frontier approach, explicitly measuring both outputs
and inputs, so that prices of IT equipment and software affect both sides of our growth
accounts.
14 In Japan, large-scale National Wealth Surveys were conducted several times prior to 1970. Although the results of these surveys are valuable for some purposes, for example, estimating war-time damages, they do not include detailed stock data on each type of investment good. For this reason, we have used the method described in the text to estimate initial values. 15 Detailed formulas can be found in Appendix 3 of Motohashi (2002). 16 KEO (1996).
14
Since technological advances are so rapid and quality changes are so dramatic, it is difficult
to obtain satisfactory price indexes for IT products based on matched models. For this reason
the hedonic method for constructing IT price indexes is used in both Japan and the U.S.
Jorgenson and Stiroh (2002) have pointed out that the price indexes used in the U.S. NIPA
for communications equipment and software are biased upward. Only the price index for
prepackaged software is calculated using the hedonic method, while the price for
custom-made software is estimated from wages of programmers, assuming that labor
productivity remains unchanged. Jorgenson and Stiroh (2002) applied prices calculated by
the hedonic method for communications equipment and software and obtained substantial
increases in the impact of IT investment on labor productivity growth.
In Table 3, we compare prices from the U.S. NIPA and two hedonic price indexes used in
Jorgenson and Stiroh (2002) with those provided by Bank of Japan for IT products in Japan.
(Table 3)
Although price indexes for computers in both countries are based on the hedonic method, the
pace of price decline is much lower in Japan. The Japanese price index for computers is a
composite index for personal computers, large-scale computers, and various kinds of
computer peripherals.
Differences in rates of price decline for computers between Japan and the U.S. could be due
to differences in composition of computer investment. For example, if the share of personal
computers (PC’s) in total computer investment were higher in the United States, the
composite price would drop more rapidly in the U.S., since prices for PC ‘s fall faster than
composite price index for computers. Alternatively, changes in computer prices could be
different between the two countries. However, these explanations are not totally convincing
because it is implausible to suppose that Japanese firms and U.S. firms are using
substantially different computing systems. The differences in price indexes can be fully
explained only by differences in methodology.

15
For communications equipment the rate of price decline is slightly higher in the Bank of
Japan’s WPI price index than in the U.S. NIPA index. Although both indexes use matched
models, Japan’s WPI is based on a more detailed list of items and may be more accurate.
Finally, the Bank of Japan’s price index for custom-made software uses an estimate of costs
that assumes no increases in labor productivity. The U.S. NIPA data uses a weighted average
of costs for custom software and a hedonic price index for packaged software, leading to a
more rapid decline in prices.
If differences in the behavior of prices are due to differences in methodology between the two
countries, we have to choose one set of prices for comparative analysis. We have estimated an
“internationally harmonized” set of prices based on U.S. price indexes this study. The basic
idea of the harmonized price index is to use U.S. prices of IT products relative to non-IT
products to estimate prices of IT products relative to non-IT products in Japan. This
approach was introduced in a series of OECD studies, for example, Colecchia and Schreyer
(2002), and has been used in international comparative studies by van Ark et. al. (2002).
In this study, relative prices of IT to non-IT products in the U.S. are applied to prices of
non-IT products for Japan to obtain “internationally harmonized” prices of IT products in
Japan. This removes the impact of inflation in prices of non-IT products from our estimates
of prices of IT products. However, it incorporates the rapid price decline of IT prices in the
U.S. after the impact of inflation is taken into account. We have applied this approach
separately for business, government and household sectors in Japan.
4. Results
(1)Information technology and economic growth in Japan and the United States
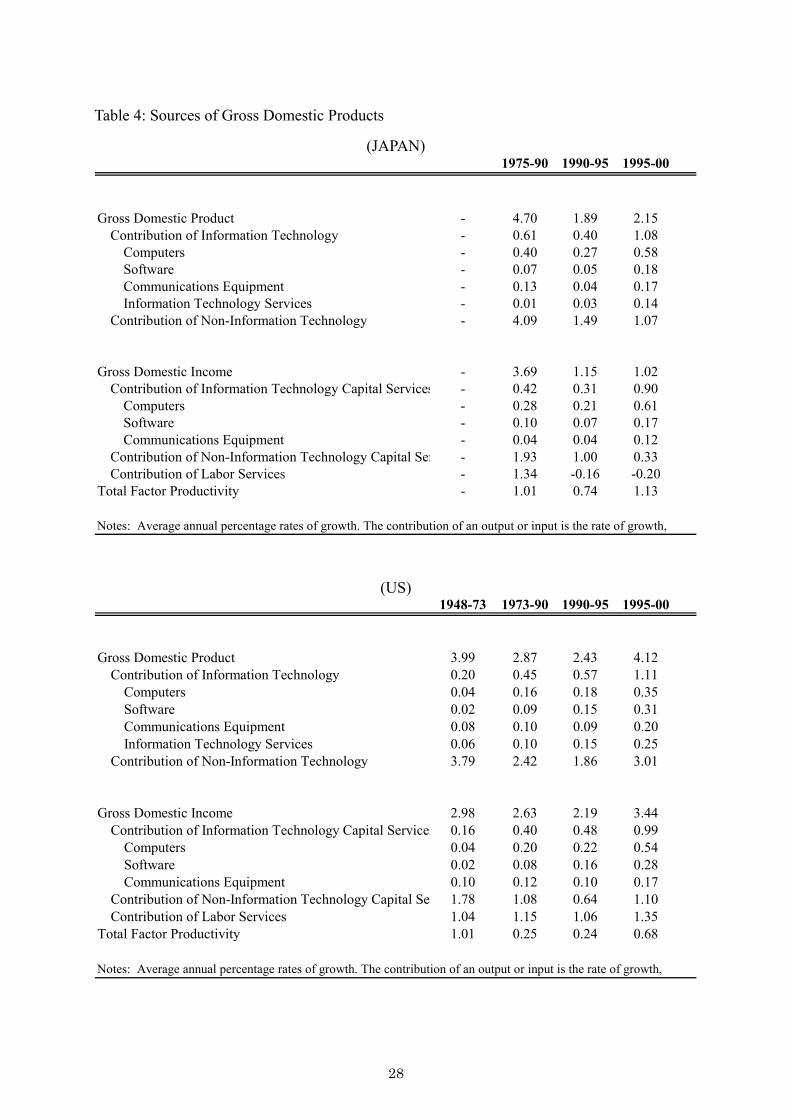
Table 4 shows our estimates of the contribution of information technology to output and
input of the Japanese economy, together with the corresponding results for the U.S., based on
an update of Jorgenson (2002b). The contribution of information technology to Gross
Domestic Product (GDP) includes investments in computers, software and communication

16
equipment by business, government, and household sectors. It also includes capital service
flows from IT equipment and software in government and household sectors, labeled
“Information Technology Services”.
The growth rate of GDP in Japan in the 1990’s dropped to around 2% from more than 4% in
the 1980’s. The contribution of information technology to output growth in Japan after 1995
was close to 1%, nearly the same as in the U.S. Slightly more than half of Japanese output
growth in the last half of the 1990’s can be attributed to information technology. The last half
of the 1990’s was the era of growth resurgence in the U.S. economy. While information
technology played a significant role in this resurgence, almost three-quarters of output
growth can be explained by the contributions of non-IT goods and services.
(Table 4)
Table 4 presents the sources of growth in the two countries. The growth rate of gross
domestic income can be decomposed among the contributions of IT capital services, non-IT
capital services, and labor services. Differences in growth rate between GDI and GDP is
equal to the growth rate of total factor productivity (TFP). Our most striking finding on the
sources of Japanese economic growth is the surge in the contribution of capital services from
IT equipment and software during the last half of the 1990’s, reflecting the sharp rise of IT
investment.
The contribution of IT capital services in the U.S. rose steadily throughout the period
1973-2000, but fell short of the Japanese contribution before 1990. The contribution of IT
capital in Japan declined during the first half of the 1990’s, but rebounded strongly after
1995. The contribution of IT capital in Japan during this period was 0.90 percent per year,
while the corresponding figure for the U.S. was 0.99 percent. The increase in the contribution
of IT investment in Japan during the last half of the 1990’s actually outstripped the
substantial rise in the U.S.
Our second finding is that the TFP growth rate in Japan rose during the last half of the

17
1990’s during a period of relatively slow growth in the Japanese GDP. This rise in TFP
growth in Japan was only slightly less than that in the U.S. It is important to note that the
growth rate of TFP in Japan substantially exceeded that of the U.S. throughout the period
1973-2000. The contribution of IT capital services exceeded that of TFP growth in the U.S.,
while TFP growth was more important than the contribution of IT capital services in Japan.
An important part of the slowdown in economic growth in Japan during the 1990’s is
attributable to the drastic decline in the contribution of labor input analyzed by Hayashi and
Prescott (2002). The labor input contribution dropped from 1.35 percent per year before 1990
to negative rate of -0.16 percent before 1995 and -0.20 percent after 1995. However, the
contribution of non-IT capital services also declined during the first half of the 1990’s and
continued to sink during the last half of the 1990’s. By contrast the contribution of labor
input in the U.S. fell off only modestly during the first half of the 1990’s and rose
considerably after 1995.
The Japanese economy grew at annual rates in the 3-5% range throughout the late 1970’s
and 1980’s. In the 1990’s growth rates dropped to the 1% range. Although more than 10 years
have elapsed since the burst of the “bubble economy”, there is no sign of revival in the official
statistics. By contrast our estimates show that the surge of investment in information
technology and software led to a modest revival of Japanese economic growth after 1995.
This was much less dramatic that the resurgence of the U.S. economy, due the shrinking
contributions of non-IT capital services and labor inputs in Japan.
(2) TFP decomposition between IT and non-IT
Jorgenson, Gollop and Fraumeni (1987) provide a model for tracing aggregate productivity
growth to its sources at the level of individual industries. Productivity growth for each
industry is weighted by the ratio of the gross output of the industry to GDP to obtain the
industry’s contribution to aggregate TFP growth. The price or “dual approach” to productivity
measurement employed by Jorgenson (2002b) identifies productivity growth in different
sectors from differences between output and input price changes.

18
Since the price of output falls rapidly in the IT-producing industries, the change in IT prices
relative to the aggregate price index can be used as a proxy for the TFP growth rate.17 While
an important part of the decline in IT prices can be attributed to the rapid decline of
constant-quality prices for semiconductors, most semiconductors are used in the production
of information technology equipment and other products. Accordingly, semiconductors appear
as both an input and an output at the industry level and productivity growth in
semiconductor production cancels out.
Table 5 shows the contribution of TFP in IT-production to aggregate TFP growth in Japan
using the dual method, compared to the contribution for the U.S. The nominal share of
information technology in GDP in the late 1990’s was nearly the same for the two countries,
a little more than 4%, and its contribution to the aggregate TFP growth rate was also very
similar. The share of computers was higher in Japan than in the U.S. The relative price of
computers fell faster than the prices of software or communication equipment, pushing up
the contribution of IT to aggregate TFP in Japan.
(Table 5)
A major difference between Japan and the United States can be found in the contribution of
TFP growth outside the IT-producing industries to economic growth. We have already seen in
Table 4 that TFP growth in Japan exceeded that in the U.S. throughout the period 1973-2000.
Almost all of this difference is attributable to the contribution of TFP growth outside the
IT-producing industries. A possible interpretation of this finding is that both Japan and the
U.S. are close to the technology frontier of information technology, while the level of
Japanese technology continues to lag outside the IT-producing sectors. Investment in
information technology equipment and software has resulted in convergence toward U.S.
levels. 18
17 In an industry with rapid productivity growth, output price falls rapidly relative to the input price. TFP growth can be measured from relative change of the input price to the output price. 18 This is consistent with the findings of the studies in Jorgenson (1995b), including the study of Jorgenson and Kuroda (1995).

19
(3) Discussion
(a) Sensitivity of the results to the IT price data
In order to make a rigorous comparison between the role of information technology in
economic growth in Japan and the U.S., we have introduced an “internationally harmonized”
deflator for investment in information technology equipment and software in Japan, based
on IT prices from the U.S. NIPA. The harmonized deflator drops much faster than the prices
in the Japanese official statistics, provided by the Bank of Japan and the National Statistical
Bureau. In this section, we investigate how this affects our estimates.
Table 6 presents the same data as in Table 4 (Sources of Gross Domestic Product), using the
official statistics for Japan. The price changes have significant impacts on both output and
input data. This discrepancy becomes wider in recent periods, due to the growing importance
of IT in Japanese economy. The annual growth rate of output in the late 1990’s falls by 0.67%,
of which 0.40% is attributable to the slower price decline for computer investment. The
nominal share of the computer industry in Japanese GDP is relatively large and the price
discrepancy is much larger than for other categories of IT output.
(Table 6)
Slower growth of input results from a lower pace of price decline, since the growth rate of
capital stock decreases. In addition, since the capital service price falls with a lower rate of
price decline in equation (11), the share of IT capital services also decreases. There effects
are revealed in the fall of the contribution of IT capital services in Table 6.
Slower growth in both outputs and inputs leaves the TFP growth rate in Japan almost
unaffected. The TFP growth rate in the late 1990’s falls by only 0.13%, from 1.13% to 1.00%.
We note that the rebound of the TFP growth rate observed in our estimates can be seen in
estimates using official price statistics as well. Since the magnitude of effects of IT prices
increases substantially after 1995, the GDP growth rate in the late 1990’s is now lower than

20
that in the first half of 1990’s.
(b) Comparison with official GDP data
It is useful to compare our estimate on aggregate output with the official GDP data. As
described in section 3 (1), we have made some adjustments with official Japanese GDP data
to make them more closely comparable with U.S. data. Table 7 shows the impact of each of
the adjustments we have made on the growth rate of output.
(Table 7)
First, adding prepackaged and own-account software, excluded from the Japanese SNA93
concept of GDP, does not have a big impact. Taking account of the capital service flow from
consumer durables contributes to 0.1% - 0.2 % growth rate increase to output. The largest
part of the difference between the official Japanese GDP and the output data used in this
study is due to differences in IT prices. Introduction of the internationally harmonized
deflators adds more than a half percent to the annual growth rate of the Japanese economy
in the late 1990’s. In a period of slow growth in Japan, this is a very significant number.
Hence, the choice of an appropriate price deflator for IT products is a very important issue in
estimating the growth rate of the Japanese GDP.
(c) Other issues in TFP estimation
Our TFP growth rate in 1990’s is very high by comparison with the Economic and Social
Research Institute (2003) and Hayashi and Prescott (2002). Since these studies are based on
the official price statistics, it is not surprising that the TFP growth rate is different. In
addition, we include land as a capital input, while only services from depreciable assets are
counted as capital inputs in the other studies. The stock of land was assumed to be constant
in our study and this stock constitutes 20-30 percent of the nominal share of overall capital
stock. Including land reduces the shares of depreciable assets and the contributions of
service flows from these assets. Since we have a positive growth contribution from capital

21
services, slower growth of capital input pushes up the TFP growth rate.
In addition, variations in the share of land in the value of capital services have a
considerable impact on our TFP estimates. In the 1990’s land prices declined sharply after
the burst of “bubble economy” and the nominal share of land surged due to the higher capital
service prices. In order to determine the specific influence of land, we have recalculated TFP,
excluding all land-related data, on the assumption that capital stock consists only of
depreciation assets and inventories. Excluding land from capital input reduces the TFP
growth rate to 0.29% from 1.01% in 1975-90, 0.14% from 0.74% in 1990-95, and 0.65% from
1.13% in 1995-2000. Although the TFP growth rate goes down over all periods, the
productivity rebound in the late 90’s survives.
A second potential issue is that TFP is derived as a residual between the growth of output
and the growth of input. Basu (1996) observes that TFP moves in the same direction as
output and is pro-cyclical in the U.S.. He attributes this to the effects of market distortions.
Since the Japanese economy experienced an economic surge in the late 1980’s and a sharp
decline in the beginning of 1990’s, some caution is needed in interpreting the TFP growth
rate in these periods. However, our finding of a revival of TFP growth during slow GDP
growth in the late 1990’s is unaffected by this argument.
5. Conclusions
We have analyzed aggregate economic data for Japan and the U.S. to determine whether the
increase in the rate of economic growth from surging IT investment in the U.S. in the late
1990’s can also be observed in Japan. We have adjusted estimates of IT investments in Japan
to achieve comparability with the U.S. estimates by Jorgenson (2002b). In order to make a
rigorous comparison, we have applied an internationally harmonized deflator for IT
investment in Japan. We have also used Japanese official statistics to test the robustness of
our results.
We have shown that the expansion of investment in IT equipment and software in the U.S.

22
in the last half of the 1990’s, accompanied by rising growth rates of total factor productivity,
has a precise parallel in Japan. While this phenomenon contributed to a sharp rise in the
rate of economic growth in the U.S., it took place in a depressed economic environment in
Japan. Growth rates of labor input plummeted in Japan during the 1990’s, dragging down
the rate of economic growth. However, the revival of Japanese economic growth after 1995
suggests that long-term prospects for the Japanese economy are less dismal than suggested
by the official statistics.
The top priority for future research is to analyze relative levels of productivity in Japan and
the U.S., following Jorgenson and Kuroda (1995) and Jorgenson and Nishimizu (1995). Our
conjecture is that level comparisons will show that the IT-producing industries in Japan and
the United States are closely comparable. We anticipate that the IT-using industries in
Japan lag behind their U.S. counterparts in the use of IT equipment and software, but will
converge to U.S. levels. However, substantial parts of the Japanese economy are impervious
to changes resulting from the adoption of information technology and will continue to
languish.
For economic policy it is very important whether TFP growth is concentrated in the
IT-producing industries, as our results for the United States suggest. We have decomposed
TFP growth in Japan between IT and non-IT sectors, using the decline in IT prices as a
proxy for TFP growth in the IT-producing sectors. The growth of TFP in IT-using industries
has been relatively strong throughout the period 1973-2000, which is consistent with
persistence of opportunities to “catch up” to U.S. levels of technology in these industries.
In the analysis of individual industries, the effects of statistical issues arising from
productivity measurements will be greater. For example, although productivity growth in
service industries has been considered to be lower than that in manufacturing industries,
this may be related to deficiencies in price deflators for service industry outputs. For example,
the financial services industry shows particularly higher rates of investment in IT-related

23
equipment and software,19 but the output of this industry is difficult to measure.
To avoid some of the statistical issues associated with the analysis of individual industries,
analysis can also be conducted at a firm level. This would permit comparisons of the
relationships of IT and productivity among businesses in the same industry. Brynjolfsson and
Hitt (1995) conducted one of the first studies of the relationship between IT and productivity
on a company level. More recently, the effects of IT investment on business organization have
been explored by Brynjolfsson and Hitt (2000).
Finally, IT investment covers a wide range of different situations -- from applications of
CAD/CAM technology in manufacturing to applications of ERP in business services.
Motohashi (2001) has shown that the effects on productivity vary by application. As
illustrated by these examples, economic analysis of investment in IT has made important
progress in many areas. However, the rapid pace of technological advance is constantly
generating new questions. It is vital that microeconomic analysis on a company level and
macroeconomic analysis for the economy as a whole be coordinated in order to clarify the
mechanisms that underlie the structural changes resulting from the IT investments.
19 Griliches (1994) discusses statistical issues in the measurement of service sector output as a source of under-estimation of the impact of IT investment.

24
References
van Ark, Bart, Johanna Melka, Nanno Mulder, Marcel Timmer and Gerard Ypma (2002),
"ICT Investments and Growth Accounts for the European Union 1980-2000", Research
Memorandum, Groningen University.
Basu, Susanto (1996), “Procyclical Productivity: Increasing Returns or Cyclical Utilization?”
Quarterly Journal of Economics, Vol. 111, No. 3., August, pp. 719-751.
Brynjolffson, Erik, and Loren Hitt (1995), “Information Technology as a Factor of Production,
the
Role of Differences among Firms,” Economics of Innovation and New Technology, Vol.
3, pp. 183-199.
_____ and _____ (2000), “Beyond Computation: Information Technology, Organizational
Transformation and Business Performance,” Journal of Economic Perspectives, Vol. 14,
No. 4, Fall, pp. 23-48.
Colecchia, Alessandra, and Paul Schreyer (2002). “ICT investment and economic growth in
the 1990s: is the United States a unique case? A comparative study of nine OECD
countries.” Review of Economic Dynamics, Vol.5, No. 2, April, pp. 408-42
Economic Research and Social Institute (2003), Industrial Productivity and Economic
Growth; 1970-98 (in Japanese), Tokyo, Japan’s Cabinet Office.
Economic Research Institute, Economic Planning Agency (2000), “The Effect of Information
and Technology on Productivity: In Search of Japan’s ‘New Economy’ (in Japanese).”
Seisaku Koka Repoto (Report on Policies and Effects), No. 4, October 2000.
Fraumeni, Barbara (1997), “The Measurement of Depreciation in the U.S. National Income
and
Product Accounts,” Survey of Current Business, Vol. 77, No. 7, July, pp. 7-23.
Griliches, Zvi (1994), “Productivity, R&D, and the Data Constraint,” American Economic
Review, Vol. 84, No. 1, March, pp. 1-23.
Hayashi, Fumio and Edward Prescott (2002), “The 1990s in Japan: A Lost Decade,” Review of
Economic Dynamics, Vol. 5, No. 1, February, pp. 206-235.

25
Jorgenson, Dale W. (1995a), Postwar U.S. Economic Growth, Cambridge, The MIT Press.
_____ (1995b), International Comparisons of Economic Growth, Cambridge, The MIT Press.
_____(1995c), “The Embodiment Hypothesis,” Chapter 2 in Jorgenson (1995a), pp. 25-50.
_____ (1996), “The Economic Theory of Replacement and Depreciation,” Chapter 5 in Dale W.
Jorgenson, Tax Policy and the Cost of Capital, Cambridge, The MIT Press, pp.
125-156.
_____ (2002a), Economic Growth in the Information Age, Cambridge, The MIT Press.
_____ (2002b), “Information Technology and the US Economy,” Chapter 1 in Jorgenson
(2002a), pp. 1-42.
Jorgenson, Dale W., Frank M. Gollop, and Barbara M. Fraumeni (1987), Productivity and
U.S. Economic Growth, Cambridge, Harvard University Press.
Jorgenson, Dale W., Mun S. Ho, and Kevin Stiroh (2002a), “Growth of U.S. Industries and
Investments in Information Technology and Higher Education,” in Carol Corrado,
John Haltiwanger, and Daniel Sichel, eds., Measurement of Capital in the New
Economy, Chicago, University of Chicago Press, forthcoming.
Jorgenson, Dale W., Mun S. Ho, and Kevin Stiroh (2002b), “Lessons from the U.S. Growth
Resurgence,” in Brian Kahin, ed., Economic and Social Implications of Information
Technology, Cambridge, The MIT Press, forthcoming.
Jorgenson, Dale W., and Masahiro Kuroda (1995), “Productivity and International
Competitiveness in Japan and the United States, 1960-1985,” Chapter 9 in Jorgenson
(1995b), pp. 387-418.
Jorgenson, Dale W., and Mieko Nishimizu (1995), “U.S. and Japanese Economic Growth,
1952-1974: An International Comparison,” Chapter 3 in Jorgenson (1995b), pp. 179-202.
Jorgenson, Dale W., and Kevin Stiroh (2002), “Raising the Speed Limit: US Economic Growth
in the Information Age,” Chapter 3 in Jorgenson (2002), pp. 71-150.
Jorgenson, Dale W. and Kun-Young Yun (2001), Lifting the Burden: Tax Reform, the Cost of
Capital and US Economic Growth, Cambridge, The MIT Press
Keio University Institute for Economic and Industry Studies (Keio Economic Observatory)
(1996), KEO Database, Keio Economic Observatory Monograph Series, No. 8
Motohashi, Kasuyuki (2002),”IT Investment and Productivity Growth of Japanese Economy

26
and Comparison to the United States, (in Japanese)”, RIETI Discussion Paper Series
02-J-018
Motohashi, Kasuyuki (2001), “Economic Analysis of Information Network Use:
Organizational and Productivity Impacts on Japanese Firms,” mimeo.
OECD (2000), OECD Productivity Manual: A Guide to the Measurement of Industry-Level
and Aggregate Productivity Growth - Revision 2.2, OECD, Paris.
OECD (2001), The Impact of Information and Communication Technologies on Output
Growth: Issues and Preliminary Findings, DSTI/EAS/IND/SWP(2001)11.
Nomura, Koji (1998), “Measuring Capital Services (in Japanese),” Keio University Institute
for Economic and Industry Studies (Keio Economic Observatory), October 1998.
Parker, Robert,. and Bruce Grimm (2000), “Recognition of Business and Government
Expenditures for Software as Investment: Methodology and Quantitative Impacts,
1959-98,” BEA, US Department of Commerce.
Price Statistics Division (2001). “Quality Adjustment of Price Indexes, Wholesale Price Index
and Corporate Service Price Index: The Current Situation and Future Implications,”
Research and Statistics Department, Bank of Japan. Working Paper 01-6.

27
Table 1: Variables used in growth factor analysis Business sector Public sector Household sector
Output 93SNA Official GDP + software adjustments
93SNA Official GDP + software adjustmsnts
93SNA Official GDP + capital service from household
Capital Input (Depreciable Assets) - Based on investment series by 62
types of asset (5 types of IT), capital stock and capital service are estimated.
(Land) - The stock of land is assumed to be
constant at macro level. Capital service price is estimated from land price
(Inventory) - Use SNA base aggregated inventory
stock and price to estimate capital service
Based on investment series by 20 types of asset (3 types of IT), capital stock and capital service are estimated.
Labor KEO data for labor inputs by type of labpr
-
(Note) Refer to Motohashi (2002) for details in depreciable asset data
Table 2: Comparing current price output in 2000
(in billion yen)
Official GDP 93SNA 513,377+Software Adjustment 4,154+Consumer Durables Adjustment 15,338
Adjusted Output data 532,868Reference: Official GDP 68SNA base 490,518
Table 3: Comparison of IT prices between Japan and the United States
Japan US (WPI, BOJ) (BEA) (case1) (case2)
1980-90 1990-00 1990-98 1990-98 1990-98
Computer -7.0% -7.2% -19.5% -19.5% -19.5%Comm. Equip. -2.8% -3.1% -2.0% -10.7% -17.9%Software 4.1% 1.1% -1.7% -10.1% -16.0%
28
Table 4: Sources of Gross Domestic Products
(JAPAN) 1975-90 1990-95 1995-00
Gross Domestic Product - 4.70 1.89 2.15Contribution of Information Technology - 0.61 0.40 1.08
Computers - 0.40 0.27 0.58Software - 0.07 0.05 0.18Communications Equipment - 0.13 0.04 0.17Information Technology Services - 0.01 0.03 0.14
Contribution of Non-Information Technology - 4.09 1.49 1.07
Gross Domestic Income - 3.69 1.15 1.02Contribution of Information Technology Capital Services - 0.42 0.31 0.90
Computers - 0.28 0.21 0.61Software - 0.10 0.07 0.17Communications Equipment - 0.04 0.04 0.12
Contribution of Non-Information Technology Capital Ser - 1.93 1.00 0.33Contribution of Labor Services - 1.34 -0.16 -0.20
Total Factor Productivity - 1.01 0.74 1.13
Notes: Average annual percentage rates of growth. The contribution of an output or input is the rate of growth,
(US) 1948-73 1973-90 1990-95 1995-00
Gross Domestic Product 3.99 2.87 2.43 4.12Contribution of Information Technology 0.20 0.45 0.57 1.11
Computers 0.04 0.16 0.18 0.35Software 0.02 0.09 0.15 0.31Communications Equipment 0.08 0.10 0.09 0.20Information Technology Services 0.06 0.10 0.15 0.25
Contribution of Non-Information Technology 3.79 2.42 1.86 3.01
Gross Domestic Income 2.98 2.63 2.19 3.44Contribution of Information Technology Capital Services 0.16 0.40 0.48 0.99
Computers 0.04 0.20 0.22 0.54Software 0.02 0.08 0.16 0.28Communications Equipment 0.10 0.12 0.10 0.17
Contribution of Non-Information Technology Capital Ser 1.78 1.08 0.64 1.10Contribution of Labor Services 1.04 1.15 1.06 1.35
Total Factor Productivity 1.01 0.25 0.24 0.68
Notes: Average annual percentage rates of growth. The contribution of an output or input is the rate of growth,

29
Table 5: Decomposition of TFP growth JAPAN 1975-90 1990-95 1995-00
Total Factor Productivity Growth 1.01 0.74 1.13
Contributions to TFP Growth:Information Technology 0.24 0.32 0.47
Computers 0.20 0.26 0.40Software 0.02 0.04 0.03Communications Equipment 0.02 0.02 0.04
Non-Information Technology 0.77 0.42 0.66
Relative Price Changes:Information Technology -17.1 -10.4 -7.7
Computers -19.7 -15.7 -24.4Software -3.5 -3.1 -1.8Communications Equipment -2.5 -2.9 -4.2
Non-Information Technology 7.6 1.6 -0.5
Average Nominal Shares:Information Technology 2.22 3.63 4.19
Computers 1.03 1.65 1.65Software 0.59 1.21 1.58Communications Equipment 0.60 0.77 0.96
Non-Information Technology 95.36 93.85 92.99
US 1973-90 1990-95 1995-00
Total Factor Productivity Growth 0.25 0.24 0.68
Contributions to TFP Growth:Information Technology 0.19 0.26 0.45
Computers 0.12 0.15 0.29Software 0.02 0.05 0.07Communications Equipment 0.06 0.06 0.09
Non-Information Technology 0.06 -0.02 0.23
Relative Price Changes:Information Technology -7.4 -7.3 -10.3
Computers -21.1 -18.1 -30.9Software -3.2 -4.0 -3.6Communications Equipment -4.2 -4.1 -5.8
Non-Information Technology 0.0 0.1 0.0
Average Nominal Shares:Information Technology 2.60 3.46 4.36
Computers 0.61 0.81 0.94Software 0.60 1.30 1.90Communications Equipment 1.39 1.34 1.51
Non-Information Technology 96.56 95.35 94.22

30
Table 6 Sources of GDP by using Official Price Data in Japan 1975-90 1990-95 1995-00
Gross Domestic Product - 4.54 1.67 1.58Contribution of Information Technology - 0.45 0.18 0.51
Computers - 0.26 0.11 0.16Software - 0.03 0.02 0.12Communications Equipment - 0.15 0.04 0.17Information Technology Services - 0.01 0.02 0.06
Contribution of Non-Information Technology - 4.09 1.49 1.07
Gross Domestic Income - 3.57 1.00 0.57Contribution of Information Technology Capital Services - 0.29 0.16 0.44
Computers - 0.17 0.10 0.21Software - 0.07 0.02 0.11Communications Equipment - 0.05 0.04 0.12
Contribution of Non-Information Technology Capital Ser - 1.93 1.00 0.33Contribution of Labor Services - 1.34 -0.16 -0.20
Total Factor Productivity - 0.98 0.67 1.00
Notes: Average annual percentage rates of growth. The contribution of an output or input is the rate of growth,
Table 7: Comparison of output with official GDP in Japan
1975-90 1990-95 1995-00
Official Statistics (93SNA) 4.19 1.49 1.39 (68SNA GDP series) (4.13) (1.44) (1.02) +Software Adjustment 0.11 -0.01 0.02 +IT consumer durables 0.01 0.02 0.06 +Non-IT consumer durables 0.24 0.17 0.10Adjusted by national statistics 4.54 1.67 1.58 +price adjustment (Computer) 0.14 0.16 0.42 +price adjustment (Software) 0.04 0.04 0.06 +price adjustment (Comm. Equip) -0.02 0.00 0.01 +price adjustment (IT services) 0.00 0.02 0.09Adjusted by harmonized price 4.70 1.89 2.15