Embed Size (px)
Citation preview
Economic Horizons, May - August 2018, Volume 20, Number 2, 93 - 107UDC: 33 eISSN 2217-9232
© Faculty of Economics, University of Kragujevac www. ekfak.kg.ac.rs
Original scientific paperUDC: 332.1(497.11)
doi:10.5937/ekonhor1802095J
INTRODUCTION
The unique phenomenon of institutional transition in the European transition countries has been existent for almost three decades and in the Republic of Serbia (RS) for seventeen years. Institutional transition in the Southeast European (SEE) countries began with the rapid destruction of institutions from the prior political and economic system, whereas the
construction of new market institutions was much slower and inefficient, with the different dynamics of construction from one country to another, depending on the speed of the implementation of the structural reforms and the European Union (EU) entry.
In particular, in the first decade of transition, only Estonia, Hungary and Poland, out of all the transition countries, built the institutions that would ensure the protection of property rights and the implementation of the regulatory reform of the business environment in order to stimulate investment. Despite the implementation of significant macroeconomic
ECONOMIC GROWTH AND THE INSTITUTIONAL TRANSITION OF THE REPUBLIC OF SERBIA
Edvard Jakopin*Ministry of Economy, The Republic of Serbia
Are the transitional countries of SEE trapped in institutional transition or not? The institutional transition that has been lasting for almost three decades, and almost two decades in the Republic of Serbia, initiated the rapid destruction of the institutions of the previous political and economic system, but the construction of new market institutions has been slow, inefficient and partial. The Republic of Serbia lost the three decades of economic growth and development, which, as evidenced by economic law, takes twice as much time to restore the system to the previous equilibrium of the length of the time which the system is located in off-balance. The average 3% growth in the seventeen transition years is insufficient to compensate for the enormous backlog of the 1990s. The contribution of the research study to the work focuses on the analysis of the interdependence of economic growth and institution building. A special viewpoint is aimed at the corruption factor destroying institutions in all transition countries, reducing their economic growth and productivity, and negatively affecting the attractiveness of FDIs.Keywords: economic growth, institutional transition, corruption
JEL Classification: O11, O43
* Correspondence to: E. Jakopin, Ministry of Economy, Vlajkoviceva 10, 11000 Belgrade, The Republic of Serbia; e-mail: [email protected]
Economic Horizons (2018) 20(2), 93 - 10794
reforms, Lithuania and Slovakia failed for a long time to comply with the severe budget constraints on the subsidies to state-owned enterprises. A number of countries (Moldova, Russia, Ukraine) stuck in the so-called “reform trap”, without the essential reforms (“the form instead of the reform”), because the previous system was recycled through the process of privatization and liberalization (Jakopin, 2017b, 106). In general, a number of the transition countries have managed to build a new institutional framework after the fall of socialism, but most transition countries are still trapped in institutional transition.
The transition economies predominantly relying on the resource, labor-intensive economic sectors were, as a rule, more suited to the elites that did not match the new institutional framework (the old nomenclature that benefited from the privatization or the newly-built group of company owners). The reasons for the very slow growth of market institutions in transition countries are that some authors look for previous great economic dependence upon natural resources and the historical experience of these countries during socialism (Bhattacharyya & Hodler, 2010).
The subject of the research study is the institutional performance of the transition of RS, with a special research objective of analyzing the interdependence of economic growth and institutional transition in RS and the SEE transition countries, most of which are in the EU lobby.
The paper examines the hypothesis that without the development of stable institutions there are no sustainable high economic growth rates, and vice versa; that without the high rates of economic growth it is impossible to build stable institutions. Within this hypothesis, the effects of the global recession on institutional transition and economic growth were analyzed.
In this paper, the methods of analysis and synthesis, compilation and comparison were applied. The institutional transition analysis was based on the composite Worldwide Governance Indicators (WGI).
The paper is structured into two interconnected continents. The first explores the performance of
transitional economic growth in RS; in the second, the research reorientation focuses on institutional transition, with a special emphasis on corruption analysis as the factor that affects the decommissioning of institutions.
THE LOST THREE DECADES OF GROWTH
The beginning of transformation in 2001 was welcomed by the RS economy, whose structure had been formed almost three decades before. After seventeen years, the short transition balance would be as follows: the slowdown of the 1990s, which is slowly (only three-quarters of the way now) reaching the lag in relation to the group of the most developed countries in Europe (EU-15) is not decreasing, but it is increasing in relation to the group of transition countries that were admitted to the EU in 2004 (EU-10).
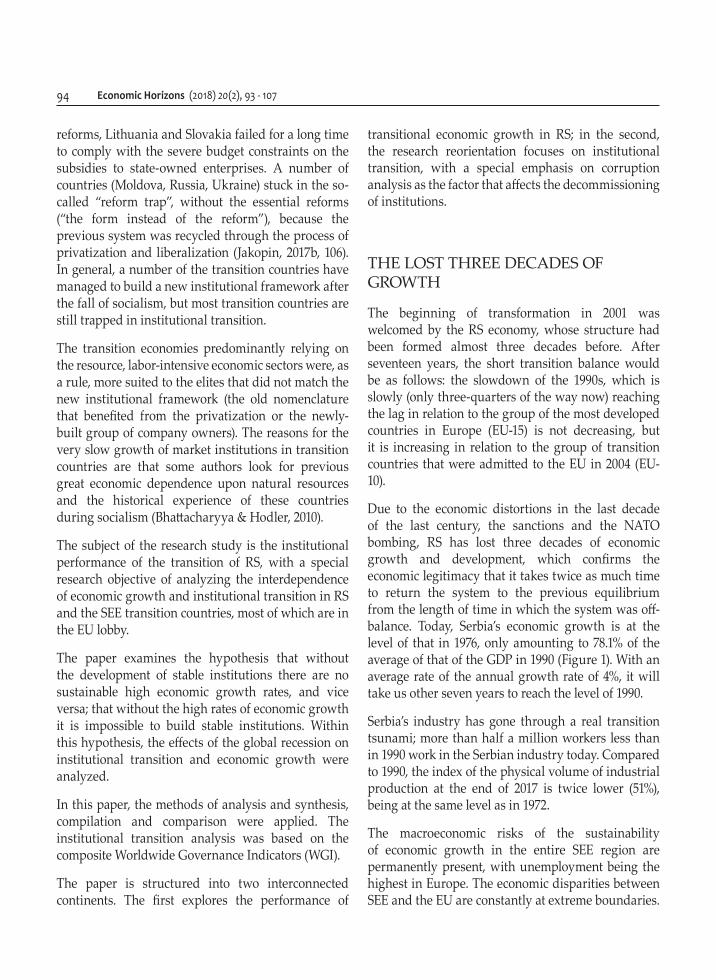
Due to the economic distortions in the last decade of the last century, the sanctions and the NATO bombing, RS has lost three decades of economic growth and development, which confirms the economic legitimacy that it takes twice as much time to return the system to the previous equilibrium from the length of time in which the system was off-balance. Today, Serbia’s economic growth is at the level of that in 1976, only amounting to 78.1% of the average of that of the GDP in 1990 (Figure 1). With an average rate of the annual growth rate of 4%, it will take us other seven years to reach the level of 1990.
Serbia’s industry has gone through a real transition tsunami; more than half a million workers less than in 1990 work in the Serbian industry today. Compared to 1990, the index of the physical volume of industrial production at the end of 2017 is twice lower (51%), being at the same level as in 1972.
The macroeconomic risks of the sustainability of economic growth in the entire SEE region are permanently present, with unemployment being the highest in Europe. The economic disparities between SEE and the EU are constantly at extreme boundaries.
E. Jakopin, Economic growth and the institutional transition of the Republic of Serbia 95
According to all economic parameters, the SEE region belongs to the EU periphery. The living standard in SEE in 2016 was almost three times as low as the EU average, and the unemployment rate was three times as high. Regional and social cohesion in Europe is becoming weaker and weaker, and the SEE region is increasingly being confronted with the various forms of poverty and backwardness (Jakopin, 2017a, 157).
The SEE transition economies are slowly adapting to the globalization process, the ever-growing market competition, and the high demands coming from the competition. In the second half of the 1990s, the successful transitional economies had dynamic economic growth, primarily due to the growth of investments, personal consumption and the greater exports of goods and services. The initiator of their economic growth was the implemented structural reforms that led to significant changes in the structure of industrial production. The structural changes led by the postulate of greater international
competitiveness caused an extremely dynamic growth of the industrial branches based on the use of modern technology and the economies of scale, the development of new industries, and creative economies.
The structural changes implemented through FDI inflows, industrial production and exports growth have contributed to the fact that the majority of the central European transition countries in and some SEE countries (EU Member States) have significantly increased their export performance, raising the entire industry of these countries to a higher level. The EU market has played the key role in the process of increasing exports. Innovative processes in science and technology in all the industrial branches are proceeding at a faster pace in the world, simultaneously bypassing the SEE region.
Figure 1 The lost three decades of growth - the Republic of Serbia GDP 1952-2017
Source: Author
Methodological note: Due to the changes in the methodology for the period 1952-2000, a series of trends in the social product (prices in 1994) was used, and in the period 2001-2017, a series of the growth rates of the GDP was used (Jakopin, 2018, 36).
Economic Horizons (2018) 20(2), 93 - 10796
TRANSITION GROWTH MODELS
The global recession created by a speculative price growth and the bursting of bubbles in 2007 opened many theoretical and practical dilemmas, beginning with the source of the crisis, the role of the state, market distortions, the systemic forms of the crisis, resource mobility, alternative solutions and growth models (Jakopin, 2018, 38-44).
Imbalances are deepened by the applied transformation model. The model functioned according to the principle of purchasing time with privatization revenues and FDI inflows, as the unstructured export-oriented economy borrowed and increased the external debt. On the other hand, the vulnerable internal stability conditioned by the huge surplus of imports over the exports and overstated the dinar that this huge foreign trade deficit has stimulated and sustained. The overpriced dinar carried the pillar of the anti-inflationary policy and influenced commodity flows, but due to cheap import raw materials and intermediate goods it affected production costs. In such a situation, the global recession only reduced oil to the fire.
A brief theoretical excursion about the causes of the global recession revealed that the causes of the hotbed of the greatest crisis since the Great Depression of 1929-1933 lie in the combination of the three factors:
• the enormous growth of the greediness (greed) of business entities (Keynes’ famous “animal spirits”),
• economic policy failures, and
• the institutional framework (the regulatory system).
In recessionary periods, the state is more superior to the market, primarily because it has instruments to mobilize resources. For example, in all the variants of the state, the economic policy stimulates a faster development of entrepreneurship in order to reduce the “perception of risk”. The crisis-trigger generator is always the system, not the state with its policy, because the economic system is inherently unstable. Through
its instruments, the state creates structural reforms and changes the system so as to minimize losses. Some authors believe that neither the reconstruction of the system nor the transformation of the economic policy can eliminate the causes of the crisis. In a word, systemic instability is the key determinant of a recession. In addition to systemic causes, recession weights were intensified by the weaker export sector and the wrong economic policy, which manifested itself primarily through the strong domestic currency. Occasional catching was provided by privatization, FDIs and foreign borrowing (Jakopin, 2018, 42).
The basic characteristics of the pre-crisis transition model of economic growth in Serbia in the period 2001-2008. The years that had the greatest impact on economic growth can be described as follows:
• the process of the privatization of social property which was being turned into privately-owned was not followed by consistent institutional solutions, the effects were far less than expected;
• the growth of industrial unemployment was not accompanied by the growth of the entrepreneurial sector;
• the economic growth was based on the growth of services, not on the growth of industries - exchangeable goods (industry, construction);
• consumption grew faster than economic growth, thus resulting in an increase in the external debt,
• the structural reforms in the economy were slow, selective and partial.
The average rate of economic growth in the transition period from 2001 to 2017 is modest, only 3.0%. After the dynamic economic growth in the pre-crisis period 2001-2008 (the average growth rate was 5.9%), there came a fall in the crisis in 2009 (-3.1%) and a long-term recession period (the average fall in the rate of economic growth in the period 2010-2014 was -0, 1%), so that in the period 2015-2017 the mild signs of the recovery of economic growth followed (average growth was 1.8%).
The transformation period 2001-2017 is characterized
E. Jakopin, Economic growth and the institutional transition of the Republic of Serbia 97
by different models of growth:
• The growth model based on the growth of private consumption and services in the period 2001-2008. In the period leading up to the outbreak of the World Economic Crisis, Serbia’s economic growth achieved a high growth average rate (5.9%), which, however, was not enough to compensate for the backlog of the sanctions against and the economic problems in the state at the end of the last century. The service sector was the main contributor to the growth model, with the services in the structure of the gross domestic product (GDP) reaching 60%. In 2008, the level of the Serbian GDP reached the level of 1975.
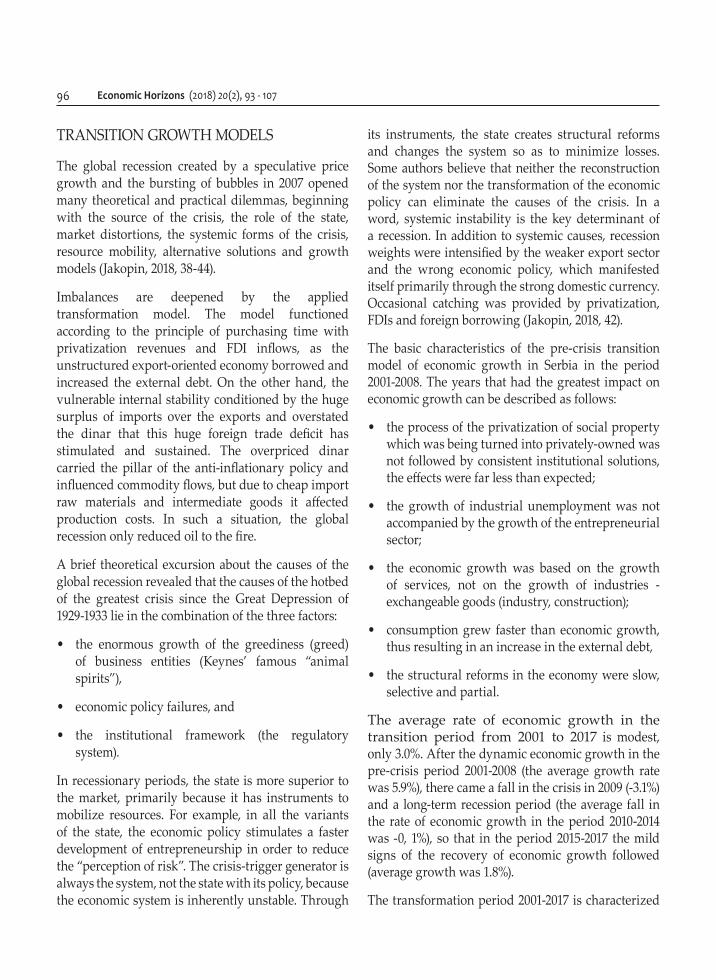
• The recession period from 2009 to 2014 implies the years without growth, with the average annual fall of -0.2%. Under the impact of the global recession, economic growth was interrupted in 2009, and the economic policy makers were forced to redesign the growth model and face new growth sources, faced with the multi-sectoral negative effects of the global recession (Figure 2).
• A new growth-based investment and export growth in the period 2015-2017 was characterized by the average annual growth of 1.8%. Only in 2016, economic growth reached the pre-crisis level of 2008. At the end of 2017, the level of the GDP was at the level of 1977, which speaks about the extent of the economic distortions in the last decade of the XX century.
By consistently implementing fiscal consolidation in the period 2015-2017, internal and external macroeconomic imbalances were reduced, a structural adjustment began, the economic and investment environment improved, as confirmed by renowned international institutions (WB, IMF, EBRD, WEF).
A comparative analysis of the economic growth trends in the SEE transition countries shows the different effects of the economic recession from one country to another, with some economies having managed to overcome the prior negative crisis strikes on their economies, primarily thanks to the resilience of their processing sectors (Table 1).
Figure 2 The impact of the crisis on economic growth in the Republic of Serbia
Source: Author
Economic Horizons (2018) 20(2), 93 - 10798
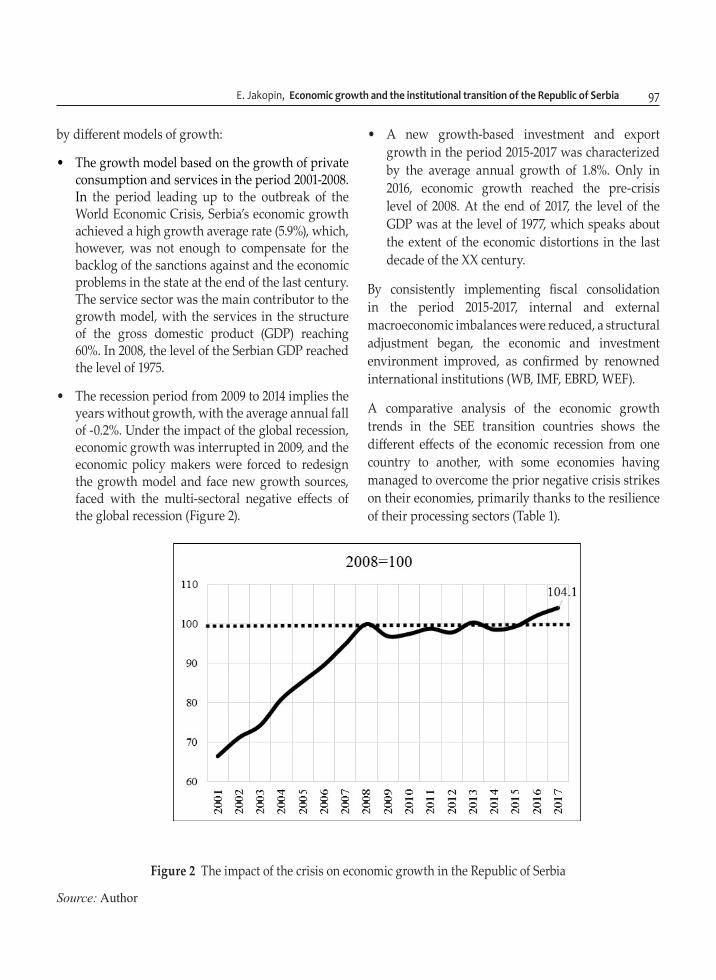
Table 1 Economic growth in the transition countries of the region
State
Rates of growth/decline
in GDP
GDP per capita 2016
2001-2008
2009-2016 EUR PPS EU-
28=100
Albania 6.0 2.4 3,700 30
Bosnia and Herzegovina 4.9 0.9 4,400 31
Bulgaria 5.8 1.1 6,748 48
FYR Macedonia 3.0 2.2 4,691 38
Romania 6.3 1.1 8,640 59
Republic of Serbia 5.9 0.3 4,904 36
Croatia 4.3 -1.1 11,142 59
Montenegro 5.0 1.1 6,354 42
Slovenia 4.2 -0.3 19,574 83
Hungary 3.2 0.6 11,588 67
Source: Eurostat, RZS
The pre-crisis period 2001-2008 was characterized by the dynamics of Serbia’s economic activities being above the average of the countries in the region. In the period 2009-2016, Albania and Macedonia recorded the highest GDP growth, whereas the highest decline was recorded in Croatia (Table 1). In the majority of the countries of the region, domestic demand (investments and private consumption) had a dominant influence on economic growth. Only in Bulgaria, the net exports made a greater contribution than domestic demand.
Above all, the effects of transition reflected in the standard of living in these countries. The living standard in RS in 2016 (the GDP per capita being
4,904 EUR) was higher than in Albania, Macedonia and Bosnia and Herzegovina, but simultaneously lower than the living standard in Bulgaria (by 37%), Romania (by 76%), Croatia and Hungary (2.3 times) and Slovenia (4 times). Compared to the purchasing power, RS is at 36% of the EU-28 average (the GDP per purchasing power), which is well below the developed transition countries in the region (Hungary lags behind the EU average of 33%, Croatia 41% and Slovenia 17%).
In the pre-crisis period, the employment rate did not change, the unemployment rate fell to 14.9%, inflation was reduced, but was still high, FDIs experienced significant growth, the current account deficit was high, and the public debt was kept under control. The impact of the recession mostly affected the increase in the external debt and the decline in investment (both gross investments and FDIs). The positive macroeconomic results in the post-crisis period are fiscal consolidation (the reduction in the fiscal deficit) and the lowering inflation, below 3%.
The analysis of the transformation period 2001-2017 shows the degree of the unsustainability of the growth model in the period 2001-2008, the negative effects in the recession period 2009-2014, primarily a rise in unemployment, a fall in the living standards and the debt growth and a change in the growth patterns over the last few years (Jakopin, 2018, 43). The consequences of the transformation model of “debt economies” reflected in all of the developmental dimensions ranging from demographic regression, via industrial devastation, the educational gap, regional imbalances, to institutional non-construction.
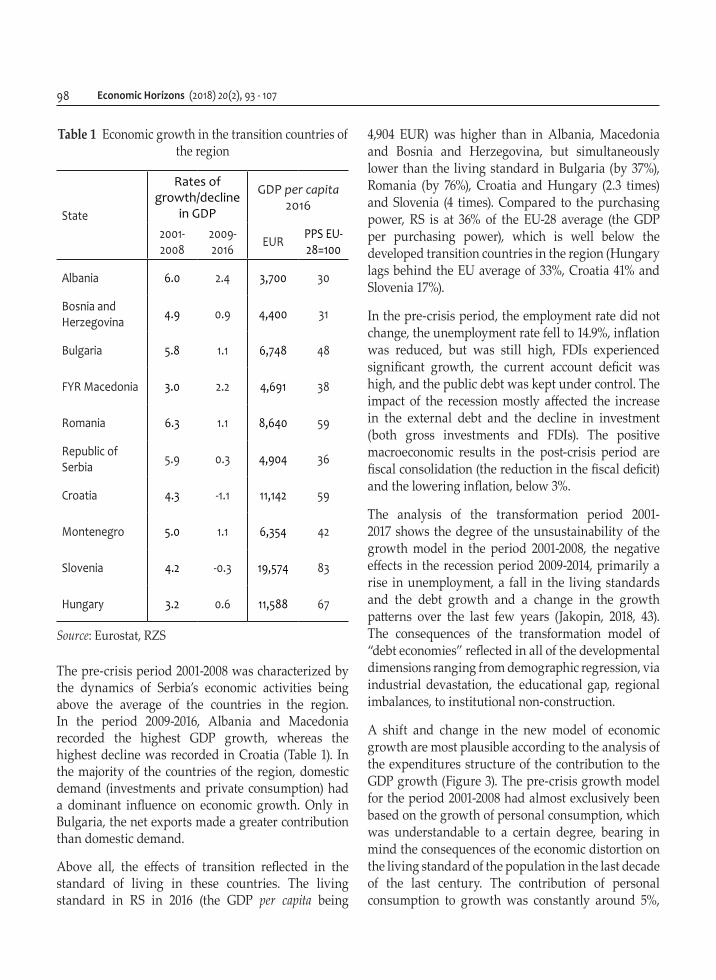
A shift and change in the new model of economic growth are most plausible according to the analysis of the expenditures structure of the contribution to the GDP growth (Figure 3). The pre-crisis growth model for the period 2001-2008 had almost exclusively been based on the growth of personal consumption, which was understandable to a certain degree, bearing in mind the consequences of the economic distortion on the living standard of the population in the last decade of the last century. The contribution of personal consumption to growth was constantly around 5%,
E. Jakopin, Economic growth and the institutional transition of the Republic of Serbia 99
while, for example in 2008, it was as much as 8%. The foreign trade deficit was of a permanent character and the contribution of investments to economic growth was mainly made through the privatization process. State consumption also contributed to the growth achieved by 2009.
During the recession period, there was a drastic fall in personal consumption and investment, whereas a significant drop in the contribution to the recession was also visible in the foreign trade deficit. In 2015, a positive contribution of investments was registered for the first time, which continued in 2016 and 2017. After five recession years, f the focus from the growth model based on the growth of consumption slowly shifted in 2015 to the growth model based on investment and, after a long time, on personal consumption. The contribution of personal consumption had an upward trend which resulted in a contribution of 0.4 percentage points in 2015, 0.7 percentage points in 2016, and 1.3 percentage points in 2017.
INSTITUTIONAL TRANSITION
The theorists of institutional transition define the very notion of institutions broadly, most often as the “formal and informal rules and their implementation mechanisms that shape the behavior of individuals and organizations in society” (Burki and Perry, 1998). Formal institutions are laws, regulations and contracts, whereas informal ones are: trust, ethics and political norms. Political institutions (legislative, political parties, government agencies), economic institutions (private companies, trade unions, business associations) and social institutions (NGOs, schools) are distinguished. The institutional growth theorists who claim that institutions dominate politics define institutions as
“a group of social arrangements that contain constitutional and social constraints based on the power of politicians and elites, the rule of law, provisions for mediation in social conflicts, the strong enforcement of property rights, a minimum volume of equal opportunities, and relatively broad access to education, etc.” (Acemoglu, Johnson, & Robinson, 2005).
Figure 3 The models growth-structures contribution to the GDP growth in the Republic of Serbia
Source: Author
Economic Horizons (2018) 20(2), 93 - 107100
Similarly, one group of authors define institutions as “the rules of the game in the society and their contribution to desirable economic behavior” (Rodrik, Subramanian & Trebbi, 2004), especially emphasizing the rule of law and the protection of property rights. “Institutions are primary to the rule of law” and “law enforcement” (Dollar & Kraay, 2002).
The theoretical framework of the connection between institutional development and economic growth is extremely diverse. E. L. Jones (1981), D. North (1990), S. Knack and Ph. Keefer (1995), P. Mauro (1995), W. Easterly and R. Levine (2003), D. Acemoglu, S. Johnson and J. A. Robinson (2005), S. L. Engerman and S. Sokoloff (2010), and others have made a significant contribution to the construction of institutions and economic development. The crucial factor of successful transitional results is the efficiency of newly-established institutions (Hoff & Stiglitz, 2004).
Perhaps one of the biggest shortcomings in the imposed reform agenda intending to help transitional economies is inconsistency and selectivity in strengthening the institute of the rule of law, property rights and the investment climate (all being more or less closely related). The definition of the World Bank insists on the efficiency of institutions, does not put an emphasis on the development of an institute, for example, the rule of law, a long and systemically demanding process implicative of social implications.
The reform agenda of the institutional transition focuses on the rule of law, law enforcement, access to knowledge and education, political participation, social equity and solidarity, tolerance and accountability.
According to the theoretical concept stipulating that institutional transition involves three key factors, namely the process of electing and controlling power, the institutional adoption and implementation of policies, and the development of institutions for the purpose of serving citizens, Daniel Kaufmann, Aart Kraay and Massimo Mastruzzi created the composite Indicators of Effective Institutional Management (Worldwide Governance Indicators, WGI) and developed a methodology for monitoring institutional transition in transition countries (Kaufmann, Kraay
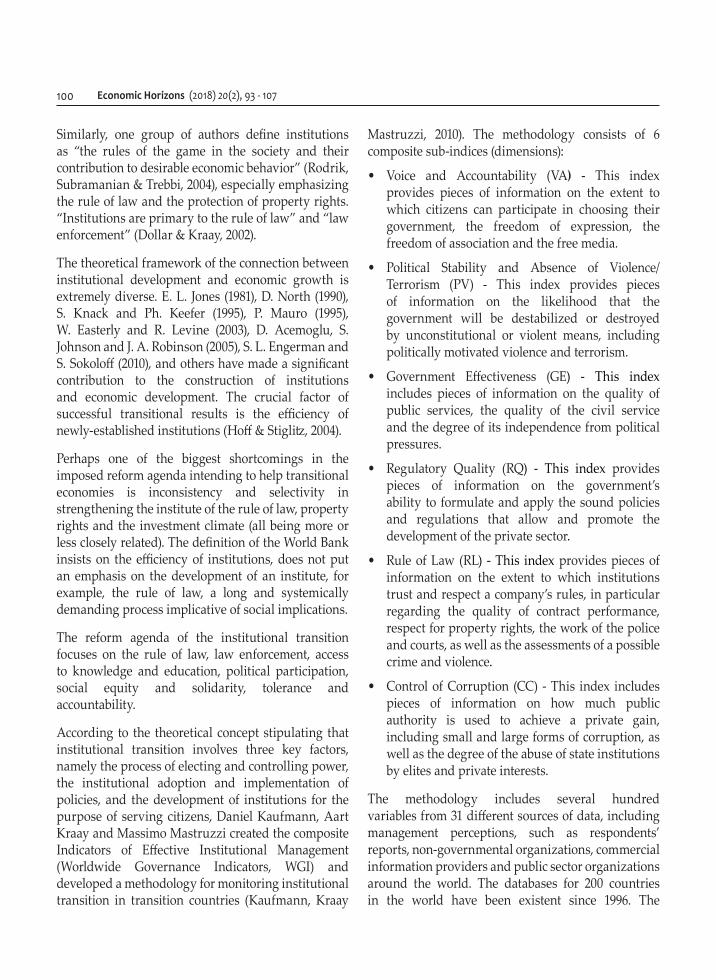
Mastruzzi, 2010). The methodology consists of 6 composite sub-indices (dimensions):
• Voice and Accountability (VA) - This index provides pieces of information on the extent to which citizens can participate in choosing their government, the freedom of expression, the freedom of association and the free media.
• Political Stability and Absence of Violence/Terrorism (PV) - This index provides pieces of information on the likelihood that the government will be destabilized or destroyed by unconstitutional or violent means, including politically motivated violence and terrorism.
• Government Effectiveness (GE) - This index includes pieces of information on the quality of public services, the quality of the civil service and the degree of its independence from political pressures.
• Regulatory Quality (RQ) - This index provides pieces of information on the government’s ability to formulate and apply the sound policies and regulations that allow and promote the development of the private sector.
• Rule of Law (RL) - This index provides pieces of information on the extent to which institutions trust and respect a company’s rules, in particular regarding the quality of contract performance, respect for property rights, the work of the police and courts, as well as the assessments of a possible crime and violence.
• Control of Corruption (CC) - This index includes pieces of information on how much public authority is used to achieve a private gain, including small and large forms of corruption, as well as the degree of the abuse of state institutions by elites and private interests.
The methodology includes several hundred variables from 31 different sources of data, including management perceptions, such as respondents’ reports, non-governmental organizations, commercial information providers and public sector organizations around the world. The databases for 200 countries in the world have been existent since 1996. The
E. Jakopin, Economic growth and the institutional transition of the Republic of Serbia 101
composite indicator WGI, expressed through the equation system, is expressed in standard normal units (ranging from -2.5 to 2.5).
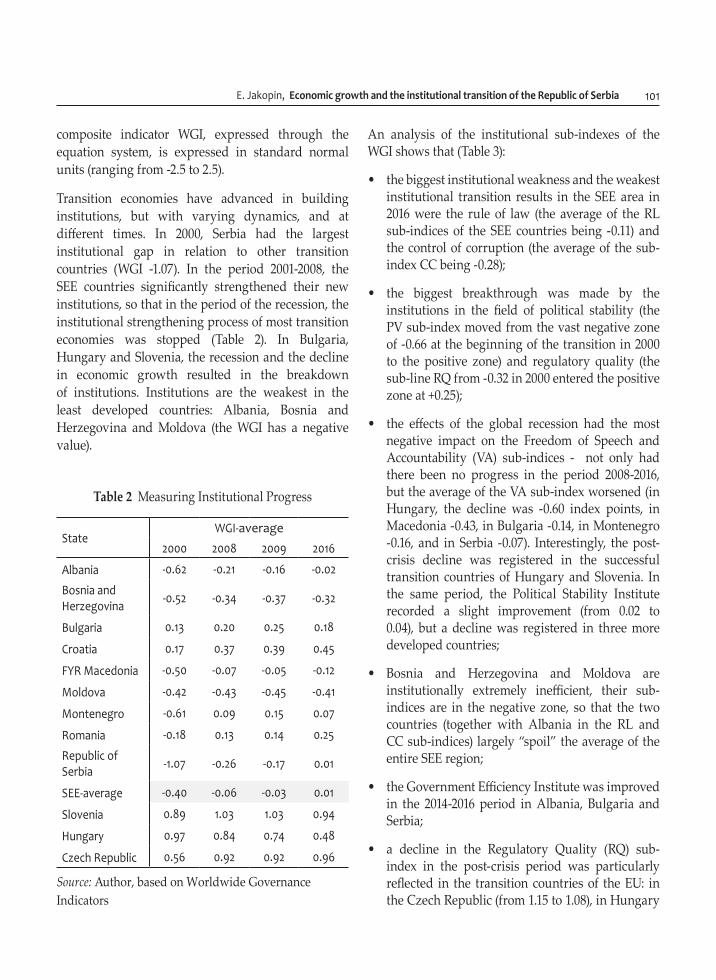
Transition economies have advanced in building institutions, but with varying dynamics, and at different times. In 2000, Serbia had the largest institutional gap in relation to other transition countries (WGI -1.07). In the period 2001-2008, the SEE countries significantly strengthened their new institutions, so that in the period of the recession, the institutional strengthening process of most transition economies was stopped (Table 2). In Bulgaria, Hungary and Slovenia, the recession and the decline in economic growth resulted in the breakdown of institutions. Institutions are the weakest in the least developed countries: Albania, Bosnia and Herzegovina and Moldova (the WGI has a negative value).
Table 2 Measuring Institutional Progress
StateWGI-average
2000 2008 2009 2016
Albania -0.62 -0.21 -0.16 -0.02
Bosnia and Herzegovina -0.52 -0.34 -0.37 -0.32
Bulgaria 0.13 0.20 0.25 0.18
Croatia 0.17 0.37 0.39 0.45
FYR Macedonia -0.50 -0.07 -0.05 -0.12
Moldova -0.42 -0.43 -0.45 -0.41
Montenegro -0.61 0.09 0.15 0.07
Romania -0.18 0.13 0.14 0.25
Republic of Serbia -1.07 -0.26 -0.17 0.01
SEE-average -0.40 -0.06 -0.03 0.01
Slovenia 0.89 1.03 1.03 0.94
Hungary 0.97 0.84 0.74 0.48
Czech Republic 0.56 0.92 0.92 0.96
Source: Author, based on Worldwide Governance Indicators
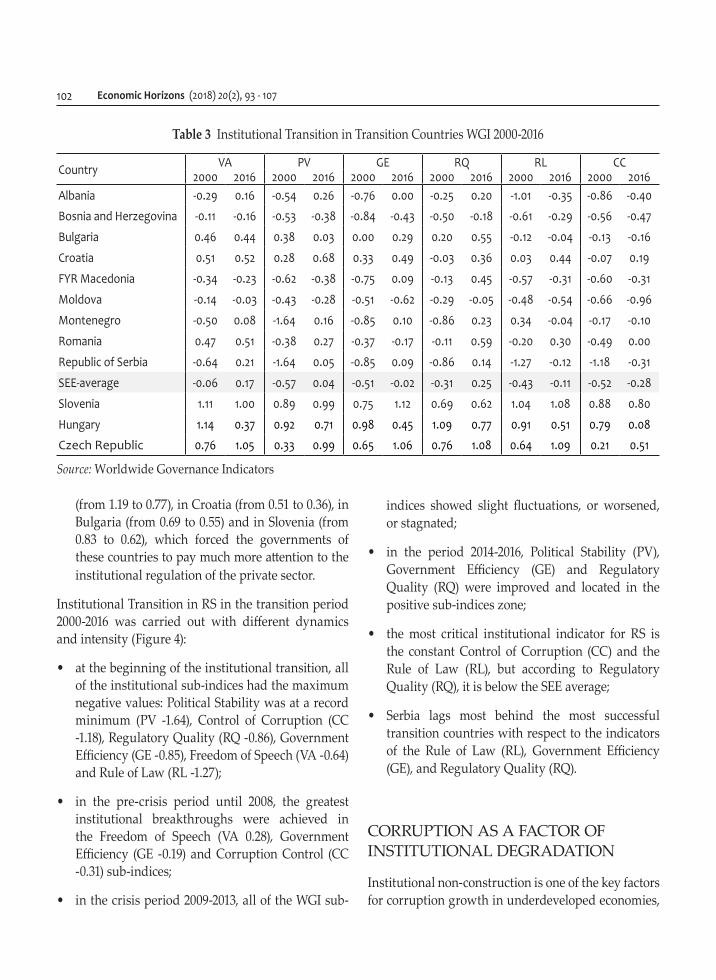
An analysis of the institutional sub-indexes of the WGI shows that (Table 3):
• the biggest institutional weakness and the weakest institutional transition results in the SEE area in 2016 were the rule of law (the average of the RL sub-indices of the SEE countries being -0.11) and the control of corruption (the average of the sub-index CC being -0.28);
• the biggest breakthrough was made by the institutions in the field of political stability (the PV sub-index moved from the vast negative zone of -0.66 at the beginning of the transition in 2000 to the positive zone) and regulatory quality (the sub-line RQ from -0.32 in 2000 entered the positive zone at +0.25);
• the effects of the global recession had the most negative impact on the Freedom of Speech and Accountability (VA) sub-indices - not only had there been no progress in the period 2008-2016, but the average of the VA sub-index worsened (in Hungary, the decline was -0.60 index points, in Macedonia -0.43, in Bulgaria -0.14, in Montenegro -0.16, and in Serbia -0.07). Interestingly, the post-crisis decline was registered in the successful transition countries of Hungary and Slovenia. In the same period, the Political Stability Institute recorded a slight improvement (from 0.02 to 0.04), but a decline was registered in three more developed countries;
• Bosnia and Herzegovina and Moldova are institutionally extremely inefficient, their sub-indices are in the negative zone, so that the two countries (together with Albania in the RL and CC sub-indices) largely “spoil” the average of the entire SEE region;
• the Government Efficiency Institute was improved in the 2014-2016 period in Albania, Bulgaria and Serbia;
• a decline in the Regulatory Quality (RQ) sub-index in the post-crisis period was particularly reflected in the transition countries of the EU: in the Czech Republic (from 1.15 to 1.08), in Hungary
Economic Horizons (2018) 20(2), 93 - 107102
(from 1.19 to 0.77), in Croatia (from 0.51 to 0.36), in Bulgaria (from 0.69 to 0.55) and in Slovenia (from 0.83 to 0.62), which forced the governments of these countries to pay much more attention to the institutional regulation of the private sector.
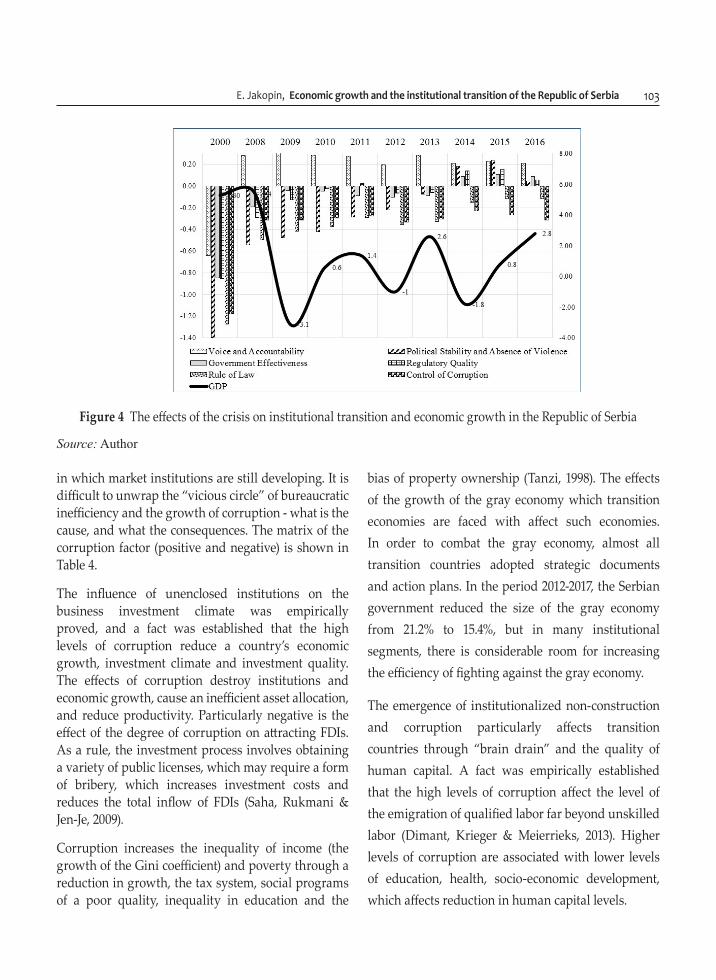
Institutional Transition in RS in the transition period 2000-2016 was carried out with different dynamics and intensity (Figure 4):
• at the beginning of the institutional transition, all of the institutional sub-indices had the maximum negative values: Political Stability was at a record minimum (PV -1.64), Control of Corruption (CC -1.18), Regulatory Quality (RQ -0.86), Government Efficiency (GE -0.85), Freedom of Speech (VA -0.64) and Rule of Law (RL -1.27);
• in the pre-crisis period until 2008, the greatest institutional breakthroughs were achieved in the Freedom of Speech (VA 0.28), Government Efficiency (GE -0.19) and Corruption Control (CC -0.31) sub-indices;
• in the crisis period 2009-2013, all of the WGI sub-
indices showed slight fluctuations, or worsened, or stagnated;
• in the period 2014-2016, Political Stability (PV), Government Efficiency (GE) and Regulatory Quality (RQ) were improved and located in the positive sub-indices zone;
• the most critical institutional indicator for RS is the constant Control of Corruption (CC) and the Rule of Law (RL), but according to Regulatory Quality (RQ), it is below the SEE average;
• Serbia lags most behind the most successful transition countries with respect to the indicators of the Rule of Law (RL), Government Efficiency (GE), and Regulatory Quality (RQ).
CORRUPTION AS A FACTOR OF INSTITUTIONAL DEGRADATION
Institutional non-construction is one of the key factors for corruption growth in underdeveloped economies,
Table 3 Institutional Transition in Transition Countries WGI 2000-2016
Country VA PV GE RQ RL CC2000 2016 2000 2016 2000 2016 2000 2016 2000 2016 2000 2016
Albania -0.29 0.16 -0.54 0.26 -0.76 0.00 -0.25 0.20 -1.01 -0.35 -0.86 -0.40
Bosnia and Herzegovina -0.11 -0.16 -0.53 -0.38 -0.84 -0.43 -0.50 -0.18 -0.61 -0.29 -0.56 -0.47
Bulgaria 0.46 0.44 0.38 0.03 0.00 0.29 0.20 0.55 -0.12 -0.04 -0.13 -0.16
Croatia 0.51 0.52 0.28 0.68 0.33 0.49 -0.03 0.36 0.03 0.44 -0.07 0.19
FYR Macedonia -0.34 -0.23 -0.62 -0.38 -0.75 0.09 -0.13 0.45 -0.57 -0.31 -0.60 -0.31
Moldova -0.14 -0.03 -0.43 -0.28 -0.51 -0.62 -0.29 -0.05 -0.48 -0.54 -0.66 -0.96
Montenegro -0.50 0.08 -1.64 0.16 -0.85 0.10 -0.86 0.23 0.34 -0.04 -0.17 -0.10
Romania 0.47 0.51 -0.38 0.27 -0.37 -0.17 -0.11 0.59 -0.20 0.30 -0.49 0.00
Republic of Serbia -0.64 0.21 -1.64 0.05 -0.85 0.09 -0.86 0.14 -1.27 -0.12 -1.18 -0.31
SEE-average -0.06 0.17 -0.57 0.04 -0.51 -0.02 -0.31 0.25 -0.43 -0.11 -0.52 -0.28
Slovenia 1.11 1.00 0.89 0.99 0.75 1.12 0.69 0.62 1.04 1.08 0.88 0.80
Hungary 1.14 0.37 0.92 0.71 0.98 0.45 1.09 0.77 0.91 0.51 0.79 0.08
Czech Republic 0.76 1.05 0.33 0.99 0.65 1.06 0.76 1.08 0.64 1.09 0.21 0.51
Source: Worldwide Governance Indicators
E. Jakopin, Economic growth and the institutional transition of the Republic of Serbia 103
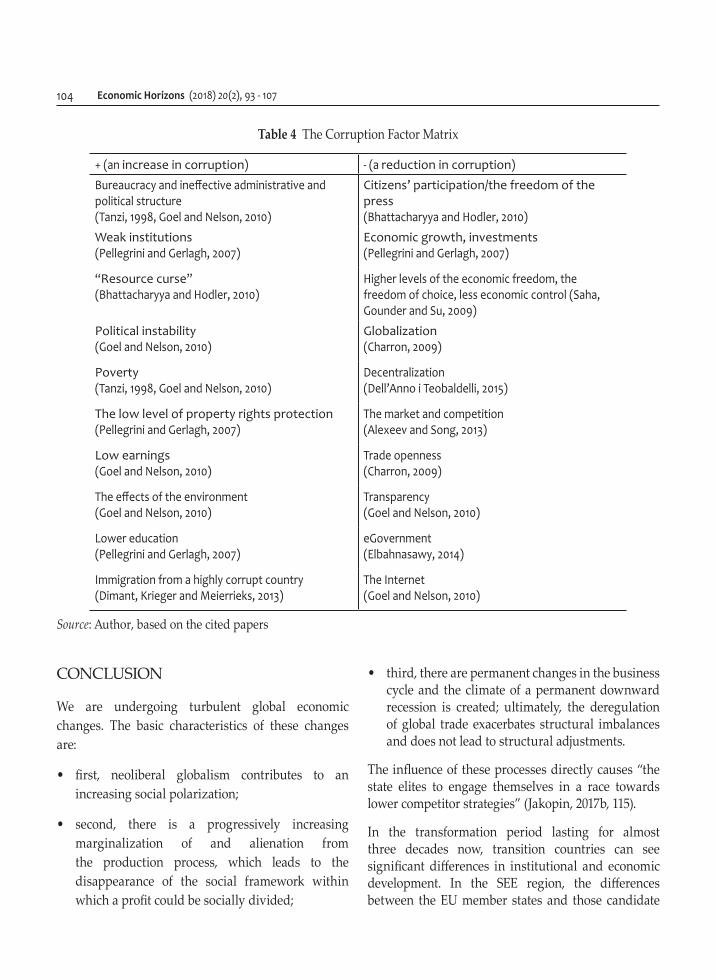
in which market institutions are still developing. It is difficult to unwrap the “vicious circle” of bureaucratic inefficiency and the growth of corruption - what is the cause, and what the consequences. The matrix of the corruption factor (positive and negative) is shown in Table 4.
The influence of unenclosed institutions on the business investment climate was empirically proved, and a fact was established that the high levels of corruption reduce a country’s economic growth, investment climate and investment quality. The effects of corruption destroy institutions and economic growth, cause an inefficient asset allocation, and reduce productivity. Particularly negative is the effect of the degree of corruption on attracting FDIs. As a rule, the investment process involves obtaining a variety of public licenses, which may require a form of bribery, which increases investment costs and reduces the total inflow of FDIs (Saha, Rukmani & Jen-Je, 2009).
Corruption increases the inequality of income (the growth of the Gini coefficient) and poverty through a reduction in growth, the tax system, social programs of a poor quality, inequality in education and the
bias of property ownership (Tanzi, 1998). The effects of the growth of the gray economy which transition economies are faced with affect such economies. In order to combat the gray economy, almost all transition countries adopted strategic documents and action plans. In the period 2012-2017, the Serbian government reduced the size of the gray economy from 21.2% to 15.4%, but in many institutional segments, there is considerable room for increasing the efficiency of fighting against the gray economy.
The emergence of institutionalized non-construction and corruption particularly affects transition countries through “brain drain” and the quality of human capital. A fact was empirically established that the high levels of corruption affect the level of the emigration of qualified labor far beyond unskilled labor (Dimant, Krieger & Meierrieks, 2013). Higher levels of corruption are associated with lower levels of education, health, socio-economic development, which affects reduction in human capital levels.
Figure 4 The effects of the crisis on institutional transition and economic growth in the Republic of Serbia
Source: Author
Economic Horizons (2018) 20(2), 93 - 107104
CONCLUSION
We are undergoing turbulent global economic changes. The basic characteristics of these changes are:
• first, neoliberal globalism contributes to an increasing social polarization;
• second, there is a progressively increasing marginalization of and alienation from the production process, which leads to the disappearance of the social framework within which a profit could be socially divided;
• third, there are permanent changes in the business cycle and the climate of a permanent downward recession is created; ultimately, the deregulation of global trade exacerbates structural imbalances and does not lead to structural adjustments.
The influence of these processes directly causes “the state elites to engage themselves in a race towards lower competitor strategies” (Jakopin, 2017b, 115).
In the transformation period lasting for almost three decades now, transition countries can see significant differences in institutional and economic development. In the SEE region, the differences between the EU member states and those candidate
Table 4 The Corruption Factor Matrix
+ (an increase in corruption) - (a reduction in corruption)Bureaucracy and ineffective administrative and political structure (Tanzi, 1998, Goel and Nelson, 2010)
Citizens’ participation/the freedom of the press(Bhattacharyya and Hodler, 2010)
Weak institutions(Pellegrini and Gerlagh, 2007)
Economic growth, investments (Pellegrini and Gerlagh, 2007)
“Resource curse”(Bhattacharyya and Hodler, 2010)
Higher levels of the economic freedom, the freedom of choice, less economic control (Saha, Gounder and Su, 2009)
Political instability (Goel and Nelson, 2010)
Globalization (Charron, 2009)
Poverty (Tanzi, 1998, Goel and Nelson, 2010)
Decentralization (Dell’Anno i Teobaldelli, 2015)
The low level of property rights protection (Pellegrini and Gerlagh, 2007)
The market and competition(Alexeev and Song, 2013)
Low earnings (Goel and Nelson, 2010)
Trade openness (Charron, 2009)
The effects of the environment (Goel and Nelson, 2010)
Transparency (Goel and Nelson, 2010)
Lower education (Pellegrini and Gerlagh, 2007)
eGovernment (Elbahnasawy, 2014)
Immigration from a highly corrupt country (Dimant, Krieger and Meierrieks, 2013)
The Internet (Goel and Nelson, 2010)
Source: Author, based on the cited papers
E. Jakopin, Economic growth and the institutional transition of the Republic of Serbia 105
ones are increasingly more noticeable in terms of economic (the rate and sustainability of economic growth) and in institutional terms (efficient and stable institutions in the function of economic growth). The global recession had a devastating effect on the degradation of the already fragile institutions of the SEE region (Jakopin, 2018, 51-54). In addition to the late transition phase (Serbia, Bosnia and Herzegovina, Macedonia), institutional and economic policies were influenced by the institutional reforms.
The influence the institutions have on economic growth and development is directly felt through the efficiency of the state (the regulatory, allocative, and incentive functions), especially in the crisis periods when the imperfection of the market, as a convergence instrument, is manifest. An effective institutional framework creates the business environment, instruments, mechanisms and measures for sustainable economic growth. Countries characterized by a high degree of the rule of law have a rate of economic growth three times as high. In addition to the delayed transition and the political legacy, the SEE’s economic periphery should also be sought for the reason of the fact that, first of all, the institutional transition has not been successfully implemented.
According to the results of the research work done, the following conclusions can be drawn:
• The applied transitional models of economic growth were not in the function of building stable institutions. Institutional construction was shadowed by the ownership structure transformation process. The inadequacy and inefficiency of institutions directly influenced the effects of the privatization process, as well as the post-privatization effects, not only in Serbia, but also in the surrounding countries.
• Throughout the transition period there is a permanent gap between reform laws and their implementation. Institutions without the law enforcement capacity not only create inconsistencies between the proclaimed and the real, but also encourage the marginalization and non-enforcement of law.
• The institutional gap is mostly contributed to by the corruption factor, which is “fed” by bureaucracy, inefficient administration, low wages and poverty.
• Institutions are faced with the major problem of openness, which is evident from the central to the local level of institutional closure, and non-transparency is growing. The Center for Democratic Transition conducted a research study of the openness of institutions (governments, assemblies, ministries and administration bodies) in the countries of Montenegro, Republic of Serbia, Bosnia and Herzegovina, and FYR Macedonia (October-December 2016) and the obtained results based on the Regional Open Source Index show high institutional closeness, selectivity and arbitrariness (for example, the Serbian authorities were opened 56%, whereas that percentage was 66% in Montenegro, 36% in Macedonia and 44% in B&H). The concept of open governments during the EU integration process did not fully survive, and society’s essential need for the necessity of applying and promoting reform values and their positive impact on the citizens was not recognized. In this context, it is necessary to continuously conduct research studies of the openness of institutions at all the levels of government.
The contribution of the research study reflects in the testing of the initial hypothesis of the interaction between institutional transition and economic growth indicates that the influence of institutions on transition economic growth in Serbia was negligible, and the reverse influence, i.e. the impact of economic growth on the development of institutions is the only such interest we can speak about. In the period 2001-2008, when the average rate of economic growth in Serbia was 5.9%, all of the indicators of institutional efficiency recorded significant growth. By contrast, in the recession period until 2014, deprived of virtually any growth at all, the largest number of the indicators of institutional efficiency experienced either a decline or stagnation. A mild recovery and growth in the period 2015-2017 reflected the improvement of a number of institutional indicators (political stability, government efficiency and regulatory quality).
Economic Horizons (2018) 20(2), 93 - 107106
The final message to the economic policy makers is: as sustainable economic growth is impossible without stable and efficient institutions, no stable or efficient institutions are possible, either, in recessionary periods, or in the periods of low economic growth rates.
REFERENCES
Acemoglu, D., Johnson, S., & Robinson, J. A. (2005). Institutions as the fundamental cause of long-run growth. In P. Aghion, & S. Durlauf (Eds.). Handbook of Economic Growth Volume 1A (pp. 385-472). Amsterdam, North Holland: Elsevier B.V. doi:lO.l016/Sl574-W84(05)OloW
Alexeev, M., & Song, Y. (2013). Corruption and product market competition: An empirical investigation. Journal of Development Economics, 103(1), 154-166. doi.org/10.1016/j.jdeveco.2013.02.010
Bhattacharyya, S., & Hodler, R. (2010). Natural resources, democracy and corruption. European Economic Review, 54(4), 608-621. doi.org/10.1016/j.euroecorev.2009.10.004
Burki, S. J., & Perry, G. (1998). Beyond the Washington Consensus: Institutions Matter. Washington, DC: World Bank.
Charron, N. (2009). The impact of socio-political integration and press freedom on corruption. The Journal of Development Studies, 45(9), 1472-1493. doi.org/10.1080/00220380902890243
Dell’Anno, R., & Teobaldelli, D. (2015). Keeping both corruption and the shadow economy in check: The role of decentralization. International Tax and Public Finance, 22(1), 1-40. doi:10.1007/s10797-013-9298-4
Dimant, E., Krieger, T., & Meierrieks, D. (2013). The effect of corruption on migration 1985-2000. Applied Economics Letters, 20(13), 1270-1274. doi.org/10.1080/13504851.2013.806776
Dollar, D., & Kraay, A. (2002). Institutions, trade, and growth. Journal of Monetary Economics, 50(1), 133-162. doi.org/10.1016/S0304-3932(02)00206-4
Easterly, W., & Levine, R. (2003). Tropic, germs and crops: How endowments influence economic development. Journal of Monetary Economics, 50(1), 3-39. doi.org/10.1016/S0304-3932(02)00200-3
Elbahnasawy, N. G. (2014). E-government, internet adoption, and corruption: An empirical investigation. World Development, 57(C), 114-126. doi: 10.1016/j.worlddev.2013.12.005
Engerman, S. L., & Sokoloff, S. (2000). History lessons: Institutions, factor endowments, and paths of development in the new world. Journal of Economic Perspectives, 14(3), 217-232. doi:10.1257/jep.14.3.217
Goel, K. R., & Nelson, A. M. (2010). Causes of corruption: History, geography and government. Journal of Policy Modeling, 32(4), 433-447. doi.org/10.1016/j.jpolmod.2010.05.004
Hoff, K., & Stiglitz, E. J. (2004). After the big bang? Obstacles to the emergence of the rule of law in post-communist societies. American Economic Review 94(3), 753-763.
doi:10.1257/0002828041464533
Jakopin, E. (2017a). Smart specialisation of manufacturing industry: Relying on one’s own strengths and targeted attraction of FDI. Ekonomika preduzeća, 65(1-2), 155-173.
Jakopin, E. (2017b). Privredni rast i institucionalne performanse u tranzicionim državama JIE. Ekonomija danas, Institucije - šta (ne)možemo uraditi bolje, 105-118.
Jakopin, E. 2018. Regionalna tranzicija Srbije. Beograd, Republika Srbija: Zadužbina Andrejević.
Jones, E. L. 1981. The European Miracle: Environments, Economies, and Geopolitics in the History of Europe and Asia. New York, NY: Cambridge University Press.
Kaufmann, D., Kraay, A., & Mastruzzi, M. (2010). The worldwide governance indicators: Methodology and analytical issues. Working Paper Series 5430, WB.
Knack, S., & Keefer, Ph. (1995). Institutions and economic performance: Cross-country tests using alternative institutional measures. Economics and Politics, 7(3), 207-227.
doi.org/10.1111/j.1468-0343.1995.tb00111.x
Mauro, P. (1995). Corruption and growth. Quarterly Journal of Economics 110(3), 681-712. doi.org/10.2307/2946696
North, D. 1990. Institutions, Institutional Change, and Economic Performance. New York, NY: Cambridge University Press.
Pellegrini, L., & Gerlagh, R. (2007). Causes of corruption: A survey of cross-country analyses and extende results. Economics of Governance 9(3), 245-263. doi:10.1007/s10101-007-0033-4
E. Jakopin, Economic growth and the institutional transition of the Republic of Serbia 107
Rodrik, D., Subramanian, A., & Trebbi, F. (2004). Institutions rule: The primacy of institutions over geography and integration in economic development. Journal of Economic Growth, 9(2), 131-165. doi:10.3386/w9305
Saha, S., Rukmani, G., & Jen-Je, S. (2009). The interaction effect of economic freedom and democracy on corruption: A panel cross-country analysis. Economics Letters, 105(2), 173-176.
Tanzi, V. (1998). Corruption around the world: Causes, consequences, scope, and cures. IMF Working Paper No. 98/63, 1-39.
Edvard A. Jakopin is the Head of the Department for Strategic Analysis and Industrial Policy of the Ministry of Economy of the Republic of Serbia. He obtained his Ph.D. at the Faculty of Economics of the University of Belgrade. He is the author of numerous scientific and expert papers in the field of macroeconomics, economic development planning, structural changes, competitiveness, regional modeling.
Received on 4th April 2018,after revision,
accepted for publication on 22nd August 2018
Published online on 27th August 2018