Embed Size (px)
Citation preview

Economic growthand funded pensionsystems
Michiel BijlsmaCasper van EwijkFerry Haaijen
CPB Discussion Paper | 279


1
Economic growth and funded pension systems
Michiel Bijlsma1, Casper van Ewijk2, Ferry Haaijen3
Abstract
Growing pension savings lead to deeper capital markets. This can have a positive effect on economic
growth by allowing firms that are more dependent on external finance to grow faster. We study this
effect using data on 69 industrial sectors in 34 OECD countries for the period 2001-2010 through a
difference-in-differences approach that interacts financial development with industry dependence on
external finance. We take into account unobserved heterogeneity by including country-time, industry-
time and industry-country fixed effects. We find a significant impact of higher level of pension savings on
growth in sectors that are more dependent on external financing. The financial crisis does not
significantly affect this relation.
JEL CODES: C23, J26, O43 Keywords: Pension reform, pension funding, financial structure, economic growth.
1 CPB Netherland Bureau for Economic Policy Analysis, Tilec, Department of Economics, Tilburg University,
[email protected] 2 University of Amsterdam, Netspar, Tilburg University, [email protected]
3 SIRM, [email protected]
2
1. Introduction
The role of pension funds and life-insurance companies in the economy has increased with ageing
populations and government policies promoting private pension savings (Coletta and Zinni, 2013).
Growing pension savings lead to deeper capital markets, and therefore may have a positive effect on
economic growth. Also the financial landscape might change, with institutional investors taking over
some of the financial intermediation activities from banks. This may lead to a shift away from the
traditional continental model of relationship banking to a more Anglo-American system with a larger
role for capital markets in corporate funding (Davis and Steil, 2001). The European Commission
welcomes a larger role of institutional investors; their longer time horizons enable them "to behave in a
patient, counter-cyclical manner, restraining 'short-termism' and reducing the need for maturity
transformation" (European Commission, 2013). This is expected to foster long-term investment, helping
to put Europe back on the path of sustainable growth. The role of pension funds and life-insurance
companies seems especially relevant after the banking crisis, as banks are restrained in credit to firms
and households during the difficult process of deleveraging.
In this paper we present new empirical evidence for such an alleged positive impact of pension savings
on economic growth. We study the effect of pension assets on economic growth in OECD countries for
the period 2001-2011. Unlike the standard cross-country growth regressions, we focus on one specific
transmission mechanism for the impact of pension savings on economic growth, namely the access of
firms to external finance to fund their investments. The hypothesis is as follows: If capital markets are
more developed, one would expect firms that rely more strongly on external finance to benefit
disproportionally from more efficient financial markets compared to firms that depend less on external
finance. To test this hypothesis, we apply a difference-in-difference approach by regressing industry
growth on the interaction of an industry’s dependence on external finance with the level of pension
savings. Significance of this interaction term then indicates that financial frictions are lower in countries
with higher levels of pension savings. Thus, we are able to focus on a key mechanism that could explain
the positive effect on economic growth of a larger pension savings through pension funds and life-
insurance companies. This idea goes back to Rajan and Zingales (1998) in the context of financial
markets and growth. The difference in difference approach helps us to mitigate the endogeneity
problem in standard growth regressions (e.g. Davis and Hu (2008), Zandberg and Spierdijk (2013)). In
line with our hypothesis, we find supporting empirical evidence that growth of funded pension systems
has a positive effect on economic growth in OECD countries.
Our paper relates to a small literature on the effect of different types of pension systems on economic
growth. In a recent paper, Zandberg and Spierdijk (2013) find no significant effects of the growth in
funded pension systems on economic growth in the 2001-2010 period for 54 OECD and non-OECD
countries. The authors control for pension investment returns to capture the switch in funded pensions.
Only when using a 5-year period growth model with rolling windows, which is non-standard in empirical
growth literature, do they find a weak significantly positive effect of pension savings on economic
growth. These positive findings, however, are not robust to exclusion of individual countries. In
appendix 2, we find that a cross-country regression for OECD countries only does give significant
positive effects of pension assets on economic growth, also without applying rolling windows. In an
older paper Davis and Hu (2008) find that an increasing pension assets-to-GDP ratio positively affects

3
output using both OLS estimation and dynamic heterogeneous panel estimation. The authors find a
positive influence of funded pension systems on economic growth for both OECD countries and
Emerging Market Economies in the period 1960-2002. For example for Chile they find that a 1%
increase in pension assets can contribute to economic growth by 0.14%. Other papers focus on the
impact of pension reforms on aggregate savings. Samwick (2000) shows that PAYG countries tend to
have lower aggregate saving rates than countries with funded pensions. Similar results were found by
Bailliu and Reisen (1997), who find evidence that funded pensions in OECD and developing countries
are correlated with higher savings.
Our paper is structured as follows. Section 2 provides some background on the increasing role of
pension savings, and discusses the potential impact on the financial landscape and economic growth.
Section 3 presents the econometric methodology and describes the data. Section 4 presents our
empirical results applying the Rajan and Zingales (1998) methodology in a cross-industry, cross-country
comparison. Section 5 concludes.
2. Funded pensions, financial intermediation and economic growth
The role of private pensions in the provision of retirement income has grown significantly in the past
two decades, reflecting efforts by many countries to relieve pressure on unsustainable pay-as-you-go
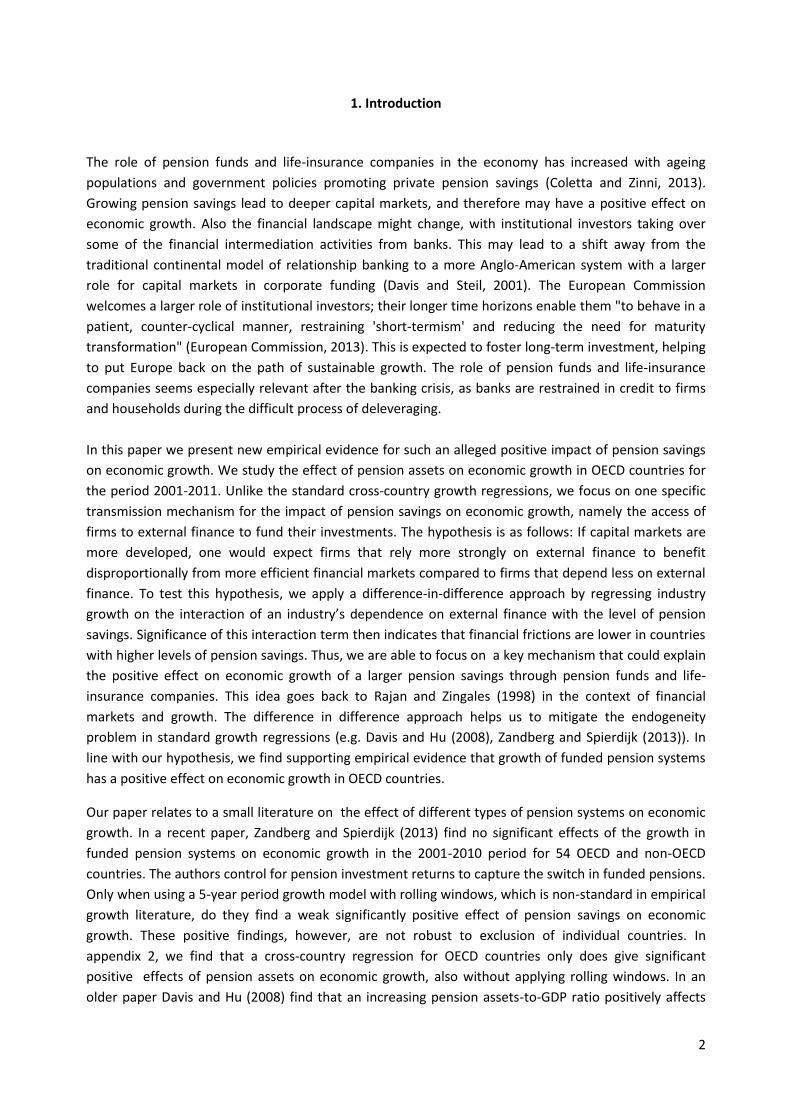
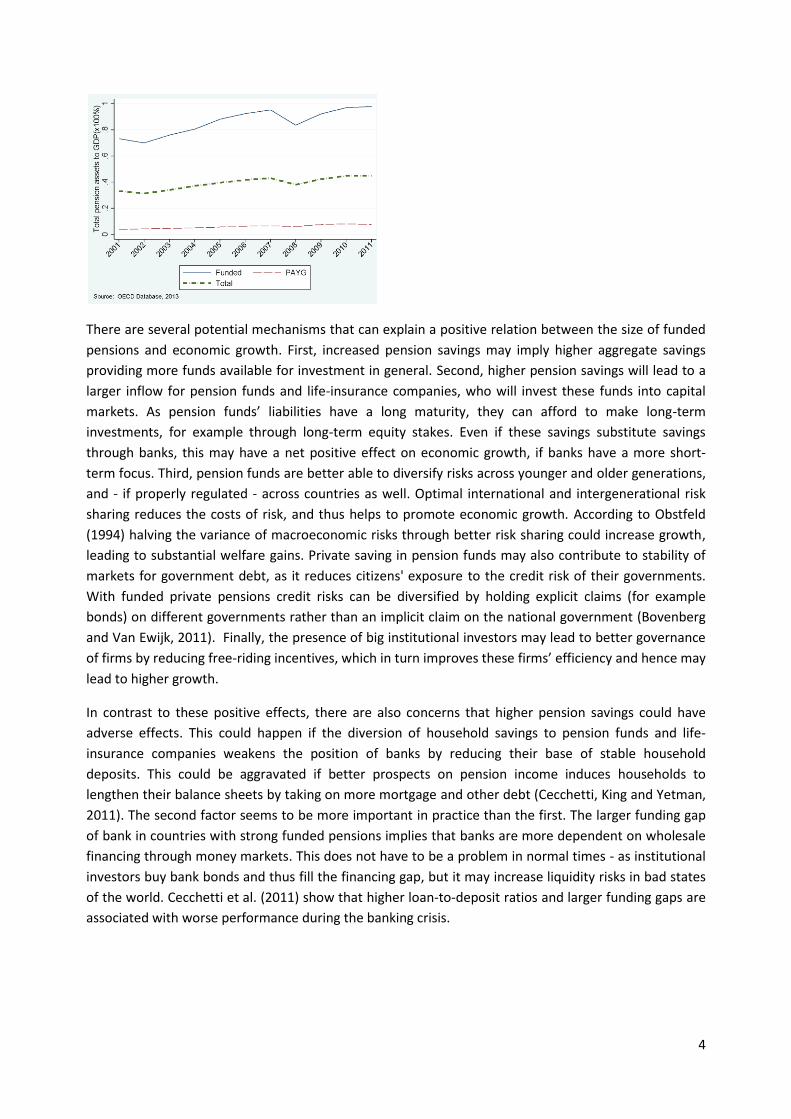
(PAYG) benefits. The growing importance of pension savings is illustrated in figure 1. Despite the
considerable losses due to the financial crises in 2002 and 2008, total pension assets relative to GDP
rose 13 percentage points in OECD countries from approximately 33% on average in 2001 to 45% in
20114. Most of the increase is driven by OECD countries with already larger funded pension systems.
Total pension assets to GDP for this group increased with nearly 25 percentage points from 73.2% to
97.8%. However, also for the average PAYG country the ratio more than doubled from 3.7% to 7.6%.
Despite this common trend for pension savings to increase, great diversity remains across individual
countries, both in level and in evolution over time (for a detailed description, see Appendix 1). Pension
policies are typically determined at the national level, and are subject to specific historical and political
circumstances, and are sometimes erratic. The recent incidents in Poland and Hungary where private
pensions where re-nationalized - mainly for budgetary reasons - fall outside the scope of our
observation period.
Figure 1: Total pension assets-to-GDP for 'funded' countries and 'PAYG' countries, 2001-2011. Unweighted average of pension assets-to-GDP
for all 34 OECD countries. The funded group is identified as having at least 25% of total pension assets-to-GDP in 2002.
4 Unweighted average for all 34 OECD countries (Source: OECD - total pension assets to GDP statistics)
4
There are several potential mechanisms that can explain a positive relation between the size of funded
pensions and economic growth. First, increased pension savings may imply higher aggregate savings
providing more funds available for investment in general. Second, higher pension savings will lead to a
larger inflow for pension funds and life-insurance companies, who will invest these funds into capital
markets. As pension funds’ liabilities have a long maturity, they can afford to make long-term
investments, for example through long-term equity stakes. Even if these savings substitute savings
through banks, this may have a net positive effect on economic growth, if banks have a more short-
term focus. Third, pension funds are better able to diversify risks across younger and older generations,
and - if properly regulated - across countries as well. Optimal international and intergenerational risk
sharing reduces the costs of risk, and thus helps to promote economic growth. According to Obstfeld
(1994) halving the variance of macroeconomic risks through better risk sharing could increase growth,
leading to substantial welfare gains. Private saving in pension funds may also contribute to stability of
markets for government debt, as it reduces citizens' exposure to the credit risk of their governments.
With funded private pensions credit risks can be diversified by holding explicit claims (for example
bonds) on different governments rather than an implicit claim on the national government (Bovenberg
and Van Ewijk, 2011). Finally, the presence of big institutional investors may lead to better governance
of firms by reducing free-riding incentives, which in turn improves these firms’ efficiency and hence may
lead to higher growth.
In contrast to these positive effects, there are also concerns that higher pension savings could have
adverse effects. This could happen if the diversion of household savings to pension funds and life-
insurance companies weakens the position of banks by reducing their base of stable household
deposits. This could be aggravated if better prospects on pension income induces households to
lengthen their balance sheets by taking on more mortgage and other debt (Cecchetti, King and Yetman,
2011). The second factor seems to be more important in practice than the first. The larger funding gap
of bank in countries with strong funded pensions implies that banks are more dependent on wholesale
financing through money markets. This does not have to be a problem in normal times - as institutional
investors buy bank bonds and thus fill the financing gap, but it may increase liquidity risks in bad states
of the world. Cecchetti et al. (2011) show that higher loan-to-deposit ratios and larger funding gaps are
associated with worse performance during the banking crisis.

5
3. Method and data
We analyse the effect of pension assets on economic growth in OECD countries for the period 2001-
2011 using a cross-industry, cross-country difference-in-difference regression. We focus on the
difference in dependence on external finance across different industries. Following Rajan and Zingales
(1998) we define an index of the dependence of firms on external finance as the fraction of investment
not financed through retained earnings. Specifically, it is the gap between capital expenditures on fixed
assets and cash flow from operations. The index is constructed using data on US firms; the literature
proposes that this country provides the preferred measure of dependence on external finance as it has
the best developed financial markets. A central assumption is that the ordering of industries according
to their dependence on external finance is the same for different countries, and is determined by some
fundamental characteristics of these sectors. This methodology has been used in several papers such as
Dell'ariccia (2008), to identify the impact of banking crises on the real economy, and Laeven and
Valencia (2013) to identify the effect of financial sector intervention on the real economy. The latter
paper also checks robustness of the original Rajan Zingales index by recalculating it with more recent
data.
Our hypothesis is that domestic industries with high dependence on external finance (EDi) should
disproportionately benefit from an increase in the size of pension assets as this is associated with more
efficient financial markets. Equation 1 shows the model with cross-industry, cross-country fixed effects.
Also, we include a crisis dummy to see whether the relation changed during the crisis, or even might
have changed sign, as suggested by authors concerned with the funding gap of banks (Cecchetti et al
(2011)).
(1)
Here, the dependent variable is the value added growth for sector i in country c and year t.
include country-industry, country-time and industry-time fixed effects. This large number of
dummy variables controls for a large number of time specific, country specific, and industry specific
shocks that may affect firm performance. is the size of sector i in country c relative
to total manufacturing of that particular country5; this accounts for the possibility that larger, more
saturated industries experience slower growth. We interact the level of total pension assets per country
with dependence on external finance per industry . Here the PA-to-GDP ratio ( ) is
taken as a lagged variable as it takes time for additional pension savings to lead to higher investment
and growth. The external dependence variable is included as a time-invariant characteristic per
industry. The United States is excluded from the regression because it is the benchmark for external
dependence per industry.
To examine whether the relation of pension assets and economic growth might have changed during
the crisis, we also include a crisis dummy interacted with the difference-in-difference term
. We expect the coefficient on this term to be negative if the crisis has hit countries with
large funded pensions more strongly and firms with large external financing suffer from impaired bank
5 where the sum of total value added is given as a variable on INDSTAT.
6
lending in particular. Following Laeven and Valencia (2013) we define the crisis period dummy to be one
from 2008 to 2010 for the following countries in our sample: Austria, Belgium, Czech, Denmark, Estonia,
France, Germany, Greece, Hungary, Iceland, Ireland, Luxembourg, Netherlands, Portugal, Slovakia,
Spain, Sweden and the United Kingdom.
Our panel includes all 34 OECD countries and 69 industry sectors. The OECD provides annual data on
total pension assets relative to its country’s nominal GDP (current prices, local currency) for all OECD
countries in the 2001-11 period.6 Missing pension asset data for Japan is complemented by total PA-to-
GDP ratio from the Bank of Japan.7 Limited availability of industry data (INDSTAT) restricts our
regressions to the period 2001-2010, where for the year 2010 data are available only for Australia,
Canada, Estonia, Japan, Mexico and Slovenia. Taken together we have 13,682 available observations for
1,862 unique country and sector combinations. The panel is not perfectly balanced; there are some
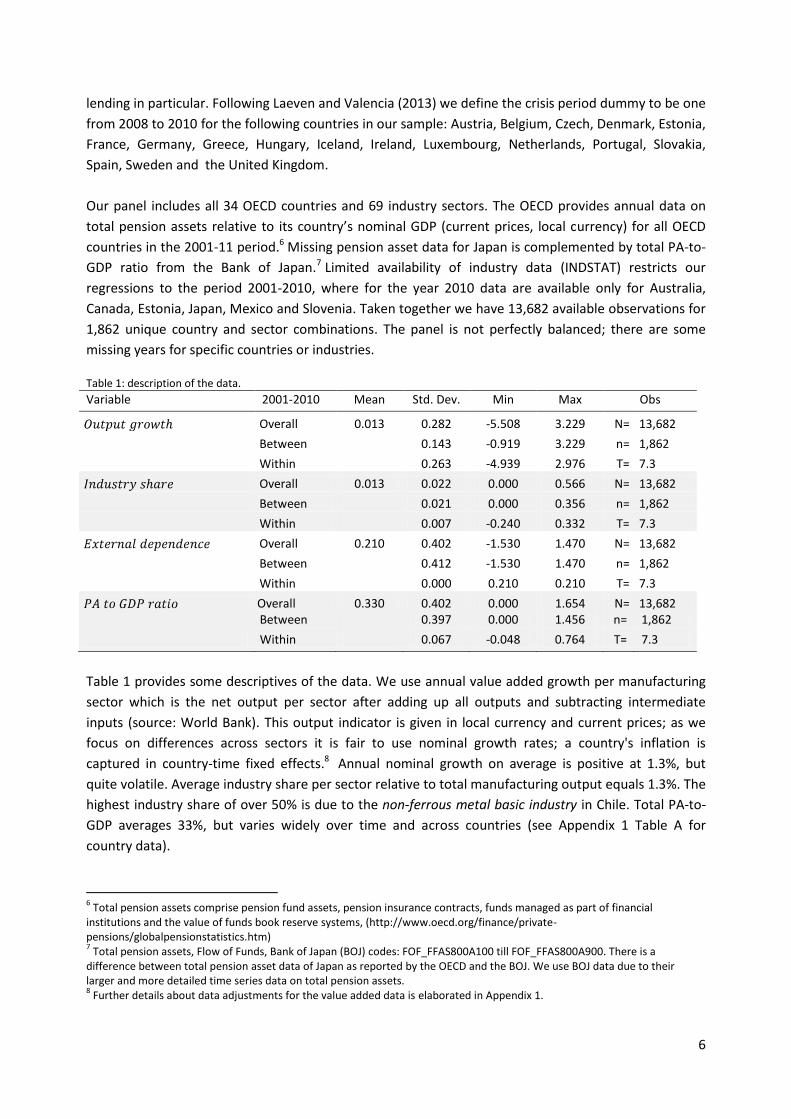
missing years for specific countries or industries. Table 1: description of the data.
Variable 2001-2010 Mean Std. Dev. Min Max Obs
Overall 0.013 0.282 -5.508 3.229 N= 13,682
Between 0.143 -0.919 3.229 n= 1,862
Within 0.263 -4.939 2.976 T= 7.3
Overall 0.013 0.022 0.000 0.566 N= 13,682
Between
0.021 0.000 0.356 n= 1,862
Within
0.007 -0.240 0.332 T= 7.3
Overall 0.210 0.402 -1.530 1.470 N= 13,682
Between 0.412 -1.530 1.470 n= 1,862
Within 0.000 0.210 0.210 T= 7.3
Overall 0.330 0.402 0.000 1.654 N= 13,682 Between 0.397 0.000 1.456 n= 1,862
Within 0.067 -0.048 0.764 T= 7.3
Table 1 provides some descriptives of the data. We use annual value added growth per manufacturing
sector which is the net output per sector after adding up all outputs and subtracting intermediate
inputs (source: World Bank). This output indicator is given in local currency and current prices; as we
focus on differences across sectors it is fair to use nominal growth rates; a country's inflation is
captured in country-time fixed effects.8 Annual nominal growth on average is positive at 1.3%, but
quite volatile. Average industry share per sector relative to total manufacturing output equals 1.3%. The
highest industry share of over 50% is due to the non-ferrous metal basic industry in Chile. Total PA-to-
GDP averages 33%, but varies widely over time and across countries (see Appendix 1 Table A for
country data).
6 Total pension assets comprise pension fund assets, pension insurance contracts, funds managed as part of financial
institutions and the value of funds book reserve systems, (http://www.oecd.org/finance/private-pensions/globalpensionstatistics.htm) 7 Total pension assets, Flow of Funds, Bank of Japan (BOJ) codes: FOF_FFAS800A100 till FOF_FFAS800A900. There is a
difference between total pension asset data of Japan as reported by the OECD and the BOJ. We use BOJ data due to their larger and more detailed time series data on total pension assets. 8 Further details about data adjustments for the value added data is elaborated in Appendix 1.
7
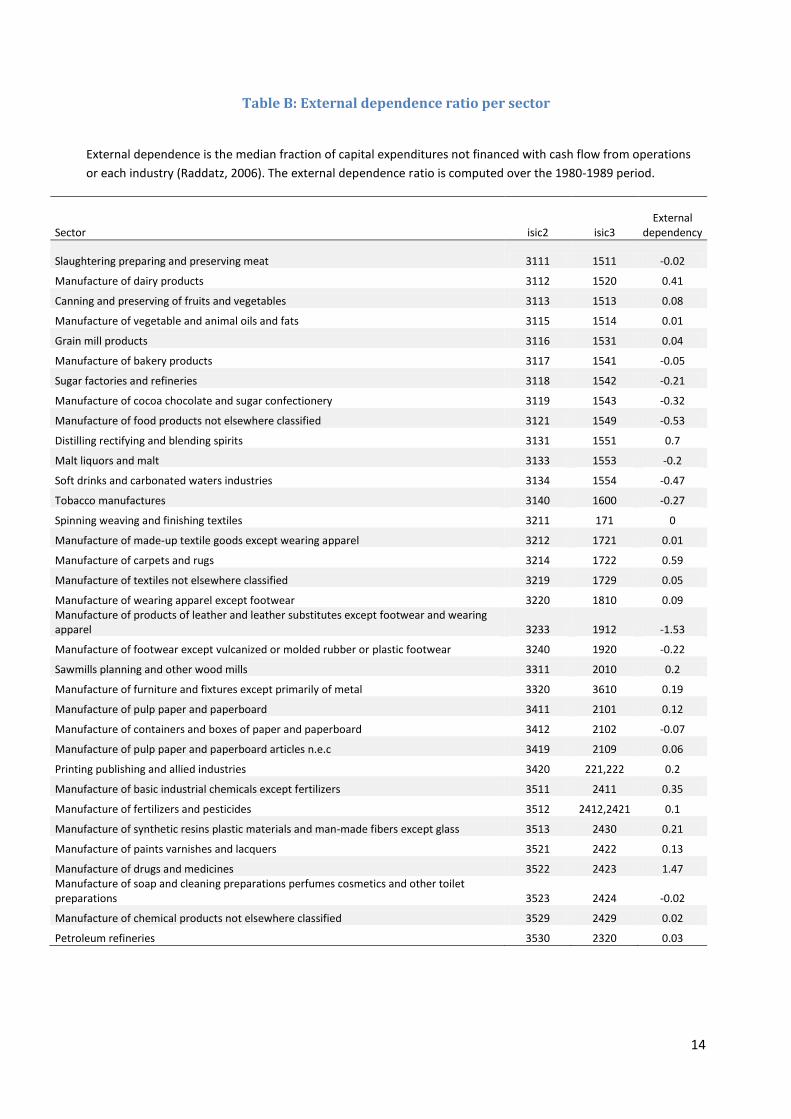
The index for external dependence per manufacturing sector ( ) has previously been constructed by
Rajan and Zingales (1998), and enlarged by Raddatz (2006). Rajan and Zingales distinguish 36 sectors
which has been extended to 70 sectors by Raddatz. External dependence at the company level is
defined as the gap between capital expenditures on fixed assets and cash flow from operations:
The authors take the median of the (time-averaged) external dependence of all firms per sector in the
1980-89 period to compute the aggregate external dependence ratio which is time-invariant but differs
between sectors. Note that the external dependence index is not constrained to be positive. Sectors
range from the leather industry, with the lowest external dependence (-1.53), to manufacturing of
drugs and medicines, with the highest external financial needs (1.47).9 Rajan and Zingales argue that
these measures are very persistent and technologically determined, and therefore typical for an
industry over time and across countries. Indeed, a number of papers have checked robustness by
constructing the measure with more recent data (Beck, Chen, Lin, and Song, 2012 and Laeven and
Valencia, 2013).
4. Empirical results
In this section we estimate the model in Equation 1. The results are summarised in Table 2 both for the
standard model, and for the model that includes a crisis dummy to account for the potential impact of
the crisis. To account for country and sector trends, as well as for omitted variables, each regression
includes country-industry, country-year and industry-year fixed effects with standard errors clustered
by country-industry. In order to eliminate noise we only use output data with at least 5 consecutive
growth data points (see also Ciccone and Papaioannou , 2010). Furthermore, In line with Kroszner,
Laeven and Klingebiel (2007) we Winsorise the top and bottom 1% of the outliers which caps negative
output growth from - 551% to -86% and positive growth from 323% to 75%. Also, the top and bottom
1% of our industry share variable are Winsorised capping the top 1% ratio from 0.57 to 0.10. The PA-to-
GDP ratio has no extreme outliers.
The first two columns in Table 2 (columns a and b) presents our regression results without the industry-
year fixed effects. These fixed effects take into account common factors across industries; we now have
to include lagged output growth to account for autocorrelation at the industry level. Columns c and d
present our complete model including country-industry, country-year and industry-year fixed effects. In
line with Rajan and Zingales (1998), we find that high industry share in the previous period has a
negative effect on growth. The intuition is that saturated markets with high industry shares and more
competition inevitably hinder growth. The results for the key interaction are significant
at the 99.9% confidence level in all models and, moreover, stable across alternative specifications of the
model. Larger funded pension systems thus positively stimulate growth of manufacturing sectors with a
higher dependence on external financing, pointing to a positive impact of deeper capital markets on
financial intermediation and, thereby, on economic growth.
9 See Appendix 1, Table B for all ratios.

8
Table 2: Dependent variable: output growth (y_c,I,t ) per sector.
(a) (b) (c) (d) -0.204*** -0.205*** - -
(0.015) (0.015) -1.141*** -1.141*** -1.451*** -1.451***
(0.136) (0.136) (0.154) (0.154)
0.723*** 0.860*** 0.804*** 0.781***
(0.165) (0.188) (0.184) (0.192)
- -0.149 - 0.028
(0.102)
(0.095)
N 11159 11159 11717 11717
adj. R-sq 0.219 0.219 0.264 0.264
Country-industry f.e ✓ ✓ ✓ ✓
Country-time f.e ✓ ✓ ✓ ✓
Industry-time f.e
✓ ✓ Explanation: Regressions 1a and 1b are with country-year fixed effects and regressions 1c and 1d are with country-year industry-year fixed effects. All regressions are clustered per country-industry group. The regressions are performed for groups with at least 5 consecutive growth data points. *** denote significance at 99.9%.
Columns b and d in Table 2 test whether the positive effect of pension assets on growth breaks down
during the crisis. For this we interact the crisis period with our key independent variable. This variable,
however, turns out to be insignificant. Also the sign changes across the regressions. We thus find no
support for the argument that larger funded pensions may have a destabilising impact on the financial
system and the economy in the event of a severe crisis. This conclusion is further supported by the
insignificant result for a similar crisis dummy in a standard cross-country regression (see Appendix 2).
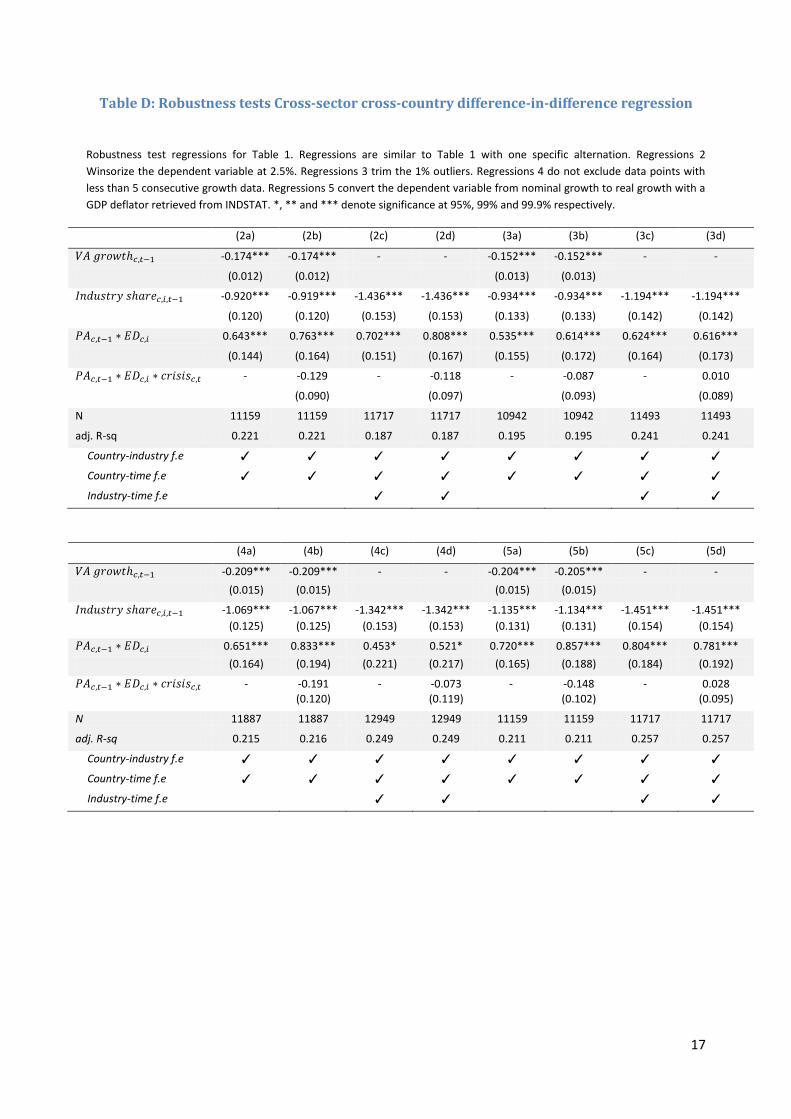
We have performed several robustness tests and we report the results of the four most important tests
in Appendix 1 (Table D). First, we have redone our initial regressions and take the top and bottom 2.5%
of output growth as threshold for Winsorisation, which turns out to cap output growth at -50% and
50%. Second, as an alternative to Winsorisation we trim the 1% outliers, in line with Dell’Ariccia et al.
(2008). Third, we note that the majority of papers correct output growth for inflation, thus we convert
our nominal output growth to real growth with the GDP deflator retrieved from INDSTAT and Winsorise
the new variable at 1%. Fourth, we repeat the initial regressions with a loop that each time omits either
two countries or three industries in alphabetic order to check for country outliers. All these robustness
tests produce significant results for the key variable at the 99.9% confidence level. We also check what
happens when we drop the requirement of 5 consecutive growth data points. Significance now falls, but
our results remain significant at the 95% confidence level. The fall in significance arises because
inclusion of sectors with substantial periods of missing output growth data are generally small with less
accurate data and lower consistency of their reported value added, which increases noise. Most of this
data comes from Greece, Turkey, Portugal and Belgium.
5. Conclusion
Many countries encourage private pension savings as a supplement to public pensions, which face
increasing demographic pressure. It is likely that the role of pension savings and institutional investors
9
in financial intermediation will increase in the future. The increasing size of pension assets may impact
the financial landscape, with a growing role of institutional investors (pension funds and life-insurance
companies). We explore whether this has consequences for economic growth and what the channel
may be. We find supporting empirical evidence that growth of funded pension systems has a positive
effect on economic growth in OECD countries. Following Rajan and Zingales (1998) we focus on one
specific channel, the external financing of firms. Using data on 69 industry sectors in 34 OECD countries
for period 2001-2010 we find that increasing pension saving is in particular beneficial for firms heavily
relying on external finance. This suggests that an increased amount of assets held by pension funds and
other institutional investors is associated with more efficient financial markets and therefore higher
economic growth.
An interesting conjecture is that this relationship might have changed during the banking crisis, as the
diversion of household savings from banks to pension funds might have weakened banks, making them
more dependent on wholesale markets. We do not find any support for a negative impact on economic
performance during a crisis.
We see several routes for future research. First, our analysis is restricted to the manufacturing industry;
the analysis could be broadened including other sectors as well, in particular the service industry.
Second, our analysis focuses on one particular transmission mechanism; there are other factors that
could influence the impact of pension savings on the economy, for example, regulations with regard to
the investments and funding of pensions funds and life-insurance companies.

10
References
Bailliu, J. N. and Reisen, H. 1998. Do funded pensions contribute to higher aggregate savings? A cross-
country analysis. Weltwirtschaftliches Archiv, 134 (4), pp. 692--711.
Beck, T., Chen, T., Lin, C., & Song, F. M., 2012. Financial Innovation: The Bright and the Dark Sides,
Working Papers 052012, Hong Kong Institute for Monetary Research, Hong Kong.
Beck, T., Levine, R. and Loayza, N. 2000. Finance and the Sources of Growth. Journal of financial
economics, 58 (1), pp. 261--300.
Bijlsma, M. and Zwart, G. 2013. The changing landscape of financial markets in Europe, the United
States and Japan, Discussion Paper 238, CPB, The Hague.
Bollinger, C. R. and Chandra, A. 2005. Iatrogenic Specification Error: A Cautionary Tale of Cleaning Data.
Journal of Labor Economics, 23 (2), pp. 235--257.
Bovenberg, A.L. and Van Ewijk, C. 2011, Private Pensions for Europe, CPB Policy Brief 7, The Hague.
Cecchetti, S.G., King M.R., and Yetman, J. 2011, Weathering the financial crisis: good policy or good
luck? BIS Working Papers 352, Basle.
Ciccone, A. and Papaioannou, E. 2010. Estimating cross-industry cross-country models using benchmark
industry characteristics. CEPR Discussion Papers 8056, London
Coletta , M. and Zinni, B. 2013. Insurance corporations and pension funds in OECD countries, Banca d'
Italia, Occasional papers 165.
Davis, E. P. and Steil B. 2001, Institutional Investors, MIT Press.
Davis, E. P. and Hu, Y. 2008. Does funding of pensions stimulate economic growth? Journal of Pension
Economics and Finance, 7 (2), p. 221--249.
Dell'ariccia, G., Detragiache, E. and Rajan, R. 2008. The real effect of banking crises. Journal of Financial
Intermediation, 17 (1), pp. 89--112.
European Commission 2013. Long-term financing of the European economy, Green paper , Brussels.
Kroszner, R., Laeven, L. and Klingebiel, D. 2007. Banking crises, financial dependence, and growth.
Journal of Financial Economics, 84 (1), pp. 187--228.
Laeven, L. and Valencia, F. 2013. The real effects of financial sector interventions during crises. Journal
of Money, Credit and Banking, 45 (1), pp. 147--177.
Obstfeld, M. 1994, Risk taking, global diversification, and growth, American Economic Review 84, 1310-
29.
Raddatz, C. 2006. Liquidity needs and vulnerability to financial underdevelopment. Journal of Financial
Economics, 80 (3), pp. 677--722.

11
Rajan, R. G. and Zingales, L. 1998. Financial dependence and growth. The American Economic Review, 88
(3), pp. 559-–586.
Samwick, A. A. 2000. Is pension reform conducive to higher saving?. Review of Economics and Statistics,
82 (2), pp. 264--272.
United Nations, Department of Economic and Social Affairs, Population Division (2013). World Population Ageing 2013. ST/ESA/SER.A/348. Zandberg, E. and Spierdijk, L. 2013. Funding of pensions and economic growth: Are they really related.
Journal of Pensions Economics and Finance, 12 (2), pp. 151--167.

12
Appendix 1: Data description
This appendix provides more detail information on the data used. For the industry output data we use
annual value added in local currency and current prices from 152 sectors in the manufacturing industry
for the period 1999-2009 from INDSTAT. We focus on sectors for which we have the dependence of
external financing ratio from Raddatz (2006). We construct a concordance table between isic3 codes
from INDSTAT and the isic2 codes from Raddatz. Some of the isic2 sectors include either two or three
isic3 sectors as seen in Table B in this appendix. At the country level, some observations of one of the
isic3 subgroups that belong to the same isic2 group are missing. In order to maintain consistency of the
former group we only compute the total sector value of these subgroups if there are no missing values
in that time series. For some countries the calculation of an industry’s value added has changed from
some particular year onwards. We identify the transition year and ignoring this specific output growth
observation to eliminate distorted growth values resulting from the change in definition. We end up
with 69 sectors which have the dependence of external financing ratio from Raddatz. Table A shows
annual pension assets-to-GDP growth as retrieved from OECD.Stat for all countries included in the
sample. Table B shows the external dependence ratio as obtained from Raddatz (2006).
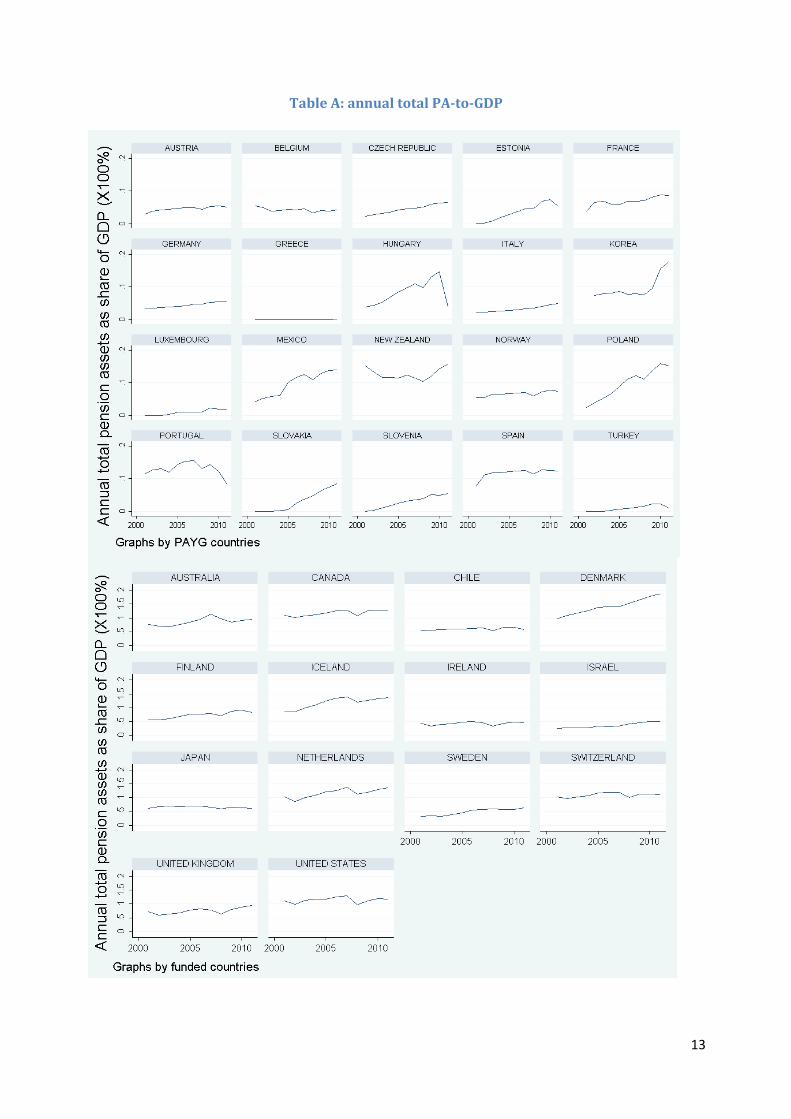
13
Table A: annual total PA-to-GDP
14
Table B: External dependence ratio per sector
External dependence is the median fraction of capital expenditures not financed with cash flow from operations
or each industry (Raddatz, 2006). The external dependence ratio is computed over the 1980-1989 period.
Sector isic2 isic3 External
dependency
Slaughtering preparing and preserving meat 3111 1511 -0.02
Manufacture of dairy products 3112 1520 0.41
Canning and preserving of fruits and vegetables 3113 1513 0.08
Manufacture of vegetable and animal oils and fats 3115 1514 0.01
Grain mill products 3116 1531 0.04
Manufacture of bakery products 3117 1541 -0.05
Sugar factories and refineries 3118 1542 -0.21
Manufacture of cocoa chocolate and sugar confectionery 3119 1543 -0.32
Manufacture of food products not elsewhere classified 3121 1549 -0.53
Distilling rectifying and blending spirits 3131 1551 0.7
Malt liquors and malt 3133 1553 -0.2
Soft drinks and carbonated waters industries 3134 1554 -0.47
Tobacco manufactures 3140 1600 -0.27
Spinning weaving and finishing textiles 3211 171 0
Manufacture of made-up textile goods except wearing apparel 3212 1721 0.01
Manufacture of carpets and rugs 3214 1722 0.59
Manufacture of textiles not elsewhere classified 3219 1729 0.05
Manufacture of wearing apparel except footwear 3220 1810 0.09 Manufacture of products of leather and leather substitutes except footwear and wearing apparel 3233 1912 -1.53
Manufacture of footwear except vulcanized or molded rubber or plastic footwear 3240 1920 -0.22
Sawmills planning and other wood mills 3311 2010 0.2
Manufacture of furniture and fixtures except primarily of metal 3320 3610 0.19
Manufacture of pulp paper and paperboard 3411 2101 0.12
Manufacture of containers and boxes of paper and paperboard 3412 2102 -0.07
Manufacture of pulp paper and paperboard articles n.e.c 3419 2109 0.06
Printing publishing and allied industries 3420 221,222 0.2
Manufacture of basic industrial chemicals except fertilizers 3511 2411 0.35
Manufacture of fertilizers and pesticides 3512 2412,2421 0.1
Manufacture of synthetic resins plastic materials and man-made fibers except glass 3513 2430 0.21
Manufacture of paints varnishes and lacquers 3521 2422 0.13
Manufacture of drugs and medicines 3522 2423 1.47 Manufacture of soap and cleaning preparations perfumes cosmetics and other toilet preparations 3523 2424 -0.02
Manufacture of chemical products not elsewhere classified 3529 2429 0.02
Petroleum refineries 3530 2320 0.03

15
Sector isic2 isic3 External
dependency
Manufacture of miscellaneous products of petroleum and coal 3540 2310 0.12
Tyre and tube industries 3551 2511 -0.11
Manufacture of rubber products not elsewhere classified 3559 2519 -0.03
Manufacture of plastic products not elsewhere classified 3560 2520 0.31
Manufacture of pottery china and earthenware 3610 2691 -0.21
Manufacture of glass and glass products 3620 2610 0.26
Manufacture of structural clay products 3691 2693 0.22
Manufacture of cement lime and plaster 3692 2694 0.27
Manufacture of non-metallic mineral products not elsewhere classified 3699 2699 -0.09
Iron and steel basic industries 3710 2710,2731 0
Non-ferrous metal basic industries 3720 2720,2732 0.02
Manufacture of cutlery hand tools and general hardware 3811 2893 -0.09
Manufacture of structural metal products 3813 2811 0.45 Manufacture of fabricated metal products except machinery and equipment not elsewhere classified 3819 2899 0.3
Manufacture of engines and turbines 3821 2911 0.23
Manufacture of agricultural machinery and equipment 3822 2921 0.33
Manufacture of metal and wood working machinery 3823 2922,2923 0.17 Manufacture of special industrial machinery and equipment except metal and wood working machinery 3824 2924,2925,2926 0.37
Manufacture of office computing and accounting machinery 3825 3000 1.07
Machinery and equipment except electrical not elsewhere classified 3829 2919 0.3
Manufacture of electrical industrial machinery and apparatus 3831 3110,3120 0.27
Manufacture of radio television and communication equipment and apparatus 3832 3210,3220,3230 0.93
Manufacture of electrical appliances and house wares 3833 2930 0.29
Manufacture of electrical apparatus and supplies not elsewhere classified 3839 3190 0.42
Ship building and repairing 3841 351 0.46
Manufacture of railroad eqquipment 3842 3520 0.18
Manufacture of motor vehicles 3843 3410,3420,3430 0.72
Manufacture of aircraft 3845 3530 0.28 Manufacture of professional and scientific and measuring and controlling equipment not elsewhere classified 3851 3312,3313 1.05
Manufacture of photographic and optical goods 3852 3320 0.72
Manufacture of watches and clocks 3853 3330 0.79
Manufacture of jewelry and related articles 3901 3691 0.79
Manufacture of musical instruments 3902 3692 0.59
Manufacture of sporting and athletic goods 3903 3693 0.16

16
Table C: Funded countries and non-funded countries Average total pension assets-to-GDP ratio per country in the 2001-2011 period to separate the more PAYG countries from the
more funded countries where funded countries have pension assets of more than 25% of nominal GDP in 2002.
0%
20%
40%
60%
80%
100%
120%
140%
160%
Total pension assets-to-GDP ratio Per country, unweighted average, 2001-2011
Source: OECD Database (2013), Bank of Japan (2013)
17
Table D: Robustness tests Cross-sector cross-country difference-in-difference regression
Robustness test regressions for Table 1. Regressions are similar to Table 1 with one specific alternation. Regressions 2
Winsorize the dependent variable at 2.5%. Regressions 3 trim the 1% outliers. Regressions 4 do not exclude data points with
less than 5 consecutive growth data. Regressions 5 convert the dependent variable from nominal growth to real growth with a
GDP deflator retrieved from INDSTAT. *, ** and *** denote significance at 95%, 99% and 99.9% respectively.
(2a) (2b) (2c) (2d) (3a) (3b) (3c) (3d)
-0.174*** -0.174*** - - -0.152*** -0.152*** - -
(0.012) (0.012) (0.013) (0.013)
-0.920*** -0.919*** -1.436*** -1.436*** -0.934*** -0.934*** -1.194*** -1.194***
(0.120) (0.120) (0.153) (0.153) (0.133) (0.133) (0.142) (0.142)
0.643*** 0.763*** 0.702*** 0.808*** 0.535*** 0.614*** 0.624*** 0.616***
(0.144) (0.164) (0.151) (0.167) (0.155) (0.172) (0.164) (0.173)
- -0.129 - -0.118 - -0.087 - 0.010
(0.090) (0.097) (0.093) (0.089)
N 11159 11159 11717 11717 10942 10942 11493 11493
adj. R-sq 0.221 0.221 0.187 0.187 0.195 0.195 0.241 0.241
Country-industry f.e ✓ ✓ ✓ ✓ ✓ ✓ ✓ ✓
Country-time f.e ✓ ✓ ✓ ✓ ✓ ✓ ✓ ✓
Industry-time f.e ✓ ✓ ✓ ✓
(4a) (4b) (4c) (4d) (5a) (5b) (5c) (5d)
-0.209*** -0.209*** - - -0.204*** -0.205*** - -
(0.015) (0.015) (0.015) (0.015)
-1.069*** -1.067*** -1.342*** -1.342*** -1.135*** -1.134*** -1.451*** -1.451***
(0.125) (0.125) (0.153) (0.153) (0.131) (0.131) (0.154) (0.154)
0.651*** 0.833*** 0.453* 0.521* 0.720*** 0.857*** 0.804*** 0.781***
(0.164) (0.194) (0.221) (0.217) (0.165) (0.188) (0.184) (0.192)
- -0.191 - -0.073 - -0.148 - 0.028
(0.120) (0.119) (0.102) (0.095)
N 11887 11887 12949 12949 11159 11159 11717 11717
adj. R-sq 0.215 0.216 0.249 0.249 0.211 0.211 0.257 0.257
Country-industry f.e ✓ ✓ ✓ ✓ ✓ ✓ ✓ ✓
Country-time f.e ✓ ✓ ✓ ✓ ✓ ✓ ✓ ✓
Industry-time f.e ✓ ✓ ✓ ✓

18
Appendix 2 Cross-country growth regressions
In this appendix present results from a standard cross country regression between GDP growth and
pension assets. Following Zandberg & Spierdijk (2013) we estimate the following model:
(a)
We relate nominal GDP growth to the lagged total pension assets-to-GDP growth and the
lagged rate of return on pension assets (Equation a). We include country fixed effects and year
fixed effects to take account of any common factors over time. Standard errors are clustered by
country. Because total funded pension assets also change due to the realized return on existing pension
assets, we control for investment returns on pension assets, . In order to compute the annual
rate of returns on pension assets of country at year we use the OECD Global Pension Statistics
Database, which has data at country-level on how pension funds allocate their investments. Under the
assumption of perfect global diversification (each investment vehicle grants an annual rate of return
that is identical between countries at a given year) we derive the annual return of pension assets
(b)
where represent the ratios of how pension funds asset portfolios are constructed. Finally, we
control for some additional factors to single out other possible determinants of GDP growth. Finally, we
add again a dummy for the crisis to check whether the relationship between pension savings and
growth may have changed during the crisis, for all countries and for funded countries taken apart.
Economic growth is measured by GDP growth per capita in current prices and local currency, retrieved
from the World Bank. We also use the widely used inverse old age dependency ratio as a control
variable to correct for changing demographics influencing pension assets. The inverse old age
dependency ratio captures changes in the working population relative to the population above 65.
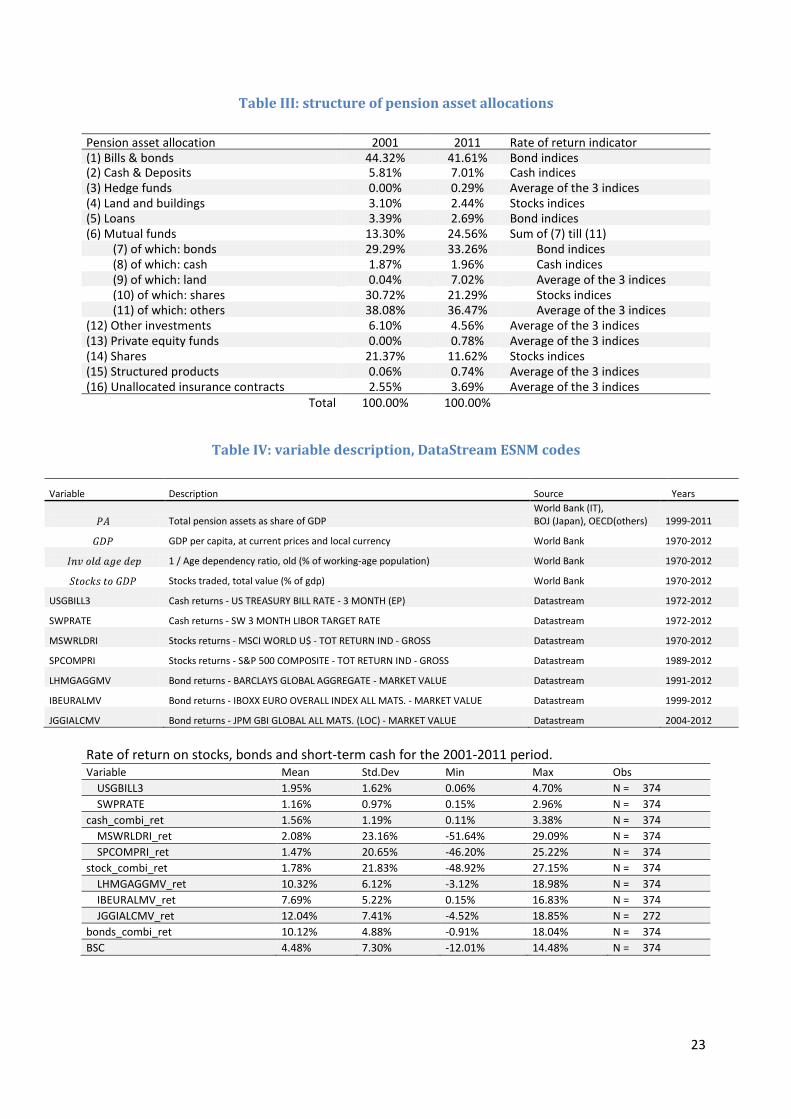
To compute the annual rate of return on total pension assets we use detailed information from OECD
on how pension funds allocate their assets amongst 11 different securities investments, ranging from
short-term cash to stocks, mutual funds and longer term bonds (Table III). Mutual funds have been
subdivided into several investment groups. Bonds represent the largest investment category in total
pension assets with 44% in 2001 and 42% in 2011. Countries with missing years of pension allocations
are computed by taking the average of all available years of that particular country. If, at country-level,
there is no data available whatsoever, worldwide averages of that particular year are used.
To reproduce the rate of return on pension assets variable we use a mixture of stocks (MSCI World
Gross Return Index), bonds (Barclays Global Aggregate Unhedged Bond Index) and short-term cash (3m
T-bill) return indices to calculate the average rate of return on total pension assets, depending on how
pension funds allocate their assets on annual bases. We combine some of the most commonly used
global securities return indices per investment category, retrieved from DataStream. Accordingly each
DataStream ESNM code is reported in Table IV below. For short-term cash returns we use the 3-month

19
Treasury bill rate and the 3-month LIBOR rate, annualized from monthly rates. For stock returns we take
average market returns of the MSCI World Gross Total Return Index and the S&P 500 Composite Gross
Total Return Index. Lastly, for bond returns we use average market value returns of the Barclays Global
Aggregate Bond Index, IBOXX European All Maturities Bond Index and JPMorgan Global All Maturities
Bond Index. For the remaining pension funds asset allocations we compute the average of these 3
return indices. Rate of return estimations in countries with a complete absence of pension asset
allocations data (France and New Zealand) are retrieve from annual reports of their largest national
pension fund.10
In comparison with Zandberg & Spierdijk (2013) we add one more year of observations, the year 2011.
Also we include a set of financial market variables as indicators for the financial development of the
country. Following Beck, Levine and Laoyza (1999) we include the stocks-to-GDP ratio and domestic
credit to the private sector as a percentage of GDP. Domestic credit to private sector refers to financial
resources provided to the private sector, such as through loans, purchases of non-equity securities and
other accounts receivable, that establish a claim for repayment. For some countries these claims
include credit to public enterprises. The stocks-to-GDP ratio refers to the total value of shares traded
during the period. This indicator complements the market capitalization ratio by showing whether
market size is matched by trading. Especially in 2001 and 2008-2009 we find large drops in the stocks-
to-GDP ratio due to financial turmoil and dried up liquidity in financial markets.
In line with the literature we include PA-to-GDP growth with a lag as capital growth does not
immediately lead to new investments. Also we interact the PA-to-GDP growth variable with a dummy
variable that separates PAYG countries from more funded countries. This is to account for the
possibility that PAYG countries with lower total PA-to-GDP ratios experience higher PA-to-GDP growth
rates which could drive regression results. Finally, we test again whether the relation changed during
the crisis period of 2008-2011.
Table I summarizes the results for the impact of growth in assets-to-GDP on GDP growth in the 2001-
2011 period. We report results with country-fixed effects to correct for individual country
characteristics. In line with Kroszner, Laeven and Klingebiel (2007) we Winsorize the top and bottom 1%
of the outliers of GDP growth and total PA-to-GDP growth because we do not want spurious outliers to
distort results. This method typically produces a higher robustness than simply omitting outliers
(Bollinger and Chandra, 2005). As a result, this caps the log of negative GDP growth from -16.5% to -
7.2% and the log of positive growth from 37.8% to 20.6%. Similarly this caps the log of total PA-to-GDP
growth from -136% to -34% and 184% to 139%.
In all regressions PA-to-GDP growth shows a statistically significant and positive sign at the 99―99.9%
confidence level. On average, a 10% increase in PA-to-GDP results to a 0.24-0.30 percentage points
increase in GDP, keeping everything else constant. Our lagged rate of return on pension assets control
variable shows a negative coefficient. This concurs with the idea, that pension asset returns do not
necessarily have a positive effect on growth. It is the increase in the flow of pension savings that drives
economic growth. Furthermore, simple OLS regressions show a weakly significant and positive
interaction between PA-to-GDP growth and a dummy for funded countries, meaning that the already
10
New Zealand Superannuation Fund and Fonds de réserve pour les retraites (Annual reports 2012-2013)

20
funded countries benefit more from becoming even more funded. There is no evidence of a changing
relation due to the financial crisis. Lastly, the positive and sometimes weakly significant inverse old age
ratio logically implies that an increasing amount of workers relative to retirees stimulates economic
growth. This strengthens our negative conclusion on the impact of the crisis on the basis of the Rajan
Zingales model.
Table I: Regressions for the impact of pension assets on GDP growth, 2001 - 2011.
LSDV OLS OLS fixed effects
(1a) (2a) (3a) (1b) (2b) (3b) (1c) (2c) (3c)
0.452*** 0.437*** 0.437*** 0.616*** 0.603*** 0.610*** 0.292*** 0.278*** 0.276***
(0.076) (0.079) (0.078) (0.058) (0.060) (0.060) (0.065) (0.066) (0.068)
0.024** 0.028** 0.025** 0.024** 0.026** 0.026** 0.027** 0.030*** 0.029***
(0.009) (0.010) (0.010) (0.008) (0.008) (0.009) (0.008) (0.008) (0.007)
-0.042 -0.042 -0.060 -0.026 -0.023 -0.044 -0.045 -0.046 -0.062
(0.039) (0.038) (0.045) (0.048) (0.047) (0.055) (0.043) (0.042) (0.048)
0.620 0.628 0.219 0.212 0.630* 0.650*
(0.324) (0.329) (0.181) (0.184) (0.286) (0.273)
0.002 0.001 0.005 0.005 0.001 0.001
(0.004) (0.004) (0.003) (0.003) (0.004) (0.004)
0.025 0.068* 0.044
(0.029) (0.030) (0.023)
-0.006 0.004 0.017
(0.030) (0.048) (0.043)
0.009 0.033 0.057
(0.053) (0.052) (0.049)
N 299 299 299 299 299 299 299 299 299
adj. R-sq - - - 0.622 0.625 0.624 0.585 0.589 0.586
Explanation: Dependent variable: GDP growth in local currency and current prices. Regressions are estimated by (a) the bias-corrected LSDV estimator with bootstrapped standard errors (Blundell-Bond estimator with first order bias and a 50x bootstrap variance-covariance matrix), (b) OLS with clustered standard errors and (c) OLS with fixed effects and clustered standard errors. Country and year dummies are not reported and the LSDV regression does not report the R-squared. Regressions 1 are our standard regressions and regressions 2 include relevant control variables. Regressions 3 includes additional interaction terms of PA-to-GDP growth with a funded dummy variable for funded countries with at least 25% pension assets-to-GDP in 2002 and a crisis dummy for the 2008-2011 period for countries which were hit by the financial crisis. PA, GDP, stocks-to-GDP and the inverse age dependency ratio are all in growth(log). *, ** and *** denote significance at 95%, 99% and 99.9% respectively.
We perform three different robustness tests. First, we add a higher restriction to outliers and Winsorize
at 2.5% instead of 1% which caps nominal GDP growth between -4.7% and 16.4% and PA-to-GDP
growth between -23% and 60%. Second, we trim the 1% outliers instead of Winsorizing. Both methods
result in higher coefficients of our PA-to-GDP variable but also result in a lower significance. None the
less, results always stay significant no less than the 95% confidence interval and on average we find that
a 10% increase in PA-to-GDP results to a 0.25-0.47 percentage point increase in nominal growth.
Regression results of these robustness tests can be found in Table II. Third, we look at country outliers
in our 2nd and 3rd regressions by each time omitting one different country. This is repeat 34 times,
matching our amount of OECD countries. Excluding either Estonia, Luxembourg or Mexico (non-funded
countries) in our original regressions of Table I again slightly drops the significance of our PA-to-GDP
growth variable but no less than the 99% confidence interval. Excluding Denmark (largest funded
country) from the fixed effects OLS regression makes the interaction term between PA-to-GDP growth

21
and funded countries significant at the 95% confidence level, supplementary to our simple OLS
regression.
To conclude, in our cross-country growth regressions we find a statistically significant and robust effect
of PA-to-GDP growth on economic growth and this effect is approximately 0.24-0.30 percentage point
on GDP growth per 10% PA-to-GDP growth. Our interaction terms between PA-to-GDP growth and
funded is positive and hints towards a larger effect of PA-to-GDP growth of the already funded
countries. These relationships are stable; there is no indication that pension funding makes countries
more vulnerable during the financial crisis.

22
Table II : Robustness tests Cross-country growth regressions
Table J: Robustness tests with 2.5% Winsorization and 1% trimming of outliers. Dependent variable: GDP growth in local currency
and current prices. For a more detailed description we refer to Table 3 in our paper. *, ** and *** denote significance at 95%,
99% and 99.9% respectively.
2.5% Winsorized LSDV OLS OLS fixed effects
(1a) (2a) (3a) (1b) (2b) (3b) (1c) (2c) (3c)
0.453*** 0.438*** 0.424*** 0.624*** 0.610*** 0.608*** 0.299*** 0.286*** 0.274***
(0.077) (0.080) (0.078) (0.053) (0.056) (0.058) (0.055) (0.057) (0.058)
0.040** 0.043** 0.043** 0.039** 0.040** 0.044* 0.041** 0.044** 0.047*
(0.014) (0.014) (0.015) (0.014) (0.014) (0.016) (0.015) (0.015) (0.018)
-0.058 -0.059 -0.067 -0.044 -0.041 -0.055 -0.061 -0.062 -0.069
(0.037) (0.037) (0.042) (0.045) (0.045) (0.048) (0.039) (0.040) (0.042)
0.591* 0.643* 0.218 0.228 0.595* 0.656*
(0.299) (0.308) (0.173) (0.179) (0.288) (0.266)
0.001 0.001 0.004 0.003 0.001 0.000
(0.004) (0.004) (0.003) (0.003) (0.004) (0.004)
0.007 0.070* 0.044
(0.027) (0.029) (0.023)
-0.022
0.004
0.018
(0.032)
(0.050)
(0.046)
0.028 0.037 0.059
(0.051) (0.057) (0.054)
N 299 299 299 299 299 299 299 299 299
adj. R-sq - - - 0.635 0.636 0.637 0.593 0.598 0.595
1% trimmed LSDV OLS OLS fixed effects
(1a) (2a) (3a) (1b) (2b) (3b) (1c) (2c) (3c)
0.409*** 0.392*** 0.367*** 0.594*** 0.582*** 0.584*** 0.253*** 0.232** 0.223**
(0.062) (0.063) (0.066) (0.059) (0.062) (0.064) (0.066) (0.066) (0.075)
0.039*** 0.042*** 0.044** 0.025* 0.026* 0.027* 0.025* 0.028** 0.028**
(0.011) (0.011) (0.014) (0.009) (0.010) (0.010) (0.009) (0.009) (0.009)
-0.054 -0.055 -0.065 -0.023 -0.021 -0.042 -0.048 -0.050 -0.062
(0.035) (0.035) (0.037) (0.050) (0.049) (0.056) (0.044) (0.043) (0.047)
0.710 0.806*
0.225 0.228
0.747** 0.809**
(0.391) (0.400)
(0.191) (0.195)
(0.270) (0.263)
-0.000 -0.001
0.004 0.003
-0.001 -0.001
(0.004) (0.004)
(0.003) (0.003)
(0.004) (0.005)
-0.001
0.062*
0.034
(0.039)
(0.030)
(0.024)
-0.041
-0.002
0.002
(0.028)
(0.050)
(0.053)
0.060
0.042
0.059
(0.058)
(0.054)
(0.055)
N 292 292 292 292 292 292 292 292 292
adj. R-sq - - - 0.594 0.596 0.595 0.547 0.555 0.553
23
Table III: structure of pension asset allocations
Pension asset allocation 2001 2011 Rate of return indicator (1) Bills & bonds 44.32% 41.61% Bond indices (2) Cash & Deposits 5.81% 7.01% Cash indices (3) Hedge funds 0.00% 0.29% Average of the 3 indices (4) Land and buildings 3.10% 2.44% Stocks indices (5) Loans 3.39% 2.69% Bond indices (6) Mutual funds 13.30% 24.56% Sum of (7) till (11)
(7) of which: bonds 29.29% 33.26% Bond indices (8) of which: cash 1.87% 1.96% Cash indices (9) of which: land 0.04% 7.02% Average of the 3 indices (10) of which: shares 30.72% 21.29% Stocks indices (11) of which: others 38.08% 36.47% Average of the 3 indices
(12) Other investments 6.10% 4.56% Average of the 3 indices (13) Private equity funds 0.00% 0.78% Average of the 3 indices (14) Shares 21.37% 11.62% Stocks indices (15) Structured products 0.06% 0.74% Average of the 3 indices (16) Unallocated insurance contracts 2.55% 3.69% Average of the 3 indices
Total 100.00% 100.00%
Table IV: variable description, DataStream ESNM codes
Variable Description Source Years
Total pension assets as share of GDP World Bank (IT), BOJ (Japan), OECD(others) 1999-2011
GDP per capita, at current prices and local currency World Bank 1970-2012
1 / Age dependency ratio, old (% of working-age population) World Bank 1970-2012
Stocks traded, total value (% of gdp) World Bank 1970-2012
USGBILL3 Cash returns - US TREASURY BILL RATE - 3 MONTH (EP) Datastream 1972-2012
SWPRATE Cash returns - SW 3 MONTH LIBOR TARGET RATE Datastream 1972-2012
MSWRLDRI Stocks returns - MSCI WORLD U$ - TOT RETURN IND - GROSS Datastream 1970-2012
SPCOMPRI Stocks returns - S&P 500 COMPOSITE - TOT RETURN IND - GROSS Datastream 1989-2012
LHMGAGGMV Bond returns - BARCLAYS GLOBAL AGGREGATE - MARKET VALUE Datastream 1991-2012
IBEURALMV Bond returns - IBOXX EURO OVERALL INDEX ALL MATS. - MARKET VALUE Datastream 1999-2012
JGGIALCMV Bond returns - JPM GBI GLOBAL ALL MATS. (LOC) - MARKET VALUE Datastream 2004-2012
Rate of return on stocks, bonds and short-term cash for the 2001-2011 period. Variable Mean Std.Dev Min Max Obs
USGBILL3 1.95% 1.62% 0.06% 4.70% N = 374
SWPRATE 1.16% 0.97% 0.15% 2.96% N = 374
cash_combi_ret 1.56% 1.19% 0.11% 3.38% N = 374
MSWRLDRI_ret 2.08% 23.16% -51.64% 29.09% N = 374
SPCOMPRI_ret 1.47% 20.65% -46.20% 25.22% N = 374
stock_combi_ret 1.78% 21.83% -48.92% 27.15% N = 374
LHMGAGGMV_ret 10.32% 6.12% -3.12% 18.98% N = 374
IBEURALMV_ret 7.69% 5.22% 0.15% 16.83% N = 374
JGGIALCMV_ret 12.04% 7.41% -4.52% 18.85% N = 272
bonds_combi_ret 10.12% 4.88% -0.91% 18.04% N = 374
BSC 4.48% 7.30% -12.01% 14.48% N = 374

Publisher:
CPB Netherlands Bureau for Economic Policy AnalysisP.O. Box 80510 | 2508 GM The Haguet (070) 3383 380
July 2014 | ISBN 978-90-5833-648-4