Embed Size (px)
DESCRIPTION
Economic growth. Olduvai stone chopping tool, 1.8 – 2 million years BP. Actual and potential output. Economic growth: Studies growth of potential output. Congressional Budget Office, Sept 2012, cbo.gov. Agenda. Introductory background Essential aspects of economic growth - PowerPoint PPT Presentation
Citation preview

1
Economic growth
Olduvai stone chopping tool, 1.8 – 2 million years BP

2
Congressional Budget Office, Sept 2012, cbo.gov.
Actual and potential output
16,000
14,000
12,000
10,000
8,000
6,000
1980 1985 1990 1995 2000 2005 2010 2015 2020
Potential GDP
Actual GDP
Billions of 2005$
Economic growth:
Studies growth of potential output

3
Agenda• Introductory background • Essential aspects of economic growth • Aggregate production functions • Neoclassical growth model• Simulation of increased saving experiment • Then in the last week: deficits, debt, and
economic growth

4
Historical Trends in Economic Growth in the US since 1800
1. Strong growth in Y
2. Strong growth in productivity (both Y/L and TFP)
3. Steady “capital deepening” (increase in K/L)
4. Strong growth in real wages since early 19th C; g(w/p) ~
g(X/L)
5. Real interest rate and profit rate basically trendless

Notes on the readings
Chapters 4 and 5 are core and consensus economicsChapter 6 is controversial and one point of view.
5

Capital deepening in agriculture
6
Food for Commons
Morocco, 2002

Mining in rich and poor countries
Canada
7
D.R. Congo

8
Review of aggregate production functionYt = At F(Kt, Lt)
Kt = capital services (like rentals as apartment-years)
Lt = labor services (hours worked)
At = level of technology
gx = growth rate of x = (1/xt) dxt/dt = Δ xt/xt-1 = d[ln(xt))]/dt
gA = growth of technology = rate of technological change = Δ At/At-1
Constant returns to scale: λYt = At F(λKt, λLt), or all inputs increased by λ means output increased by λ
Perfect competition in factor and product markets (for p = 1):MPK = ∂Y/∂K = R = rental price of capital; ∂Y/∂L = w = wage rate
Exhaustion of product with CRTS:MPK x K + MPL x L = RK + wL = Y
Alternative measures of productivity:Labor productivity = Yt/Lt
Total factor productivity (TFP) = At = Yt /F(Kt, Lt)

9
Review: Cobb-Douglas aggregate production function
Remember Cobb-Douglas production function:
Yt = At Kt α Lt
1-α
or ln(Yt)= ln(At) + α ln(Kt) +(1-α) ln(Lt)
Here α = ∂ln(Yt)/∂ln(Kt) = elasticity of output w.r.t. capital; (1-α ) = elasticity of output w.r.t. labor
MPK = Rt = α At Kt α-1 Lt
1-α = α Yt/Kt
Share of capital in national income = Rt Kt /Yt = α = constant. Ditto for share of labor.

The MIT School of Economics
10
Paul Samuelson (1915-2009)
Robert Solow (1924 - )

11
Basic neoclassical growth modelMajor assumptions:1. Basic setup:
- full employment- flexible wages and prices- perfect competition- closed economy
2. Capital accumulation: ΔK = sY – δK; s = investment rate = constant3. Labor supply: Δ L/L = n = exogenous 4. Production function
- constant returns to scale- two factors (K, L)- single output used for both C and I: Y = C + I- no technological change to begin with- in next model, labor-augmenting technological change
5. Change of variable to transform to one-equation model: k = K/L = capital-labor ratio
Y = F(K, L) = LF(K/L,1) y = Y/L = F(K/L,1) = f(k), where f(k) is per capita production
fn.

12
Major variables:Y = output (GDP)L = labor inputsK = capital stock or servicesI = gross investmentw = real wage rater = real rate of return on capital (rate of profit)E = efficiency units = level of labor-augmenting technology (growth of E is
technological change = ΔE/E) L~= efficiency labor inputs = EL = similarly for other variables with
“~”notation)
Further notational conventionsΔ x = dx/dtgx = growth rate of x = (1/x) dx/dt = Δxt/xt-1=dln(xt)/dt s = I/Y = savings and investment ratek = capital-labor ratio = K/Lc = consumption per capita = C/Li = investment per worker = I/Lδ = depreciation rate on capitaly = output per worker = Y/Ln = rate of growth of population (or labor force)
= gL = Δ L/Lv = capital-output ratio = K/Yh = rate of labor-augmenting technological change
13
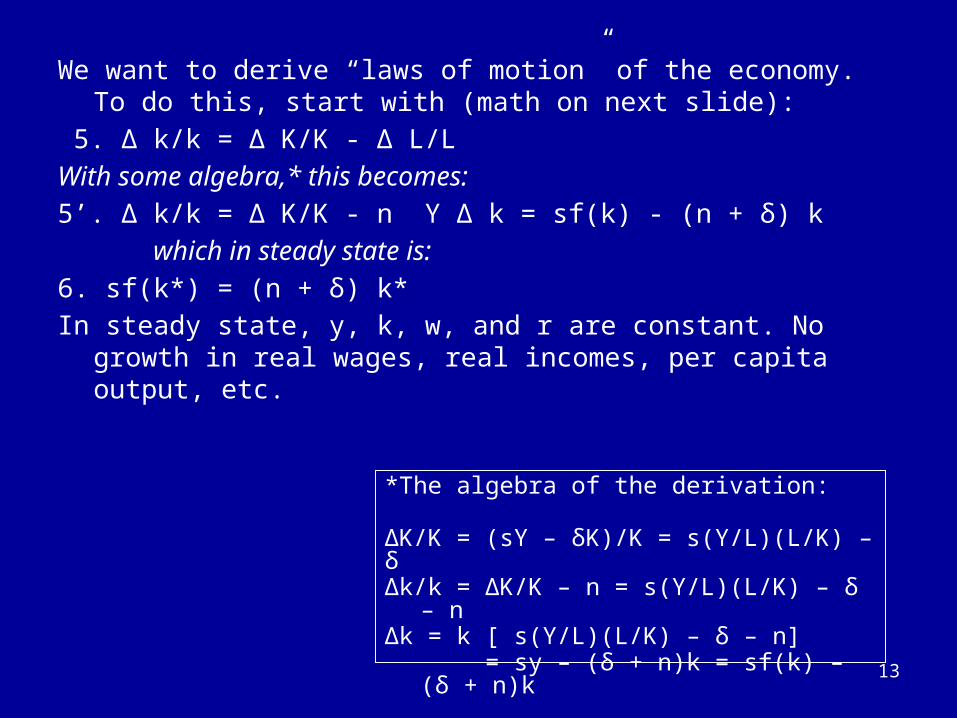
We want to derive “laws of motion” of the economy. To do this, start with (math on next slide):
5. Δ k/k = Δ K/K - Δ L/LWith some algebra,* this becomes:5’. Δ k/k = Δ K/K - n Y Δ k = sf(k) - (n + δ) k which in steady state is:6. sf(k*) = (n + δ) k* In steady state, y, k, w, and r are constant. No growth in real
wages, real incomes, per capita output, etc.
*The algebra of the derivation:
ΔK/K = (sY – δK)/K = s(Y/L)(L/K) – δΔk/k = ΔK/K – n = s(Y/L)(L/K) – δ – nΔk = k [ s(Y/L)(L/K) – δ – n] = sy – (δ + n)k = sf(k) – (δ + n)k

Mathematical noteWe will use the following math fact:
Define z = y/xThen(1) (Growth rate of z) = (growth rate of y) – (growth rate of x)Or gz = gy - gx
Proof:Using logs:ln(zt) = ln(yt )– ln(xt)
Taking time derivative:[dzt/dt]/zt = [dyt/dt]/yt - [dxt/dt]/xt
which is the desired result.
Note that we sometimes use the discrete version of (1), as we did in the last slide. This has a small error that is in the order of the size of the time step or the growth rates. For example, if gy = 5 % and gx = 3 %, then by the formula gz = 2 %, while the exact calculation is that gz = 1.9417 %. This is close enough for expository purposes. 14

15
k
y = Y/L
y = f(k)
(n+δ)k
y*
i* = (I/Y)*
k*
i = sf(k)

16
Predictions of basic model:– “Steady state”– constant y, w, k, and r– gY = n
Uniqueness and stability of equilibrium. – Equilibrium is unique– Equilibrium is stable
(meaning k → k* as t → ∞ for all initial
k0).
Results of neoclassical model without TC
26
k
y = Y/ L
y = f(k)
(n+δ)k
y*
i* = (I/ Y)*
k*
i = sf(k)
But does not have growth predictions of historical record, so need further work (next lecture).

Economic growth (II)
17World fastest supercomputer, 2012 (IBM Sequoia at 16.2 petaflops)

Agenda- Continue analysis of NGM- Discuss problem sets and ground rules - Savings experiment- On Monday, do economics of technological
change and real business cycle model- On Wednesday, pset 1 due at the beginning of
class.
18

Review from last time• Neoclassical growth model: classical + dynamics• Growth involves potential output (not business cycles)• Key assumptions: fixed s, labor growth at n• Law of motion of economy: Δ k/k = sf(k) - (n + δ) k• Unique and stable equilibrium: sf(k*) = (n + δ) k*• Alas, does not capture major trends.• Concluded need to include technological change (TC).
• Economic growth involves:- increase in quantity (number of cars)- improved quality (safer cars)- new goods and services (computer replaces typewriter)
19

20
Growth trend, US, 1948-2008
0.0
0.4
0.8
1.2
1.6
2.0
50 55 60 65 70 75 80 85 90 95 00 05
ln(K)ln(Y)ln(hours)

21
Near-constancy of labor’s share of national income
0%
10%
20%
30%
40%
50%
60%
70%
80%
1929 1939 1949 1959 1969 1979 1989 1999 2009
Share of compensation
Share of wages
Labor share of national income in US
- Slow increase over most of century
- Tiny decline in recent years as profits rose
- Big rise in fringe benefit share (and decline in wage share)

22
What are the contributors to growth? Growth Accounting
Growth accounting is a widely used technique used to separate out the sources of growth in a country; it relies on the neoclassical growth model
DerivationStart with production function and competitive assumptions. For simplicity, assume a Cobb-Douglas production function with technological change:
(1) Yt = At Kt α Lt
1- α
Take logarithms:(2) ln(Yt) = ln(At )+ α ln(Kt) + (1 - α) ln(Lt )
Now take the time derivative. Note that ∂ln(x)/∂x=1/x and use chain rule:(3) ∂ln(Yt)/∂t= g[Yt] = g[At] + α g[Kt] + (1 - α) g[Lt ]
In the C-D production function, α is the competitive share of K, sh(K); and (1 - α) the competitive share of labor, sh(L).(4) g[Yt] = g[At] + sh(K) g[Kt] + (1 – sh(L)) g[Lt ]
From this, we estimate the rate of T.C. as:(5) g[At] = g[Yt] –sh(K) g[Kt] - sh(L) g[Lt ]}

23
Apply to U.S. private non-farm business, 1987-2011
g[Yt] = g[At] + sh(K) g[Kt] + sh(L) g[Lt ]
We have data on everything but g[At].
According to U.S. Bureau of Labor Statistics:g[Yt] = 2.8 % p.y.; sh(K) = ¼; g[Kt] =3.6%; g[Lt ] = 1.1%
So contribution to growth isK: 0.9% per yearL: 0.8 % per yearg[At]: 1.1 % per year
So technology contributes 55% and capital 45% to growth in output per hour.
Source: BLS, multifactor productivity page.

24
Added after class (correct the mistake)
What are the contributions to per capita output growth?
g[Y/L] = g(y) = g[A] + sh(K) g[K] + sh(L) g[L ] –g[L]= g[A] + sh(K) g[K] - sh(K) g[L ] = g[A] + sh(K) (g[K] - g[L ])= g[A] + sh(K) (g[k])
Since g[y] = 1.7 % p.y.; sh(K) = ¼; g[k] =2.5%
So contribution to growth isOf A: 1.1%, or 65% of totalOf k: ¼ x 2.5, or 35% of total
This is the very surprising results that technology contributes most of the rise in per capita output over the period. Similar in other countries/periods.

25
Introducing technological changeFirst model omits technological change (TC). What is TC?
• New processes that increase TFP (assembly line, fiber optics)
• Improvements in quality of goods (plasma TV)• New goods and services (automobile, telephone,
iPod)Analytically, TC is
- Shift in production function.
k
y = Y/ L
new f(k)
k*
old f(k)

Technological change in medicine
Scan for lung cancer
26African medicine
man

Disappearance of polio:A benefit of growth that is not captured
in the GDP statistics!

The greatest technological change in history
[flop = floating point operations per second, e.g., 1011011011001001/0010110100010101]
Abacus master, 1945 (.03 flops)
IBM 1620, circa 1960(104 flops)
Sony Laptop, 2010(1010 flops)
IBM Sequoia, top supercomputer, 2012
(16x 1015 flops), 2x 2011 tops

29
Introducing technological change
29
Introducing technological change
We take specific form which is “labor-augmenting technological change” at rate h.
For this, we need new variable called “efficiency labor units” denoted as E
where E = efficiency units of labor and ~ indicates efficiency units.
New production function is then
Note: Redefining labor units in efficiency terms is a specific way of representing TC that makes everything work out easily. Other forms of TC will give slightly different results.
k
y = Y/ L
new f(k)
k*
old f(k)
, ( , )
, / ,1
( ), /
/ ( )
Y F K EL F K L
F K L L F K L
L f k wherek K L
y Y L f k
L = E L
30
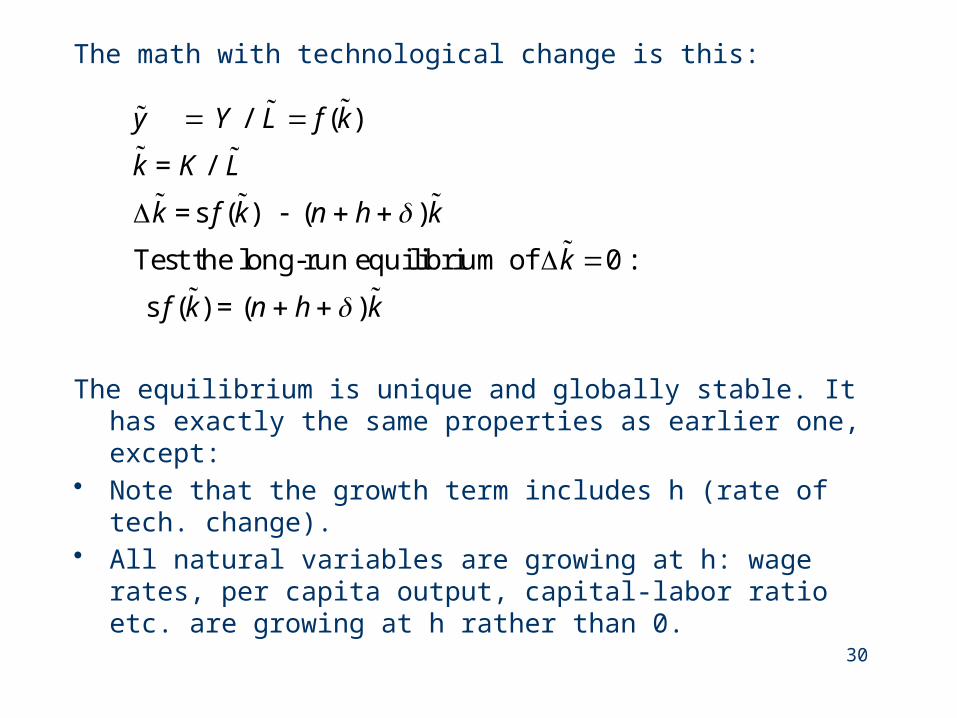
The math with technological change is this:
The equilibrium is unique and globally stable. It has exactly the same properties as earlier one, except:
• Note that the growth term includes h (rate of tech. change).
• All natural variables are growing at h: wage rates, per capita output, capital-labor ratio etc. are growing at h rather than 0.
/ ( )
= /
=s ( ) ( )
Test the long-run equilibrium of 0:
s ( ) = ( )
y Y L f k
k K L
k f k n h k
k
f k n h k

T.C. for the Cobb-Douglas
In C-D case, labor-augmenting TC is very simple:
31
0 0
1
11
Set A 1 for simplicity.
( )
/ ( ) / /
=
htt t t
htt t t t t t tt t
t t t t
Y K e
y Y L K e L K L L
y K L k
E
L
L
32
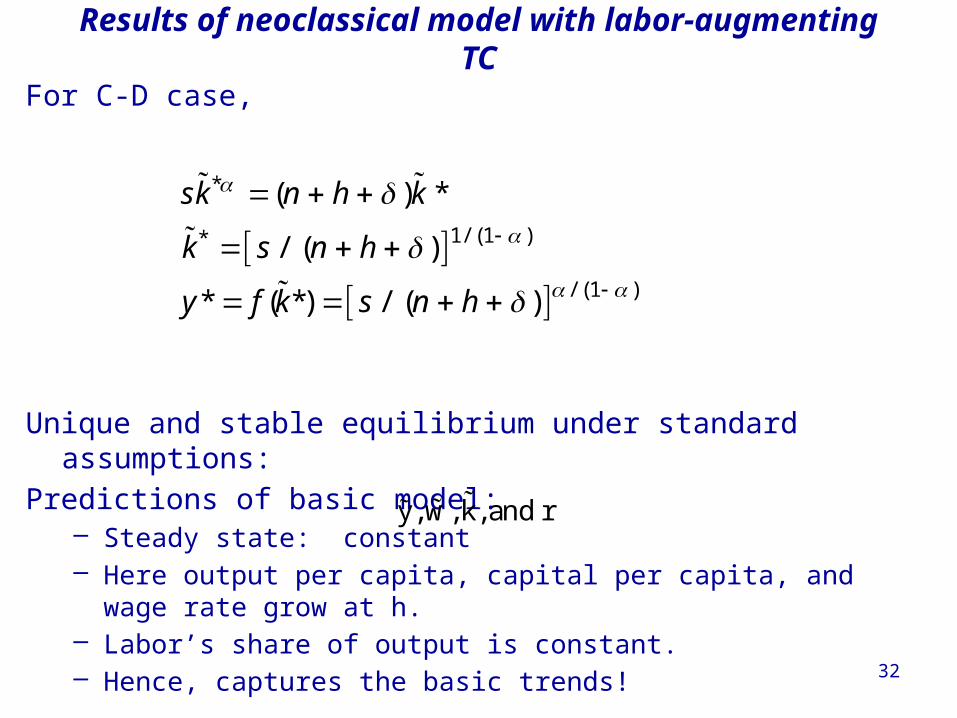
For C-D case,
Unique and stable equilibrium under standard assumptions:
Predictions of basic model:– Steady state: constant – Here output per capita, capital per capita, and wage rate
grow at h.– Labor’s share of output is constant.– Hence, captures the basic trends!
Results of neoclassical model with labor-augmenting TC
*
1/ (1 )*
/ (1 )
( ) *
/ ( )
* ( *) / ( )
sk n h k
k s n h
y f k s n h
y, w, k, and r

3333
i*=I*/Y*
Impact with labor-augmenting TCy Y/L
y* y ( )f k
( )n k
i ( )sf k
k* k=K/ L

34
ln (Y), etc.
time
ln (L) ); gL = n
Time profiles of major variables with TC
ln (K); gK = n+h
ln (Y); gY = n+h
ln( ); LL g n h

35
Sources of TC
Technological change is in some deep sense “endogenous.”The underlying theory will be discussed on Monday.

36
Several “comparative dynamics” experiments
• Change growth in labor force (immigration or retirement policy)
• Change in rate of TC
• Change in national savings and investment rate (tax changes, savings changes, demographic changes)
Here we will investigate only a change in the national savings rate.