Embed Size (px)
Citation preview
Nº 37 - May 2018
Economic GPS
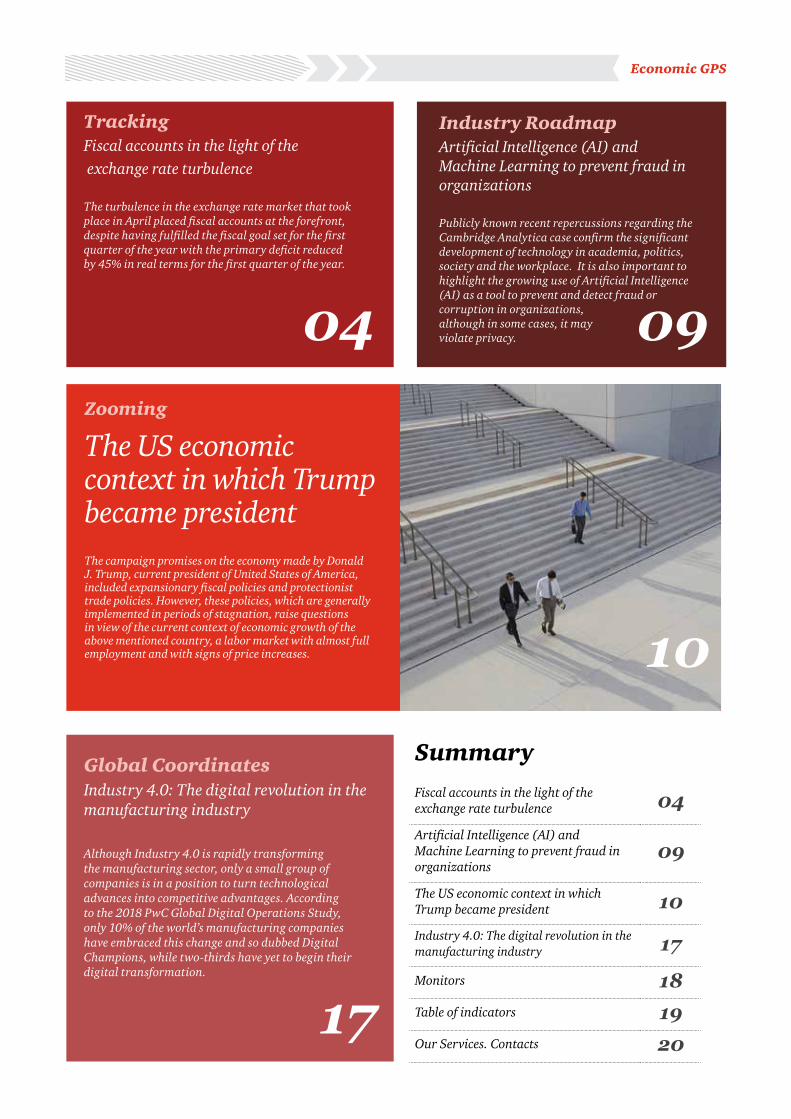
TrackingFiscal accounts in the light of the exchange rate turbulence
ZoomingThe US economic context in which Trump became president
Industry Roadmap Artificial Intelligence (AI) and Machine Learning to prevent fraud in organizations
Global CoordinatesIndustry 4.0: The digital revolution in the manufacturing industry
04
09
10
17
As the protagonist of Murakami’s novel, Aomame at a certain moment climbs down a staircase from an expressway, and walks out of 1984 to enter the alternate reality of 1Q84. It may seem that in recent weeks the same has happened in Argentina. The world has changed: we are no longer in 2018, but instead in 2Q18.
The world has changed indeed, but that much? Not really, but even the slightest breeze can kill someone sick with very low defenses. A series of factors contributed to a credibility crisis and strong pressure on the exchange rate. Firstly, the incipient reversal in international financial flows from higher interest rates in the United States. This translated into a strengthening of the dollar worldwide, meaning, a devaluation of most currencies. Add to this, a
series of internal constraints, such as the adjustment of inflationary targets, the entry into effect of income tax on income from financial transactions, a lower harvest due to drought and the political rumbling regarding pensions and tariffs.
As we have repeatedly pointed out in EGPS, the basic budget for the expansionary adjustment is the existence of financing, and its weak point is the intertemporal solvency of foreign trade. A context of high international liquidity left the possibility to “buy time” to adjust gradually, without a sudden correction of relative prices that (necessarily) implied a strong decline in the level of activity and the destruction of wealth. However, the world has changed, and this change has brought uncertainty regarding the possibility to finance fiscal and trade imbalances, therefore, causing a credibility crisis and a flight of foreign currency that puts pressure on the exchange rate.
Following the initial response which was somewhat chaotic in nature, the government introduced strong measures to stabilize the exchange market: which included oversight of fiscal targets and reduction of the GDP target from 3.2% to 2.7%; increase interest rates to 40%; announcement of negotiations to obtain financing from the IMF; reduction of permitted limits allowed for financial entities to maintain foreign currency assets and flexibility of liquidity requirements. This led to the stabilization of the exchange rate at around 25 pesos per dollar.
However, in the current environment, the measures taken were necessary, but are they enough? If the term cannot be extended and the cost of the remunerated liabilities of the BCRA cannot be reduced, sooner or later the pressure on the exchange rate will continue, with the risk of an inflationary spiral. We are optimistic that the Central Bank seems to be aware of this risk, and has announced a plan to swap short-term LEBACS for long-term ones. It remains to be known if this measure will be enough, or more concrete and drastic actions will be needed.
So far, there are two moons over Buenos Aires. Like Aomame, while we are in 2Q18, we must go to great lengths to avoid running greater risks.
José María SeguraEconomista Jefe de PwC Argentina
2Q18
Summary
Fiscal accounts in the light of the exchange rate turbulence 04Artificial Intelligence (AI) and Machine Learning to prevent fraud in organizations
09
The US economic context in which Trump became president 10Industry 4.0: The digital revolution in the manufacturing industry 17
Monitors 18Table of indicators 19Our Services. Contacts 20
TrackingFiscal accounts in the light of the exchange rate turbulence
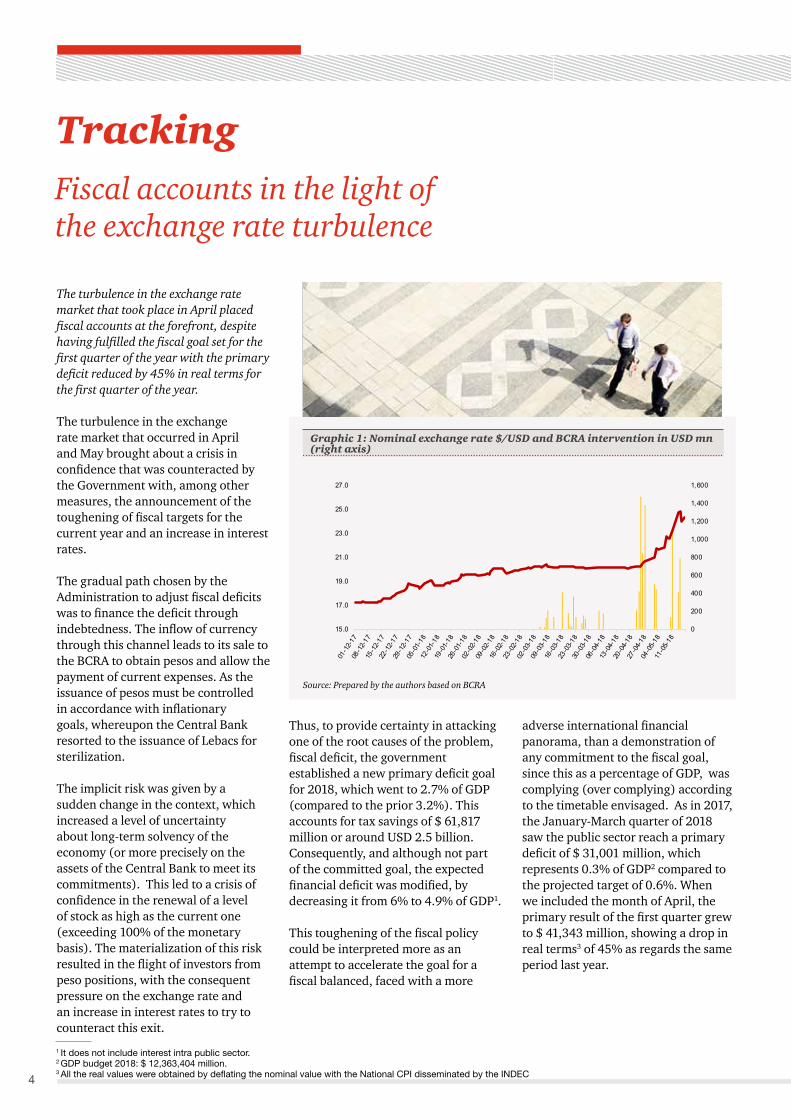
The turbulence in the exchange rate market that took place in April placed fiscal accounts at the forefront, despite having fulfilled the fiscal goal set for the first quarter of the year with the primary deficit reduced by 45% in real terms for the first quarter of the year.
Zooming
The US economic context in which Trump became presidentThe campaign promises on the economy made by Donald J. Trump, current president of United States of America, included expansionary fiscal policies and protectionist trade policies. However, these policies, which are generally implemented in periods of stagnation, raise questions in view of the current context of economic growth of the above mentioned country, a labor market with almost full employment and with signs of price increases.
Industry Roadmap Artificial Intelligence (AI) and Machine Learning to prevent fraud in organizations
Publicly known recent repercussions regarding the Cambridge Analytica case confirm the significant development of technology in academia, politics, society and the workplace. It is also important to highlight the growing use of Artificial Intelligence (AI) as a tool to prevent and detect fraud or corruption in organizations, although in some cases, it may violate privacy.
Global CoordinatesIndustry 4.0: The digital revolution in the manufacturing industry Although Industry 4.0 is rapidly transforming the manufacturing sector, only a small group of companies is in a position to turn technological advances into competitive advantages. According to the 2018 PwC Global Digital Operations Study, only 10% of the world’s manufacturing companies have embraced this change and so dubbed Digital Champions, while two-thirds have yet to begin their digital transformation.
04 09
Economic GPS
17
10
4
Tracking
The turbulence in the exchange rate market that took place in April placed fiscal accounts at the forefront, despite having fulfilled the fiscal goal set for the first quarter of the year with the primary deficit reduced by 45% in real terms for the first quarter of the year.
The turbulence in the exchange rate market that occurred in April and May brought about a crisis in confidence that was counteracted by the Government with, among other measures, the announcement of the toughening of fiscal targets for the current year and an increase in interest rates.
The gradual path chosen by the Administration to adjust fiscal deficits was to finance the deficit through indebtedness. The inflow of currency through this channel leads to its sale to the BCRA to obtain pesos and allow the payment of current expenses. As the issuance of pesos must be controlled in accordance with inflationary goals, whereupon the Central Bank resorted to the issuance of Lebacs for sterilization.
The implicit risk was given by a sudden change in the context, which increased a level of uncertainty about long-term solvency of the economy (or more precisely on the assets of the Central Bank to meet its commitments). This led to a crisis of confidence in the renewal of a level of stock as high as the current one (exceeding 100% of the monetary basis). The materialization of this risk resulted in the flight of investors from peso positions, with the consequent pressure on the exchange rate and an increase in interest rates to try to counteract this exit.
1 It does not include interest intra public sector.2 GDP budget 2018: $ 12,363,404 million.3 All the real values were obtained by deflating the nominal value with the National CPI disseminated by the INDEC
Fiscal accounts in the light of the exchange rate turbulence
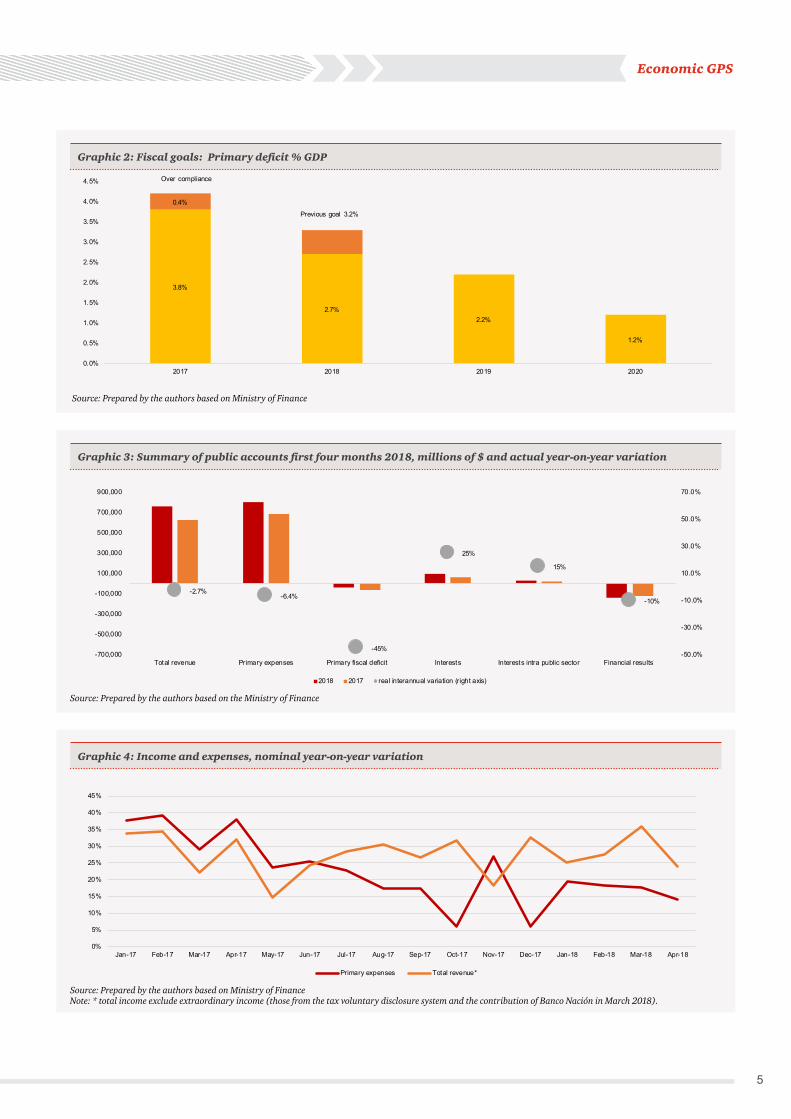
Thus, to provide certainty in attacking one of the root causes of the problem, fiscal deficit, the government established a new primary deficit goal for 2018, which went to 2.7% of GDP (compared to the prior 3.2%). This accounts for tax savings of $ 61,817 million or around USD 2.5 billion. Consequently, and although not part of the committed goal, the expected financial deficit was modified, by decreasing it from 6% to 4.9% of GDP1.
This toughening of the fiscal policy could be interpreted more as an attempt to accelerate the goal for a fiscal balanced, faced with a more
adverse international financial panorama, than a demonstration of any commitment to the fiscal goal, since this as a percentage of GDP, was complying (over complying) according to the timetable envisaged. As in 2017, the January-March quarter of 2018 saw the public sector reach a primary deficit of $ 31,001 million, which represents 0.3% of GDP2 compared to the projected target of 0.6%. When we included the month of April, the primary result of the first quarter grew to $ 41,343 million, showing a drop in real terms3 of 45% as regards the same period last year.
Source: Prepared by the authors based on BCRA
Graphic 1: Nominal exchange rate $/USD and BCRA intervention in USD mn (right axis)
0
200
400
600
800
1,000
1,200
1,400
1,600
15.0
17.0
19.0
21.0
23.0
25.0
27.0
Economic GPS
5
Source: Prepared by the authors based on Ministry of Finance
Graphic 2: Fiscal goals: Primary deficit % GDP
Source: Prepared by the authors based on the Ministry of Finance
Graphic 3: Summary of public accounts first four months 2018, millions of $ and actual year-on-year variation
Source: Prepared by the authors based on Ministry of FinanceNote: * total income exclude extraordinary income (those from the tax voluntary disclosure system and the contribution of Banco Nación in March 2018).
Graphic 4: Income and expenses, nominal year-on-year variation
-2.7%-6.4%
-45%
25%
15%
-10%
-50.0%
-30.0%
-10.0%
10.0%
30.0%
50.0%
70.0%
-700,000
-500,000
-300,000
-100,000
100,000
300,000
500,000
700,000
900,000
Total revenue Primary expenses Primary fiscal deficit Interests Interests intra public sector Financial results*
2018 2017 real interannual variation (right axis)
3.8%
2.7%
0.4%
2.2%
1.2%
0.0%
0.5%
1.0%
1.5%
2.0%
2.5%
3.0%
3.5%
4.0%
4.5%
2017 2018 2019 2020
Previous goal 3.2%
Over compliance
0%
5%
10%
15%
20%
25%
30%
35%
40%
45%
Jan-17 Feb-17 Mar-17 Apr-17 May-17 Jun-17 Jul-17 Aug-17 Sep-17 Oct-17 Nov-17 Dec-17 Jan-18 Feb-18 Mar-18 Apr-18
Primary expenses Total revenue*
6
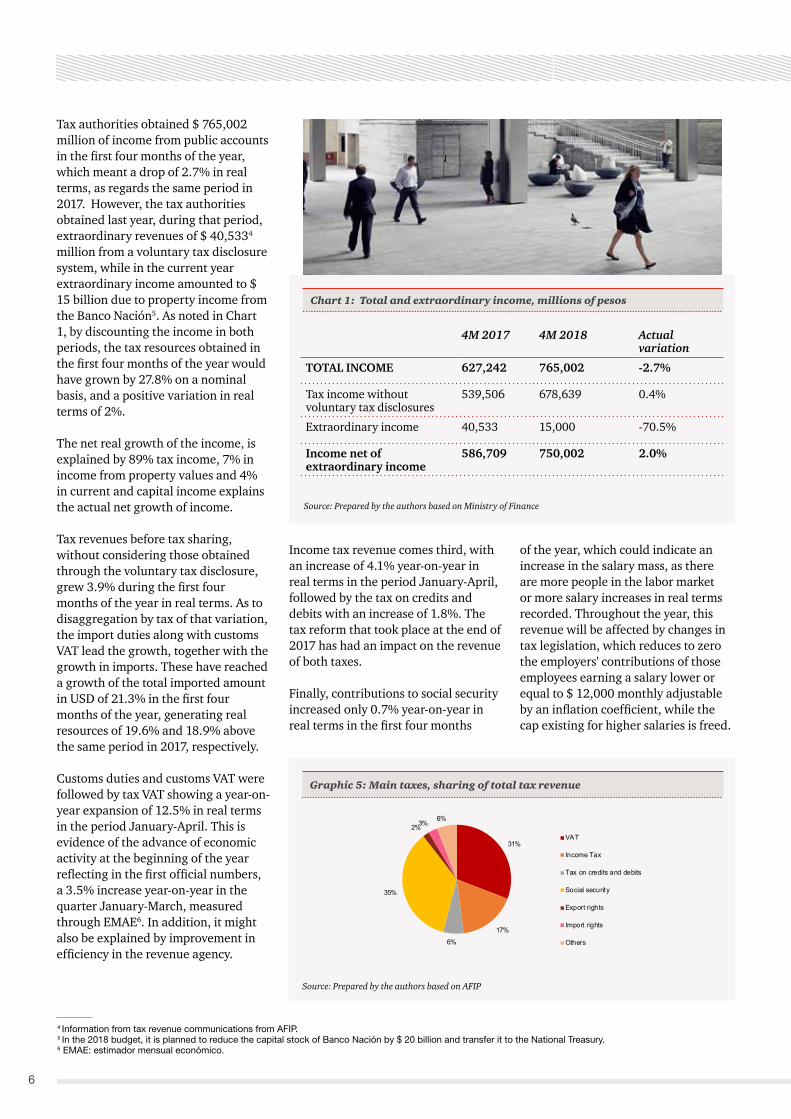
Tax authorities obtained $ 765,002 million of income from public accounts in the first four months of the year, which meant a drop of 2.7% in real terms, as regards the same period in 2017. However, the tax authorities obtained last year, during that period, extraordinary revenues of $ 40,5334 million from a voluntary tax disclosure system, while in the current year extraordinary income amounted to $ 15 billion due to property income from the Banco Nación5. As noted in Chart 1, by discounting the income in both periods, the tax resources obtained in the first four months of the year would have grown by 27.8% on a nominal basis, and a positive variation in real terms of 2%.
The net real growth of the income, is explained by 89% tax income, 7% in income from property values and 4% in current and capital income explains the actual net growth of income.
Tax revenues before tax sharing, without considering those obtained through the voluntary tax disclosure, grew 3.9% during the first four months of the year in real terms. As to disaggregation by tax of that variation, the import duties along with customs VAT lead the growth, together with the growth in imports. These have reached a growth of the total imported amount in USD of 21.3% in the first four months of the year, generating real resources of 19.6% and 18.9% above the same period in 2017, respectively.
Customs duties and customs VAT were followed by tax VAT showing a year-on-year expansion of 12.5% in real terms in the period January-April. This is evidence of the advance of economic activity at the beginning of the year reflecting in the first official numbers, a 3.5% increase year-on-year in the quarter January-March, measured through EMAE6. In addition, it might also be explained by improvement in efficiency in the revenue agency.
Chart 1: Total and extraordinary income, millions of pesos
Income tax revenue comes third, with an increase of 4.1% year-on-year in real terms in the period January-April, followed by the tax on credits and debits with an increase of 1.8%. The tax reform that took place at the end of 2017 has had an impact on the revenue of both taxes.
Finally, contributions to social security increased only 0.7% year-on-year in real terms in the first four months
of the year, which could indicate an increase in the salary mass, as there are more people in the labor market or more salary increases in real terms recorded. Throughout the year, this revenue will be affected by changes in tax legislation, which reduces to zero the employers' contributions of those employees earning a salary lower or equal to $ 12,000 monthly adjustable by an inflation coefficient, while the cap existing for higher salaries is freed.
Source: Prepared by the authors based on Ministry of Finance
4 Information from tax revenue communications from AFIP.5 In the 2018 budget, it is planned to reduce the capital stock of Banco Nación by $ 20 billion and transfer it to the National Treasury.6 EMAE: estimador mensual económico.
4M 2017 4M 2018 Actual variation
TOTAL INCOME 627,242 765,002 -2.7%
Tax income without voluntary tax disclosures
539,506 678,639 0.4%
Extraordinary income 40,533 15,000 -70.5%
Income net of extraordinary income
586,709 750,002 2.0%
Source: Prepared by the authors based on AFIP
Graphic 5: Main taxes, sharing of total tax revenue
31%
17%
6%
35%
2%3%6%
VAT
Income Tax
Tax on credits and debits
Social security
Export rights
Import rights
Others
Economic GPS
7
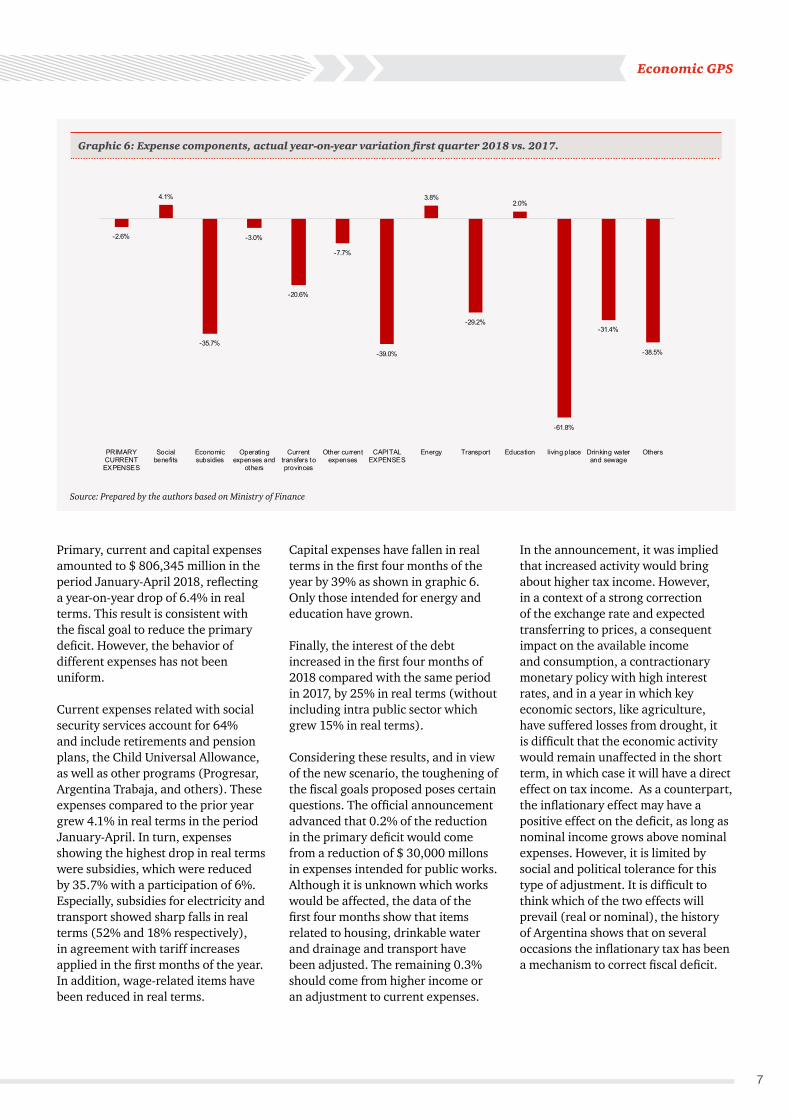
Primary, current and capital expenses amounted to $ 806,345 million in the period January-April 2018, reflecting a year-on-year drop of 6.4% in real terms. This result is consistent with the fiscal goal to reduce the primary deficit. However, the behavior of different expenses has not been uniform.
Current expenses related with social security services account for 64% and include retirements and pension plans, the Child Universal Allowance, as well as other programs (Progresar, Argentina Trabaja, and others). These expenses compared to the prior year grew 4.1% in real terms in the period January-April. In turn, expenses showing the highest drop in real terms were subsidies, which were reduced by 35.7% with a participation of 6%. Especially, subsidies for electricity and transport showed sharp falls in real terms (52% and 18% respectively), in agreement with tariff increases applied in the first months of the year. In addition, wage-related items have been reduced in real terms.
Source: Prepared by the authors based on Ministry of Finance
Graphic 6: Expense components, actual year-on-year variation first quarter 2018 vs. 2017.
Capital expenses have fallen in real terms in the first four months of the year by 39% as shown in graphic 6. Only those intended for energy and education have grown.
Finally, the interest of the debt increased in the first four months of 2018 compared with the same period in 2017, by 25% in real terms (without including intra public sector which grew 15% in real terms).
Considering these results, and in view of the new scenario, the toughening of the fiscal goals proposed poses certain questions. The official announcement advanced that 0.2% of the reduction in the primary deficit would come from a reduction of $ 30,000 millons in expenses intended for public works. Although it is unknown which works would be affected, the data of the first four months show that items related to housing, drinkable water and drainage and transport have been adjusted. The remaining 0.3% should come from higher income or an adjustment to current expenses.
In the announcement, it was implied that increased activity would bring about higher tax income. However, in a context of a strong correction of the exchange rate and expected transferring to prices, a consequent impact on the available income and consumption, a contractionary monetary policy with high interest rates, and in a year in which key economic sectors, like agriculture, have suffered losses from drought, it is difficult that the economic activity would remain unaffected in the short term, in which case it will have a direct effect on tax income. As a counterpart, the inflationary effect may have a positive effect on the deficit, as long as nominal income grows above nominal expenses. However, it is limited by social and political tolerance for this type of adjustment. It is difficult to think which of the two effects will prevail (real or nominal), the history of Argentina shows that on several occasions the inflationary tax has been a mechanism to correct fiscal deficit.
-2.6%
4.1%
-35.7%
-3.0%
-20.6%
-7.7%
-39.0%
3.8%
-29.2%
2.0%
-61.8%
-31.4%
-38.5%
PRIMARYCURRENTEXPENSES
Socialbenefits
Economicsubsidies
Operatingexpenses and
others
Currenttransfers toprovinces
Other currentexpenses
CAPITALEXPENSES
Energy Transport Education living place Drinking waterand sewage
Others
8
Looking ahead in the medium term, the limit of this type of adjustment mechanism to fiscal deficit should be monitored. In other words, nearly 60% of expenses (retirements and pensions are adjusted for inflation on an annual basis with a rule mainly fixed according to the reform of last December) will remain in real terms or grow at a real positive rate, while income from social security contributions have been growing in a very limited manner (0.7%). Considering this unbalance, the possibility of implementing a policy to encourage the formalization of the labor market -already in the agenda of this government administration- is important. If an agreement is reached in Congress and approved, workers currently not making any contributions would be added to the formal labor market and would allow reducing the burden on the rest of the tax resources to solve the social security system.
To sum up, the adjustment schedule of the tax policy confronting the government was being fulfilled as expected. However, recent events of April and May led to a new scenario and the government had to choose to accelerate the fiscal adjustment, partly as a mechanism to show greater commitment to financial markets and the IMF and to maintain the possibility of financing without resorting to a higher immediate adjustment.
Economic GPS
Industry Roadmap
By Andrés Sarcuno, Principal, Forensic Services, PwC Argentina.
Artificial Intelligence (AI) and Machine Learning to prevent fraud in organizations.
9
Publicly known recent repercussions regarding the Cambridge Analytica case confirm the significant development of technology in academia, politics, society and the workplace. It is also important to highlight the growing use of Artificial Intelligence (AI) as a tool to prevent and detect fraud or corruption in organizations, although in some cases, it may violate privacy.
In recent years, especially after the Law on Corporate Criminal Liability came into force, there has been an increasing need to build integrity, anti-fraud and/or anti-corruption programs, as well as create compliance and internal research teams, with the purpose of establishing specific policies and procedures, and implementing technology that help organizations tackle the threat of fraud. Our last economic crime survey indicated that 23% of organizations are currently using AI, and 35% are planning to implement it within the short and medium term.
In general, the central focus of any research, prevention and detection activity is to find evidence, patterns or behaviors that help us identify unethical or unlawful acts. In that process, the role of the researcher is crucial, where he or she demonstrates the ability to analyze different sources of information, develop lateral thinking skills to connect dots that do not relate to each other a priori and formulate hypotheses of how the crime could have occurred, subsequently test them, and eventually, prove the facts. However, nowadays, the researcher is not working alone anymore in this daunting task. Thanks to the advance of technology over the past few years, and the emergence of a great variety of structured and non-structured data in constant generation, the most innovative organizations have put into practice predictive models that support the work of the team who is responsible for promoting ethics and transparency. Therefore, internal auditors, fraud investigators, data scientists, ethics and compliance officials, information security and systems leaders, operations and sales managers, CFOs, and even the CEOs, have been encouraged to embark on this task too. To what end? To start constructing potential threat scenarios to which the organization might be
exposed and find out what data will be necessary to gather to create a model that predicts when they will face such threats. Over time, and thanks to the records of those allegedly suspicious activities, organizations have been able to apply machine learning and artificial intelligence to classify every new transaction and predict if they were fraudulent or not. A number of companies that a few years ago trusted that advanced analytics was going to allow them to strengthen their anti-fraud programs began recording and storing certain relevant data. At present, these companies are applying a predictive model. The key is in the track record of transactions (or alerts) that were investigated and classified as fraudulent or non-fraudulent.
Therefore, organizations that are concerned about corruption and fraud, and which are implementing an integrity program, need to include the application of artificial intelligence and machine learning in their agenda, to fight the scourge of fraud and anticipate the current and future threats worldwide.
10
ZoomingThe US economic context in which Trump became president
10
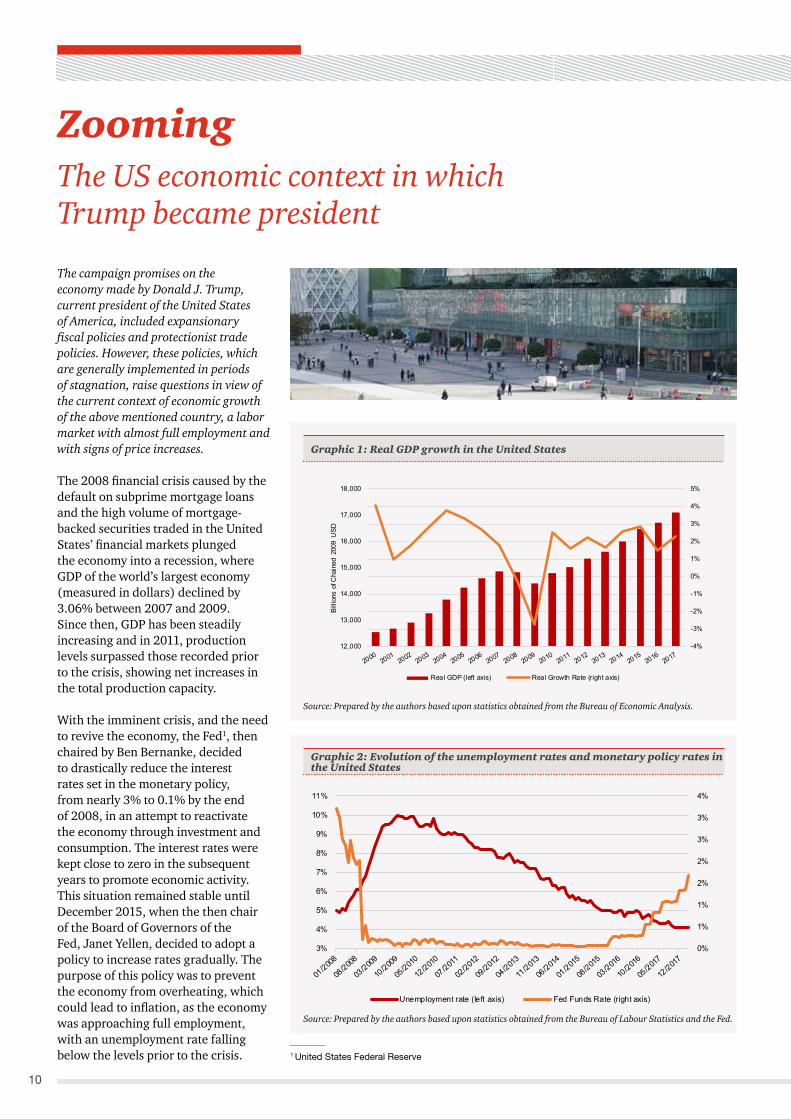
The campaign promises on the economy made by Donald J. Trump, current president of the United States of America, included expansionary fiscal policies and protectionist trade policies. However, these policies, which are generally implemented in periods of stagnation, raise questions in view of the current context of economic growth of the above mentioned country, a labor market with almost full employment and with signs of price increases.
The 2008 financial crisis caused by the default on subprime mortgage loans and the high volume of mortgage-backed securities traded in the United States’ financial markets plunged the economy into a recession, where GDP of the world’s largest economy (measured in dollars) declined by 3.06% between 2007 and 2009. Since then, GDP has been steadily increasing and in 2011, production levels surpassed those recorded prior to the crisis, showing net increases in the total production capacity.
With the imminent crisis, and the need to revive the economy, the Fed1, then chaired by Ben Bernanke, decided to drastically reduce the interest rates set in the monetary policy, from nearly 3% to 0.1% by the end of 2008, in an attempt to reactivate the economy through investment and consumption. The interest rates were kept close to zero in the subsequent years to promote economic activity. This situation remained stable until December 2015, when the then chair of the Board of Governors of the Fed, Janet Yellen, decided to adopt a policy to increase rates gradually. The purpose of this policy was to prevent the economy from overheating, which could lead to inflation, as the economy was approaching full employment, with an unemployment rate falling below the levels prior to the crisis.
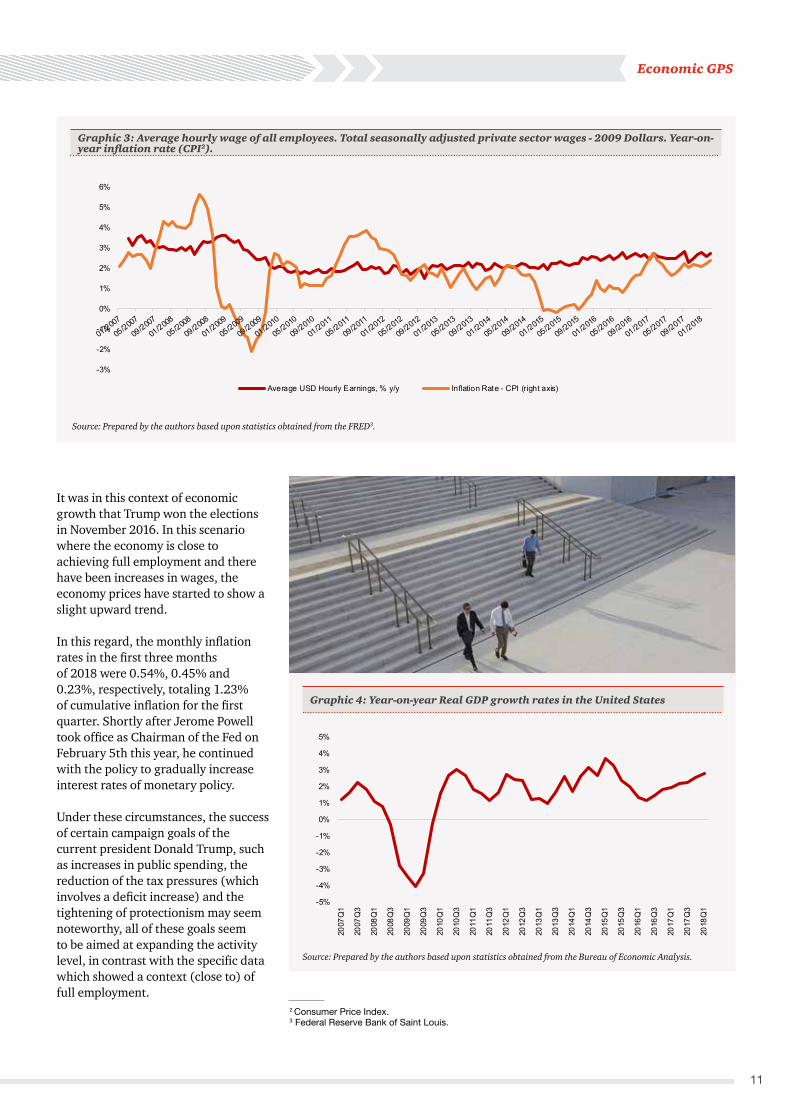
Source: Prepared by the authors based upon statistics obtained from the Bureau of Economic Analysis.
Source: Prepared by the authors based upon statistics obtained from the Bureau of Labour Statistics and the Fed.
Graphic 1: Real GDP growth in the United States
Graphic 2: Evolution of the unemployment rates and monetary policy rates in the United States
1 United States Federal Reserve
0%
1%
1%
2%
2%
3%
3%
4%
3%
4%
5%
6%
7%
8%
9%
10%
11%
Unemployment rate (left axis) Fed Funds Rate (right axis)
-4%
-3%
-2%
-1%
0%
1%
2%
3%
4%
5%
12,000
13,000
14,000
15,000
16,000
17,000
18,000
Billi
ons
of C
hain
ed 2
009
USD
Real GDP (left axis) Real Growth Rate (right axis)
Economic GPS
11
It was in this context of economic growth that Trump won the elections in November 2016. In this scenario where the economy is close to achieving full employment and there have been increases in wages, the economy prices have started to show a slight upward trend.
In this regard, the monthly inflation rates in the first three months of 2018 were 0.54%, 0.45% and 0.23%, respectively, totaling 1.23% of cumulative inflation for the first quarter. Shortly after Jerome Powell took office as Chairman of the Fed on February 5th this year, he continued with the policy to gradually increase interest rates of monetary policy.
Under these circumstances, the success of certain campaign goals of the current president Donald Trump, such as increases in public spending, the reduction of the tax pressures (which involves a deficit increase) and the tightening of protectionism may seem noteworthy, all of these goals seem to be aimed at expanding the activity level, in contrast with the specific data which showed a context (close to) of full employment.
Source: Prepared by the authors based upon statistics obtained from the Bureau of Economic Analysis.
Graphic 4: Year-on-year Real GDP growth rates in the United States
Source: Prepared by the authors based upon statistics obtained from the FRED3.
Graphic 3: Average hourly wage of all employees. Total seasonally adjusted private sector wages - 2009 Dollars. Year-on-year inflation rate (CPI2).
2 Consumer Price Index.3 Federal Reserve Bank of Saint Louis.
-5%
-4%
-3%
-2%
-1%
0%
1%
2%
3%
4%
5%
2007
Q1
2007
Q3
2008
Q1
2008
Q3
2009
Q1
2009
Q3
2010
Q1
2010
Q3
2011
Q1
2011
Q3
2012
Q1
2012
Q3
2013
Q1
2013
Q3
2014
Q1
2014
Q3
2015
Q1
2015
Q3
2016
Q1
2016
Q3
2017
Q1
2017
Q3
2018
Q1
-3%
-2%
-1%
0%
1%
2%
3%
4%
5%
6%
Average USD Hourly Earnings, % y/y Inflation Rate - CPI (right axis)
1212
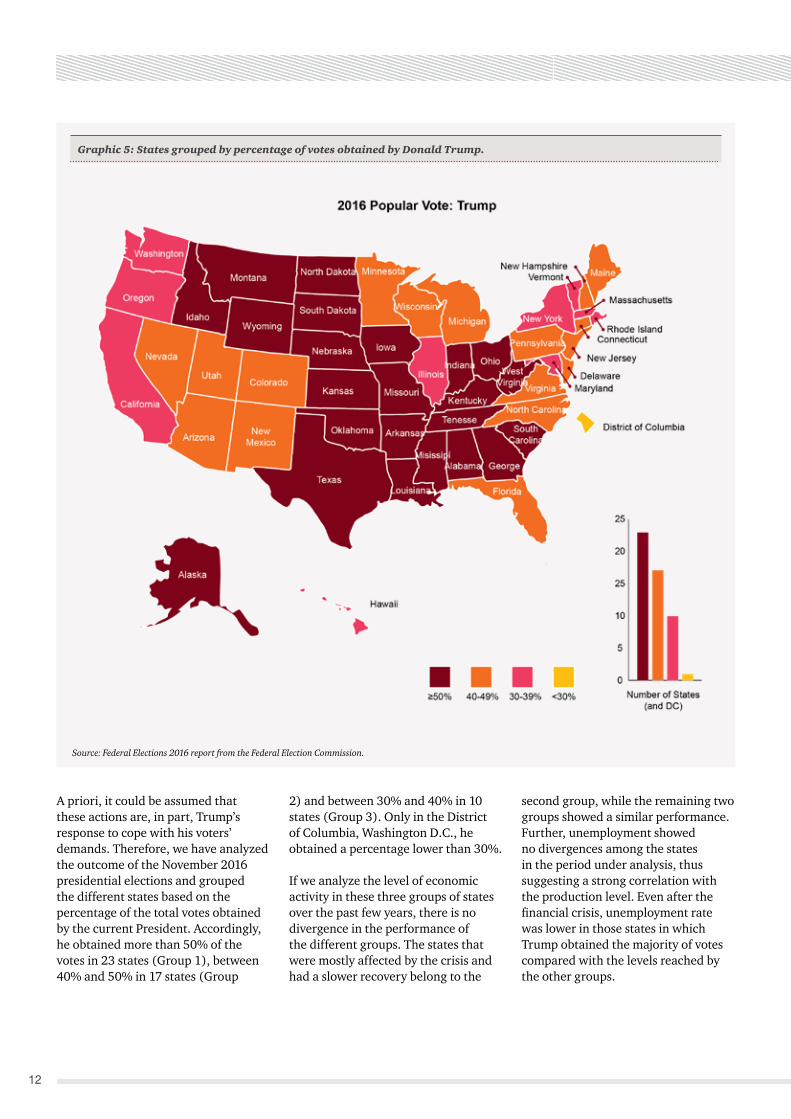
A priori, it could be assumed that these actions are, in part, Trump’s response to cope with his voters’ demands. Therefore, we have analyzed the outcome of the November 2016 presidential elections and grouped the different states based on the percentage of the total votes obtained by the current President. Accordingly, he obtained more than 50% of the votes in 23 states (Group 1), between 40% and 50% in 17 states (Group
Source: Federal Elections 2016 report from the Federal Election Commission.
Graphic 5: States grouped by percentage of votes obtained by Donald Trump.
2) and between 30% and 40% in 10 states (Group 3). Only in the District of Columbia, Washington D.C., he obtained a percentage lower than 30%.
If we analyze the level of economic activity in these three groups of states over the past few years, there is no divergence in the performance of the different groups. The states that were mostly affected by the crisis and had a slower recovery belong to the
second group, while the remaining two groups showed a similar performance. Further, unemployment showed no divergences among the states in the period under analysis, thus suggesting a strong correlation with the production level. Even after the financial crisis, unemployment rate was lower in those states in which Trump obtained the majority of votes compared with the levels reached by the other groups.
Economic GPS
13
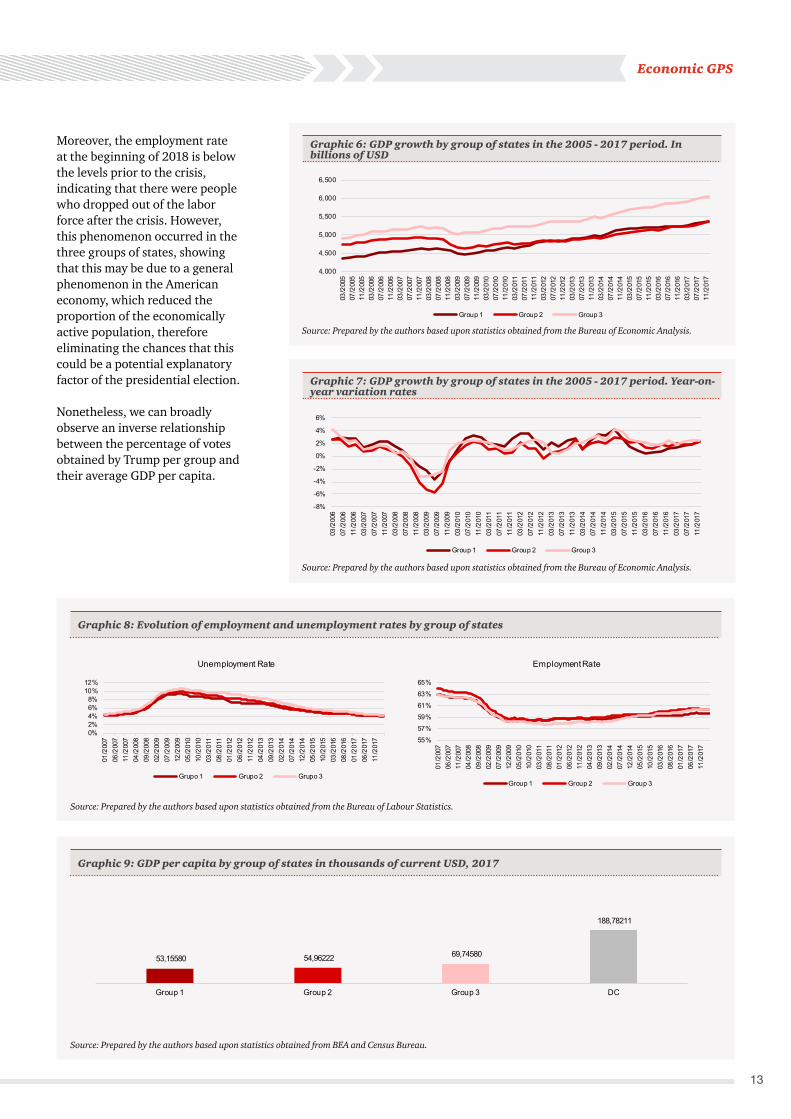
Moreover, the employment rate at the beginning of 2018 is below the levels prior to the crisis, indicating that there were people who dropped out of the labor force after the crisis. However, this phenomenon occurred in the three groups of states, showing that this may be due to a general phenomenon in the American economy, which reduced the proportion of the economically active population, therefore eliminating the chances that this could be a potential explanatory factor of the presidential election.
Nonetheless, we can broadly observe an inverse relationship between the percentage of votes obtained by Trump per group and their average GDP per capita.
Source: Prepared by the authors based upon statistics obtained from the Bureau of Labour Statistics.
Source: Prepared by the authors based upon statistics obtained from BEA and Census Bureau.
Graphic 8: Evolution of employment and unemployment rates by group of states
Graphic 9: GDP per capita by group of states in thousands of current USD, 2017
Source: Prepared by the authors based upon statistics obtained from the Bureau of Economic Analysis.
Source: Prepared by the authors based upon statistics obtained from the Bureau of Economic Analysis.
Graphic 6: GDP growth by group of states in the 2005 - 2017 period. In billions of USD
Graphic 7: GDP growth by group of states in the 2005 - 2017 period. Year-on-year variation rates
53,15580 54,96222 69,74580
188,78211
Group 1 Group 2 Group 3 DC
4,000
4,500
5,000
5,500
6,000
6,500
03/2
005
07/2
005
11/2
005
03/2
006
07/2
006
11/2
006
03/2
007
07/2
007
11/2
007
03/2
008
07/2
008
11/2
008
03/2
009
07/2
009
11/2
009
03/2
010
07/2
010
11/2
010
03/2
011
07/2
011
11/2
011
03/2
012
07/2
012
11/2
012
03/2
013
07/2
013
11/2
013
03/2
014
07/2
014
11/2
014
03/2
015
07/2
015
11/2
015
03/2
016
07/2
016
11/2
016
03/2
017
07/2
017
11/2
017
Group 1 Group 2 Group 3
-8%
-6%
-4%
-2%
0%
2%
4%
6%
03/2
006
07/2
006
11/2
006
03/2
007
07/2
007
11/2
007
03/2
008
07/2
008
11/2
008
03/2
009
07/2
009
11/2
009
03/2
010
07/2
010
11/2
010
03/2
011
07/2
011
11/2
011
03/2
012
07/2
012
11/2
012
03/2
013
07/2
013
11/2
013
03/2
014
07/2
014
11/2
014
03/2
015
07/2
015
11/2
015
03/2
016
07/2
016
11/2
016
03/2
017
07/2
017
11/2
017
Group 1 Group 2 Group 3
0%2%4%6%8%
10%12%
01/2
007
06/2
007
11/2
007
04/2
008
09/2
008
02/2
009
07/2
009
12/2
009
05/2
010
10/2
010
03/2
011
08/2
011
01/2
012
06/2
012
11/2
012
04/2
013
09/2
013
02/2
014
07/2
014
12/2
014
05/2
015
10/2
015
03/2
016
08/2
016
01/2
017
06/2
017
11/2
017
Unemployment Rate
Grupo 1 Grupo 2 Grupo 3
55%57%59%61%63%65%
01/2
007
06/2
007
11/2
007
04/2
008
09/2
008
02/2
009
07/2
009
12/2
009
05/2
010
10/2
010
03/2
011
08/2
011
01/2
012
06/2
012
11/2
012
04/2
013
09/2
013
02/2
014
07/2
014
12/2
014
05/2
015
10/2
015
03/2
016
08/2
016
01/2
017
06/2
017
11/2
017
Employment Rate
Group 1 Group 2 Group 3
1414
Table 1: Share of total production by group of states:
Source: Prepared by the authors based upon statistics obtained from the Bureau of Economic Analysis.
Sector Grup 1 Grup 2 Grup 3 DC Total
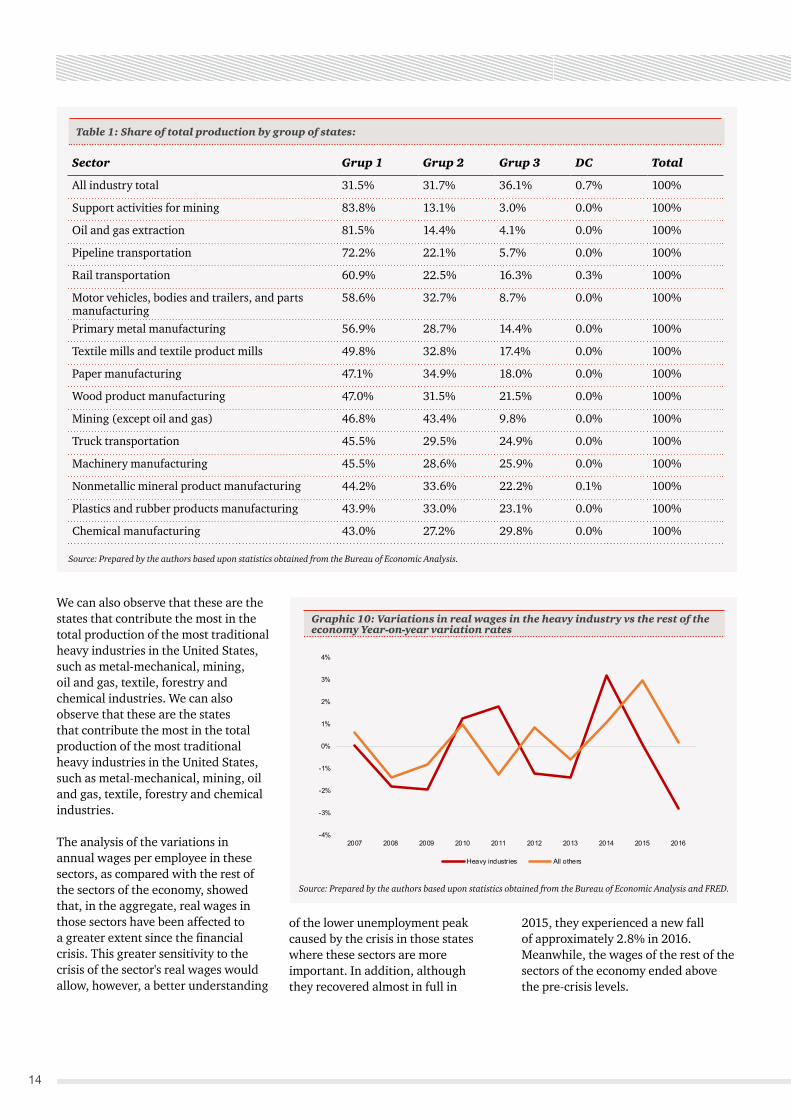
All industry total 31.5% 31.7% 36.1% 0.7% 100%
Support activities for mining 83.8% 13.1% 3.0% 0.0% 100%
Oil and gas extraction 81.5% 14.4% 4.1% 0.0% 100%
Pipeline transportation 72.2% 22.1% 5.7% 0.0% 100%
Rail transportation 60.9% 22.5% 16.3% 0.3% 100%
Motor vehicles, bodies and trailers, and parts manufacturing
58.6% 32.7% 8.7% 0.0% 100%
Primary metal manufacturing 56.9% 28.7% 14.4% 0.0% 100%
Textile mills and textile product mills 49.8% 32.8% 17.4% 0.0% 100%
Paper manufacturing 47.1% 34.9% 18.0% 0.0% 100%
Wood product manufacturing 47.0% 31.5% 21.5% 0.0% 100%
Mining (except oil and gas) 46.8% 43.4% 9.8% 0.0% 100%
Truck transportation 45.5% 29.5% 24.9% 0.0% 100%
Machinery manufacturing 45.5% 28.6% 25.9% 0.0% 100%
Nonmetallic mineral product manufacturing 44.2% 33.6% 22.2% 0.1% 100%
Plastics and rubber products manufacturing 43.9% 33.0% 23.1% 0.0% 100%
Chemical manufacturing 43.0% 27.2% 29.8% 0.0% 100%
We can also observe that these are the states that contribute the most in the total production of the most traditional heavy industries in the United States, such as metal-mechanical, mining, oil and gas, textile, forestry and chemical industries. We can also observe that these are the states that contribute the most in the total production of the most traditional heavy industries in the United States, such as metal-mechanical, mining, oil and gas, textile, forestry and chemical industries.
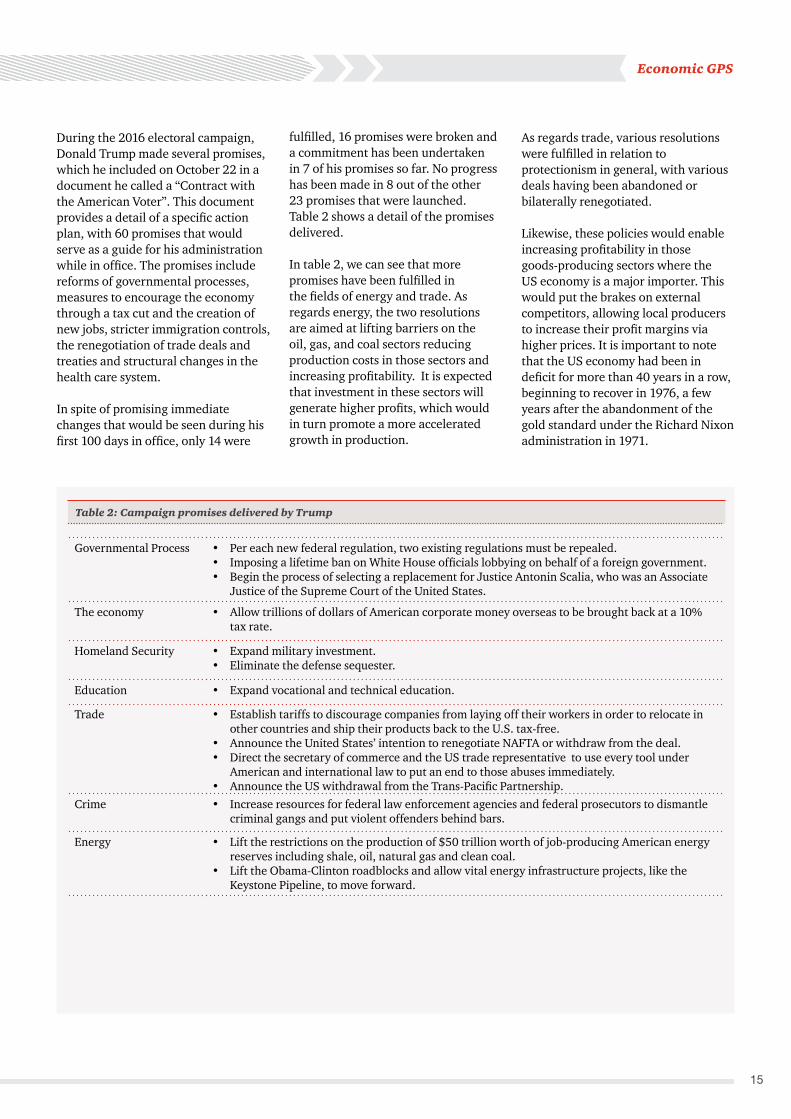
The analysis of the variations in annual wages per employee in these sectors, as compared with the rest of the sectors of the economy, showed that, in the aggregate, real wages in those sectors have been affected to a greater extent since the financial crisis. This greater sensitivity to the crisis of the sector's real wages would allow, however, a better understanding
Source: Prepared by the authors based upon statistics obtained from the Bureau of Economic Analysis and FRED.
Graphic 10: Variations in real wages in the heavy industry vs the rest of the economy Year-on-year variation rates
of the lower unemployment peak caused by the crisis in those states where these sectors are more important. In addition, although they recovered almost in full in
2015, they experienced a new fall of approximately 2.8% in 2016. Meanwhile, the wages of the rest of the sectors of the economy ended above the pre-crisis levels.
-4%
-3%
-2%
-1%
0%
1%
2%
3%
4%
2007 2008 2009 2010 2011 2012 2013 2014 2015 2016
Heavy industries All others
Economic GPS
1415
Table 2: Campaign promises delivered by Trump
Governmental Process • Per each new federal regulation, two existing regulations must be repealed.• Imposing a lifetime ban on White House officials lobbying on behalf of a foreign government.• Begin the process of selecting a replacement for Justice Antonin Scalia, who was an Associate
Justice of the Supreme Court of the United States.
The economy • Allow trillions of dollars of American corporate money overseas to be brought back at a 10% tax rate.
Homeland Security • Expand military investment.• Eliminate the defense sequester.
Education • Expand vocational and technical education.
Trade • Establish tariffs to discourage companies from laying off their workers in order to relocate in other countries and ship their products back to the U.S. tax-free.
• Announce the United States’ intention to renegotiate NAFTA or withdraw from the deal.• Direct the secretary of commerce and the US trade representative to use every tool under
American and international law to put an end to those abuses immediately.• Announce the US withdrawal from the Trans-Pacific Partnership.
Crime • Increase resources for federal law enforcement agencies and federal prosecutors to dismantle criminal gangs and put violent offenders behind bars.
Energy • Lift the restrictions on the production of $50 trillion worth of job-producing American energy reserves including shale, oil, natural gas and clean coal.
• Lift the Obama-Clinton roadblocks and allow vital energy infrastructure projects, like the Keystone Pipeline, to move forward.
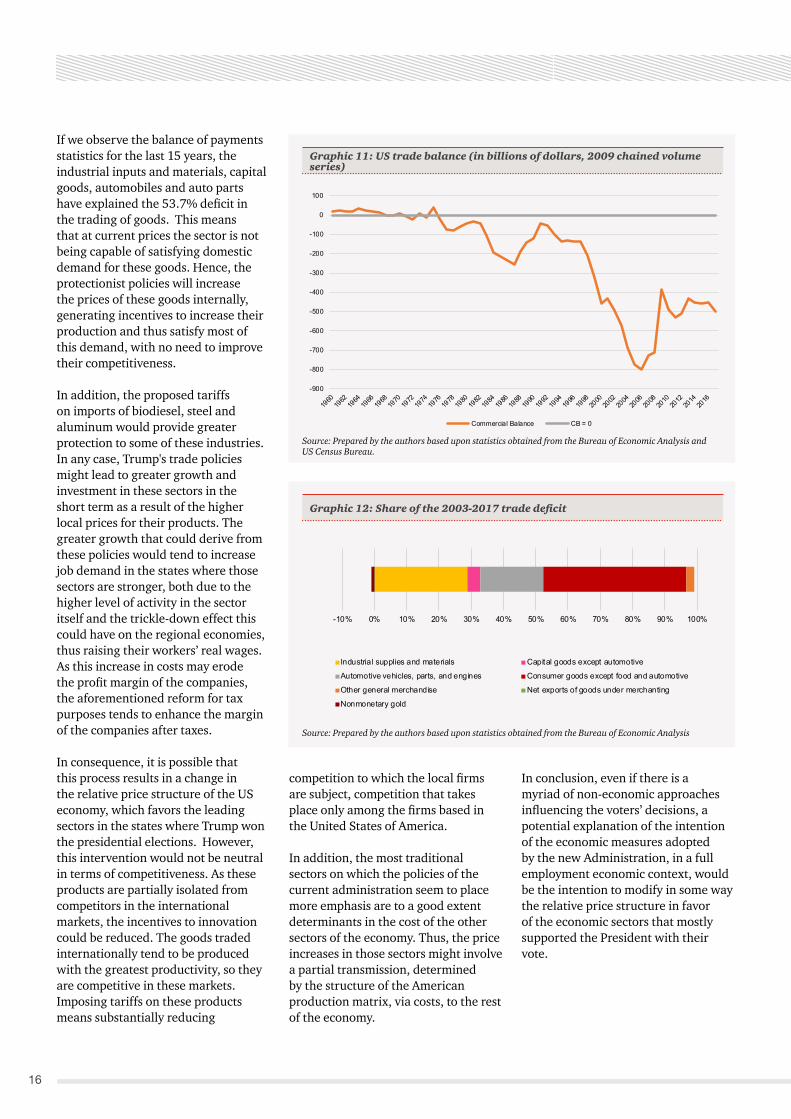
During the 2016 electoral campaign, Donald Trump made several promises, which he included on October 22 in a document he called a “Contract with the American Voter”. This document provides a detail of a specific action plan, with 60 promises that would serve as a guide for his administration while in office. The promises include reforms of governmental processes, measures to encourage the economy through a tax cut and the creation of new jobs, stricter immigration controls, the renegotiation of trade deals and treaties and structural changes in the health care system.
In spite of promising immediate changes that would be seen during his first 100 days in office, only 14 were
fulfilled, 16 promises were broken and a commitment has been undertaken in 7 of his promises so far. No progress has been made in 8 out of the other 23 promises that were launched. Table 2 shows a detail of the promises delivered.
In table 2, we can see that more promises have been fulfilled in the fields of energy and trade. As regards energy, the two resolutions are aimed at lifting barriers on the oil, gas, and coal sectors reducing production costs in those sectors and increasing profitability. It is expected that investment in these sectors will generate higher profits, which would in turn promote a more accelerated growth in production.
As regards trade, various resolutions were fulfilled in relation to protectionism in general, with various deals having been abandoned or bilaterally renegotiated.
Likewise, these policies would enable increasing profitability in those goods-producing sectors where the US economy is a major importer. This would put the brakes on external competitors, allowing local producers to increase their profit margins via higher prices. It is important to note that the US economy had been in deficit for more than 40 years in a row, beginning to recover in 1976, a few years after the abandonment of the gold standard under the Richard Nixon administration in 1971.
1616
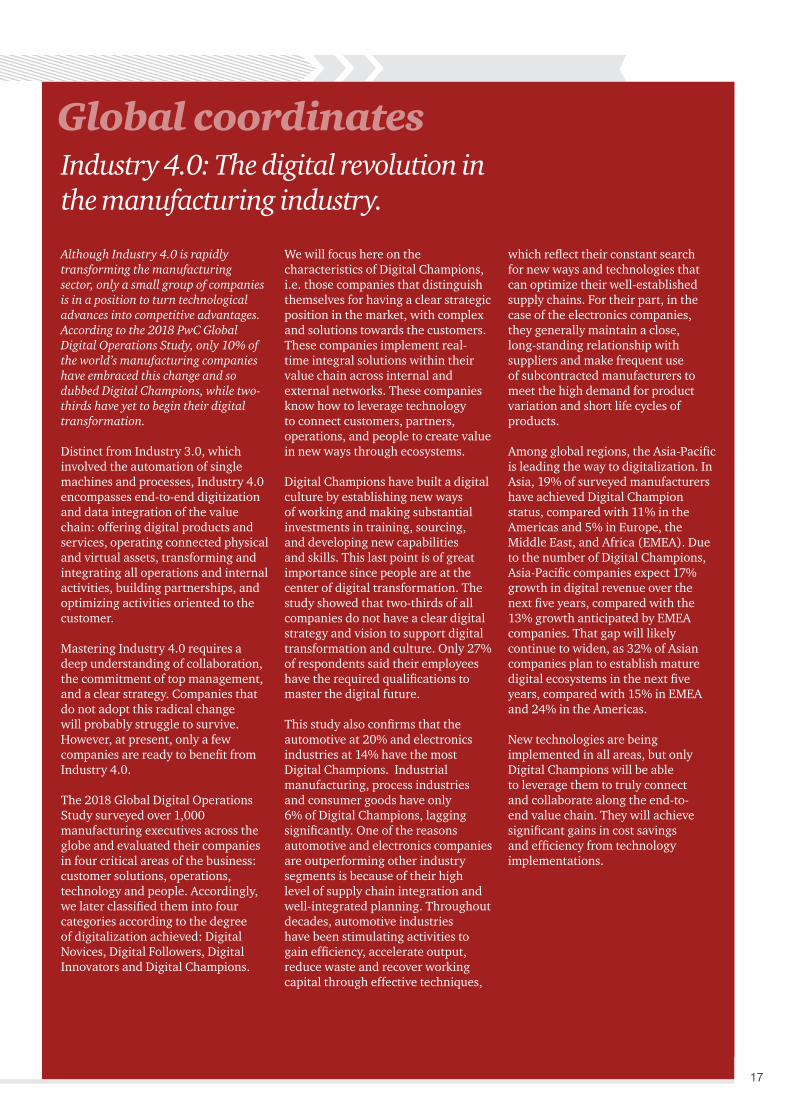
If we observe the balance of payments statistics for the last 15 years, the industrial inputs and materials, capital goods, automobiles and auto parts have explained the 53.7% deficit in the trading of goods. This means that at current prices the sector is not being capable of satisfying domestic demand for these goods. Hence, the protectionist policies will increase the prices of these goods internally, generating incentives to increase their production and thus satisfy most of this demand, with no need to improve their competitiveness.
In addition, the proposed tariffs on imports of biodiesel, steel and aluminum would provide greater protection to some of these industries. In any case, Trump's trade policies might lead to greater growth and investment in these sectors in the short term as a result of the higher local prices for their products. The greater growth that could derive from these policies would tend to increase job demand in the states where those sectors are stronger, both due to the higher level of activity in the sector itself and the trickle-down effect this could have on the regional economies, thus raising their workers’ real wages. As this increase in costs may erode the profit margin of the companies, the aforementioned reform for tax purposes tends to enhance the margin of the companies after taxes.
In consequence, it is possible that this process results in a change in the relative price structure of the US economy, which favors the leading sectors in the states where Trump won the presidential elections. However, this intervention would not be neutral in terms of competitiveness. As these products are partially isolated from competitors in the international markets, the incentives to innovation could be reduced. The goods traded internationally tend to be produced with the greatest productivity, so they are competitive in these markets. Imposing tariffs on these products means substantially reducing
competition to which the local firms are subject, competition that takes place only among the firms based in the United States of America.
In addition, the most traditional sectors on which the policies of the current administration seem to place more emphasis are to a good extent determinants in the cost of the other sectors of the economy. Thus, the price increases in those sectors might involve a partial transmission, determined by the structure of the American production matrix, via costs, to the rest of the economy.
In conclusion, even if there is a myriad of non-economic approaches influencing the voters’ decisions, a potential explanation of the intention of the economic measures adopted by the new Administration, in a full employment economic context, would be the intention to modify in some way the relative price structure in favor of the economic sectors that mostly supported the President with their vote.
Source: Prepared by the authors based upon statistics obtained from the Bureau of Economic Analysis and US Census Bureau.
Source: Prepared by the authors based upon statistics obtained from the Bureau of Economic Analysis
Graphic 11: US trade balance (in billions of dollars, 2009 chained volume series)
Graphic 12: Share of the 2003-2017 trade deficit
-10% 0% 10% 20% 30% 40% 50% 60% 70% 80% 90% 100%
Industrial supplies and materials Capital goods except automotive
Automotive vehicles, parts, and engines Consumer goods except food and automotive
Other general merchandise Net exports of goods under merchanting
Nonmonetary gold
-900
-800
-700
-600
-500
-400
-300
-200
-100
0
100
Commercial Balance CB = 0
Global coordinates
Although Industry 4.0 is rapidly transforming the manufacturing sector, only a small group of companies is in a position to turn technological advances into competitive advantages. According to the 2018 PwC Global Digital Operations Study, only 10% of the world’s manufacturing companies have embraced this change and so dubbed Digital Champions, while two-thirds have yet to begin their digital transformation.
Distinct from Industry 3.0, which involved the automation of single machines and processes, Industry 4.0 encompasses end-to-end digitization and data integration of the value chain: offering digital products and services, operating connected physical and virtual assets, transforming and integrating all operations and internal activities, building partnerships, and optimizing activities oriented to the customer.
Mastering Industry 4.0 requires a deep understanding of collaboration, the commitment of top management, and a clear strategy. Companies that do not adopt this radical change will probably struggle to survive. However, at present, only a few companies are ready to benefit from Industry 4.0.
The 2018 Global Digital Operations Study surveyed over 1,000 manufacturing executives across the globe and evaluated their companies in four critical areas of the business: customer solutions, operations, technology and people. Accordingly, we later classified them into four categories according to the degree of digitalization achieved: Digital Novices, Digital Followers, Digital Innovators and Digital Champions.
We will focus here on the characteristics of Digital Champions, i.e. those companies that distinguish themselves for having a clear strategic position in the market, with complex and solutions towards the customers. These companies implement real-time integral solutions within their value chain across internal and external networks. These companies know how to leverage technology to connect customers, partners, operations, and people to create value in new ways through ecosystems.
Digital Champions have built a digital culture by establishing new ways of working and making substantial investments in training, sourcing, and developing new capabilities and skills. This last point is of great importance since people are at the center of digital transformation. The study showed that two-thirds of all companies do not have a clear digital strategy and vision to support digital transformation and culture. Only 27% of respondents said their employees have the required qualifications to master the digital future.
This study also confirms that the automotive at 20% and electronics industries at 14% have the most Digital Champions. Industrial manufacturing, process industries and consumer goods have only 6% of Digital Champions, lagging significantly. One of the reasons automotive and electronics companies are outperforming other industry segments is because of their high level of supply chain integration and well-integrated planning. Throughout decades, automotive industries have been stimulating activities to gain efficiency, accelerate output, reduce waste and recover working capital through effective techniques,
which reflect their constant search for new ways and technologies that can optimize their well-established supply chains. For their part, in the case of the electronics companies, they generally maintain a close, long-standing relationship with suppliers and make frequent use of subcontracted manufacturers to meet the high demand for product variation and short life cycles of products.
Among global regions, the Asia-Pacific is leading the way to digitalization. In Asia, 19% of surveyed manufacturers have achieved Digital Champion status, compared with 11% in the Americas and 5% in Europe, the Middle East, and Africa (EMEA). Due to the number of Digital Champions, Asia-Pacific companies expect 17% growth in digital revenue over the next five years, compared with the 13% growth anticipated by EMEA companies. That gap will likely continue to widen, as 32% of Asian companies plan to establish mature digital ecosystems in the next five years, compared with 15% in EMEA and 24% in the Americas.
New technologies are being implemented in all areas, but only Digital Champions will be able to leverage them to truly connect and collaborate along the end-to-end value chain. They will achieve significant gains in cost savings and efficiency from technology implementations.
Industry 4.0: The digital revolution in the manufacturing industry.
17
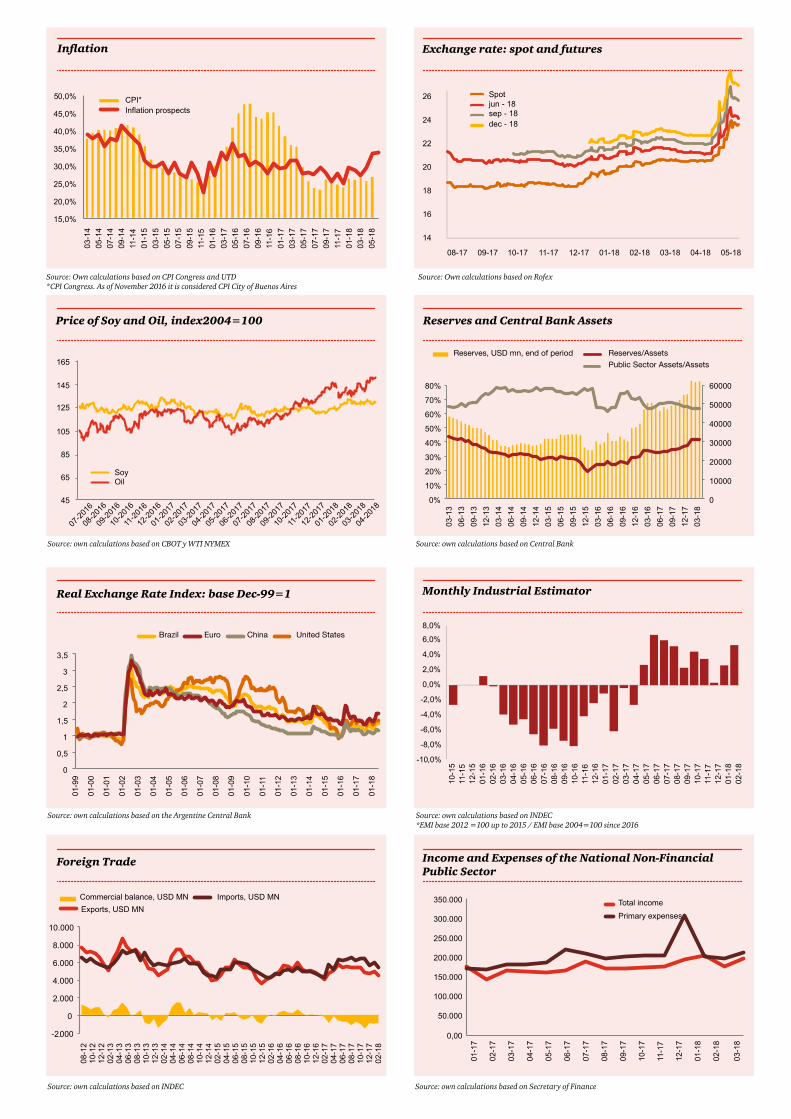
Exchange rate: spot and futures
Monthly Industrial Estimator
Reserves and Central Bank AssetsPrice of Soy and Oil, index2004=100
Real Exchange Rate Index: base Dec-99=1
Foreign Trade Income and Expenses of the National Non-Financial Public Sector
Inflation
Source: own calculations based on INDEC*EMI base 2012 =100 up to 2015 / EMI base 2004=100 since 2016
Source: own calculations based on Central BankSource: own calculations based on CBOT y WTI NYMEX
Source: own calculations based on the Argentine Central Bank
Source: own calculations based on INDEC Source: own calculations based on Secretary of Finance
Source: Own calculations based on CPI Congress and UTD*CPI Congress. As of November 2016 it is considered CPI City of Buenos Aires
Source: Own calculations based on Rofex
Spotjun - 18sep - 18dec - 18
CPI*Inflation prospects
SoyOil
Reserves, USD mn, end of period Reserves/AssetsPublic Sector Assets/Assets
Brazil United StatesEuro China
Commercial balance, USD MN Imports, USD MNExports, USD MN
Total incomePrimary expenses
20,0%
25,0%
30,0%
35,0%
40,0%
05 ,0%
45,0%
07-20
16
09-20
16
10-20
16
11-20
16
12-20
16
01-20
17
02-20
17
03-20
17
04-20
17
05-20
17
06-20
17
07-20
17
08-20
17
09-20
17
10-20
17
11-20
17
12-20
17
01-20
18
02-20
18
03-20
18
04-20
18
08-20
1645
65
85
105
125
145
165
0
10000
20000
30000
40000
50000
60000
0%
10%
20%
30%
40%
50%
60%
70%
80%
0
0,5
01-9
9
01-0
0
01-0
1
01-0
2
01-0
3
01-0
4
01-0
5
01-0
6
01-0
7
01-0
8
01-0
9
01-1
0
01-1
1
01-1
2
01-1
3
01-1
4
01-1
6
01-1
7
01-1
8
01-1
5
1
1,5
2
2,5
3
3,5
0
2.000
-2.000
4.000
6.000
8.000
10.000
-10,0%
-8,0%
-6,0%
-4,0%
-2,0%
0,0%
2,0%
4,0%
6,0%
8,0%
15,0%
03-1
306
-13
09-1
3
03-1
406
-14
12-1
3
12-1
403
-15
06-1
5
09-1
4
12-1
503
-16
06-1
6
09-1
5
12-1
603
-16
06-1
7
09-1
6
12-1
703
-18
09-1
7
12-1
511
-15
10-1
5
01-1
6
03-1
6
06-1
6
08-1
609
-16
10-1
611
-16
12-1
601
-17
02-1
703
-17
04-1
705
-17
06-1
707
-17
09-1
710
-17
11-1
712
-17
01-1
802
-18
08-1
7
07-1
6
05-1
604
-16
02-1
6
03-1
4
09-1
411
-14
05-1
407
-14
05-1
507
-15
01-1
503
-15
01-1
603
-17
09-1
511
-15
07-1
609
-16
11-1
601
-17
03-1
705
-17
07-1
709
-17
01-1
803
-18
05-1
8
11-1
7
05-1
6
11-17 12-17 01-18 02-18 03-18 04-18 05-1810-1709-1708-17
10-1
212
-12
08-1
2
06-1
308
-13
02-1
304
-13
02-1
404
-14
10-1
312
-13
10-1
412
-14
06-1
408
-14
04-1
506
-15
02-1
5
10-1
512
-15
08-1
5
04-1
606
-16
02-1
6
10-1
612
-16
08-1
6
02-1
704
-17
08-1
710
-17
12-1
702
-18
06-1
7
250.000
300.000
350.000
150.000
200.000
100.000
50.000
01-1
7
02-1
7
03-1
7
04-1
7
05-1
7
06-1
7
07-1
7
08-1
7
09-1
7
10-1
7
11-1
7
12-1
7
01-1
8
02-1
8
03-1
8
22
24
26
14
16
18
20
0,00
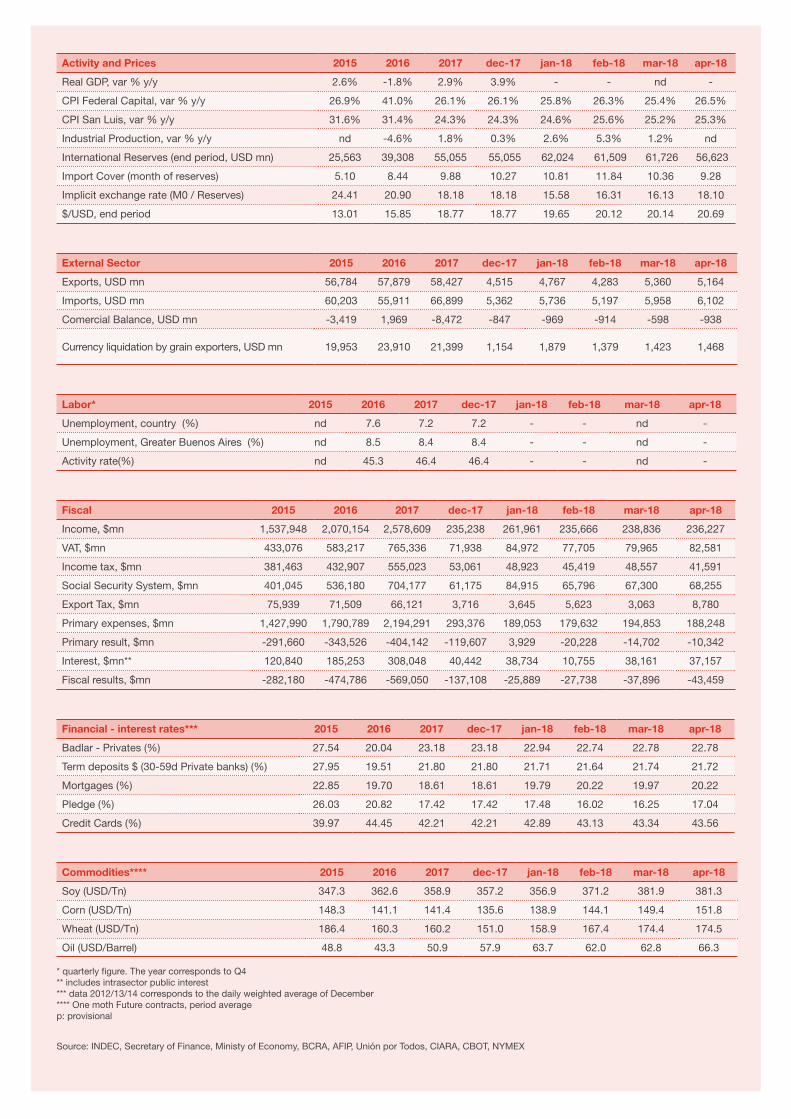
Activity and Prices 2015 2016 2017 dec-17 jan-18 feb-18 mar-18 apr-18
Real GDP, var % y/y 2.6% -1.8% 2.9% 3.9% - - nd -
CPI Federal Capital, var % y/y 26.9% 41.0% 26.1% 26.1% 25.8% 26.3% 25.4% 26.5%
CPI San Luis, var % y/y 31.6% 31.4% 24.3% 24.3% 24.6% 25.6% 25.2% 25.3%
Industrial Production, var % y/y nd -4.6% 1.8% 0.3% 2.6% 5.3% 1.2% nd
International Reserves (end period, USD mn) 25,563 39,308 55,055 55,055 62,024 61,509 61,726 56,623
Import Cover (month of reserves) 5.10 8.44 9.88 10.27 10.81 11.84 10.36 9.28
Implicit exchange rate (M0 / Reserves) 24.41 20.90 18.18 18.18 15.58 16.31 16.13 18.10
$/USD, end period 13.01 15.85 18.77 18.77 19.65 20.12 20.14 20.69
External Sector 2015 2016 2017 dec-17 jan-18 feb-18 mar-18 apr-18
Exports, USD mn 56,784 57,879 58,427 4,515 4,767 4,283 5,360 5,164
Imports, USD mn 60,203 55,911 66,899 5,362 5,736 5,197 5,958 6,102
Comercial Balance, USD mn -3,419 1,969 -8,472 -847 -969 -914 -598 -938
Currency liquidation by grain exporters, USD mn 19,953 23,910 21,399 1,154 1,879 1,379 1,423 1,468
Labor* 2015 2016 2017 dec-17 jan-18 feb-18 mar-18 apr-18
Unemployment, country (%) nd 7.6 7.2 7.2 - - nd -
Unemployment, Greater Buenos Aires (%) nd 8.5 8.4 8.4 - - nd -
Activity rate(%) nd 45.3 46.4 46.4 - - nd -
Fiscal 2015 2016 2017 dec-17 jan-18 feb-18 mar-18 apr-18
Income, $mn 1,537,948 2,070,154 2,578,609 235,238 261,961 235,666 238,836 236,227
VAT, $mn 433,076 583,217 765,336 71,938 84,972 77,705 79,965 82,581
Income tax, $mn 381,463 432,907 555,023 53,061 48,923 45,419 48,557 41,591
Social Security System, $mn 401,045 536,180 704,177 61,175 84,915 65,796 67,300 68,255
Export Tax, $mn 75,939 71,509 66,121 3,716 3,645 5,623 3,063 8,780
Primary expenses, $mn 1,427,990 1,790,789 2,194,291 293,376 189,053 179,632 194,853 188,248
Primary result, $mn -291,660 -343,526 -404,142 -119,607 3,929 -20,228 -14,702 -10,342
Interest, $mn** 120,840 185,253 308,048 40,442 38,734 10,755 38,161 37,157
Fiscal results, $mn -282,180 -474,786 -569,050 -137,108 -25,889 -27,738 -37,896 -43,459
Financial - interest rates*** 2015 2016 2017 dec-17 jan-18 feb-18 mar-18 apr-18
Badlar - Privates (%) 27.54 20.04 23.18 23.18 22.94 22.74 22.78 22.78
Term deposits $ (30-59d Private banks) (%) 27.95 19.51 21.80 21.80 21.71 21.64 21.74 21.72
Mortgages (%) 22.85 19.70 18.61 18.61 19.79 20.22 19.97 20.22
Pledge (%) 26.03 20.82 17.42 17.42 17.48 16.02 16.25 17.04
Credit Cards (%) 39.97 44.45 42.21 42.21 42.89 43.13 43.34 43.56
Commodities**** 2015 2016 2017 dec-17 jan-18 feb-18 mar-18 apr-18
Soy (USD/Tn) 347.3 362.6 358.9 357.2 356.9 371.2 381.9 381.3
Corn (USD/Tn) 148.3 141.1 141.4 135.6 138.9 144.1 149.4 151.8
Wheat (USD/Tn) 186.4 160.3 160.2 151.0 158.9 167.4 174.4 174.5
Oil (USD/Barrel) 48.8 43.3 50.9 57.9 63.7 62.0 62.8 66.3
* quarterly figure. The year corresponds to Q4** includes intrasector public interest*** data 2012/13/14 corresponds to the daily weighted average of December**** One moth Future contracts, period averagep: provisional
Source: INDEC, Secretary of Finance, Ministy of Economy, BCRA, AFIP, Unión por Todos, CIARA, CBOT, NYMEX
This publication has been prepared for general guidance on matters of interest only, and does not constitute professional advice. You should not act upon the information contained in this publication without obtaining specific professional advice. No representation or warranty (express or implied) is given as to the accuracy or completeness of the information contained in this publication, and, to the extent permitted by law, Price Waterhouse & Co. Asesores de Empresas S.R.L., its members, employees and agents do not accept or assume any liability, responsibility or duty of care for any consequences of you or anyone else acting, or refraining to act, in reliance on the information contained in this publication or for any decision based on it.
© 2018 In Argentina, the member firms of the global network of PricewaterhouseCoopers International Limited are Price Waterhouse & Co. S.R.L, Price Waterhouse & Co. Asesores de Empresas S.R.L. and PwC Legal S.R.L, each of which, either separately or jointly, are identified as PwC Argentina.
Macroeconomic analysis
- Monthly/quarterly report
- Conferences
- Projections and data
Sectorial/Quantitative
- Follow up and projection by sector
- Quantification of demand
- Applied econometrics
- Revenue forecast
- Surveys
Litigation
- Support of experts’ reports relating to economic matters
- Dumping
- Antitrust
Regulatory
- Tax benefits
- Benefit/price structure
- Quantification of impacts
José María Segura
[email protected]+54 11 4850 6718
Leandro Romano
[email protected]+54 11 4850 6713
Paula Lima
[email protected]+54 11 4850 6000 int. 4128
Our services
Contacts