Embed Size (px)
Citation preview

5/3/2011
1
Economic Geography of the
Copyright 2011 AFG
Long Island Region
1
Geography of DataThe geography of economic activity requires:
- the gathering of spatial data
2
- the location of data geographically
- the analysis of the interrelationship of the data to geographic site and situ-ation, both currently and historically (so as to assess change).
Total Population Changefrom 1950-2010 for Nassau/Suffolk
2010 Census2.9 million
3
Nassau = 1.4 milSuffolk = 1.5 mil
Economic Development Over Time
• The original inhabitants were hunter-gatherers who later became subsistence farmers.
• The European colonists relied on subsis-
4
tence farming and fishing to survive.• For-profit activities - farming, fishing and
whaling - came about as a cash economy took hold.
• Early interaction with other parts of LI and NYC was limited by poor transportation.
Economic Development Over Time
• As a network of boat routes, overland turn-pikes and the rail lines were established, trade within areas of LI and outside of LI (NYC and New England) flourished.
5
• Industries started out locally and were based on nearby resources and people.
• The western end of LI (Brooklyn and Queens)saw the first large-scale industrial develop-ment, especially along the East River inlets as Newtown Creek and Gowanus Creek.
Economic Development Over Time
• In the post-Civil War era, especially in the 1870s, saw the rapid growth of industry along the Brooklyn-Queens waterfront.
• Income generated allowed the wealthy
6
industrialists to build estates on LI’s North Shore and the workers to vacation along its South Shore.
• The leisure, vacation, tourism and retail industries developed to support them.

5/3/2011
2
Economic Development Over Time
• During the early 1900s airplane and related technology industries were established in Nassau County.
• The 1930s-1960s saw defense industries
7
grow and the need for workers increase.• Workers needed housing: the construction
industry grew.• Workers and their families required goods
and services: the retail trade industry grew.
Economic Development Over Time
• During the 1970s high-technology and service oriented industries were set up in Nassau and western Suffolk counties.
• Nassau’s economic and population growth
8
slowed as it began to run out of land.• Suffolk’s increased because of the avail-
ability of space. But its agricultural sector suffered as suburbia moved eastward.
• Suffolk acts to preserve farmland (1974) but this affects economic development.
Economic Development Over Time
• LI residents, especially those in central and eastern Suffolk County who did not work locally, commuted daily to jobs in NYC and Nassau County.
9
• The LIRR carried workers to NYC.• The Long Island Expressway, the North
State Parkway and the Southern State Parkway became clogged with commuters working in Nassau and Suffolk counties or driving to NYC subway stations.
Economic Development Over Time
• 1990s: Nassau-Suffolk lost many defense-related industry jobs (aviation; electronics).
• Since then, Nassau’s growth has been slow while Suffolk’s has increased due to
10
a strong research and biotechnology sec-tor (associated with Stony Brook and Brookhaven) and financial services.
• Research and development, wine making and recreation industries helped Suffolk get through the recession of the 2000s.
Employment Trend 1995-2005
of J
obs
Nassau
Suffolk
Long Island Region
11Source: NYS Comptroller’s Office, 2007
Tho
usan
ds o Nassau
Areas of Employment 2002
12
Trade
Business and other services
Health, education and social services
Government
Manufacturing

5/3/2011
3
Industry Groups in 2002US Census of Industry and Manufacturing
Nassau County (47,600 units)
1. Professional, scientific, technical services
2. Retail trade
Suffolk County (48,400 units)
1. Construction2. Retail trade3. Professional, scientific
3. Health care and social assistance
4. Construction5. Other services (except
public administration)6. Wholesale trade
,and technical services
4. Health care and social assistance
5. Other services (except public administration)
6. Wholesale trade
13
Employment by Industry in 2006NYS Dept of Labor
Industry Cluster Reporting Units, Employment, and Wages, Long Island Region**Data are preliminary and subject to change**Data may not add to total due to rounding
Region Industry Cluster Reporting
Units Employment** % Change, 2003-2006
Total Wages ($ mns)**
% Change, 2003-2006
Average Wage
Long Island Back Office & Outsourcing 639 20,700 18.7% $820.4 35.5% $39,630
Biomedical 448 14,400 2.9% $730.7 11.5% $50,590Communications, Software & Media Services 1,475 33,700 1.6% $1,980.9 6.3% $58,730
Distribution 8,113 44,700 -0.6% $2,635.1 13.9% $58,990Electronics & Imaging 199 10,800 -10.4% $752.9 5.3% $69,480Fashion, Apparel & Textiles 585 6,700 0.9% $317.7 8.9% $47,550Financial Services 3,708 50,100 -6.4% $4,194.5 13.6% $83,680Food Processing 205 6,400 -6.6% $246.9 2.6% $38,830Forest Products 361 5,300 8.0% $263.0 27.0% $49,230
Front Office & Producer Services 9,786 73,500 3.6% $4,633.8 12.4% $63,070Industrial Machinery & Services 941 22,300 1.3% $1,270.2 15.0% $56,960Information Technology Services 1,867 11,000 3.8% $829.5 18.1% $75,280
Materials Processing 335 8,100 -15.6% $409.6 -2.6% $50,500Miscellaneous Manufacturing 235 5,400 -5.0% $206.2 3.3% $37,930Transportation Equipment 142 5,300 7.3% $374.0 20.7% $71,010
Travel & Tourism 9,863 38,100 3.6% $1,197.2 13.4% $31,420
Long Island, Total 38,902 356,600 0.7% $20,862.5 12.8% $58,500
14
Percent Employed in 2008US Census, American Survey
Nassau County• 27% Education, health
care, social services• 13% Professional,
Suffolk County • 25% Education, health
care, social services• 12% Retail
scientific, management• 11% Retail trade• 10% Finance, insurance,
real estate• 7% Arts, entertainment,
recreation, accommoda-tion, food service
• 11% Professional, scientific, management
• 8% Construction• 8% Manufacturing• 8% Finance, insurance,
real estate
15
LI Employment by Industry, 2010
16
Salary and Change in Employment, 2010
17
Economic Development, 2011
Labor Statistics for the Long Island Region
Nassau and Suffolk CountiesRecent Developments in the Long Island Labor Market The private sector job count on Long Island rose over the year by 10,300, or 1%, to 1,002,200 in March 2011.
18
Job gains were centered in educational and health services (+6,500), leisure and hospitality (+3,400), trade, transportation and utilities (+2,800), and other services (+1,800).
Losses were greatest in natural resources, mining and construction (-3,000), manufacturing (-1,300), and information (-1,000). The government job count fell (-2,300) over the year.
The Long Island unemployment rate for March 2011, at 7.1%, is down 0.7% from last year’s 7.8%.
SOURCE: NYS Dept. of Labor
5/3/2011
4
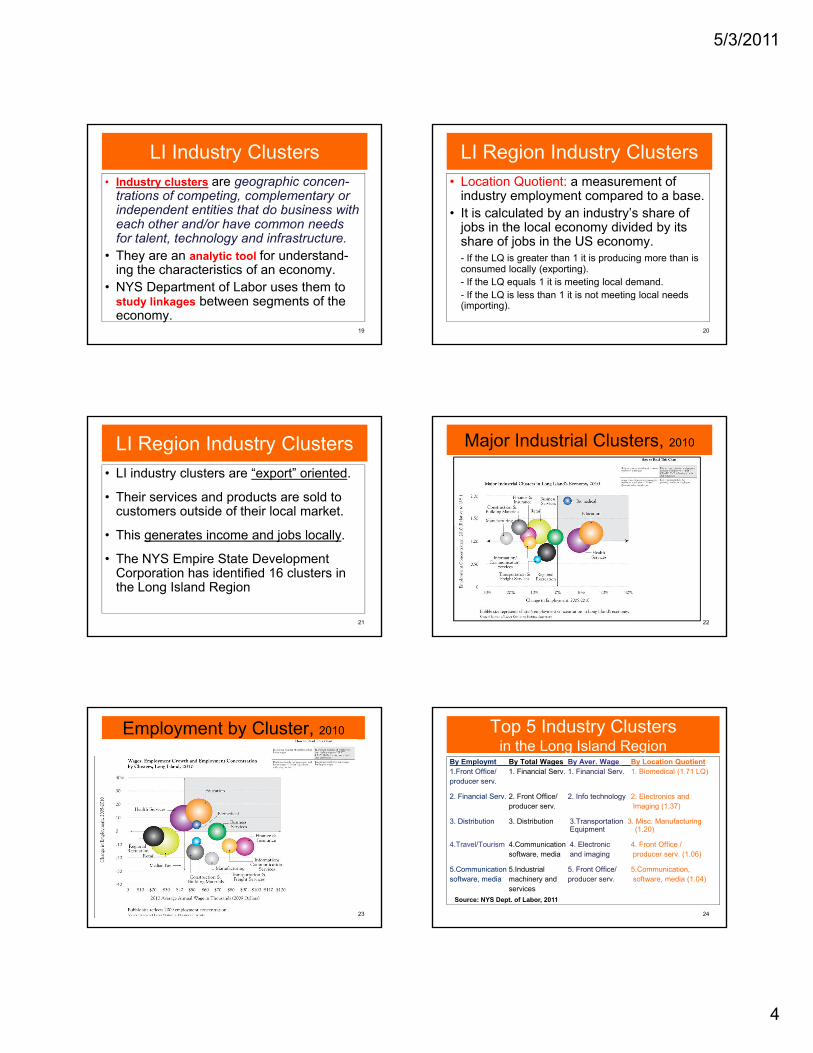
LI Industry Clusters• Industry clusters are geographic concen-
trations of competing, complementary or independent entities that do business with each other and/or have common needs f t l t t h l d i f t t
19
for talent, technology and infrastructure.• They are an analytic tool for understand-
ing the characteristics of an economy.• NYS Department of Labor uses them to
study linkages between segments of the economy.
LI Region Industry Clusters• Location Quotient: a measurement of
industry employment compared to a base.• It is calculated by an industry’s share of
jobs in the local economy divided by its
20
share of jobs in the US economy.- If the LQ is greater than 1 it is producing more than is consumed locally (exporting).- If the LQ equals 1 it is meeting local demand.- If the LQ is less than 1 it is not meeting local needs (importing).
LI Region Industry Clusters• LI industry clusters are “export” oriented.
• Their services and products are sold to customers outside of their local market.
21
• This generates income and jobs locally.
• The NYS Empire State Development Corporation has identified 16 clusters in the Long Island Region
Major Industrial Clusters, 2010
22
Employment by Cluster, 2010
23
Top 5 Industry Clustersin the Long Island Region
By Employmt By Total Wages By Aver. Wage By Location Quotient1.Front Office/ 1. Financial Serv. 1. Financial Serv. 1. Biomedical (1.71 LQ)producer serv.
2. Financial Serv. 2. Front Office/ 2. Info technology 2. Electronics andproducer serv. Imaging (1.37)
24
3. Distribution 3. Distribution 3.Transportation 3. Misc. ManufacturingEquipment (1.20)
4.Travel/Tourism 4.Communication 4. Electronic 4. Front Office /software, media and imaging producer serv. (1.06)
5.Communication 5.Industrial 5. Front Office/ 5.Communication,software, media machinery and producer serv. software, media (1.04)
servicesSource: NYS Dept. of Labor, 2011

5/3/2011
5
Where people live and work
on Long Island
25 26
Mass Transit Routes
27
Blue highlight = ½ miles from bus routePink highlight = ½ mile from LIRR station
Road and Rail transportation
Highways and rail lines
28
Question of the Day
Should commercial development in eastern Long Island bein eastern Long Island be
encouraged?
Benefits? Drawbacks?29
Compilation of Census Statistics from CityMelt.com
• http://www.citymelt.com/county/New-York/Suffolk+County-NY.html
• http://www.citymelt.com/city/New-York/East+Hampton+Town-NY.html
30