Embed Size (px)
Citation preview
ECONOMIC GEOGRAPHY: LOOKING BACK, SEEING AHEAD
Indermit S. Gill and Somik Lall
Duke University and the World Bank
World Bank: March 25, 2019

ECONOMIC GEOGRAPHY SINCE 2009
• The Revenge of Markets
• Urbanization in India and Africa
• The Revenge of the Regions
• Territorial development in Europe and the US
• The Revenge of the Colonies
• International integration in East and Central Asia led
by China
2
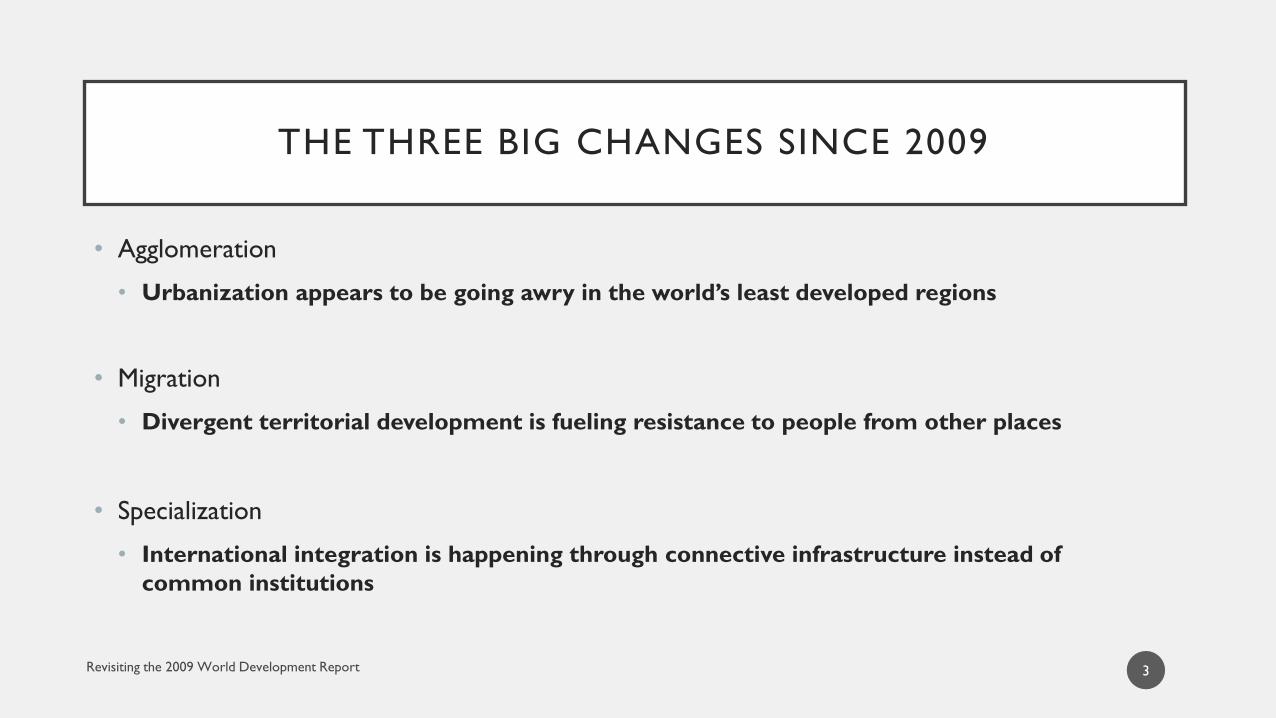
THE THREE BIG CHANGES SINCE 2009
• Agglomeration
• Urbanization appears to be going awry in the world’s least developed regions
• Migration
• Divergent territorial development is fueling resistance to people from other places
• Specialization
• International integration is happening through connective infrastructure instead of
common institutions
3
LOOKING BACK
Agglomeration and Urbanization
01Migration and Territorial Development
02Specialization and International Integration
03
4
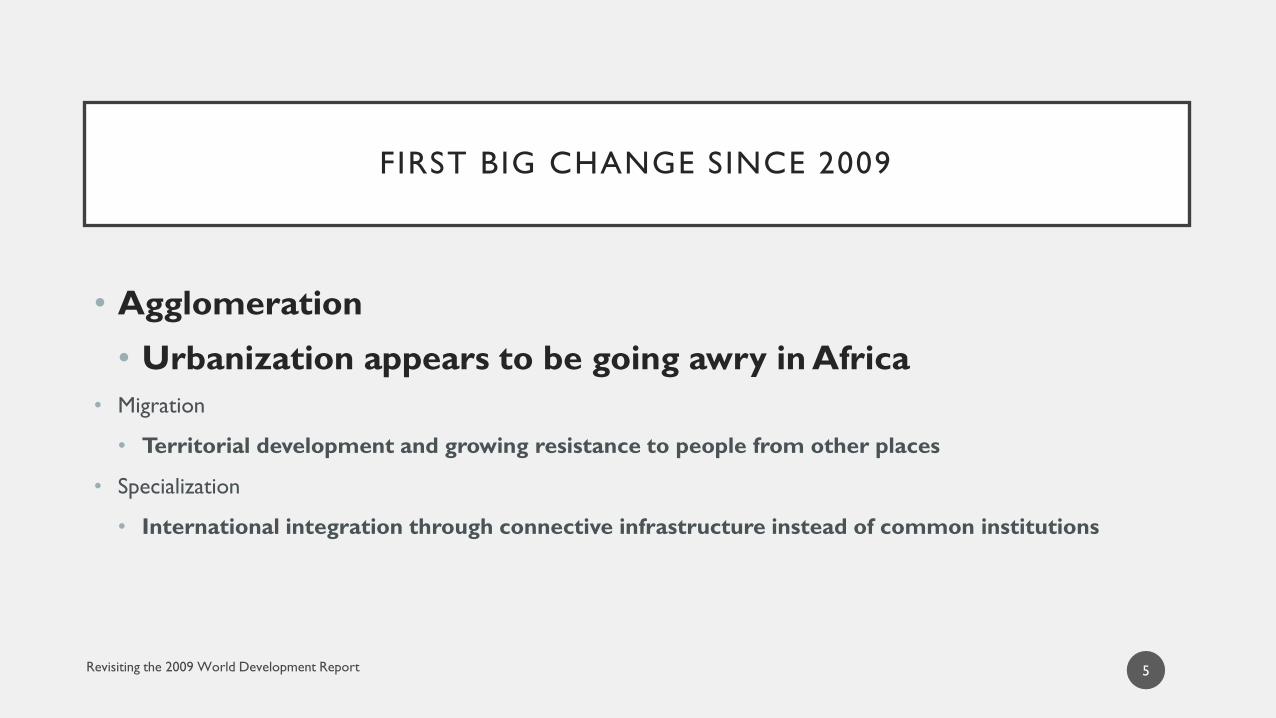
FIRST BIG CHANGE SINCE 2009
• Agglomeration
• Urbanization appears to be going awry in Africa
• Migration
• Territorial development and growing resistance to people from other places
• Specialization
• International integration through connective infrastructure instead of common institutions
5
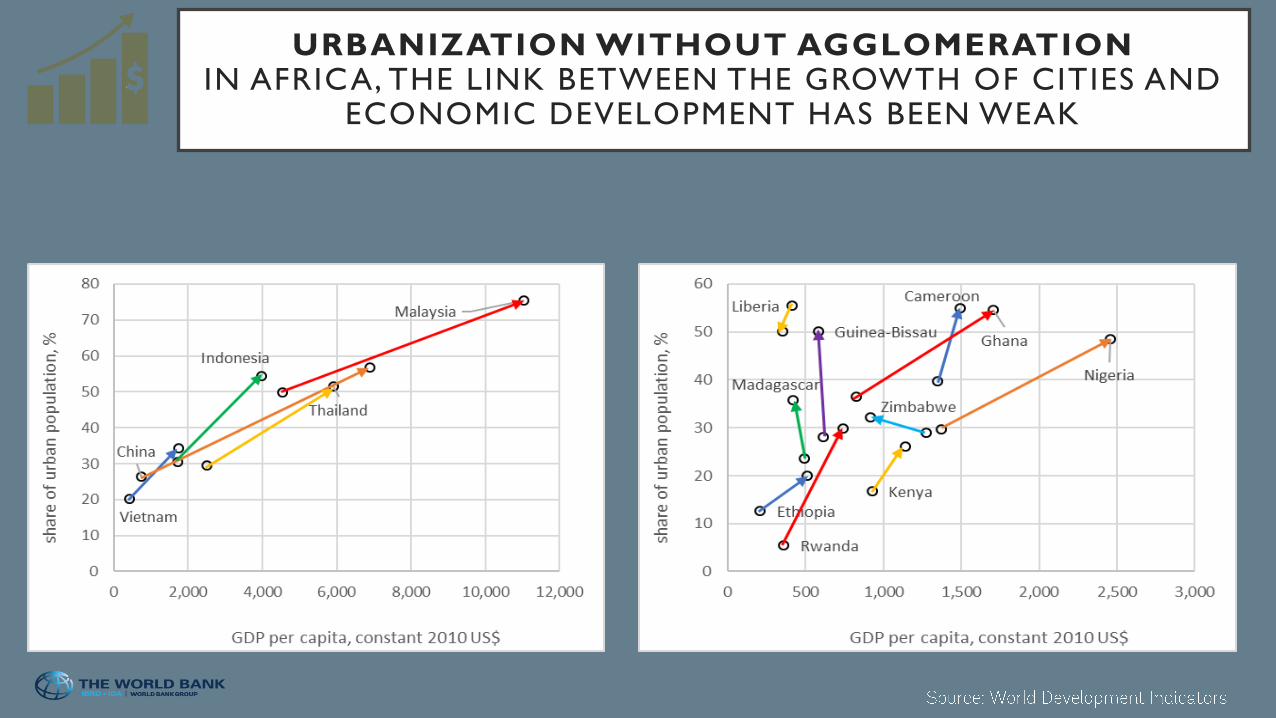
URBANIZATION WITHOUT AGGLOMERATIONIN AFRICA, THE LINK BETWEEN THE GROWTH OF CITIES AND
ECONOMIC DEVELOPMENT HAS BEEN WEAK


Land is being developed in small & disconnected fragments:
People are disconnected from other people and from jobs
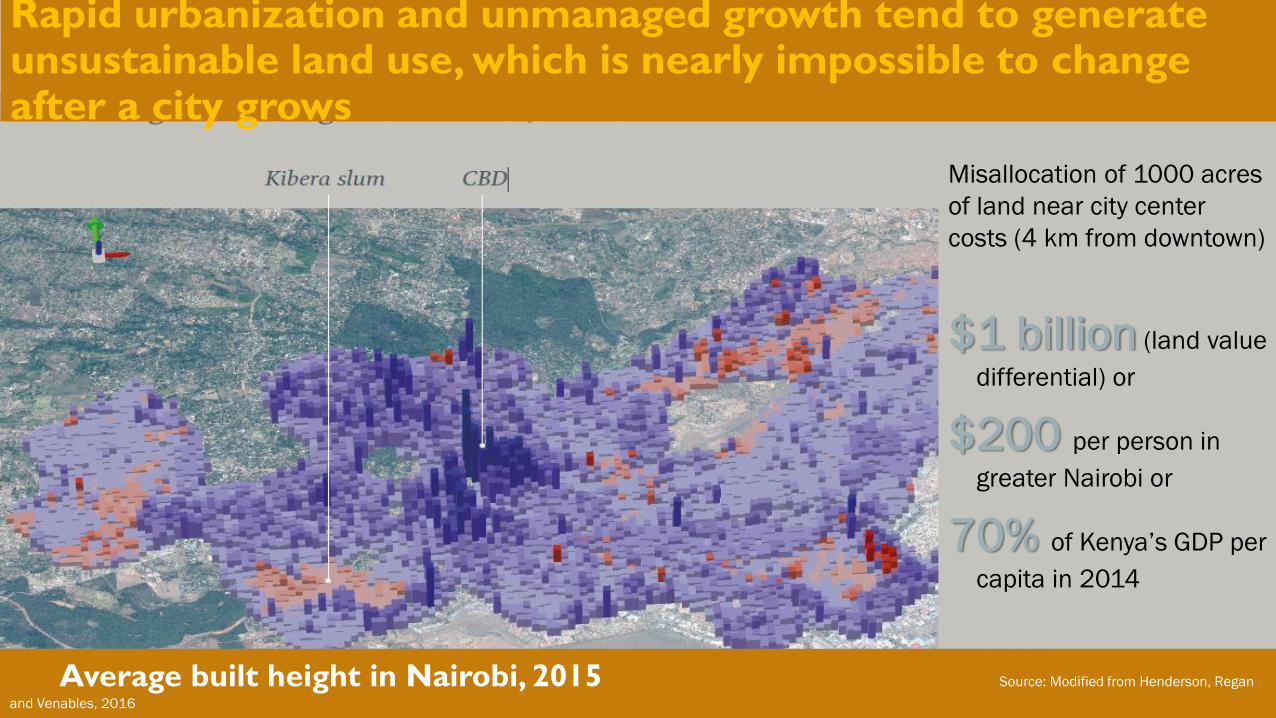
Misallocation of 1000 acres
of land near city center
costs (4 km from downtown)
$1 billion (land value
differential) or
$200 per person in
greater Nairobi or
70% of Kenya’s GDP per
capita in 2014
Average built height in Nairobi, 2015 Source: Modified from Henderson, Regan
and Venables, 2016
Rapid urbanization and unmanaged growth tend to generate unsustainable land use, which is nearly impossible to change after a city grows
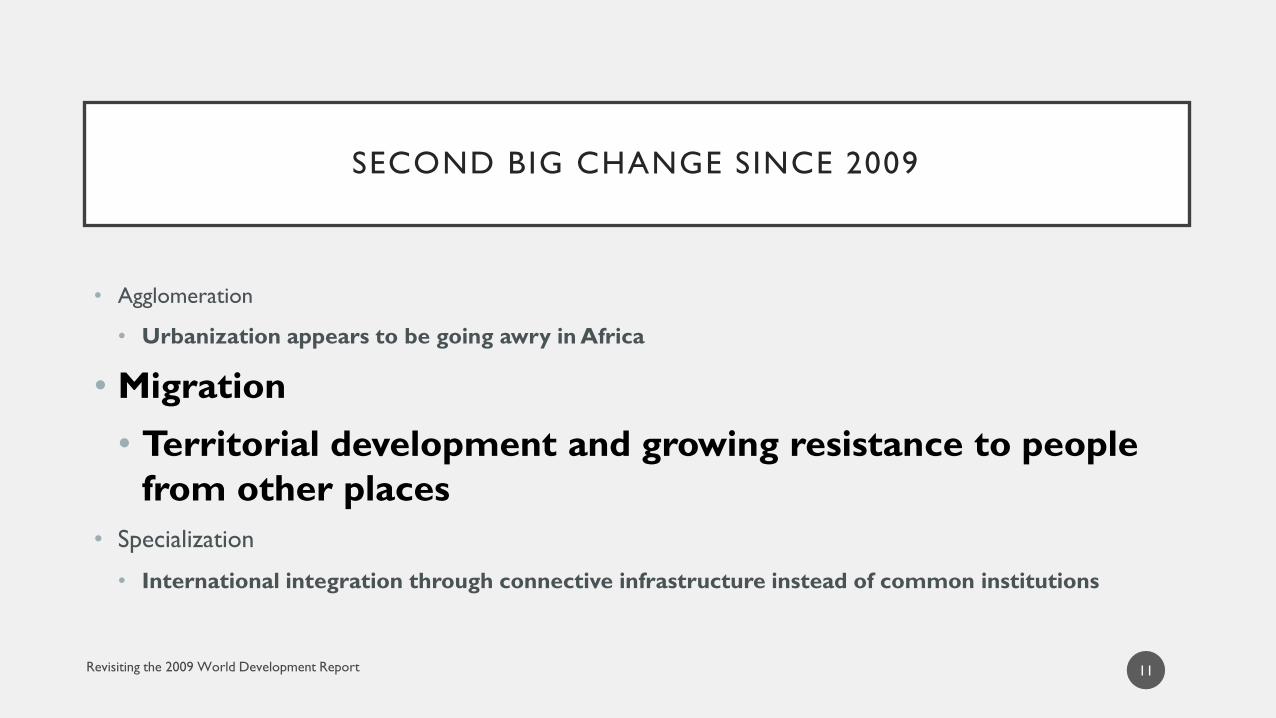
SECOND BIG CHANGE SINCE 2009
• Agglomeration
• Urbanization appears to be going awry in Africa
• Migration
• Territorial development and growing resistance to people
from other places
• Specialization
• International integration through connective infrastructure instead of common institutions
11
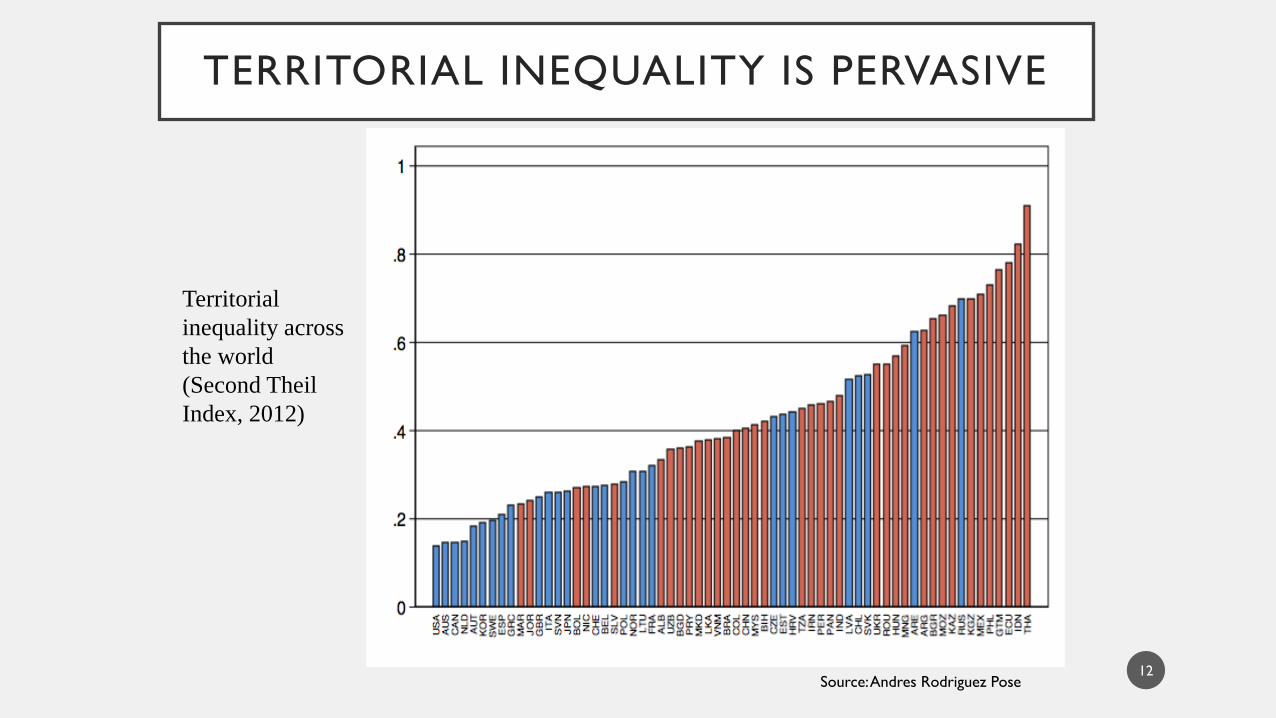
TERRITORIAL INEQUALITY IS PERVASIVE
Territorial
inequality across
the world
(Second Theil
Index, 2012)
Source: Andres Rodriguez Pose12

AND SEEMS TO BE ON THE RISE
Changes in regional disparities in developing countries
Notes: Spatial inequality is measured using Theil’s index. Source: Ezcurra and Rodríguez-Pose, 2013
Spatial inequality
Country Spatial units Period Initial Final Average
Argentina 23 1992-2006 0.040 0.097 0.057
Bolivia 9 1990-2006 0.024 0.050 0.033
Brazil 27 1990-2006 0.102 0.110 0.109
Bulgaria 6 1990-2006 0.049 0.084 0.067
Chile 13 1990-2006 0.066 0.069 0.072
China 31 1990-2005 0.085 0.126 0.123
Colombia 33 1990-2006 0.076 0.052 0.065
Ecuador 21 1993-2006 0.211 0.266 0.250
Estonia 5 1990-2006 0.039 0.088 0.069
India 32 1993-2005 0.059 0.090 0.074
Indonesia 30 2000-2006 0.256 0.223 0.246
Latvia 6 1993-2006 0.030 0.156 0.097
Lithuania 10 1993-2006 0.004 0.049 0.021
Mexico 32 1993-2004 0.143 0.145 0.147
Peru 24 1990-2006 0.140 0.135 0.142
Philippines 16 2005-2006 0.163 0.169 0.166
Poland 16 1990-2006 0.009 0.033 0.021
Romania 8 1990-2006 0.008 0.064 0.030
South Africa 9 1995-2005 0.135 0.114 0.119
Thailand 76 1994-2005 0.439 0.473 0.439
Turkey 26 1990-2001 0.094 0.076 0.081
Venezuela 23 1990-2006 0.006 0.028 0.02413

63%Differences in consumption
across sub national regions in
MENA contribute 63% more to
total inequality than elsewhere in
the world.
SPATIAL INEQUALITIES ARE
HIGH IN MENA…
Source: GMD Global TSD / World Bank (2018).

Source: GMD Global TSD / World Bank (2018).
Spatial inequalities can be attributed to differences in endowments and returns to endowments
SPATIAL INEQUALITIES LARGELY EXPLAINED BY DIFFERENCES IN RETURNS TO
ENDOWMENTS

Most MENA countries are not ful ly leveraging the most potent vehicle to enhance returns from
endowments - migration
0
.2
.4
.6
.8
1
Inte
rna
l M
igra
tio
n R
ate
Mor
occo
Egypt
Rom
ania
Portu
gal
Slove
nia
China
Moz
ambiqu
e
Papua
New
Guine
a
Indo
nesiaIra
q
Tuni
sia
Armen
ia
Jord
an
Sudan
Ukr
aine
Benin
Leba
non
Bra
zil
Mex
ico
Alger
ia
El S
alva
dor
Sou
th A
frica
Irela
nd
Thaila
nd
Cos
ta R
ica
Mal
aysia
Hon
dura
s
Gha
na
Ecuad
or
Uru
guay
Switz
erla
nd
Gre
ece
Spain
Libe
ria
Venez
uela
Turk
ey
Jam
aica
Chi
le
Uni
ted
State
s
Tanz
ania
Uga
nda
Bot
swan
a
Malaw
i
Cub
aPer
u
Mon
golia
On average, 14 percent of households
have moved from their place of birth
in the Middle East and North Africa,
compared to 28 percent elsewhere
Sources: Arab Barometer Wave 4 (2016) and IPUMS International.
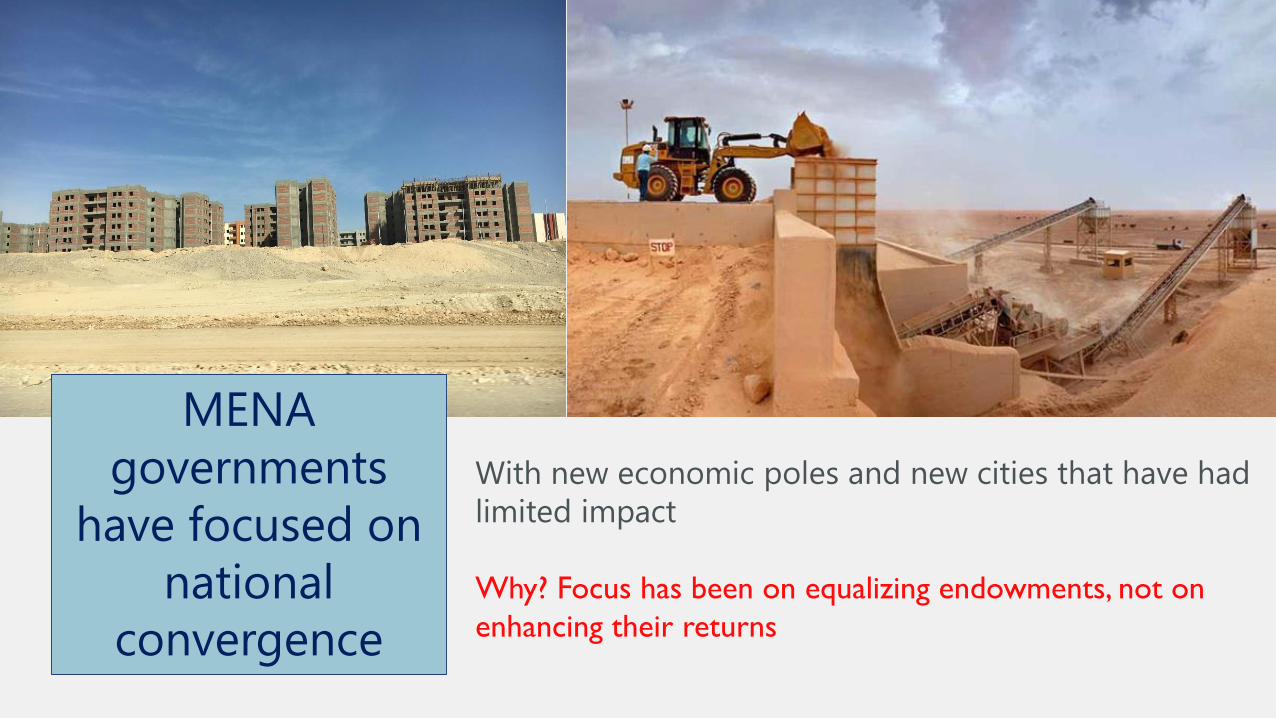
With new economic poles and new cities that have had
limited impact
Why? Focus has been on equalizing endowments, not on
enhancing their returns
MENA
governments
have focused on
national
convergence
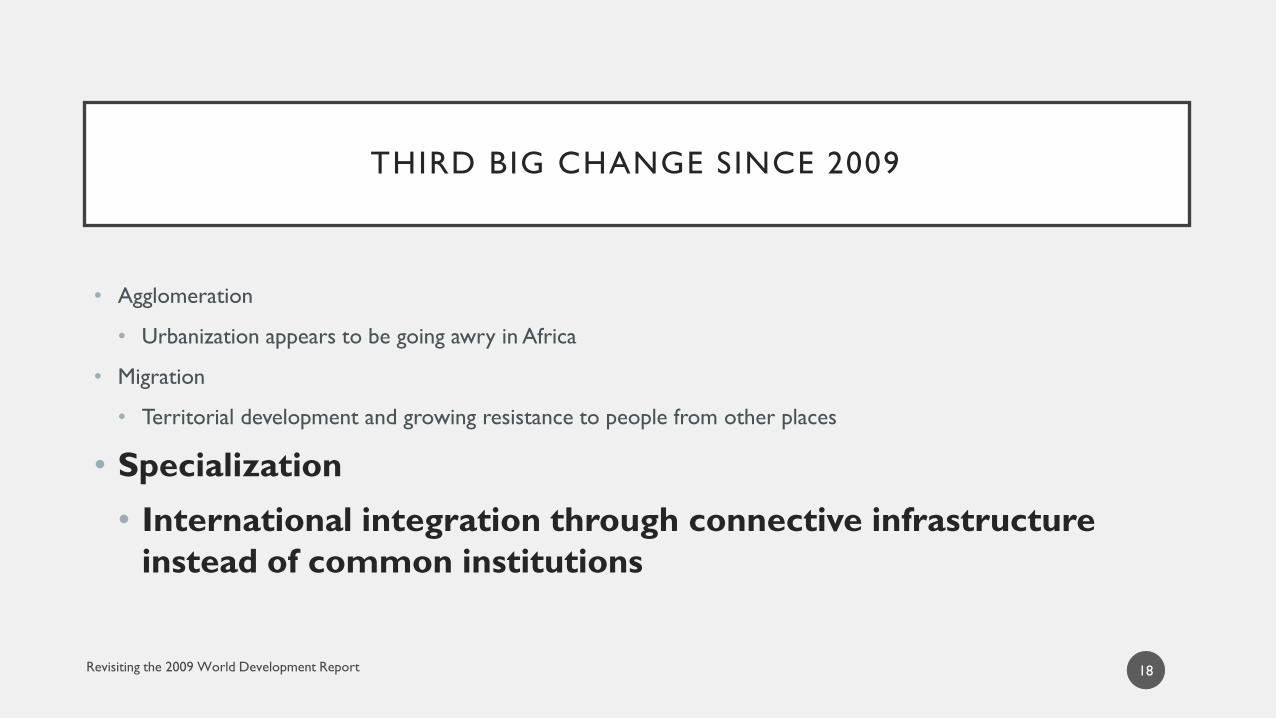
THIRD BIG CHANGE SINCE 2009
• Agglomeration
• Urbanization appears to be going awry in Africa
• Migration
• Territorial development and growing resistance to people from other places
• Specialization
• International integration through connective infrastructure
instead of common institutions
18

19
CHINA’S OVERSEAS PROJECTS
(A IDDATA, 2019)

The Belt and Road
Initiative
Somik V. LallGlobal Lead, Territorial Development, World Bank Group
GLED Talk @ World Bank, January 15 2019

21
BELT AND ROAD ECONOMICS @ THE WBG
•World Bank study on the Belt and Road Initiative (BRI)• 71 economies located along the Belt and Road
• BRI economies account for over 30% of global GDP, 60% of population, 40% of world trade
• Connectivity gaps in BRI economies• Economic effects of the BRI transportation infrastructure
• Complementary policies and institutions
•Spatial adjustments to external integration• Significant potential for welfare gains and reshaping economic geography …
• .. If BRI economies implement complementary domestic policies and investments that:
• Support trade facilitation
• Leverage agglomeration economies through territorial development policies
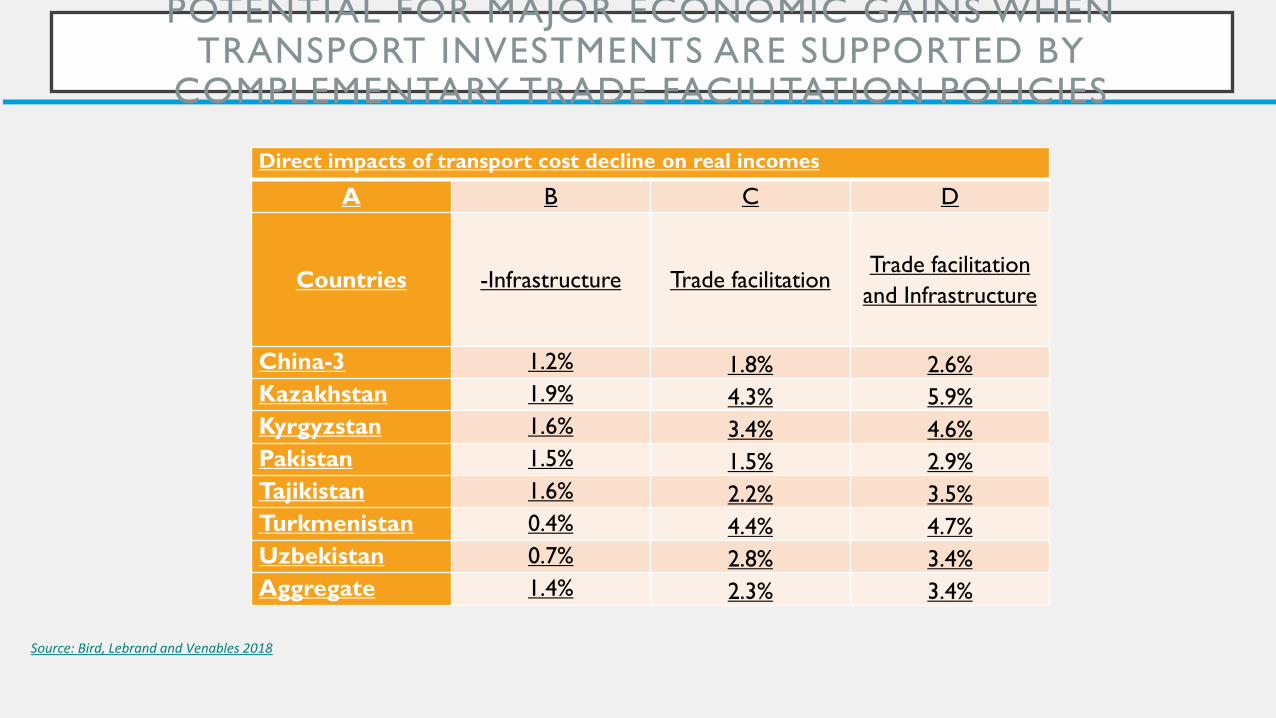
POTENTIAL FOR MAJOR ECONOMIC GAINS WHEN TRANSPORT INVESTMENTS ARE SUPPORTED BY
COMPLEMENTARY TRADE FACILITATION POLICIES
Direct impacts of transport cost decline on real incomes
A B C D
Countries -Infrastructure Trade facilitationTrade facilitation
and Infrastructure
China-3 1.2% 1.8% 2.6%
Kazakhstan 1.9% 4.3% 5.9%
Kyrgyzstan 1.6% 3.4% 4.6%
Pakistan 1.5% 1.5% 2.9%
Tajikistan 1.6% 2.2% 3.5%
Turkmenistan 0.4% 4.4% 4.7%
Uzbekistan 0.7% 2.8% 3.4%
Aggregate 1.4% 2.3% 3.4%
Source: Bird, Lebrand and Venables 2018
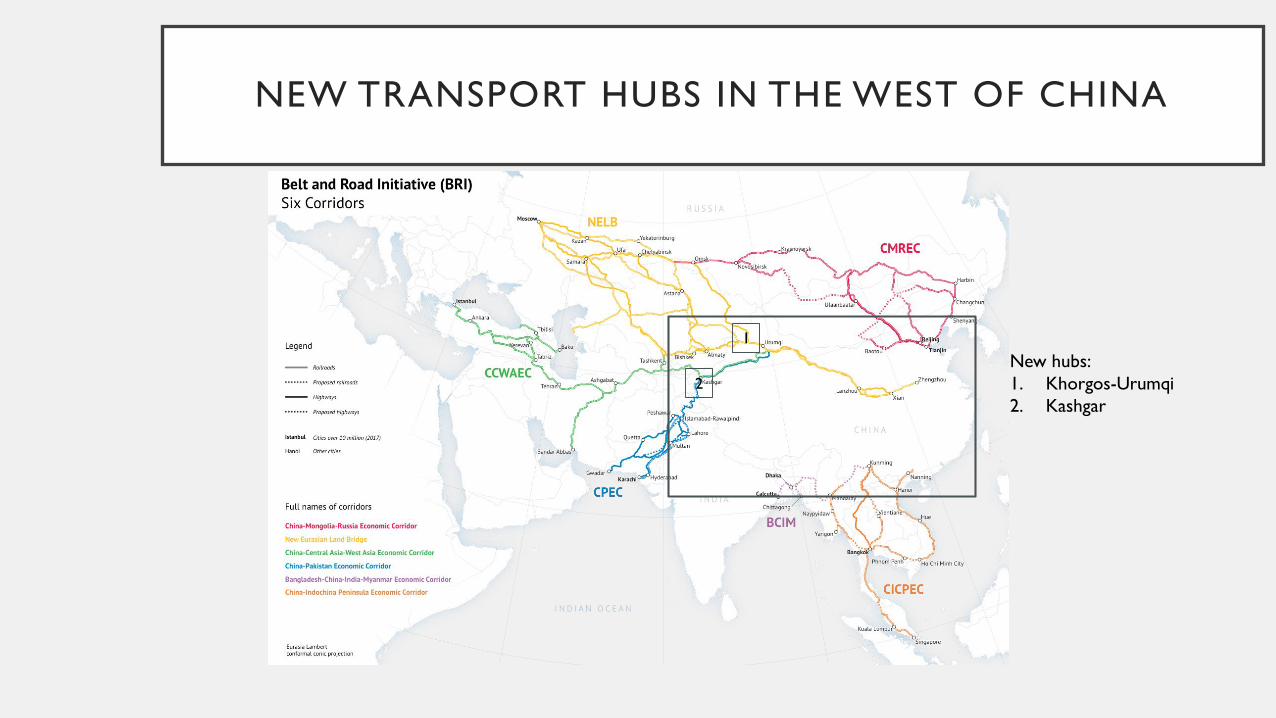
NEW TRANSPORT HUBS IN THE WEST OF CHINA
New hubs:
1. Khorgos-Urumqi
2. Kashgar
1
2
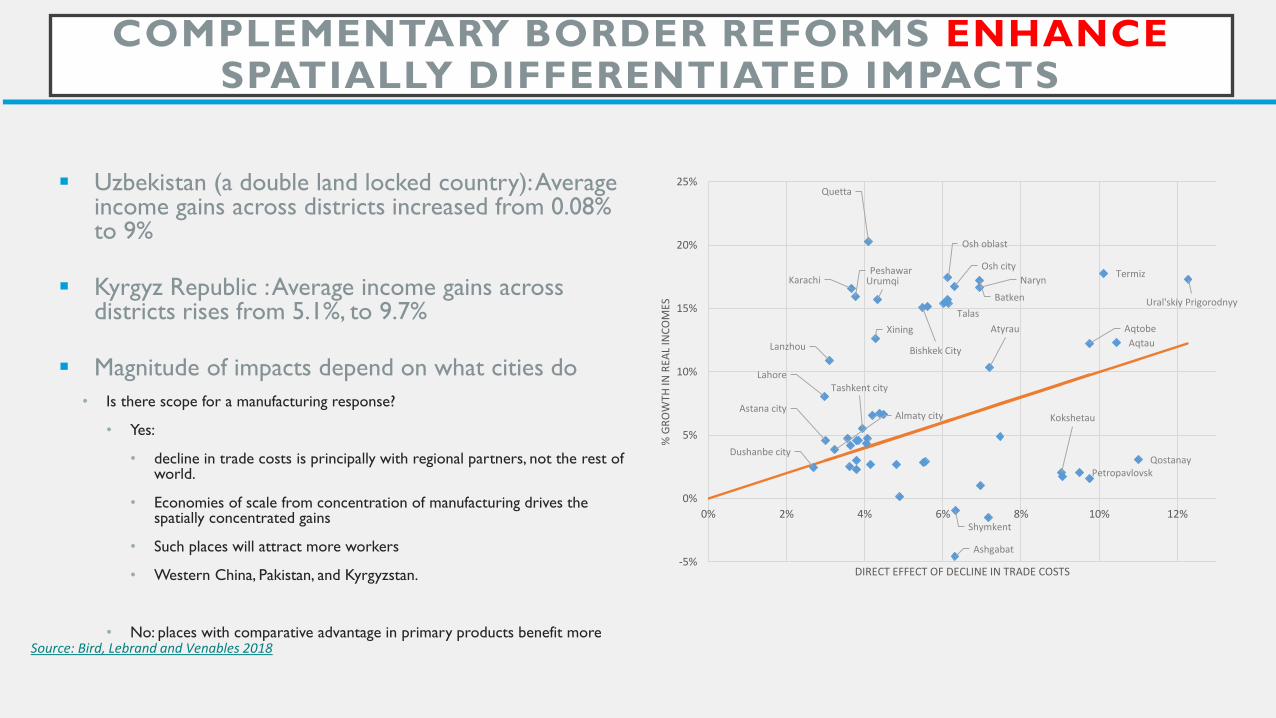
COMPLEMENTARY BORDER REFORMS ENHANCESPATIALLY DIFFERENTIATED IMPACTS
▪ Uzbekistan (a double land locked country): Average income gains across districts increased from 0.08% to 9%
▪ Kyrgyz Republic : Average income gains across districts rises from 5.1%, to 9.7%
▪ Magnitude of impacts depend on what cities do
• Is there scope for a manufacturing response?
• Yes:
• decline in trade costs is principally with regional partners, not the rest of world.
• Economies of scale from concentration of manufacturing drives the spatially concentrated gains
• Such places will attract more workers
• Western China, Pakistan, and Kyrgyzstan.
• No: places with comparative advantage in primary products benefit more
Lanzhou
Xining
Urumqi
AqtobeAtyrau
Aqtau
PetropavlovskQostanay
Shymkent
Ural'skiy Prigorodnyy
Astana cityKokshetauAlmaty city
Batken
Naryn
Talas
Bishkek City
Osh oblast
Osh city
Quetta
Peshawar
Lahore
Karachi
Dushanbe city
Ashgabat
Termiz
Tashkent city
-5%
0%
5%
10%
15%
20%
25%
0% 2% 4% 6% 8% 10% 12%
% G
RO
WTH
IN R
EAL
INC
OM
ES
DIRECT EFFECT OF DECLINE IN TRADE COSTS
Source: Bird, Lebrand and Venables 2018
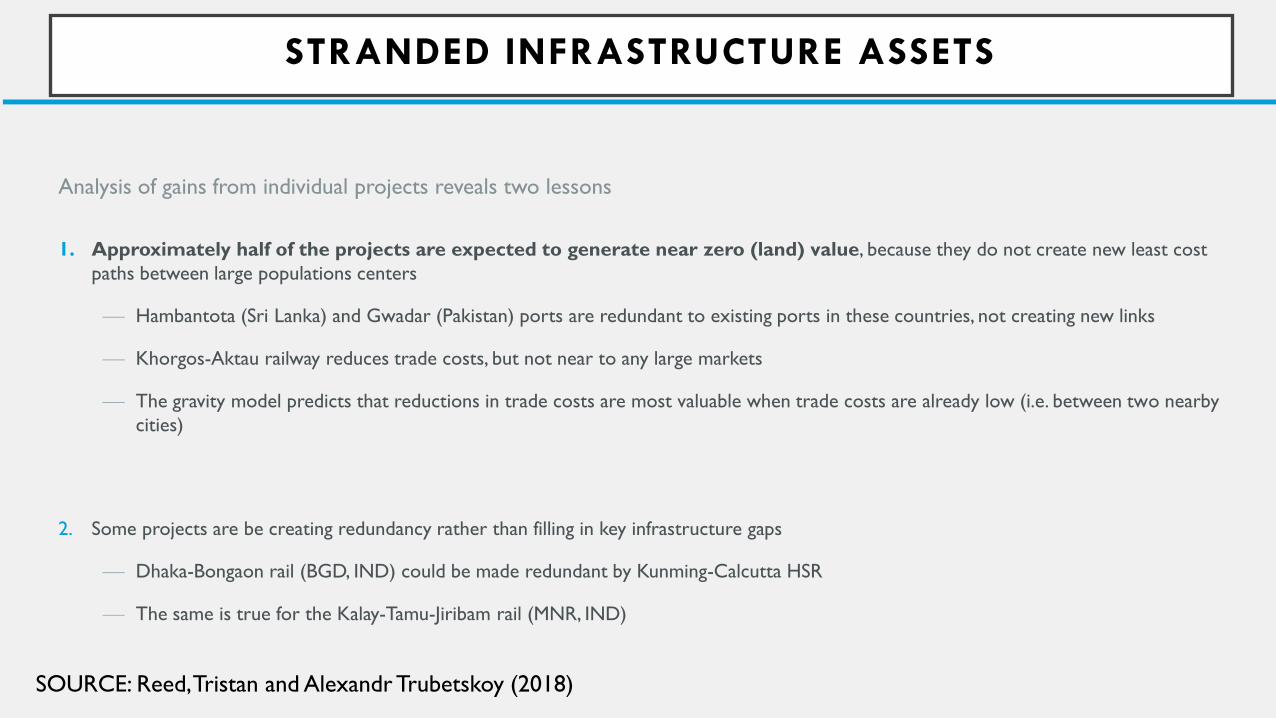
STRANDED INFRASTRUCTURE ASSETS
Analysis of gains from individual projects reveals two lessons
1. Approximately half of the projects are expected to generate near zero (land) value, because they do not create new least cost
paths between large populations centers
⎯ Hambantota (Sri Lanka) and Gwadar (Pakistan) ports are redundant to existing ports in these countries, not creating new links
⎯ Khorgos-Aktau railway reduces trade costs, but not near to any large markets
⎯ The gravity model predicts that reductions in trade costs are most valuable when trade costs are already low (i.e. between two nearby
cities)
2. Some projects are be creating redundancy rather than filling in key infrastructure gaps
⎯ Dhaka-Bongaon rail (BGD, IND) could be made redundant by Kunming-Calcutta HSR
⎯ The same is true for the Kalay-Tamu-Jiribam rail (MNR, IND)
SOURCE: Reed, Tristan and Alexandr Trubetskoy (2018)
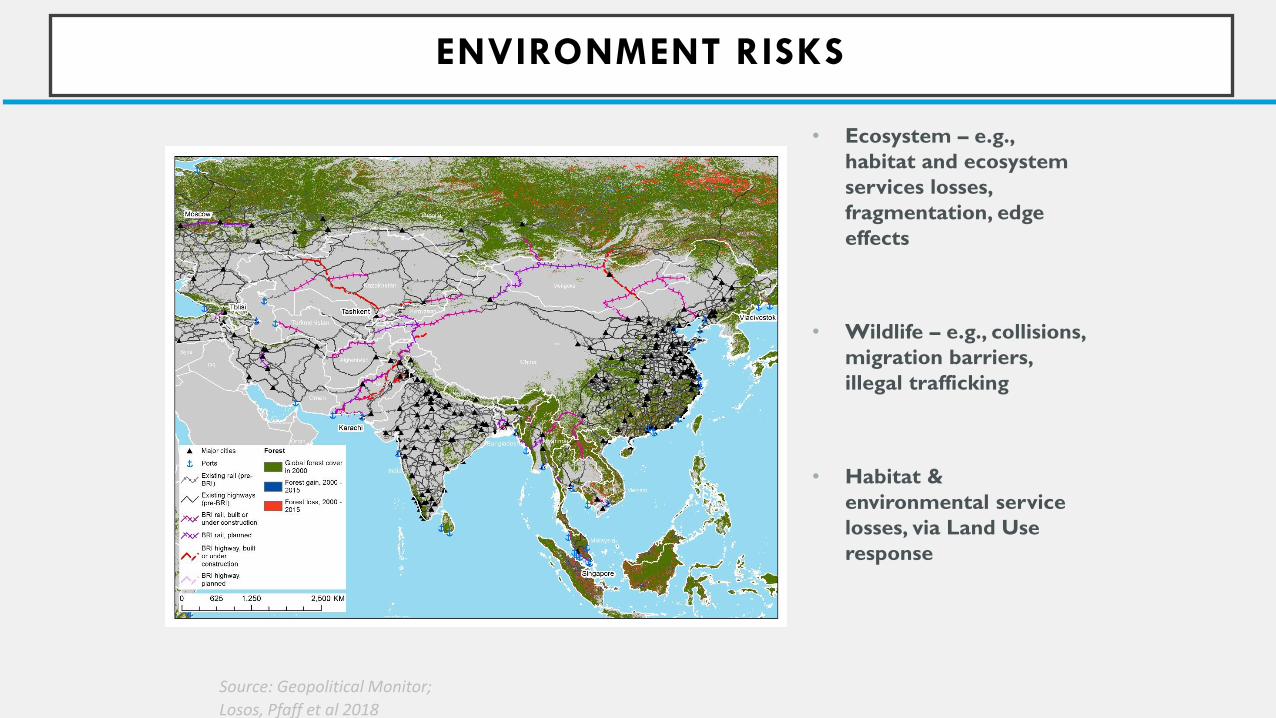
Source: Geopolitical Monitor;
Losos, Pfaff et al 2018
ENVIRONMENT RISKS
• Ecosystem – e.g.,
habitat and ecosystem
services losses,
fragmentation, edge
effects
• Wildlife – e.g., collisions,
migration barriers,
illegal trafficking
• Habitat &
environmental service
losses, via Land Use
response

SEEING AHEAD
Agglomeration and Density
Technology
01Migration andDistance
Politics
02Specialization and Division
Environment
03
27
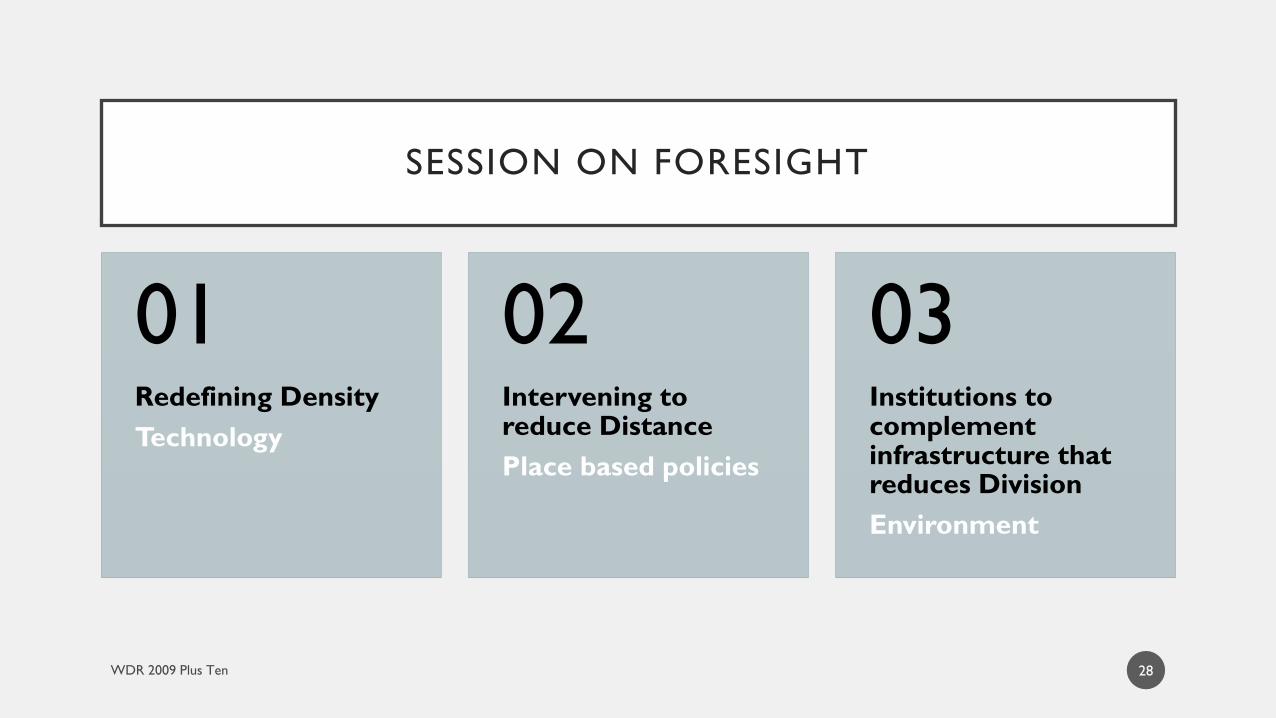
SESSION ON FORESIGHT
Redefining Density
Technology
01Intervening to reduce Distance
Place based policies
02Institutions to complement infrastructure that reduces Division
Environment
03
28

HTTPS://WWW.WORLDBANK.ORG/EN/EVENTS/2019/03/25/WORLD-
DEVELOPMENT-REPORT-2009-RESHAPING-ECONOMIC-GEOGRAPHY