Embed Size (px)
Citation preview
Economic Freedom and Emotional Well-Being
Boris Nikolaev* and Daniel L. Bennett# *Baylor University — USA, #Patrick Henry College** — USA
Abstract: We explore the relationship between emotional well-being and economic freedom. Us-
ing data for a sample of 12 countries from wave 2 of the World Value Survey (WVS) and the Economic Freedom of the World (EFW) index, we find that people living in more economi-cally free societies are more likely to report the presence of positive affect and absence of neg-ative affect. Specifically, people who live in countries with greater economic freedom are more likely to report feeling excited, accomplished, and on the top of the world. At the same time, they are less likely to report feeling pride, restlessness, loneliness, boredom, and being upset. These results are consistent with previous studies that find a positive association be-tween economic freedom and life satisfaction.
1. Introduction
Over the past several decades, a large theoretical and empirical literature has established that eco-nomic freedom—the mix of policies and institutions that emphasize the importance of personal freedom, voluntary exchange, protection of private property, and the freedom to enter markets and compete — is associated with many positive socio-economic out-comes. Some of these outcomes include faster economic growth, greater investment in physical and human capital, poverty reduction, lower unemploy-ment rates, and higher levels of social trust and toler-ance (see Hall and Lawson (2014) for a recent review of literature). Within this literature, a number of studies have explored the empirical link between eco-nomic freedom and subjective well-being (SWB) and found that people who live in countries with institu-tions consistent with the principles of economic free-dom are more likely to report higher levels of SWB
1 Diener (1984), for example, identifies three separate aspects of SWB: (1) life satisfaction (i.e., a person’s overall life evaluation at a point in time), (2) the presence of positive feelings or affect (i.e., positive emotions such as feelings of joy or sense of vitality), and (3) the absence of negative feelings or affect (i.e., feelings of
(Bjørnskov, Dreher, and Fischer, 2010; Gehring, 2013; Gropper, Lawson, and Thorne, 2011; Ott, 2010; Rode, 2013). Recent research has further highlighted that increases in economic freedom are strongly associ-ated with greater well-being at the U.S. state level (Belasen and Hafer, 2013).
Most of these studies, however, examine the effect of economic freedom on life satisfaction, which is a reflective assessment of one’s life that requires an ef-fort to remember and evaluate past experiences. Yet, psychologists often distinguish between two separate dimensions of SWB, namely, life evaluation and emotional well-being (Diener, 1984). The latter refers to the everyday positive and negative emotional states such as excitement, sadness, anger, stress, or loneliness that are experienced in real time and make one’s life pleasant or unpleasant.1 These different di-mensions of SWB are only weakly correlated, have
boredom, loneliness, etc.). The frequency with which a person ex-periences pleasant feelings such as excitement and joy could be entirely independent of the frequency with which a person expe-riences unpleasant feelings such as loneliness and boredom.
JRAP 47(1): 88-99. © 2017 MCRSA. All rights reserved.
Economic Freedom and Emotional Well-Being 89
different correlates in the circumstances of people’s lives, and the order of importance of the various di-mensions is unclear (Fitoussi, Sen, and Stiglitz, 2009; Kahneman and Deaton, 2010). In order to get a satis-factory appreciation of people’s quality of life, then, it is important to distinguish between these different aspects of SWB and understand their determinants.
This study endeavors to fill the gap in the eco-nomic freedom and happiness literature by examin-ing the relationship between economic freedom and emotional well-being measured by the self-reported presence of positive and negative affect or experi-ences of feeling or emotion. We make several contri-butions to the literature. First, we propose mecha-nisms through which economic freedom may affect emotional well-being. We argue that there are two channels through which economic freedom can affect people’s day-to-day emotional states and ultimately lead to higher levels of life satisfaction: socio-eco-nomic outcomes and procedural utility.
Second, this is the first study that we are aware of that empirically analyzes the relationship between economic freedom and emotional well-being. We take advantage of a module from wave 2 (1990-1994) of the World Values Surveys (WVS) that asks 15,000 respondents across a dozen countries (see Table 2 for a list of countries) to evaluate their recent emotional states such as feelings of excitement, boredom, and loneliness. We develop indices of positive and nega-tive affect and find that individuals living in coun-tries with greater economic freedom are more (less) likely to report feelings of positive (negative) affect. We also examine the correlation between economic freedom and eight individual measures of emotional well-being and find that individuals living in more economically free nations are more likely to report the presence of positive feelings such as accomplish-ment, excitement, and being on the top of the world. At the same time, they are less likely to report feelings of boredom, disappointment, loneliness, pride, and restlessness.
Overall, our results are consistent with previous studies that have found economic freedom contrib-utes to higher levels of life satisfaction and suggest a possible channel through which this positive associa-tion may work: the presence of positive day-to-day feelings and the absence of negative ones leaves peo-ple in more economically free societies more satisfied with their lives. Furthermore, the results remain after
2 In this section, we build on Nikolaev & Bennett (2016).
controlling for a large set of microeconomic variables, the level of economic development, and the inclusion of country and regional dummies. This suggests that the procedural well-being benefits of economic free-dom translate not just into better evaluation of one’s life, but also into greater day-to-day positive hedonic experiences.
The remainder of this paper is organized as fol-lows. Section 2 provides some theoretical considera-tions to motivate the analysis. The data are described in section 3, followed by the empirical results in sec-tion 4. Section 5 offers concluding remarks.
2. Theoretical considerations
We propose two possible channels through which economic freedom can influence emotional well-be-ing: socio-economic outcomes and procedural util-ity.2 The first channel likely affects SWB in an indirect manner, while the second one offers a more instru-mental SWB benefit to individuals.3
2.1. Socio-economic outcomes
A large theoretical and empirical literature has es-tablished a robust correlation between economic free-dom and many positive socio-economic outcomes such as higher income levels and faster economic growth (Bennett et al., 2017; De Haan, Lundström, & Sturm, 2006; Faria & Montesinos, 2009), poverty re-duction (Azman-Saini, Baharumshah, and Law, 2010), higher wages (Yankow, 2014), lower unem-ployment rates (Feldmann, 2007; Bennett, 2016), less income inequality (Bennett and Vedder, 2013), migra-tion patterns (Watkins and Yandle, 2010), and more entrepreneurial activity (Bjørnskov & Foss, 2008; Kreft & Sobel, 2005; Nyström, 2008; Hall et al., 2013). A recent special issue in the Journal of Regional Analy-sis & Policy (see Hall (2013)), highlights that many of these positive effects of economic freedom are robust at the US state level.” The underlying argument here is that institutions consistent with the principles of economic freedom provide incentives that encourage people to use their talents in a productive way (Baumol, 1990), which leads to higher levels of invest-ment in physical and human capital (Gwartney, Hol-combe, and Lawson, 2006; Hall, Sobel, and Crowley, 2010) and greater total factor productivity, promoting economic growth, job creation and higher standards of living.
3 For a more general theory of the relationship between economic freedom and life satisfaction at the meta level, see Gehring (2013) and Rode (2013).
90 Nikolaev and Bennett
Economic freedom therefore provides individuals with greater choice in terms of the goods and services available to them as well as over their careers. We hypothesize then that more choices on the product and labor markets will translate into more real oppor-tunities for self-actualization and self-expression. As a consequence, people will be more likely to feel ex-cited about potential opportunities (e.g., greater choice set of jobs) and to feel “on the top of the world” when they succeed in their endeavors. Furthermore, novelty is a major source of satisfaction (Scitovsky, 1976), and thus we expect that people in more eco-nomically free societies will be more stimulated and more frequently experience feelings of excitement and interest and less frequently feelings of boredom. In this sense, economic freedom offers indirect well-being benefits through economic development.
More importantly, however, higher economic re-wards may keep people hungry for greater success, especially if they believe in the procedural fairness of the system. While this could lead people to utilize their talents in a productive way by attaining higher levels of physical as well as human capital (e.g., pur-sue a higher education) and more often experience feelings of interest and achievement, it could also lead to escalated expectation and feelings of self-blame and regret, especially if individuals fail to achieve their goals (Schwartz, 2004). Higher material aspirations, for example, have been linked to lower happiness (Stutzer, 2004). In this case, higher levels of economic freedom may lead to more frequent feel-ings of disappointment. For example, even if more choices present valuable alternatives, people can still feel disappointed because of the perception that they are missing out on highly valuable (alternative) op-portunities. Escalated expectations may also cause people to be more critical of each other’s work and lead to feelings of discouragement.
Furthermore, people do not evaluate their lives in isolation—they restlessly compare themselves with one another (Duesenberry, 1949; Frank, 1999; Scitovsky, 1976; Veblen, 1899). Status concerns may lead to positional arms races that can lower the over-all welfare of society (Frank, 1999, 2005; Layard, 1980). If more economically free societies offer higher economic rewards, they may set the benchmark for social comparison higher, which can lead to more fre-quent feelings of restlessness and less frequent feel-ings of pride even if individuals are able to accom-plish more in absolute terms.
Finally, it has also been suggested that economic freedom is linked to higher levels of social trust (Berggren and Jordahl, 2006) and tolerance (Berggren
and Nilsson, 2013). Free markets, for example, pro-vide incentives for people to be more inclusive and less discriminatory, especially in the labor and prod-uct markets, and cultivate an environment of peace-fulness (De Soysa and Fjelde, 2010). Thus, people in more economically free societies will be more likely to feel connected with each other, which can translate to less frequent feelings of loneliness. On the other hand, the opportunity cost of spending time with friends and family could be larger as more people dedicate their limited time and resources to fulfill their individualistic aspirations (e.g., pursue their dream career), which can produce feelings of remote-ness, especially in the domain of family life.
2.2. Procedural utility
While individuals derive utility from outcomes, they also care about the processes that lead to these outcomes (Frey, Benz, and Stutzer, 2004; Frey and Stutzer, 2010). In this respect, the mix of policies and institutions that determines the level of economic freedom in a country can provide an independent source of utility, procedural utility, because they not only lead to specific socio-economic outcomes, but also determine how these outcomes are achieved. Re-cent research, for example, suggests that individuals who live in more economically free countries are more likely to report greater perception of procedural fairness, social mobility, and freedom of choice (Bjørnskov, Dreher, Fischer, Schnellenbach, and Gehring, 2013; Nikolaev and Bennett, 2016).
One explanation is that people value freedom in-trinsically because it allows them to act in a deliber-ate, conscious, and purposeful manner, which is one of the most fundamental human needs. By empha-sizing the importance of personal choice and volun-tary exchange, economic freedom allows individuals to maximize their potential through exercising their autonomy and self-expression. Being able to freely choose a course of action, even if it leads to failure, can produce greater feelings of self-worth, pride, and accomplishment. The work of Csikszentmihalyi (1991), for example, suggests that the highest feeling of personal happiness is achieved when a person is in a state of “flow” or otherwise in a self-selected task or activity. Similarly, Inglehart et al. (2008) and Verme (2009) argue that the perception of freedom of choice is one of the most important determinants of SWB.
In contrast, suppressing individual choice by plac-ing more power into a centralized decision-making body such as government may have disturbing con-sequences for individual self-esteem and self-worth. A person who receives government benefits may less
Economic Freedom and Emotional Well-Being 91
frequently experience feelings of pride and accom-plishment than someone who earns his or her income through their own efforts. Yet, living in an uncertain world in which more responsibility is placed on the individual may lead to greater feelings of restless-ness, since competitive markets are dynamic and characterized by creative destruction (Schumpeter, 1942). Uncertainty is most unpleasant when it ex-tends over a long and indeterminate period that leads to a lack of control (Scitovsky, 1976). Recent research, however, indicates that people who live in more eco-nomically free countries experience greater percep-tion of control over their lives than people who live in less economically free societies (Nikolaev and Ben-nett, 2016; Pitlik and Rode, 2016).
Moreover, institutions provide established rules and norms that influence how people treat their
fellow citizens. Economic freedom creates an inclu-sive environment of greater tolerance, social trust, and peacefulness, which are important determinants of SWB. Importantly, this is achieved not through cen-tralized decision making and planned order, but through freedom of choice, voluntary exchange, and spontaneous order. Thus, even if the end result is the same — e.g., minority groups are not discriminated against in the market place — the process that gener-ates this outcome may provide a separate source of utility, especially if individuals believe that it is fair.
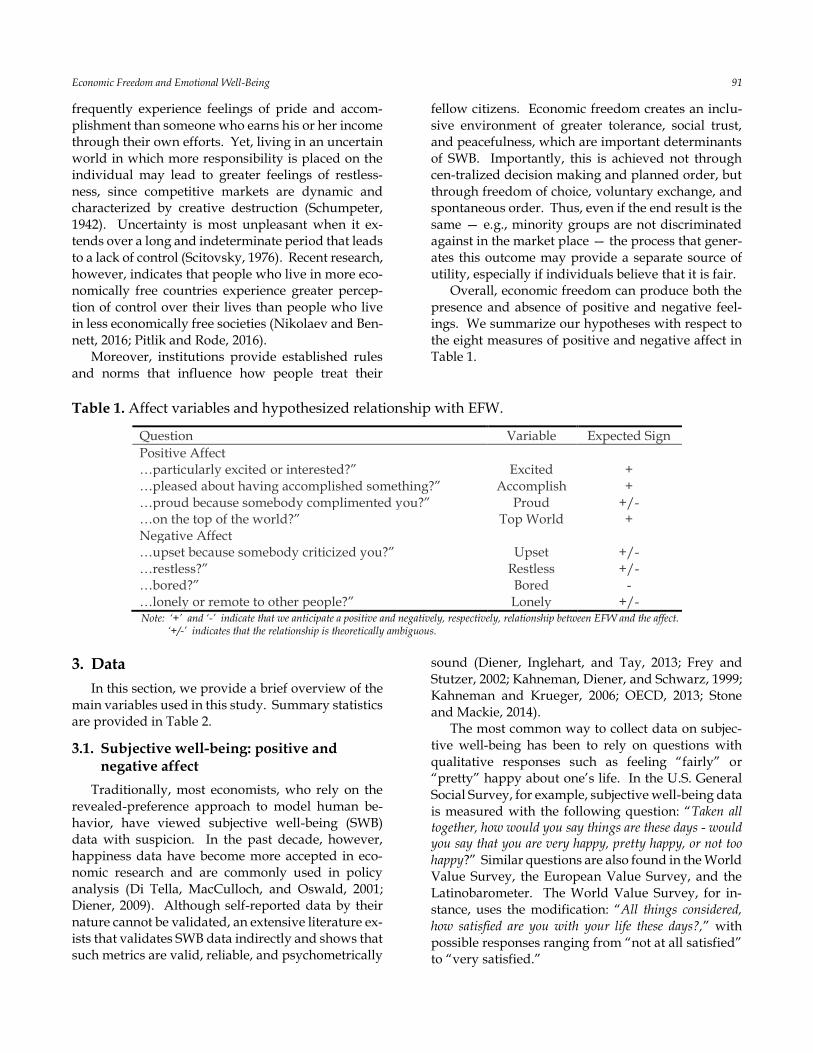
Overall, economic freedom can produce both the presence and absence of positive and negative feel-ings. We summarize our hypotheses with respect to the eight measures of positive and negative affect in Table 1.
Table 1. Affect variables and hypothesized relationship with EFW.
Question Variable Expected Sign
Positive Affect …particularly excited or interested?” Excited + …pleased about having accomplished something?” Accomplish + …proud because somebody complimented you?” Proud +/- …on the top of the world?” Top World + Negative Affect …upset because somebody criticized you?” Upset +/- …restless?” Restless +/- …bored?” Bored - …lonely or remote to other people?” Lonely +/-
Note: ‘+’ and ‘-’ indicate that we anticipate a positive and negatively, respectively, relationship between EFW and the affect. ‘+/-’ indicates that the relationship is theoretically ambiguous.
3. Data
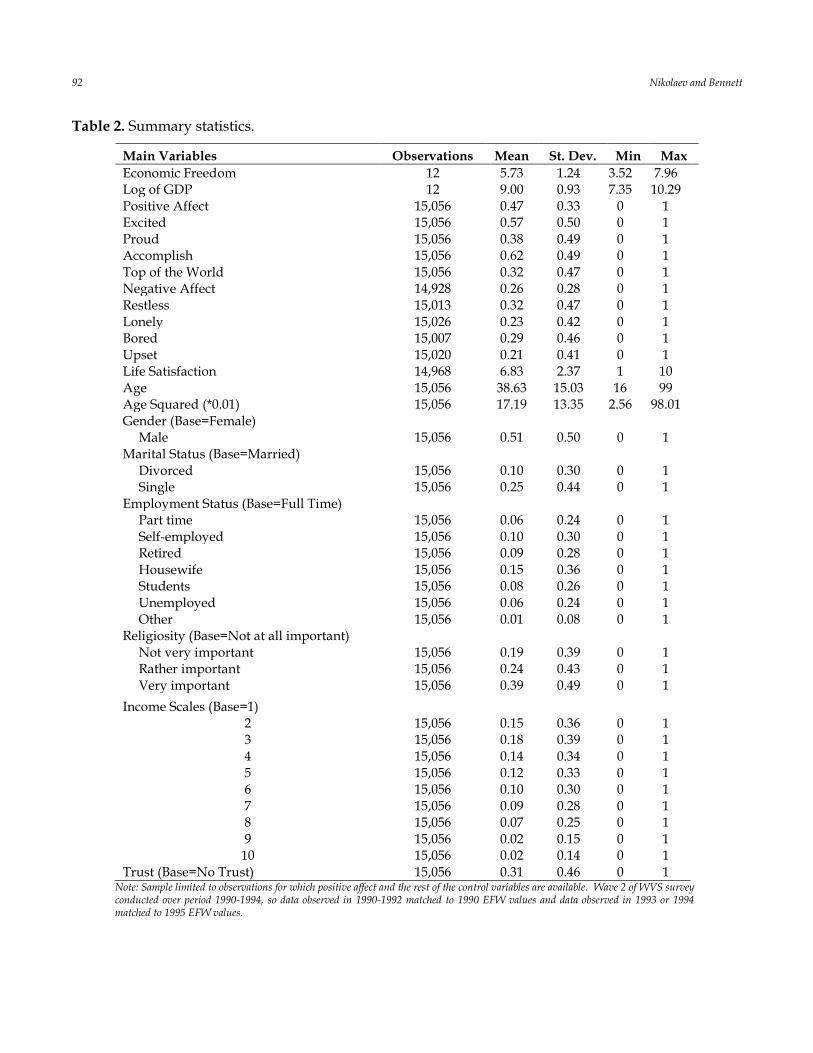
In this section, we provide a brief overview of the main variables used in this study. Summary statistics are provided in Table 2.
3.1. Subjective well-being: positive and negative affect
Traditionally, most economists, who rely on the revealed-preference approach to model human be-havior, have viewed subjective well-being (SWB) data with suspicion. In the past decade, however, happiness data have become more accepted in eco-nomic research and are commonly used in policy analysis (Di Tella, MacCulloch, and Oswald, 2001; Diener, 2009). Although self-reported data by their nature cannot be validated, an extensive literature ex-ists that validates SWB data indirectly and shows that such metrics are valid, reliable, and psychometrically
sound (Diener, Inglehart, and Tay, 2013; Frey and Stutzer, 2002; Kahneman, Diener, and Schwarz, 1999; Kahneman and Krueger, 2006; OECD, 2013; Stone and Mackie, 2014).
The most common way to collect data on subjec-tive well-being has been to rely on questions with qualitative responses such as feeling “fairly” or “pretty” happy about one’s life. In the U.S. General Social Survey, for example, subjective well-being data is measured with the following question: “Taken all together, how would you say things are these days - would you say that you are very happy, pretty happy, or not too happy?” Similar questions are also found in the World Value Survey, the European Value Survey, and the Latinobarometer. The World Value Survey, for in-stance, uses the modification: “All things considered, how satisfied are you with your life these days?,” with possible responses ranging from “not at all satisfied” to “very satisfied.”
92 Nikolaev and Bennett
Table 2. Summary statistics.
Main Variables Observations Mean St. Dev. Min Max
Economic Freedom 12 5.73 1.24 3.52 7.96 Log of GDP 12 9.00 0.93 7.35 10.29 Positive Affect 15,056 0.47 0.33 0 1 Excited 15,056 0.57 0.50 0 1 Proud 15,056 0.38 0.49 0 1 Accomplish 15,056 0.62 0.49 0 1 Top of the World 15,056 0.32 0.47 0 1 Negative Affect 14,928 0.26 0.28 0 1 Restless 15,013 0.32 0.47 0 1 Lonely 15,026 0.23 0.42 0 1 Bored 15,007 0.29 0.46 0 1 Upset 15,020 0.21 0.41 0 1 Life Satisfaction 14,968 6.83 2.37 1 10 Age 15,056 38.63 15.03 16 99 Age Squared (*0.01) 15,056 17.19 13.35 2.56 98.01 Gender (Base=Female)
Male 15,056 0.51 0.50 0 1 Marital Status (Base=Married)
Divorced 15,056 0.10 0.30 0 1 Single 15,056 0.25 0.44 0 1
Employment Status (Base=Full Time) Part time 15,056 0.06 0.24 0 1 Self-employed 15,056 0.10 0.30 0 1 Retired 15,056 0.09 0.28 0 1 Housewife 15,056 0.15 0.36 0 1 Students 15,056 0.08 0.26 0 1 Unemployed 15,056 0.06 0.24 0 1 Other 15,056 0.01 0.08 0 1
Religiosity (Base=Not at all important) Not very important 15,056 0.19 0.39 0 1 Rather important 15,056 0.24 0.43 0 1 Very important 15,056 0.39 0.49 0 1
Income Scales (Base=1)
2 15,056 0.15 0.36 0 1 3 15,056 0.18 0.39 0 1 4 15,056 0.14 0.34 0 1 5 15,056 0.12 0.33 0 1 6 15,056 0.10 0.30 0 1 7 15,056 0.09 0.28 0 1 8 15,056 0.07 0.25 0 1 9 15,056 0.02 0.15 0 1
10 15,056 0.02 0.14 0 1 Trust (Base=No Trust) 15,056 0.31 0.46 0 1
Note: Sample limited to observations for which positive affect and the rest of the control variables are available. Wave 2 of WVS survey conducted over period 1990-1994, so data observed in 1990-1992 matched to 1990 EFW values and data observed in 1993 or 1994 matched to 1995 EFW values.
Economic Freedom and Emotional Well-Being 93
This type of approach, however, measures how people evaluate their life as a whole rather than their current feelings. Thus, it reflects an evaluative judg-ment in which past and present life circumstances as well as expectations for the future play a role. Emo-tional well-being, on the other hand, is measured in real time (or shortly after an event has occurred) and measures the presence or absence of pleasant and unpleasant feelings. Because of their relatively high cost, data on emotional well-being are far less com-mon than life-evaluation surveys, although this does not necessarily imply that they are less preferred or useful. The two most common measures are the Ex-perience Sampling and the Day Reconstruction Method, but neither one has been applied to a repre-sentative portion of the population (Fitoussi et al., 2009).
To test our hypotheses, we utilize a special mod-ule from wave 2 (1990-1994) of the WVS that asks re-spondents to evaluate their positive and negative af-fect with the following question: “We are interested in the way people are feeling these days. During the past few weeks, did you ever feel ___?” We are particularly inter-ested in responses to the questions indicated in Table 1. Each question was dichotomous, so yes responses are coded as 1 and no responses as 0. Following Kahneman and Deaton (2010), we create positive and negative affect composite measures by taking the av-erage of the first and last four responses, respectively.
3.2. Economic freedom
Our measure of economic freedom is the widely used Economic Freedom of the World (EFW) index,
which measures the degree to which a country’s in-stitutions and policies are consistent with personal choice, voluntary exchange, open markets, and protection of persons and their property from aggressors. It is comprised of 42 variables derived from publically available sources such as the World Bank, International Monetary Fund, and the Global Competitiveness Report. Each variable is trans-formed to a 0-10 scale increasing in freedom and as-signed to 1 of 5 major areas: (1) size of government; (2) legal system and property rights; (3) sound money; (4) freedom to trade internationally; and (5) regulation of credit, labor, and business. Each area score equals the average of its components, and the composite EFW index represents the average of the five areas (Gwartney, Lawson, and Hall, 2012). The EFW data are available very five years prior to 2000, so we match the WVS variables to the closest (+/- 2 years) EFW country-year observation.
3.3. Control variables
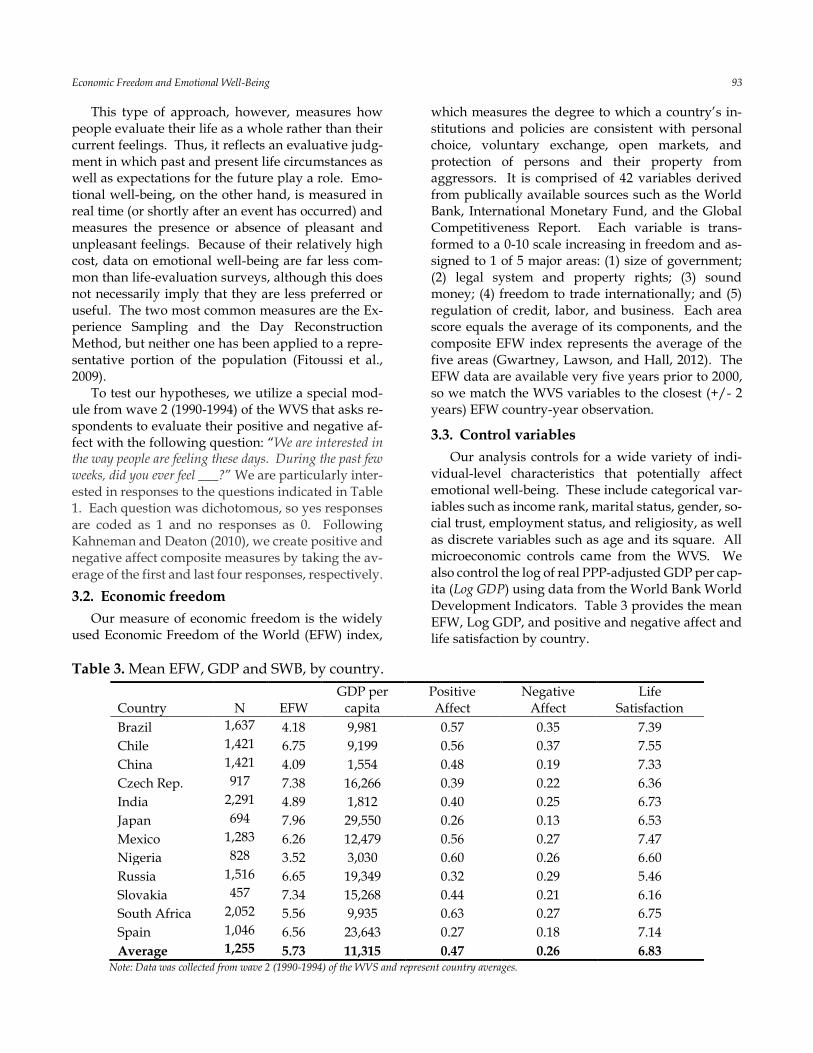
Our analysis controls for a wide variety of indi-vidual-level characteristics that potentially affect emotional well-being. These include categorical var-iables such as income rank, marital status, gender, so-cial trust, employment status, and religiosity, as well as discrete variables such as age and its square. All microeconomic controls came from the WVS. We also control the log of real PPP-adjusted GDP per cap-ita (Log GDP) using data from the World Bank World Development Indicators. Table 3 provides the mean EFW, Log GDP, and positive and negative affect and life satisfaction by country.
Table 3. Mean EFW, GDP and SWB, by country.
Country
N
EFW GDP per
capita Positive Affect
Negative Affect
Life Satisfaction
Brazil 1,637 4.18 9,981 0.57 0.35 7.39
Chile 1,421 6.75 9,199 0.56 0.37 7.55
China 1,421 4.09 1,554 0.48 0.19 7.33
Czech Rep. 917 7.38 16,266 0.39 0.22 6.36
India 2,291 4.89 1,812 0.40 0.25 6.73
Japan 694 7.96 29,550 0.26 0.13 6.53
Mexico 1,283 6.26 12,479 0.56 0.27 7.47
Nigeria 828 3.52 3,030 0.60 0.26 6.60
Russia 1,516 6.65 19,349 0.32 0.29 5.46
Slovakia 457 7.34 15,268 0.44 0.21 6.16
South Africa 2,052 5.56 9,935 0.63 0.27 6.75
Spain 1,046 6.56 23,643 0.27 0.18 7.14
Average 1,255 5.73 11,315 0.47 0.26 6.83 Note: Data was collected from wave 2 (1990-1994) of the WVS and represent country averages.
94 Nikolaev and Bennett
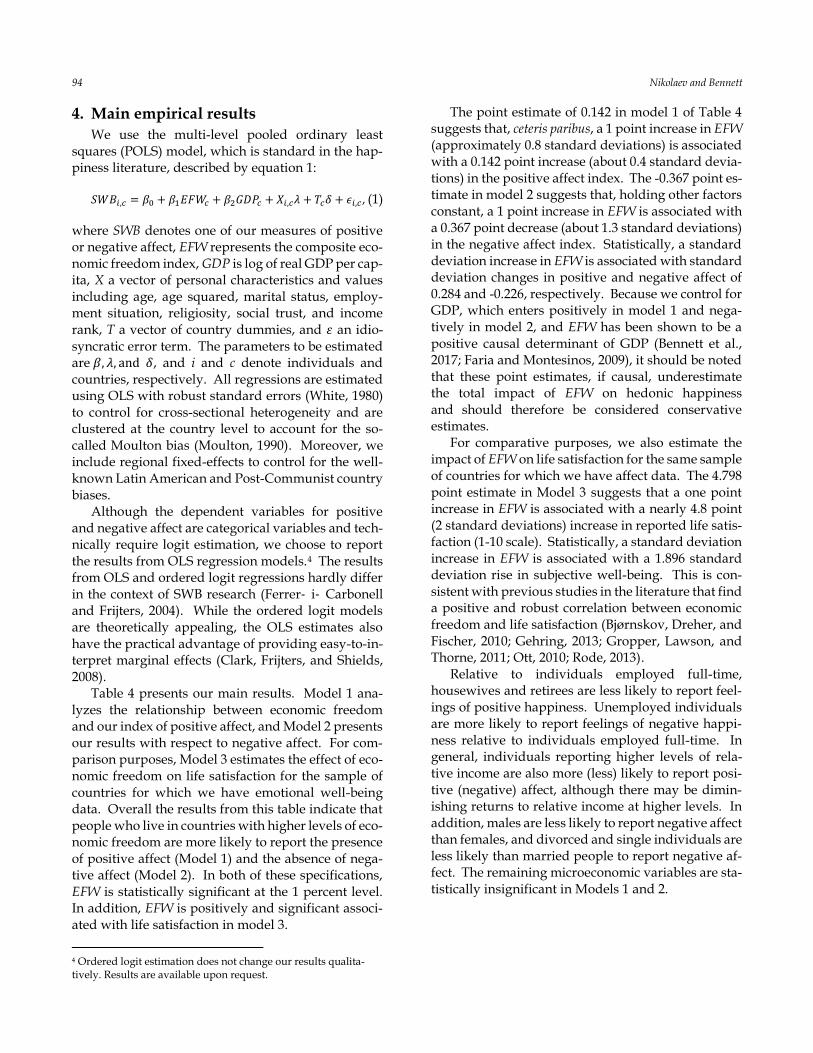
4. Main empirical results
We use the multi-level pooled ordinary least squares (POLS) model, which is standard in the hap-piness literature, described by equation 1:
𝑆𝑊𝐵𝑖,𝑐 = 𝛽0 + 𝛽1𝐸𝐹𝑊𝑐 + 𝛽2𝐺𝐷𝑃𝑐 + 𝑋𝑖,𝑐𝜆 + 𝑇𝑐𝛿 + 𝜖𝑖,𝑐 , (1)
where SWB denotes one of our measures of positive or negative affect, EFW represents the composite eco-nomic freedom index, GDP is log of real GDP per cap-ita, X a vector of personal characteristics and values including age, age squared, marital status, employ-ment situation, religiosity, social trust, and income rank, T a vector of country dummies, and 휀 an idio-syncratic error term. The parameters to be estimated are 𝛽, 𝜆, and 𝛿, and i and c denote individuals and countries, respectively. All regressions are estimated using OLS with robust standard errors (White, 1980) to control for cross-sectional heterogeneity and are clustered at the country level to account for the so-called Moulton bias (Moulton, 1990). Moreover, we include regional fixed-effects to control for the well-known Latin American and Post-Communist country biases.
Although the dependent variables for positive and negative affect are categorical variables and tech-nically require logit estimation, we choose to report the results from OLS regression models.4 The results from OLS and ordered logit regressions hardly differ in the context of SWB research (Ferrer‐ i‐ Carbonell and Frijters, 2004). While the ordered logit models are theoretically appealing, the OLS estimates also have the practical advantage of providing easy-to-in-terpret marginal effects (Clark, Frijters, and Shields, 2008).
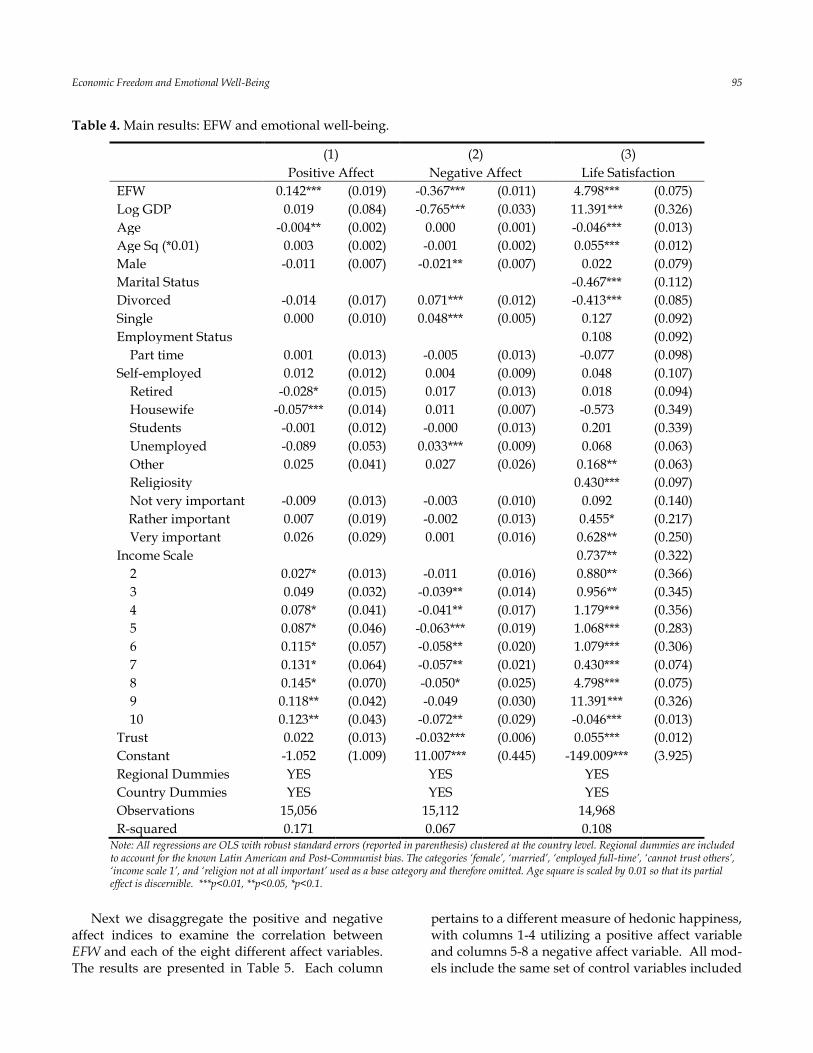
Table 4 presents our main results. Model 1 ana-lyzes the relationship between economic freedom and our index of positive affect, and Model 2 presents our results with respect to negative affect. For com-parison purposes, Model 3 estimates the effect of eco-nomic freedom on life satisfaction for the sample of countries for which we have emotional well-being data. Overall the results from this table indicate that people who live in countries with higher levels of eco-nomic freedom are more likely to report the presence of positive affect (Model 1) and the absence of nega-tive affect (Model 2). In both of these specifications, EFW is statistically significant at the 1 percent level. In addition, EFW is positively and significant associ-ated with life satisfaction in model 3.
4 Ordered logit estimation does not change our results qualita-tively. Results are available upon request.
The point estimate of 0.142 in model 1 of Table 4 suggests that, ceteris paribus, a 1 point increase in EFW (approximately 0.8 standard deviations) is associated with a 0.142 point increase (about 0.4 standard devia-tions) in the positive affect index. The -0.367 point es-timate in model 2 suggests that, holding other factors constant, a 1 point increase in EFW is associated with a 0.367 point decrease (about 1.3 standard deviations) in the negative affect index. Statistically, a standard deviation increase in EFW is associated with standard deviation changes in positive and negative affect of 0.284 and -0.226, respectively. Because we control for GDP, which enters positively in model 1 and nega-tively in model 2, and EFW has been shown to be a positive causal determinant of GDP (Bennett et al., 2017; Faria and Montesinos, 2009), it should be noted that these point estimates, if causal, underestimate the total impact of EFW on hedonic happiness and should therefore be considered conservative estimates.
For comparative purposes, we also estimate the impact of EFW on life satisfaction for the same sample of countries for which we have affect data. The 4.798 point estimate in Model 3 suggests that a one point increase in EFW is associated with a nearly 4.8 point (2 standard deviations) increase in reported life satis-faction (1-10 scale). Statistically, a standard deviation increase in EFW is associated with a 1.896 standard deviation rise in subjective well-being. This is con-sistent with previous studies in the literature that find a positive and robust correlation between economic freedom and life satisfaction (Bjørnskov, Dreher, and Fischer, 2010; Gehring, 2013; Gropper, Lawson, and Thorne, 2011; Ott, 2010; Rode, 2013).
Relative to individuals employed full-time, housewives and retirees are less likely to report feel-ings of positive happiness. Unemployed individuals are more likely to report feelings of negative happi-ness relative to individuals employed full-time. In general, individuals reporting higher levels of rela-tive income are also more (less) likely to report posi-tive (negative) affect, although there may be dimin-ishing returns to relative income at higher levels. In addition, males are less likely to report negative affect than females, and divorced and single individuals are less likely than married people to report negative af-fect. The remaining microeconomic variables are sta-tistically insignificant in Models 1 and 2.
Economic Freedom and Emotional Well-Being 95
Table 4. Main results: EFW and emotional well-being.
(1) (2) (3)
Positive Affect Negative Affect Life Satisfaction
EFW 0.142*** (0.019) -0.367*** (0.011) 4.798*** (0.075)
Log GDP 0.019 (0.084) -0.765*** (0.033) 11.391*** (0.326)
Age -0.004** (0.002) 0.000 (0.001) -0.046*** (0.013)
Age Sq (*0.01) 0.003 (0.002) -0.001 (0.002) 0.055*** (0.012)
Male -0.011 (0.007) -0.021** (0.007) 0.022 (0.079)
Marital Status -0.467*** (0.112)
Divorced -0.014 (0.017) 0.071*** (0.012) -0.413*** (0.085)
Single 0.000 (0.010) 0.048*** (0.005) 0.127 (0.092)
Employment Status 0.108 (0.092)
Part time 0.001 (0.013) -0.005 (0.013) -0.077 (0.098)
Self-employed 0.012 (0.012) 0.004 (0.009) 0.048 (0.107)
Retired -0.028* (0.015) 0.017 (0.013) 0.018 (0.094)
Housewife -0.057*** (0.014) 0.011 (0.007) -0.573 (0.349)
Students -0.001 (0.012) -0.000 (0.013) 0.201 (0.339)
Unemployed -0.089 (0.053) 0.033*** (0.009) 0.068 (0.063)
Other 0.025 (0.041) 0.027 (0.026) 0.168** (0.063)
Religiosity 0.430*** (0.097)
Not very important -0.009 (0.013) -0.003 (0.010) 0.092 (0.140)
Rather important 0.007 (0.019) -0.002 (0.013) 0.455* (0.217)
Very important 0.026 (0.029) 0.001 (0.016) 0.628** (0.250)
Income Scale 0.737** (0.322)
2 0.027* (0.013) -0.011 (0.016) 0.880** (0.366)
3 0.049 (0.032) -0.039** (0.014) 0.956** (0.345)
4 0.078* (0.041) -0.041** (0.017) 1.179*** (0.356)
5 0.087* (0.046) -0.063*** (0.019) 1.068*** (0.283)
6 0.115* (0.057) -0.058** (0.020) 1.079*** (0.306)
7 0.131* (0.064) -0.057** (0.021) 0.430*** (0.074)
8 0.145* (0.070) -0.050* (0.025) 4.798*** (0.075)
9 0.118** (0.042) -0.049 (0.030) 11.391*** (0.326)
10 0.123** (0.043) -0.072** (0.029) -0.046*** (0.013)
Trust 0.022 (0.013) -0.032*** (0.006) 0.055*** (0.012)
Constant -1.052 (1.009) 11.007*** (0.445) -149.009*** (3.925)
Regional Dummies YES YES YES Country Dummies YES YES YES Observations 15,056 15,112 14,968 R-squared 0.171 0.067 0.108
Note: All regressions are OLS with robust standard errors (reported in parenthesis) clustered at the country level. Regional dummies are included to account for the known Latin American and Post-Communist bias. The categories ‘female’, ‘married’, ‘employed full-time’, ‘cannot trust others’, ‘income scale 1’, and ‘religion not at all important’ used as a base category and therefore omitted. Age square is scaled by 0.01 so that its partial effect is discernible. ***p<0.01, **p<0.05, *p<0.1.
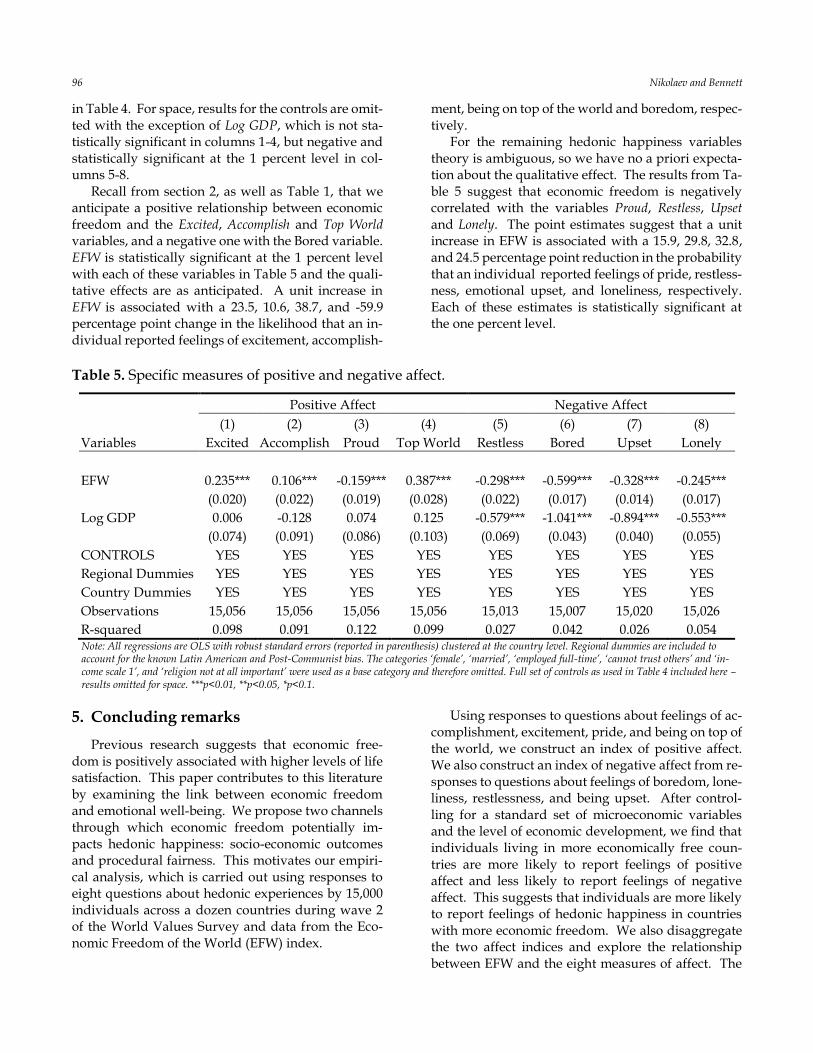
Next we disaggregate the positive and negative
affect indices to examine the correlation between EFW and each of the eight different affect variables. The results are presented in Table 5. Each column
pertains to a different measure of hedonic happiness, with columns 1-4 utilizing a positive affect variable and columns 5-8 a negative affect variable. All mod-els include the same set of control variables included
96 Nikolaev and Bennett
in Table 4. For space, results for the controls are omit-ted with the exception of Log GDP, which is not sta-tistically significant in columns 1-4, but negative and statistically significant at the 1 percent level in col-umns 5-8.
Recall from section 2, as well as Table 1, that we anticipate a positive relationship between economic freedom and the Excited, Accomplish and Top World variables, and a negative one with the Bored variable. EFW is statistically significant at the 1 percent level with each of these variables in Table 5 and the quali-tative effects are as anticipated. A unit increase in EFW is associated with a 23.5, 10.6, 38.7, and -59.9 percentage point change in the likelihood that an in-dividual reported feelings of excitement, accomplish-
ment, being on top of the world and boredom, respec-tively.
For the remaining hedonic happiness variables theory is ambiguous, so we have no a priori expecta-tion about the qualitative effect. The results from Ta-ble 5 suggest that economic freedom is negatively correlated with the variables Proud, Restless, Upset and Lonely. The point estimates suggest that a unit increase in EFW is associated with a 15.9, 29.8, 32.8, and 24.5 percentage point reduction in the probability that an individual reported feelings of pride, restless-ness, emotional upset, and loneliness, respectively. Each of these estimates is statistically significant at the one percent level.
Table 5. Specific measures of positive and negative affect.
Positive Affect Negative Affect
(1) (2) (3) (4) (5) (6) (7) (8)
Variables Excited Accomplish Proud Top World Restless Bored Upset Lonely
EFW 0.235*** 0.106*** -0.159*** 0.387*** -0.298*** -0.599*** -0.328*** -0.245***
(0.020) (0.022) (0.019) (0.028) (0.022) (0.017) (0.014) (0.017)
Log GDP 0.006 -0.128 0.074 0.125 -0.579*** -1.041*** -0.894*** -0.553***
(0.074) (0.091) (0.086) (0.103) (0.069) (0.043) (0.040) (0.055)
CONTROLS YES YES YES YES YES YES YES YES
Regional Dummies YES YES YES YES YES YES YES YES
Country Dummies YES YES YES YES YES YES YES YES
Observations 15,056 15,056 15,056 15,056 15,013 15,007 15,020 15,026
R-squared 0.098 0.091 0.122 0.099 0.027 0.042 0.026 0.054 Note: All regressions are OLS with robust standard errors (reported in parenthesis) clustered at the country level. Regional dummies are included to account for the known Latin American and Post-Communist bias. The categories ‘female’, ‘married’, ‘employed full-time’, ‘cannot trust others’ and ‘in-come scale 1’, and ‘religion not at all important’ were used as a base category and therefore omitted. Full set of controls as used in Table 4 included here – results omitted for space. ***p<0.01, **p<0.05, *p<0.1.
5. Concluding remarks
Previous research suggests that economic free-dom is positively associated with higher levels of life satisfaction. This paper contributes to this literature by examining the link between economic freedom and emotional well-being. We propose two channels through which economic freedom potentially im-pacts hedonic happiness: socio-economic outcomes and procedural fairness. This motivates our empiri-cal analysis, which is carried out using responses to eight questions about hedonic experiences by 15,000 individuals across a dozen countries during wave 2 of the World Values Survey and data from the Eco-nomic Freedom of the World (EFW) index.
Using responses to questions about feelings of ac-complishment, excitement, pride, and being on top of the world, we construct an index of positive affect. We also construct an index of negative affect from re-sponses to questions about feelings of boredom, lone-liness, restlessness, and being upset. After control-ling for a standard set of microeconomic variables and the level of economic development, we find that individuals living in more economically free coun-tries are more likely to report feelings of positive affect and less likely to report feelings of negative affect. This suggests that individuals are more likely to report feelings of hedonic happiness in countries with more economic freedom. We also disaggregate the two affect indices and explore the relationship between EFW and the eight measures of affect. The
Economic Freedom and Emotional Well-Being 97
results suggest that individuals living in countries with higher levels of economic freedom are more likely to report feelings of accomplishment, excite-ment, and being on top of the world. They are also less likely to report feelings of boredom, loneliness, pride, restlessness, and being upset.
Although our results are generally consistent with previous research that has found a positive link be-tween economic freedom and subjective well-being, there are three main limitations. First, the results are based on cross-sectional data for a dozen countries during the early 1990s. If people adapt rapidly to their new environment, then cross-sectional data may overstate the long-run effect of economic freedom on emotional well-being (Frey and Stutzer, 2010). Ad-ditionally, the limited sample size and period suggest that the results are not generalizable. Second is the possibility of omitted variable bias. We attempt to minimize this by including a standard set of microe-conomic controls used in happiness research, fixed country and regional effects, and the level of eco-nomic development. Lastly, our results cannot be in-terpreted as causal, as it is possible that economic freedom is endogenous; however, as Gehring (2013) points out, there is no psychological theory sugges-tive that happier people have preference for eco-nomic freedom. On the contrary, previous empirical research suggests that the relationship runs from for-mal institutions to happiness (Verme, 2009). In addi-tion, Rode (2013) provides evidence of a causal chan-nel from economic freedom to well-being.
Additional research on the relationship between economic freedom and hedonic happiness will be possible as a survey and field data become available for a greater number of countries over time. Because economic freedom is a complex concept that is com-prised of a large number of institutional and policy variables, it would also be instructive for policy anal-ysis to explore how various aspects of economic free-dom are related to emotional well-being. The current paper, however, contributes to the growing literature on the link between institutions and happiness that views hedonic experiences, and not just life evalua-tion, as fundamental to our understanding of the causes and correlates of well-being.
References
Azman-Saini, W., A.Z. Baharumshah, and S.H. Law. 2010. Foreign direct investment, economic freedom and economic growth: International evidence. Economic Modelling 27(5): 1079-1089.
Baumol, W.J. 1990. Entrepreneurship: Productive, unproductive, and destructive. The Journal of Political Economy 98(5): 893-921.
Belasen, A.R., and R.W. Hafer. 2013. Do changes in economic freedom affect well-being? Journal of Regional Analysis and Policy 43 (1):56-64
Bennett, D.L. 2016. Subnational economic freedom and performance in the United States and Can-ada. Cato Journal 36(1): 165-185.
Bennett, D., H. Faria, J. Gwartney, and D. Morales. 2017. Economic institutions and comparative economic development: A post-colonial perspective. World Development 96: 503-519.
Bennett, D., and R. Vedder (2013). A dynamic analysis of economic freedom and income inequality in the 50 US states: Empirical evidence of a parabolic relationship. Journal of Regional Analysis & Policy 43(1): 42-55.
Berggren, N., and H. Jordahl. 2006. Free to trust: Economic freedom and social capital. Kyklos 59(2): 141-169.
Berggren, N., and T. Nilsson. 2013. Does economic freedom foster tolerance? Kyklos 66(2), 177-207.
Bjørnskov, C., A. Dreher, and J.A. Fischer. 2010. Formal institutions and subjective well-being: Revisiting the cross-country evidence. European Journal of Political Economy 26(4), 419-430.
Bjørnskov, C., A. Dreher, J.A. Fischer, J. Schnellenbach, and K. Gehring. 2013. Inequality and happiness: When perceived social mobility and economic reality do not match. Journal of Economic Behavior & Organization 91: 75-92.
Bjørnskov, C., and N.J. Foss. 2008. Economic freedom and entrepreneurial activity: Some cross-country evidence. Public Choice 134(34): 307-328.
Clark, A.E., P. Frijters, and M.A. Shields. 2008. Relative income, happiness, and utility: An explanation for the Easterlin paradox and other puzzles. Journal of Economic Literature 46(1): 95-144.
Csikszentmihalyi, M. 1991. Flow: The psychology of optimal experience (Vol. 41). New York: Harper Perennial.
De Haan, J., S. Lundström, and J.-E. Sturm. 2006. Market-oriented institutions and policies and economic growth: A critical survey. Journal of Economic Surveys 20(2): 157-191.
De Soysa, I., and H. Fjelde. 2010. Is the hidden hand an iron fist? Capitalism and civil peace, 1970-2005. Journal of Peace Research 47(3): 287-298.
98 Nikolaev and Bennett
Di Tella, R., R.J. MacCulloch, and A.J. Oswald. 2001. Preferences over inflation and unemployment: Evidence from surveys of happiness. American Economic Review 91(1): 335-341.
Diener, E. 1984. Subjective well-being. Psychological Bulletin 95(3): 542-575.
Diener, E. 2009. Well-being for public policy. New York: Oxford University Press.
Diener, E., R. Inglehart, and L. Tay. 2013. Theory and validity of life satisfaction scales. Social Indicators Research 112(3): 497-527.
Duesenberry, J.S. 1949. Income, saving, and the theory of consumer behavior. Cambridge: Harvard University Press.
Faria, H.J., and H.M. Montesinos. 2009. Does economic freedom cause prosperity? An IV approach. Public Choice 141(1): 103-127.
Feldmann, H. 2007. Economic freedom and unemployment around the world. Southern Economic Journal 74(1): 158-176.
Ferrer‐ i‐ Carbonell, A., and P. Frijters. 2004. How Important is Methodology for the estimates of the determinants of Happiness?. The Economic Journal 114(497): 641-659.
Fitoussi, J.-P., A. Sen, and J. Stiglitz. 2009. Report by the commission on the measurement of economic performance and social progress. The Commission on the Measurement of Economic Performance and Social Progress. Accessed Aug 22, 2016: http://www.insee.fr/fr/publications-et-services/dossiers_ web/stiglitz/doc-commission/RAPPORT_anglais.pdf.
Frank, R.H. 1999. Luxury fever: Money and happiness in an era of excess. Princeton , NJ: Princeton University Press.
Frank, R.H. 2005. Positional externalities cause large and preventable welfare losses. American Economic Review:Papers & Proceedings 95(2): 137-141.
Frey, B., M. Benz, and A. Stutzer. 2004. Introducing procedural utility: Not only what, but also how matters. Journal of Institutional and Theoretical Economics (JITE)/Zeitschrift für die gesamte Staatswissenschaft 160(3): 377-401.
Frey, B., and A. Stutzer. 2002. What can economists learn from happiness research? Journal of Economic Literature 40(2): 402-435.
Frey, B., and A. Stutzer. 2010. Happiness and economics: How the economy and institutions affect human well-being. Princeton, NJ: Princeton University Press.
Gehring, K. 2013. Who benefits from economic freedom? Unraveling the effect of economic freedom on subjective well-being. World Development 50: 74-90.
Gropper, D.M., R.A. Lawson, and J.T. Thorne. 2011. Economic freedom and happiness. Cato Journal 31(2): 237-255.
Gwartney, J., R. Lawson, and J. Hall. 2012. Economic Freedom of the World: 2012 Annual Report. Vancouver, Canada: Fraser Institute.
Gwartney, J., R.G. Holcombe, and R.A. Lawson. 2006. Institutions and the Impact of Investment on Growth. Kyklos 59(2): 255-273.
Hall, J. (2013). Economic Freedom and Regional Economics: An Introduction to a Special Issue. Journal of Regional Analysis & Policy 43(1):1-2
Hall, J.C., and R.A. Lawson. 2014. Economic freedom of the world: An accounting of the literature. Contemporary Economic Policy 32(1): 1-19.
Hall, J.C, B. Nikolaev, J.M Pulito, and B.J. Van Metre 2013. The effect of personal and economic free-dom on entrepreneurial activity: evidence from a new state level freedom index. American Journal of Entrepreneurship 6(1): 88-103.
Hall, J.C., R.S. Sobel, and G.R. Crowley. 2010. Institutions, capital, and growth. Southern Economic Journal 77(2): 385-405.
Inglehart, R., R. Foa, C. Peterson, and C. Welzel. 2008. Development, freedom, and rising happiness: A global perspective (1981–2007). Perspectives on Psychological Science 3(4): 264-285.
Kahneman, D., and A. Deaton. 2010. High income improves evaluation of life but not emotional well-being. Proceedings of the National Academy of Sciences 107(38), 16489-16493.
Kahneman, D., E. Diener, and N. Schwarz (eds). 1999. Well-being: Foundations of Hedonic Psychology. New York, NY: Russell Sage Foundation.
Kahneman, D., and A.B. Krueger. 2006. Developments in the measurement of subjective well-being. The Journal of Economic Perspectives 20(1): 3-24.
Kreft, S.F., and R.S. Sobel. 2005. Public policy, entrepreneurship, and economic freedom. Cato Journal 25(3): 595-616.
Layard, R. 1980. Human satisfactions and public policy. The Economic Journal 90(360): 737-750.
Moulton, B.R. 1990. An illustration of a pitfall in estimating the effects of aggregate variables on micro units. The Review of Economics and Statistics 72(2): 334-338.
Economic Freedom and Emotional Well-Being 99
Nikolaev, B., and D. Bennett. 2016. Give me liberty and give me control: Economic freedom, control perceptions and the paradox of choice. European Journal of Political Economy 45(S): 39-52.
Nyström, K. 2008. The institutions of economic freedom and entrepreneurship: evidence from panel data. Public Choice 136(3-4): 269-282.
OECD. 2013. OECD Guidelines on Measuring Subjective Well-being: OECD Publishing. Accessed Aug 22, 2016: http://www.oecd.org/statistics/Guidelines%20on%20Measuring%20Subjective%20Well-being.pdf.
Ott, J.C. 2010. Good governance and happiness in nations: Technical quality precedes democracy and quality beats size. Journal of Happiness Studies 11(3): 353-368.
Pitlik, H., and M. Rode. 2016. Free to choose? Eco-nomic freedom, relative income, and life control perceptions. International Journal of Well-Being, 6(1): 81-100.
Rode, M. 2013. Do good institutions make citizens happy, or do happy citizens build better institutions? Journal of Happiness Studies 14(5): 1479-1505.
Schumpeter, J. 1942. Creative destruction. Capitalism, socialism and democracy: 82-85
Schwartz, B. 2004. The Paradox of Choice: Why More is Less. New York, NY: Ecco.
Scitovsky, T. 1976. The joyless economy: An inquiry into human satisfaction and consumer dissatisfaction. Revised Edition. New York, NY: Oxford University Press.
Stone, A.A., and C. Mackie (eds). 2014. Subjective well-being: Measuring happiness, suffering, and other dimensions of experience: Washington, DC: National Academies Press.
Stutzer, A. 2004. The role of income aspirations in individual happiness. Journal of Economic Behavior & Orgranization 54 (1): 89-109.
Veblen, T. 1899. The theory ofthe leisure class. New York, NY: The New American Library.
Verme, P. 2009. Happiness, freedom and control. Journal of Economic Behavior & Organization 71(2): 146-161.
Watkins, T., and B. Yandle. 2010. Can Freedom and Knowledge Economy Indexes Explain Go-Getter Migration Patterns? Journal of Regional Analysis & Policy 40(2):104-114.
White, H. 1980. A heteroskedasticity-consistent covariance matrix estimator and a direct test for heteroskedasticity. Econometrica: Journal of the Econometric Society 48(4): 817-838.
Yankow, J.J. 2014. A longitudinal analysis of the im-pact of state economic freedom on individual wages. Journal of Regional Analysis & Policy 44(1): 58-70.