Embed Size (px)
Citation preview
V Economic-Financial Relations with the International Community 77
Economic-Financial Relations with the International Community
Foreign Trade Policy
In 2011, the foreign trade policy was guided by two major guidelines: the reinforcement of instruments for commercial protection and stimulus to innovation and national production, aiming to increase the country’s industrial competitiveness in both domestic and foreign markets, an initiative materialized in the Greater Brazil Plan (PBM).
The PBM was established by Decree no. 7,540, dated August 2, 2011, in compliance with the governmental policy of boosting and strengthening the national industry, implemented in May, 2008, through the so-called Productive Development Policy (PDP). The PBM goals are to increase the competitiveness of national goods and services, focusing on the areas of international trade, protection of domestic industry and market, and investment and innovation. Measures concerning the international trade were established with the following purposes:i) Tax relief on exports;ii) Commercial protection;iii) Financing and guaranteeing exports;iv) Commercial promotion.
In the scope of these measures, Provisional Measure no. 540, dated August 2, 2011, converted into Law no. 12,546, dated December 14, established the Reintegra in order to refund values related to residual tax costs. The producer (legal person) who exports manufactured goods in the country will be allowed to calculate the value eligible for the partial or total compensation of residual taxes in the productive chain. This value will be calculated through a percentage established by the Executive Branch on the income associated with exports, varying from zero to 3%, and being differentiated by economic sector and activity category.
This Reintegra regime was regulated by Decree no. 7,633, dated December 1. As a rule, the products for which the costs of imported inputs are not higher than 40% of the export price may be benefi ted, but for high tech goods (pharmaceuticals; machinery, apparatuses and electrical and electronic appliances; airplanes; instruments, apparatuses; clock making) the limit reaches 65%. Products imported with the aim of
V
78 Boletim do Banco Central do Brasil – Annual Report 2011
being re-exported by Brazilian companies are not subject to this system. In addition, inputs imported from the member states of the Southern Common Market (Mercosur) that complies with the origin requirements of the economic bloc will be considered as national inputs for the application of the Reintegra. This regulation also deals with the establishment of a technical group, consisting of the Ministry of Finance and the Ministry of Development, Industry and Foreign Trade (MDIC), whose mission will be to study occasional proposals for changing the refund percentage, the maximum percentage of imported inputs and the list of eligible goods. This system will be effective up to December 31, 2012.
Another PBM initiative, established by Provisional Measure no. 540, dated August 2, converted into Law no. 12,546, dated December 14, was the reduction, from 20% to zero, up to December 2012, of the employer’s contribution on the payroll in the textile, footwear, furniture and software segments, and the implementation of a contribution on revenues of those companies. The rate of 2.5% was defi ned for the software segment, and 1.5% for the other segments. The loss of RGPS’s revenues consequent upon these changes shall be offset with funds provided by the National Treasury. The same regulation determined the gradual reduction, of twelve months, in July of 2011, for immediate appropriation, in July 2012, of the deadline for the refund of the PIS/Cofi ns credits related to capital goods.
Still in the PBM scope, the following commercial protection measures were also announced: reduction, from 15 to 10 months, of the maximum deadline for antidumping investigations, safeguards and compensatory measures, and from 240 to 120 days for the application of provisional rights. Furthermore, it is noteworthy the additional efforts for fi ghting against circumvention (triangulation from which the product is sold by a country, having been produced in another country), false declaration of origin, sub-invoiced products, illegal imports and violation of industrial property.
Commercial protection was defi ned as one of the major foreign trade policy goals throughout the year, by means of several initiatives in this area. The Inter-ministerial Ordinance of the Secretariat of the Federal Revenue of Brazil (RFB) and MDIC no. 149, dated June 16, of the Intelligence Group on Foreign Trade (GI-CEX) allowed the easy identifi cation of administrative instruments of each entity, thus guaranteeing greater effi ciency in the fi ght against disloyal and illegal foreign trade practices. An innovative measure to improve the system of commercial protection with the aim of monitoring the infl ow of goods and avoid anticipated purchases by importers is the inclusion of the product in non-automatic licensing as of the moment in which an antidumping investigation is opened. Other initiative for the cooperation between the two entities was implemented by the Ordinance RFB no. 3,011, dated June 30, authorizing the exchange of data, from the Federal Revenue to the Foreign Trade Secretariat (Secex), in order to analyze requirements to open investigations for extending antidumping measures.
V Economic-Financial Relations with the International Community 79
Moreover, the full-margin was adopted for the calculation of antidumping measures, instead of the Management Executive Committee (Gecex) of the Foreign Trade Council (Camex) guideline suggesting to adopt the rule of the lowest right in effect since 2007. So far, Brazil had opted to impose a surcharge enough to compensate the damage, and the adoption of the full-margin is expected to increase the surcharges applied.
The retroactive charge of antidumping and compensatory rights was established by Camex Resolution no. 64, dated September 14. This regulation authorized the levying of taxes on imported products up to ninety days before the date of the application of provisional antidumping measures. This charge aims to avoid the accumulation of stocks in the period immediately after the beginning of investigations of disloyal commercial practices. The retroactive antidumping right is accepted by the World Trade Organization (WTO) and the Brazilian legislation.
At the end of 2011, a total of 84 antidumping rights, one price commitment and one safeguard measure, related to 52 products associated with 25 countries or blocs took place, with emphasis on those related to China, U.S. and India. It s worth mentioning that the Secex Ordinance no. 39, dated November 11, improved the criteria for the opening of investigation about the fulfi llment of rules established by the Brazilian legislation, and the fi rst investigations about circumvention were opened in the year.
In May, the government decided to apply the non-automatic licensing for the imports of new automotive vehicles. In the scope of the PBM, Provisional Measure no. 540, dated August 2, converted into Law no. 12,546, dated December 14, established a new system for the automotive sector with tax incentives for stimulating investments, value aggregation, employment generation and technological innovation. This regulation was dealt with by Decree no. 7,567, dated September 15. IPI was exempted for vehicles with minimum regional content of 65% in at least 6 of the 11 productive stages in the country, and investment of 0.5% of total gross income on sales of goods and services in research and technological innovation, effective up to December 31, 2012. IPI on vehicles imported from Mercosur member states and Mexico remained unchanged, as long as manufacturers held a plant installed in Brazil. Later on, the Brazilian Government extended, in compliance with the Brazil-Uruguay Automotive Agreement, the benefi ts of the IPI reduction on vehicles from the neighboring country. In view of the Decision of the Supreme Federal Court, stating that the rule would be effective after 90 days, it was established the Decree no. 7,604, dated November 10, which altered the beginning of the IPI increase, effective as of December 16.
In the scope of the Mercosur, the Brazilian government proposed the improvement of the Import Tax tariff structure, including the establishment of a mechanism that would allow tax increases. In the Council’s Meeting of the Mercosur Common Market in Montevideo, held on December 20, through the Decision no. 39/2011, it was implemented a mechanism allowing member states of this economic bloc to increase, temporarily,
80 Boletim do Banco Central do Brasil – Annual Report 2011
import tax rates. This mechanism is an instrument parallel to the List of Exception to the Common External Tariff (TEC), with the difference that TEC rates can be reduced or increased. Each country will be allowed to include one hundred new tariff codes of the Common Mercosur Nomenclature (NCM) apart from those included in the List of Exception, in order to raise rates included in the TEC of the Mercosur for products imported from non member countries.
In the scope of the commercial promotion, the Ata-Carnet came into force through the publication of Decree no. 7,545, dated August 2, 2011. This is a convention that makes it easy the circulation of goods under the regime of temporary admission with no taxes being charged. Additionally, it was reinforced the strategy of commercial promotion by overriding products/services in selected markets.
Regarding the fi nancing and guarantees for exports, it was determined the creation of the Export Financing Fund (FFEX), a fund of private nature established by the Banco do Brasil for companies with revenues up to R$60 million. The Federal Government was authorized by Provisional Measure no. 541, dated August 2, converted into the Law no. 12,545, dated December 14, to initially participate with R$1 billion, but other companies may participate in the fund, which will be also supported by earnings associated with the Proex-Financing.
Furthermore, it was implemented by the BNDES and Banco do Brasil the computerization of the process to issue the Credit Insurance to the Export Guarantee Fund (FGE) Policy. In the case of Proex Equalization operations, the defi nition of reference spreads shall be automatically approved for the exports of goods and services. The FGE will have a revolving ceiling of US$50 million concerning the exports of manufactured products.
With regard to measures aimed to fi nance exports, the Secex Ordinance no. 42, dated December 7, extended the utilization of the Export Financing Program (Proex) for operations carried out through the Simplifi ed Export Declaration (DSE), limited to the value of US$50 thousand. To obtain this fi nancing, it is necessary to fi ll in the Credit Registration (RC) in the Integrated Foreign Trade System (Siscomex), regardless of the Export Registration (RE). When fi nancing is approved by the Banco do Brasil, exporters are only required to present a copy of the DSE and documents related to the shipment of goods in order to release the loan.
Proex operations totaled US$4.1 billion in 2011, of which US$635 million related to fi nancing and US$3.5 billion to interest rates equalization. Funds allocated under the fi nancing modality increased 24.3% as compared to the previous year, while the number of operations decreased from 1,478 to 1,354, and the total of exporters participating in the program decreased from 371 to 312.
V Economic-Financial Relations with the International Community 81
The main economic sectors that took advantage of the Proex-Financing in 2011 were the agribusiness, 58% of total; the segments of textile, leather and footwear, 24%; and machinery and equipment, 9%. The main countries of destination of exports were Cuba, 45% of total; China, 10%; and France, 7%.
Funds allocated to the equalization modality registered stability in the year, while the issue of securities related to operations of interest rates equalization totaled US$185 million, rising 56.6% as compared to 2010. In the year, 2,531 operations were carried out by 34 exporters, as against 2,657 operations carried out by 31 companies in the previous year.
The sectoral analysis reveals that exports involving this modality were focused on machinery and equipment, accounting for 70%, followed by transportation equipment industry, 22%. The main regions of destination of exports carried out by the Proex-Equalization were the North American Free Trade Agreement (Nafta) countries, with 31%; countries of the Latin American Integration Association (Aladi), 20%; and Mercosur member countries, 15%. The main countries of destination were the U.S., with 22% of total; Argentina; 13%; Chile, 8%; Peru, 8%; and Mexico, 7%.
The prorogation of the deadline for the contract of fi nancing in the framework of the BNDES Investment Support Program (ISP), with a budget of R$75 billion, represented an important measure to leverage the productive investment and technological innovation. In March, the PSI was prorogated until December 31, 2011, and, in September, until the end of 2012, being adjusted to the PBM strategies. The National Monetary Council, through Resolution no. 4,009, dated September 14, approved some PSI alterations, with emphasis on the reallocation of fi nancing limits from the BNDES to the Finep, increasing the amount of funds from R$1 billion to R$3 billion; the inclusion as benefi ciaries of national or foreign corporations headquartered in Brazil, in addition to entrepreneurs, associations and foundations with the purpose of developing technological innovation projects in a systematic way.
On June 1, it was announced a partnership between Banco do Brasil and BNDES for the fi nancing of Brazilian exports of capital goods in the Latin America, in the framework of the BNDES Exim automatic. The new credit line, with payment deadlines of up to fi ve years, should contribute to enhance the competitiveness of Brazilian companies abroad, especially in the segment of capital goods. All Banco do Brasil’s branches, in Brazil and overseas, are eligible for negotiating with companies interested in this credit line, limited to US$200 million.
In 2011, disbursements related to BNDES foreign trade operations totaled US$6.7 billion, of which US$5 billion targeted to exports of goods and US$1.7 billion to exports of services. In the scope of the 580 operations involving disbursements for the industry, US$1.4 billion corresponded to exports in the segment of vehicles, tow trucks
82 Boletim do Banco Central do Brasil – Annual Report 2011
and bodyworks; US$1.2 billion in other transportation equipment; US$724 million to machinery and equipment; and US$487 million in electrical machines and apparatuses. These four segments accounted for 77.1% of total disbursements channeled to the manufacturing industry.
Regarding the special import regimes, the Secex Ordinance no. 8, dated February 15, regulated the new regime of Integrated Drawback Exemption. This system permits the replacement of stock of imported inputs acquired in the domestic market with the aim of being utilized in the industrialization of the fi nal exported product. The company may choose between the exemption for the amount imported or acquired in the domestic market, an innovative choice with the goal of improving the competitiveness of Brazilian products on the international market.
Other relevant item was the signing, on October 24, of the Constitutional Amendment Proposal (PEC) in order to prorogate, for more than 50 years, the validity of the Free Economic Zone of Manaus and the extension of benefi ts for that metropolitan region. In addition, through the Inter-Ministerial Ordinance of the Ministry of Science and Technology no. 432, dated June 28, it was defi ned the fi rst company allowed to produce tablets in the country, subject to tax incentives in the framework of the Informatics Law.
Exchange policy
According to Circular no. 3,520, dated January 6, fi nancial institutions should pay to the Central Bank, as compulsory deposit, 60% of the short exchange position exceeding the lowest of the following values: US$3 billion, or the Base Capital (PR). The deadline for fi nancial institutions to adapt to this compulsory deposit paid in cash and without return, totaled 90 days. This prudential measure aimed to reduce banking exchange exposure in foreign currency.
On January 14, the Central Bank resumed reverse exchange swap operations, in which it assumes asset position in exchange variation and liability in domestic interest rates. It is worth mentioning that, in June of 2009, the Central Bank had closed all its open positions in exchange swap contracts. At the end of December 2011, these operations resulted in net exposure of US$3 billion.
Circular no. 3,484, dated January 25, authorized foreign currency auctions with forward settlement, that is, with defi ned deadlines for future payments. Auctions were carried out in February, April and September, totaling US$2.2 billion in the year. Through this measure, the Central Bank obtained the following instruments to intervene on the
V Economic-Financial Relations with the International Community 83
exchange domestic market: direct interventions in the spot market; exchange swap and reverse exchange swap auctions; and forward auctions.
The maintenance of foreign capital infl ows to the Brazilian market allowed the monetary authority to keep the policy of purchasing foreign currency in the spot market, totaling acquisitions of US$47.9 billion from January to September, which, added up to US$2.2 billion related to forward operations, totaled purchases of US$50.1 billion in the year.
According to Decree no. 7,454, the IOF rate on exchange operations for the fulfi llment of obligations of the credit card administrators, commercial or multiple banks in the quality of credit card issuers, resulting from the acquisition of foreign goods and services by their users, increased to 6.38% as of March 25, This measure came into force on the publication’s date, with effects on the exchange operations after the thirtieth day subsequent to the publication’s date.
According to the Decree no. 7,456, dated March 28, the IOF rate on liquidations of exchange operations contracted since March 29, 2011, concerning infl ows of foreign funds under the modality of loans, contracted directly or through the issue of securities on the international market, with minimum average term of 360 days, was raised to 6%. The deadline was increased to 720 days for the settlement of exchange operations contracted since April 7, 2011, according to Decree no. 7,457, dated April 6. The aim of this regulation is to reduce short-term foreign debts, which are subject to higher risks in a crisis scenario.
Aiming to equalize the treatment provided to operations involving conversion operations and transfer between foreign capital registered at the Central Bank of Brazil, the CMN, through Resolution no. 3,967, dated April 4, turned it mandatory the implementation of simultaneous operation in renovations, renegotiations and assumption of obligations related to foreign loans operations, contracted directly or through the issue of securities on the international market. The Central Bank implemented normative changes on this subject through Circular no. 3,531, dated April 13.
Other macro-prudential measure aimed to reduce banking exposure in foreign currency was announced on July 8. Through Circular no. 3,548, the Central Bank redefi ned and consolidated the rules for the compulsory payment on exchange short position. According to this rule, fi nancial institutions should pay to the Central Bank, as compulsory deposit, 60% of the value of the exchange short position exceeding the lowest of the following values: US$1 billion, or the Base Capital (PR). This compulsory deposit should be paid in cash and yields no earnings.
Provisional Measure no. 539, dated July 26, converted into Law no. 12,543, dated December 8, authorized the National Monetary Council to establish specifi c conditions
84 Boletim do Banco Central do Brasil – Annual Report 2011
to negotiate derivatives contracts. According to this Law, operations related to securities, involving derivatives contracts are subjected to the maximum IOF rate, 25%. Additionally, Decree no. 7,536, dated July 26, fi xed the IOF rate in derivatives contracts at 1% on the adjusted value, in the purchase, sale or maturity of contracts of fi nancial derivatives, whose liquidation value had been affected by the variation of the interest rate and resulting in increase of the short net exposure, compared to that calculated at the end of the previous business day. Through Normative Instruction no. 1,207, dated November 3, the Federal Revenue regulated the collection of IOF, but its payment for the triggering events occurred from September 15 to December 31, 2011 was postponed, by means of Ordinance no. 560, dated December 23, to January 31, 2012. In addition, the same Decree determined for the loan operation, contracted by the minimum average deadline higher than 720 days, that if the minimum medium term required is not fulfi lled, the taxpayer will have to pay the tax calculated at a rate of 6%, plus interest on late payments and fi nes.
The IOF rate on foreign investment in shares was reduced from 2% to zero, according to Decree no. 7,632, dated December 1. The reduction reached the initial public offer (IPO) and the secondary market, and included the cancellation and primary issue of depositary receipts of Brazilian companies negotiated abroad. It was also reduced, from 6% to zero, the IOF rate on non-resident investments in securities of medium-term higher than four years, issued by non-fi nancial companies and associated with investment projects.
In the scope of the policy for strengthening the Brazilian companies’ performance on the international market, the CMN, through Resolution no. 4,033, dated November 30, allowed the authorized banks to operate in the exchange market, with minimum base capital of R$5 billion, and to use funds raised in the international market to grant credit abroad. This credit may be only channeled to Brazilian companies, subsidiaries of Brazilian companies and foreign companies, whose shareholder with the majority of voting capital should be, directly or indirectly, an individual or corporation resident in Brazil. In addition, banks were authorized to acquire, in the primary market, securities issued by the referred companies.
In the context of measures aimed to streamline exchange operations, the CMN, through Resolution no. 3,997, dated July 28, regulated the receipt by national exporters of funds associated with sales of goods and services abroad, in an environment of electronic commerce. The measure eliminated the harmful asymmetry for the Brazilian companies, thus allowing national exporters to compete in the environment of electronic commerce under similar conditions with foreign competitors.
V Economic-Financial Relations with the International Community 85
Exchange movement
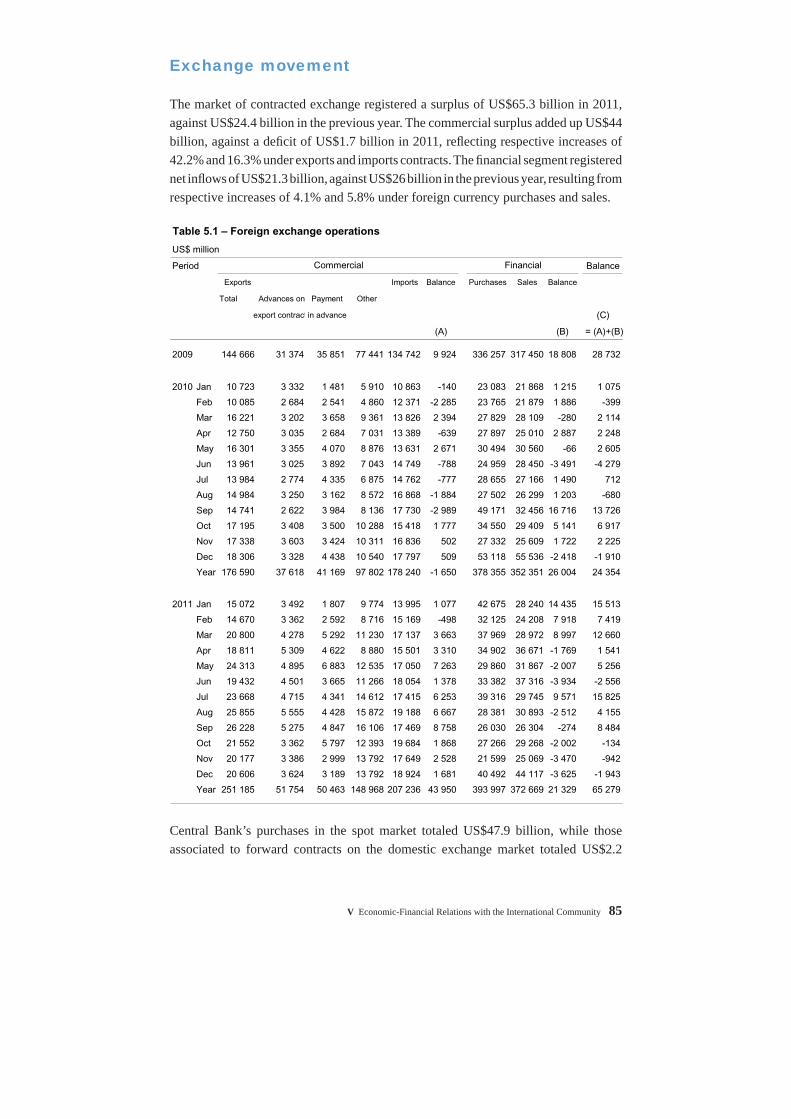
The market of contracted exchange registered a surplus of US$65.3 billion in 2011, against US$24.4 billion in the previous year. The commercial surplus added up US$44 billion, against a defi cit of US$1.7 billion in 2011, refl ecting respective increases of 42.2% and 16.3% under exports and imports contracts. The fi nancial segment registered net infl ows of US$21.3 billion, against US$26 billion in the previous year, resulting from respective increases of 4.1% and 5.8% under foreign currency purchases and sales.
Central Bank’s purchases in the spot market totaled US$47.9 billion, while those associated to forward contracts on the domestic exchange market totaled US$2.2
Table 5.1 – Foreign exchange operations
US$ million
Period Balance
Exports Imports Balance Purchases Sales Balance
Total Advances on Payment Other
export contract in advance (C)
(A) (B) = (A)+(B)
2009 144 666 31 374 35 851 77 441 134 742 9 924 336 257 317 450 18 808 28 732
2010 Jan 10 723 3 332 1 481 5 910 10 863 -140 23 083 21 868 1 215 1 075
Feb 10 085 2 684 2 541 4 860 12 371 -2 285 23 765 21 879 1 886 -399
Mar 16 221 3 202 3 658 9 361 13 826 2 394 27 829 28 109 -280 2 114
Apr 12 750 3 035 2 684 7 031 13 389 -639 27 897 25 010 2 887 2 248
May 16 301 3 355 4 070 8 876 13 631 2 671 30 494 30 560 -66 2 605
Jun 13 961 3 025 3 892 7 043 14 749 -788 24 959 28 450 -3 491 -4 279
Jul 13 984 2 774 4 335 6 875 14 762 -777 28 655 27 166 1 490 712
Aug 14 984 3 250 3 162 8 572 16 868 -1 884 27 502 26 299 1 203 -680
Sep 14 741 2 622 3 984 8 136 17 730 -2 989 49 171 32 456 16 716 13 726
Oct 17 195 3 408 3 500 10 288 15 418 1 777 34 550 29 409 5 141 6 917
Nov 17 338 3 603 3 424 10 311 16 836 502 27 332 25 609 1 722 2 225
Dec 18 306 3 328 4 438 10 540 17 797 509 53 118 55 536 -2 418 -1 910
Year 176 590 37 618 41 169 97 802 178 240 -1 650 378 355 352 351 26 004 24 354
2011 Jan 15 072 3 492 1 807 9 774 13 995 1 077 42 675 28 240 14 435 15 513
Feb 14 670 3 362 2 592 8 716 15 169 -498 32 125 24 208 7 918 7 419
Mar 20 800 4 278 5 292 11 230 17 137 3 663 37 969 28 972 8 997 12 660
Apr 18 811 5 309 4 622 8 880 15 501 3 310 34 902 36 671 -1 769 1 541
May 24 313 4 895 6 883 12 535 17 050 7 263 29 860 31 867 -2 007 5 256
Jun 19 432 4 501 3 665 11 266 18 054 1 378 33 382 37 316 -3 934 -2 556
Jul 23 668 4 715 4 341 14 612 17 415 6 253 39 316 29 745 9 571 15 825
Aug 25 855 5 555 4 428 15 872 19 188 6 667 28 381 30 893 -2 512 4 155
Sep 26 228 5 275 4 847 16 106 17 469 8 758 26 030 26 304 -274 8 484
Oct 21 552 3 362 5 797 12 393 19 684 1 868 27 266 29 268 -2 002 -134
Nov 20 177 3 386 2 999 13 792 17 649 2 528 21 599 25 069 -3 470 -942
Dec 20 606 3 624 3 189 13 792 18 924 1 681 40 492 44 117 -3 625 -1 943
Year 251 185 51 754 50 463 148 968 207 236 43 950 393 997 372 669 21 329 65 279
Commercial Financial
86 Boletim do Banco Central do Brasil – Annual Report 2011
billion. Banks’ exchange position, refl ecting both operations with clients on the primary exchange market and Central Bank’s interventions, decreased from US$16.8 billion, at the end of 2010, to US$1.6 billion, at the end of December 2011.
The Brazilian real depreciated 12.6% against the U.S. dollar in 2011. Effective real exchange rate indices, defl ated by the Extended Price Index (IPA-DI) and the IPCA, registered respective decreases of 10.6% and 5.2% at the end of 2011 and 2010.
Balance of payments
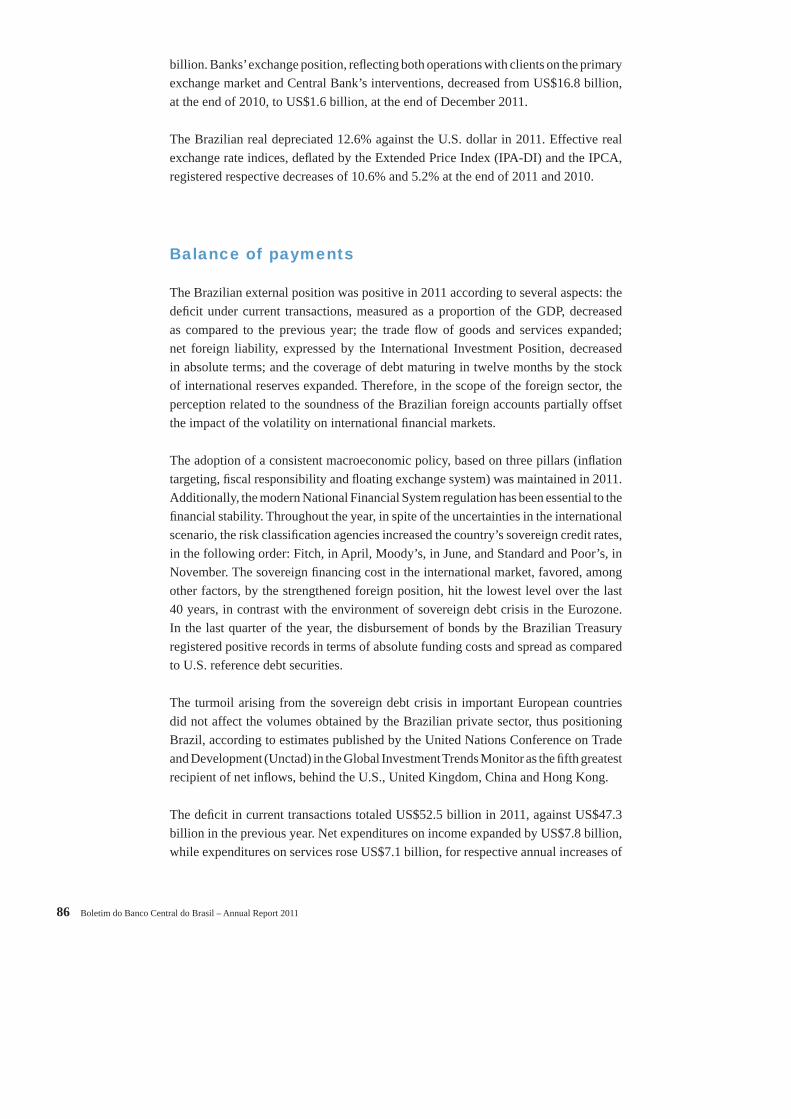
The Brazilian external position was positive in 2011 according to several aspects: the defi cit under current transactions, measured as a proportion of the GDP, decreased as compared to the previous year; the trade fl ow of goods and services expanded; net foreign liability, expressed by the International Investment Position, decreased in absolute terms; and the coverage of debt maturing in twelve months by the stock of international reserves expanded. Therefore, in the scope of the foreign sector, the perception related to the soundness of the Brazilian foreign accounts partially offset the impact of the volatility on international fi nancial markets.
The adoption of a consistent macroeconomic policy, based on three pillars (infl ation targeting, fi scal responsibility and fl oating exchange system) was maintained in 2011. Additionally, the modern National Financial System regulation has been essential to the fi nancial stability. Throughout the year, in spite of the uncertainties in the international scenario, the risk classifi cation agencies increased the country’s sovereign credit rates, in the following order: Fitch, in April, Moody’s, in June, and Standard and Poor’s, in November. The sovereign fi nancing cost in the international market, favored, among other factors, by the strengthened foreign position, hit the lowest level over the last 40 years, in contrast with the environment of sovereign debt crisis in the Eurozone. In the last quarter of the year, the disbursement of bonds by the Brazilian Treasury registered positive records in terms of absolute funding costs and spread as compared to U.S. reference debt securities.
The turmoil arising from the sovereign debt crisis in important European countries did not affect the volumes obtained by the Brazilian private sector, thus positioning Brazil, according to estimates published by the United Nations Conference on Trade and Development (Unctad) in the Global Investment Trends Monitor as the fi fth greatest recipient of net infl ows, behind the U.S., United Kingdom, China and Hong Kong.
The defi cit in current transactions totaled US$52.5 billion in 2011, against US$47.3 billion in the previous year. Net expenditures on income expanded by US$7.8 billion, while expenditures on services rose US$7.1 billion, for respective annual increases of
V Economic-Financial Relations with the International Community 87
19.8% and 23.1%, partially offset by the increase of 47.9% in the trade balance surplus. The acknowledgment of Brazil as a safe environment for investments, expressed in terms of risk expectations, contributed to net infl ows of US$112.4 billion in the capital and fi nancial account in 2011. The balance of payments turned in a surplus of US$58.6 billion.
Table 5.2 – Balance of payments
US$ million
Itemization 2010 2011
1st half 2nd half Year 1st half 2nd half Year
Trade balance - FOB 7 880 12 267 20 147 12 960 16 846 29 807 Exports 89 187 112 728 201 915 118 304 137 736 256 040 Imports 81 308 100 461 181 768 105 343 120 890 226 233Services -13 531 -17 304 -30 835 -17 993 -19 959 -37 952 Credit 14 765 16 834 31 599 18 179 20 030 38 209 Debit 28 296 34 138 62 434 36 172 39 989 76 161 Income -19 731 -19 755 -39 486 -22 577 -24 742 -47 319 Credit 3 124 4 282 7 405 5 758 4 994 10 753 Debit 22 855 24 037 46 892 28 335 29 736 58 072 Current unilateral transfers (net) 1 563 1 339 2 902 1 576 1 408 2 984 Credit 2 395 2 379 4 775 2 481 2 435 4 915 Debit 833 1 040 1 873 905 1 027 1 931Current account -23 820 -23 453 -47 273 -26 034 -26 446 -52 480Capital and financial account 42 989 56 923 99 912 69 341 43 048 112 389 Capital account 494 625 1 119 666 907 1 573 Financial account 42 495 56 299 98 793 68 675 42 141 110 816 Direct investment (net) 3 215 33 704 36 919 34 986 32 703 67 689 Abroad -8 881 -2 706 -11 588 2 484 -1 455 1 029 Equity capital -12 110 -14 673 -26 782 -14 597 -4 936 -19 533 Intercompany loans 3 229 11 966 15 195 17 081 3 481 20 562 In the reporting country 12 096 36 410 48 506 32 502 34 158 66 660 Equity capital 12 256 27 860 40 117 25 827 28 955 54 782 Intercompany loans -160 8 550 8 390 6 675 5 203 11 878 Portfolio investments 22 790 40 221 63 011 25 146 10 165 35 311 Assets -375 -4 408 -4 784 12 711 4 147 16 858 Equity securities 896 5 315 6 211 6 841 1 961 8 801 Debt securities -1 271 -9 724 -10 995 5 871 2 186 8 057 Liabilities 23 166 44 629 67 795 12 435 6 018 18 453 Equity securities 9 733 27 937 37 671 3 865 3 309 7 174 Debt securities 13 432 16 692 30 124 8 570 2 709 11 278 Financial derivatives -17 -95 -112 -9 12 3 Assets 74 59 133 170 82 252 Liabilities -91 -154 -245 -179 -70 -249
Other investments1/ 16 507 -17 531 -1 024 8 552 -739 7 813 Assets -12 045 -30 522 -42 567 -20 564 -18 420 -38 984 Liabilities 28 552 12 991 41 543 29 116 17 681 46 796Errors and omissions -2 502 -1 036 -3 538 -397 -875 -1 272Overall balance 16 666 32 434 49 101 42 910 15 727 58 637
Memo:Current account/GDP (%) -2.20 -2.12
1/ Includes trade credits, loans, currency and deposits, other assets and liabilities.
88 Boletim do Banco Central do Brasil – Annual Report 2011
Trade balance
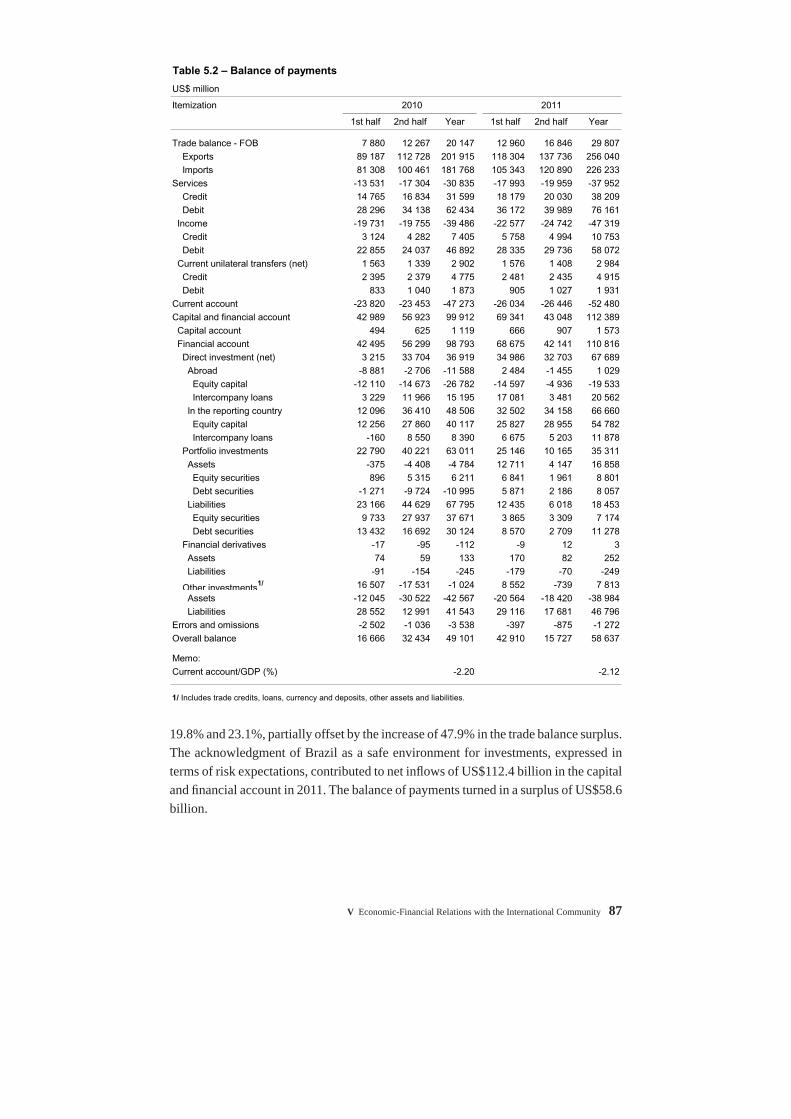
The trade balance registered a surplus of US$29.8 billion in 2011, the eleventh positive annual result in the sequence. The annual expansion of 47.9% refl ected increases of 26.8% under exports and 24.5% under imports, totaling, respectively, US$256 billion and US$226.2 billion. In the year, the trade fl ow increased by 25.7%, as against an expansion of 36.7% in 2010.
Table 5.3 – Trade balance – FOB
US$ million
Year Exports Imports Balance Trade flow
2010 201 915 181 768 20 147 383 684
2011 256 040 226 233 29 807 482 273
% change 26.8 24.5 47.9 25.7
Source: MDIC/Secex
-3
-2
-1
0
1
2
Mar2008
Jun Sep Dec Mar2009
Jun Sep Dec Mar2010
Jun Sep Dec Mar2011
Jun Sep Dec
Graph 5.1Current accounts balance and external financing requirements
Accumulated in 12 months
Current account balance/GDP External financing requirements/GDP
%
External financing requirements = current account deficit - net foreign direct investments
-30
-15
0
15
30
45
60
Dec 2007
Mar 2008
Jun Sep Dec Mar 2009
Jun Sep Dec Mar 2010
Jun Sep Dec Mar 2011
Jun Sep Dec
Source: MDIC/Secex1/ From the same period of the previous year.
Exports Imports
Graph 5.2Exports and imports – FOB
Last 12 months (% change)1/
V Economic-Financial Relations with the International Community 89
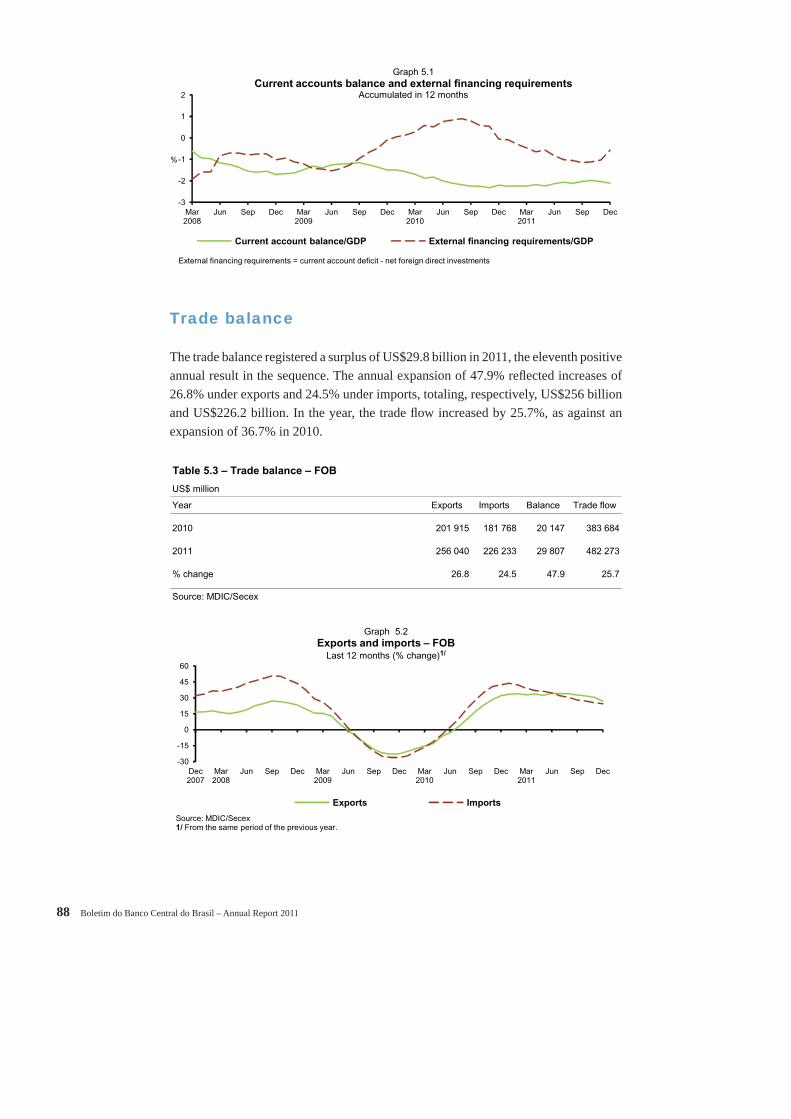
The terms of trade continued on the upward trend begun in 2009 up to the fi rst quarter of the year, when they hit a record level, before declining in the subsequent period. In terms of annual averages, export prices increased 23.2%, and import prices, 14.3%, while the comparison between December 2011 and December 2010 indicators reveals respective expansions of 8.6% and 12.5%.
The annual expansion of exports, resulting from increases of 23.2% in prices and 2.9% in quantum, refl ected sales expansion in all aggregate factor categories. Sales of basic, semi-manufactured and manufactured products registered respective annual increases of 36.1%, 27.7% and 16%.
The steady expansion of international prices of important commodities of the Brazilian list of exports stimulated price increases in the categories of basic products, 31.3%, and semi-manufactured products, 20.9%, while the prices of manufactured goods increased 14.1%. Exported amounts increased, respectively, 3.6%, 5.6% and 1.7%.
With regard to major basic exported products, annual price increases were registered for wheat grain, 73.7%; raw coffee, 54.4%; corn grain, 39.8%; oil, 39.5%; and iron ore, 35.9%. Exported amounts mainly refl ected expansions in shipments of corn rice, 213.8%, wheat grain, 77.5%; raw cotton, 48%; offal, 13.5%; and soybeans, 13.5%, in contrast with sale decreases in the segments of alive cows and beef.
90
99
108
117
126
135
II Q 2005
IV Q II Q 2006
IV Q II Q 2007
IV Q II Q 2008
IV Q II Q 2009
IV Q II Q 2010
IV Q II Q 2011
IV Q
Source: Funcex
Graph 5.3Terms of trade index
2006 = 100
Table 5.4 – Exports price and volume indices
Change from the previous year (%)
Itemization
Price Volume Price Volume
Total 20.5 9.5 23.2 2.9
Primary products 30.4 11.4 31.3 3.6
Semimanufactured goods 29.0 6.6 20.9 5.6
Manufactured goods 8.5 8.9 14.1 1.7
Source: Funcex
2010 2011
90 Boletim do Banco Central do Brasil – Annual Report 2011
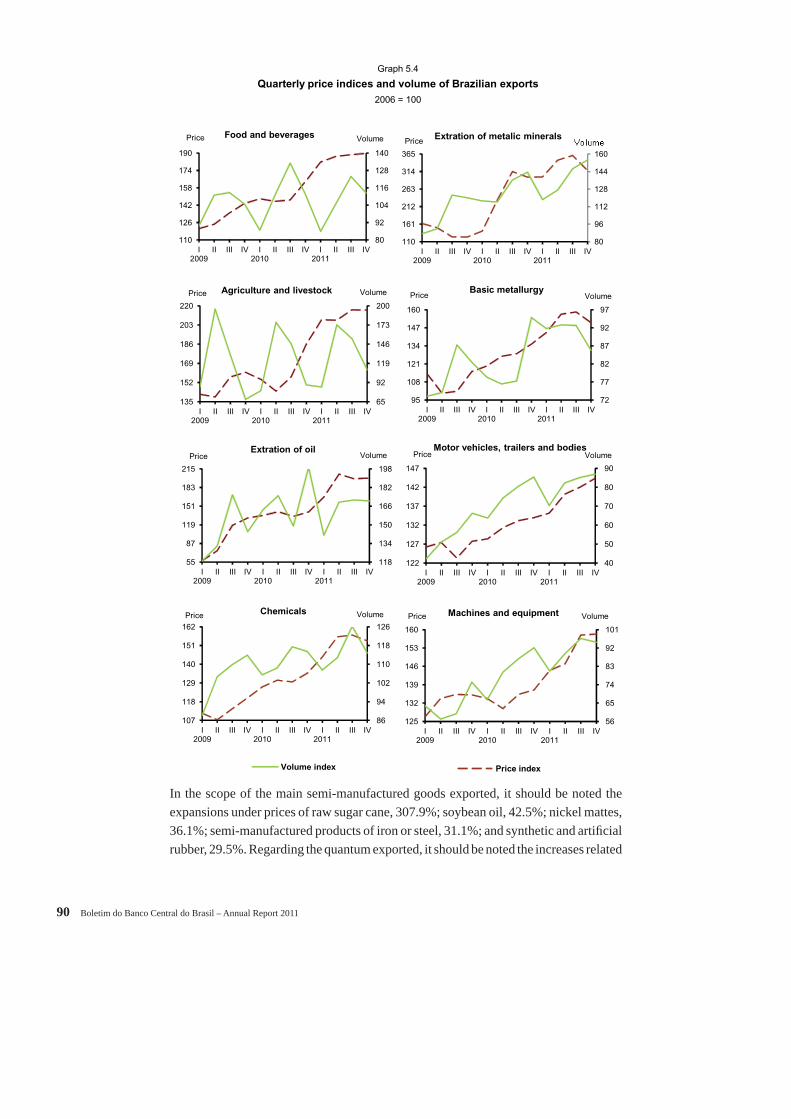
In the scope of the main semi-manufactured goods exported, it should be noted the expansions under prices of raw sugar cane, 307.9%; soybean oil, 42.5%; nickel mattes, 36.1%; semi-manufactured products of iron or steel, 31.1%; and synthetic and artifi cial rubber, 29.5%. Regarding the quantum exported, it should be noted the increases related
Quarterly price indices and volume of Brazilian exports
2006 = 100
Graph 5.4
80
92
104
116
128
140
110
126
142
158
174
190
I2009
II III IV I2010
II III IV I2011
II III IV
VolumePrice Food and beverages
118
134
150
166
182
198
55
87
119
151
183
215
I2009
II III IV I2010
II III IV I2011
II III IV
VolumePriceExtration of oil
65
92
119
146
173
200
135
152
169
186
203
220
I2009
II III IV I2010
II III IV I2011
II III IV
VolumePrice Agriculture and livestock
72
77
82
87
92
97
95
108
121
134
147
160
I2009
II III IV I2010
II III IV I2011
II III IV
VolumePriceBasic metallurgy
80
96
112
128
144
160
110
161
212
263
314
365
I2009
II III IV I2010
II III IV I2011
II III IV
Price Extration of metalic minerals
40
50
60
70
80
90
122
127
132
137
142
147
I2009
II III IV I2010
II III IV I2011
II III IV
VolumePriceMotor vehicles, trailers and bodies
86
94
102
110
118
126
107
118
129
140
151
162
I2009
II III IV I2010
II III IV I2011
II III IV
VolumePrice Chemicals
Volume index
56
65
74
83
92
101
125
132
139
146
153
160
I2009
II III IV I2010
II III IV I2011
II III IV
VolumePrice Machines and equipment
Price index
V Economic-Financial Relations with the International Community 91
to pig iron and Spiegel iron, 40.6%, semi-manufactured products of iron or steel, 36.4%; copper cathodes, 23%; zinc, 15.2%, and nickel cathodes, 14.4%; in contrast with the decreases in the shipments of aluminum alloys, wood sawn or chipped and vegetable waxes.
In relation to foreign sales of manufactured products, whose prices, in general, are less volatile, it should be noted the annual increases in the segments of ethyl alcohol, 42.4%; fuel oil, 38.1%; frozen orange juice, 37.1%; hydrocarbons and their derivatives, 36%; and refi ned sugar, 33.2%. Regarding the amounts exported in this category, increases were observed in excavation and drilling machinery, 29.9%; tractors, 20.9%; ethylene polymers, propylene and styrene, 17.9%; engines for automotive vehicles, 17.9%; and cargo vehicles, 16.6%. Conversely, decreases higher than 15% were observed in the amounts exported of refi ned sugar, footwear and accessories, and hydrocarbons and their derivatives.
In 2011, according to the Foreign Trade Studies Center Foundation (Funcex), eight of the chief export segments totaled 80% of the country’s foreign sales. In the year, prices increased in all the mentioned segments, with emphasis on those related to oil drilling, 39.7%; metallic minerals, 34.6%; and crop and livestock, 31.9%. Among exports, it should be noted expansions related to basic metallurgy and machinery and equipments; both of them accounting for 11%; and automotive vehicles, tow trucks and bodyworks, 6.8%.
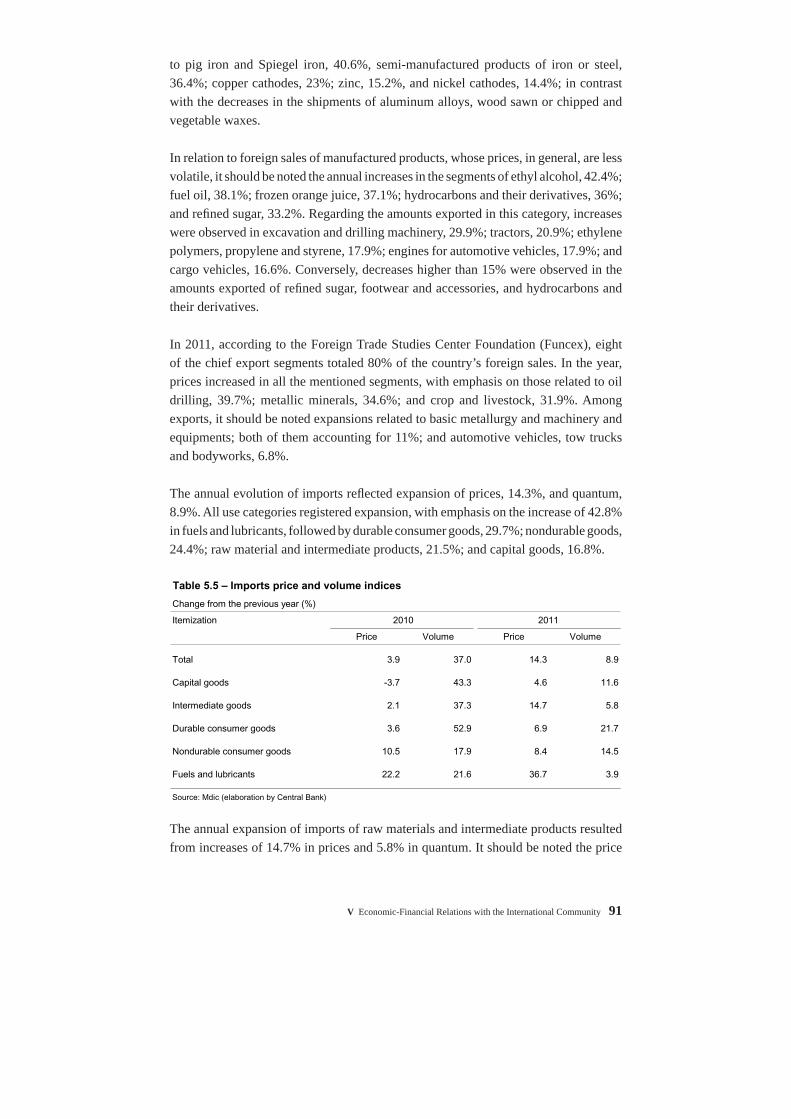
The annual evolution of imports refl ected expansion of prices, 14.3%, and quantum, 8.9%. All use categories registered expansion, with emphasis on the increase of 42.8% in fuels and lubricants, followed by durable consumer goods, 29.7%; nondurable goods, 24.4%; raw material and intermediate products, 21.5%; and capital goods, 16.8%.
The annual expansion of imports of raw materials and intermediate products resulted from increases of 14.7% in prices and 5.8% in quantum. It should be noted the price
Table 5.5 – Imports price and volume indices
Change from the previous year (%)
Itemization 2010 2011
Price Volume Price Volume
Total 3.9 37.0 14.3 8.9
Capital goods -3.7 43.3 4.6 11.6
Intermediate goods 2.1 37.3 14.7 5.8
Durable consumer goods 3.6 52.9 6.9 21.7
Nondurable consumer goods 10.5 17.9 8.4 14.5
Fuels and lubricants 22.2 21.6 36.7 3.9
Source: Mdic (elaboration by Central Bank)
92 Boletim do Banco Central do Brasil – Annual Report 2011
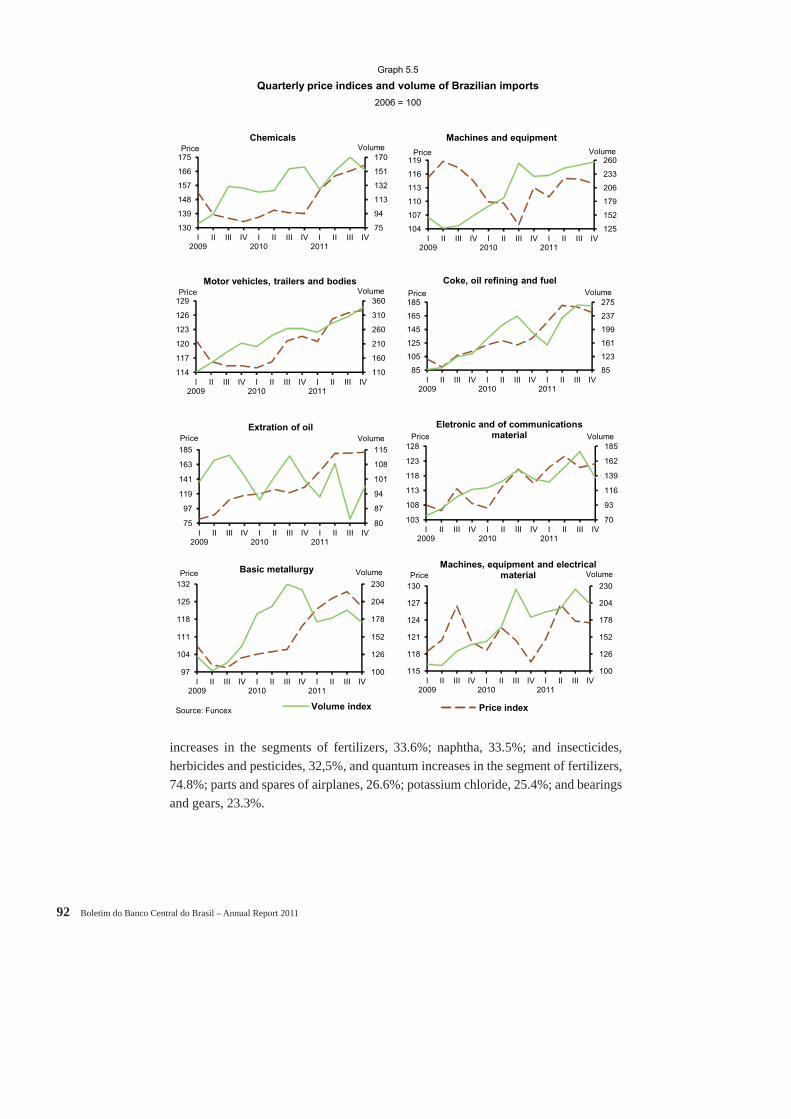
increases in the segments of fertilizers, 33.6%; naphtha, 33.5%; and insecticides, herbicides and pesticides, 32,5%, and quantum increases in the segment of fertilizers, 74.8%; parts and spares of airplanes, 26.6%; potassium chloride, 25.4%; and bearings and gears, 23.3%.
Quarterly price indices and volume of Brazilian imports
2006 = 100
Graph 5.5
75
94
113
132
151
170
130
139
148
157
166
175
I2009
II III IV I2010
II III IV I2011
II III IV
VolumePriceChemicals
100
126
152
178
204
230
115
118
121
124
127
130
I2009
II III IV I2010
II III IV I2011
II III IV
VolumePriceMachines, equipment and electrical
material
Price index
70
93
116
139
162
185
103
108
113
118
123
128
I2009
II III IV I2010
II III IV I2011
II III IV
VolumePrice
Eletronic and of communications
material
80
87
94
101
108
115
75
97
119
141
163
185
I2009
II III IV I2010
II III IV I2011
II III IV
VolumePriceExtration of oil
125
152
179
206
233
260
104
107
110
113
116
119
I2009
II III IV I2010
II III IV I2011
II III IV
VolumePrice
Machines and equipment
85
123
161
199
237
275
85
105
125
145
165
185
I2009
II III IV I2010
II III IV I2011
II III IV
VolumePrice
Coke, oil refining and fuel
100
126
152
178
204
230
97
104
111
118
125
132
I2009
II III IV I2010
II III IV I2011
II III IV
VolumePrice Basic metallurgy
Volume indexSource: Funcex
110
160
210
260
310
360
114
117
120
123
126
129
I2009
II III IV I2010
II III IV I2011
II III IV
VolumePriceMotor vehicles, trailers and bodies
V Economic-Financial Relations with the International Community 93
In the scope of the capital goods segments, quantum expanded 11.6% and prices, 4.6%. It should be noted the expanded volume of purchases of mobile phone transmitters and receivers, 74.7%; transmitter apparatuses or receivers, 44.8%; load-lifting machines, 43.5%; and medical instruments and equipment, 35.9%. Price expansion in this category mainly refl ected expansions in the items of airplanes, 82.1%; machinery to mold rubber or plastic, 21%; centrifuges and fi ltering apparatuses, 14.9%; and machines for computer data processing, 12.6%.
As for imports of durable consumer goods, quantum increased 21.7% and prices, 6.9%. The amount of imported motorcycles increased 60.9%, followed by increases in the items of bags, suitcases and trunks, 45.6%; and toys and plays, 36.3%, while the prices of transmitter apparatuses and receivers, parts and spares of motorcycles and bicycles, and plastic products for packaging registered respective increases of 114.2%, 31.9% and 18.3%.
The annual growth of imports of nondurable consumer goods resulted from increases of 14.5% in the quantum and 8.4% in prices, with emphasis on quantum expansion of frozen fi sh, 111.2%; milk and milk cream, 65%; and footwear and parts, 21.4%; and price expansion of frozen meat, 23.6%; medicines, 21.7%; and milk and milk cream, 17.6%.
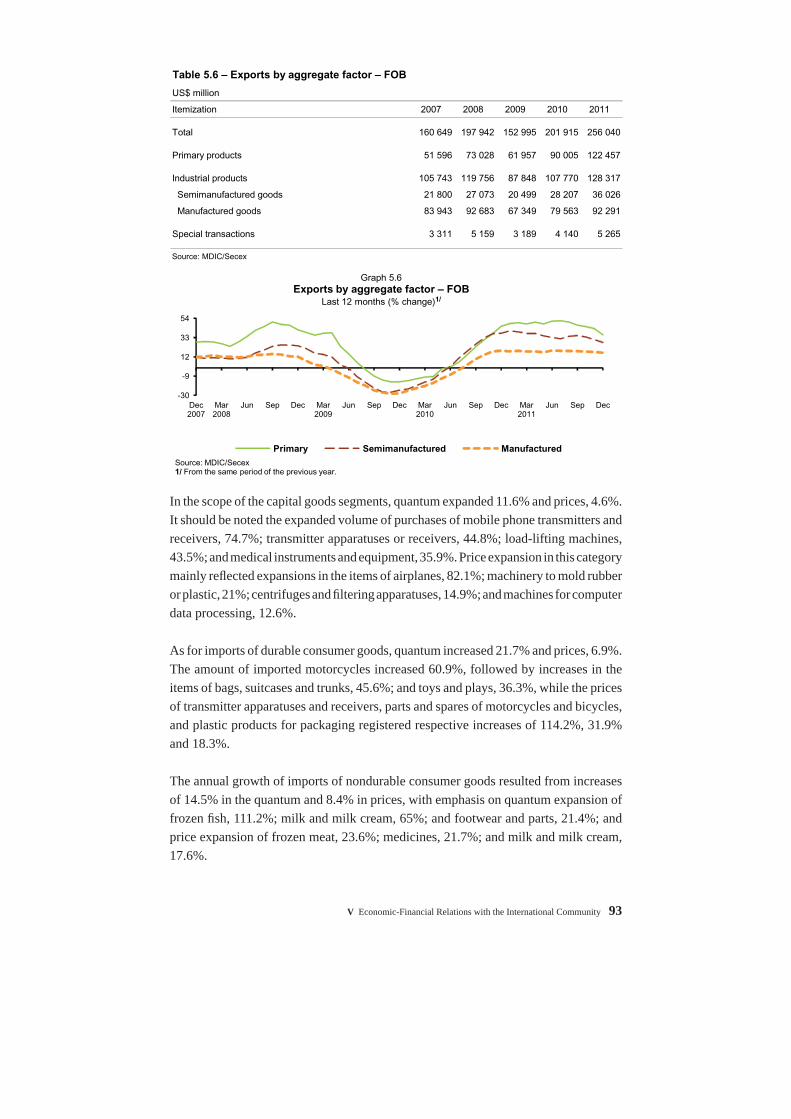
Table 5.6 – Exports by aggregate factor – FOB
US$ million
Itemization 2007 2008 2009 2010 2011
Total 160 649 197 942 152 995 201 915 256 040
Primary products 51 596 73 028 61 957 90 005 122 457
Industrial products 105 743 119 756 87 848 107 770 128 317
Semimanufactured goods 21 800 27 073 20 499 28 207 36 026
Manufactured goods 83 943 92 683 67 349 79 563 92 291
Special transactions 3 311 5 159 3 189 4 140 5 265
Source: MDIC/Secex
-30
-9
12
33
54
Dec 2007
Mar 2008
Jun Sep Dec Mar 2009
Jun Sep Dec Mar 2010
Jun Sep Dec Mar 2011
Jun Sep Dec
Source: MDIC/Secex1/ From the same period of the previous year.
Primary Semimanufactured Manufactured
Graph 5.6Exports by aggregate factor – FOB
Last 12 months (% change)1/
94 Boletim do Banco Central do Brasil – Annual Report 2011
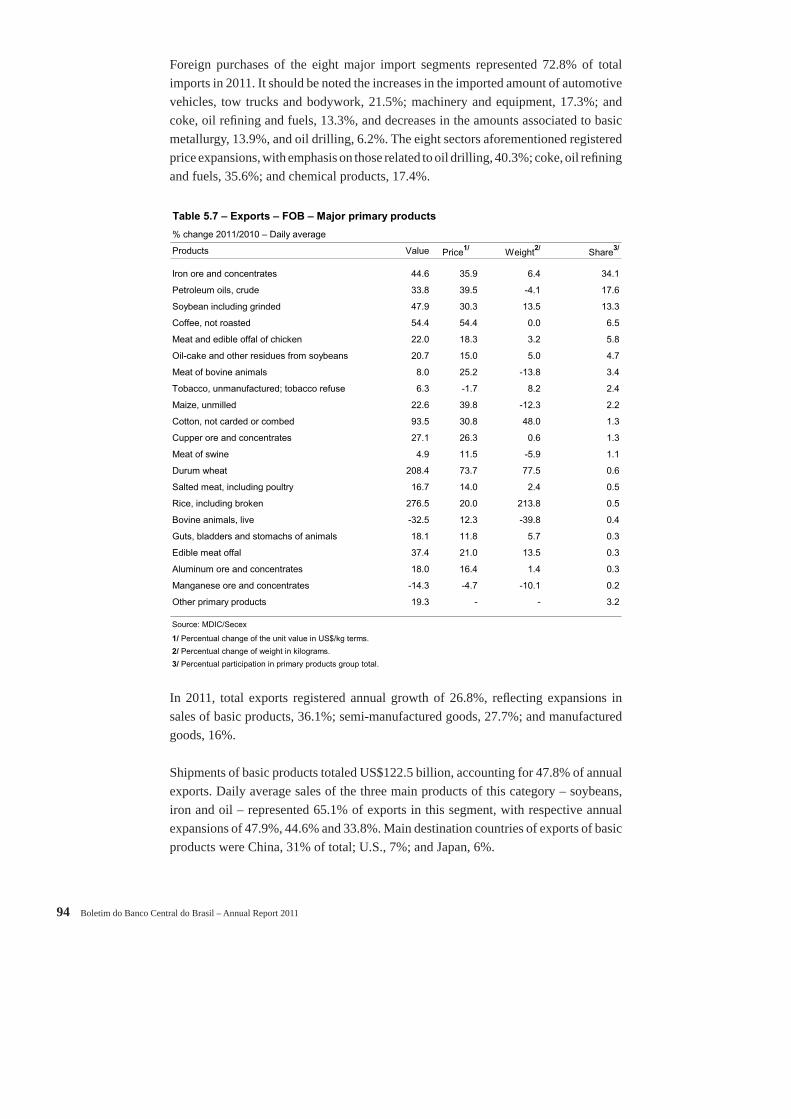
Foreign purchases of the eight major import segments represented 72.8% of total imports in 2011. It should be noted the increases in the imported amount of automotive vehicles, tow trucks and bodywork, 21.5%; machinery and equipment, 17.3%; and coke, oil refi ning and fuels, 13.3%, and decreases in the amounts associated to basic metallurgy, 13.9%, and oil drilling, 6.2%. The eight sectors aforementioned registered price expansions, with emphasis on those related to oil drilling, 40.3%; coke, oil refi ning and fuels, 35.6%; and chemical products, 17.4%.
In 2011, total exports registered annual growth of 26.8%, refl ecting expansions in sales of basic products, 36.1%; semi-manufactured goods, 27.7%; and manufactured goods, 16%.
Shipments of basic products totaled US$122.5 billion, accounting for 47.8% of annual exports. Daily average sales of the three main products of this category – soybeans, iron and oil – represented 65.1% of exports in this segment, with respective annual expansions of 47.9%, 44.6% and 33.8%. Main destination countries of exports of basic products were China, 31% of total; U.S., 7%; and Japan, 6%.
Table 5.7 – Exports – FOB – Major primary products
% change 2011/2010 – Daily average
Products Value Price1/ Weight2/ Share3/
Iron ore and concentrates 44.6 35.9 6.4 34.1
Petroleum oils, crude 33.8 39.5 -4.1 17.6
Soybean including grinded 47.9 30.3 13.5 13.3
Coffee, not roasted 54.4 54.4 0.0 6.5
Meat and edible offal of chicken 22.0 18.3 3.2 5.8
Oil-cake and other residues from soybeans 20.7 15.0 5.0 4.7
Meat of bovine animals 8.0 25.2 -13.8 3.4
Tobacco, unmanufactured; tobacco refuse 6.3 -1.7 8.2 2.4
Maize, unmilled 22.6 39.8 -12.3 2.2
Cotton, not carded or combed 93.5 30.8 48.0 1.3
Cupper ore and concentrates 27.1 26.3 0.6 1.3
Meat of swine 4.9 11.5 -5.9 1.1
Durum wheat 208.4 73.7 77.5 0.6
Salted meat, including poultry 16.7 14.0 2.4 0.5
Rice, including broken 276.5 20.0 213.8 0.5
Bovine animals, live -32.5 12.3 -39.8 0.4
Guts, bladders and stomachs of animals 18.1 11.8 5.7 0.3
Edible meat offal 37.4 21.0 13.5 0.3
Aluminum ore and concentrates 18.0 16.4 1.4 0.3
Manganese ore and concentrates -14.3 -4.7 -10.1 0.2
Other primary products 19.3 - - 3.2
Source: MDIC/Secex
1/ Percentual change of the unit value in US$/kg terms.
2/ Percentual change of weight in kilograms.
3/ Percentual participation in primary products group total.
V Economic-Financial Relations with the International Community 95
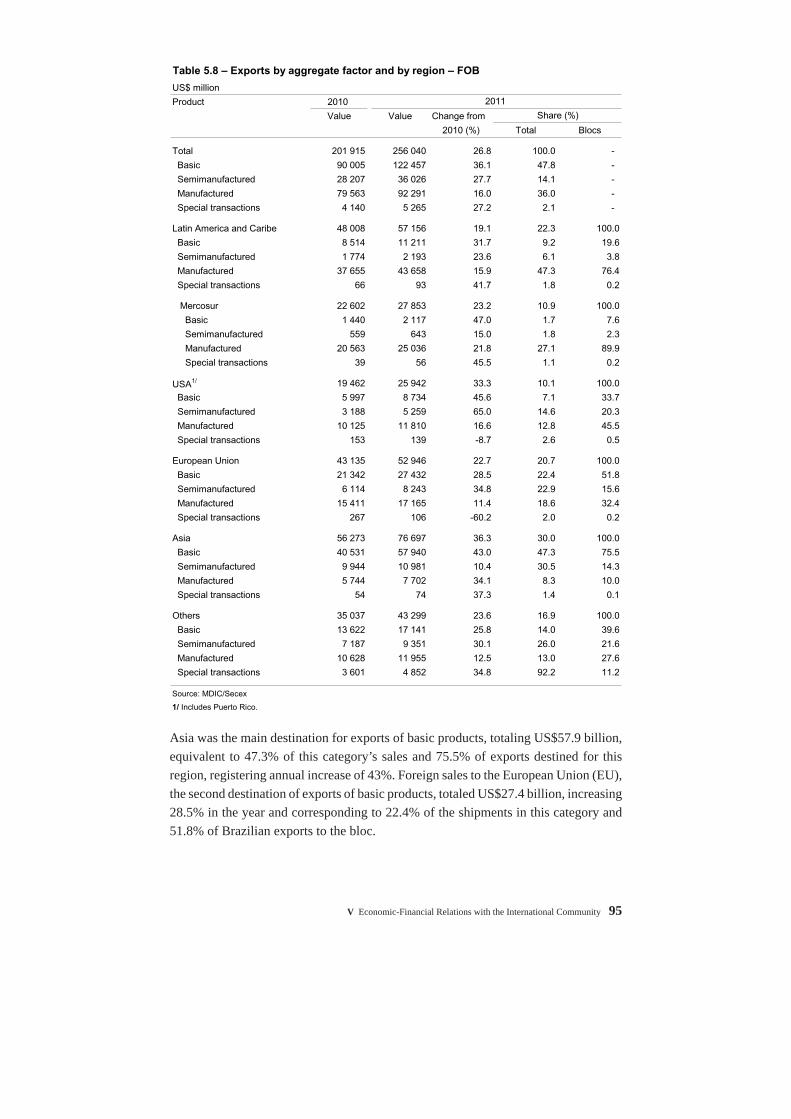
Asia was the main destination for exports of basic products, totaling US$57.9 billion, equivalent to 47.3% of this category’s sales and 75.5% of exports destined for this region, registering annual increase of 43%. Foreign sales to the European Union (EU), the second destination of exports of basic products, totaled US$27.4 billion, increasing 28.5% in the year and corresponding to 22.4% of the shipments in this category and 51.8% of Brazilian exports to the bloc.
Table 5.8 – Exports by aggregate factor and by region – FOB
US$ million
Product 2010
Value Value Change from
2010 (%) Total Blocs
Total 201 915 256 040 26.8 100.0 -
Basic 90 005 122 457 36.1 47.8 -
Semimanufactured 28 207 36 026 27.7 14.1 -
Manufactured 79 563 92 291 16.0 36.0 -
Special transactions 4 140 5 265 27.2 2.1 -
Latin America and Caribe 48 008 57 156 19.1 22.3 100.0
Basic 8 514 11 211 31.7 9.2 19.6
Semimanufactured 1 774 2 193 23.6 6.1 3.8
Manufactured 37 655 43 658 15.9 47.3 76.4
Special transactions 66 93 41.7 1.8 0.2
Mercosur 22 602 27 853 23.2 10.9 100.0
Basic 1 440 2 117 47.0 1.7 7.6
Semimanufactured 559 643 15.0 1.8 2.3
Manufactured 20 563 25 036 21.8 27.1 89.9
Special transactions 39 56 45.5 1.1 0.2
USA1/ 19 462 25 942 33.3 10.1 100.0
Basic 5 997 8 734 45.6 7.1 33.7
Semimanufactured 3 188 5 259 65.0 14.6 20.3
Manufactured 10 125 11 810 16.6 12.8 45.5
Special transactions 153 139 -8.7 2.6 0.5
European Union 43 135 52 946 22.7 20.7 100.0
Basic 21 342 27 432 28.5 22.4 51.8
Semimanufactured 6 114 8 243 34.8 22.9 15.6
Manufactured 15 411 17 165 11.4 18.6 32.4
Special transactions 267 106 -60.2 2.0 0.2
Asia 56 273 76 697 36.3 30.0 100.0
Basic 40 531 57 940 43.0 47.3 75.5
Semimanufactured 9 944 10 981 10.4 30.5 14.3
Manufactured 5 744 7 702 34.1 8.3 10.0
Special transactions 54 74 37.3 1.4 0.1
Others 35 037 43 299 23.6 16.9 100.0
Basic 13 622 17 141 25.8 14.0 39.6
Semimanufactured 7 187 9 351 30.1 26.0 21.6
Manufactured 10 628 11 955 12.5 13.0 27.6
Special transactions 3 601 4 852 34.8 92.2 11.2
Source: MDIC/Secex
1/ Includes Puerto Rico.
Share (%)
2011
96 Boletim do Banco Central do Brasil – Annual Report 2011
Sales of basic products to the Latin America and the Caribbean totaled US$11.2 billion, of which 18.9% to member states of the Mercosur, corresponding to 9.2% of exports in this category and 19.6% of shipments destined for the region, with annual increase of 31.7%. Exports of basic products to the U.S. totaled US$8.7 billion, increasing 45.6% in the year and representing 7.1% of shipments in this category and 33.7% of the total exported to the country. Sales of basic products to other countries totaled US$17.1 billion, for annual expansion of 25.8%, representing 14% of the total exported and 39.6% of total sales to these countries.
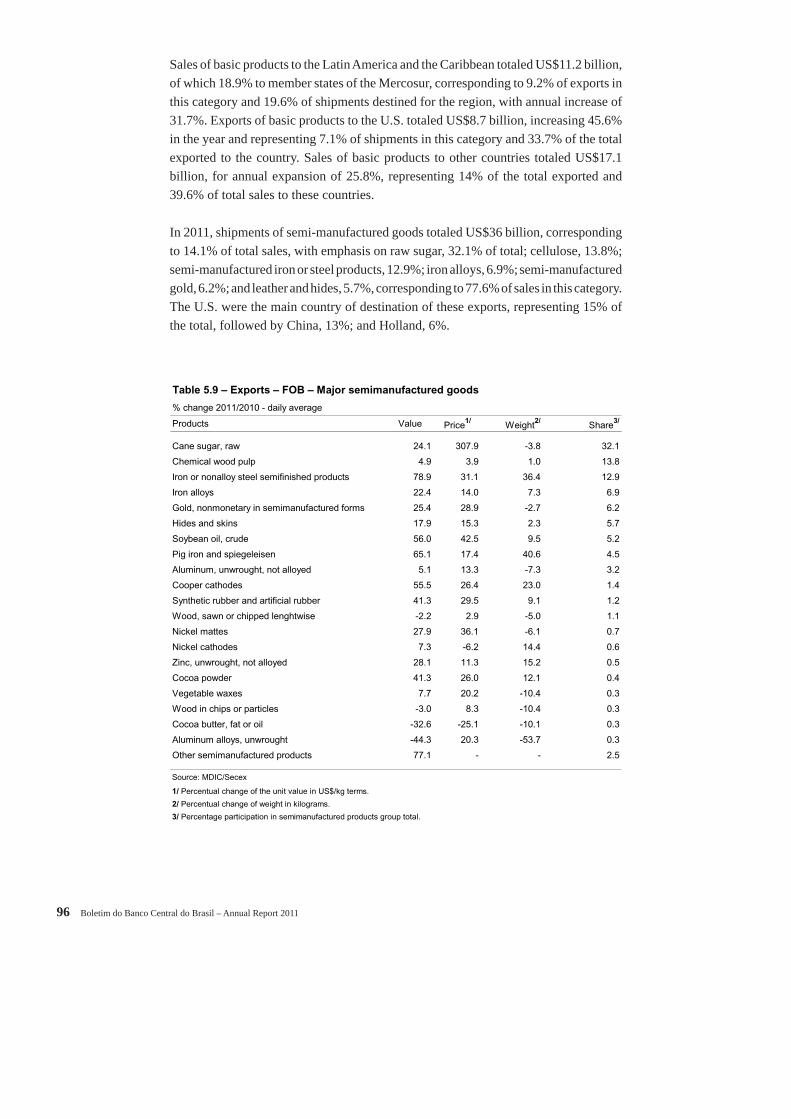
In 2011, shipments of semi-manufactured goods totaled US$36 billion, corresponding to 14.1% of total sales, with emphasis on raw sugar, 32.1% of total; cellulose, 13.8%; semi-manufactured iron or steel products, 12.9%; iron alloys, 6.9%; semi-manufactured gold, 6.2%; and leather and hides, 5.7%, corresponding to 77.6% of sales in this category. The U.S. were the main country of destination of these exports, representing 15% of the total, followed by China, 13%; and Holland, 6%.
Table 5.9 – Exports – FOB – Major semimanufactured goods
% change 2011/2010 - daily average
Products Value Price1/ Weight2/ Share3/
Cane sugar, raw 24.1 307.9 -3.8 32.1
Chemical wood pulp 4.9 3.9 1.0 13.8
Iron or nonalloy steel semifinished products 78.9 31.1 36.4 12.9
Iron alloys 22.4 14.0 7.3 6.9
Gold, nonmonetary in semimanufactured forms 25.4 28.9 -2.7 6.2
Hides and skins 17.9 15.3 2.3 5.7
Soybean oil, crude 56.0 42.5 9.5 5.2
Pig iron and spiegeleisen 65.1 17.4 40.6 4.5
Aluminum, unwrought, not alloyed 5.1 13.3 -7.3 3.2
Cooper cathodes 55.5 26.4 23.0 1.4
Synthetic rubber and artificial rubber 41.3 29.5 9.1 1.2
Wood, sawn or chipped lenghtwise -2.2 2.9 -5.0 1.1
Nickel mattes 27.9 36.1 -6.1 0.7
Nickel cathodes 7.3 -6.2 14.4 0.6
Zinc, unwrought, not alloyed 28.1 11.3 15.2 0.5
Cocoa powder 41.3 26.0 12.1 0.4
Vegetable waxes 7.7 20.2 -10.4 0.3
Wood in chips or particles -3.0 8.3 -10.4 0.3
Cocoa butter, fat or oil -32.6 -25.1 -10.1 0.3
Aluminum alloys, unwrought -44.3 20.3 -53.7 0.3
Other semimanufactured products 77.1 - - 2.5
Source: MDIC/Secex
1/ Percentual change of the unit value in US$/kg terms.
2/ Percentual change of weight in kilograms.
3/ Percentage participation in semimanufactured products group total.
V Economic-Financial Relations with the International Community 97
The regional analysis reveals that shipments to Asia, the principal destination of semi-manufactured products, totaled US$11 billion, increasing 10.4% in the year and accounting for 30.5% of sales in this category and 14.3% of total exports to the region. Semi-manufactured products exported to the EU totaled US$8.2 billion, up 34.8% in the year and accounting for 22.9% of sales in this category and 15.6% of total exports to the bloc. Sales to the U.S. increased 65% in the year, totaling US$5.3 billion, equivalent to 14.6% of exports in this category and 20.3% of the total country’s exports.
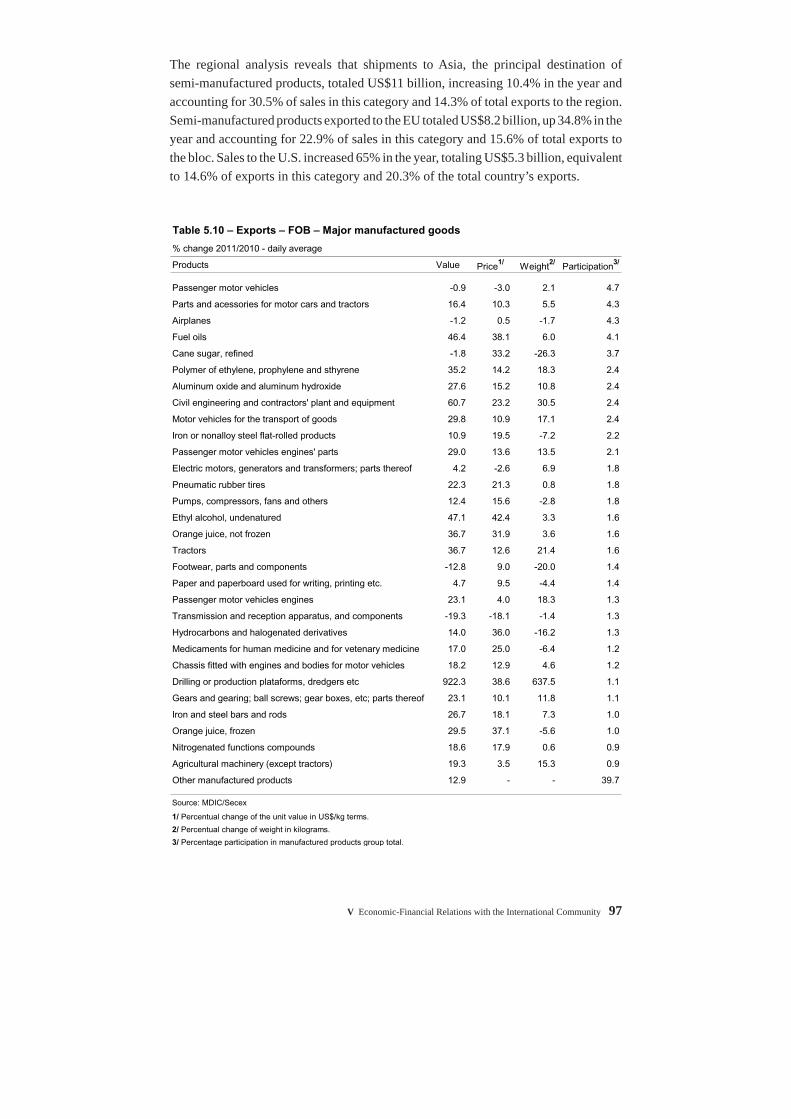
Table 5.10 – Exports – FOB – Major manufactured goods
% change 2011/2010 - daily average
Products Value Price1/ Weight2/ Participation3/
Passenger motor vehicles -0.9 -3.0 2.1 4.7
Parts and acessories for motor cars and tractors 16.4 10.3 5.5 4.3
Airplanes -1.2 0.5 -1.7 4.3
Fuel oils 46.4 38.1 6.0 4.1
Cane sugar, refined -1.8 33.2 -26.3 3.7
Polymer of ethylene, prophylene and sthyrene 35.2 14.2 18.3 2.4
Aluminum oxide and aluminum hydroxide 27.6 15.2 10.8 2.4
Civil engineering and contractors' plant and equipment 60.7 23.2 30.5 2.4
Motor vehicles for the transport of goods 29.8 10.9 17.1 2.4
Iron or nonalloy steel flat-rolled products 10.9 19.5 -7.2 2.2
Passenger motor vehicles engines' parts 29.0 13.6 13.5 2.1
Electric motors, generators and transformers; parts thereof 4.2 -2.6 6.9 1.8
Pneumatic rubber tires 22.3 21.3 0.8 1.8
Pumps, compressors, fans and others 12.4 15.6 -2.8 1.8
Ethyl alcohol, undenatured 47.1 42.4 3.3 1.6
Orange juice, not frozen 36.7 31.9 3.6 1.6
Tractors 36.7 12.6 21.4 1.6
Footwear, parts and components -12.8 9.0 -20.0 1.4
Paper and paperboard used for writing, printing etc. 4.7 9.5 -4.4 1.4
Passenger motor vehicles engines 23.1 4.0 18.3 1.3
Transmission and reception apparatus, and components -19.3 -18.1 -1.4 1.3
Hydrocarbons and halogenated derivatives 14.0 36.0 -16.2 1.3
Medicaments for human medicine and for vetenary medicine 17.0 25.0 -6.4 1.2
Chassis fitted with engines and bodies for motor vehicles 18.2 12.9 4.6 1.2
Drilling or production plataforms, dredgers etc 922.3 38.6 637.5 1.1
Gears and gearing; ball screws; gear boxes, etc; parts thereof 23.1 10.1 11.8 1.1
Iron and steel bars and rods 26.7 18.1 7.3 1.0
Orange juice, frozen 29.5 37.1 -5.6 1.0
Nitrogenated functions compounds 18.6 17.9 0.6 0.9
Agricultural machinery (except tractors) 19.3 3.5 15.3 0.9
Other manufactured products 12.9 - - 39.7
Source: MDIC/Secex
1/ Percentual change of the unit value in US$/kg terms.
2/ Percentual change of weight in kilograms.
3/ Percentage participation in manufactured products group total.
98 Boletim do Banco Central do Brasil – Annual Report 2011
Sales of semi-manufactured goods to the Latin America and the Caribbean, of which 29.3% to member states of the Mercosur, totaled US$2.2 billion, increasing 23.6% in the year and representing 6.1% of the total of this category and 3.8% of the total exported to these countries. Shipments of semi-manufactured products to the other countries of this area amounted to US$9.4 billion, with annual increase of 30.1%, corresponding to 26% of sales in this category and 21.6% of the total exported to the group.
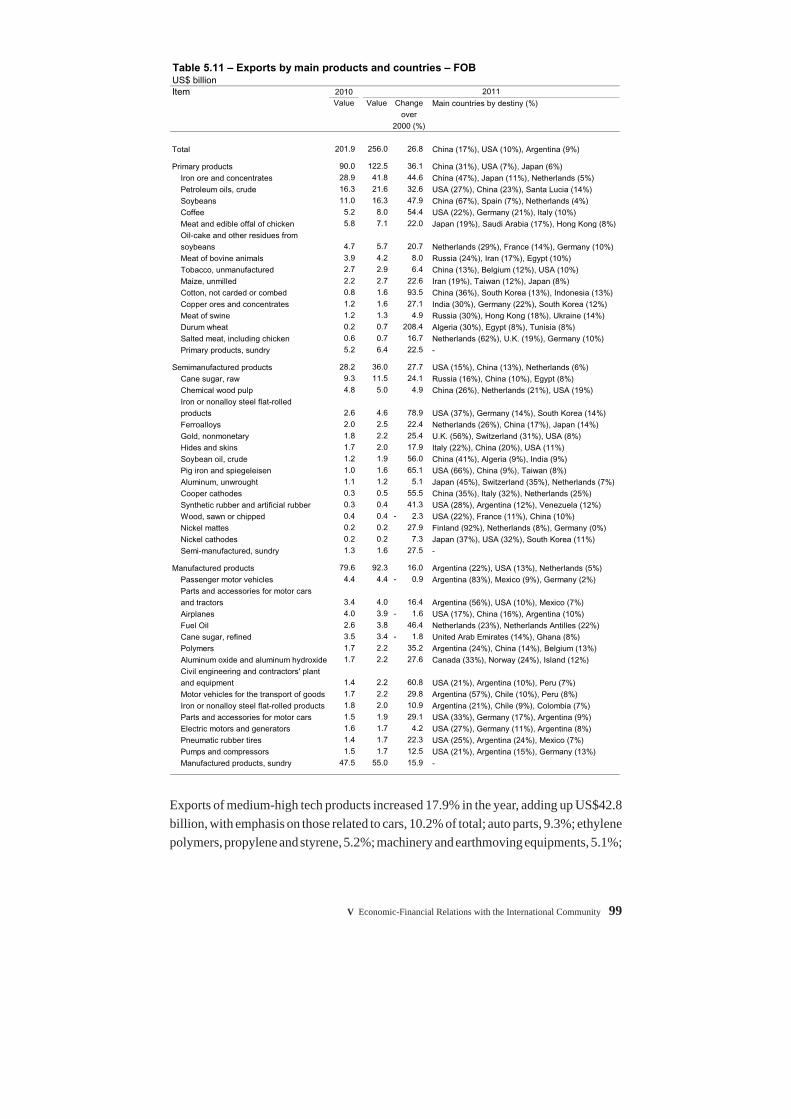
Exports of manufactured products totaled US$92.3 billion, corresponding to 36% of the Brazilian exports in 2011 and being concentrated in passenger cars, 4.7% of total; auto parts, 4.3%; airplanes, 4.3%; fuel oil, 4.1%; and refi ned sugar, 3.7%. Sales of manufactured goods were mainly shipped to Argentina, 22% of the total in this category; U.S., 13%; and Netherlands, 5%.
Shipments of manufactured goods to the Latin America and the Caribbean totaled US$43.7 billion, increasing 15.9% in the year, corresponding to 47.3% of sales in this category and 76.4% of total shipments to this region. Exports of manufactured products to the EU reached US$17.2 billion, for annual expansion of 11.4%, representing 18.6% of sales in this category and 32.4% of shipments to the bloc.
Exports of manufactured goods to the U.S. registered annual increase of 16.6%, to US$11.8 billion, corresponding to 12.8% of the total of this category and 45.5% of total sales to the country. Shipments to Asia totaled US$7.7 billion, responding for 8.3% of exports of this category and 10% of Brazilian sales to the region, registering annual increase of 34.1%. S sales of manufactured products to the other countries in the region totaled US$12 billion, with annual expansion of 12.5%, representing 13% of the sales of this category and 27.6% of shipments to these countries.
Special operations – including onboard consumption and re-exports – amounted to US$5.3 billion in 2011, increasing 27.2% in the year and corresponding to 2.1% of total exports.
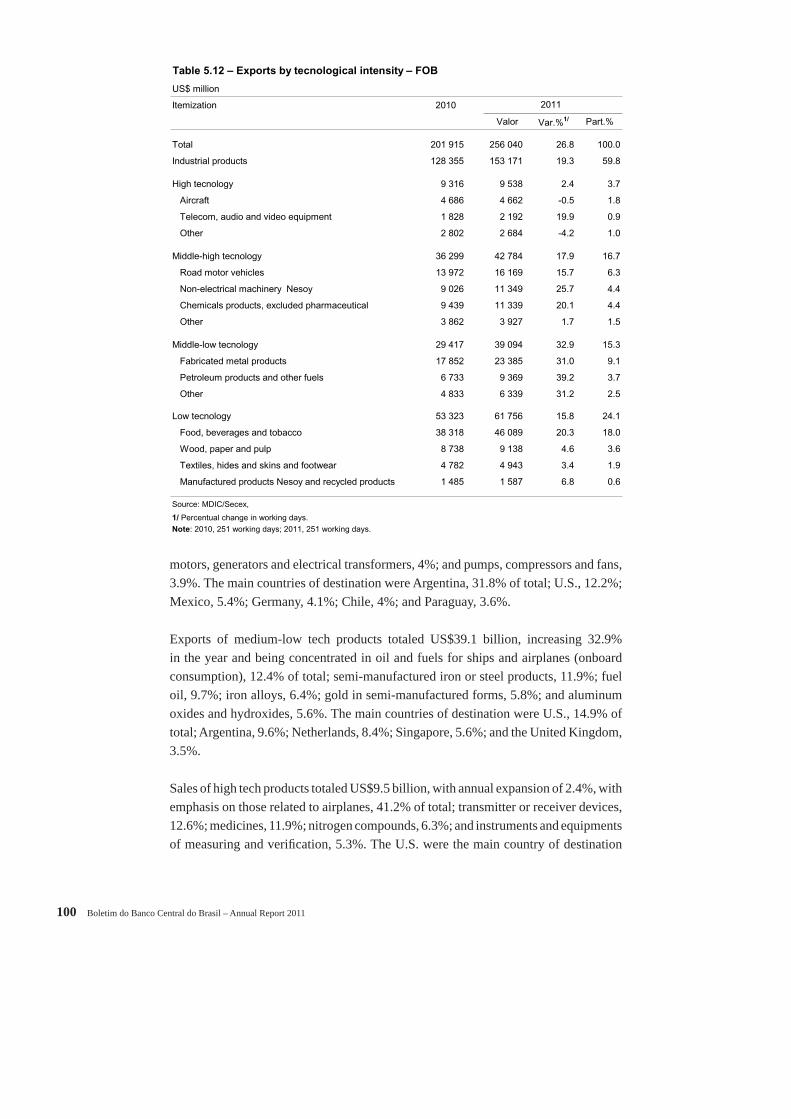
Exports of industrial products totaled US$153.2 billion in 2011, registering annual increase of 19.3%, corresponding to 59.8% of Brazilian exports, being distributed by low technology industries, 24.1% of total exports; medium-high technology, 16.7%, medium-low technology, 15.3%; and high technology, 3.7%.
Sales of low tech products totaled US$61.8 billion, with annual expansion of 15.8%. Shipments were concentrated in the segment of foodstuffs, beverage and tobacco, with emphasis on raw sugarcane, 18.7% of total; chicken meat, 11.4%; soybean meal, 9.2%; cellulose, 8.1%; and beef, 6.8%. The Netherlands was the main destination of these shipments, with 7.9% of total, followed by China, 7.3%; U.S., 7.3%; Russia, 5.7%; and Japan, 3.7%.
V Economic-Financial Relations with the International Community 99
Exports of medium-high tech products increased 17.9% in the year, adding up US$42.8 billion, with emphasis on those related to cars, 10.2% of total; auto parts, 9.3%; ethylene polymers, propylene and styrene, 5.2%; machinery and earthmoving equipments, 5.1%;
Table 5.11 – Exports by main products and countries – FOB
US$ billionItem 2010
Value Value Change Main countries by destiny (%)over
2000 (%)
Total 201.9 256.0 26.8 China (17%), USA (10%), Argentina (9%)
Primary products 90.0 122.5 36.1 China (31%), USA (7%), Japan (6%)Iron ore and concentrates 28.9 41.8 44.6 China (47%), Japan (11%), Netherlands (5%)Petroleum oils, crude 16.3 21.6 32.6 USA (27%), China (23%), Santa Lucia (14%)Soybeans 11.0 16.3 47.9 China (67%), Spain (7%), Netherlands (4%)Coffee 5.2 8.0 54.4 USA (22%), Germany (21%), Italy (10%)Meat and edible offal of chicken 5.8 7.1 22.0 Japan (19%), Saudi Arabia (17%), Hong Kong (8%)Oil-cake and other residues from soybeans 4.7 5.7 20.7 Netherlands (29%), France (14%), Germany (10%)Meat of bovine animals 3.9 4.2 8.0 Russia (24%), Iran (17%), Egypt (10%)Tobacco, unmanufactured 2.7 2.9 6.4 China (13%), Belgium (12%), USA (10%)Maize, unmilled 2.2 2.7 22.6 Iran (19%), Taiwan (12%), Japan (8%)Cotton, not carded or combed 0.8 1.6 93.5 China (36%), South Korea (13%), Indonesia (13%)Copper ores and concentrates 1.2 1.6 27.1 India (30%), Germany (22%), South Korea (12%)Meat of swine 1.2 1.3 4.9 Russia (30%), Hong Kong (18%), Ukraine (14%)Durum wheat 0.2 0.7 208.4 Algeria (30%), Egypt (8%), Tunisia (8%)Salted meat, including chicken 0.6 0.7 16.7 Netherlands (62%), U.K. (19%), Germany (10%)Primary products, sundry 5.2 6.4 22.5 -
Semimanufactured products 28.2 36.0 27.7 USA (15%), China (13%), Netherlands (6%)Cane sugar, raw 9.3 11.5 24.1 Russia (16%), China (10%), Egypt (8%)Chemical wood pulp 4.8 5.0 4.9 China (26%), Netherlands (21%), USA (19%)Iron or nonalloy steel flat-rolled products 2.6 4.6 78.9 USA (37%), Germany (14%), South Korea (14%)Ferroalloys 2.0 2.5 22.4 Netherlands (26%), China (17%), Japan (14%)Gold, nonmonetary 1.8 2.2 25.4 U.K. (56%), Switzerland (31%), USA (8%)Hides and skins 1.7 2.0 17.9 Italy (22%), China (20%), USA (11%)Soybean oil, crude 1.2 1.9 56.0 China (41%), Algeria (9%), India (9%)Pig iron and spiegeleisen 1.0 1.6 65.1 USA (66%), China (9%), Taiwan (8%)Aluminum, unwrought 1.1 1.2 5.1 Japan (45%), Switzerland (35%), Netherlands (7%)Cooper cathodes 0.3 0.5 55.5 China (35%), Italy (32%), Netherlands (25%)Synthetic rubber and artificial rubber 0.3 0.4 41.3 USA (28%), Argentina (12%), Venezuela (12%)Wood, sawn or chipped 0.4 0.4 - 2.3 USA (22%), France (11%), China (10%)Nickel mattes 0.2 0.2 27.9 Finland (92%), Netherlands (8%), Germany (0%)Nickel cathodes 0.2 0.2 7.3 Japan (37%), USA (32%), South Korea (11%)Semi-manufactured, sundry 1.3 1.6 27.5 -
Manufactured products 79.6 92.3 16.0 Argentina (22%), USA (13%), Netherlands (5%)Passenger motor vehicles 4.4 4.4 - 0.9 Argentina (83%), Mexico (9%), Germany (2%)Parts and accessories for motor carsand tractors 3.4 4.0 16.4 Argentina (56%), USA (10%), Mexico (7%)Airplanes 4.0 3.9 - 1.6 USA (17%), China (16%), Argentina (10%)Fuel Oil 2.6 3.8 46.4 Netherlands (23%), Netherlands Antilles (22%)Cane sugar, refined 3.5 3.4 - 1.8 United Arab Emirates (14%), Ghana (8%)Polymers 1.7 2.2 35.2 Argentina (24%), China (14%), Belgium (13%)Aluminum oxide and aluminum hydroxide 1.7 2.2 27.6 Canada (33%), Norway (24%), Island (12%)Civil engineering and contractors' plantand equipment 1.4 2.2 60.8 USA (21%), Argentina (10%), Peru (7%)Motor vehicles for the transport of goods 1.7 2.2 29.8 Argentina (57%), Chile (10%), Peru (8%)Iron or nonalloy steel flat-rolled products 1.8 2.0 10.9 Argentina (21%), Chile (9%), Colombia (7%)Parts and accessories for motor cars 1.5 1.9 29.1 USA (33%), Germany (17%), Argentina (9%)Electric motors and generators 1.6 1.7 4.2 USA (27%), Germany (11%), Argentina (8%)Pneumatic rubber tires 1.4 1.7 22.3 USA (25%), Argentina (24%), Mexico (7%)Pumps and compressors 1.5 1.7 12.5 USA (21%), Argentina (15%), Germany (13%)Manufactured products, sundry 47.5 55.0 15.9 -
2011
100 Boletim do Banco Central do Brasil – Annual Report 2011
motors, generators and electrical transformers, 4%; and pumps, compressors and fans, 3.9%. The main countries of destination were Argentina, 31.8% of total; U.S., 12.2%; Mexico, 5.4%; Germany, 4.1%; Chile, 4%; and Paraguay, 3.6%.
Exports of medium-low tech products totaled US$39.1 billion, increasing 32.9% in the year and being concentrated in oil and fuels for ships and airplanes (onboard consumption), 12.4% of total; semi-manufactured iron or steel products, 11.9%; fuel oil, 9.7%; iron alloys, 6.4%; gold in semi-manufactured forms, 5.8%; and aluminum oxides and hydroxides, 5.6%. The main countries of destination were U.S., 14.9% of total; Argentina, 9.6%; Netherlands, 8.4%; Singapore, 5.6%; and the United Kingdom, 3.5%.
Sales of high tech products totaled US$9.5 billion, with annual expansion of 2.4%, with emphasis on those related to airplanes, 41.2% of total; transmitter or receiver devices, 12.6%; medicines, 11.9%; nitrogen compounds, 6.3%; and instruments and equipments of measuring and verifi cation, 5.3%. The U.S. were the main country of destination
Table 5.12 – Exports by tecnological intensity – FOB
US$ million
Itemization 2010
Valor Var.%1/ Part.%
Total 201 915 256 040 26.8 100.0
Industrial products 128 355 153 171 19.3 59.8
High tecnology 9 316 9 538 2.4 3.7
Aircraft 4 686 4 662 -0.5 1.8
Telecom, audio and video equipment 1 828 2 192 19.9 0.9
Other 2 802 2 684 -4.2 1.0
Middle-high tecnology 36 299 42 784 17.9 16.7
Road motor vehicles 13 972 16 169 15.7 6.3
Non-electrical machinery Nesoy 9 026 11 349 25.7 4.4
Chemicals products, excluded pharmaceutical 9 439 11 339 20.1 4.4
Other 3 862 3 927 1.7 1.5
Middle-low tecnology 29 417 39 094 32.9 15.3
Fabricated metal products 17 852 23 385 31.0 9.1
Petroleum products and other fuels 6 733 9 369 39.2 3.7
Other 4 833 6 339 31.2 2.5
Low tecnology 53 323 61 756 15.8 24.1
Food, beverages and tobacco 38 318 46 089 20.3 18.0
Wood, paper and pulp 8 738 9 138 4.6 3.6
Textiles, hides and skins and footwear 4 782 4 943 3.4 1.9
Manufactured products Nesoy and recycled products 1 485 1 587 6.8 0.6
Source: MDIC/Secex,
1/ Percentual change in working days.Note: 2010, 251 working days; 2011, 251 working days.
2011
V Economic-Financial Relations with the International Community 101
of these products, registering 16.7% of total; followed by Argentina, 12.8%; China, 8.1%; Germany, 5.1%; Mexico, 4.2%; and France, 2.8%.
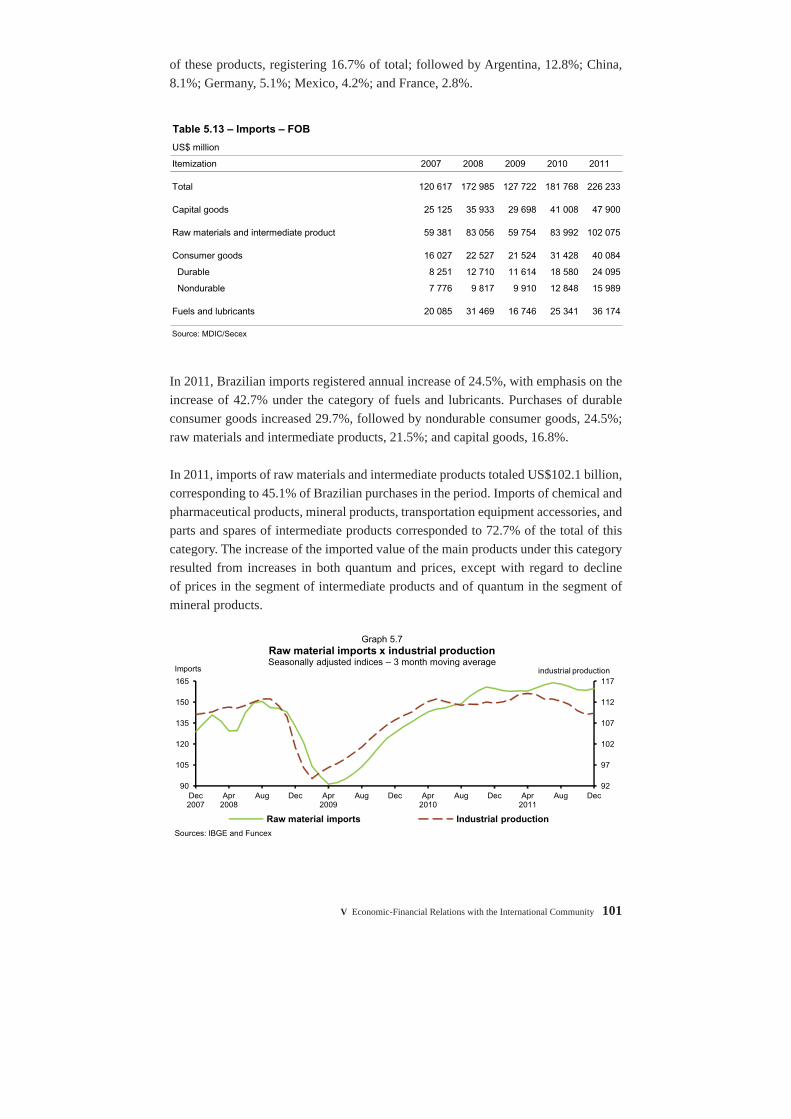
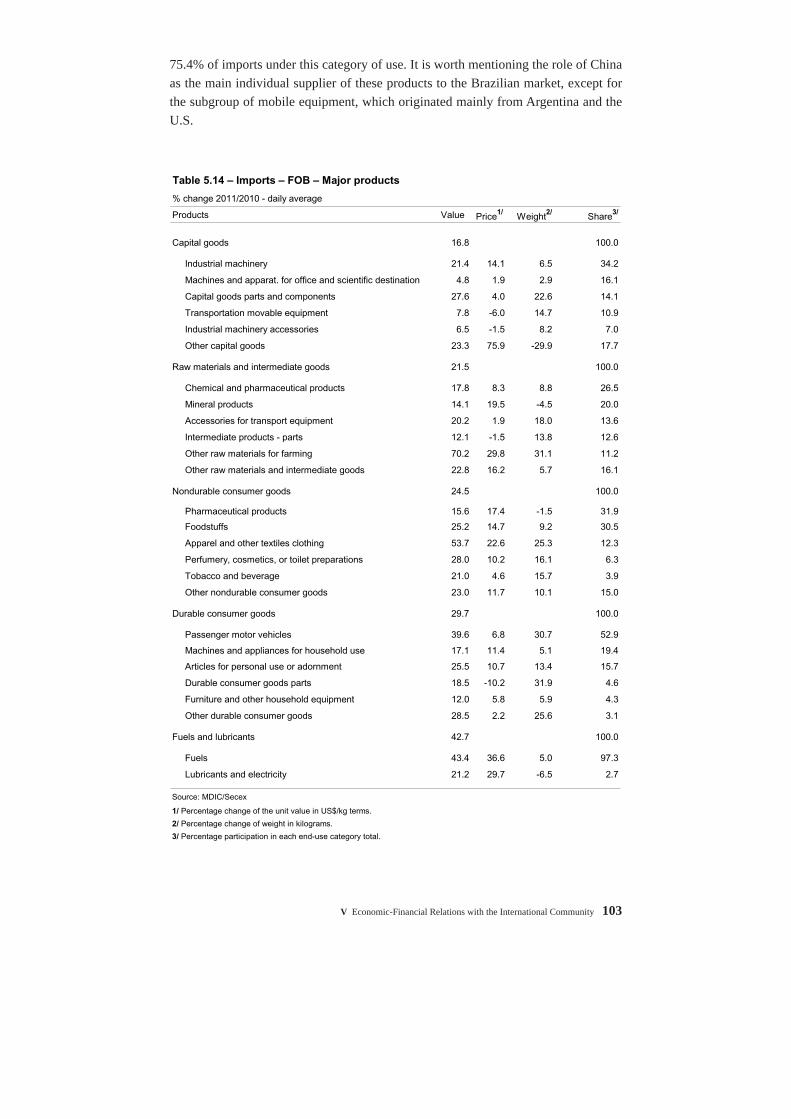
In 2011, Brazilian imports registered annual increase of 24.5%, with emphasis on the increase of 42.7% under the category of fuels and lubricants. Purchases of durable consumer goods increased 29.7%, followed by nondurable consumer goods, 24.5%; raw materials and intermediate products, 21.5%; and capital goods, 16.8%.
In 2011, imports of raw materials and intermediate products totaled US$102.1 billion, corresponding to 45.1% of Brazilian purchases in the period. Imports of chemical and pharmaceutical products, mineral products, transportation equipment accessories, and parts and spares of intermediate products corresponded to 72.7% of the total of this category. The increase of the imported value of the main products under this category resulted from increases in both quantum and prices, except with regard to decline of prices in the segment of intermediate products and of quantum in the segment of mineral products.
Table 5.13 – Imports – FOB
US$ million
Itemization 2007 2008 2009 2010 2011
Total 120 617 172 985 127 722 181 768 226 233
Capital goods 25 125 35 933 29 698 41 008 47 900
Raw materials and intermediate product 59 381 83 056 59 754 83 992 102 075
Consumer goods 16 027 22 527 21 524 31 428 40 084
Durable 8 251 12 710 11 614 18 580 24 095
Nondurable 7 776 9 817 9 910 12 848 15 989
Fuels and lubricants 20 085 31 469 16 746 25 341 36 174
Source: MDIC/Secex
92
97
102
107
112
117
90
105
120
135
150
165
Dec 2007
Apr 2008
Aug Dec Apr 2009
Aug Dec Apr 2010
Aug Dec Apr 2011
Aug Dec
industrial productionImports
Sources: IBGE and Funcex
Raw material imports Industrial production
Graph 5.7Raw material imports x industrial productionSeasonally adjusted indices – 3 month moving average
102 Boletim do Banco Central do Brasil – Annual Report 2011
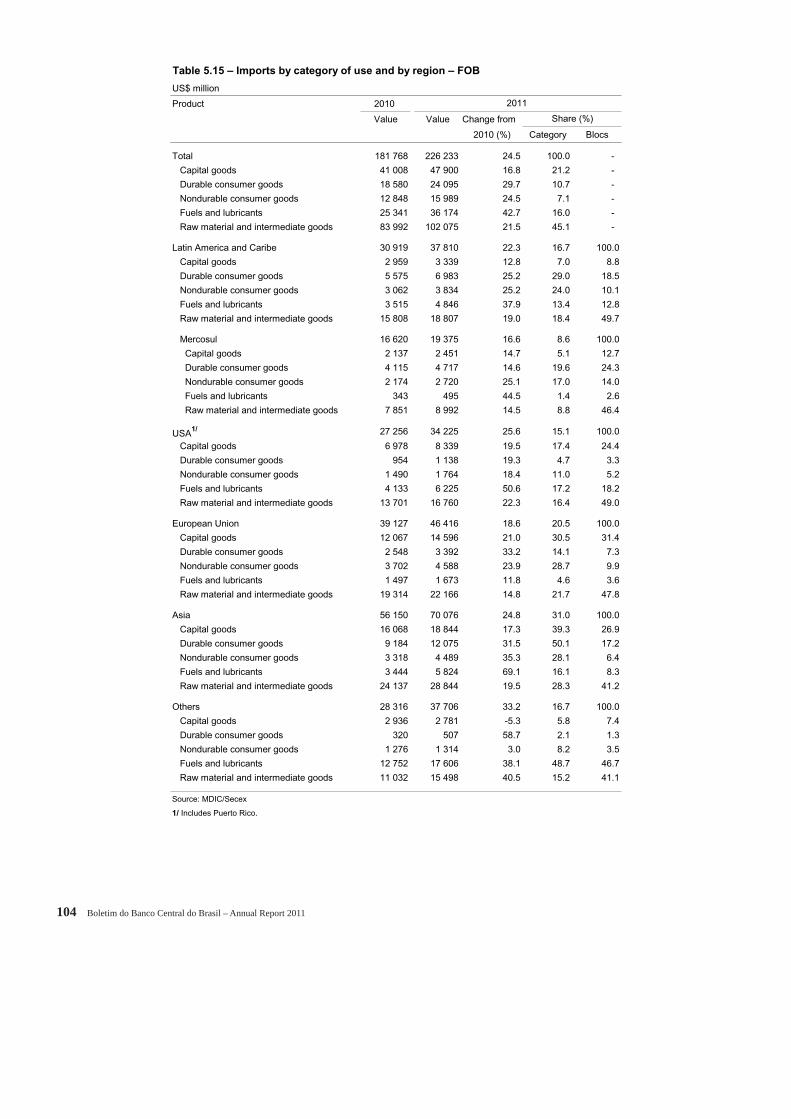
Imports of raw materials and intermediate products coming from Asia, the EU, Latin America and the Caribbean totaled US$28.8 billion, US$22.2 billion and US$18.8 billion, respectively, corresponding to 68.4% of imports under this category. Purchases from other countries increased 40.6% in the year, with emphasis on the increase of 70.2% in those associated to other raw materials for the agricultural sector.
The U.S., China and Argentina were the three main markets of origin, accounting for 35% of imports under this category. Purchases were concentrated under chemical and pharmaceutical products, mineral products, transportation equipment accessories and parts and spares of intermediate products, totaling US$74.3 billion and representing 72.7% of purchases in this category. It should be noted the participation of Mercosur member states as suppliers of food products, with emphasis on the imports from Argentina.
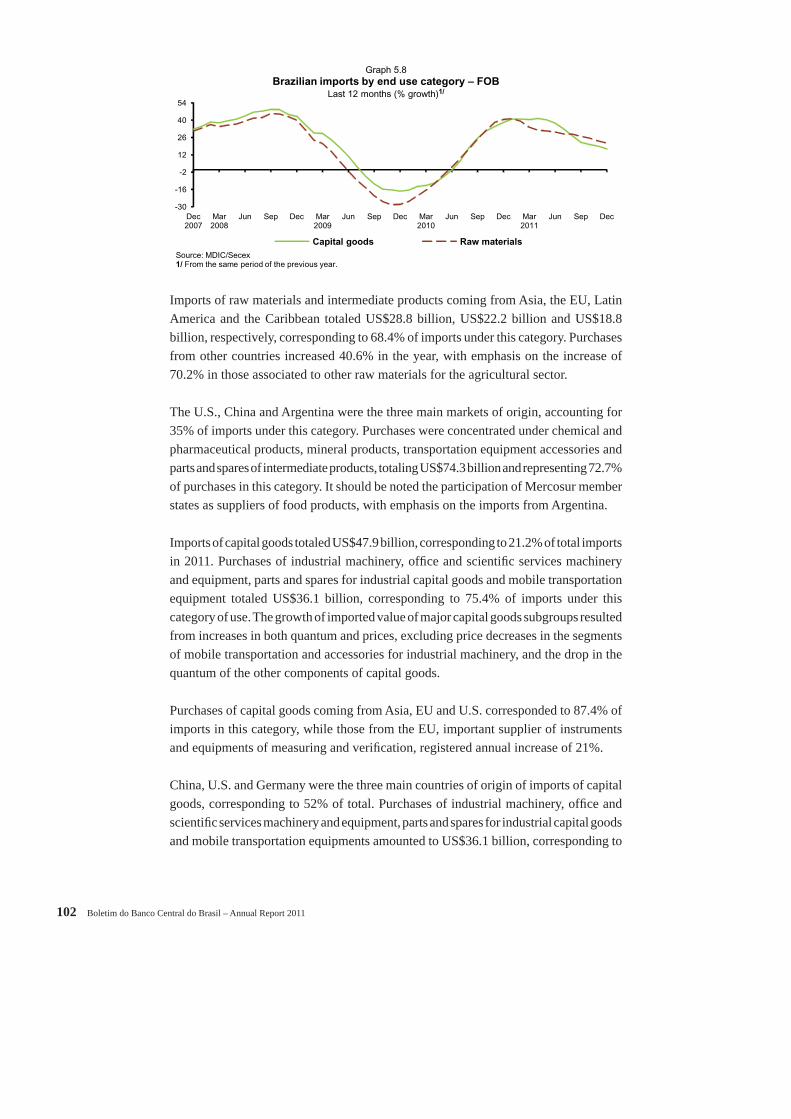
Imports of capital goods totaled US$47.9 billion, corresponding to 21.2% of total imports in 2011. Purchases of industrial machinery, offi ce and scientifi c services machinery and equipment, parts and spares for industrial capital goods and mobile transportation equipment totaled US$36.1 billion, corresponding to 75.4% of imports under this category of use. The growth of imported value of major capital goods subgroups resulted from increases in both quantum and prices, excluding price decreases in the segments of mobile transportation and accessories for industrial machinery, and the drop in the quantum of the other components of capital goods.
Purchases of capital goods coming from Asia, EU and U.S. corresponded to 87.4% of imports in this category, while those from the EU, important supplier of instruments and equipments of measuring and verifi cation, registered annual increase of 21%.
China, U.S. and Germany were the three main countries of origin of imports of capital goods, corresponding to 52% of total. Purchases of industrial machinery, offi ce and scientifi c services machinery and equipment, parts and spares for industrial capital goods and mobile transportation equipments amounted to US$36.1 billion, corresponding to
-30
-16
-2
12
26
40
54
Dec 2007
Mar 2008
Jun Sep Dec Mar 2009
Jun Sep Dec Mar 2010
Jun Sep Dec Mar 2011
Jun Sep Dec
Source: MDIC/Secex1/ From the same period of the previous year.
Capital goods Raw materials
Graph 5.8Brazilian imports by end use category – FOB
Last 12 months (% growth)1/
V Economic-Financial Relations with the International Community 103
75.4% of imports under this category of use. It is worth mentioning the role of China as the main individual supplier of these products to the Brazilian market, except for the subgroup of mobile equipment, which originated mainly from Argentina and the U.S.
Table 5.14 – Imports – FOB – Major products
% change 2011/2010 - daily average
Products Value Price1/ Weight2/ Share3/
Capital goods 16.8 100.0
Industrial machinery 21.4 14.1 6.5 34.2
Machines and apparat. for office and scientific destination 4.8 1.9 2.9 16.1
Capital goods parts and components 27.6 4.0 22.6 14.1
Transportation movable equipment 7.8 -6.0 14.7 10.9
Industrial machinery accessories 6.5 -1.5 8.2 7.0
Other capital goods 23.3 75.9 -29.9 17.7
Raw materials and intermediate goods 21.5 100.0
Chemical and pharmaceutical products 17.8 8.3 8.8 26.5
Mineral products 14.1 19.5 -4.5 20.0
Accessories for transport equipment 20.2 1.9 18.0 13.6
Intermediate products - parts 12.1 -1.5 13.8 12.6
Other raw materials for farming 70.2 29.8 31.1 11.2
Other raw materials and intermediate goods 22.8 16.2 5.7 16.1
Nondurable consumer goods 24.5 100.0
Pharmaceutical products 15.6 17.4 -1.5 31.9
Foodstuffs 25.2 14.7 9.2 30.5
Apparel and other textiles clothing 53.7 22.6 25.3 12.3
Perfumery, cosmetics, or toilet preparations 28.0 10.2 16.1 6.3
Tobacco and beverage 21.0 4.6 15.7 3.9
Other nondurable consumer goods 23.0 11.7 10.1 15.0
Durable consumer goods 29.7 100.0
Passenger motor vehicles 39.6 6.8 30.7 52.9
Machines and appliances for household use 17.1 11.4 5.1 19.4
Articles for personal use or adornment 25.5 10.7 13.4 15.7
Durable consumer goods parts 18.5 -10.2 31.9 4.6
Furniture and other household equipment 12.0 5.8 5.9 4.3
Other durable consumer goods 28.5 2.2 25.6 3.1
Fuels and lubricants 42.7 100.0
Fuels 43.4 36.6 5.0 97.3
Lubricants and electricity 21.2 29.7 -6.5 2.7
Source: MDIC/Secex
1/ Percentage change of the unit value in US$/kg terms.
2/ Percentage change of weight in kilograms.
3/ Percentage participation in each end-use category total.
104 Boletim do Banco Central do Brasil – Annual Report 2011
Table 5.15 – Imports by category of use and by region – FOB
US$ million
Product 2010
Value Value Change from
2010 (%) Category Blocs
Total 181 768 226 233 24.5 100.0 -
Capital goods 41 008 47 900 16.8 21.2 -
Durable consumer goods 18 580 24 095 29.7 10.7 -
Nondurable consumer goods 12 848 15 989 24.5 7.1 -
Fuels and lubricants 25 341 36 174 42.7 16.0 -
Raw material and intermediate goods 83 992 102 075 21.5 45.1 -
Latin America and Caribe 30 919 37 810 22.3 16.7 100.0
Capital goods 2 959 3 339 12.8 7.0 8.8
Durable consumer goods 5 575 6 983 25.2 29.0 18.5
Nondurable consumer goods 3 062 3 834 25.2 24.0 10.1
Fuels and lubricants 3 515 4 846 37.9 13.4 12.8
Raw material and intermediate goods 15 808 18 807 19.0 18.4 49.7
Mercosul 16 620 19 375 16.6 8.6 100.0
Capital goods 2 137 2 451 14.7 5.1 12.7
Durable consumer goods 4 115 4 717 14.6 19.6 24.3
Nondurable consumer goods 2 174 2 720 25.1 17.0 14.0
Fuels and lubricants 343 495 44.5 1.4 2.6
Raw material and intermediate goods 7 851 8 992 14.5 8.8 46.4
USA1/ 27 256 34 225 25.6 15.1 100.0
Capital goods 6 978 8 339 19.5 17.4 24.4
Durable consumer goods 954 1 138 19.3 4.7 3.3
Nondurable consumer goods 1 490 1 764 18.4 11.0 5.2
Fuels and lubricants 4 133 6 225 50.6 17.2 18.2
Raw material and intermediate goods 13 701 16 760 22.3 16.4 49.0
European Union 39 127 46 416 18.6 20.5 100.0
Capital goods 12 067 14 596 21.0 30.5 31.4
Durable consumer goods 2 548 3 392 33.2 14.1 7.3
Nondurable consumer goods 3 702 4 588 23.9 28.7 9.9
Fuels and lubricants 1 497 1 673 11.8 4.6 3.6
Raw material and intermediate goods 19 314 22 166 14.8 21.7 47.8
Asia 56 150 70 076 24.8 31.0 100.0
Capital goods 16 068 18 844 17.3 39.3 26.9
Durable consumer goods 9 184 12 075 31.5 50.1 17.2
Nondurable consumer goods 3 318 4 489 35.3 28.1 6.4
Fuels and lubricants 3 444 5 824 69.1 16.1 8.3
Raw material and intermediate goods 24 137 28 844 19.5 28.3 41.2
Others 28 316 37 706 33.2 16.7 100.0
Capital goods 2 936 2 781 -5.3 5.8 7.4
Durable consumer goods 320 507 58.7 2.1 1.3
Nondurable consumer goods 1 276 1 314 3.0 8.2 3.5
Fuels and lubricants 12 752 17 606 38.1 48.7 46.7
Raw material and intermediate goods 11 032 15 498 40.5 15.2 41.1
Source: MDIC/Secex
1/ Includes Puerto Rico.
2011
Share (%)
V Economic-Financial Relations with the International Community 105
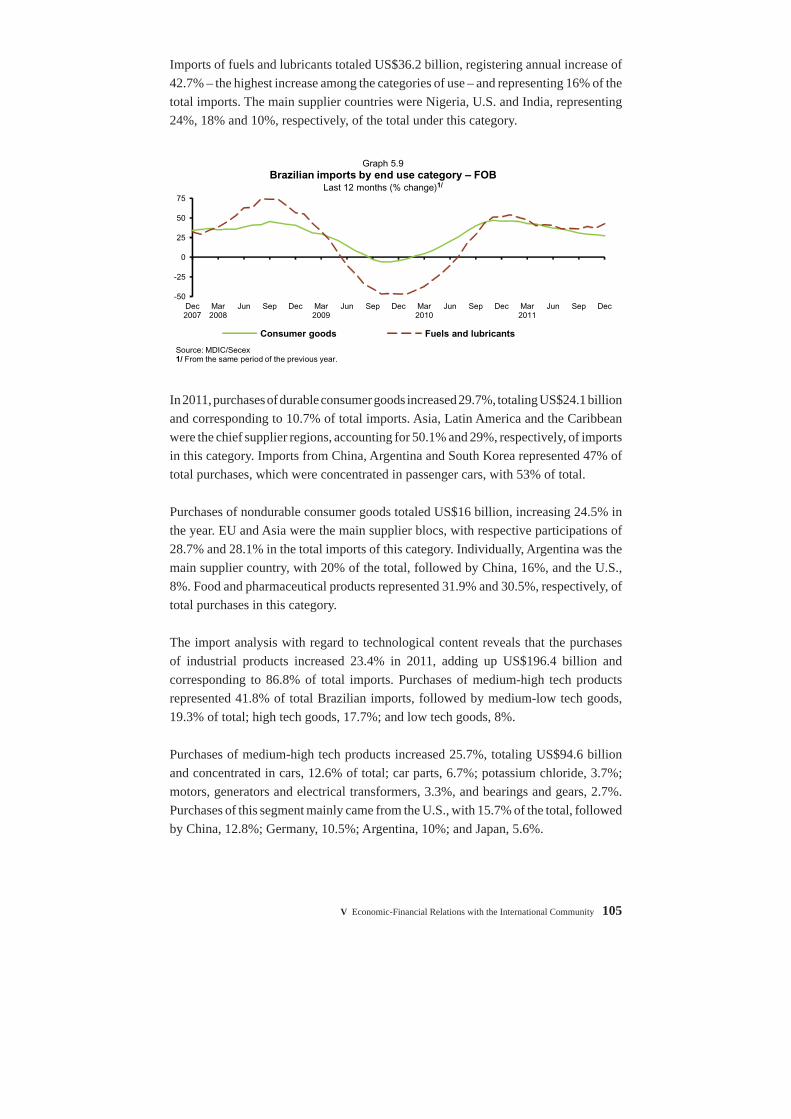
Imports of fuels and lubricants totaled US$36.2 billion, registering annual increase of 42.7% – the highest increase among the categories of use – and representing 16% of the total imports. The main supplier countries were Nigeria, U.S. and India, representing 24%, 18% and 10%, respectively, of the total under this category.
In 2011, purchases of durable consumer goods increased 29.7%, totaling US$24.1 billion and corresponding to 10.7% of total imports. Asia, Latin America and the Caribbean were the chief supplier regions, accounting for 50.1% and 29%, respectively, of imports in this category. Imports from China, Argentina and South Korea represented 47% of total purchases, which were concentrated in passenger cars, with 53% of total.
Purchases of nondurable consumer goods totaled US$16 billion, increasing 24.5% in the year. EU and Asia were the main supplier blocs, with respective participations of 28.7% and 28.1% in the total imports of this category. Individually, Argentina was the main supplier country, with 20% of the total, followed by China, 16%, and the U.S., 8%. Food and pharmaceutical products represented 31.9% and 30.5%, respectively, of total purchases in this category.
The import analysis with regard to technological content reveals that the purchases of industrial products increased 23.4% in 2011, adding up US$196.4 billion and corresponding to 86.8% of total imports. Purchases of medium-high tech products represented 41.8% of total Brazilian imports, followed by medium-low tech goods, 19.3% of total; high tech goods, 17.7%; and low tech goods, 8%.
Purchases of medium-high tech products increased 25.7%, totaling US$94.6 billion and concentrated in cars, 12.6% of total; car parts, 6.7%; potassium chloride, 3.7%; motors, generators and electrical transformers, 3.3%, and bearings and gears, 2.7%. Purchases of this segment mainly came from the U.S., with 15.7% of the total, followed by China, 12.8%; Germany, 10.5%; Argentina, 10%; and Japan, 5.6%.
-50
-25
0
25
50
75
Dec 2007
Mar 2008
Jun Sep Dec Mar 2009
Jun Sep Dec Mar 2010
Jun Sep Dec Mar 2011
Jun Sep Dec
Source: MDIC/Secex1/ From the same period of the previous year.
Consumer goods Fuels and lubricants
Graph 5.9Brazilian imports by end use category – FOB
Last 12 months (% change)1/
106 Boletim do Banco Central do Brasil – Annual Report 2011
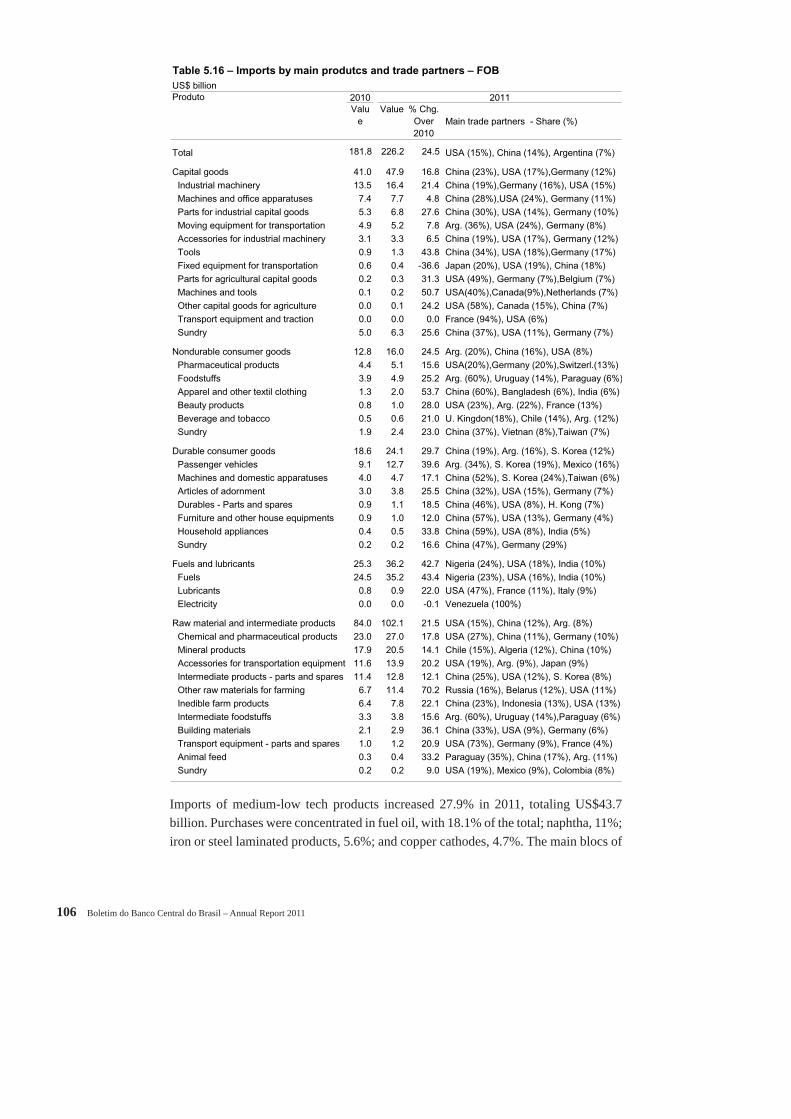
Imports of medium-low tech products increased 27.9% in 2011, totaling US$43.7 billion. Purchases were concentrated in fuel oil, with 18.1% of the total; naphtha, 11%; iron or steel laminated products, 5.6%; and copper cathodes, 4.7%. The main blocs of
Table 5.16 – Imports by main produtcs and trade partners – FOB
US$ billionProduto 2010
Value
Value % Chg. Over 2010
Main trade partners - Share (%)
Total 181.8 226.2 24.5 USA (15%), China (14%), Argentina (7%)
Capital goods 41.0 47.9 16.8 China (23%), USA (17%),Germany (12%)Industrial machinery 13.5 16.4 21.4 China (19%),Germany (16%), USA (15%)Machines and office apparatuses 7.4 7.7 4.8 China (28%),USA (24%), Germany (11%)Parts for industrial capital goods 5.3 6.8 27.6 China (30%), USA (14%), Germany (10%)Moving equipment for transportation 4.9 5.2 7.8 Arg. (36%), USA (24%), Germany (8%)Accessories for industrial machinery 3.1 3.3 6.5 China (19%), USA (17%), Germany (12%)Tools 0.9 1.3 43.8 China (34%), USA (18%),Germany (17%)Fixed equipment for transportation 0.6 0.4 -36.6 Japan (20%), USA (19%), China (18%)Parts for agricultural capital goods 0.2 0.3 31.3 USA (49%), Germany (7%),Belgium (7%)Machines and tools 0.1 0.2 50.7 USA(40%),Canada(9%),Netherlands (7%)Other capital goods for agriculture 0.0 0.1 24.2 USA (58%), Canada (15%), China (7%)Transport equipment and traction 0.0 0.0 0.0 France (94%), USA (6%)Sundry 5.0 6.3 25.6 China (37%), USA (11%), Germany (7%)
Nondurable consumer goods 12.8 16.0 24.5 Arg. (20%), China (16%), USA (8%)Pharmaceutical products 4.4 5.1 15.6 USA(20%),Germany (20%),Switzerl.(13%)Foodstuffs 3.9 4.9 25.2 Arg. (60%), Uruguay (14%), Paraguay (6%)Apparel and other textil clothing 1.3 2.0 53.7 China (60%), Bangladesh (6%), India (6%)Beauty products 0.8 1.0 28.0 USA (23%), Arg. (22%), France (13%)Beverage and tobacco 0.5 0.6 21.0 U. Kingdon(18%), Chile (14%), Arg. (12%)Sundry 1.9 2.4 23.0 China (37%), Vietnan (8%),Taiwan (7%)
Durable consumer goods 18.6 24.1 29.7 China (19%), Arg. (16%), S. Korea (12%)Passenger vehicles 9.1 12.7 39.6 Arg. (34%), S. Korea (19%), Mexico (16%)Machines and domestic apparatuses 4.0 4.7 17.1 China (52%), S. Korea (24%),Taiwan (6%)Articles of adornment 3.0 3.8 25.5 China (32%), USA (15%), Germany (7%)Durables - Parts and spares 0.9 1.1 18.5 China (46%), USA (8%), H. Kong (7%)Furniture and other house equipments 0.9 1.0 12.0 China (57%), USA (13%), Germany (4%)Household appliances 0.4 0.5 33.8 China (59%), USA (8%), India (5%)Sundry 0.2 0.2 16.6 China (47%), Germany (29%)
Fuels and lubricants 25.3 36.2 42.7 Nigeria (24%), USA (18%), India (10%)Fuels 24.5 35.2 43.4 Nigeria (23%), USA (16%), India (10%)Lubricants 0.8 0.9 22.0 USA (47%), France (11%), Italy (9%)Electricity 0.0 0.0 -0.1 Venezuela (100%)
Raw material and intermediate products 84.0 102.1 21.5 USA (15%), China (12%), Arg. (8%)Chemical and pharmaceutical products 23.0 27.0 17.8 USA (27%), China (11%), Germany (10%)Mineral products 17.9 20.5 14.1 Chile (15%), Algeria (12%), China (10%)Accessories for transportation equipment 11.6 13.9 20.2 USA (19%), Arg. (9%), Japan (9%)Intermediate products - parts and spares 11.4 12.8 12.1 China (25%), USA (12%), S. Korea (8%)Other raw materials for farming 6.7 11.4 70.2 Russia (16%), Belarus (12%), USA (11%)Inedible farm products 6.4 7.8 22.1 China (23%), Indonesia (13%), USA (13%)Intermediate foodstuffs 3.3 3.8 15.6 Arg. (60%), Uruguay (14%),Paraguay (6%)Building materials 2.1 2.9 36.1 China (33%), USA (9%), Germany (6%)Transport equipment - parts and spares 1.0 1.2 20.9 USA (73%), Germany (9%), France (4%)Animal feed 0.3 0.4 33.2 Paraguay (35%), China (17%), Arg. (11%)Sundry 0.2 0.2 9.0 USA (19%), Mexico (9%), Colombia (8%)
2011
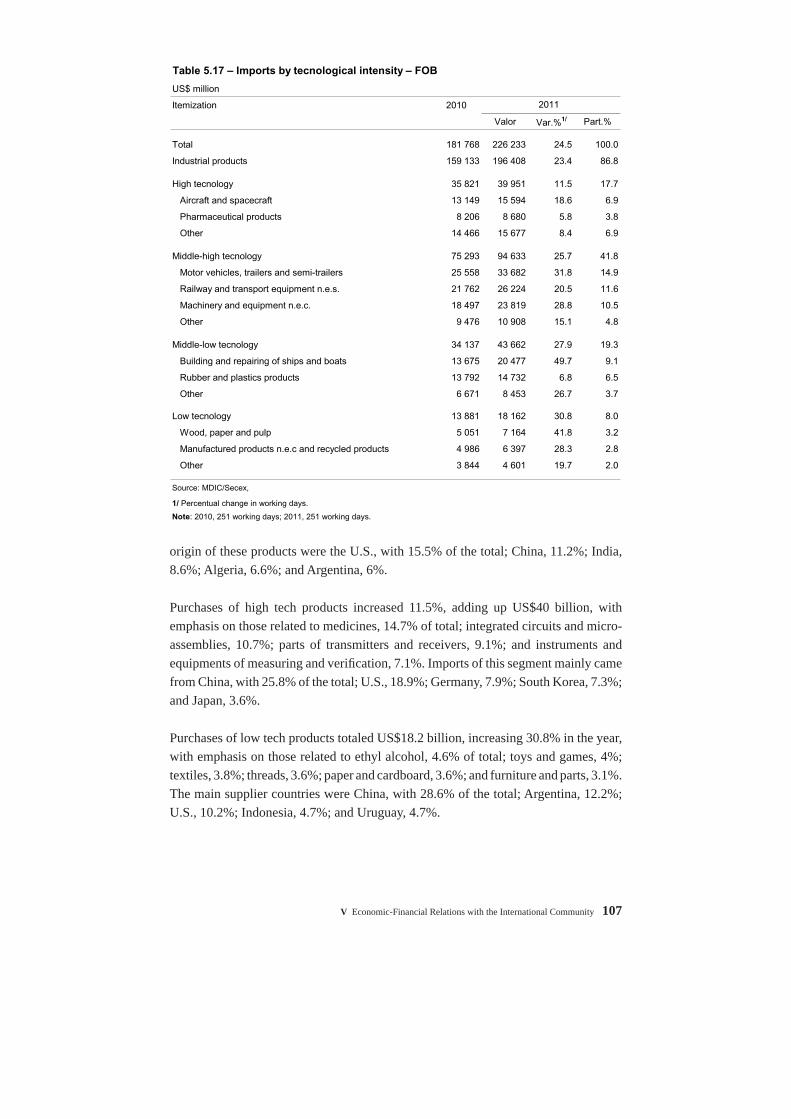
V Economic-Financial Relations with the International Community 107
origin of these products were the U.S., with 15.5% of the total; China, 11.2%; India, 8.6%; Algeria, 6.6%; and Argentina, 6%.
Purchases of high tech products increased 11.5%, adding up US$40 billion, with emphasis on those related to medicines, 14.7% of total; integrated circuits and micro-assemblies, 10.7%; parts of transmitters and receivers, 9.1%; and instruments and equipments of measuring and verifi cation, 7.1%. Imports of this segment mainly came from China, with 25.8% of the total; U.S., 18.9%; Germany, 7.9%; South Korea, 7.3%; and Japan, 3.6%.
Purchases of low tech products totaled US$18.2 billion, increasing 30.8% in the year, with emphasis on those related to ethyl alcohol, 4.6% of total; toys and games, 4%; textiles, 3.8%; threads, 3.6%; paper and cardboard, 3.6%; and furniture and parts, 3.1%. The main supplier countries were China, with 28.6% of the total; Argentina, 12.2%; U.S., 10.2%; Indonesia, 4.7%; and Uruguay, 4.7%.
Table 5.17 – Imports by tecnological intensity – FOB
US$ million
Itemization 2010
Valor Var.%1/ Part.%
Total 181 768 226 233 24.5 100.0
Industrial products 159 133 196 408 23.4 86.8
High tecnology 35 821 39 951 11.5 17.7
Aircraft and spacecraft 13 149 15 594 18.6 6.9
Pharmaceutical products 8 206 8 680 5.8 3.8
Other 14 466 15 677 8.4 6.9
Middle-high tecnology 75 293 94 633 25.7 41.8
Motor vehicles, trailers and semi-trailers 25 558 33 682 31.8 14.9
Railway and transport equipment n.e.s. 21 762 26 224 20.5 11.6
Machinery and equipment n.e.c. 18 497 23 819 28.8 10.5
Other 9 476 10 908 15.1 4.8
Middle-low tecnology 34 137 43 662 27.9 19.3
Building and repairing of ships and boats 13 675 20 477 49.7 9.1
Rubber and plastics products 13 792 14 732 6.8 6.5
Other 6 671 8 453 26.7 3.7
Low tecnology 13 881 18 162 30.8 8.0
Wood, paper and pulp 5 051 7 164 41.8 3.2
Manufactured products n.e.c and recycled products 4 986 6 397 28.3 2.8
Other 3 844 4 601 19.7 2.0
Source: MDIC/Secex,
1/ Percentual change in working days.
Note: 2010, 251 working days; 2011, 251 working days.
2011
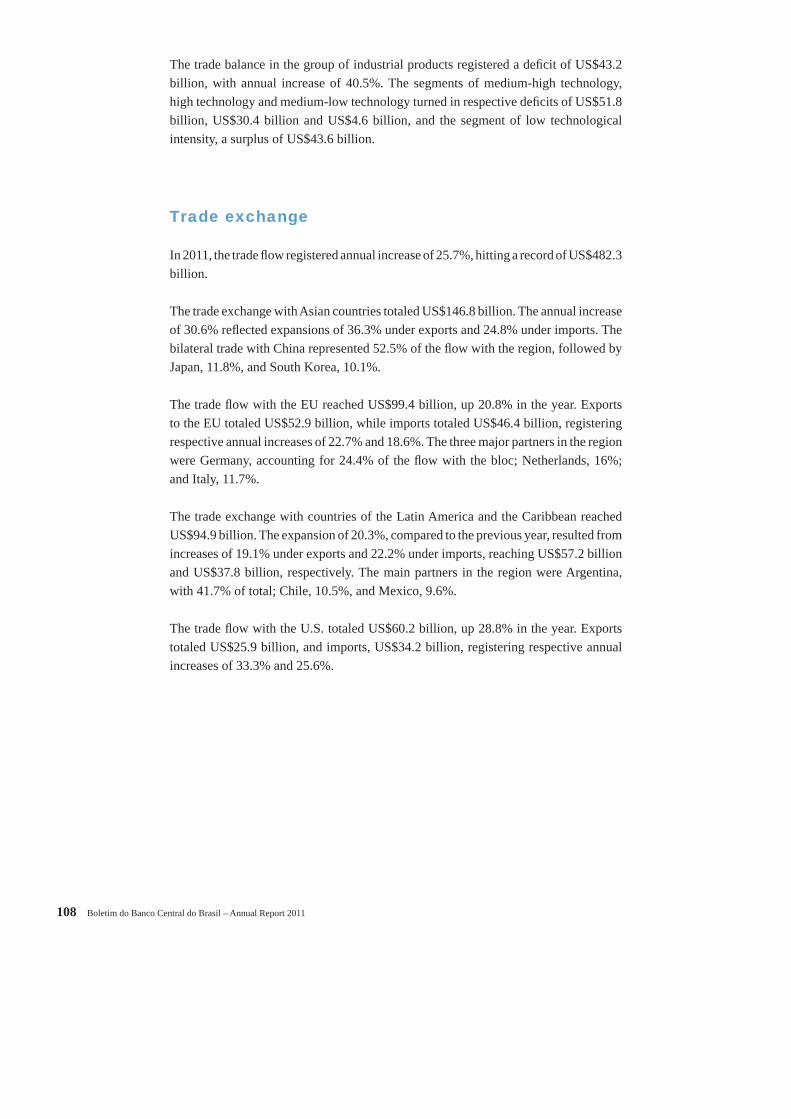
108 Boletim do Banco Central do Brasil – Annual Report 2011
The trade balance in the group of industrial products registered a defi cit of US$43.2 billion, with annual increase of 40.5%. The segments of medium-high technology, high technology and medium-low technology turned in respective defi cits of US$51.8 billion, US$30.4 billion and US$4.6 billion, and the segment of low technological intensity, a surplus of US$43.6 billion.
Trade exchange
In 2011, the trade fl ow registered annual increase of 25.7%, hitting a record of US$482.3 billion.
The trade exchange with Asian countries totaled US$146.8 billion. The annual increase of 30.6% refl ected expansions of 36.3% under exports and 24.8% under imports. The bilateral trade with China represented 52.5% of the fl ow with the region, followed by Japan, 11.8%, and South Korea, 10.1%.
The trade fl ow with the EU reached US$99.4 billion, up 20.8% in the year. Exports to the EU totaled US$52.9 billion, while imports totaled US$46.4 billion, registering respective annual increases of 22.7% and 18.6%. The three major partners in the region were Germany, accounting for 24.4% of the fl ow with the bloc; Netherlands, 16%; and Italy, 11.7%.
The trade exchange with countries of the Latin America and the Caribbean reached US$94.9 billion. The expansion of 20.3%, compared to the previous year, resulted from increases of 19.1% under exports and 22.2% under imports, reaching US$57.2 billion and US$37.8 billion, respectively. The main partners in the region were Argentina, with 41.7% of total; Chile, 10.5%, and Mexico, 9.6%.
The trade fl ow with the U.S. totaled US$60.2 billion, up 28.8% in the year. Exports totaled US$25.9 billion, and imports, US$34.2 billion, registering respective annual increases of 33.3% and 25.6%.
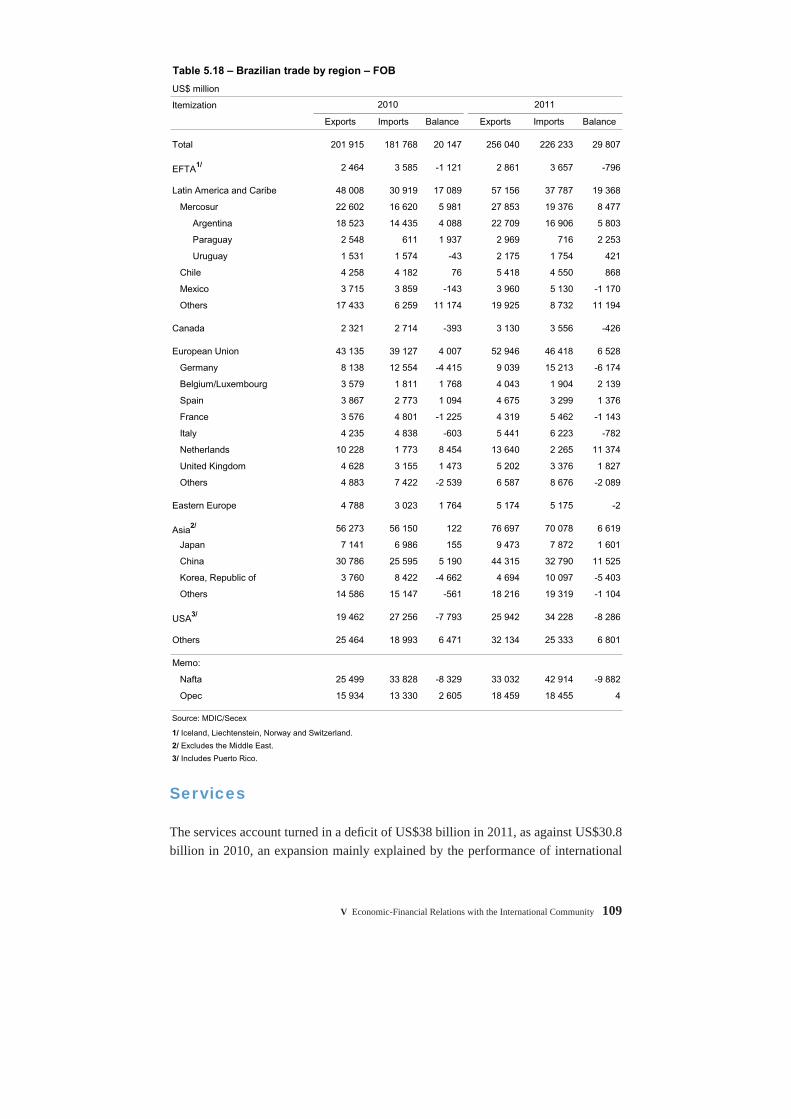
V Economic-Financial Relations with the International Community 109
Services
The services account turned in a defi cit of US$38 billion in 2011, as against US$30.8 billion in 2010, an expansion mainly explained by the performance of international
Table 5.18 – Brazilian trade by region – FOB
US$ million
Itemization
Exports Imports Balance Exports Imports Balance
Total 201 915 181 768 20 147 256 040 226 233 29 807
EFTA1/ 2 464 3 585 -1 121 2 861 3 657 -796
Latin America and Caribe 48 008 30 919 17 089 57 156 37 787 19 368
Mercosur 22 602 16 620 5 981 27 853 19 376 8 477
Argentina 18 523 14 435 4 088 22 709 16 906 5 803
Paraguay 2 548 611 1 937 2 969 716 2 253
Uruguay 1 531 1 574 -43 2 175 1 754 421
Chile 4 258 4 182 76 5 418 4 550 868
Mexico 3 715 3 859 -143 3 960 5 130 -1 170
Others 17 433 6 259 11 174 19 925 8 732 11 194
Canada 2 321 2 714 -393 3 130 3 556 -426
European Union 43 135 39 127 4 007 52 946 46 418 6 528
Germany 8 138 12 554 -4 415 9 039 15 213 -6 174
Belgium/Luxembourg 3 579 1 811 1 768 4 043 1 904 2 139
Spain 3 867 2 773 1 094 4 675 3 299 1 376
France 3 576 4 801 -1 225 4 319 5 462 -1 143
Italy 4 235 4 838 -603 5 441 6 223 -782
Netherlands 10 228 1 773 8 454 13 640 2 265 11 374
United Kingdom 4 628 3 155 1 473 5 202 3 376 1 827
Others 4 883 7 422 -2 539 6 587 8 676 -2 089
Eastern Europe 4 788 3 023 1 764 5 174 5 175 -2
Asia2/ 56 273 56 150 122 76 697 70 078 6 619
Japan 7 141 6 986 155 9 473 7 872 1 601
China 30 786 25 595 5 190 44 315 32 790 11 525
Korea, Republic of 3 760 8 422 -4 662 4 694 10 097 -5 403
Others 14 586 15 147 -561 18 216 19 319 -1 104
USA3/ 19 462 27 256 -7 793 25 942 34 228 -8 286
Others 25 464 18 993 6 471 32 134 25 333 6 801
Memo:
Nafta 25 499 33 828 -8 329 33 032 42 914 -9 882
Opec 15 934 13 330 2 605 18 459 18 455 4
Source: MDIC/Secex
1/ Iceland, Liechtenstein, Norway and Switzerland.
2/ Excludes the Middle East.
3/ Includes Puerto Rico.
2010 2011
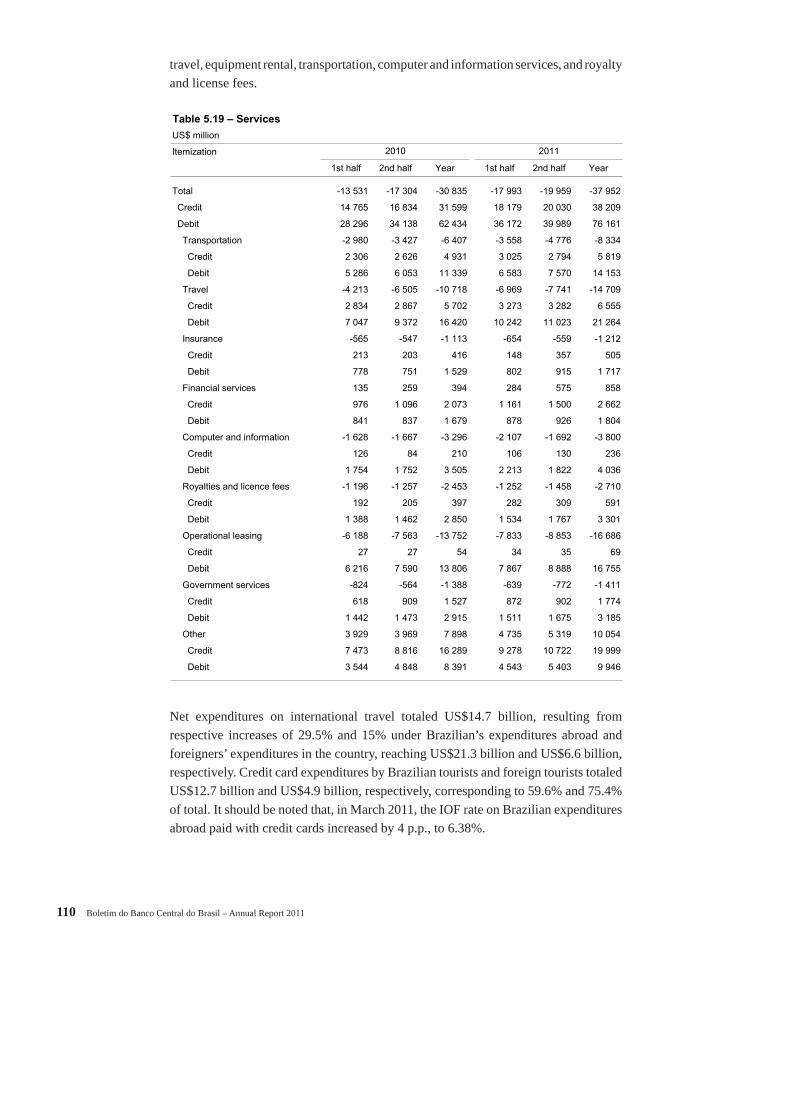
110 Boletim do Banco Central do Brasil – Annual Report 2011
travel, equipment rental, transportation, computer and information services, and royalty and license fees.
Net expenditures on international travel totaled US$14.7 billion, resulting from respective increases of 29.5% and 15% under Brazilian’s expenditures abroad and foreigners’ expenditures in the country, reaching US$21.3 billion and US$6.6 billion, respectively. Credit card expenditures by Brazilian tourists and foreign tourists totaled US$12.7 billion and US$4.9 billion, respectively, corresponding to 59.6% and 75.4% of total. It should be noted that, in March 2011, the IOF rate on Brazilian expenditures abroad paid with credit cards increased by 4 p.p., to 6.38%.
Table 5.19 – Services
US$ million
Itemization
1st half 2nd half Year 1st half 2nd half Year
Total -13 531 -17 304 -30 835 -17 993 -19 959 -37 952
Credit 14 765 16 834 31 599 18 179 20 030 38 209
Debit 28 296 34 138 62 434 36 172 39 989 76 161
Transportation -2 980 -3 427 -6 407 -3 558 -4 776 -8 334
Credit 2 306 2 626 4 931 3 025 2 794 5 819
Debit 5 286 6 053 11 339 6 583 7 570 14 153
Travel -4 213 -6 505 -10 718 -6 969 -7 741 -14 709
Credit 2 834 2 867 5 702 3 273 3 282 6 555
Debit 7 047 9 372 16 420 10 242 11 023 21 264
Insurance -565 -547 -1 113 -654 -559 -1 212
Credit 213 203 416 148 357 505
Debit 778 751 1 529 802 915 1 717
Financial services 135 259 394 284 575 858
Credit 976 1 096 2 073 1 161 1 500 2 662
Debit 841 837 1 679 878 926 1 804
Computer and information -1 628 -1 667 -3 296 -2 107 -1 692 -3 800
Credit 126 84 210 106 130 236
Debit 1 754 1 752 3 505 2 213 1 822 4 036
Royalties and licence fees -1 196 -1 257 -2 453 -1 252 -1 458 -2 710
Credit 192 205 397 282 309 591
Debit 1 388 1 462 2 850 1 534 1 767 3 301
Operational leasing -6 188 -7 563 -13 752 -7 833 -8 853 -16 686
Credit 27 27 54 34 35 69
Debit 6 216 7 590 13 806 7 867 8 888 16 755
Government services -824 -564 -1 388 -639 -772 -1 411
Credit 618 909 1 527 872 902 1 774
Debit 1 442 1 473 2 915 1 511 1 675 3 185
Other 3 929 3 969 7 898 4 735 5 319 10 054
Credit 7 473 8 816 16 289 9 278 10 722 19 999
Debit 3 544 4 848 8 391 4 543 5 403 9 946
2010 2011
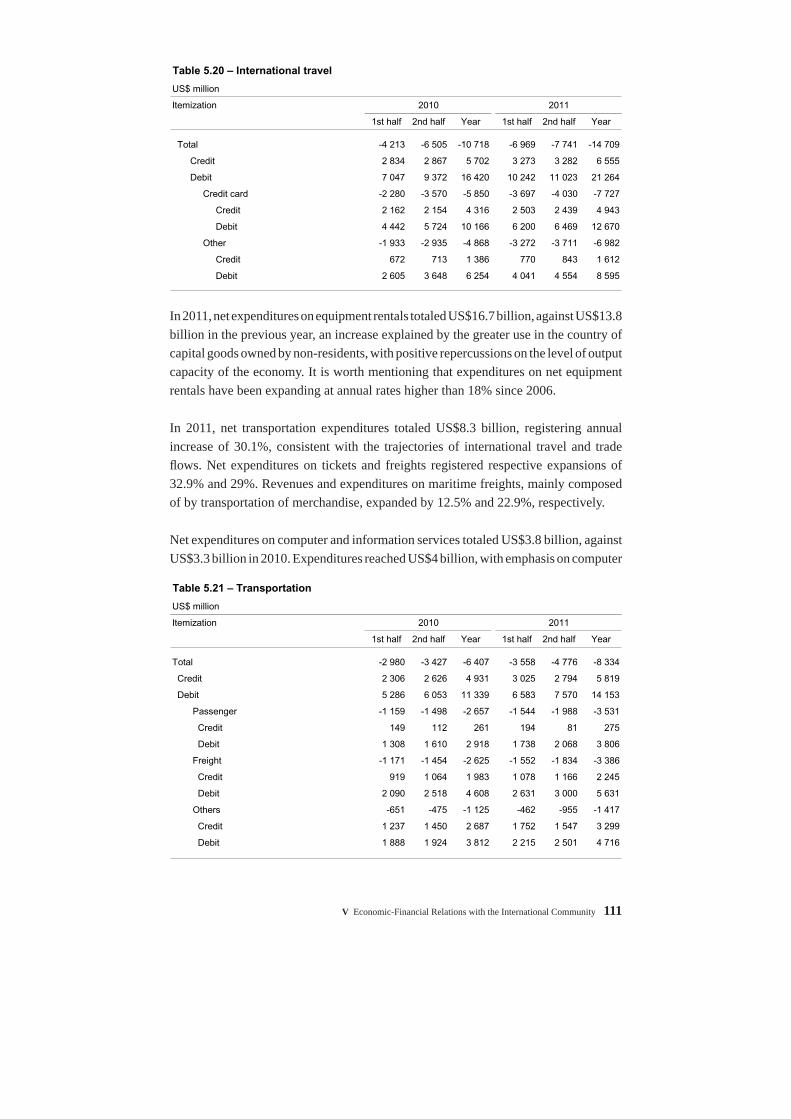
V Economic-Financial Relations with the International Community 111
In 2011, net expenditures on equipment rentals totaled US$16.7 billion, against US$13.8 billion in the previous year, an increase explained by the greater use in the country of capital goods owned by non-residents, with positive repercussions on the level of output capacity of the economy. It is worth mentioning that expenditures on net equipment rentals have been expanding at annual rates higher than 18% since 2006.
In 2011, net transportation expenditures totaled US$8.3 billion, registering annual increase of 30.1%, consistent with the trajectories of international travel and trade fl ows. Net expenditures on tickets and freights registered respective expansions of 32.9% and 29%. Revenues and expenditures on maritime freights, mainly composed of by transportation of merchandise, expanded by 12.5% and 22.9%, respectively.
Net expenditures on computer and information services totaled US$3.8 billion, against US$3.3 billion in 2010. Expenditures reached US$4 billion, with emphasis on computer
Table 5.20 – International travel
US$ million
Itemization 2010 2011
1st half 2nd half Year 1st half 2nd half Year
Total -4 213 -6 505 -10 718 -6 969 -7 741 -14 709
Credit 2 834 2 867 5 702 3 273 3 282 6 555
Debit 7 047 9 372 16 420 10 242 11 023 21 264
Credit card -2 280 -3 570 -5 850 -3 697 -4 030 -7 727
Credit 2 162 2 154 4 316 2 503 2 439 4 943
Debit 4 442 5 724 10 166 6 200 6 469 12 670
Other -1 933 -2 935 -4 868 -3 272 -3 711 -6 982
Credit 672 713 1 386 770 843 1 612
Debit 2 605 3 648 6 254 4 041 4 554 8 595
Table 5.21 – Transportation
US$ million
Itemization 2010 2011
1st half 2nd half Year 1st half 2nd half Year
Total -2 980 -3 427 -6 407 -3 558 -4 776 -8 334
Credit 2 306 2 626 4 931 3 025 2 794 5 819
Debit 5 286 6 053 11 339 6 583 7 570 14 153
Passenger -1 159 -1 498 -2 657 -1 544 -1 988 -3 531
Credit 149 112 261 194 81 275
Debit 1 308 1 610 2 918 1 738 2 068 3 806
Freight -1 171 -1 454 -2 625 -1 552 -1 834 -3 386
Credit 919 1 064 1 983 1 078 1 166 2 245
Debit 2 090 2 518 4 608 2 631 3 000 5 631
Others -651 -475 -1 125 -462 -955 -1 417
Credit 1 237 1 450 2 687 1 752 1 547 3 299
Debit 1 888 1 924 3 812 2 215 2 501 4 716
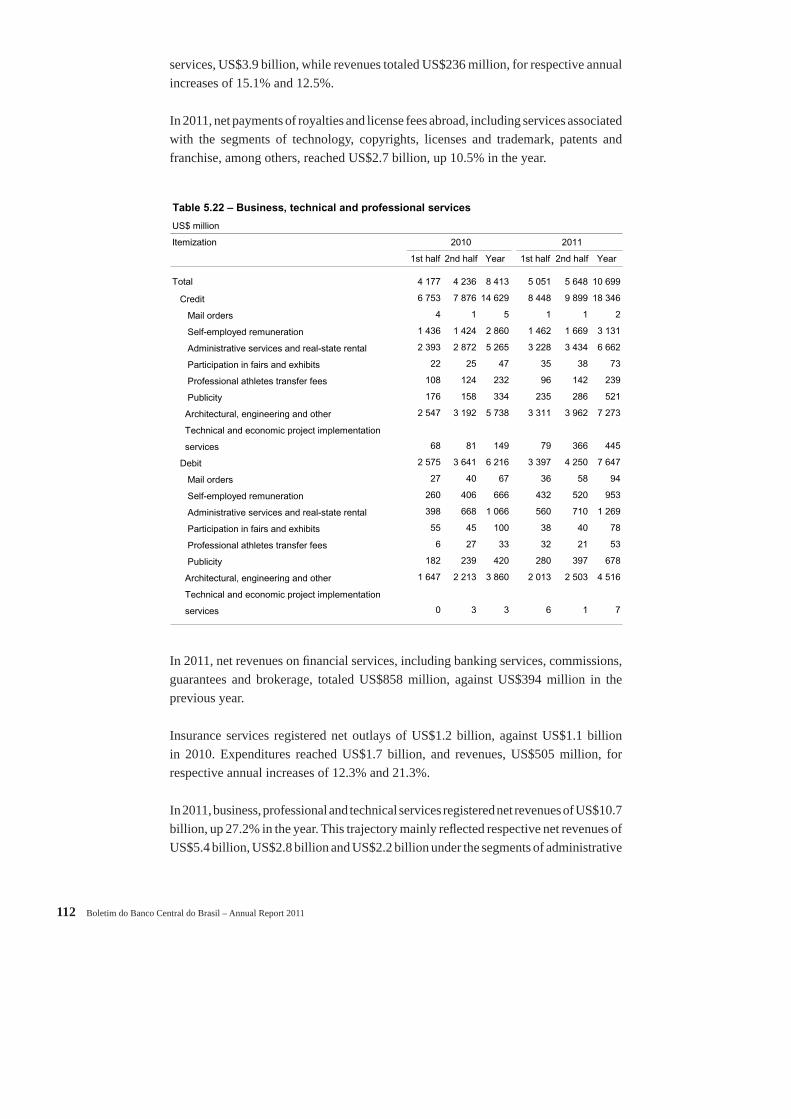
112 Boletim do Banco Central do Brasil – Annual Report 2011
services, US$3.9 billion, while revenues totaled US$236 million, for respective annual increases of 15.1% and 12.5%.
In 2011, net payments of royalties and license fees abroad, including services associated with the segments of technology, copyrights, licenses and trademark, patents and franchise, among others, reached US$2.7 billion, up 10.5% in the year.
In 2011, net revenues on fi nancial services, including banking services, commissions, guarantees and brokerage, totaled US$858 million, against US$394 million in the previous year.
Insurance services registered net outlays of US$1.2 billion, against US$1.1 billion in 2010. Expenditures reached US$1.7 billion, and revenues, US$505 million, for respective annual increases of 12.3% and 21.3%.
In 2011, business, professional and technical services registered net revenues of US$10.7 billion, up 27.2% in the year. This trajectory mainly refl ected respective net revenues of US$5.4 billion, US$2.8 billion and US$2.2 billion under the segments of administrative
Table 5.22 – Business, technical and professional services
US$ million
Itemization 2010 2011
1st half 2nd half Year 1st half 2nd half Year
Total 4 177 4 236 8 413 5 051 5 648 10 699
Credit 6 753 7 876 14 629 8 448 9 899 18 346
Mail orders 4 1 5 1 1 2
Self-employed remuneration 1 436 1 424 2 860 1 462 1 669 3 131
Administrative services and real-state rental 2 393 2 872 5 265 3 228 3 434 6 662
Participation in fairs and exhibits 22 25 47 35 38 73
Professional athletes transfer fees 108 124 232 96 142 239
Publicity 176 158 334 235 286 521
Architectural, engineering and other 2 547 3 192 5 738 3 311 3 962 7 273
Technical and economic project implementation
services 68 81 149 79 366 445
Debit 2 575 3 641 6 216 3 397 4 250 7 647
Mail orders 27 40 67 36 58 94
Self-employed remuneration 260 406 666 432 520 953
Administrative services and real-state rental 398 668 1 066 560 710 1 269
Participation in fairs and exhibits 55 45 100 38 40 78
Professional athletes transfer fees 6 27 33 32 21 53
Publicity 182 239 420 280 397 678
Architectural, engineering and other 1 647 2 213 3 860 2 013 2 503 4 516
Technical and economic project implementation
services 0 3 3 6 1 7
V Economic-Financial Relations with the International Community 113
services and rental properties, architectural and engineering, and autonomous workers’ fees, registering annual variations of 28.5%, 46.8% and -0.7%, respectively.
Income
In 2011, the defi cit of the income account totaled US$47.3 billion defi cit, 19.8% up from the previous year.
Net interest expenditures totaled US$9.7 billion, refl ecting increases of 39.2% under revenues and 15.7% under expenditures. The signifi cant upward trend for revenues has been consistent with the upward trend of international reserves, the main asset component that generates revenues.
Net remittances of profi ts and dividends hit a record level of US$38.2 billion. The annual expansion of 25.7% is consistent with the increase of the stock of foreign direct investments in the country and with the devaluation registered by the average exchange rate in 2011, which stimulates the remittance of profi ts earned in domestic currency. Remittances of profi ts and dividends surpassed net expenditures on interests for the sixth consecutive year, refl ecting the predominance of stocks of risky capital – foreign direct investments and stocks – over the stock of foreign indebtedness in the composition of foreign liabilities.
In 2011, the account salaries and wages registered net infl ows of US$567 million, 13.7% down from the previous year. Earnings brought from abroad by employees resident in the country reached US$665 million, increasing 17.7% in the year.
Maintaining the trend observed since 2006, net remittances of income abroad was strongly infl uenced by net remittances of income on direct investments, which totaled US$29.6 billion, up 16.2% in the year. Net remittance of profi ts and dividends, in this category, reached US$27.4 billion, up 16.1%. Net remittances of interests on intercompany loans increased 17.7%, to US$2.3 billion.
Net remittances of income on portfolio investments totaled US$12.2 billion, increasing 22.1% as compared to 2010. This trasjectory mainly refl ected the performance of net remittances of dividends related to stocks listed on Brazilian stock exchanges and notes negotiated in foreign stock exchanges, which totaled US$10.8 billion, up 59% in the period. The account of interests on fi xed-income securities registered net expenditures of US$1.4 billion, against US$3.2 billion in 2010. Net remittances of income on other investments, including interests on supplier credits, loans, deposits, and other assets and liabilities, totaled US$6.1 billion, up 34.8% according to the same comparison basis.
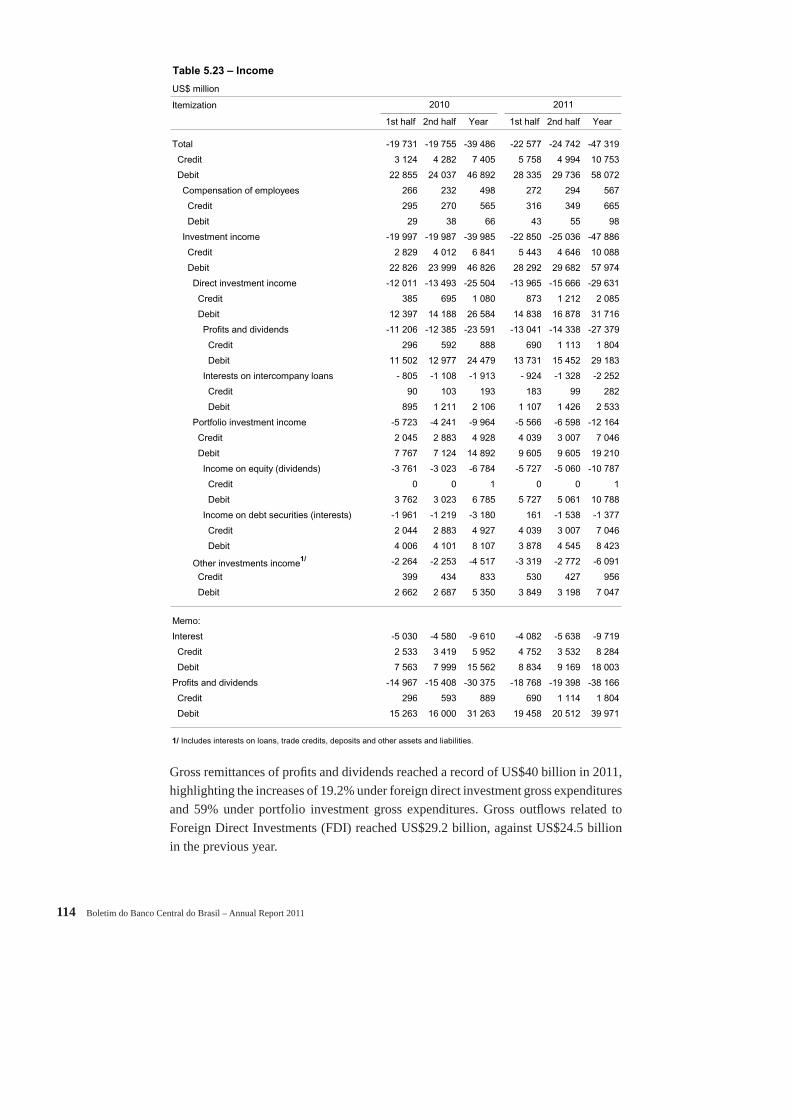
114 Boletim do Banco Central do Brasil – Annual Report 2011
Gross remittances of profi ts and dividends reached a record of US$40 billion in 2011, highlighting the increases of 19.2% under foreign direct investment gross expenditures and 59% under portfolio investment gross expenditures. Gross outfl ows related to Foreign Direct Investments (FDI) reached US$29.2 billion, against US$24.5 billion in the previous year.
Table 5.23 – Income
US$ million
Itemization
1st half 2nd half Year 1st half 2nd half Year
Total -19 731 -19 755 -39 486 -22 577 -24 742 -47 319
Credit 3 124 4 282 7 405 5 758 4 994 10 753
Debit 22 855 24 037 46 892 28 335 29 736 58 072
Compensation of employees 266 232 498 272 294 567
Credit 295 270 565 316 349 665
Debit 29 38 66 43 55 98
Investment income -19 997 -19 987 -39 985 -22 850 -25 036 -47 886
Credit 2 829 4 012 6 841 5 443 4 646 10 088
Debit 22 826 23 999 46 826 28 292 29 682 57 974
Direct investment income -12 011 -13 493 -25 504 -13 965 -15 666 -29 631
Credit 385 695 1 080 873 1 212 2 085
Debit 12 397 14 188 26 584 14 838 16 878 31 716
Profits and dividends -11 206 -12 385 -23 591 -13 041 -14 338 -27 379
Credit 296 592 888 690 1 113 1 804
Debit 11 502 12 977 24 479 13 731 15 452 29 183
Interests on intercompany loans - 805 -1 108 -1 913 - 924 -1 328 -2 252
Credit 90 103 193 183 99 282
Debit 895 1 211 2 106 1 107 1 426 2 533
Portfolio investment income -5 723 -4 241 -9 964 -5 566 -6 598 -12 164
Credit 2 045 2 883 4 928 4 039 3 007 7 046
Debit 7 767 7 124 14 892 9 605 9 605 19 210
Income on equity (dividends) -3 761 -3 023 -6 784 -5 727 -5 060 -10 787
Credit 0 0 1 0 0 1
Debit 3 762 3 023 6 785 5 727 5 061 10 788
Income on debt securities (interests) -1 961 -1 219 -3 180 161 -1 538 -1 377
Credit 2 044 2 883 4 927 4 039 3 007 7 046
Debit 4 006 4 101 8 107 3 878 4 545 8 423
Other investments income1/ -2 264 -2 253 -4 517 -3 319 -2 772 -6 091
Credit 399 434 833 530 427 956
Debit 2 662 2 687 5 350 3 849 3 198 7 047
Memo:
Interest -5 030 -4 580 -9 610 -4 082 -5 638 -9 719
Credit 2 533 3 419 5 952 4 752 3 532 8 284
Debit 7 563 7 999 15 562 8 834 9 169 18 003
Profits and dividends -14 967 -15 408 -30 375 -18 768 -19 398 -38 166
Credit 296 593 889 690 1 114 1 804
Debit 15 263 16 000 31 263 19 458 20 512 39 971
1/ Includes interests on loans, trade credits, deposits and other assets and liabilities.
2010 2011
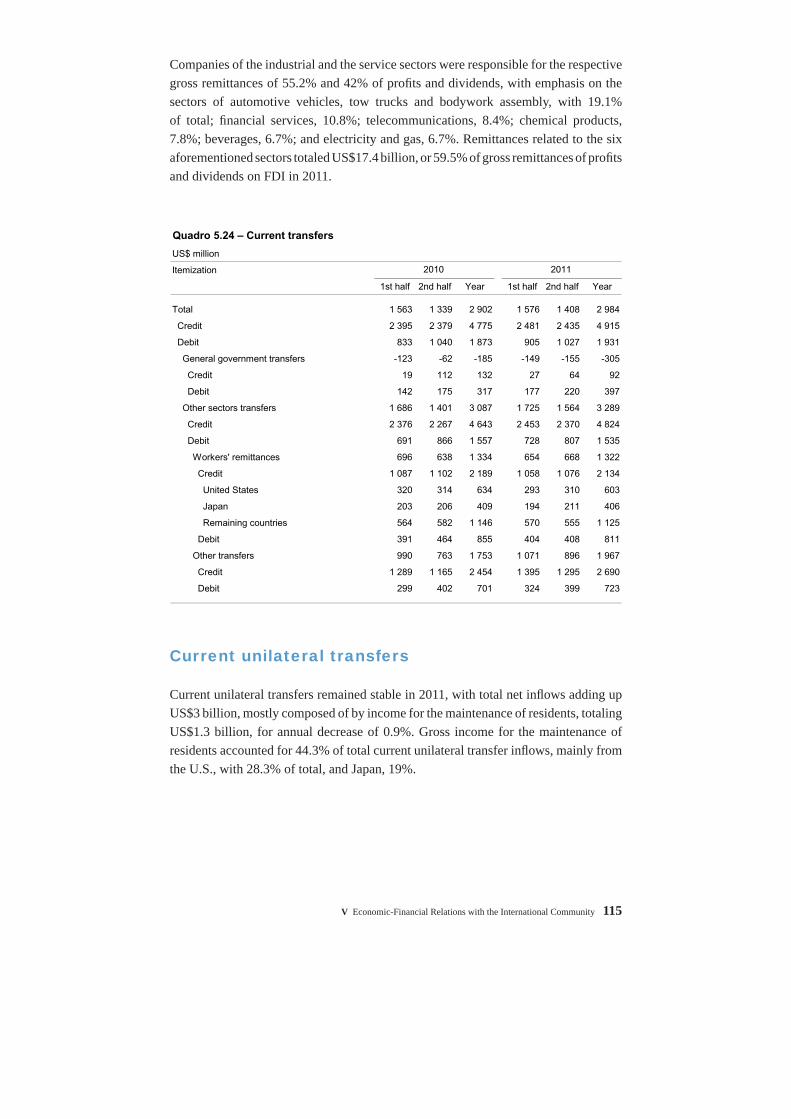
V Economic-Financial Relations with the International Community 115
Quadro 5.24 – Current transfers
US$ million
Itemization
1st half 2nd half Year 1st half 2nd half Year
Total 1 563 1 339 2 902 1 576 1 408 2 984
Credit 2 395 2 379 4 775 2 481 2 435 4 915
Debit 833 1 040 1 873 905 1 027 1 931
General government transfers -123 -62 -185 -149 -155 -305
Credit 19 112 132 27 64 92
Debit 142 175 317 177 220 397
Other sectors transfers 1 686 1 401 3 087 1 725 1 564 3 289
Credit 2 376 2 267 4 643 2 453 2 370 4 824
Debit 691 866 1 557 728 807 1 535
Workers' remittances 696 638 1 334 654 668 1 322
Credit 1 087 1 102 2 189 1 058 1 076 2 134
United States 320 314 634 293 310 603
Japan 203 206 409 194 211 406
Remaining countries 564 582 1 146 570 555 1 125
Debit 391 464 855 404 408 811
Other transfers 990 763 1 753 1 071 896 1 967
Credit 1 289 1 165 2 454 1 395 1 295 2 690
Debit 299 402 701 324 399 723
2010 2011
Companies of the industrial and the service sectors were responsible for the respective gross remittances of 55.2% and 42% of profi ts and dividends, with emphasis on the sectors of automotive vehicles, tow trucks and bodywork assembly, with 19.1% of total; fi nancial services, 10.8%; telecommunications, 8.4%; chemical products, 7.8%; beverages, 6.7%; and electricity and gas, 6.7%. Remittances related to the six aforementioned sectors totaled US$17.4 billion, or 59.5% of gross remittances of profi ts and dividends on FDI in 2011.
Current unilateral transfers
Current unilateral transfers remained stable in 2011, with total net infl ows adding up US$3 billion, mostly composed of by income for the maintenance of residents, totaling US$1.3 billion, for annual decrease of 0.9%. Gross income for the maintenance of residents accounted for 44.3% of total current unilateral transfer infl ows, mainly from the U.S., with 28.3% of total, and Japan, 19%.
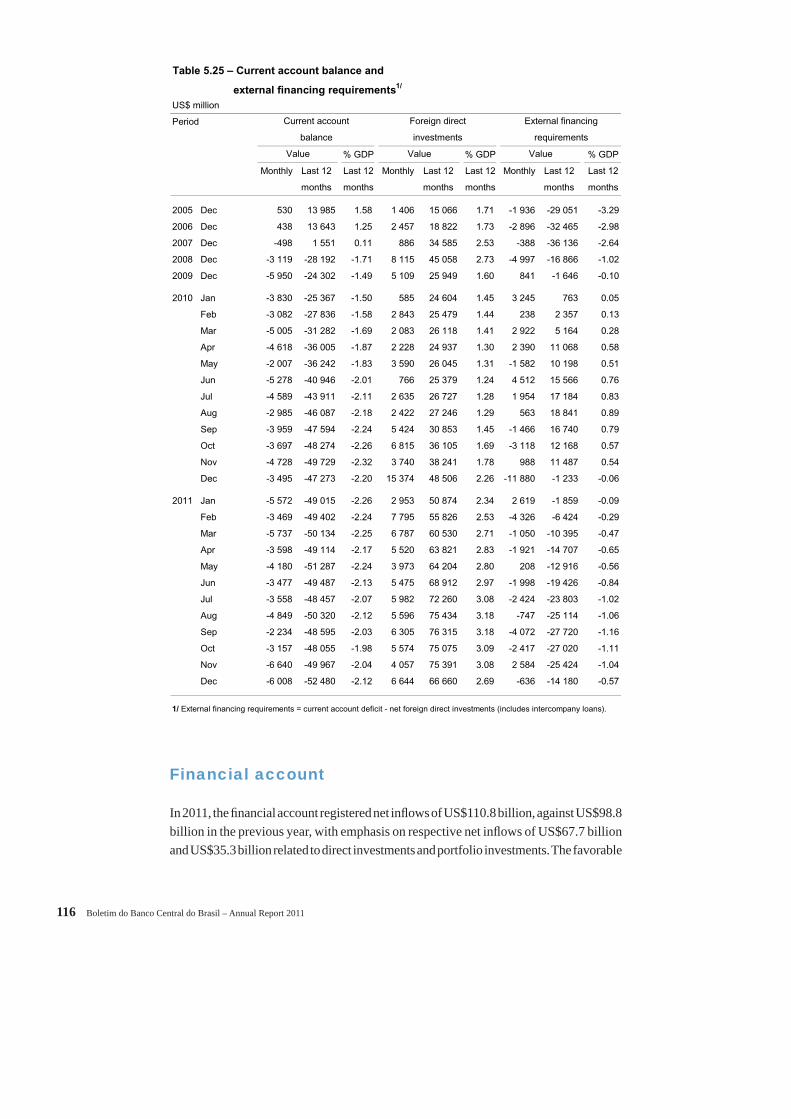
116 Boletim do Banco Central do Brasil – Annual Report 2011
Financial account
In 2011, the fi nancial account registered net infl ows of US$110.8 billion, against US$98.8 billion in the previous year, with emphasis on respective net infl ows of US$67.7 billion and US$35.3 billion related to direct investments and portfolio investments. The favorable
Table 5.25 – Current account balance and
external financing requirements1/
US$ million
Period
% GDP % GDP % GDP
Monthly Last 12 Last 12 Monthly Last 12 Last 12 Monthly Last 12 Last 12
months months months months months months
2005 Dec 530 13 985 1.58 1 406 15 066 1.71 -1 936 -29 051 -3.29
2006 Dec 438 13 643 1.25 2 457 18 822 1.73 -2 896 -32 465 -2.98
2007 Dec -498 1 551 0.11 886 34 585 2.53 -388 -36 136 -2.64
2008 Dec -3 119 -28 192 -1.71 8 115 45 058 2.73 -4 997 -16 866 -1.02
2009 Dec -5 950 -24 302 -1.49 5 109 25 949 1.60 841 -1 646 -0.10
2010 Jan -3 830 -25 367 -1.50 585 24 604 1.45 3 245 763 0.05
Feb -3 082 -27 836 -1.58 2 843 25 479 1.44 238 2 357 0.13
Mar -5 005 -31 282 -1.69 2 083 26 118 1.41 2 922 5 164 0.28
Apr -4 618 -36 005 -1.87 2 228 24 937 1.30 2 390 11 068 0.58
May -2 007 -36 242 -1.83 3 590 26 045 1.31 -1 582 10 198 0.51
Jun -5 278 -40 946 -2.01 766 25 379 1.24 4 512 15 566 0.76
Jul -4 589 -43 911 -2.11 2 635 26 727 1.28 1 954 17 184 0.83
Aug -2 985 -46 087 -2.18 2 422 27 246 1.29 563 18 841 0.89
Sep -3 959 -47 594 -2.24 5 424 30 853 1.45 -1 466 16 740 0.79
Oct -3 697 -48 274 -2.26 6 815 36 105 1.69 -3 118 12 168 0.57
Nov -4 728 -49 729 -2.32 3 740 38 241 1.78 988 11 487 0.54
Dec -3 495 -47 273 -2.20 15 374 48 506 2.26 -11 880 -1 233 -0.06
2011 Jan -5 572 -49 015 -2.26 2 953 50 874 2.34 2 619 -1 859 -0.09
Feb -3 469 -49 402 -2.24 7 795 55 826 2.53 -4 326 -6 424 -0.29
Mar -5 737 -50 134 -2.25 6 787 60 530 2.71 -1 050 -10 395 -0.47
Apr -3 598 -49 114 -2.17 5 520 63 821 2.83 -1 921 -14 707 -0.65
May -4 180 -51 287 -2.24 3 973 64 204 2.80 208 -12 916 -0.56
Jun -3 477 -49 487 -2.13 5 475 68 912 2.97 -1 998 -19 426 -0.84
Jul -3 558 -48 457 -2.07 5 982 72 260 3.08 -2 424 -23 803 -1.02
Aug -4 849 -50 320 -2.12 5 596 75 434 3.18 -747 -25 114 -1.06
Sep -2 234 -48 595 -2.03 6 305 76 315 3.18 -4 072 -27 720 -1.16
Oct -3 157 -48 055 -1.98 5 574 75 075 3.09 -2 417 -27 020 -1.11
Nov -6 640 -49 967 -2.04 4 057 75 391 3.08 2 584 -25 424 -1.04
Dec -6 008 -52 480 -2.12 6 644 66 660 2.69 -636 -14 180 -0.57
1/ External financing requirements = current account deficit - net foreign direct investments (includes intercompany loans).
Value Value Value
Current account Foreign direct External financing
balance investments requirements
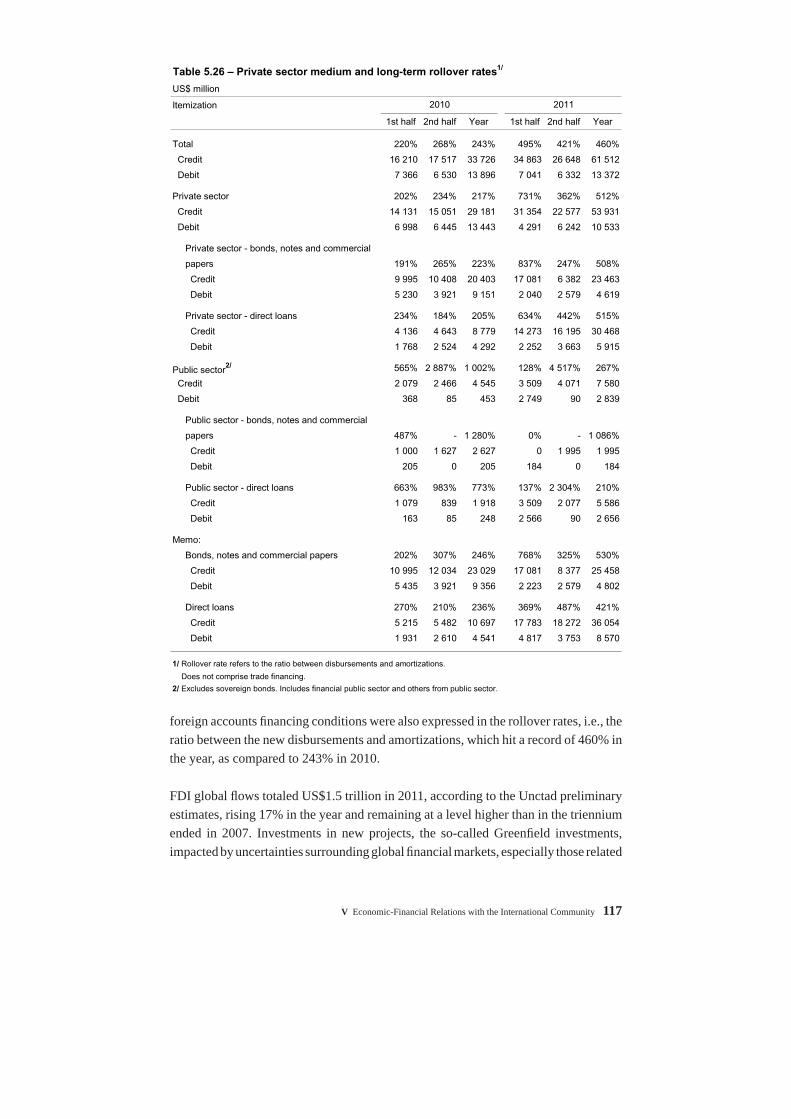
V Economic-Financial Relations with the International Community 117
foreign accounts fi nancing conditions were also expressed in the rollover rates, i.e., the ratio between the new disbursements and amortizations, which hit a record of 460% in the year, as compared to 243% in 2010.
FDI global fl ows totaled US$1.5 trillion in 2011, according to the Unctad preliminary estimates, rising 17% in the year and remaining at a level higher than in the triennium ended in 2007. Investments in new projects, the so-called Greenfi eld investments, impacted by uncertainties surrounding global fi nancial markets, especially those related
Table 5.26 – Private sector medium and long-term rollover rates1/
US$ million
Itemization
1st half 2nd half Year 1st half 2nd half Year
Total 220% 268% 243% 495% 421% 460%
Credit 16 210 17 517 33 726 34 863 26 648 61 512
Debit 7 366 6 530 13 896 7 041 6 332 13 372
Private sector 202% 234% 217% 731% 362% 512%
Credit 14 131 15 051 29 181 31 354 22 577 53 931
Debit 6 998 6 445 13 443 4 291 6 242 10 533
Private sector - bonds, notes and commercial
papers 191% 265% 223% 837% 247% 508%
Credit 9 995 10 408 20 403 17 081 6 382 23 463
Debit 5 230 3 921 9 151 2 040 2 579 4 619
Private sector - direct loans 234% 184% 205% 634% 442% 515%
Credit 4 136 4 643 8 779 14 273 16 195 30 468
Debit 1 768 2 524 4 292 2 252 3 663 5 915
Public sector2/ 565% 2 887% 1 002% 128% 4 517% 267%
Credit 2 079 2 466 4 545 3 509 4 071 7 580
Debit 368 85 453 2 749 90 2 839
Public sector - bonds, notes and commercial
papers 487% - 1 280% 0% - 1 086%
Credit 1 000 1 627 2 627 0 1 995 1 995
Debit 205 0 205 184 0 184
Public sector - direct loans 663% 983% 773% 137% 2 304% 210%
Credit 1 079 839 1 918 3 509 2 077 5 586
Debit 163 85 248 2 566 90 2 656
Memo:
Bonds, notes and commercial papers 202% 307% 246% 768% 325% 530%
Credit 10 995 12 034 23 029 17 081 8 377 25 458
Debit 5 435 3 921 9 356 2 223 2 579 4 802
Direct loans 270% 210% 236% 369% 487% 421%
Credit 5 215 5 482 10 697 17 783 18 272 36 054
Debit 1 931 2 610 4 541 4 817 3 753 8 570
1/ Rollover rate refers to the ratio between disbursements and amortizations.
Does not comprise trade financing.
2/ Excludes sovereign bonds. Includes financial public sector and others from public sector.
2010 2011
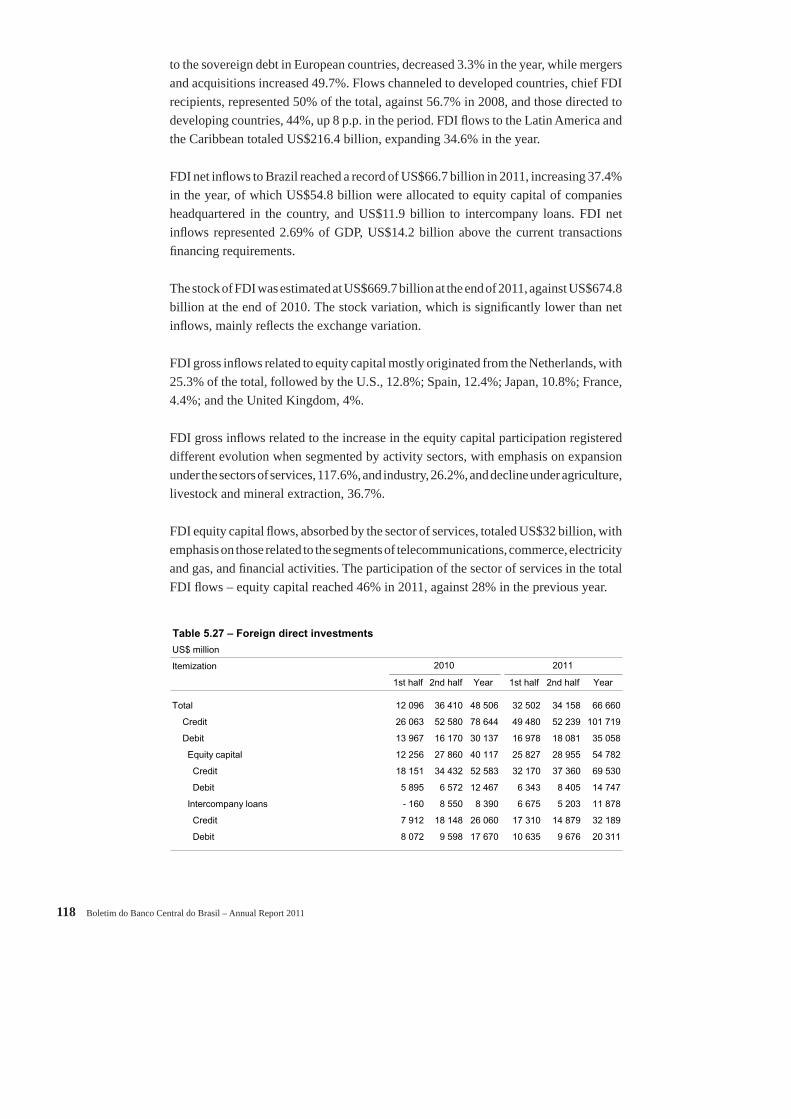
118 Boletim do Banco Central do Brasil – Annual Report 2011
to the sovereign debt in European countries, decreased 3.3% in the year, while mergers and acquisitions increased 49.7%. Flows channeled to developed countries, chief FDI recipients, represented 50% of the total, against 56.7% in 2008, and those directed to developing countries, 44%, up 8 p.p. in the period. FDI fl ows to the Latin America and the Caribbean totaled US$216.4 billion, expanding 34.6% in the year.
FDI net infl ows to Brazil reached a record of US$66.7 billion in 2011, increasing 37.4% in the year, of which US$54.8 billion were allocated to equity capital of companies headquartered in the country, and US$11.9 billion to intercompany loans. FDI net infl ows represented 2.69% of GDP, US$14.2 billion above the current transactions fi nancing requirements.
The stock of FDI was estimated at US$669.7 billion at the end of 2011, against US$674.8 billion at the end of 2010. The stock variation, which is signifi cantly lower than net infl ows, mainly refl ects the exchange variation.
FDI gross infl ows related to equity capital mostly originated from the Netherlands, with 25.3% of the total, followed by the U.S., 12.8%; Spain, 12.4%; Japan, 10.8%; France, 4.4%; and the United Kingdom, 4%.
FDI gross infl ows related to the increase in the equity capital participation registered different evolution when segmented by activity sectors, with emphasis on expansion under the sectors of services, 117.6%, and industry, 26.2%, and decline under agriculture, livestock and mineral extraction, 36.7%.
FDI equity capital fl ows, absorbed by the sector of services, totaled US$32 billion, with emphasis on those related to the segments of telecommunications, commerce, electricity and gas, and fi nancial activities. The participation of the sector of services in the total FDI fl ows – equity capital reached 46% in 2011, against 28% in the previous year.
Table 5.27 – Foreign direct investments
US$ million
Itemization
1st half 2nd half Year 1st half 2nd half Year
Total 12 096 36 410 48 506 32 502 34 158 66 660
Credit 26 063 52 580 78 644 49 480 52 239 101 719
Debit 13 967 16 170 30 137 16 978 18 081 35 058
Equity capital 12 256 27 860 40 117 25 827 28 955 54 782
Credit 18 151 34 432 52 583 32 170 37 360 69 530
Debit 5 895 6 572 12 467 6 343 8 405 14 747
Intercompany loans - 160 8 550 8 390 6 675 5 203 11 878
Credit 7 912 18 148 26 060 17 310 14 879 32 189
Debit 8 072 9 598 17 670 10 635 9 676 20 311
2010 2011
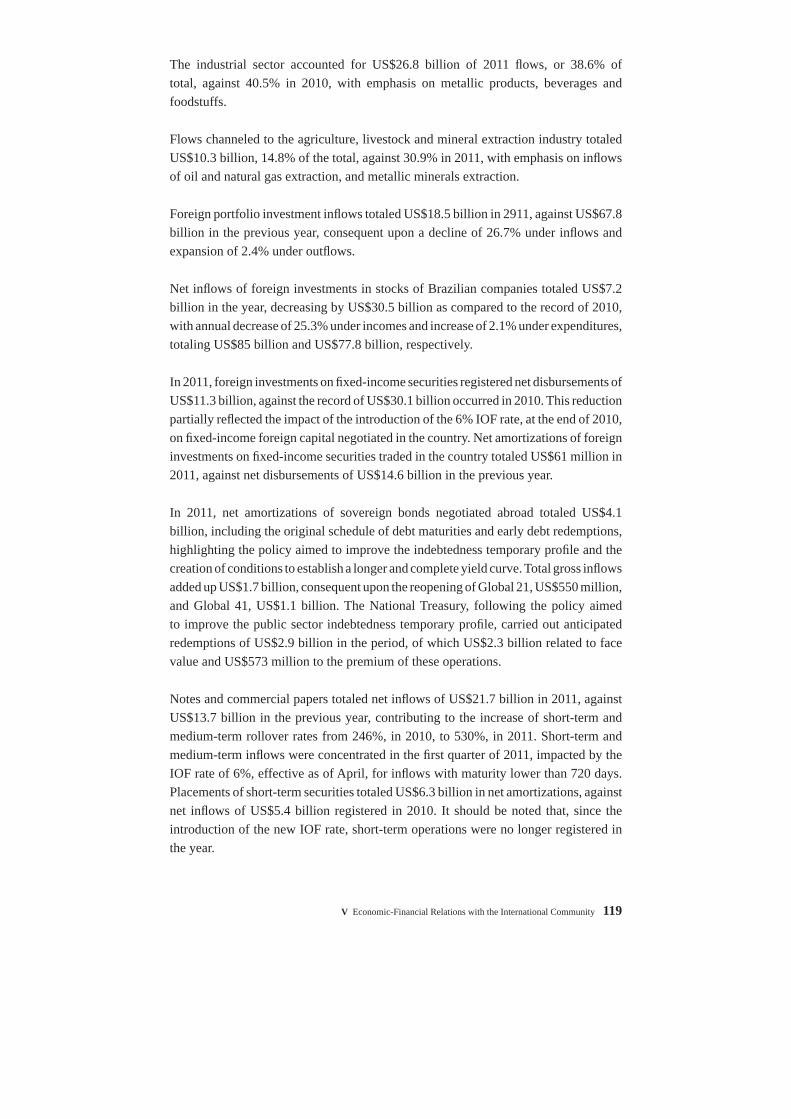
V Economic-Financial Relations with the International Community 119
The industrial sector accounted for US$26.8 billion of 2011 fl ows, or 38.6% of total, against 40.5% in 2010, with emphasis on metallic products, beverages and foodstuffs.
Flows channeled to the agriculture, livestock and mineral extraction industry totaled US$10.3 billion, 14.8% of the total, against 30.9% in 2011, with emphasis on infl ows of oil and natural gas extraction, and metallic minerals extraction.
Foreign portfolio investment infl ows totaled US$18.5 billion in 2911, against US$67.8 billion in the previous year, consequent upon a decline of 26.7% under infl ows and expansion of 2.4% under outfl ows.
Net infl ows of foreign investments in stocks of Brazilian companies totaled US$7.2 billion in the year, decreasing by US$30.5 billion as compared to the record of 2010, with annual decrease of 25.3% under incomes and increase of 2.1% under expenditures, totaling US$85 billion and US$77.8 billion, respectively.
In 2011, foreign investments on fi xed-income securities registered net disbursements of US$11.3 billion, against the record of US$30.1 billion occurred in 2010. This reduction partially refl ected the impact of the introduction of the 6% IOF rate, at the end of 2010, on fi xed-income foreign capital negotiated in the country. Net amortizations of foreign investments on fi xed-income securities traded in the country totaled US$61 million in 2011, against net disbursements of US$14.6 billion in the previous year.
In 2011, net amortizations of sovereign bonds negotiated abroad totaled US$4.1 billion, including the original schedule of debt maturities and early debt redemptions, highlighting the policy aimed to improve the indebtedness temporary profi le and the creation of conditions to establish a longer and complete yield curve. Total gross infl ows added up US$1.7 billion, consequent upon the reopening of Global 21, US$550 million, and Global 41, US$1.1 billion. The National Treasury, following the policy aimed to improve the public sector indebtedness temporary profi le, carried out anticipated redemptions of US$2.9 billion in the period, of which US$2.3 billion related to face value and US$573 million to the premium of these operations.
Notes and commercial papers totaled net infl ows of US$21.7 billion in 2011, against US$13.7 billion in the previous year, contributing to the increase of short-term and medium-term rollover rates from 246%, in 2010, to 530%, in 2011. Short-term and medium-term infl ows were concentrated in the fi rst quarter of 2011, impacted by the IOF rate of 6%, effective as of April, for infl ows with maturity lower than 720 days. Placements of short-term securities totaled US$6.3 billion in net amortizations, against net infl ows of US$5.4 billion registered in 2010. It should be noted that, since the introduction of the new IOF rate, short-term operations were no longer registered in the year.
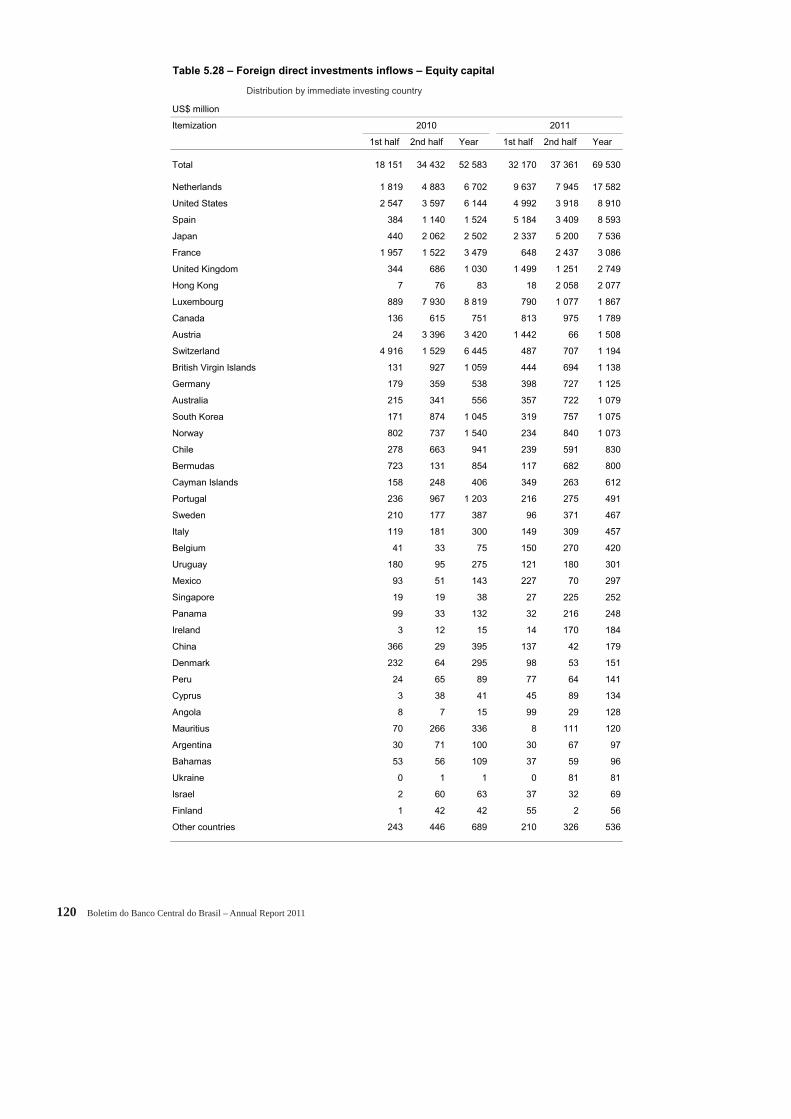
120 Boletim do Banco Central do Brasil – Annual Report 2011
Table 5.28 – Foreign direct investments inflows – Equity capital
Distribution by immediate investing country
US$ million
Itemization 2010 2011
1st half 2nd half Year 1st half 2nd half Year
Total 18 151 34 432 52 583 32 170 37 361 69 530
Netherlands 1 819 4 883 6 702 9 637 7 945 17 582
United States 2 547 3 597 6 144 4 992 3 918 8 910
Spain 384 1 140 1 524 5 184 3 409 8 593
Japan 440 2 062 2 502 2 337 5 200 7 536
France 1 957 1 522 3 479 648 2 437 3 086
United Kingdom 344 686 1 030 1 499 1 251 2 749
Hong Kong 7 76 83 18 2 058 2 077
Luxembourg 889 7 930 8 819 790 1 077 1 867
Canada 136 615 751 813 975 1 789
Austria 24 3 396 3 420 1 442 66 1 508
Switzerland 4 916 1 529 6 445 487 707 1 194
British Virgin Islands 131 927 1 059 444 694 1 138
Germany 179 359 538 398 727 1 125
Australia 215 341 556 357 722 1 079
South Korea 171 874 1 045 319 757 1 075
Norway 802 737 1 540 234 840 1 073
Chile 278 663 941 239 591 830
Bermudas 723 131 854 117 682 800
Cayman Islands 158 248 406 349 263 612
Portugal 236 967 1 203 216 275 491
Sweden 210 177 387 96 371 467
Italy 119 181 300 149 309 457
Belgium 41 33 75 150 270 420
Uruguay 180 95 275 121 180 301
Mexico 93 51 143 227 70 297
Singapore 19 19 38 27 225 252
Panama 99 33 132 32 216 248
Ireland 3 12 15 14 170 184
China 366 29 395 137 42 179
Denmark 232 64 295 98 53 151
Peru 24 65 89 77 64 141
Cyprus 3 38 41 45 89 134
Angola 8 7 15 99 29 128
Mauritius 70 266 336 8 111 120
Argentina 30 71 100 30 67 97
Bahamas 53 56 109 37 59 96
Ukraine 0 1 1 0 81 81
Israel 2 60 63 37 32 69
Finland 1 42 42 55 2 56
Other countries 243 446 689 210 326 536
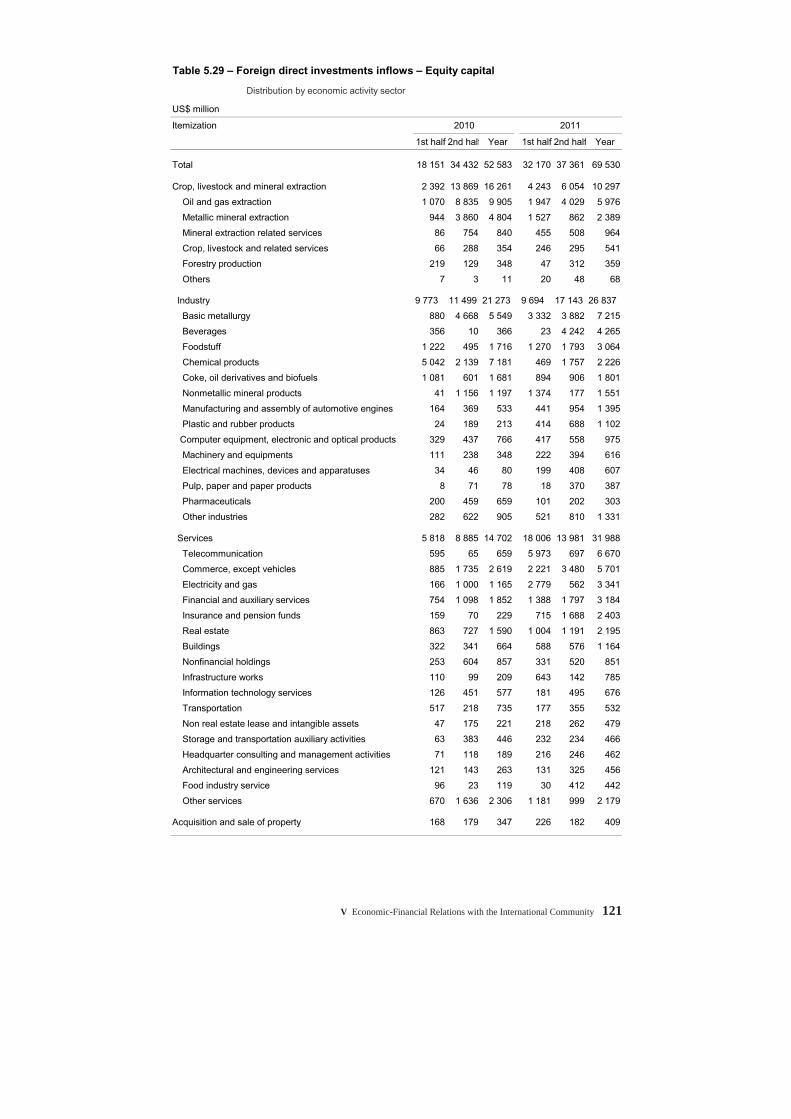
V Economic-Financial Relations with the International Community 121
Table 5.29 – Foreign direct investments inflows – Equity capital
Distribution by economic activity sector
US$ million
Itemization 2010 2011
1st half 2nd half Year 1st half 2nd half Year
Total 18 151 34 432 52 583 32 170 37 361 69 530
Crop, livestock and mineral extraction 2 392 13 869 16 261 4 243 6 054 10 297
Oil and gas extraction 1 070 8 835 9 905 1 947 4 029 5 976
Metallic mineral extraction 944 3 860 4 804 1 527 862 2 389
Mineral extraction related services 86 754 840 455 508 964
Crop, livestock and related services 66 288 354 246 295 541
Forestry production 219 129 348 47 312 359
Others 7 3 11 20 48 68
Industry 9 773 11 499 21 273 9 694 17 143 26 837
Basic metallurgy 880 4 668 5 549 3 332 3 882 7 215
Beverages 356 10 366 23 4 242 4 265
Foodstuff 1 222 495 1 716 1 270 1 793 3 064
Chemical products 5 042 2 139 7 181 469 1 757 2 226
Coke, oil derivatives and biofuels 1 081 601 1 681 894 906 1 801
Nonmetallic mineral products 41 1 156 1 197 1 374 177 1 551
Manufacturing and assembly of automotive engines 164 369 533 441 954 1 395
Plastic and rubber products 24 189 213 414 688 1 102
Computer equipment, electronic and optical products 329 437 766 417 558 975
Machinery and equipments 111 238 348 222 394 616
Electrical machines, devices and apparatuses 34 46 80 199 408 607
Pulp, paper and paper products 8 71 78 18 370 387
Pharmaceuticals 200 459 659 101 202 303
Other industries 282 622 905 521 810 1 331
Services 5 818 8 885 14 702 18 006 13 981 31 988
Telecommunication 595 65 659 5 973 697 6 670
Commerce, except vehicles 885 1 735 2 619 2 221 3 480 5 701
Electricity and gas 166 1 000 1 165 2 779 562 3 341
Financial and auxiliary services 754 1 098 1 852 1 388 1 797 3 184
Insurance and pension funds 159 70 229 715 1 688 2 403
Real estate 863 727 1 590 1 004 1 191 2 195
Buildings 322 341 664 588 576 1 164
Nonfinancial holdings 253 604 857 331 520 851
Infrastructure works 110 99 209 643 142 785
Information technology services 126 451 577 181 495 676
Transportation 517 218 735 177 355 532
Non real estate lease and intangible assets 47 175 221 218 262 479
Storage and transportation auxiliary activities 63 383 446 232 234 466
Headquarter consulting and management activities 71 118 189 216 246 462
Architectural and engineering services 121 143 263 131 325 456
Food industry service 96 23 119 30 412 442
Other services 670 1 636 2 306 1 181 999 2 179
Acquisition and sale of property 168 179 347 226 182 409
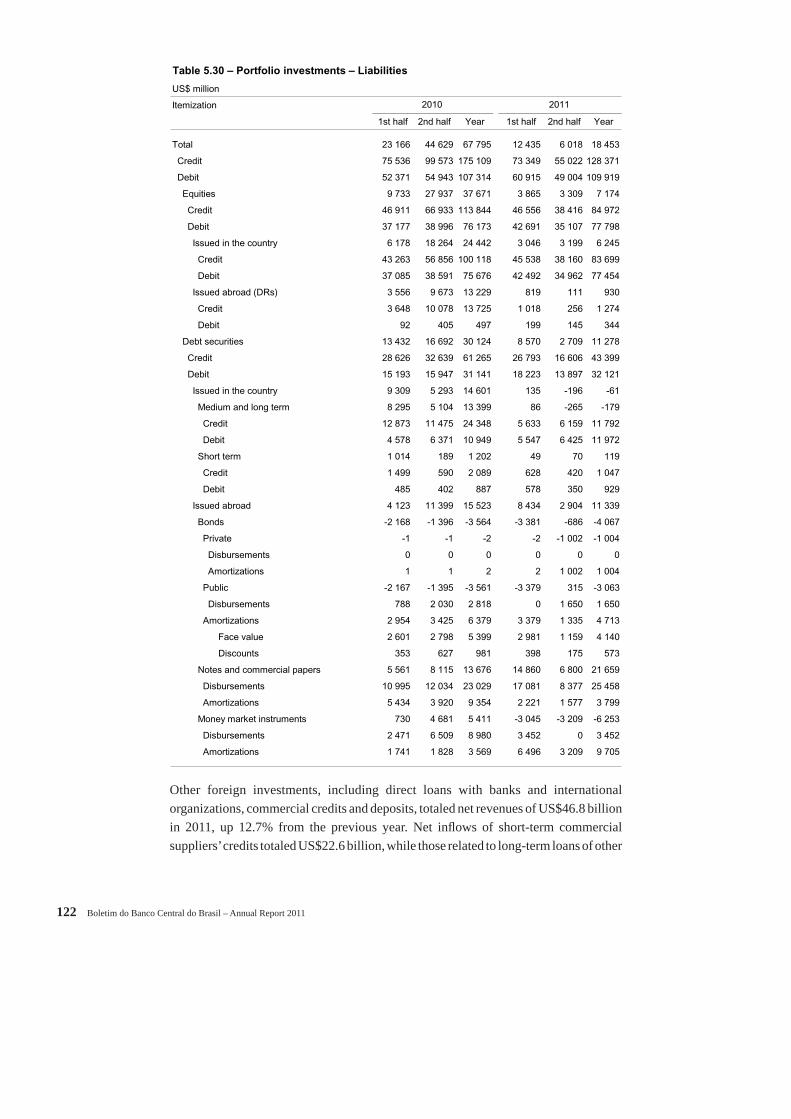
122 Boletim do Banco Central do Brasil – Annual Report 2011
Other foreign investments, including direct loans with banks and international organizations, commercial credits and deposits, totaled net revenues of US$46.8 billion in 2011, up 12.7% from the previous year. Net infl ows of short-term commercial suppliers’ credits totaled US$22.6 billion, while those related to long-term loans of other
Table 5.30 – Portfolio investments – Liabilities
US$ million
Itemization
1st half 2nd half Year 1st half 2nd half Year
Total 23 166 44 629 67 795 12 435 6 018 18 453
Credit 75 536 99 573 175 109 73 349 55 022 128 371
Debit 52 371 54 943 107 314 60 915 49 004 109 919
Equities 9 733 27 937 37 671 3 865 3 309 7 174
Credit 46 911 66 933 113 844 46 556 38 416 84 972
Debit 37 177 38 996 76 173 42 691 35 107 77 798
Issued in the country 6 178 18 264 24 442 3 046 3 199 6 245
Credit 43 263 56 856 100 118 45 538 38 160 83 699
Debit 37 085 38 591 75 676 42 492 34 962 77 454
Issued abroad (DRs) 3 556 9 673 13 229 819 111 930
Credit 3 648 10 078 13 725 1 018 256 1 274
Debit 92 405 497 199 145 344
Debt securities 13 432 16 692 30 124 8 570 2 709 11 278
Credit 28 626 32 639 61 265 26 793 16 606 43 399
Debit 15 193 15 947 31 141 18 223 13 897 32 121
Issued in the country 9 309 5 293 14 601 135 -196 -61
Medium and long term 8 295 5 104 13 399 86 -265 -179
Credit 12 873 11 475 24 348 5 633 6 159 11 792
Debit 4 578 6 371 10 949 5 547 6 425 11 972
Short term 1 014 189 1 202 49 70 119
Credit 1 499 590 2 089 628 420 1 047
Debit 485 402 887 578 350 929
Issued abroad 4 123 11 399 15 523 8 434 2 904 11 339
Bonds -2 168 -1 396 -3 564 -3 381 -686 -4 067
Private -1 -1 -2 -2 -1 002 -1 004
Disbursements 0 0 0 0 0 0
Amortizations 1 1 2 2 1 002 1 004
Public -2 167 -1 395 -3 561 -3 379 315 -3 063
Disbursements 788 2 030 2 818 0 1 650 1 650
Amortizations 2 954 3 425 6 379 3 379 1 335 4 713
Face value 2 601 2 798 5 399 2 981 1 159 4 140
Discounts 353 627 981 398 175 573
Notes and commercial papers 5 561 8 115 13 676 14 860 6 800 21 659
Disbursements 10 995 12 034 23 029 17 081 8 377 25 458
Amortizations 5 434 3 920 9 354 2 221 1 577 3 799
Money market instruments 730 4 681 5 411 -3 045 -3 209 -6 253
Disbursements 2 471 6 509 8 980 3 452 0 3 452
Amortizations 1 741 1 828 3 569 6 496 3 209 9 705
2011 2010
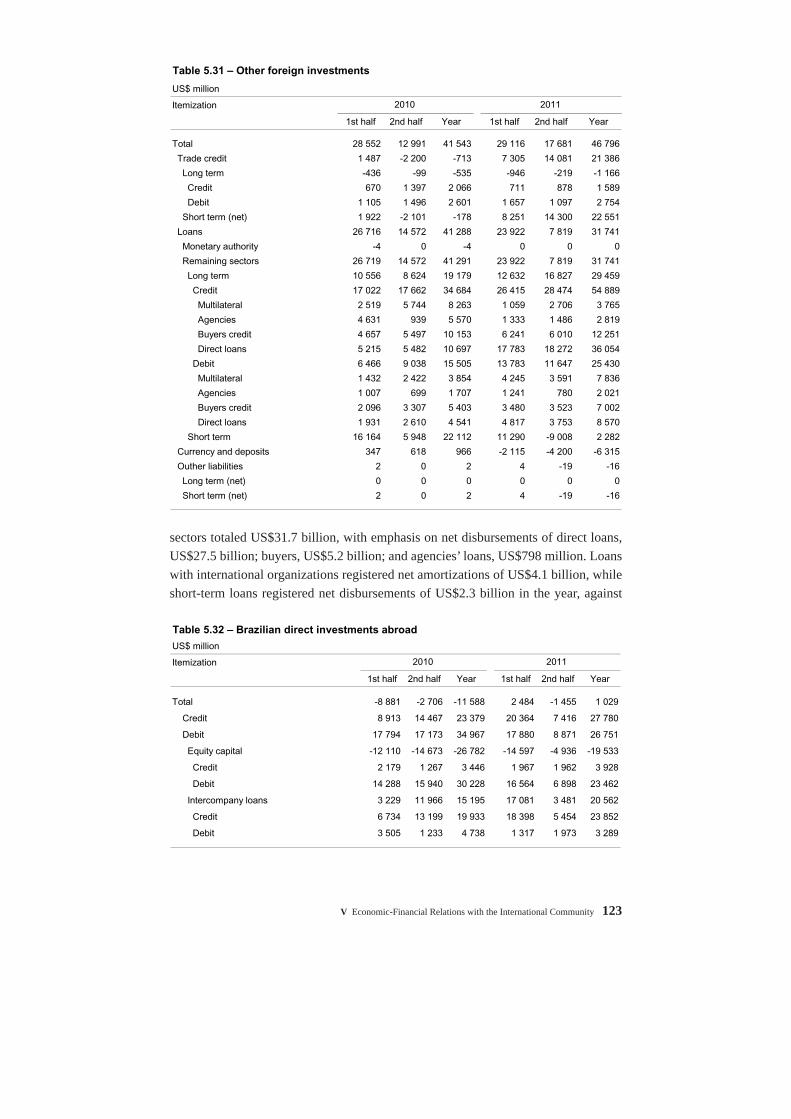
V Economic-Financial Relations with the International Community 123
sectors totaled US$31.7 billion, with emphasis on net disbursements of direct loans, US$27.5 billion; buyers, US$5.2 billion; and agencies’ loans, US$798 million. Loans with international organizations registered net amortizations of US$4.1 billion, while short-term loans registered net disbursements of US$2.3 billion in the year, against
Table 5.31 – Other foreign investments
US$ million
Itemization
1st half 2nd half Year 1st half 2nd half Year
Total 28 552 12 991 41 543 29 116 17 681 46 796
Trade credit 1 487 -2 200 -713 7 305 14 081 21 386
Long term -436 -99 -535 -946 -219 -1 166
Credit 670 1 397 2 066 711 878 1 589
Debit 1 105 1 496 2 601 1 657 1 097 2 754
Short term (net) 1 922 -2 101 -178 8 251 14 300 22 551
Loans 26 716 14 572 41 288 23 922 7 819 31 741
Monetary authority -4 0 -4 0 0 0
Remaining sectors 26 719 14 572 41 291 23 922 7 819 31 741
Long term 10 556 8 624 19 179 12 632 16 827 29 459
Credit 17 022 17 662 34 684 26 415 28 474 54 889
Multilateral 2 519 5 744 8 263 1 059 2 706 3 765
Agencies 4 631 939 5 570 1 333 1 486 2 819
Buyers credit 4 657 5 497 10 153 6 241 6 010 12 251
Direct loans 5 215 5 482 10 697 17 783 18 272 36 054
Debit 6 466 9 038 15 505 13 783 11 647 25 430
Multilateral 1 432 2 422 3 854 4 245 3 591 7 836
Agencies 1 007 699 1 707 1 241 780 2 021
Buyers credit 2 096 3 307 5 403 3 480 3 523 7 002
Direct loans 1 931 2 610 4 541 4 817 3 753 8 570
Short term 16 164 5 948 22 112 11 290 -9 008 2 282
Currency and deposits 347 618 966 -2 115 -4 200 -6 315
Outher liabilities 2 0 2 4 -19 -16
Long term (net) 0 0 0 0 0 0
Short term (net) 2 0 2 4 -19 -16
2010 2011
Table 5.32 – Brazilian direct investments abroad
US$ million
Itemization
1st half 2nd half Year 1st half 2nd half Year
Total -8 881 -2 706 -11 588 2 484 -1 455 1 029
Credit 8 913 14 467 23 379 20 364 7 416 27 780
Debit 17 794 17 173 34 967 17 880 8 871 26 751
Equity capital -12 110 -14 673 -26 782 -14 597 -4 936 -19 533
Credit 2 179 1 267 3 446 1 967 1 962 3 928
Debit 14 288 15 940 30 228 16 564 6 898 23 462
Intercompany loans 3 229 11 966 15 195 17 081 3 481 20 562
Credit 6 734 13 199 19 933 18 398 5 454 23 852
Debit 3 505 1 233 4 738 1 317 1 973 3 289
2010 2011
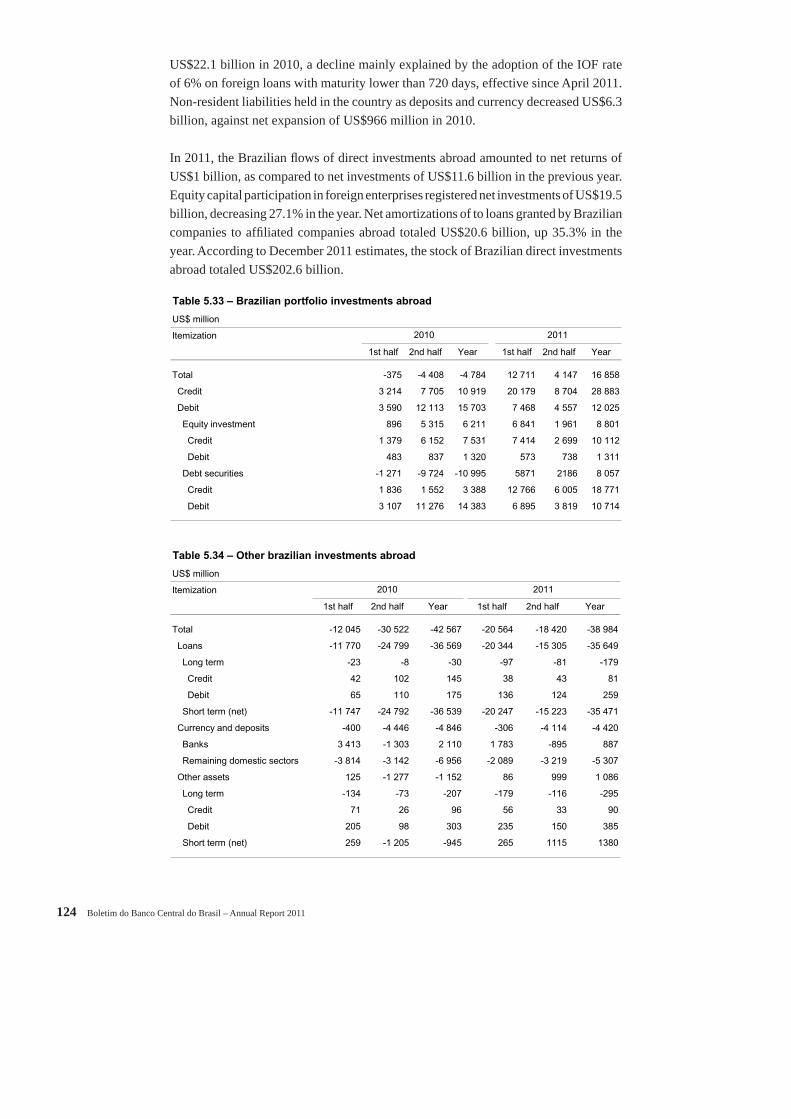
124 Boletim do Banco Central do Brasil – Annual Report 2011
US$22.1 billion in 2010, a decline mainly explained by the adoption of the IOF rate of 6% on foreign loans with maturity lower than 720 days, effective since April 2011. Non-resident liabilities held in the country as deposits and currency decreased US$6.3 billion, against net expansion of US$966 million in 2010.
In 2011, the Brazilian fl ows of direct investments abroad amounted to net returns of US$1 billion, as compared to net investments of US$11.6 billion in the previous year. Equity capital participation in foreign enterprises registered net investments of US$19.5 billion, decreasing 27.1% in the year. Net amortizations of to loans granted by Brazilian companies to affi liated companies abroad totaled US$20.6 billion, up 35.3% in the year. According to December 2011 estimates, the stock of Brazilian direct investments abroad totaled US$202.6 billion.
Table 5.34 – Other brazilian investments abroad
US$ million
Itemization
1st half 2nd half Year 1st half 2nd half Year
Total -12 045 -30 522 -42 567 -20 564 -18 420 -38 984
Loans -11 770 -24 799 -36 569 -20 344 -15 305 -35 649
Long term -23 -8 -30 -97 -81 -179
Credit 42 102 145 38 43 81
Debit 65 110 175 136 124 259
Short term (net) -11 747 -24 792 -36 539 -20 247 -15 223 -35 471
Currency and deposits -400 -4 446 -4 846 -306 -4 114 -4 420
Banks 3 413 -1 303 2 110 1 783 -895 887
Remaining domestic sectors -3 814 -3 142 -6 956 -2 089 -3 219 -5 307
Other assets 125 -1 277 -1 152 86 999 1 086
Long term -134 -73 -207 -179 -116 -295
Credit 71 26 96 56 33 90
Debit 205 98 303 235 150 385
Short term (net) 259 -1 205 -945 265 1115 1380
2010 2011
Table 5.33 – Brazilian portfolio investments abroad
US$ million
Itemization
1st half 2nd half Year 1st half 2nd half Year
Total -375 -4 408 -4 784 12 711 4 147 16 858
Credit 3 214 7 705 10 919 20 179 8 704 28 883
Debit 3 590 12 113 15 703 7 468 4 557 12 025
Equity investment 896 5 315 6 211 6 841 1 961 8 801
Credit 1 379 6 152 7 531 7 414 2 699 10 112
Debit 483 837 1 320 573 738 1 311
Debt securities -1 271 -9 724 -10 995 5871 2186 8 057
Credit 1 836 1 552 3 388 12 766 6 005 18 771
Debit 3 107 11 276 14 383 6 895 3 819 10 714
2010 2011
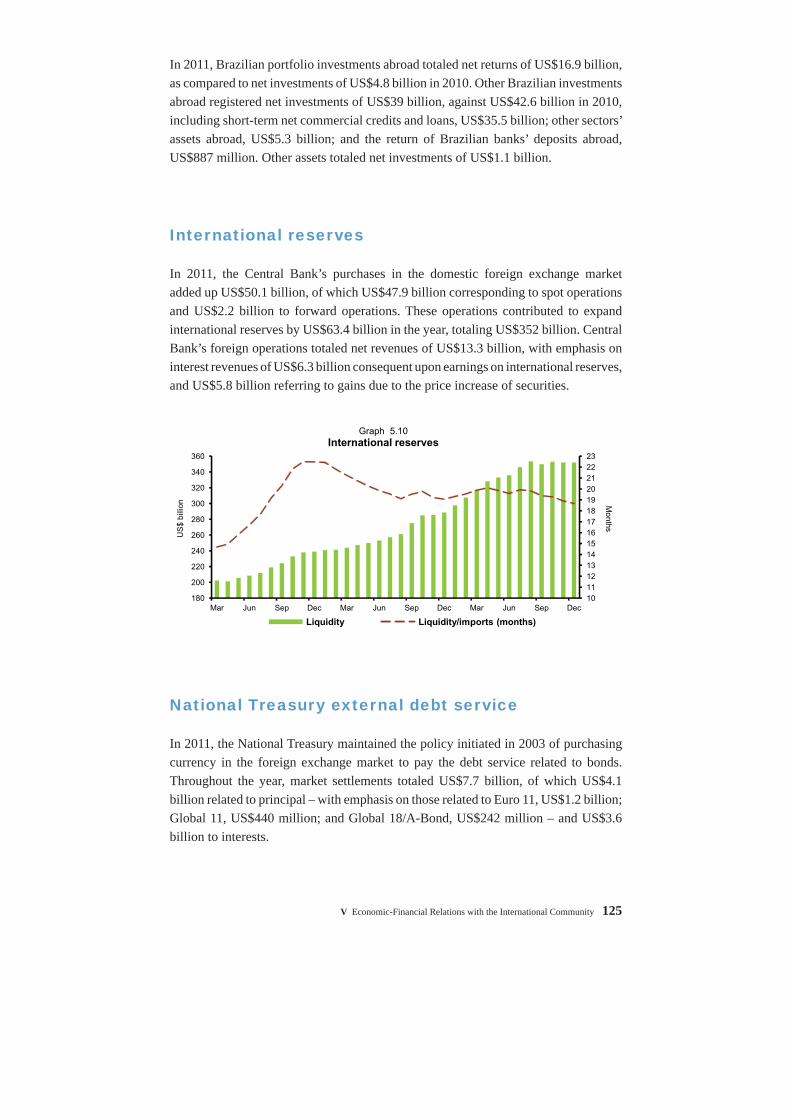
V Economic-Financial Relations with the International Community 125
In 2011, Brazilian portfolio investments abroad totaled net returns of US$16.9 billion, as compared to net investments of US$4.8 billion in 2010. Other Brazilian investments abroad registered net investments of US$39 billion, against US$42.6 billion in 2010, including short-term net commercial credits and loans, US$35.5 billion; other sectors’ assets abroad, US$5.3 billion; and the return of Brazilian banks’ deposits abroad, US$887 million. Other assets totaled net investments of US$1.1 billion.
International reserves
In 2011, the Central Bank’s purchases in the domestic foreign exchange market added up US$50.1 billion, of which US$47.9 billion corresponding to spot operations and US$2.2 billion to forward operations. These operations contributed to expand international reserves by US$63.4 billion in the year, totaling US$352 billion. Central Bank’s foreign operations totaled net revenues of US$13.3 billion, with emphasis on interest revenues of US$6.3 billion consequent upon earnings on international reserves, and US$5.8 billion referring to gains due to the price increase of securities.
National Treasury external debt service
In 2011, the National Treasury maintained the policy initiated in 2003 of purchasing currency in the foreign exchange market to pay the debt service related to bonds. Throughout the year, market settlements totaled US$7.7 billion, of which US$4.1 billion related to principal – with emphasis on those related to Euro 11, US$1.2 billion; Global 11, US$440 million; and Global 18/A-Bond, US$242 million – and US$3.6 billion to interests.
10 11 12 13 14 15 16 17 18 19 20 21 22 23
180
200
220
240
260
280
300
320
340
360
Mar Jun Sep Dec Mar Jun Sep Dec Mar Jun Sep Dec
Months
US
$ bi
llion
Liquidity Liquidity/imports (months)
Graph 5.10International reserves
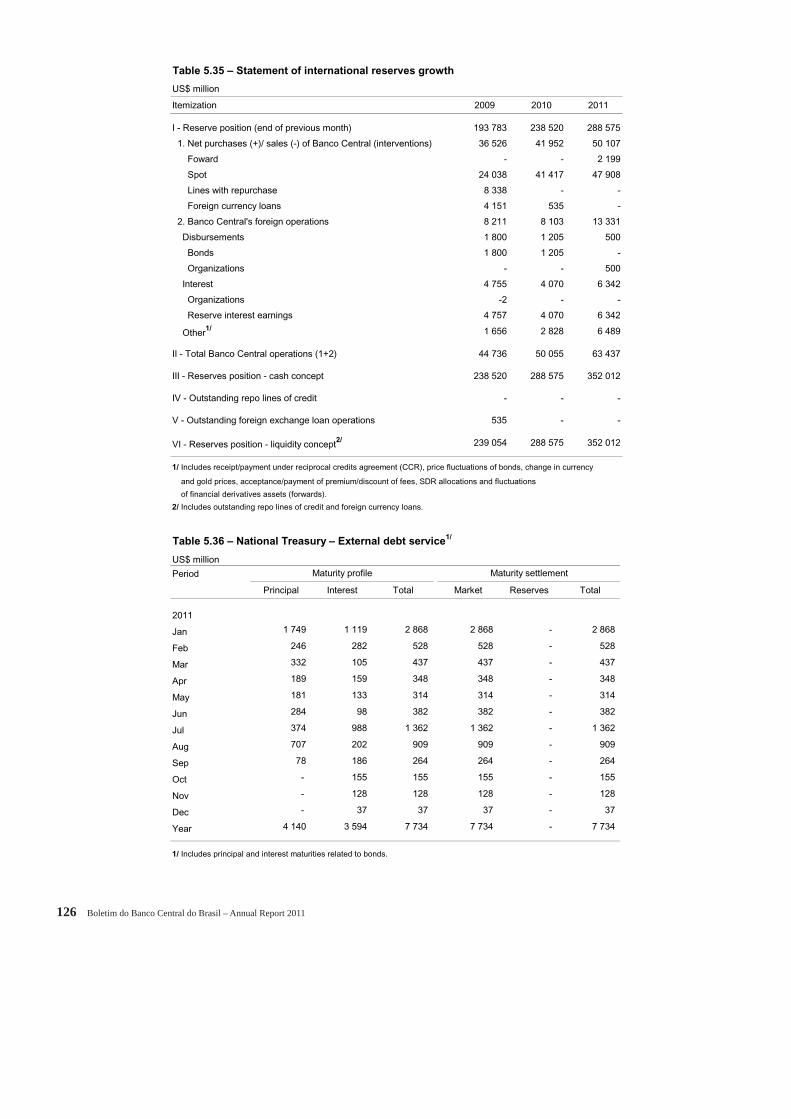
126 Boletim do Banco Central do Brasil – Annual Report 2011
Table 5.35 – Statement of international reserves growth
US$ million
Itemization 2009 2010 2011
I - Reserve position (end of previous month) 193 783 238 520 288 575
1. Net purchases (+)/ sales (-) of Banco Central (interventions) 36 526 41 952 50 107
Foward - - 2 199
Spot 24 038 41 417 47 908
Lines with repurchase 8 338 - -
Foreign currency loans 4 151 535 -
2. Banco Central's foreign operations 8 211 8 103 13 331
Disbursements 1 800 1 205 500
Bonds 1 800 1 205 -
Organizations - - 500
Interest 4 755 4 070 6 342
Organizations -2 - -
Reserve interest earnings 4 757 4 070 6 342
Other1/ 1 656 2 828 6 489
II - Total Banco Central operations (1+2) 44 736 50 055 63 437
III - Reserves position - cash concept 238 520 288 575 352 012
IV - Outstanding repo lines of credit - - -
V - Outstanding foreign exchange loan operations 535 - -
VI - Reserves position - liquidity concept2/ 239 054 288 575 352 012
1/ Includes receipt/payment under reciprocal credits agreement (CCR), price fluctuations of bonds, change in currency
and gold prices, acceptance/payment of premium/discount of fees, SDR allocations and fluctuations
of financial derivatives assets (forwards).
2/ Includes outstanding repo lines of credit and foreign currency loans.
Table 5.36 – National Treasury – External debt service1/
US$ million
Period
Principal Interest Total Market Reserves Total
2011
Jan 1 749 1 119 2 868 2 868 - 2 868
Feb 246 282 528 528 - 528
Mar 332 105 437 437 - 437
Apr 189 159 348 348 - 348
May 181 133 314 314 - 314
Jun 284 98 382 382 - 382
Jul 374 988 1 362 1 362 - 1 362
Aug 707 202 909 909 - 909
Sep 78 186 264 264 - 264
Oct - 155 155 155 - 155
Nov - 128 128 128 - 128
Dec - 37 37 37 - 37
Year 4 140 3 594 7 734 7 734 - 7 734
1/ Includes principal and interest maturities related to bonds.
Maturity profile Maturity settlement
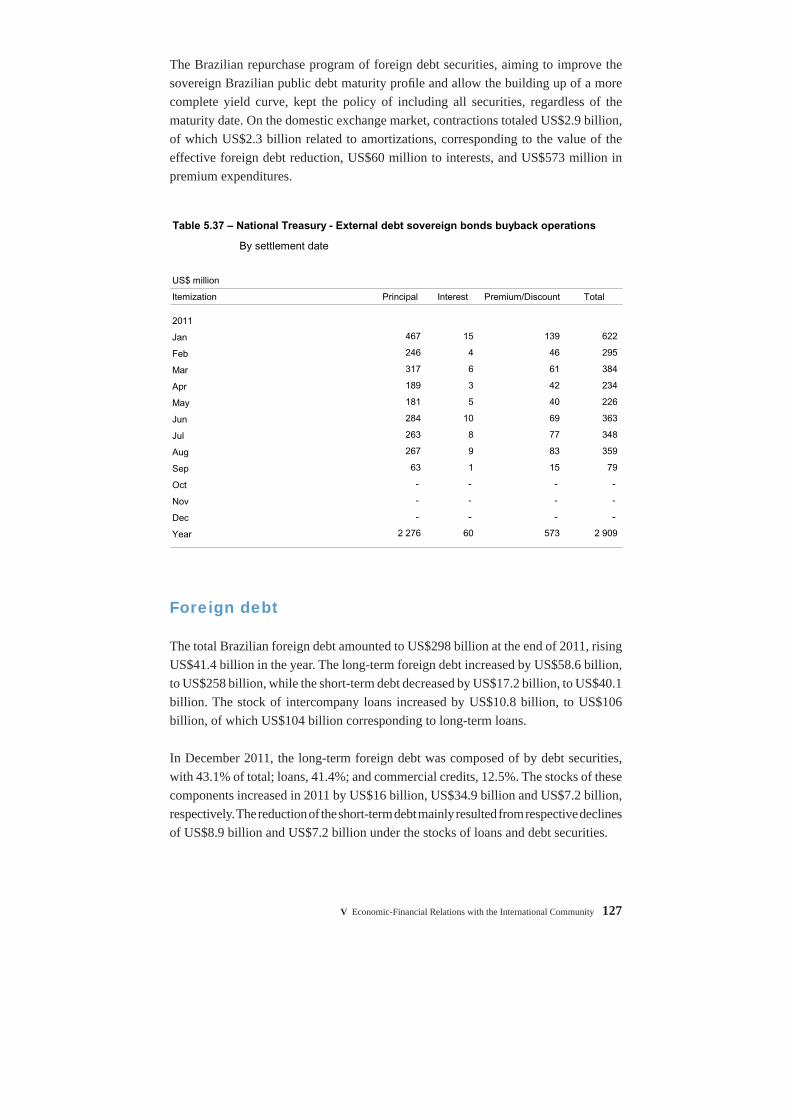
V Economic-Financial Relations with the International Community 127
The Brazilian repurchase program of foreign debt securities, aiming to improve the sovereign Brazilian public debt maturity profi le and allow the building up of a more complete yield curve, kept the policy of including all securities, regardless of the maturity date. On the domestic exchange market, contractions totaled US$2.9 billion, of which US$2.3 billion related to amortizations, corresponding to the value of the effective foreign debt reduction, US$60 million to interests, and US$573 million in premium expenditures.
Foreign debt
The total Brazilian foreign debt amounted to US$298 billion at the end of 2011, rising US$41.4 billion in the year. The long-term foreign debt increased by US$58.6 billion, to US$258 billion, while the short-term debt decreased by US$17.2 billion, to US$40.1 billion. The stock of intercompany loans increased by US$10.8 billion, to US$106 billion, of which US$104 billion corresponding to long-term loans.
In December 2011, the long-term foreign debt was composed of by debt securities, with 43.1% of total; loans, 41.4%; and commercial credits, 12.5%. The stocks of these components increased in 2011 by US$16 billion, US$34.9 billion and US$7.2 billion, respectively. The reduction of the short-term debt mainly resulted from respective declines of US$8.9 billion and US$7.2 billion under the stocks of loans and debt securities.
Table 5.37 – National Treasury - External debt sovereign bonds buyback operations
By settlement date
US$ million
Itemization Principal Interest Premium/Discount Total
2011
Jan 467 15 139 622
Feb 246 4 46 295
Mar 317 6 61 384
Apr 189 3 42 234
May 181 5 40 226
Jun 284 10 69 363
Jul 263 8 77 348
Aug 267 9 83 359
Sep 63 1 15 79
Oct - - - -
Nov - - - -
Dec - - - -
Year 2 276 60 573 2 909
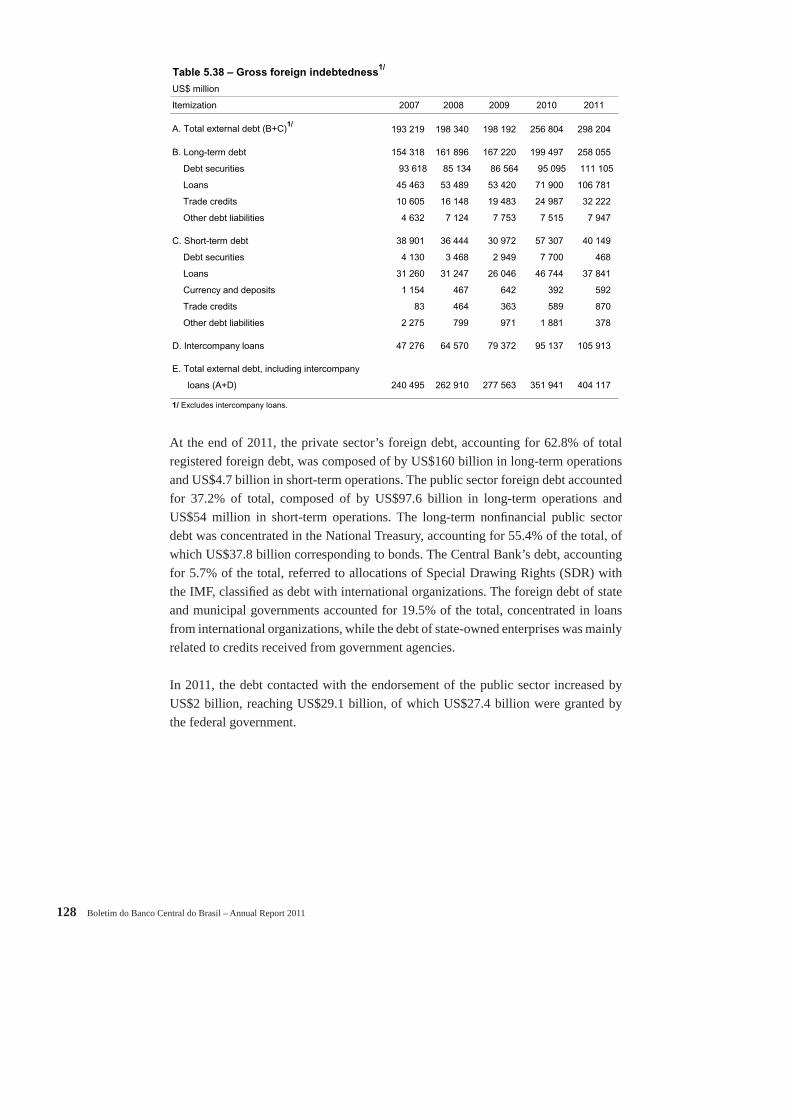
128 Boletim do Banco Central do Brasil – Annual Report 2011
At the end of 2011, the private sector’s foreign debt, accounting for 62.8% of total registered foreign debt, was composed of by US$160 billion in long-term operations and US$4.7 billion in short-term operations. The public sector foreign debt accounted for 37.2% of total, composed of by US$97.6 billion in long-term operations and US$54 million in short-term operations. The long-term nonfi nancial public sector debt was concentrated in the National Treasury, accounting for 55.4% of the total, of which US$37.8 billion corresponding to bonds. The Central Bank’s debt, accounting for 5.7% of the total, referred to allocations of Special Drawing Rights (SDR) with the IMF, classifi ed as debt with international organizations. The foreign debt of state and municipal governments accounted for 19.5% of the total, concentrated in loans from international organizations, while the debt of state-owned enterprises was mainly related to credits received from government agencies.
In 2011, the debt contacted with the endorsement of the public sector increased by US$2 billion, reaching US$29.1 billion, of which US$27.4 billion were granted by the federal government.
Table 5.38 – Gross foreign indebtedness1/
US$ million
Itemization 2007 2008 2009 2010 2011
A. Total external debt (B+C)1/193 219 198 340 198 192 256 804 298 204
B. Long-term debt 154 318 161 896 167 220 199 497 258 055
Debt securities 93 618 85 134 86 564 95 095 111 105
Loans 45 463 53 489 53 420 71 900 106 781
Trade credits 10 605 16 148 19 483 24 987 32 222
Other debt liabilities 4 632 7 124 7 753 7 515 7 947
C. Short-term debt 38 901 36 444 30 972 57 307 40 149
Debt securities 4 130 3 468 2 949 7 700 468
Loans 31 260 31 247 26 046 46 744 37 841
Currency and deposits 1 154 467 642 392 592
Trade credits 83 464 363 589 870
Other debt liabilities 2 275 799 971 1 881 378
D. Intercompany loans 47 276 64 570 79 372 95 137 105 913
E. Total external debt, including intercompany
loans (A+D) 240 495 262 910 277 563 351 941 404 117
1/ Excludes intercompany loans.
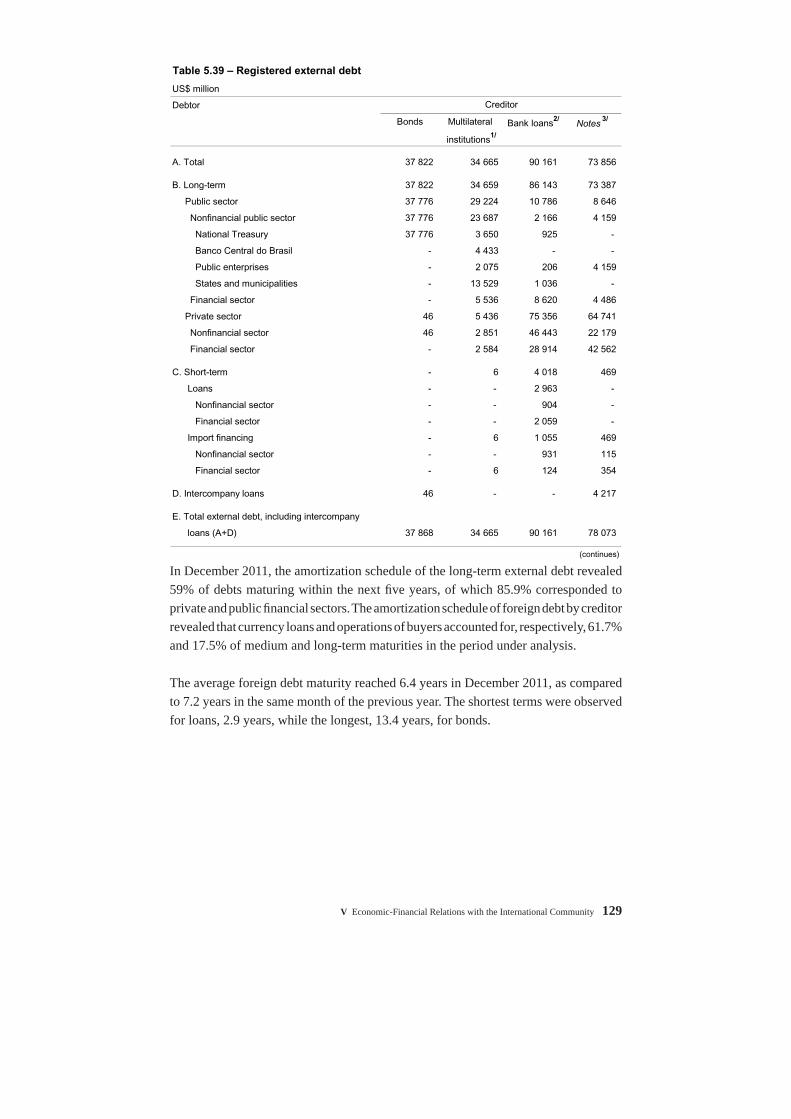
V Economic-Financial Relations with the International Community 129
In December 2011, the amortization schedule of the long-term external debt revealed 59% of debts maturing within the next fi ve years, of which 85.9% corresponded to private and public fi nancial sectors. The amortization schedule of foreign debt by creditor revealed that currency loans and operations of buyers accounted for, respectively, 61.7% and 17.5% of medium and long-term maturities in the period under analysis.
The average foreign debt maturity reached 6.4 years in December 2011, as compared to 7.2 years in the same month of the previous year. The shortest terms were observed for loans, 2.9 years, while the longest, 13.4 years, for bonds.
Table 5.39 – Registered external debt
US$ million
Debtor
Bonds Multilateral Bank loans2/Notes
3/
institutions1/
A. Total 37 822 34 665 90 161 73 856
B. Long-term 37 822 34 659 86 143 73 387
Public sector 37 776 29 224 10 786 8 646
Nonfinancial public sector 37 776 23 687 2 166 4 159
National Treasury 37 776 3 650 925 -
Banco Central do Brasil - 4 433 - -
Public enterprises - 2 075 206 4 159
States and municipalities - 13 529 1 036 -
Financial sector - 5 536 8 620 4 486
Private sector 46 5 436 75 356 64 741
Nonfinancial sector 46 2 851 46 443 22 179
Financial sector - 2 584 28 914 42 562
C. Short-term - 6 4 018 469
Loans - - 2 963 -
Nonfinancial sector - - 904 -
Financial sector - - 2 059 -
Import financing - 6 1 055 469
Nonfinancial sector - - 931 115
Financial sector - 6 124 354
D. Intercompany loans 46 - - 4 217
E. Total external debt, including intercompany
loans (A+D) 37 868 34 665 90 161 78 073
(continues)
Creditor
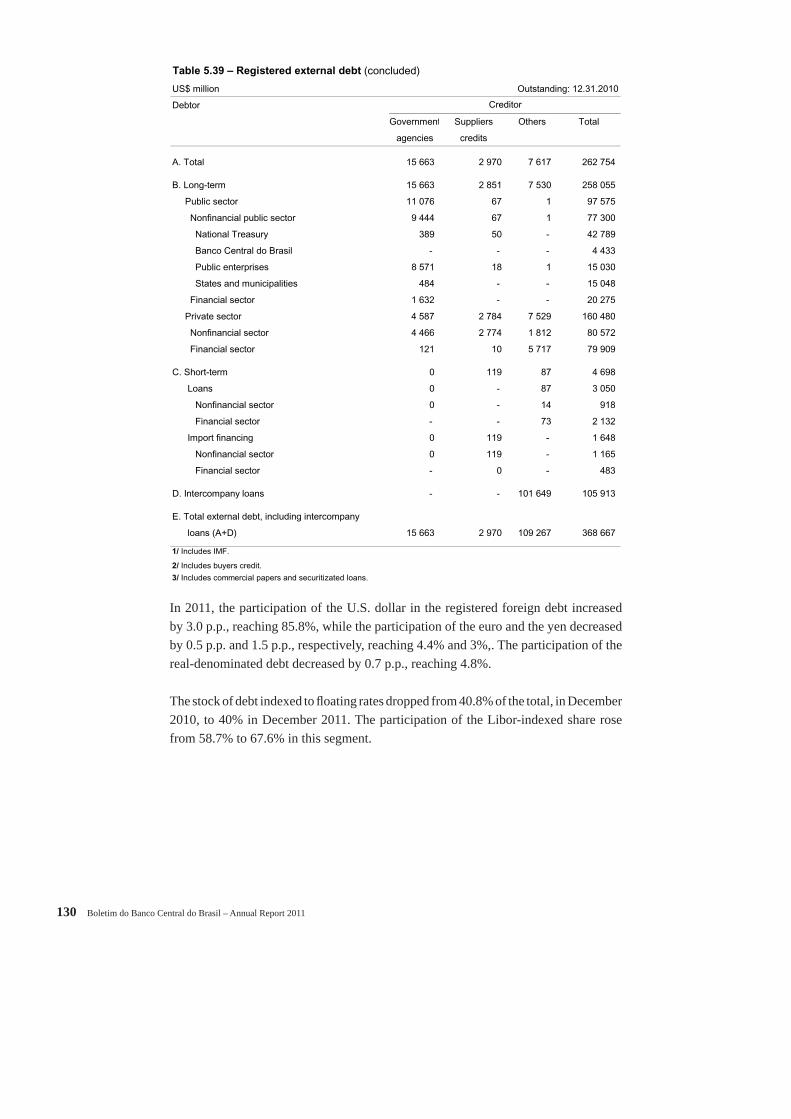
130 Boletim do Banco Central do Brasil – Annual Report 2011
In 2011, the participation of the U.S. dollar in the registered foreign debt increased by 3.0 p.p., reaching 85.8%, while the participation of the euro and the yen decreased by 0.5 p.p. and 1.5 p.p., respectively, reaching 4.4% and 3%,. The participation of the real-denominated debt decreased by 0.7 p.p., reaching 4.8%.
The stock of debt indexed to fl oating rates dropped from 40.8% of the total, in December 2010, to 40% in December 2011. The participation of the Libor-indexed share rose from 58.7% to 67.6% in this segment.
Table 5.39 – Registered external debt (concluded)
US$ million Outstanding: 12.31.2010
Debtor
Government Suppliers Others Total
agencies credits
A. Total 15 663 2 970 7 617 262 754
B. Long-term 15 663 2 851 7 530 258 055
Public sector 11 076 67 1 97 575
Nonfinancial public sector 9 444 67 1 77 300
National Treasury 389 50 - 42 789
Banco Central do Brasil - - - 4 433
Public enterprises 8 571 18 1 15 030
States and municipalities 484 - - 15 048
Financial sector 1 632 - - 20 275
Private sector 4 587 2 784 7 529 160 480
Nonfinancial sector 4 466 2 774 1 812 80 572
Financial sector 121 10 5 717 79 909
C. Short-term 0 119 87 4 698
Loans 0 - 87 3 050
Nonfinancial sector 0 - 14 918
Financial sector - - 73 2 132
Import financing 0 119 - 1 648
Nonfinancial sector 0 119 - 1 165
Financial sector - 0 - 483
D. Intercompany loans - - 101 649 105 913
E. Total external debt, including intercompany
loans (A+D) 15 663 2 970 109 267 368 667
1/ Includes IMF.
2/ Includes buyers credit.
3/ Includes commercial papers and securitizated loans.
Creditor
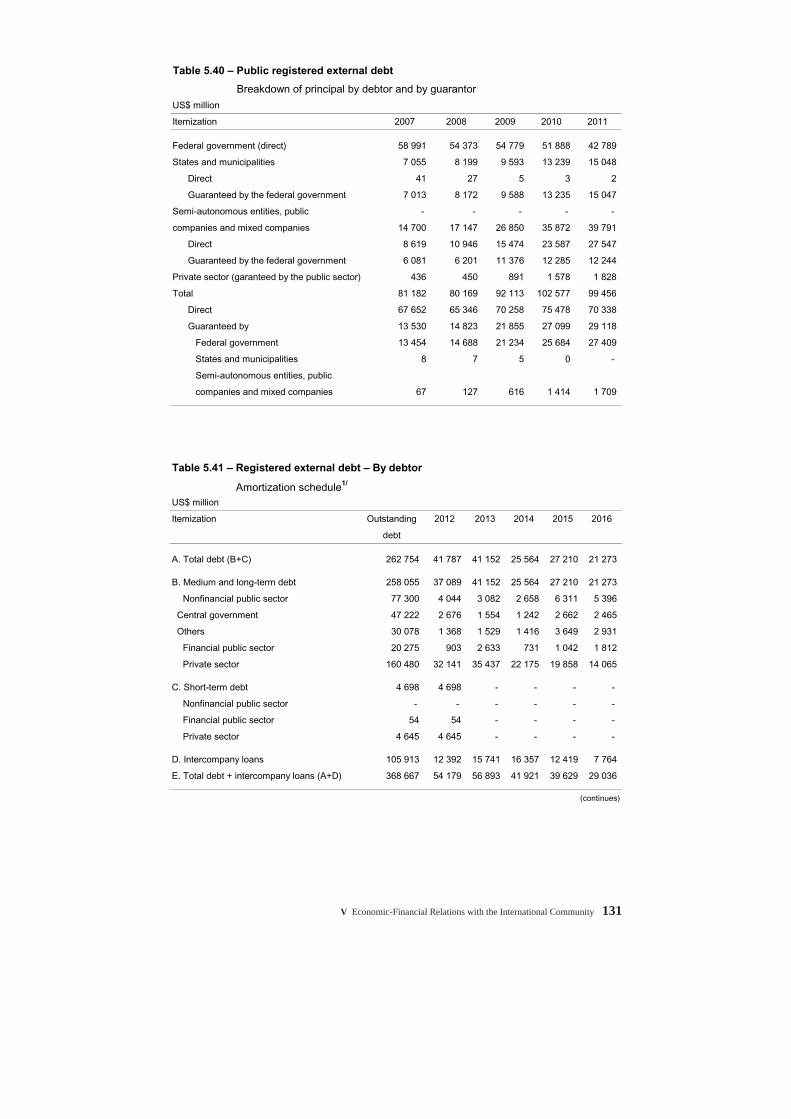
V Economic-Financial Relations with the International Community 131
Table 5.41 – Registered external debt – By debtor
Amortization schedule1/
US$ million
Itemization Outstanding 2012 2013 2014 2015 2016
debt
A. Total debt (B+C) 262 754 41 787 41 152 25 564 27 210 21 273
B. Medium and long-term debt 258 055 37 089 41 152 25 564 27 210 21 273
Nonfinancial public sector 77 300 4 044 3 082 2 658 6 311 5 396
Central government 47 222 2 676 1 554 1 242 2 662 2 465
Others 30 078 1 368 1 529 1 416 3 649 2 931
Financial public sector 20 275 903 2 633 731 1 042 1 812
Private sector 160 480 32 141 35 437 22 175 19 858 14 065
C. Short-term debt 4 698 4 698 - - - -
Nonfinancial public sector - - - - - -
Financial public sector 54 54 - - - -
Private sector 4 645 4 645 - - - -
D. Intercompany loans 105 913 12 392 15 741 16 357 12 419 7 764
E. Total debt + intercompany loans (A+D) 368 667 54 179 56 893 41 921 39 629 29 036
(continues)
Table 5.40 – Public registered external debt
Breakdown of principal by debtor and by guarantor
US$ million
Itemization 2007 2008 2009 2010 2011
Federal government (direct) 58 991 54 373 54 779 51 888 42 789
States and municipalities 7 055 8 199 9 593 13 239 15 048
Direct 41 27 5 3 2
Guaranteed by the federal government 7 013 8 172 9 588 13 235 15 047
Semi-autonomous entities, public - - - - -
companies and mixed companies 14 700 17 147 26 850 35 872 39 791
Direct 8 619 10 946 15 474 23 587 27 547
Guaranteed by the federal government 6 081 6 201 11 376 12 285 12 244
Private sector (garanteed by the public sector) 436 450 891 1 578 1 828
Total 81 182 80 169 92 113 102 577 99 456
Direct 67 652 65 346 70 258 75 478 70 338
Guaranteed by 13 530 14 823 21 855 27 099 29 118
Federal government 13 454 14 688 21 234 25 684 27 409
States and municipalities 8 7 5 0 -
Semi-autonomous entities, public
companies and mixed companies 67 127 616 1 414 1 709
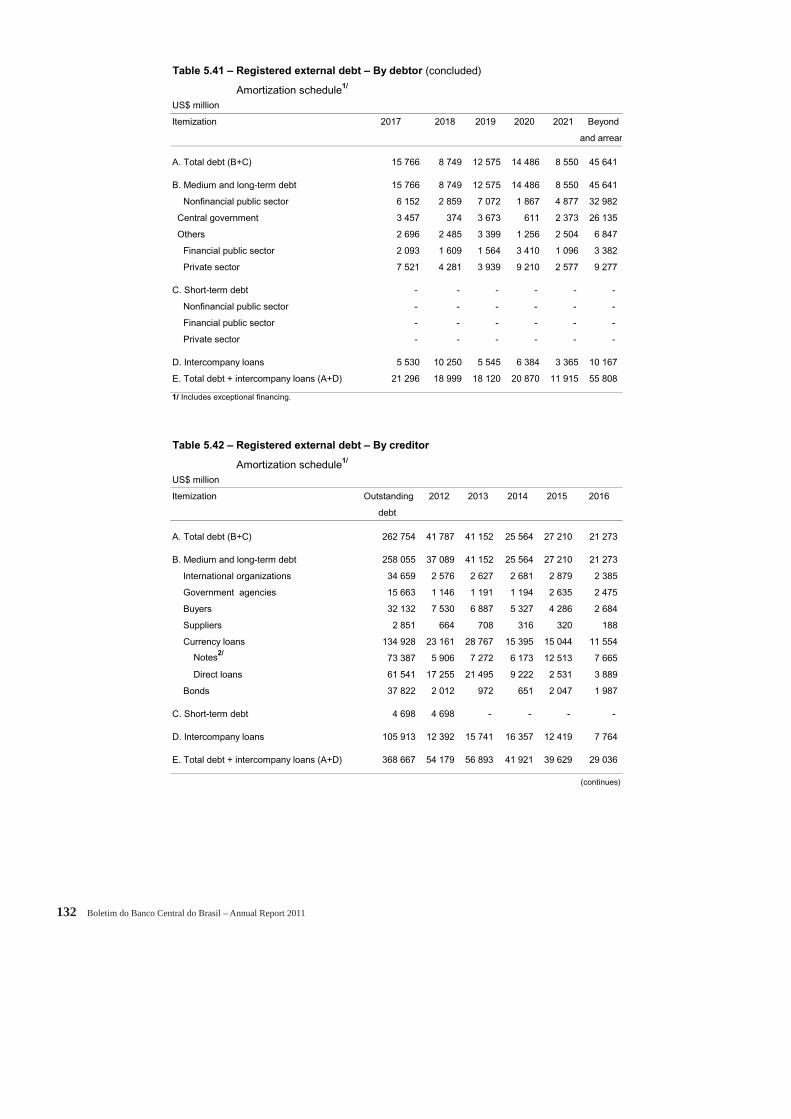
132 Boletim do Banco Central do Brasil – Annual Report 2011
Table 5.41 – Registered external debt – By debtor (concluded)
Amortization schedule1/
US$ million
Itemization 2017 2018 2019 2020 2021 Beyond
and arrears
A. Total debt (B+C) 15 766 8 749 12 575 14 486 8 550 45 641
B. Medium and long-term debt 15 766 8 749 12 575 14 486 8 550 45 641
Nonfinancial public sector 6 152 2 859 7 072 1 867 4 877 32 982
Central government 3 457 374 3 673 611 2 373 26 135
Others 2 696 2 485 3 399 1 256 2 504 6 847
Financial public sector 2 093 1 609 1 564 3 410 1 096 3 382
Private sector 7 521 4 281 3 939 9 210 2 577 9 277
C. Short-term debt - - - - - -
Nonfinancial public sector - - - - - -
Financial public sector - - - - - -
Private sector - - - - - -
D. Intercompany loans 5 530 10 250 5 545 6 384 3 365 10 167
E. Total debt + intercompany loans (A+D) 21 296 18 999 18 120 20 870 11 915 55 808
1/ Includes exceptional financing.
Table 5.42 – Registered external debt – By creditor
Amortization schedule1/
US$ million
Itemization Outstanding 2012 2013 2014 2015 2016
debt
A. Total debt (B+C) 262 754 41 787 41 152 25 564 27 210 21 273
B. Medium and long-term debt 258 055 37 089 41 152 25 564 27 210 21 273
International organizations 34 659 2 576 2 627 2 681 2 879 2 385
Government agencies 15 663 1 146 1 191 1 194 2 635 2 475
Buyers 32 132 7 530 6 887 5 327 4 286 2 684
Suppliers 2 851 664 708 316 320 188
Currency loans 134 928 23 161 28 767 15 395 15 044 11 554
Notes2/ 73 387 5 906 7 272 6 173 12 513 7 665
Direct loans 61 541 17 255 21 495 9 222 2 531 3 889
Bonds 37 822 2 012 972 651 2 047 1 987
C. Short-term debt 4 698 4 698 - - - -
D. Intercompany loans 105 913 12 392 15 741 16 357 12 419 7 764
E. Total debt + intercompany loans (A+D) 368 667 54 179 56 893 41 921 39 629 29 036
(continues)
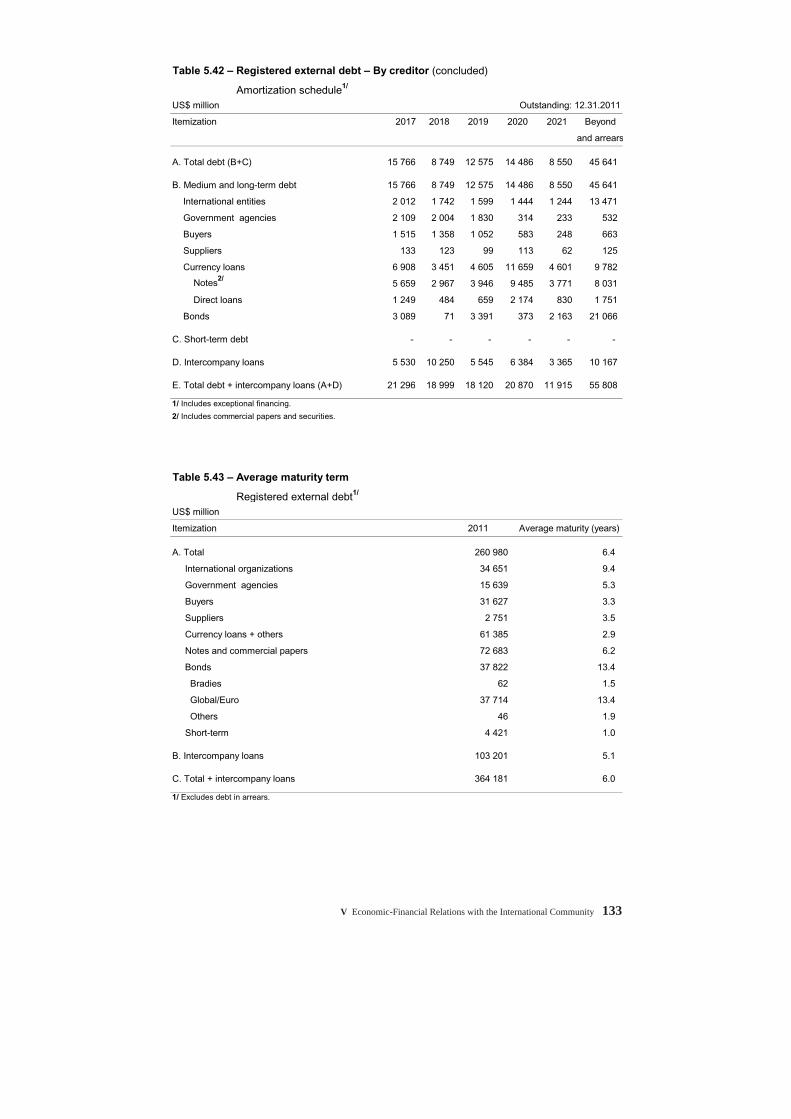
V Economic-Financial Relations with the International Community 133
Table 5.42 – Registered external debt – By creditor (concluded)
Amortization schedule1/
US$ million Outstanding: 12.31.2011
Itemization 2017 2018 2019 2020 2021 Beyond
and arrears
A. Total debt (B+C) 15 766 8 749 12 575 14 486 8 550 45 641
B. Medium and long-term debt 15 766 8 749 12 575 14 486 8 550 45 641
International entities 2 012 1 742 1 599 1 444 1 244 13 471
Government agencies 2 109 2 004 1 830 314 233 532
Buyers 1 515 1 358 1 052 583 248 663
Suppliers 133 123 99 113 62 125
Currency loans 6 908 3 451 4 605 11 659 4 601 9 782
Notes2/ 5 659 2 967 3 946 9 485 3 771 8 031
Direct loans 1 249 484 659 2 174 830 1 751
Bonds 3 089 71 3 391 373 2 163 21 066
C. Short-term debt - - - - - -
D. Intercompany loans 5 530 10 250 5 545 6 384 3 365 10 167
E. Total debt + intercompany loans (A+D) 21 296 18 999 18 120 20 870 11 915 55 808
1/ Includes exceptional financing.
2/ Includes commercial papers and securities.
Table 5.43 – Average maturity term
Registered external debt1/
US$ million
Itemization 2011 Average maturity (years)
A. Total 260 980 6.4
International organizations 34 651 9.4
Government agencies 15 639 5.3
Buyers 31 627 3.3
Suppliers 2 751 3.5
Currency loans + others 61 385 2.9
Notes and commercial papers 72 683 6.2
Bonds 37 822 13.4
Bradies 62 1.5
Global/Euro 37 714 13.4
Others 46 1.9
Short-term 4 421 1.0
B. Intercompany loans 103 201 5.1
C. Total + intercompany loans 364 181 6.0
1/ Excludes debt in arrears.
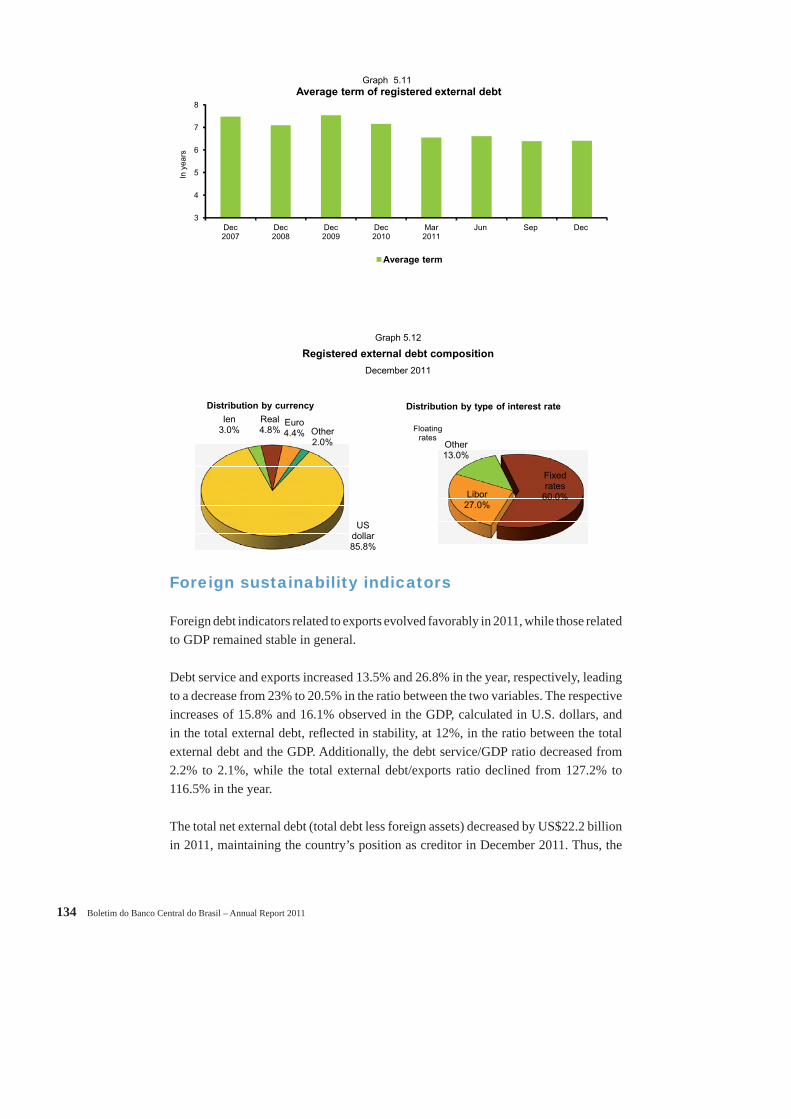
134 Boletim do Banco Central do Brasil – Annual Report 2011
Foreign sustainability indicators
Foreign debt indicators related to exports evolved favorably in 2011, while those related to GDP remained stable in general.
Debt service and exports increased 13.5% and 26.8% in the year, respectively, leading to a decrease from 23% to 20.5% in the ratio between the two variables. The respective increases of 15.8% and 16.1% observed in the GDP, calculated in U.S. dollars, and in the total external debt, refl ected in stability, at 12%, in the ratio between the total external debt and the GDP. Additionally, the debt service/GDP ratio decreased from 2.2% to 2.1%, while the total external debt/exports ratio declined from 127.2% to 116.5% in the year.
The total net external debt (total debt less foreign assets) decreased by US$22.2 billion in 2011, maintaining the country’s position as creditor in December 2011. Thus, the
3
4
5
6
7
8
Dec2007
Dec2008
Dec2009
Dec2010
Mar2011
Jun Sep Dec
In y
ears
Average term
Graph 5.11Average term of registered external debt
Graph 5.12
Registered external debt composition
December 2011
Libor27.0%
Other13.0%
Fixed rates
60.0%
Floating rates
Distribution by type of interest rate
Ien3.0%
Real4.8%
Euro4.4% Other
2.0%
US dollar85.8%
Distribution by currency
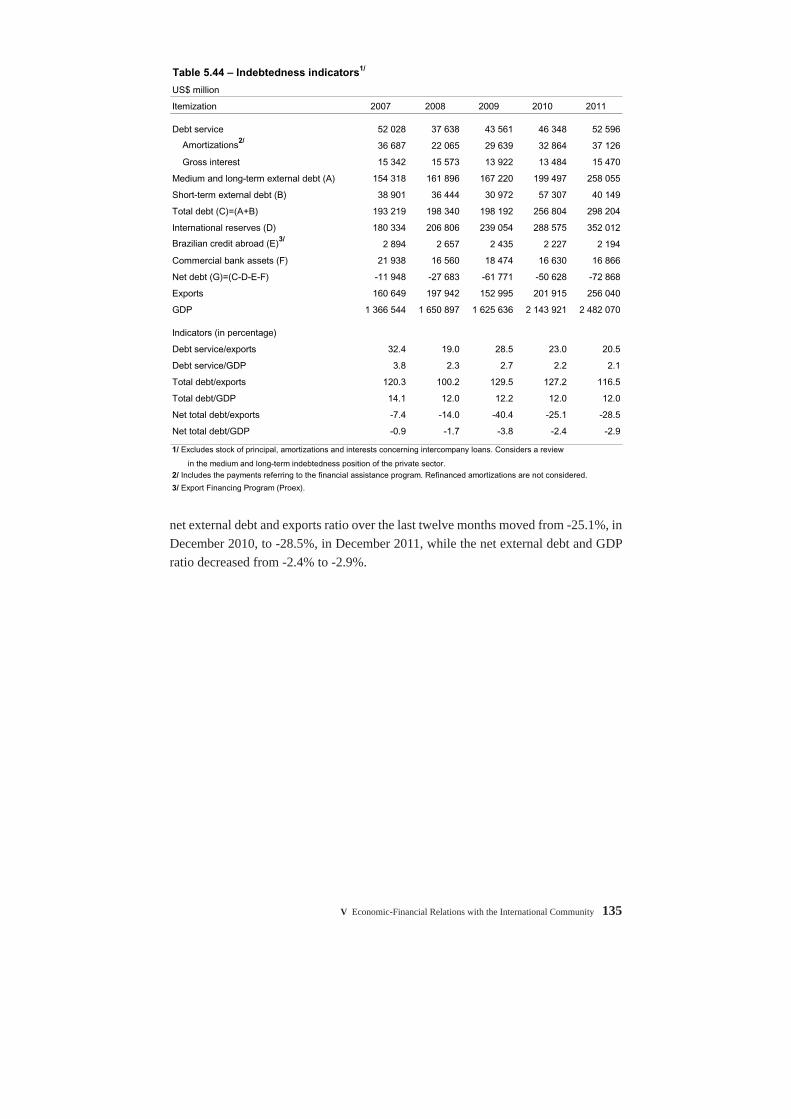
V Economic-Financial Relations with the International Community 135
net external debt and exports ratio over the last twelve months moved from -25.1%, in December 2010, to -28.5%, in December 2011, while the net external debt and GDP ratio decreased from -2.4% to -2.9%.
Table 5.44 – Indebtedness indicators1/
US$ million
Itemization 2007 2008 2009 2010 2011
Debt service 52 028 37 638 43 561 46 348 52 596
Amortizations2/36 687 22 065 29 639 32 864 37 126
Gross interest 15 342 15 573 13 922 13 484 15 470
Medium and long-term external debt (A) 154 318 161 896 167 220 199 497 258 055
Short-term external debt (B) 38 901 36 444 30 972 57 307 40 149
Total debt (C)=(A+B) 193 219 198 340 198 192 256 804 298 204
International reserves (D) 180 334 206 806 239 054 288 575 352 012
Brazilian credit abroad (E)3/2 894 2 657 2 435 2 227 2 194
Commercial bank assets (F) 21 938 16 560 18 474 16 630 16 866
Net debt (G)=(C-D-E-F) -11 948 -27 683 -61 771 -50 628 -72 868
Exports 160 649 197 942 152 995 201 915 256 040
GDP 1 366 544 1 650 897 1 625 636 2 143 921 2 482 070
Indicators (in percentage)
Debt service/exports 32.4 19.0 28.5 23.0 20.5
Debt service/GDP 3.8 2.3 2.7 2.2 2.1
Total debt/exports 120.3 100.2 129.5 127.2 116.5
Total debt/GDP 14.1 12.0 12.2 12.0 12.0
Net total debt/exports -7.4 -14.0 -40.4 -25.1 -28.5
Net total debt/GDP -0.9 -1.7 -3.8 -2.4 -2.9
1/ Excludes stock of principal, amortizations and interests concerning intercompany loans. Considers a review
in the medium and long-term indebtedness position of the private sector.2/ Includes the payments referring to the financial assistance program. Refinanced amortizations are not considered.
3/ Export Financing Program (Proex).
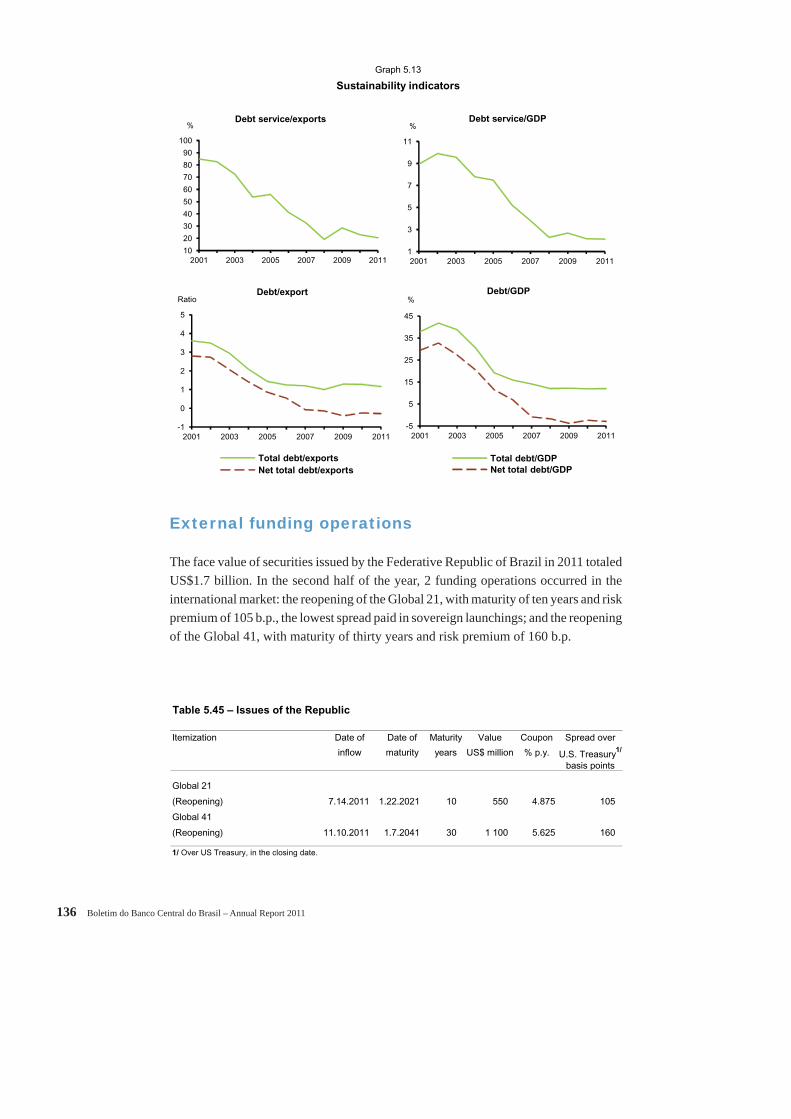
136 Boletim do Banco Central do Brasil – Annual Report 2011
External funding operations
The face value of securities issued by the Federative Republic of Brazil in 2011 totaled US$1.7 billion. In the second half of the year, 2 funding operations occurred in the international market: the reopening of the Global 21, with maturity of ten years and risk premium of 105 b.p., the lowest spread paid in sovereign launchings; and the reopening of the Global 41, with maturity of thirty years and risk premium of 160 b.p.
Table 5.45 – Issues of the Republic
Itemization Date of Date of Maturity Value Coupon Spread over
inflow maturity years US$ million % p.y. U.S. Treasury1/
basis points
Global 21
(Reopening) 7.14.2011 1.22.2021 10 550 4.875 105
Global 41
(Reopening) 11.10.2011 1.7.2041 30 1 100 5.625 160
1/ Over US Treasury, in the closing date.
Graph 5.13
Sustainability indicators
10
20
30
40
50
60
70
80
90
100
2001 2003 2005 2007 2009 2011
%Debt service/exports
1
3
5
7
9
11
2001 2003 2005 2007 2009 2011
%Debt service/GDP
-1
0
1
2
3
4
5
2001 2003 2005 2007 2009 2011
Debt/export
Total debt/exports
Net total debt/exports
Ratio
-5
5
15
25
35
45
2001 2003 2005 2007 2009 2011
%Debt/GDP
Total debt/GDP
Net total debt/GDP
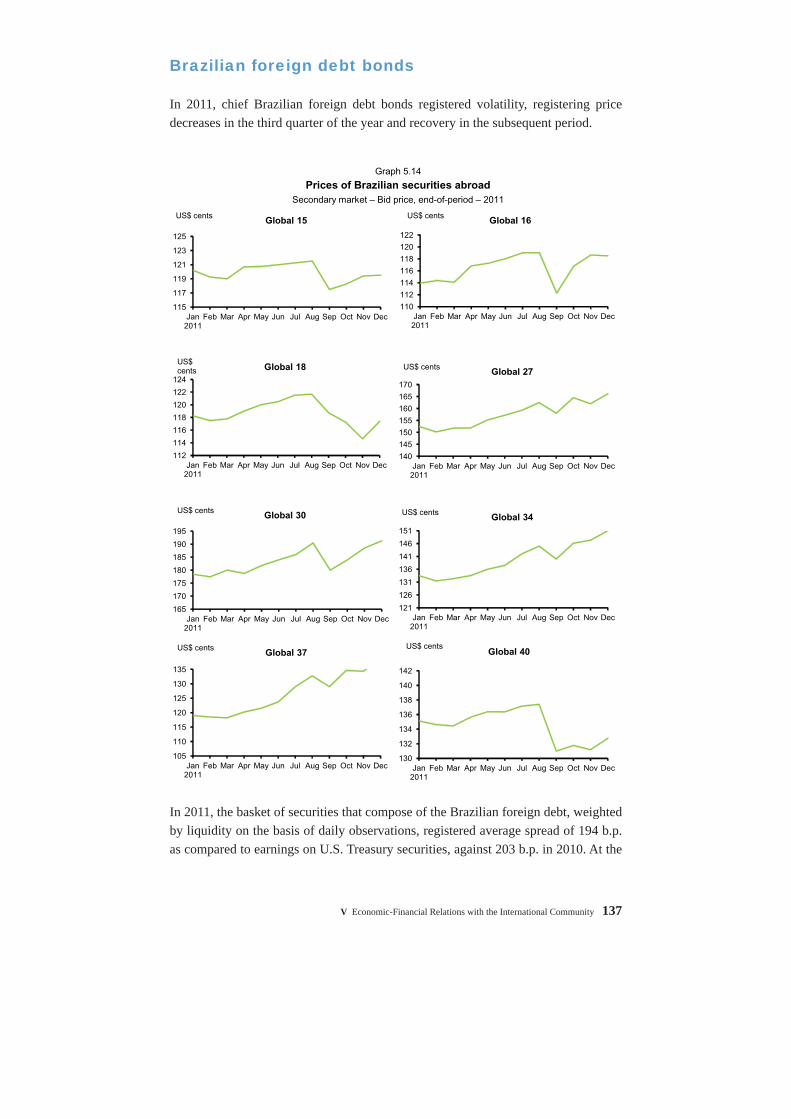
V Economic-Financial Relations with the International Community 137
Brazilian foreign debt bonds
In 2011, chief Brazilian foreign debt bonds registered volatility, registering price decreases in the third quarter of the year and recovery in the subsequent period.
In 2011, the basket of securities that compose of the Brazilian foreign debt, weighted by liquidity on the basis of daily observations, registered average spread of 194 b.p. as compared to earnings on U.S. Treasury securities, against 203 b.p. in 2010. At the
Graph 5.14
Prices of Brazilian securities abroad
Secondary market – Bid price, end-of-period – 2011
115
117
119
121
123
125
Jan2011
Feb Mar Apr May Jun Jul Aug Sep Oct Nov Dec
US$ centsGlobal 15
110
112
114
116
118
120
122
Jan2011
Feb Mar Apr May Jun Jul Aug Sep Oct Nov Dec
US$ centsGlobal 16
112
114
116
118
120
122
124
Jan2011
Feb Mar Apr May Jun Jul Aug Sep Oct Nov Dec
US$ cents Global 18
140
145
150
155
160
165
170
Jan2011
Feb Mar Apr May Jun Jul Aug Sep Oct Nov Dec
US$ centsGlobal 27
165
170
175
180
185
190
195
Jan2011
Feb Mar Apr May Jun Jul Aug Sep Oct Nov Dec
US$ centsGlobal 30
121
126
131
136
141
146
151
Jan2011
Feb Mar Apr May Jun Jul Aug Sep Oct Nov Dec
US$ centsGlobal 34
105
110
115
120
125
130
135
Jan2011
Feb Mar Apr May Jun Jul Aug Sep Oct Nov Dec
US$ centsGlobal 37
130
132
134
136
138
140
142
Jan2011
Feb Mar Apr May Jun Jul Aug Sep Oct Nov Dec
US$ centsGlobal 40
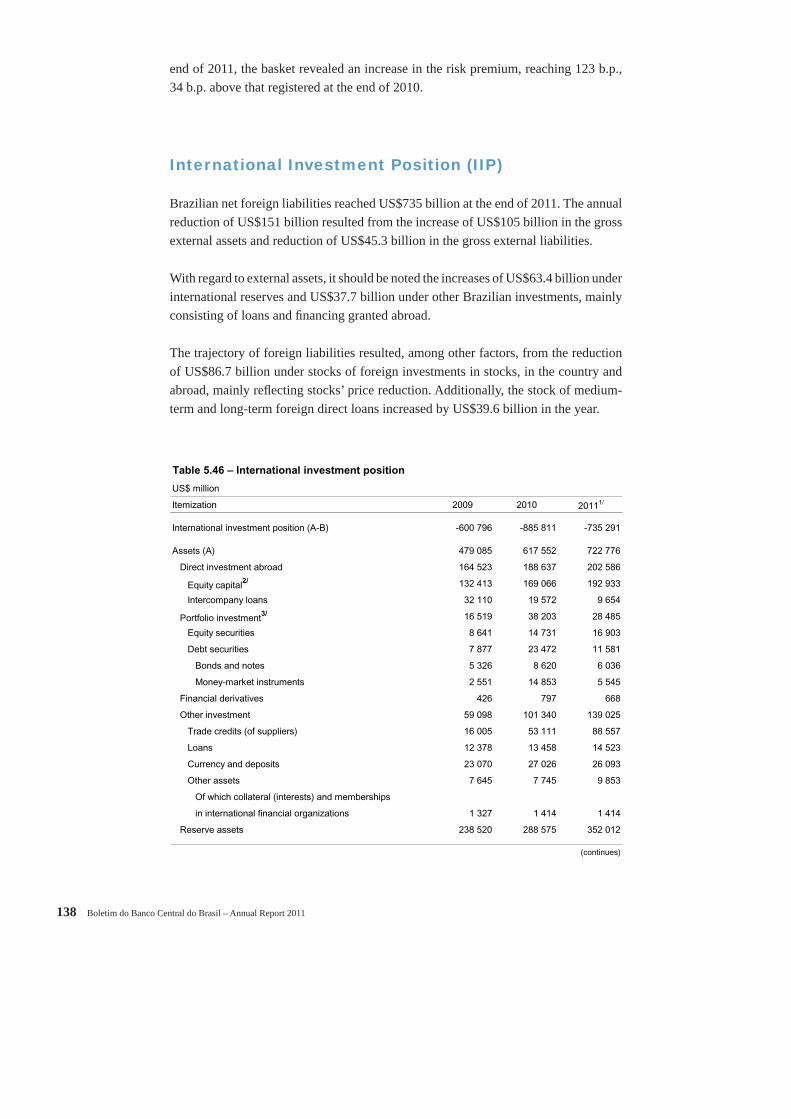
138 Boletim do Banco Central do Brasil – Annual Report 2011
end of 2011, the basket revealed an increase in the risk premium, reaching 123 b.p., 34 b.p. above that registered at the end of 2010.
International Investment Position (IIP)
Brazilian net foreign liabilities reached US$735 billion at the end of 2011. The annual reduction of US$151 billion resulted from the increase of US$105 billion in the gross external assets and reduction of US$45.3 billion in the gross external liabilities.
With regard to external assets, it should be noted the increases of US$63.4 billion under international reserves and US$37.7 billion under other Brazilian investments, mainly consisting of loans and fi nancing granted abroad.
The trajectory of foreign liabilities resulted, among other factors, from the reduction of US$86.7 billion under stocks of foreign investments in stocks, in the country and abroad, mainly refl ecting stocks’ price reduction. Additionally, the stock of medium-term and long-term foreign direct loans increased by US$39.6 billion in the year.
Table 5.46 – International investment position
US$ million
Itemization 2009 2010 20111/
International investment position (A-B) -600 796 -885 811 -735 291
Assets (A) 479 085 617 552 722 776
Direct investment abroad 164 523 188 637 202 586
Equity capital2/ 132 413 169 066 192 933
Intercompany loans 32 110 19 572 9 654
Portfolio investment3/ 16 519 38 203 28 485
Equity securities 8 641 14 731 16 903
Debt securities 7 877 23 472 11 581
Bonds and notes 5 326 8 620 6 036
Money-market instruments 2 551 14 853 5 545
Financial derivatives 426 797 668
Other investment 59 098 101 340 139 025
Trade credits (of suppliers) 16 005 53 111 88 557
Loans 12 378 13 458 14 523
Currency and deposits 23 070 27 026 26 093
Other assets 7 645 7 745 9 853
Of which collateral (interests) and memberships
in international financial organizations 1 327 1 414 1 414
Reserve assets 238 520 288 575 352 012
(continues)
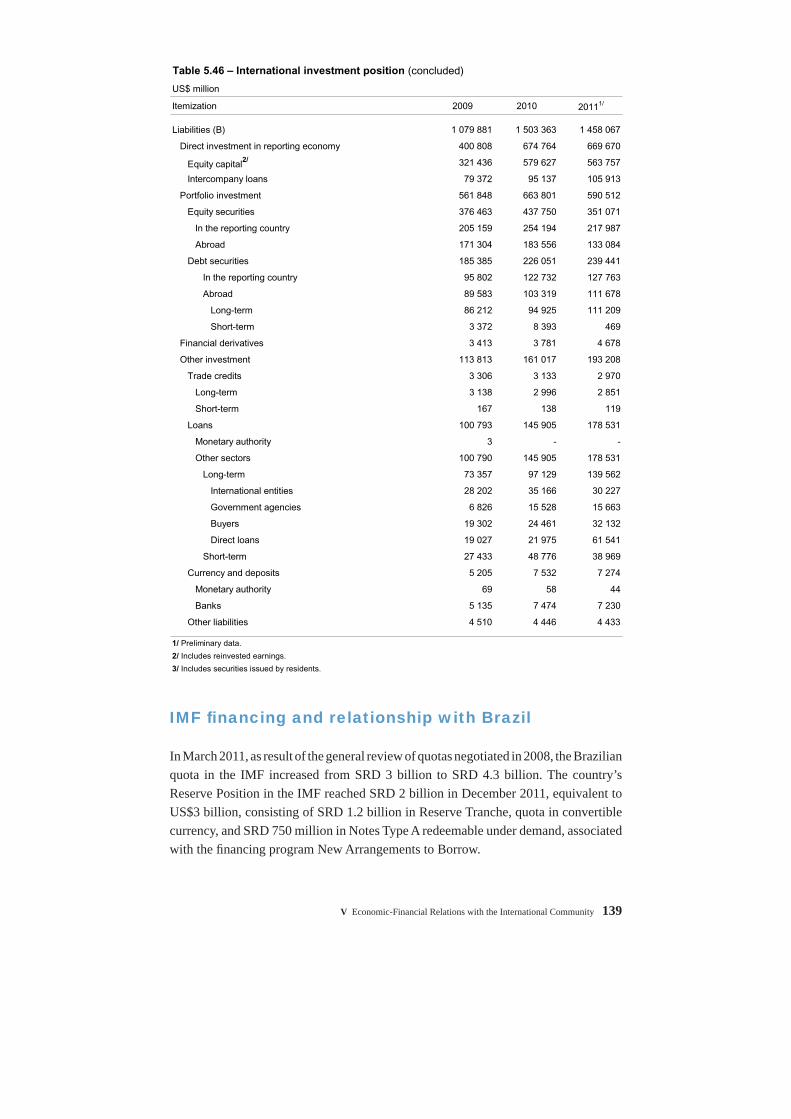
V Economic-Financial Relations with the International Community 139
IMF fi nancing and relationship with Brazil
In March 2011, as result of the general review of quotas negotiated in 2008, the Brazilian quota in the IMF increased from SRD 3 billion to SRD 4.3 billion. The country’s Reserve Position in the IMF reached SRD 2 billion in December 2011, equivalent to US$3 billion, consisting of SRD 1.2 billion in Reserve Tranche, quota in convertible currency, and SRD 750 million in Notes Type A redeemable under demand, associated with the fi nancing program New Arrangements to Borrow.
Table 5.46 – International investment position (concluded)
US$ million
Itemization 2009 2010 20111/
Liabilities (B) 1 079 881 1 503 363 1 458 067
Direct investment in reporting economy 400 808 674 764 669 670
Equity capital2/ 321 436 579 627 563 757
Intercompany loans 79 372 95 137 105 913
Portfolio investment 561 848 663 801 590 512
Equity securities 376 463 437 750 351 071
In the reporting country 205 159 254 194 217 987
Abroad 171 304 183 556 133 084
Debt securities 185 385 226 051 239 441
In the reporting country 95 802 122 732 127 763
Abroad 89 583 103 319 111 678
Long-term 86 212 94 925 111 209
Short-term 3 372 8 393 469
Financial derivatives 3 413 3 781 4 678
Other investment 113 813 161 017 193 208
Trade credits 3 306 3 133 2 970
Long-term 3 138 2 996 2 851
Short-term 167 138 119
Loans 100 793 145 905 178 531
Monetary authority 3 - -
Other sectors 100 790 145 905 178 531
Long-term 73 357 97 129 139 562
International entities 28 202 35 166 30 227
Government agencies 6 826 15 528 15 663
Buyers 19 302 24 461 32 132
Direct loans 19 027 21 975 61 541
Short-term 27 433 48 776 38 969
Currency and deposits 5 205 7 532 7 274
Monetary authority 69 58 44
Banks 5 135 7 474 7 230
Other liabilities 4 510 4 446 4 433
1/ Preliminary data.
2/ Includes reinvested earnings.
3/ Includes securities issued by residents.
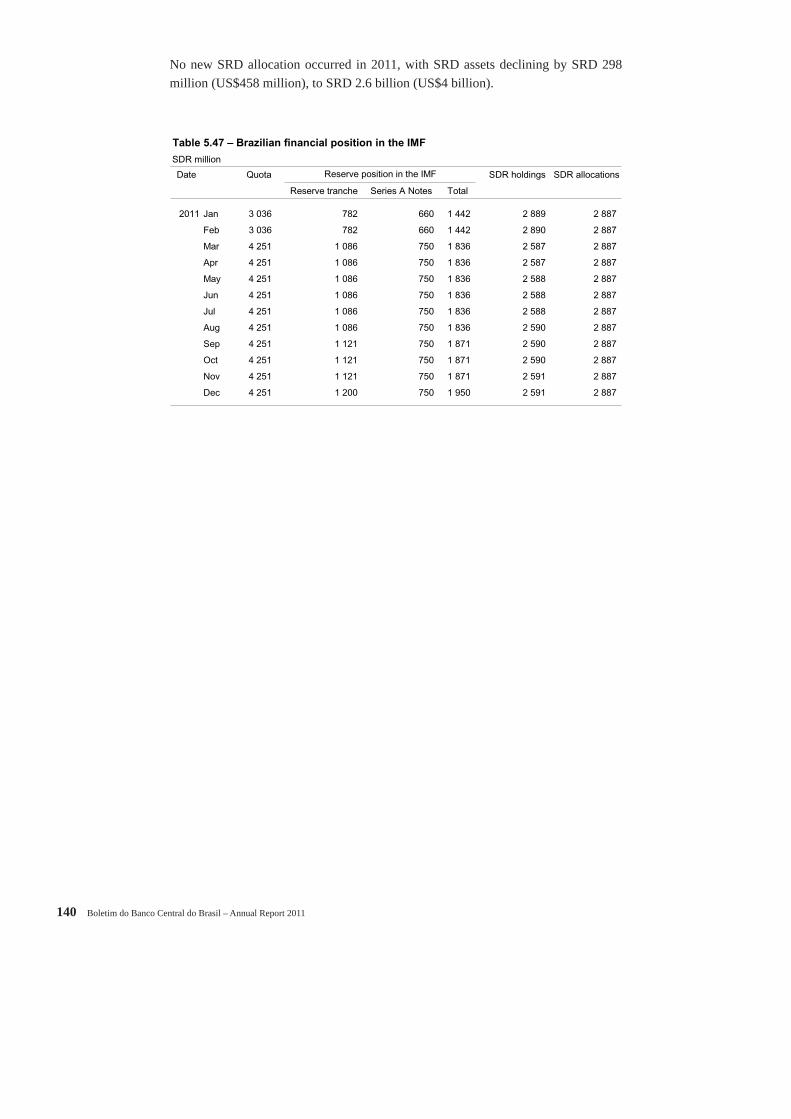
140 Boletim do Banco Central do Brasil – Annual Report 2011
Table 5.47 – Brazilian financial position in the IMF
SDR million
Date Quota SDR holdings SDR allocations
Reserve tranche Series A Notes Total
2011 Jan 3 036 782 660 1 442 2 889 2 887
Feb 3 036 782 660 1 442 2 890 2 887
Mar 4 251 1 086 750 1 836 2 587 2 887
Apr 4 251 1 086 750 1 836 2 587 2 887
May 4 251 1 086 750 1 836 2 588 2 887
Jun 4 251 1 086 750 1 836 2 588 2 887
Jul 4 251 1 086 750 1 836 2 588 2 887
Aug 4 251 1 086 750 1 836 2 590 2 887
Sep 4 251 1 121 750 1 871 2 590 2 887
Oct 4 251 1 121 750 1 871 2 590 2 887
Nov 4 251 1 121 750 1 871 2 591 2 887
Dec 4 251 1 200 750 1 950 2 591 2 887
Reserve position in the IMF
No new SRD allocation occurred in 2011, with SRD assets declining by SRD 298 million (US$458 million), to SRD 2.6 billion (US$4 billion).