Embed Size (px)
Citation preview

Economic Fact File on New Zealand Economy
1 Real GDP, 1955-2008 SNZ
2 Growth in real GDP per capita, 1975-2008 SNZ
3 Real average weekly earnings, 1989-2008 SNZ
4 Labour productivity growth, 1978-2008 SNZ
5 Unemployment rate, 1986-2008 SNZ
6 Inflation, 1975-2008 SNZ
7 Balance of payments, 1988-2008 SNZ
8 Annual saving and accumulated net worth
8A National Saving, 1972-2007 SNZ
8B Household net worth, 1979-2007 RBNZ
9 Government spending
9A - Core Crown expenses, 1994-2013 NZ Treasury
9B - Total government outlays, 1995-2009 OECD
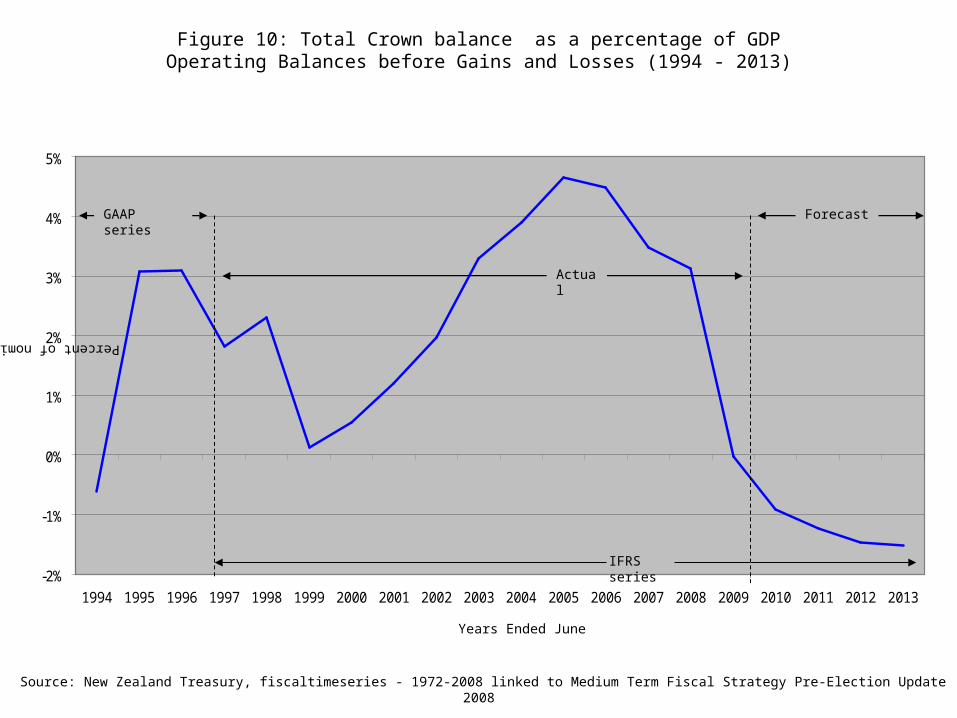
10 Crown operating balance, 1994-2013 NZ Treasury
11 Net migration from New Zealand to Australia, 1979-2008 SNZ
12 NZ competitiveness: relative unit labour costs, 1990-2007 OECD
13 External trade ratios to real GDP 1988-2008 SNZ
Table of Contents
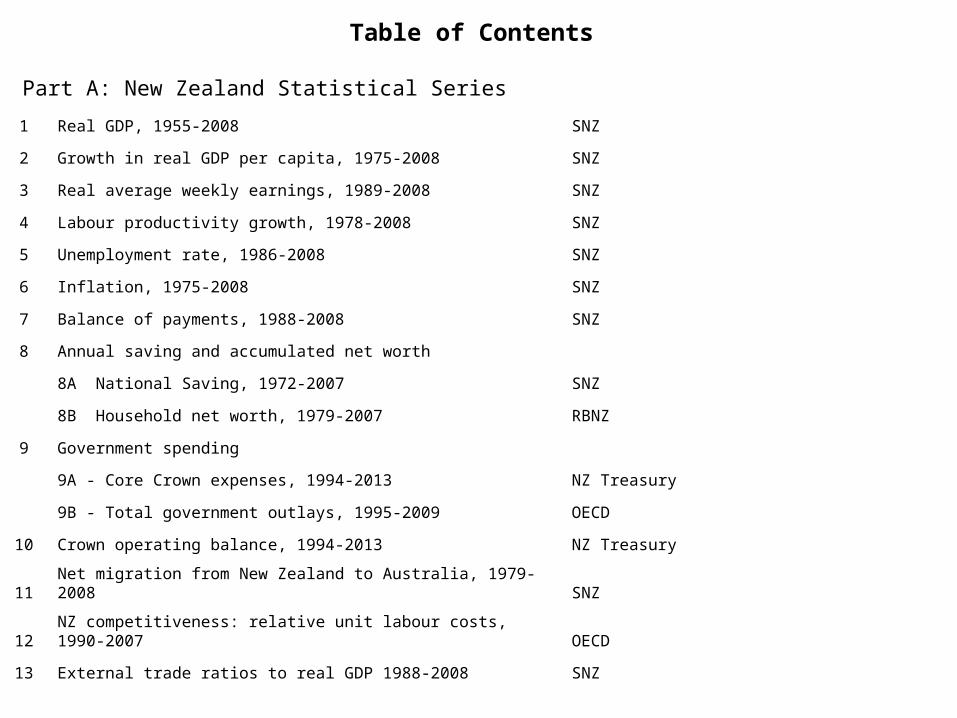
Part A: New Zealand Statistical Series
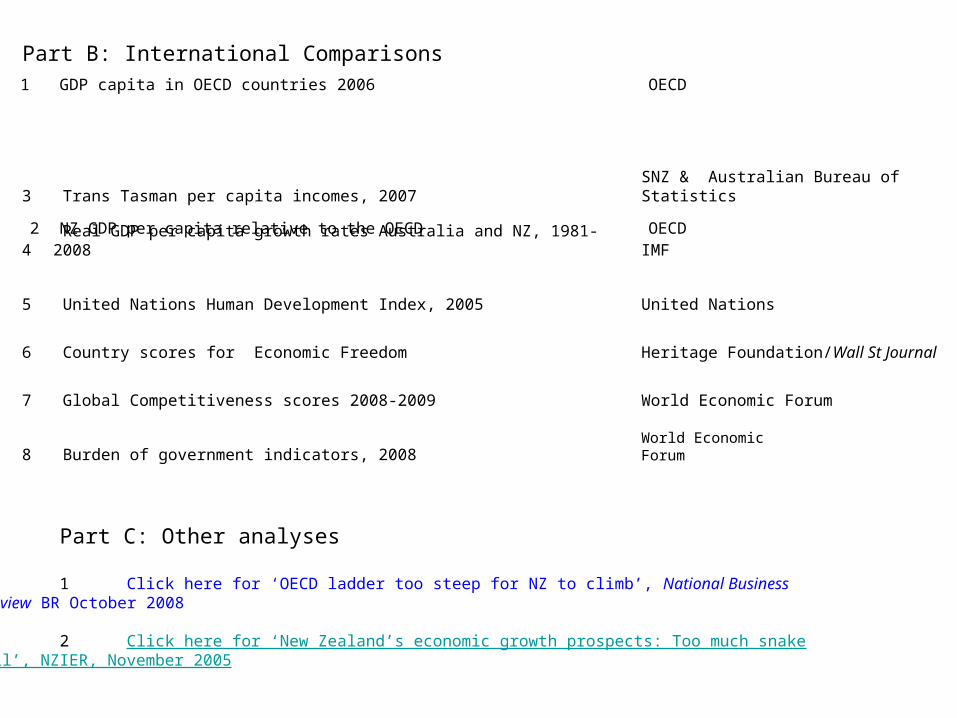
Part B: International Comparisons
1 GDP capita in OECD countries 2006 OECD
2 NZ GDP per capita relative to the OECD OECD
Part C: Other analyses
1 Click here for ‘OECD ladder too steep for NZ to climb’, National Business Review BR October 2008
2 Click here for ‘New Zealand’s economic growth prospects: Too much snake oil’, NZIER, November 2005
3 Trans Tasman per capita incomes, 2007 SNZ & Australian Bureau of Statistics
4 Real GDP per capita growth rates Australia and NZ, 1981-2008 IMF
5 United Nations Human Development Index, 2005 United Nations
6 Country scores for Economic Freedom Heritage Foundation/Wall St Journal
7 Global Competitiveness scores 2008-2009 World Economic Forum
8 Burden of government indicators, 2008 World Economic Forum

(a) New Zealand in the World
3 Click here for the United Nations Human Development Index 2007-08
4 Click here for the IMF World Economic Outlook October 2008
5 Click here for the World Bank World Development Indicators 2008
6 Click here for the World Bank Doing Business 2009
7 Click here for the Economist Intelligence Unit Quality of Life Index
8 Click here for Global Competitiveness explained by Wikipedia
9 Click here for the World Economic Forum Global Competitiveness Report 2008-09
10 Click here for Economic Freedom explained by Wikipedia
11 Click here for the Heritage-Wall St Journal Index of Economic Freedom 2008
12 Click here for the Economic Freedom of the World 2008 - Fraser Institute
(b) New Zealand in the OECD
13 Click here for OECD in Figures 2007
14 Click here for OECD Factbook 2008
15 Click here for OECD Statistical Annex Economic Outlook June 2008
16 Click here for OECD Compendium of Productivity Measures
17 Click here for Statistics New Zealand New Zealand in the OECD
(c) Other New Zealand sources
18 Click here for Statistics New Zealand datasets
19 Click here for the Treasury-MED Economic Development Indicators 2007
20 Click here for the Pre-Election Economic and Fiscal Update 2008
21 Click here for Treasury's Fiscal Strategy Model Forecasts for the Pre-Election Economic and Fiscal Update 2008
22 Click here for the table of contents for the Reserve Bank's Economic Indicators
23 Click here for 9 key graphs on the Reserve Bank's website
Part D: Links

Part A: New Zealand Statistical Series

Source: Statistics New Zealand, series SNBA.S2AZAT linked to SNCA.S1RB01 at 1988
$0
$20
$40
$60
$80
$100
$120
$140
$160
1955 1960 1965 1970 1975 1980 1985 1990 1995 2000 2005
Years Ended March
Co
nst
an
t 1
99
5-9
6 D
olla
rs (
$ b
n)
1968 recession,devaluation, fall in wool pricesnil general wage order
Stagflation after 1973-74 oil price shock
1991 Budget, ECA
Long recession after October 1987 sharemarket crash and collapseof Lange-Douglas government
'Asian crisis' slowdown
Growth during early Lange-Douglas reforms
Treasury pre-election forecasts for 2009
Actuals
Current recession
Figure 1: Real Gross Domestic Product (GDP)
Annual percentage change 3 year mov avg (annual percentage change)
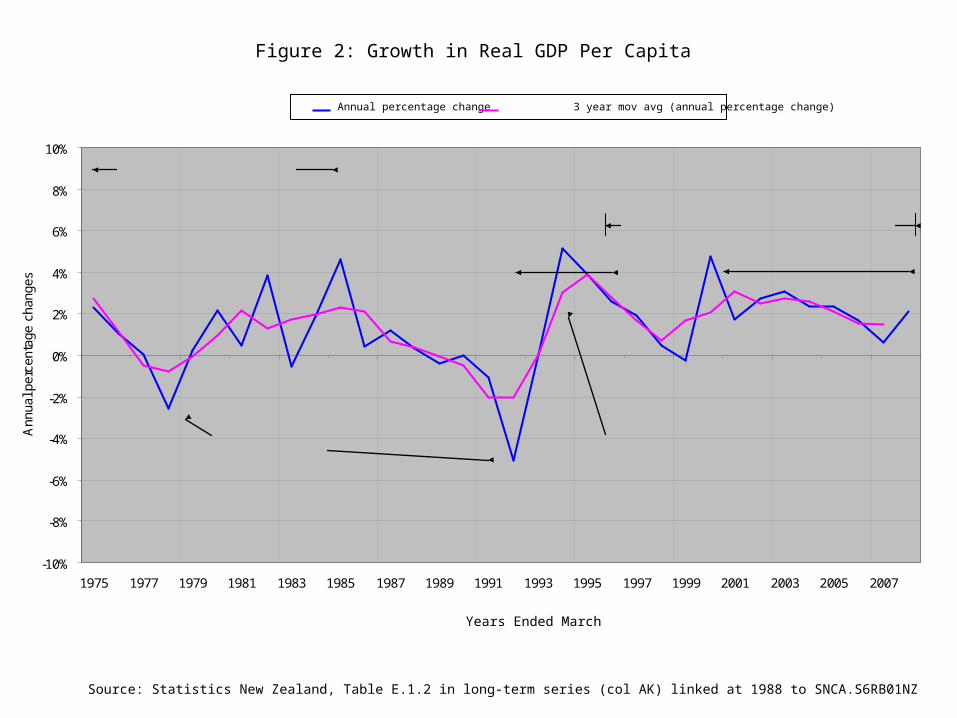
Source: Statistics New Zealand, Table E.1.2 in long-term series (col AK) linked at 1988 to SNCA.S6RB01NZ
Figure 2: Growth in Real GDP Per Capita
-10%
-8%
-6%
-4%
-2%
0%
2%
4%
6%
8%
10%
1975 1977 1979 1981 1983 1985 1987 1989 1991 1993 1995 1997 1999 2001 2003 2005 2007
Years Ended March
Ann
ual p
erce
ntag
e ch
ange
s
Deep recessions
Persistent deficits, increases in debt, inflation and rising unemployment
Shallow recession
Slowing growth trend, higher inflation
MMP & resumption of big spending increasesStrong growthlower inflation,fiscal restraint
Centered 3 year moving average
Years Ended March
Source: Statistics New Zealand, EESQ.SBAZ9Z & CPIQ.SE9A
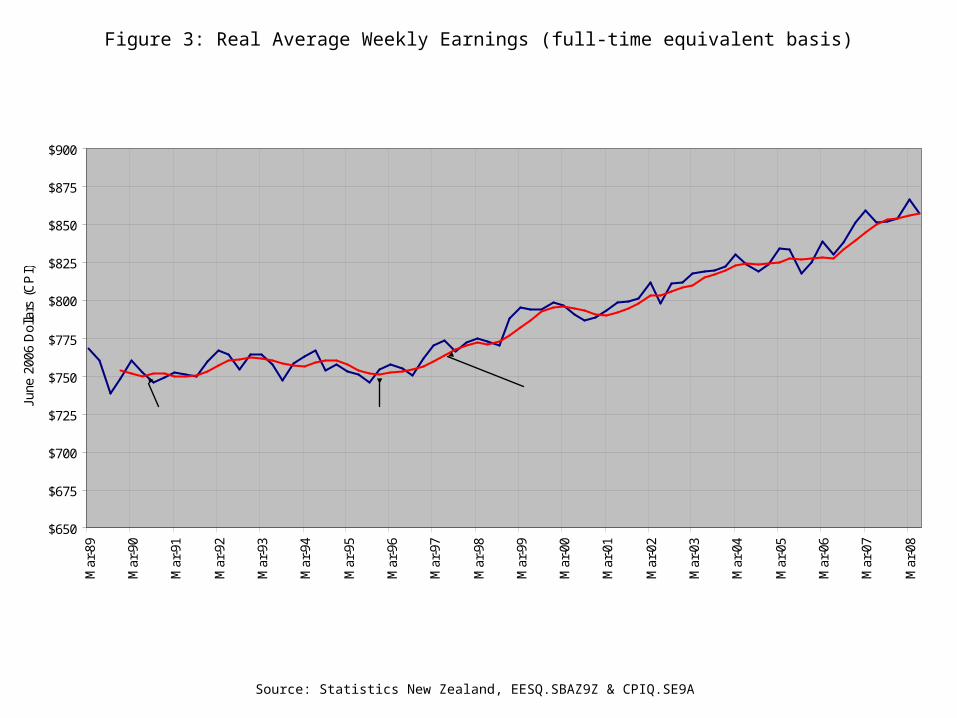
Figure 3: Real Average Weekly Earnings (full-time equivalent basis)
$650
$675
$700
$725
$750
$775
$800
$825
$850
$875
$900
Mar
-89
Mar
-90
Mar
-91
Mar
-92
Mar
-93
Mar
-94
Mar
-95
Mar
-96
Mar
-97
Mar
-98
Mar
-99
Mar
-00
Mar
-01
Mar
-02
Mar
-03
Mar
-04
Mar
-05
Mar
-06
Mar
-07
Mar
-08
June
200
6 D
olla
rs (
CP
I)
Little overall real wage growth as strongemployment growth reduces the rate of unemployment
4-quarter moving average
A

Figure 4: Labour Productivity Growth
Source: Statistics New Zealand, measured sector, S1LMSI
Years Ended March
1.7%1.4%
2.9%2.5%
2.8%
1.1%
-2%
-1%
0%
1%
2%
3%
4%
5%
6%
7%
1978 1979 1980 1981 1982 1983 1984 1985 1986 1987 1988 1989 1990 1991 1992 1993 1994 1995 1996 1997 1998 1999 2000 2001 2002 2003 2004 2005 2006 2007Ann
ual p
erce
ntag
e ch
ange
s (b
lue
line)
and
cyc
le a
vera
ge g
row
th ra
te
1978-82 1982-85 1985-90 1990-97 1997-2000 2000--07 1978-2007 Annual changes
Horizontal lines show the average growth rates during each cycle, as published by SNZ
This growth cycle associated with labour shedding
These two growth cycles associated with positive employment growth
Slowest growth cycle in 3 decadesbut highest employment growth
Weak growth cycles, extensive economic controls
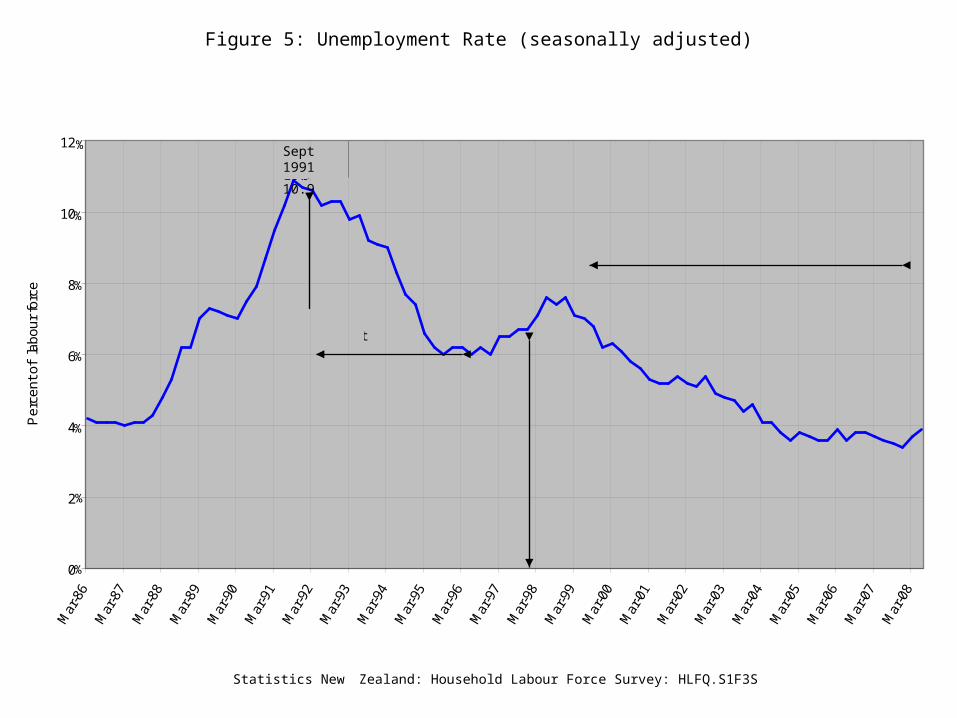
Figure 5: Unemployment Rate (seasonally adjusted)
10.9
0
2
4
6
8
10
12
Statistics New Zealand: Household Labour Force Survey: HLFQ.S1F3S
Pe
rce
nt o
f la
bo
ur
forc
e
Sept 1991
Decline resumes
Employment Contracts Act
Steep fall to 1996
Asian crisis
Statistics New Zealand: Household Labour Force Survey: HLFQ.S1F3S
Figure 5: Unemployment Rate (seasonally adjusted)
Sept 1991
10.9
%
%
%
%
%
%
%
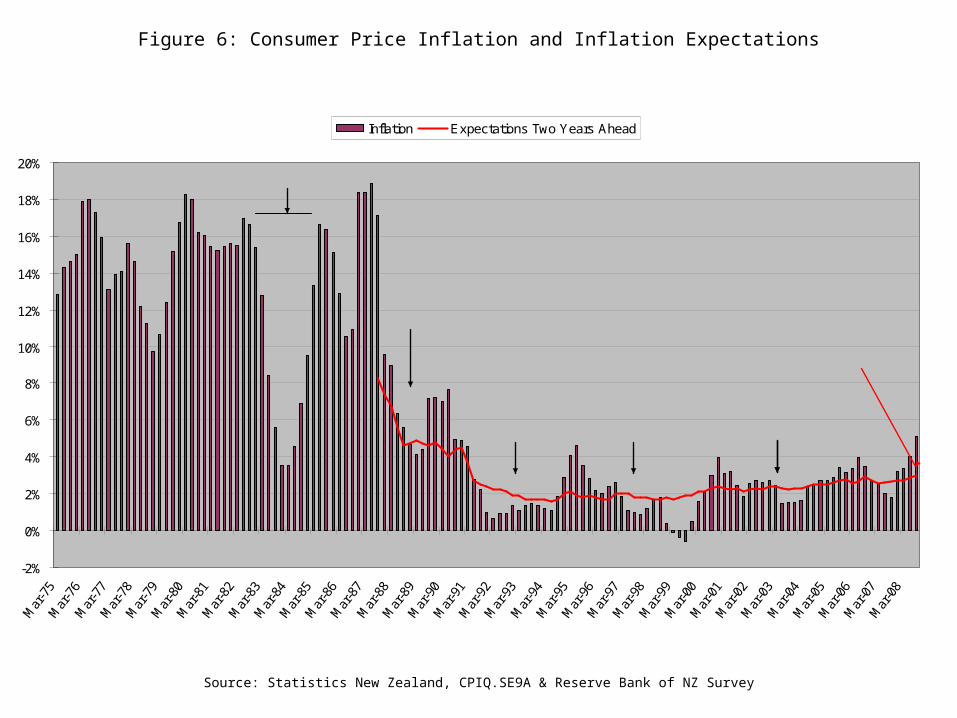
Figure 6: Consumer Price Inflation and Inflation Expectations
Source: Statistics New Zealand, CPIQ.SE9A & Reserve Bank of NZ Survey
-2%
0%
2%
4%
6%
8%
10%
12%
14%
16%
18%
20%
Inflation Expectations Two Years Ahead
Wage & Price Freeze
New price stability goal in Reserve Bank Act 1989
PTA eased, higher inflation0-2% pa inflation largely achieved
Inflation expectations nowhighest since 1991

Source: Statistics New Zealand: BoP BOPA.S5AC3, GDP (E) SNCA.S1NB15
-10%
-9%
-8%
-7%
-6%
-5%
-4%
-3%
-2%
-1%
0%
1988 1989 1990 1991 1992 1993 1994 1995 1996 1997 1998 1999 2000 2001 2002 2003 2004 2005 2006 2007 2008
Pe
rce
nt
of
no
min
al G
DP
Years Ended March
Figure 7: Balance of Payments: Current Account Balance as a Percent of GDP
Years Ended March
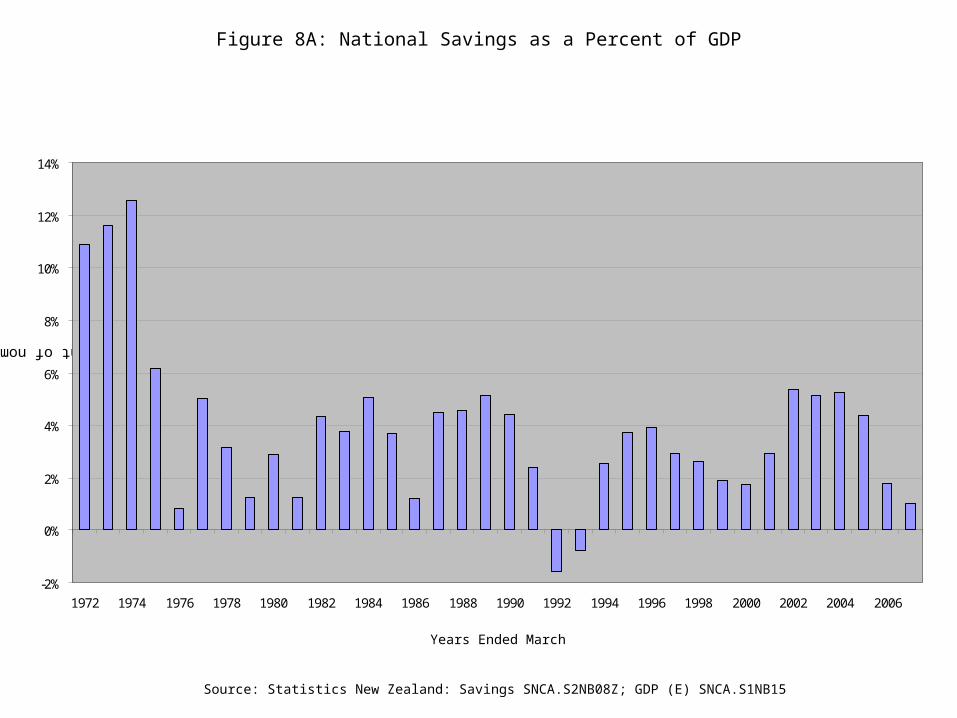
Figure 8A: National Savings as a Percent of GDP
Source: Statistics New Zealand: Savings SNCA.S2NB08Z; GDP (E) SNCA.S1NB15
Percent of nominal GDP
Years Ended March
-2%
0%
2%
4%
6%
8%
10%
12%
14%
1972 1974 1976 1978 1980 1982 1984 1986 1988 1990 1992 1994 1996 1998 2000 2002 2004 2006

0%
100%
200%
300%
400%
500%
600%
700%
Pe
rce
nt
of
ne
t d
isp
osa
ble
inco
me
Source: Reserve Bank of New Zealand, table 2 in household financial assets and liabilities: annual series 1978 to 2007. December values for net worth.
Figure 8B: Household Net Worth as a Percent of Net Disposable Income
Source: Reserve Bank of New Zealand, table 2 in household financial assets and liabilities: annual series 1978 to 2007
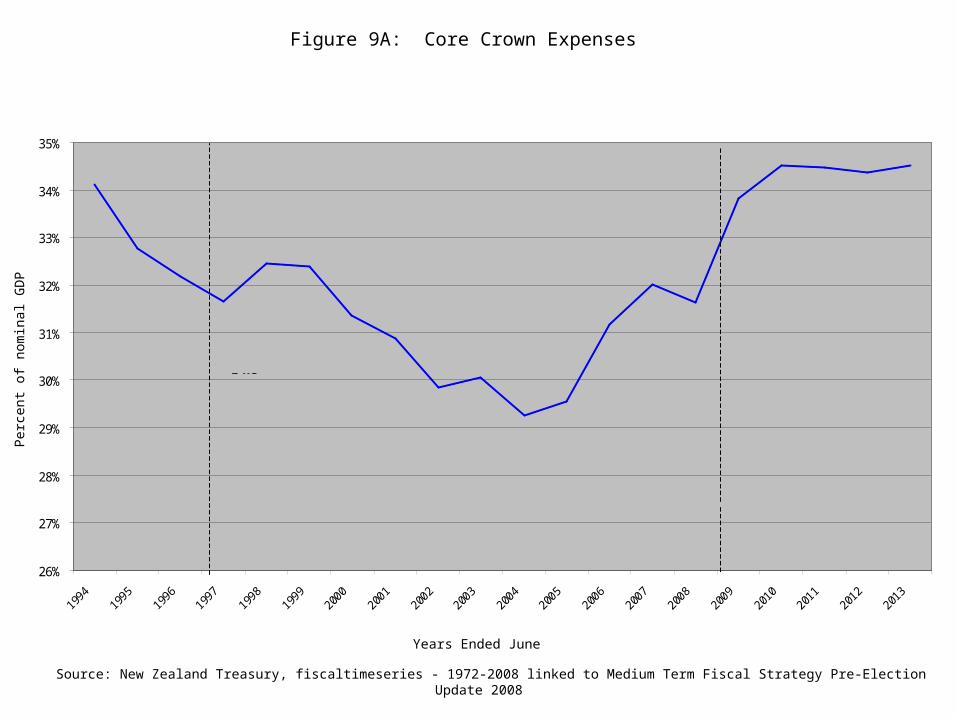
Source: New Zealand Treasury, fiscaltimeseries - 1972-2008 linked to Medium Term Fiscal Strategy Pre-Election Update 2008
ForecastActuals
IFRS
Figure 9A: Core Crown Expenses
GAAP
Years Ended June
Per
cent
of n
omin
al G
DP
26%
27%
28%
29%
30%
31%
32%
33%
34%
35%
IFRSGAAP
Actuals Forecast
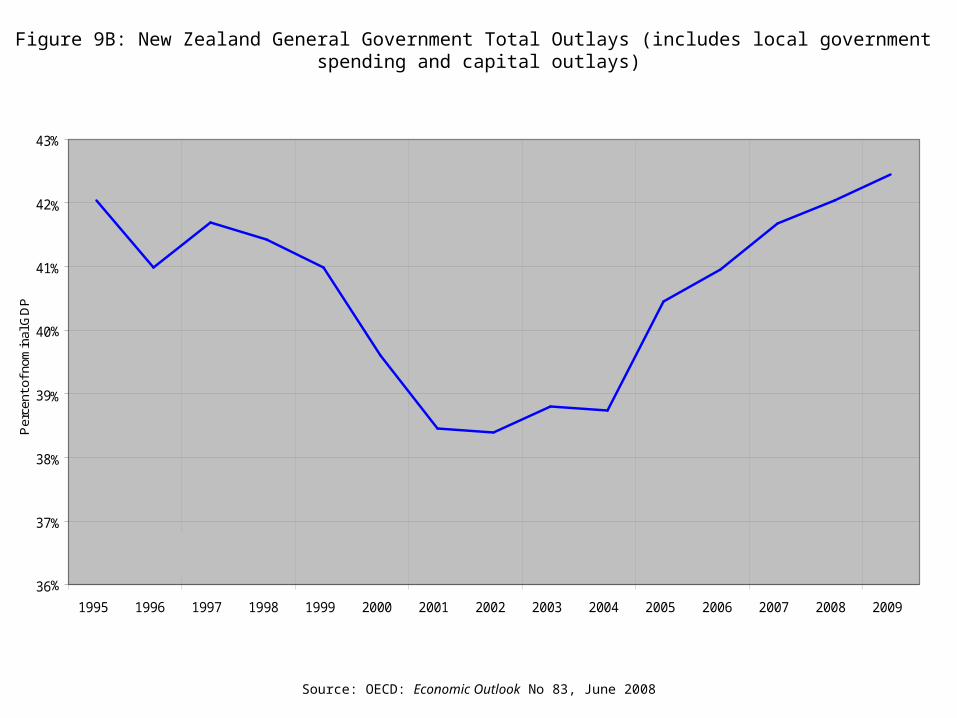
Figure 9B: New Zealand General Government Total Outlays (includes local government spending and capital outlays)
36
37
38
39
40
41
42
43
1995 1996 1997 1998 1999 2000 2001 2002 2003 2004 2005 2006 2007 2008 2009
Years
Per
cent
of n
omin
al G
DP
Source: OECD: Economic Outlook 83, June 2008
%%
%
%
%
%
%
%
%
Source: OECD: Economic Outlook No 83, June 2008
-2%
-1%
0%
1%
2%
3%
4%
5%
1994 1995 1996 1997 1998 1999 2000 2001 2002 2003 2004 2005 2006 2007 2008 2009 2010 2011 2012 2013
Years ended June
Per
cent
of G
DP
Forecast
Actual
GAAP series
Source: New Zealand Treasury, fiscaltimeseries - 1972-2008 linked to Medium Term Fiscal Strategy Pre-Election Update 2008
Figure 10: Total Crown balance as a percentage of GDPOperating Balances before Gains and Losses (1994 - 2013)
IFRS series
Percent of nominal GDP
Years Ended June
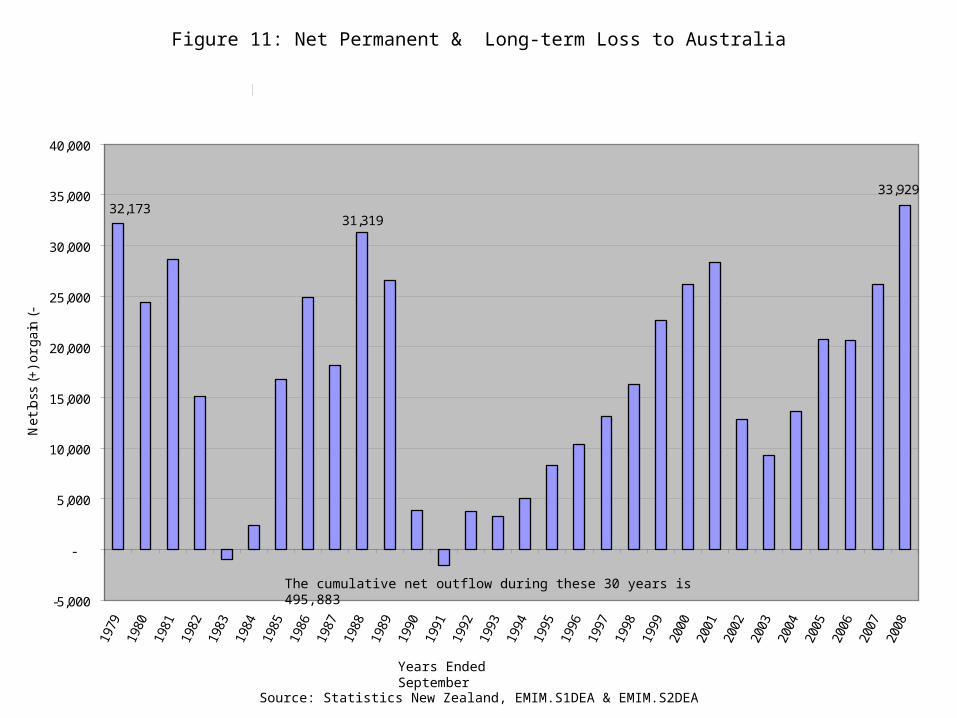
Source: Statistics New Zealand, EMIM.S1DEA & EMIM.S2DEA
Figure 11: Net Permanent & Long-term Loss to Australia
Figure 11: Net Permanent & Long-term Loss to Australia
32,17331,319
33,929
-5,000
-
5,000
10,000
15,000
20,000
25,000
30,000
35,000
40,000
Years Ended September
Ne
t lo
ss (
+)
or
ga
in (
-)
The cumulative net outflow during these 30 years is 495,883
Years Ended September
The cumulative net outflow during these 30 years is 495,883
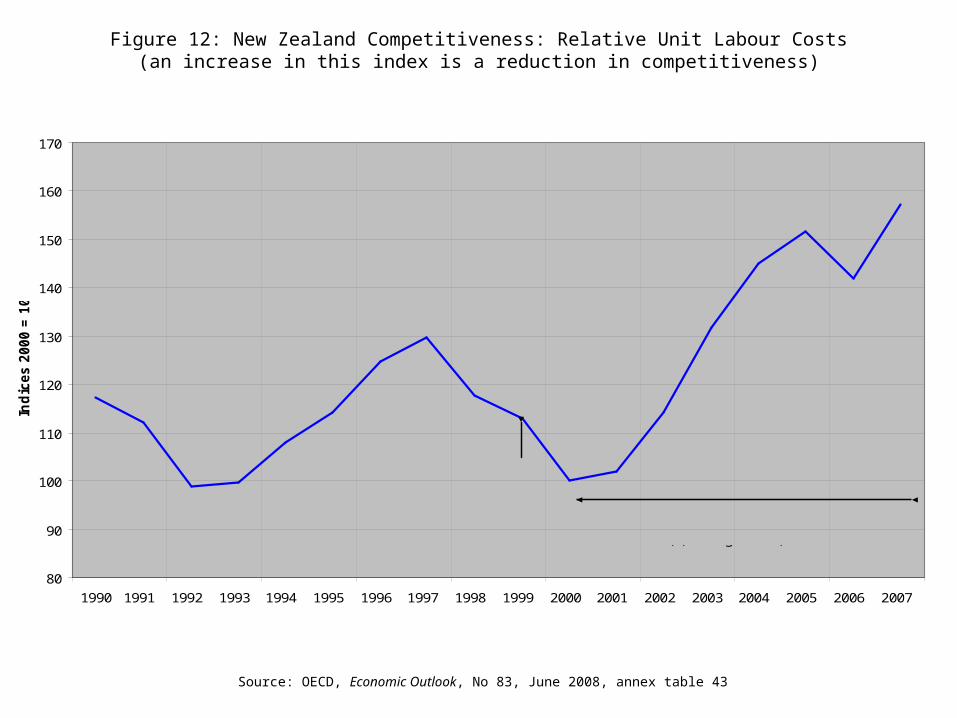
Figure 12: New Zealand Competitiveness: Relative Unit Labour Costs(an increase in this index is a reduction in competitiveness)
Source: OECD, Economic Outlook, No 83, June 2008, annex table 43
80
90
100
110
120
130
140
150
160
170
1990 1991 1992 1993 1994 1995 1996 1997 1998 1999 2000 2001 2002 2003 2004 2005 2006 2007
Years
Ind
ices 2
000 =
100
NZ 13th in world for Global Competitiveness
Loss of competiveness (NZ 24th in world for 2008 - 2009) (See Fig Part B)
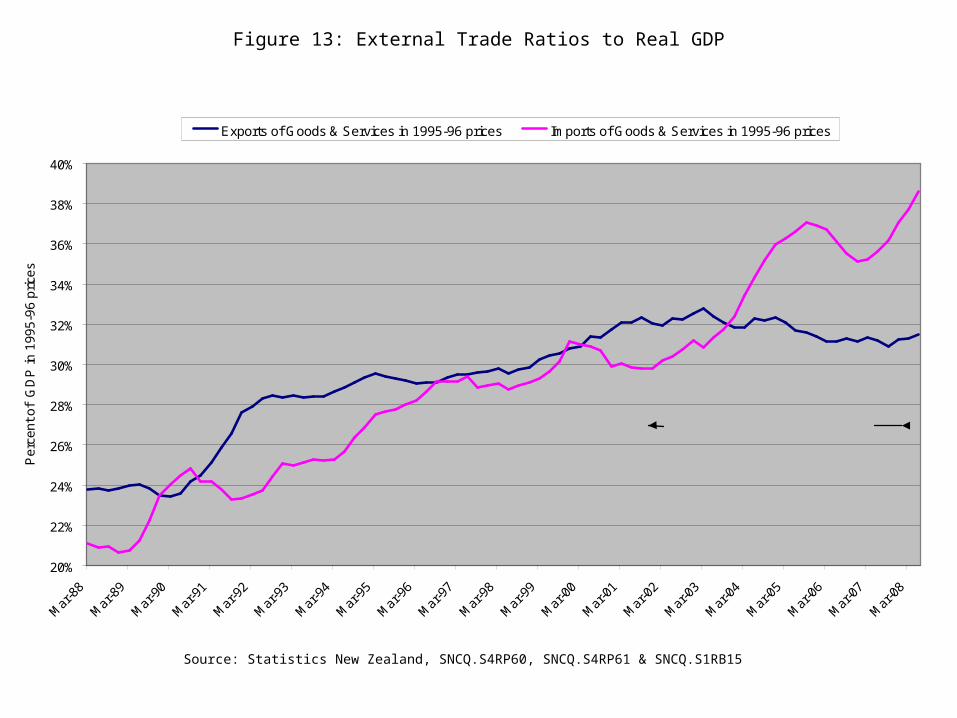
Figure 13: External Trade Ratios to Real GDP
Source: Statistics New Zealand, SNCQ.S4RP60, SNCQ.S4RP61 & SNCQ.S1RB15
20%
22%
24%
26%
28%
30%
32%
34%
36%
38%
40%
Mar
-88
Mar
-89
Mar
-90
Mar
-91
Mar
-92
Mar
-93
Mar
-94
Mar
-95
Mar
-96
Mar
-97
Mar
-98
Mar
-99
Mar
-00
Mar
-01
Mar
-02
Mar
-03
Mar
-04
Mar
-05
Mar
-06
Mar
-07
Mar
-08
Pe
rce
nt
of
GD
P in
19
95
-96
pri
ces
Exports of Goods & Services in 1995-96 prices Imports of Goods & Services in 1995-96 prices
Loss of competitiveness, rise in imports relative to exports
Part B: International Comparisons

$0
$10,000
$20,000
$30,000
$40,000
$50,000
$60,000
$70,000
$80,000
$90,000
US
$ P
urch
asin
g P
ower
Par
ity Bottom half of OECD
34,700 (12th)
26,300 (22nd)
Australia
New Zealand
OECD Average
Figure 1: GDP Per Capita in OECD Countries 2006
Source: OECD in Figures 2007
70%
75%
80%
85%
90%
95%
1990 1991 1992 1993 1994 1995 1996 1997 1998 1999 2000 2001 2002 2003 2004 2005
NZ
as
a P
erc
en
t o
f th
e U
nw
eig
hte
d O
EC
D A
vera
ge
19
2121
20
19
19
2121
21 21
21
21 22 22
22
22
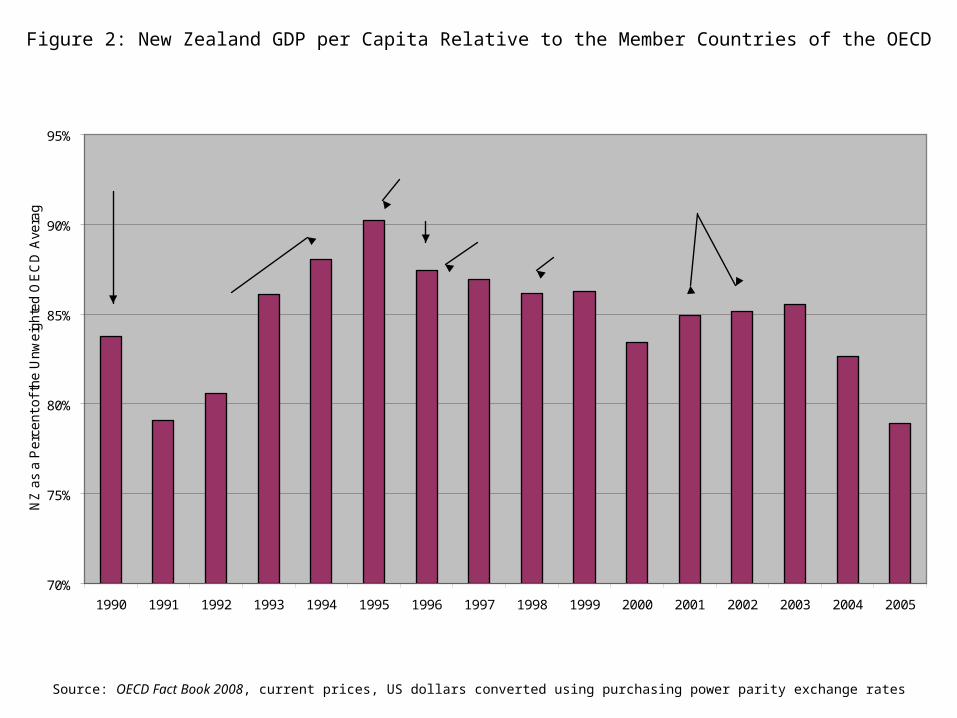
Greece moves ahead of NZ
Ireland &Spainmove ahead of NZ
NZ rank in OECD
Strong growth after1991 Budget
MMP in 1996Asian crisis
Figure 2: New Zealand GDP per Capita Relative to the Member Countries of the OECD
Source: OECD Fact Book 2008, current prices, US dollars converted using purchasing power parity exchange rates
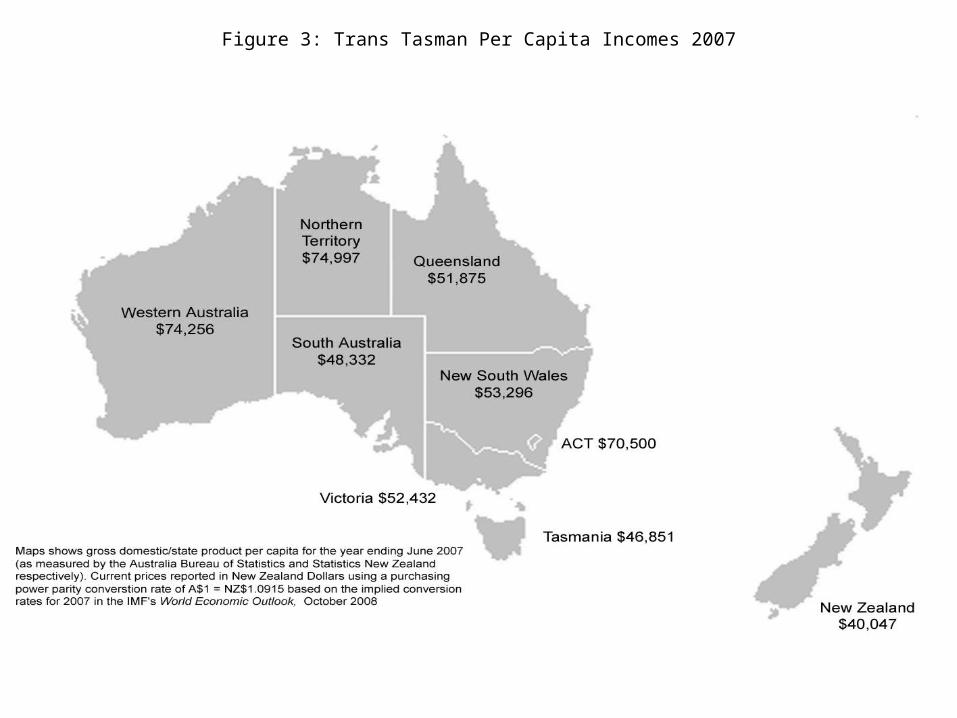
Figure 3: Trans Tasman Per Capita Incomes 2007
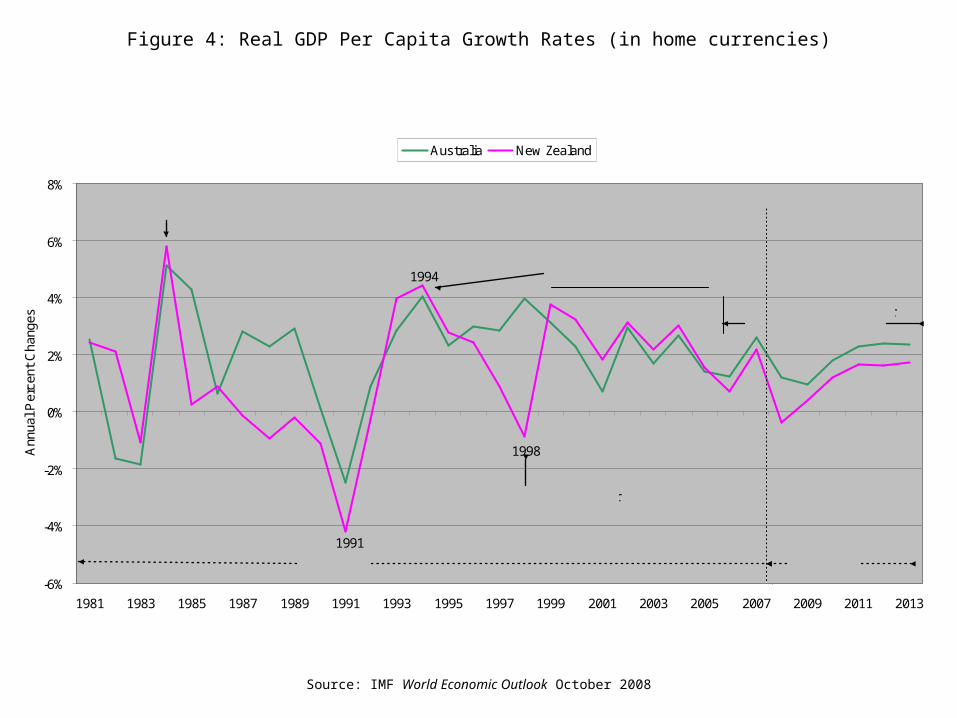
Figure 4: Real GDP Per Capita Growth Rates (in home currencies)
Source: IMF World Economic Outlook October 2008
1994
1998
1991
-6%
-4%
-2%
0%
2%
4%
6%
8%
1981 1983 1985 1987 1989 1991 1993 1995 1997 1999 2001 2003 2005 2007 2009 2011 2013
Ann
ual P
erce
nt C
hang
es
Australia New Zealand
ForecastsActuals
Australian outlook better2006 - 2013 (8 years)
Debt-fueled growth in NZ
Deeper recession in NZ
Asian crisis hits NZ harder
NZ does better to 2005
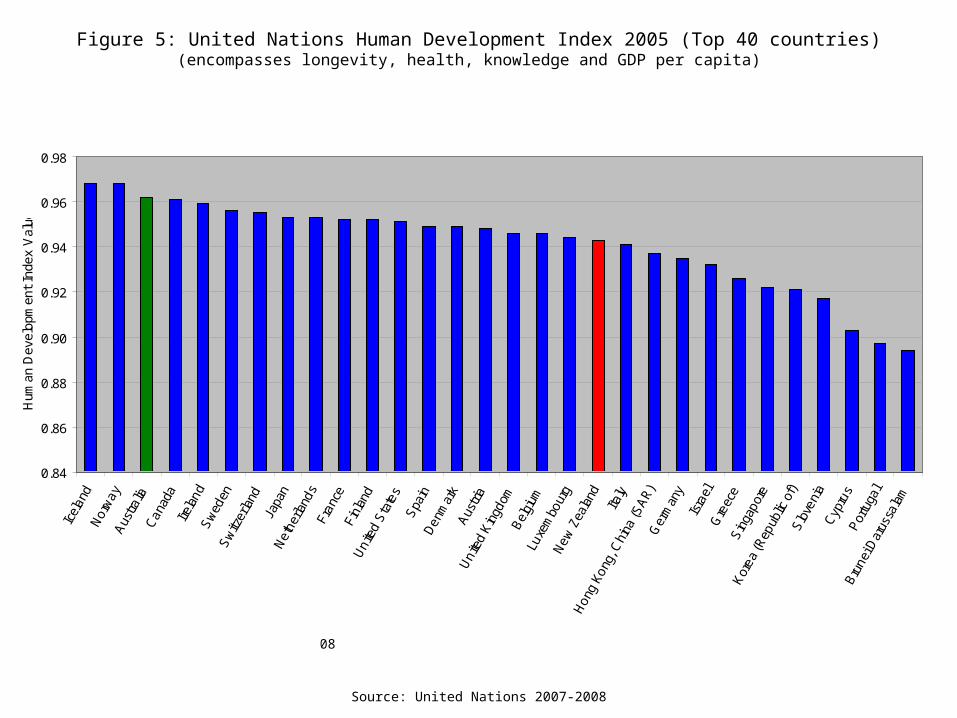
Figure 5: United Nations Human Development Index 2005 (Top 40 countries)(encompasses longevity, health, knowledge and GDP per capita)
Source: United Nations 2007-08
Source: United Nations 2007-2008
0.84
0.86
0.88
0.90
0.92
0.94
0.96
0.98
Hum
an D
evel
opm
ent
Inde
x V
alue
NZ 19th
Australia 3rd
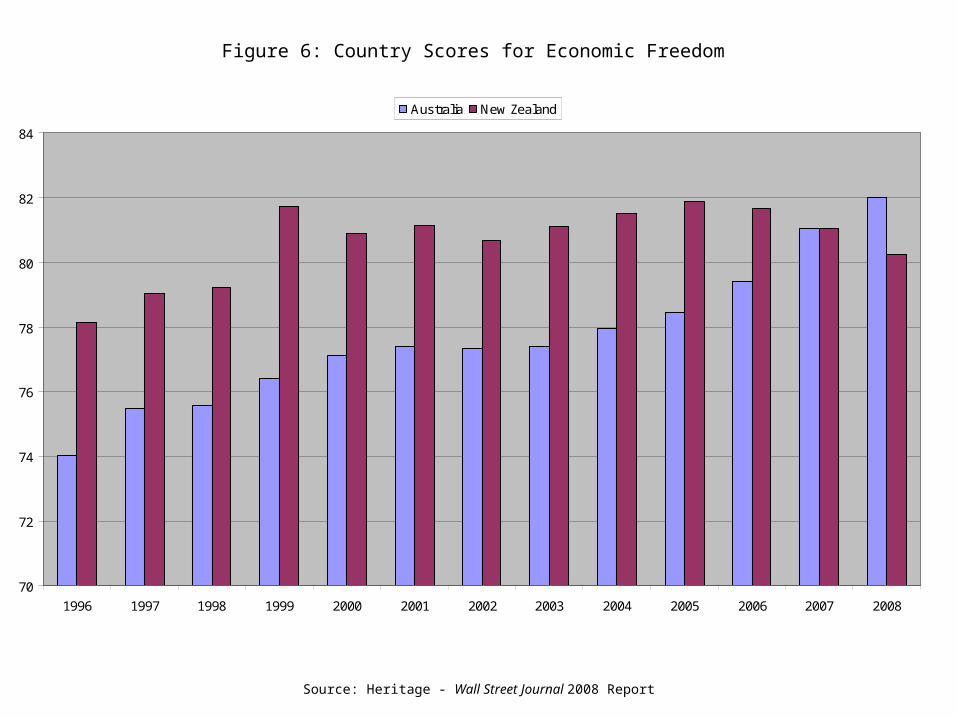
Figure 6: Country Scores for Economic Freedom
Source: Heritage - Wall Street Journal 2008 Report
70
72
74
76
78
80
82
84
1996 1997 1998 1999 2000 2001 2002 2003 2004 2005 2006 2007 2008
Australia New Zealand
Australia's ranking rose from 10th in the world to 4th during this period, while New Zealand's fell from 3rd to 6th.
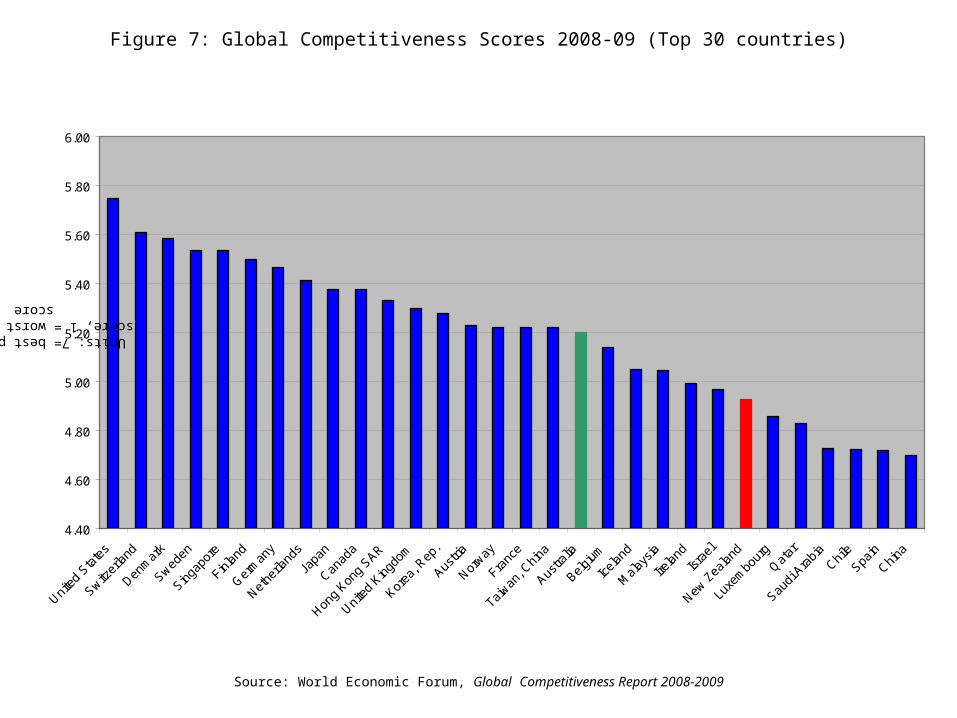
4.40
4.60
4.80
5.00
5.20
5.40
5.60
5.80
6.00
Source: World Economic Forum, Global Competitiveness Report 2008 -09
Un
its
1st
18th
24th
Figure 7: Global Competitiveness Scores 2008-09 (Top 30 countries)
Source: World Economic Forum, Global Competitiveness Report 2008-2009
Units: 7= best possible score, 1 = worst possible score
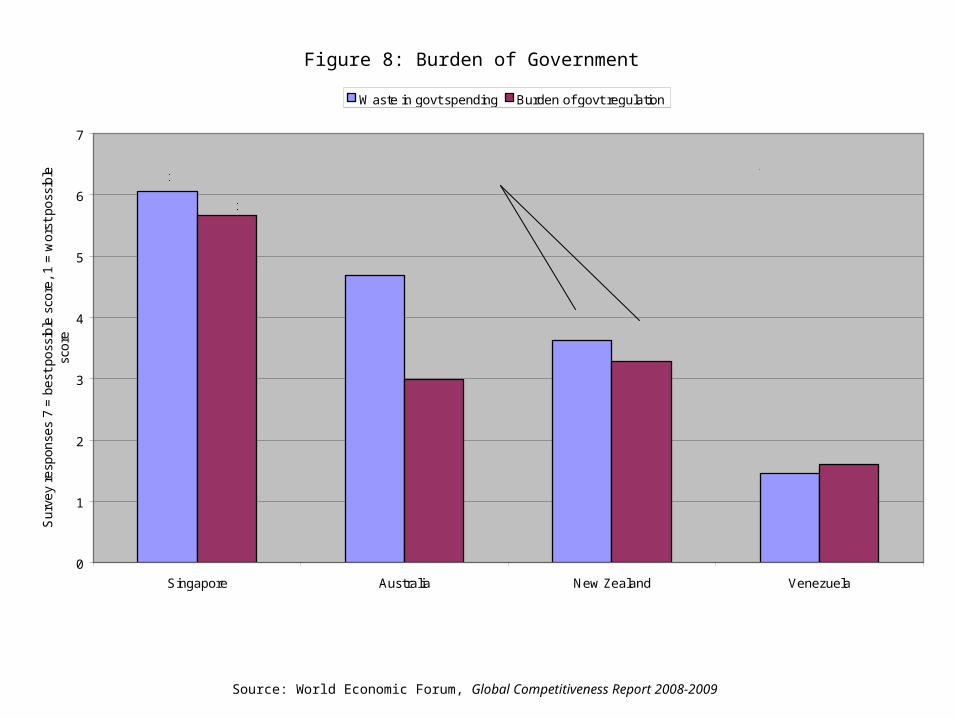
Figure 8: Burden of Government
0
1
2
3
4
5
6
7
Singapore Australia New Zealand Venezuela
Source: World Economic Forum, Global Competitiveness Report 2008-09
Su
rve
y re
spo
nse
s 7
= b
est
po
ssib
le s
core
, 1
= w
ors
t p
oss
ible
sc
ore
Waste in govt spending Burden of govt regulation
53rd
16th
1st
65th85th
World rankings (out of 134 countries) are above each bar
134th134th
(Top-ranked country in both respects)
1st
(Bottom in both respects)
Figure 8: Burden of Government
Source: World Economic Forum, Global Competitiveness Report 2008-2009