Embed Size (px)
Citation preview

FINAL REPORT JANUARY 2017
Economic evaluation of the Automatic Milking System component of the Future Dairy Program
Report prepared for Dairy Australia

Marsden Jacob Associates Financial & Economic Consultants ABN 66 663 324 657 ACN 072 233 204 Internet: http://www.marsdenjacob.com.au E-mail: [email protected] Melbourne office: Level 4, 683 Burke Road, Camberwell Victoria 3124 AUSTRALIA Telephone: 03 9882 1600 Perth office: Level 1, 220 St Georges Terrace, Perth Western Australia, 6000 AUSTRALIA Telephone: 08 9324 1785 Facsimile: 08 9322 7936 Sydney office: Rod Carr 0418 765 393 Ken Harper 0412 318 324 Author: Gavan Dwyer [email protected] Matthew Clarke [email protected]
This report has been prepared in accordance with the scope of services described in the contract or agreement between Marsden Jacob Associates Pty Ltd ACN 072 233 204 (MJA) and the Client. Any findings, conclusions or recommendations only apply to the aforementioned circumstances and no greater reliance should be assumed or drawn by the Client. Furthermore, the report has been prepared solely for use by the Client and Marsden Jacob Associates accepts no responsibility for its use by other parties.
Copyright © Marsden Jacob Associates Pty Ltd 2018
MARSDEN JACOB ASSOCIATES
TABLE OF CONTENTS
Page
Key Messages ........................................................................................................................ i
Executive summary ............................................................................................................... ii
1. Background ................................................................................................................... 4
1.1 Automatic milking systems and Future Dairy ............................................................................... 4
1.2 Terms of reference ...................................................................................................................... 5
1.3 Approach of this report ................................................................................................................ 6
1.4 Report structure .......................................................................................................................... 6
2. Phases and outcomes of program delivery ...................................................................... 8
2.1 AMS Investment phases .............................................................................................................. 8
2.2 Timeline of adoption and implementation ................................................................................. 10
2.3 Economics of AMS adoption ...................................................................................................... 12
2.4 Further understanding farmer perspectives ................................................................................ 15
3. Defining the counterfactual .......................................................................................... 16
4. Estimating AMS program benefits ................................................................................ 17
4.1 Classes of program benefit ......................................................................................................... 17
5. Estimating the costs of the AMS program ..................................................................... 25
5.1 Total AMS program expenditures .............................................................................................. 25
5.2 Source of AMS program expenditures ....................................................................................... 26
5.3 Composition of AMS program expenditures .............................................................................. 26
5.4 Future expenditures................................................................................................................... 28
6. Net benefits ................................................................................................................ 29
6.1 Base case net benefits from AMS program investment .............................................................. 29
6.2 Ex-ante net benefits .................................................................................................................. 30
6.3 Other observations ..................................................................................................................... 31
7. Sensitivity analysis ...................................................................................................... 32
8. Cash flows ................................................................................................................... 34
9. References .................................................................................................................... 1
Appendix 1: Online survey ..................................................................................................... 2
Survey questionnaire ............................................................................................................................... 2
Results of survey ..................................................................................................................................... 7
MARSDEN JACOB ASSOCIATES
LIST OF TABLES Page
Table 1: Transition experience of Australian AMS ................................................................................................. 12 Table 2: Internal rates of return (per cent) of farm business at different herd scale and milking systems ................ 13 Table 3: Future Dairy expenditure $million 2016/17 dollars (AMS program expenditures only) ............................... 25 Table 4: Composition of Future Dairy expenditure $million 2016/17 dollars (AMS program expenditures only) ...... 27 Table 5: Net Benefits summary over different time horizons ................................................................................. 29 Table 6: Net Benefits summary results ................................................................................................................. 30 Table 7: Net Benefits summary results .................................................................................................................. 30 Table 8: Sensitivity of results to cost and price assumptions.................................................................................. 33 Table 9: Whole of life base case cash flows for the Future Dairy program .............................................................. 34
LIST OF FIGURES Page
Figure 1: Historical and estimated future AMS adoption ....................................................................................... 18 Figure 2: Projected market penetration of AMS (Total AMS dairy farms as % of all Australian dairy farms) ........... 18 Figure 3: Survey question 9: Did you access or use the FutureDairy AMS management guidelines? ....................... 19 Figure 4: Survey question 10: Did FutureDairy staff assist you at anytime with problem solving changes to your AMS farm system? ............................................................................................................................................... 20 Figure 6: Survey question 18. If you responded YES to the previous question, what would you estimate was the length of the time reduction? ............................................................................................................................... 20 Figure 7: Estimated number of farmers that will avoid failure because of the AMS program .................................. 22 Figure 8: Survey question 14: What was the cost of purchasing and installing all your robotic units including ongoing support services? .................................................................................................................................... 23 Figure 9: Survey question 12: How long did it take you to successfully move to an AMS system? ........................... 23 Figure 10: Survey question 13: What was the total cost of modifying your farm infrastructure to an AMS system excluding the costs of robotics? ............................................................................................................................ 24 Figure 11: Future Dairy expenditure $million 2016/17 dollars ................................................................................. 25 Figure 12: Future Dairy expenditure by type $million (AMS program expenditures only) ....................................... 26

Dairy Australia Economic evaluation of the Automatic Milking System component of the Future Dairy Program
ES.i
MARSDEN JACOB ASSOCIATES
Key Messages
The AMS component of the Future Dairy program demonstrated the commerciality of AMS
up to medium sized herds and developed a suite of knowledge to help these farmers
successfully transition from conventional milking systems.
The program provided an important R and D function by addressing core information gaps
in the early phases of testing and demonstrating the practicality of AMS and farm system
solutions in pasture based dairy farms.
Given program costs of over $17.1 million (including future extension costs) and the
relatively modest uptake of AMS to-date, the base case net benefits of the program are
estimated to be -$7.5 million in present value terms with a benefit cost ratio of 0.56,
assuming a 30 year forward time horizon.
During the program the number of AMS dairy farms in Australia rose from one or two
individual farms independently attempting to apply the technology to over 41 farms having
mature AMS farm systems in place. This rate of adoption end was at the lower end of
expectations and in part reflects the challenges of transitioning farm systems to AMS
quickly and at relatively low cost.
Sensitivity analysis was conducted on key assumptions and upper and lower bound net
benefit estimates were calculated and the benefit cost ratio found to range between 0.12 and
1.42.
Extending practice change by using program information is expected to help reduce the cost
and length of time for an individual farm to transition to a mature AMS system. As a result,
future net benefits going forward are estimated to be in the order of $7.1 million with a
benefit cost ratio of 4.8.
A challenge for Dairy Australia is to carefully weigh its role in commercialisation of
technologies as core R and D issues are resolved during the investment. It could be valuable
for Dairy Australia to develop investment guidelines and consider formation of appropriate
institutions to transition investments and property rights overtime from research and
development to commercialisation.

Dairy Australia Economic evaluation of the Automatic Milking System component of the Future Dairy Program
ES.ii
MARSDEN JACOB ASSOCIATES
Executive summary
This evaluation assesses the net economic benefits of the automatic milking systems (AMS)
component of the Future Dairy program. The program operated between 2004 and 2017 through
a collaboration of Dairy Australia, the University of Sydney, the New South Wales Department
of Primary Industries and DeLaval1.
The program undertook research and development to prove the technical feasibility of applying
existing automatic milk technologies to pasture based dairy farms. The program developed best
management guidelines and tested the commerciality of the technologies through a number farm
system pilots.
The program demonstrated the commerciality of AMS up to medium sized herds and developed
a suite of knowledge to help these farmers successfully transition from conventional systems.
However, the program found farm system challenges are difficult to overcome in larger herds
beyond 600+ cows.
Over the life of the program the number of AMS dairy farms in Australia rose from one or two
individual farms independently attempting to apply the technology to over 41 farms having
mature AMS farm systems in place. This number is at the lower end of adoption expectations of
the program and in part reflects the challenges of transitioning farm systems to AMS quickly
and at relatively low cost. With the completion of the research component of the program and
the synthesising of the information into practice change resources, it is expected the cost and
length of time for an individual farm to transition to a mature AMS system will fall.
Given program costs of over $17.1 million (including future extension costs) and the relatively
modest uptake of AMS to-date, the base case net benefits of the program are estimated to be -
$7.5 million (Table ES1) in present value terms with a benefit cost ratio of 0.56, assuming a 30
year forward time horizon. These net benefits are both ex-post and ex-ante as they include both
historical and future costs and benefits. Sensitivity analysis was conducted on key assumptions
and upper and lower bound net benefit estimates were calculated and the benefit cost ratio found
to range between 0.12 and 1.42.
Table ES1: Net Benefits of AMS program
Given that past expenditures on the program are now complete (and effectively sunk in an
economic sense) the core question is: what is the value of program information going forward?
Based on expected modest rates of adoption over the longer term and some investment in
developing and providing practice change resources, the future net benefits going forward are
estimated to be in the order of $7.1 million with a benefit cost ratio of 4.8.
1 DeLaval is a major international manufacturer and supplier of AMS equipment and technologies.
Key measure Value
Incremental benefits ($m) $9.5
Incremental costs ($m) -$17.1
Incremental net benefits ($m) -$7.5
Benefit-cost ratio 0.56
Internal rate of return -3%
Modified internal rate of return 3%

Dairy Australia Economic evaluation of the Automatic Milking System component of the Future Dairy Program
ES.iii
MARSDEN JACOB ASSOCIATES
The AMS component of the Future Dairy program provides a number of insights into the
challenges of investing in prospective technology near or at commercial demonstration.
The program provided an important function addressing core information gaps in the early
phases of testing and demonstrating the practicality of AMS and implementation solutions
in pasture based systems. This has provided private benefits to the small number that did
adopt, but also for those in future that may or may not adopt but draw on this information.
A challenge for Dairy Australia is to carefully weigh its role in commercialisation of
technologies in a partnered investment environment. Arguably aspects of the program over
time stretched beyond pure research and development and more deeply into
commercialisation where private benefits tended to outweigh public benefits.
In these circumstances, it could be valuable for Dairy Australia to develop investment
guidelines and consider formation of appropriate institutions to transition investments and
property rights overtime from research and development to commercialisation.

Dairy Australia Economic evaluation of the Automatic Milking System component of the Future Dairy Program
ES.4
MARSDEN JACOB ASSOCIATES
1. Background
This section provides background to this evaluation. A brief introduction to automatic milking
systems (AMS) and the Future Dairy (FD) Program that invested in AMS research and development
is provided. The Terms of Reference, approach of this evaluation and structure of this report are then
briefly outlined.
1.1 Automatic milking systems and Future Dairy
1.1.1 An introduction to Automatic Milking Systems (AMS)
Automatic milk systems apply robotic and information technologies to undertake milk harvesting
activities including, drafting feeding, milk cup placement and removal2.
Each cow is fitted with a unique electronic identification that allows the cow to be
‘recognised’ electronically at gates and in the milking unit. A robotic arm cleans the
teats, attaches the milking cups and sprays the teats of each cow. Each quarter is milked
individually and cups are removed based on the milk flow from each teat, thereby
minimising overmilking of each quarter. Most automatic milking systems have the
capacity to feed grain-based concentrate at each milking. (Dairy Australia 2014, p.1
‘Precision Dairy Technology’)
Two broad AMS systems have evolved:
box system – single cow stall with one robotic arm undertaking milk harvesting activities on the
one cow per time; and
robotic rotary (RR) – robotic technologies applied to rotary dairies using multiple robot units to
attach milk cups on multiple cows as they enter the dairy.
Automatic milking systems evolved in intensive dairy farm systems in the western hemisphere. In
these farm systems, box units were installed in barns enabling cows to voluntarily be drafted, milked
and fed, and then returned to stall through automated gate trafficking systems. In the early 2000’s
there were one early adopter of the box systems in Australia and the major issue surrounding the
adoption was the development of farms systems research to enable its application in extensive pasture
based grazing dairy farms.
Historically, a common reason for the adoption of AMS was perceived labour saving opportunities —
AMS significantly reduces or removes drafting and putting cups on cows. However, in pasture based
systems AMS is not simply a bolt-on technology that does away with workers placing cups on cows.
In pasture systems, the introduction of AMS requires complex changes to the whole farm system.
Generally farmers have opted for voluntary cow traffic through changes to farm design and
management of incentives, such as access to feed. However, some farmers have adopted batch
milking systems where small groups of cattle are manually drafted to the dairy.
Taing (2016), reviewed international literature and found that:
2 We note that some aspects of automated milk systems are already wide spread, such as automatic cup removers, feeding
systems, teat sprays, drafting gates and vat cleaning.
Dairy Australia Economic evaluation of the Automatic Milking System component of the Future Dairy Program
ES.5
MARSDEN JACOB ASSOCIATES
On average, studies have found a 10 per cent reduction in total labour units required
when using AMS compared to conventional milking systems with twice a day milking (De
Koning et al., 2003, Sonck, 1995)
However, in Australian systems, the impact on whole-farm labour savings is mixed. For example, the
FD program found for the small sample of case-study3 AMS farms some substantial labour savings,
but this was not consistent across farms and appeared to depend on a variety of factors such as
management capability, business structure and stage of adoption. While the technology has tended to
shift labour effort from milk harvesting to pasture management, herd monitoring and other farm
management activities, this can enable more flexibility in the timing of labour activities and create
some gains in lifestyle.
1.1.2 Future Dairy program
In 2004 Dairy Australia, together with the University of Sydney, De Laval and NSW DPI, established
the FD program.
The program was comprised of 4 funding phases, each with a themed research focus:
Future Dairy 1 — 2004-08: ‘Innovations to meet new challenges’;
Future Dairy 2 — 2008-10: ‘Investigations into Forage, Feeding and Milking Options for Future
Dairy Farm Systems in Australia’;
Future Dairy 3 — 2011-14: ‘Working today on tomorrow solutions’; and
Future Dairy 4 — 2011-17: ‘Robotic Milk 600 and beyond’.
In Future Dairy 1, AMS was one component of a broader suite of research to increase the
competitiveness of dairy farm systems. In Future Dairy 2- 4, AMS was the sole focus. Initially the
AMS technology was limited to the box system and was the sole focus of early FD programs. But as
the technology evolved, RR became the major focus of the more recent FD programs. By the fourth
round the application of RR in large herds was the primary focus of the investment. These phases will
be discussed in further detail in Section 2.
1.2 Terms of reference
This study will:
investigate and quantify the net benefits of gaining and applying knowledge from the Automatic
Milking System component of the Future Dairy project — through research, development and
extension both to farms involved but also to the wider industry; and
analyse and report on the estimated incremental benefits and costs investments in various types of
robotic milking systems that have occurred through and as a result of the four phases of the AMS
program.
The report will draw on Dairy Australia and partner resources and participating farms to identify both
on farm and broader industry benefits and costs of the AMS technologies. This will include among
others:
3 For example see http://futuredairy.com.au/wp-content/uploads/2016/02/CSCostello.pdf

Dairy Australia Economic evaluation of the Automatic Milking System component of the Future Dairy Program
ES.6
MARSDEN JACOB ASSOCIATES
estimated and likely on-farm benefits for those that have already adopted AMS and distribution of
these benefits (e.g. by location and type of farms – such as farm size, type of dairy farming
system); and
expected benefits from program learnings for those considering the adoption of AMS in the
future, including:
improved understanding of key success factors and KPIs;
improved understanding and approaches to de-risking implementation and operation of an
Automatic Milking System;
knowledge and information that can reduce the length of the implementation or transition
phase; and
capability building and skills development.
In estimating costs of the AMS investment, all relevant program costs including Dairy Australia,
partner organisation and participant costs are to be included and, where appropriate, on-farm costs
associated with the AMS technologies.
This study is to be conducted in accordance with the Council of Rural Research and Development
Corporations Impact Assessment Guidelines and Procedures documents.
1.3 Approach of this report
This evaluation estimates the incremental value of the AMS program in helping farmers make the
decision to adopt (or not adopt) and implement AMS. It does not estimate the gross benefit of AMS
adoption.
Our approach is to estimating the on-farm net benefits that accrue to farmers by participating in the
FD program. This includes how the program has enabled farmers to increase their profitability relative
to what would have been the case in the absence of the project.
The counterfactual includes what would have been the pathway of adoption in the absence of
knowledge from the program’.
The program is likely to have created a range of learnings that potentially reduce the costs and
increase the likelihood of successfully adopting AMS. This could include improved design and
application of the technology and whole farm systems and avoidance of common pitfalls or mistakes.
We consider these benefits for both:
ex-post outcomes — what has already been the value of successful adoption and what has been
the value of avoided costs of poor implementation; and
expected ex-ante outcomes— what can be reasonably expected to be the value of this learning to
future adoptees.
1.4 Report structure
The remainder of this report is structured as follows:
Section 2 — describes the phases of delivery of the program and identifies key program
information necessary to estimate program benefits
Section 3 — defines the evaluation counterfactual;

Dairy Australia Economic evaluation of the Automatic Milking System component of the Future Dairy Program
ES.7
MARSDEN JACOB ASSOCIATES
Section 4 — identifies and estimates the benefits of the program;
Section 5 — identifies and estimates the costs of the program;
Section 6 — estimates the net benefits of the program and provides a number of broader
evaluation insights;
Section 7 — provides a sensitivity analysis of the results;
Section 8 — summarises the cash-flows of net benefits; and
Section 9 — contains references used in the report.
Appendix 1 — provides a summary of on online survey used to supplement program information
to aid the development of parameters to estimate program benefits;
Dairy Australia Economic evaluation of the Automatic Milking System component of the Future Dairy Program
ES.8
MARSDEN JACOB ASSOCIATES
2. Phases and outcomes of program delivery
In this section a more detailed description the AMS component of the Future Dairy program and its
outcomes are provided. Rates of adoption and underlying economics of the implementation of AMS
are considered. These are set out to enable the identification of key parameters to estimate the
potential benefits and costs of the investment.
2.1 AMS Investment phases
The AMS investment occurred in four distinct phases (FD1-4) to establish the technical feasibility,
commerciality; and best management practices required for successful box and RR systems in pasture
based dairy farms.
The investment produced a variety of outputs including:
core farm systems research to enable the application of AMS in pasture based systems;
development and fine tuning of pasture/forage and traffic management technologies to suit AMS
system;
best practice guidelines to successfully implement AMS;
demonstrating commercialisation of technologies on pilot farms;
the development of practice change information and communities of practice promoting and
encouraging the adoption of AMS; and
provision of general and bespoke advice to trouble shoot installation and implementation.
2.1.1 FD1 — ‘assess the technical feasibility of AMS in a pasture based system’
This phase was essentially a ‘proof of concept’ phase that involved applying box systems to the
Elizabeth Macarthur Agricultural Institute (EMAI) dairy farm at Menangle, New South Wales
developing a pasture management strategy to achieve appropriate levels of voluntary cow traffic,. The
researchers also worked in close consultation with partner farms to identify and draw on key
management insights and experiences.4 The key issues in the feeding strategy were:
achieving sufficient frequency of visitation of individual cows; and
achieving adequate throughput of the herd through the box units, and
achieving high levels of pasture utilisation
This required accuracy in pasture allocation and managing the influence of other variables on cow
flow including:
distance to pasture;
type, amount and timing of fodder supplements;
type, amount and timing of concentrate;
4 A private farm at Winnindoo in Victoria at the time was implementing a box system, but at that point there had been no
assessment and application of pasture management strategies.

Dairy Australia Economic evaluation of the Automatic Milking System component of the Future Dairy Program
ES.9
MARSDEN JACOB ASSOCIATES
animal factors (age previous training etc.); and
climatic factors.
FD1 investment demonstrated the system was feasible in a 2 two way grazing system5.
2.1.2 FD2 — ‘enable more efficient use of labour and increase in productivity while maintaining lifestyle’
This phase extended the proof of concept of phase 1 to identify further farm management refinements
necessary to improve whole of farm system outcomes and achieve commercial farm competitiveness.
This included:
co-develop and test the pilot the RR installed at EMAI in 2009
improving the whole farm performance of AMS (shifting from two to three way grazing);
putting in place management system learnings in pilot farms;
develop tools and knowledge to ensure efficient adoption;
an economic appraisal of AMS compared to a conventional milking system (CMS)6;
updates of management guidelines; and
establishing an AMS discussion group.
At this point in the program, these outputs were expected lay the foundations for a rapid increase in
the rate of adoption of AMS in pasture based dairy systems.
2.1.3 FD3 — ‘identify and develop solutions for the major constraints to AMS that enable farmers to capture the full potential value at the whole farm business systems level’.
This phase generally shifted the focus of RD and E effort toward commercialisation with a focus on
the environmental social and economic feasibility applying robotic technology with voluntary cow
movement in 600-800 cow herds. Major objectives were to:
address current and future adoption barriers to AMS;
making AMS more competitive — addressing pasture management challenges in larger herds;
and
supporting new installations and establishing a community of practice of new adopters.
Major management refinement issues under investigation were:
labour efficiency outcomes of AMS;
oestrous detection strategies;
power consumption of AMS systems;
management of abnormal milk;
managing large herd voluntary traffic;
5 A pasture rotation system used on Australian dairy farms that provides the herd with two fresh pasture breaks per day.
6 A conventional milk system includes herringbone and rotary dairies that require the manual placement of milking cups
on cows. They may have some automation such as cup removers and gates.

Dairy Australia Economic evaluation of the Automatic Milking System component of the Future Dairy Program
ES.10
MARSDEN JACOB ASSOCIATES
batch versus voluntary milking;
nutrient distribution;
herd testing approaches;
cow longevity under the systems; and
milking efficiency – frequency consistency feeding, and queuing.
During this phase extensive negotiations were conducted to install the commercial version of the RR
at EMAI, these negotiations were not successful and AMR was eventually installed and tested at the
Retreat Creek Farm during FD4. Also during this phase the first commercial reference farms of De
Laval technology were installed this included the first RR system at Gala Farms in Tasmania.
2.1.4 FD4 — ‘is AMR [RR] a technical, environmentally, socially and economically viable solution for 600-800 cows with voluntary cow traffic in a pasture based system’
The focus of the phase was to address the constraints to take-up of the RR in 600-800 cow herds and
demonstrate farm viability. An RR system was installed under a contract agreement at Retreat Creek
Farm at Birregurra, VIC as the focal point of the demonstration of RR in a large herd. And a national
milk harvest position was established to drive the uptake of AMS.
Other objectives were:
developing management guidelines for large herds
applying Gala farm learnings from phase 3;
establishing a national economic and operational narrative (technical notes, information sheets,
newsletters, media articles;
doubling the uptake of the number of farms adopting AMS and RR; and
achieving a benefit cost ratio of 3:1 between 2014-17.
2.2 Timeline of adoption and implementation
The practice change focus of FD was to promote and encourage the adoption of AMS. A key issue in
this evaluation is the extent to which the program did and can influence adoption uptake and alter
practice changes on farms. We assume the FD program brings forward the timing of decision making
to adopt and reduce the time to successfully transition to a mature AMS farm system than would have
otherwise been the case.
2.2.1 Rates of adoption
Kenny and Eastwood (2011) (using stylised farm and farm characteristic cohort analysis) developed
national and regional estimates of rates of adoption of AMS. They predicted relatively slow adoption
of between 5-10 per cent of new dairies between 2012 and 2017. Actual adoption for the period was at
the lower end, at 5 per cent.
Early FD programs focussing on particular forms of AMS (boxes and rotaries) largely preceded
commercial adoption of those technologies. In the first half of the program FD1-2 there were few
commercial operations using AMS. At this stage of technology adoption the program tended to work
with a small number of individual farms as commercialisation demonstrations and problem solving

Dairy Australia Economic evaluation of the Automatic Milking System component of the Future Dairy Program
ES.11
MARSDEN JACOB ASSOCIATES
cases studies, and promotional champions of the technology. In most cases the program sought to
achieve proof of concept and then demonstration of commercial application.
In the second half of the investment FD3-4, more commercial installations occurred. Kerrisk and
Garcia (2010) observed at the time there were 12 commercial AMS dairies installed and at least 5
more planned. They noted (p.6):
The Future Dairy team has had contact with at least 13 of the farmers that have
committed to AMS either during the planning stages or commissioning (or both).
However it is estimated that the project has had some impact on all 17 dairies either
through media, website management guidelines, farmer conferences and or knowledge
extended through other sources. In addition we have had one on one contact with a huge
number of farmers who have contemplated AMS or are preparing for AMS in the future.
By 2017 the number of installations had risen to 41. The FD4 Investment proposal claimed that the
rate of adoption of AMS had increased as a result of the FD programs.
Whilst it is difficult to measure the true industry impact of the programme of work of this
nature we can be certain that the profile that has been generated has been immense and
on-farm adoption of learnings from FutureDairy is likely to be higher than we could ever
anticipate measuring.7
FD4 sought to demonstrate RR commercialisation in 600+ herds at Retreat Creek. However, by the
end of the investment the system had been decommissioned. Nonetheless, there were learnings
developed for large herds from the Retreat Creek farm as well as from Gala Farms.
Nicon Rural Services (2017) interviewed over half the AMS installations in Australia found that only
20 per cent (3 of 15 interviewed) of AMS farmers used FD information to assess the suitability of
their operations to AMS:
Most were unaware of Future Dairy or that Future Dairy could provide information on
AMS until they had installed their new AMS dairy’.
Instead, most farmers interviewed used a range of information sources gathered from manufacturer
web-sites, YouTube clips and spoke with manufacturers on options and costs. They also spoke with
other farmers and visited installations in Australia and some overseas. In using these information
sources, farmers are likely to have been influenced indirectly by the FD program more than is implied
by their responses under interview. This is because the FD program was the core provider of
underpinning R and D for pasture systems and as such, the program was influencing manufacturer and
online information.
2.2.2 Transitioning to mature farm systems
Nicon Rural Services (2017) observed that all the farmers interviewed had sought assistance from the
FD program only once their individual installations had been commissioned. This highlights FD is an
important source of information when needed and indicates opportunities to reach adopters prior to or
during commissioning. The transition experience of AMS adopters was distinct. Most farmers
experienced significant issues transitioning from the old to new system mainly due to delay and cost
(Error! Reference source not found.). A small share of farmers (22 per cent) experienced a short
eriod of farm systems disruption (experiencing robotic system impact in their farm system and
7 Kerrisk, K. and Garcia, Y. 2010 Future Dairy 3 – Working today on tomorrows solutions, Consortium Funding Proposals
to Dairy Australia. Dairy Australia.

Dairy Australia Economic evaluation of the Automatic Milking System component of the Future Dairy Program
ES.12
MARSDEN JACOB ASSOCIATES
voluntary cow movement) while a large share of farmers experienced a prolonged period of
disruption. An estimated 88 per cent of adopters experienced system disruption beyond 6 months,
with one to two years or more being the norm. Just over 50 percent of adopters experienced this
typical length of disruption and successfully implemented the technology.
Table 1: Transition experience of Australian AMS
Category of adoption Per cent
Swift and successful (0-6 months farm system
disruption) 22
Typical (6-24 months farm system disruption)* 66
Unsuccessful – decommissioned or commissioning
abandoned (6-24+ farm system disruption) 12
Not this includes farms that did not complete successful implementation of AMS and in the course of implementation sold the dairy farm. In most cases the implementation was then progressed by the new owner.
Source: Kerrisk and Lyon 2016 quoted in Nicon Rural Services 2017
An estimated 10 percent of all Australian adopters experience failure and decommission. In contrast
international failures rates were typically in the order of 10 per cent. Some of this difference may be
explained by the sample approach used by Nicon Rural Services (2017). However, it is more likely
the lower rates international reflect that the technologies have been widely tested and used in barn
systems for many years and the application of the technologies in pasture based systems was still
relatively novel over the life of the FD project.
The FD program anticipates that Australian failure rates will fall or not rise through the future
provision of practice change information developed over the life of the FD program including in pre
investment decision making and earlier implementation of practice change guidelines in transition
phase.
2.3 Economics of AMS adoption
The FD program supported a number of farm system economic appraisals to assess the merits of an
AMS investment. Two key studies are of note, both assessed the economics of AMS at a steady state
— that is once the period of farm system disruption had ended and the AMS system was assumed to
be successfully operating. Initial partial budgeting prior to the development of management guidelines
for pasture based systems found AMS to have lower rate of return than conventional milking systems.
A more recent study concluded AMS could achieve comparable rates of return when managed
appropriately. As a result this evaluation does not estimate comparative benefits between conventional
and AMS systems once they are operating in a mature state. We assume the returns of the systems are
broadly comparable. Instead the focus of the economic benefits of this study of the program centres
on the role of the program and future practice change in reducing the costs, and length of transition to
a mature farm system.

Dairy Australia Economic evaluation of the Automatic Milking System component of the Future Dairy Program
ES.13
MARSDEN JACOB ASSOCIATES
2.3.1 Partial budget analysis
Alford et al. (2010) and Armstrong and Tarrant (2010) (in Alford 2010) undertook preliminary
economic assessments of AMS in Australian dairy.8 Using stylised partial budgets the authors
estimated the economic performance of comparable AMS and conventional farm systems at different
scales and forms of conventional milking. Using conservative assumptions, the analysis found
conventional milking systems achieved superior internal rates of return compared to AMS. This
superiority was starkest in smaller cow herds and became more marginal in larger herds (Table 2).
Break-even analysis indicated that farm labour costs would have to increase significantly (around 50
to 124 per cent subject to farm scale, labour rates and type of conventional system) for the AMS
budget to achieve the same net present value return compared with the conventional farm system.
Table 2: Internal rates of return (per cent) of farm business at different herd scale and milking systems
160 cow
Swing-over
240 cow
Swing-over
320 cow
30 unit swing-
over
320 cow
40 unit rotary
400 cow
40 unit rotary
CMS 1.0 3.4 4.7 4.4 5.6
AMS 0.3 2.8 4.1 4.1 5.2
Source: Davies, L, Aflord, A, Kerrisk, K, Garcia, S. No Date, Economics of Automatic Milking Systems, FutureDairy, Dairy Australia, p.13 summarising the results of Alford et al
Davies et al (No date, p.3) concluded:
An automatic milking system can be sometimes justified when
- there is a large saving in time compared to the alternative system conventional
milking system(CMS);
- the value placed on the labour is relatively high;
- the initial capital cost of the AMS is only approximately 50 per cent greater than the
CMS;
- the life expectancies of the two systems are similar; and
- the increased repair and maintenance costs for the AMS (likely to be higher than for
the CMS) do not erode most of the labour savings benefits.
2.3.2 Case-study whole farm analysis
Taing (2016) undertook a comparative whole farm economic assessment of two case-study AMS
operations:
170 cow herd in Gippsland with a 3 box AMS system; and a
600 cow herd in Tasmania with a voluntary traffic RR system.
8 Prior to the Future Dairy investment, Lightfoot and Mulvaney 2002 also undertook an ex ante economic assessment. All
three studies reached similar conclusions.

Dairy Australia Economic evaluation of the Automatic Milking System component of the Future Dairy Program
ES.14
MARSDEN JACOB ASSOCIATES
The assessment considered farm performance under a range of historical prices, costs and seasonal
conditions and debt scenarios. After accounting for general farm system risk, Taing (2016) concluded
that within a mature successful operation:
‘.. the two AMS farms studied in Gippsland and Tasmania are capable, under the current
management, of operating competitively under the seasonal and economic conditions
that have occurred in the past and are likely to occur in the future, when compared to
farms using conventional milking systems in the same region and under the same
conditions.’
The comparative performance of the AMS and RR case-study farms were driven by
high milk solids produced per cow;
high labour efficiency (cows milked per FTE);
high pasture utilisation (tonnes of DM grazed per year);
lower cash overheads due to labour savings,; and
improved operation flexibility as CMS continued to operate along-side the AMS.
Taing’s (2016) estimates and conclusions were based on the economics of post-adoption mature farm
systems and did not account for the potential risks and costs of transition.
2.3.3 The costs of transitioning
Estimates of the costs of transitioning from a conventional to a mature AMS farm system vary. Alford
et al (2010) observed that lost production could typically be in the order of 10 per cent in year one and
5 per cent in year two. However there is a high degree of uncertainty to the estimates.
AMS trials suggest that much of this loss in production occurs during implementation of
the AMS technology and is dependent on many factors including the stage of lactation of
the herd and any pre‐commissioning training regimes. Further research is likely to lead
to developing management strategies to minimise such adaptation losses. For individual
producers this adaptation cost would represent a risk associated with adoption of a
technology.
We also note that the cost is only considered in terms of lost production and not other cascading
effects across the farm system including, the costs of problem solving and de-risking the
implementation. A challenge in this evaluation is the counterfactual. There was an extremely limited
pool of experienced providers that could have serviced this potential market.
As part of this evaluation we estimate the value individual AMS farmers would have placed on having
to independently source advice to de-risk the implementation. Farmers we surveyed estimated this at
under $20,000 per farm. However, individual farmers placed significantly higher values on knowing
information derived from implementing AMS.
We also note that the observed transition trends are ex-post and implicitly include the influence of the
program to-date on de-risking implementation. There is anecdotal evidence that the FD program
progressively narrowed the scope of implementation risks within small to medium sized herds over
the lifetime of the program. Arguably in the absence of the program the share of farms experiencing
transition issues would been more significant than those observed by Nicon Rural Services (2017) and
the length of transition longer, and the incidence of failed implementation higher. The program
expects the length and costs of transition to AMS to fall in the future within the provision of practice
change information developed over the life of the program.

Dairy Australia Economic evaluation of the Automatic Milking System component of the Future Dairy Program
ES.15
MARSDEN JACOB ASSOCIATES
2.4 Further understanding farmer perspectives
To supplement available program information and literature provided in the previous section,
Marsden Jacob undertook an online survey using Survey Monkey, of the Future Dairy community of
practice coordinated by the Dr Nico Lyons of the University of Sydney and NSW DPI.
The intention of the survey was to provide further contemporary insight on the likely impact of the FD
program on:
the rate of AMS and RR adoption;
how the FD program impacted on transition timing and cost; and
what economic value farmers placed on FD assistance?
The survey was emailed to 41 AMS dairy farmers.
The FD program encouraged all known AMS farmers to respond to the survey. FD advised farmers
that the survey was being conducted to help evaluate the FD program. The farmers were given 2
weeks to respond to the survey and received two reminder emails.
A total of 11 dairy farmers responded to the survey. While the total number of responses was
relatively small, the intention of the survey was to supplement existing data gathered through the
review of the program and available literature. The results of the survey help ground truth and provide
justification for assumptions applied in Section 5.
The survey and results are provided in Appendix 1. Key insights that influenced the estimation of
benefits included:
70 per cent of farmers were directly (influenced adoption and implementation) by the program;
on average farm profit fell approximately 13 per cent during implementation;
the average transition time take to achieve mature adoption was 1.2 years;
the average cost of the robotics milking system was $1.5 million per farm;
other farm adoption costs averaged $80,000 per farm; and
the cost of decommissioning AMS and returning to a conventional system was estimated at
$40,000 per farm.
Survey insights together with those from program literature in section 2 are draw on in section 4 to
develop parameters to estimate program benefits.

Dairy Australia Economic evaluation of the Automatic Milking System component of the Future Dairy Program
ES.16
MARSDEN JACOB ASSOCIATES
3. Defining the counterfactual
This evaluation follows the guidelines of the CRDC and considers the net incremental benefits of the
program in a steady state over a thirty year period.
Consequently, in this evaluation, the counterfactual requires careful definition in order to identify the
benefits of the program. This is because the program is expected to have created a range benefits
during the investment, but could be expected to create a range of future benefits as learnings from the
investment are applied in future practice change.
We define the counterfactual as accounting for what would have happened in the absence of the
program. This involves considering outcomes from a number of dimensions including during and
after the investment period.
The counterfactual has to consider issues such as:
what would have been the uptake of AMS in the absence of the programs?
what would have been the length and cost of the transition period to AMS in the absence of the
program?
What would have been the failure rate of farmers attempting to implement AMS without the
project?
These issues are considered in estimating benefits in the next section of the document.

Dairy Australia Economic evaluation of the Automatic Milking System component of the Future Dairy Program
ES.17
MARSDEN JACOB ASSOCIATES
4. Estimating AMS program benefits
Aggregate program benefits are estimated at $9.5 million in present value terms and include:
avoided costs of farmers transitioning to an AMS; and
avoided costs resulting from a lower failure rate for farmers in implementing an AMS.
In this section, the incremental benefits of the AMS program are estimated.
4.1 Classes of program benefit
Drawing on program information summarised in previous sections and discussions with Dairy
Australia and the University of Sydney, two types of program benefits are identified:
Avoided costs of farmers transitioning to AMS; and
Avoided costs resulting from a lower failure rate for farmers in implementing AMS.
The influence that the program has on AMS adoption by farmers is not identified as a key program
benefit. This is because it is assumed that the net economic impact on farmers of adopting AMS is the
same as if they had not adopted – as indicated in section 2.3.
4.1.1 Avoided costs of farmers transitioning to AMS
For those farmers that have already successfully implemented AMS into their farming system, the
AMS program has reduced the costs of transitioning from their current milking system to AMS.
Additionally, future Dairy Australia extension costs and existing Future Dairy research should ensure
that the program lowers the transition costs for farmers that transition to an AMS in future years.
Avoided costs of transitioning to AMS are estimated to be $4.8 million in present value terms.
The avoided (or lower) transition costs each year are estimated as equal to:
The number of farmers each year influenced by the AMS program during their transition
phase
x Profit reduction per year during transition
x Lower transition time (years) as a result of the AMS program
Future transition benefits are estimated to occur for:
10 years into the future at 100 per cent of the estimated transition saving; and
5 years after the 10 year period at 50 per cent of the estimated transition saving.
This assumes that in the absence of the AMS program, other materials would have likely have been
developed by the private sector in the future that would have delivered the same impact as the AMS
program. This is considered a reasonable timeframe considering the time length of the AMS program
to date.
The components of the avoided transition cost calculation are discussed in more detail below.

Dairy Australia Economic evaluation of the Automatic Milking System component of the Future Dairy Program
ES.18
MARSDEN JACOB ASSOCIATES
The number of farmers influenced by AMS
The number of farmers that have already successfully implemented AMS or are projected to
successfully implement in the future is illustrated in Figure 1. Historical adoption rates are drawn
from information in research proposals for Future Dairy 1, 2, 3 and 4. Future adoption rates (2017 and
beyond) are based on:
projected adoption in the five years beyond 2017: analysis by Kenny and Eastwood (2011); and
for each year after this five year period, the number of additional farms adopting each year is
equal to the number of additional farms that adopted five years previous multiplied by the same
per cent increase in adoption from 2017 to 2022 as implicit in the Kenny and Eastwood (2011)
analysis.
This results in an increasing rate of adoption over time. In particular, the impact that these adoption
assumptions has on market penetration across all dairy farmers is illustrated in Figure 2.
Figure 1: Historical and estimated future AMS adoption
Source: MJA analysis
Figure 2: Projected market penetration of AMS (Total AMS dairy farms as % of all Australian dairy farms)
0
100
200
300
400
500
600
700
2000 2005 2010 2015 2020 2025 2030 2035
2017
0%
2%
4%
6%
8%
10%
12%
2000 2005 2010 2015 2020 2025 2030 2035
2017
Dairy Australia Economic evaluation of the Automatic Milking System component of the Future Dairy Program
ES.19
MARSDEN JACOB ASSOCIATES
Source: MJA analysis
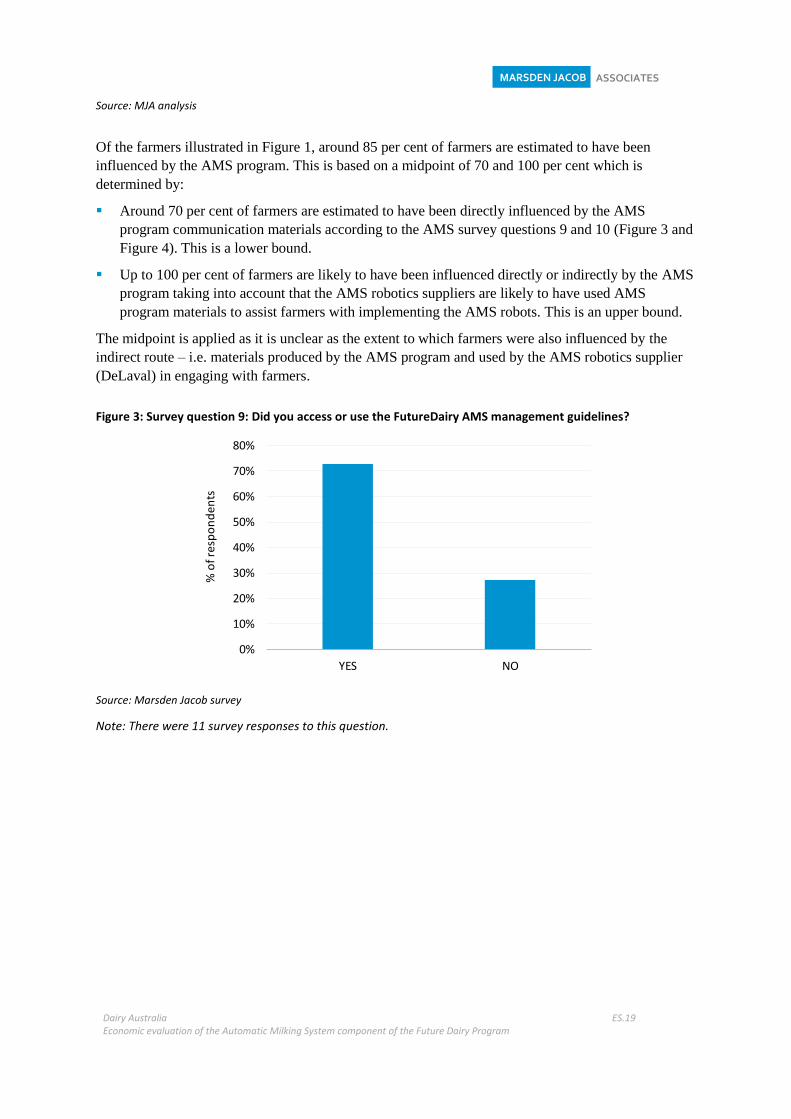
Of the farmers illustrated in Figure 1, around 85 per cent of farmers are estimated to have been
influenced by the AMS program. This is based on a midpoint of 70 and 100 per cent which is
determined by:
Around 70 per cent of farmers are estimated to have been directly influenced by the AMS
program communication materials according to the AMS survey questions 9 and 10 (Figure 3 and
Figure 4). This is a lower bound.
Up to 100 per cent of farmers are likely to have been influenced directly or indirectly by the AMS
program taking into account that the AMS robotics suppliers are likely to have used AMS
program materials to assist farmers with implementing the AMS robots. This is an upper bound.
The midpoint is applied as it is unclear as the extent to which farmers were also influenced by the
indirect route – i.e. materials produced by the AMS program and used by the AMS robotics supplier
(DeLaval) in engaging with farmers.
Figure 3: Survey question 9: Did you access or use the FutureDairy AMS management guidelines?
Source: Marsden Jacob survey
Note: There were 11 survey responses to this question.
0%
10%
20%
30%
40%
50%
60%
70%
80%
YES NO
% o
f res
po
nd
ents

Dairy Australia Economic evaluation of the Automatic Milking System component of the Future Dairy Program
ES.20
MARSDEN JACOB ASSOCIATES
Figure 4: Survey question 10: Did FutureDairy staff assist you at anytime with problem solving changes to your AMS farm system?
Source: Marsden Jacob survey
Note: There were 11 survey responses to this question.
Profit reduction per year during transition
Profit reduction during transition is estimated to be 12.1 per cent of normal farm profits. This is based
on the average profit impact indicated by Marsden Jacob survey questions 15 and 16. This equates to
a profit reduction of around $15,700 per annum per farm. Normal farm profit is based on an average
of ABARES estimated farm cash income for Australian dairy farms from 2014-15 to 2016-17.
Lower transition time (years) as a result of the AMS program
Lower transition time as a result of the AMS program is estimated to be 1.2 years which is the
average reduction in transition time indicated by the Marsden Jacob survey question 18 (Figure 5).
Figure 5: Survey question 18. If you responded YES to the previous question, what would you estimate was the length of the time reduction?
Source: Marsden Jacob survey
0%
10%
20%
30%
40%
50%
60%
70%
80%
YES NO
% o
f re
spo
nd
ents
0%
10%
20%
30%
40%
50%
60%
less than 6months
6-12months
12-18months
18 months -2 years
2 years +
% o
f re
spo
nd
en
ts
Length of time reduction

Dairy Australia Economic evaluation of the Automatic Milking System component of the Future Dairy Program
ES.21
MARSDEN JACOB ASSOCIATES
Note: There were 4 survey responses to this question. The average time length reduction is estimated to be 14
months across the 4 responses.
4.1.2 Avoided costs resulting from a lower failure rate in implementing AMS
The FD program is expected to reduce the future incidence of failure for those that attempt to
introduce an AMS system on their farm. The program is expected to deter farmers from attempting to
implement AMS in cases where they are not likely to be suitable for implementing an AMS. Dairy
Australia’s future extension activities and current materials available on the internet will provide
guidance to farmers on the key factors involved in successfully adopting AMS and why some farmers
that attempt adoption do not succeed.
Avoided costs resulting from a lower failure rate are estimated to be $4.8 million in present value
terms.
The avoided costs each year are estimated as equal to:
The number of farmers each year that will avoid failure
x (Total transition costs + profit reduction during transition)
Future benefits are estimated for ten years. However, the scale of the benefits decrease over time such
that they are zero by year ten. This reflects the counterfactual that farmers would have likely
independently determined the likely success of AMS for their farm at some time in the future.
The number of farmers each year that will avoid failure
The estimated number of farmers that have avoided failure is illustrated in Figure 6.
The number of farmers that have avoided failure (each year) is estimated by calculating the difference
between those that attempt adopting AMS each year with and without the AMS program:
Those that attempt to adopt AMS with the project is estimated as equal to the number of farmers
that successfully adopt divided by (1-10 per cent). The 10 per cent figure represents those that
attempted to implement an AMS but failed – i.e. the failure rate with the project.
Those that attempt to adopt AMS without the project is estimated as equal to the number of
farmers that successfully adopt divided by (1-y per cent). The y per cent figure represents those
that attempted to implement an AMS but failed – i.e. the failure rate without the project. The
value of y starts at 20 per cent in year 2017 and then falls in a linear manner to 10 per cent by year
10. The impact of this is to reduce the size of the benefit over time as, without the program,
farmers would have likely independently determined the likely success of AMS for their farm at
some time in the future.
The number of farmers that successfully adopt in these two calculations was illustrated in section
4.1.1.

Dairy Australia Economic evaluation of the Automatic Milking System component of the Future Dairy Program
ES.22
MARSDEN JACOB ASSOCIATES
Figure 6: Estimated number of farmers that will avoid failure because of the AMS program
Source: Marsden Jacob estimates
Total transition costs
When a farmer fails in their attempt to install AMS robots into the farm system, they will incur costs
that they would not otherwise incur, related to transitioning to the AMS and then back to their
previous farming system. The total transition costs comprise three components:
Cost of the AMS robot;
Cost of integrating AMS robots into the farm system; and
Cost of returning to a conventional milking system.
The cost of the robot is estimated to be $243,000 for each farmer. This is estimated by:
The annual economic cost of the robot x the transition period
The annual economic cost is equal to $185,000 which is the annual depreciation of the robot,
assuming:
An average cost for robots of $1.15 million per farmer, noting that most farmers purchase more
than one robot. This estimate cost is based on Marsden Jacob survey question 14 (Figure 7);
A depreciation rate of 6 per cent, which assumes an asset life of 15 years; and
A loss on sale of 10 per cent of the initial purchase price.
0.0
0.5
1.0
1.5
2.0
2.5
2018 2020 2022 2024 2026 2028

Dairy Australia Economic evaluation of the Automatic Milking System component of the Future Dairy Program
ES.23
MARSDEN JACOB ASSOCIATES
Figure 7: Survey question 14: What was the cost of purchasing and installing all your robotic units including ongoing support services?
Source: Marsden Jacob survey
Note: There were 11 survey responses to this question. The average cost is estimated to be $1.15 million.
The transition period is estimated at 1.3 years (around 16.5 months) which includes an allowance for
13.5 months to transition based on Marsden Jacob survey question 12 (Figure 8) and an allowance for
3 months for the sale of the robots.
Figure 8: Survey question 12: How long did it take you to successfully move to an AMS system?
Source: Marsden Jacob survey
Note: There were 8 survey responses to this question. The average transition time length is estimated to be
13.5 months.
The cost of integrating AMS robots into the farm system is estimated at $80,000 for each farmer and
is based on Marsden Jacob survey question 13 (Figure 9).
0%5%
10%15%20%25%30%35%40%45%50%
% o
f re
spo
nd
ents
Cost of purchasing and installing robotic units
0%
5%
10%
15%
20%
25%
30%
35%
% o
f res
po
nd
ents
Transition length

Dairy Australia Economic evaluation of the Automatic Milking System component of the Future Dairy Program
ES.24
MARSDEN JACOB ASSOCIATES
Figure 9: Survey question 13: What was the total cost of modifying your farm infrastructure to an AMS system excluding the costs of robotics?
Source: Marsden Jacob survey
Note: There were 8 survey responses to this question. The average modification costs are estimated to be
$80,000 per farm.
The cost of returning the farming system to the previous farm system (once the robots have been
removed) is assumed to $40,000 – half of the amount of modifying to an AMS.
Profit reduction during transition
Profit reduction during transition is estimated at around $17,600 per farmer based on:
The estimated profit reduction during transition per annum. This is the same calculation as per
section 4.1.1; and
A transition time of 13.5 months as per Marsden Jacob survey question 12 (Figure 8).
0%
10%
20%
30%
40%
50%
60%
% o
f res
po
nd
ents
Modification costs

Dairy Australia Economic evaluation of the Automatic Milking System component of the Future Dairy Program
ES.25
MARSDEN JACOB ASSOCIATES
5. Estimating the costs of the AMS program
5.1 Total AMS program expenditures
AMS program expenditures occurred over a period of 13 years – from 2004/05 to 2016/17 and are
estimated at $15.2 million in total in real terms (Table 3). In the first two stages of the program, there
were significant expenditures on the Future Dairy program not related to AMS (Figure 10). Table 3
only includes expenditures related to AMS components as it is assumed that Future Dairy
expenditures not related to AMS would have occurred regardless of the AMS programs.
The Future Dairy program in stages 3 and 4 was entirely comprised of AMS program expenditures.
Table 3: Future Dairy expenditure $million 2016/17 dollars (AMS program expenditures only)
Stage Time Period Number of years Total cost
Future Dairy 1 2004/05 - 2007/08 4 $813,345
Future Dairy 2 2008/09 - 2010/11 3 $1,102,837
Future Dairy 3 2011/12 - 2013/14 3 $8,591,787
Future Dairy 4 2014/15 - 2016/17 3 $4,679,223
Total 2004/05 - 2016/17 13 $15,187,192
Source: Dairy Australia
Figure 10: Future Dairy expenditure $million 2016/17 dollars
Source: Dairy Australia
Notes: The 2007/08 year is based on a pro-rata of total expenditures on Future Dairy from 2006/07 and
2007/08. No estimate for non-AMS components is provided for 2007/08 due to data limitations.
$0.0
$0.5
$1.0
$1.5
$2.0
$2.5
$3.0
$3.5
Future Dairy (AMS components) Future Dairy (non-AMS components)

Dairy Australia Economic evaluation of the Automatic Milking System component of the Future Dairy Program
ES.26
MARSDEN JACOB ASSOCIATES
5.2 Source of AMS program expenditures
Future Dairy expenditures have been funded from a variety of sources (Figure 11). The major
contributors were:
The University of Sydney which provided staff, supervision of students, infrastructure support
and access to their pilot farms in FD4 to undertake a range of research;
The New South Wales Department of Primary Industries (DPI) which provided research staff
and monetary support for research by the University of Sydney during FD1-2; and
Dairy Australia which provided funding for the University of Sydney to undertake research and
undertook program management activities.
DeLaval, the robot supplier for pilot sites, also provided support for installing RR equipment and a
contribution to the capital cost of the AMS equipment. This cost has not been included in the benefit
cost analysis as it is assumed that this contribution would have occurred regardless of the AMS
program. This exclusion was discussed and agreed with Dairy Australia staff.
Figure 11: Future Dairy expenditure by type $million (AMS program expenditures only)
5.3 Composition of AMS program expenditures
A detailed composition of AMS program expenditures is contained in Table 4.
$0.0
$0.5
$1.0
$1.5
$2.0
$2.5
$3.0
$3.5
University of Melbourne
New South Wales Department of Primary Industries staff, overheads and other
Dairy Australia overhead and delivery (50% of operating costs)
University of Sydney staff, equipment, travel and other

Dairy Australia Economic evaluation of the Automatic Milking System component of the Future Dairy Program
ES.27
MARSDEN JACOB ASSOCIATES
Table 4: Composition of Future Dairy expenditure $million 2016/17 dollars (AMS program expenditures only)
Contributor and type of cost 2004/05 2005/06 2006/07 2007/08 2008/09 2009/10 2010/11 2011/12 2012/13 2013/14 2014/15 2015/16 2016/17 Total
Dairy Australia
Staff $15,510 $16,953 $24,506 $20,928 $81,106 $84,232 $84,308 $597,875 $621,726 $648,636 $445,945 $471,296 $469,912 $3,582,933
Research equipment $628 $0 $0 $0 $6,195 $0 $0 $43,763 $26,164 $17,168 $20,226 $10,651 $0 $124,795
Travel to and from farms $1,256 $2,591 $3,746 $3,199 $3,442 $6,632 $3,273 $21,882 $21,803 $21,459 $50,564 $53,257 $41,284 $234,388
Operating costs $31,653 $33,906 $51,845 $44,275 $75,677 $60,912 $61,389 $133,428 $123,921 $112,546 $197,199 $213,030 $196,097 $1,335,877
Overhead and delivery (50% of operating costs) $24,823 $27,052 $41,465 $35,410 $83,210 $75,888 $74,485 $398,474 $396,807 $399,904 $356,967 $374,118 $353,646 $2,642,248
Regional Development Program $0 $0 $1,889 $1,613 $8,115 $7,271 $7,013 $19,723 $18,270 $18,160 $0 $0 $0 $82,052
Dairy Research Foundation $598 $653 $944 $806 $4,057 $3,635 $3,507 $9,861 $9,135 $9,080 $0 $0 $0 $42,278
University of Sydney
Staff $6,408 $20,852 $31,572 $43,720 $54,611 $49,882 $49,059 $368,267 $407,643 $423,694 $303,064 $267,033 $245,754 $2,271,558
Infrastructure support (laboratory, facilities etc.) $5,136 $6,657 $10,080 $13,958 $12,983 $11,633 $11,221 $248,803 $261,338 $263,904 $204,180 $205,000 $200,000 $1,454,894
University of Melbourne
Contribution $1,239 $1,354 $2,050 $0 $0 $0 $0 $0 $0 $0 $0 $0 $0 $4,643
New South Wales Department of Primary Industries
Staff $16,655 $19,204 $29,580 $18,254 $29,726 $27,329 $27,051 $548,682 $592,853 $631,189 $0 $0 $0 $1,940,523
Monetary contribution - contributes to research and communication $0 $0 $0 $0 $33,587 $30,864 $30,546 $177,227 $188,049 $196,561 $0 $0 $0 $656,834
Capital $128,691 $0 $0 $0 $0 $0 $0 $0 $0 $0 $0 $0 $0 $128,691
Overheads $15,038 $16,427 $24,871 $15,348 $0 $0 $0 $205,412 $205,619 $202,761 $0 $0 $0 $685,477
Total costs (by contributor)
Dairy Australia $74,468 $81,155 $124,395 $106,231 $261,801 $238,570 $233,974 $1,225,005 $1,217,827 $1,226,953 $1,070,901 $1,122,353 $1,060,939 $8,044,570
University of Sydney $11,544 $27,510 $41,651 $57,679 $67,594 $61,515 $60,280 $617,069 $668,981 $687,598 $507,244 $472,033 $445,754 $3,726,452
University of Melbourne $1,239 $1,354 $2,050 $0 $0 $0 $0 $0 $0 $0 $0 $0 $0 $4,643
New South Wales Department of Primary Industries $160,385 $35,631 $54,451 $33,602 $63,312 $58,194 $57,597 $931,322 $986,521 $1,030,511 $0 $0 $0 $3,411,526
Grand total $247,636 $145,649 $222,547 $197,512 $392,707 $358,279 $351,851 $2,773,396 $2,873,330 $2,945,062 $1,578,145 $1,594,386 $1,506,693 $15,187,192
Total costs (by cost type) 2004/05 2005/06 2006/07 2007/08 2008/09 2009/10 2010/11 2011/12 2012/13 2013/14 2014/15 2015/16 2016/17
University of Sydney staff, equipment, travel and other $61,189 $81,613 $124,581 $128,500 $246,185 $224,197 $219,769 $1,443,601 $1,490,001 $1,514,647 $1,221,178 $1,220,268 $1,153,047 $9,128,775
Dairy Australia overhead and delivery (50% of operating costs) $24,823 $27,052 $41,465 $35,410 $83,210 $75,888 $74,485 $398,474 $396,807 $399,904 $356,967 $374,118 $353,646 $2,642,248
New South Wales Department of Primary Industries staff, overheads and other$160,385 $35,631 $54,451 $33,602 $63,312 $58,194 $57,597 $931,322 $986,521 $1,030,511 $0 $0 $0 $3,411,526
University of Melbourne $1,239 $1,354 $2,050 $0 $0 $0 $0 $0 $0 $0 $0 $0 $0 $4,643
Total $247,636 $145,649 $222,547 $197,512 $392,707 $358,279 $351,851 $2,773,396 $2,873,330 $2,945,062 $1,578,145 $1,594,386 $1,506,693 $15,187,192

Dairy Australia Economic evaluation of the Automatic Milking System component of the Future Dairy Program
ES.28
MARSDEN JACOB ASSOCIATES
5.4 Future expenditures
Dairy Australia indicated that Future Dairy expenditures are estimate to be $434,000 in annual
extension costs. It is assumed that this cost occurs for five years in the future (2018 to 2022).

Dairy Australia Economic evaluation of the Automatic Milking System component of the Future Dairy Program
ES.29
MARSDEN JACOB ASSOCIATES
6. Net benefits
6.1 Base case net benefits from AMS program investment
The base case net benefits are estimated to be -$7.5 million (Table 5) in present value terms with a
benefit cost ratio of 0.56, assuming a 30 year forward time horizon and a real discount rate of 5%.
These net benefits are both ex-post and ex-ante as they include both historical and future costs and
benefits. The base case net benefits at ‘final year’ (i.e. year 2017) are estimated to be very small as
most of the benefits occur in the future. We note that there is a quantum of knowledge and R and D
experiences that could provide an option value for further R and D investment in the future. We
capture the value of the existing quantum of knowledge within our underpinning assumptions that
relate to the impacts on future avoided costs to farms adopting AMS. However, this estimate does not
include any consideration of the option value this knowledge might have to leverage further scientific
and management ‘break throughs’ in the future. This is beyond the scope of this study and would
require consideration of future R and D investment costs that would be required to leverage it.
Table 5: Net Benefits summary over different time horizons
The composition of net benefits assuming a 30 year forward horizon is illustrated in Table 6.
Time horizon Net benefits
($m)
Benefit cost
ratio
Internal rate
of return
Modified
internal rate
of return
At 'final year' -$14.6 0.04 n.a. -100%
5 year forward horizon -$12.5 0.27 n.a. -7%
10 year forward horizon -$9.2 0.46 -7% 0%
20 year forward horizon -$7.5 0.56 -3% 2%
30 year forward horizon -$7.5 0.56 -3% 3%

Dairy Australia Economic evaluation of the Automatic Milking System component of the Future Dairy Program
ES.30
MARSDEN JACOB ASSOCIATES
Table 6: Net Benefits summary results
Source: Marsden Jacob analysis
6.2 Ex-ante net benefits
If historical costs are excluded, net benefits are estimated to be $7.1 million with a benefit cost ratio
of 4.8 (Table 6). This approach is purely ex-ante as historical costs are not included in the benefit
costs analysis. Estimating net benefits in this way is useful to provide guidance on the net benefit of
continuing with extension activities.
Table 7: Net Benefits summary results
Source: Marsden Jacob analysis
$m Base case
Incremental benefits ($m)
Avoided transition costs $4.8
Avoided cost of failure $4.8
Total benefits $9.5
Incremental costs ($m)
University of Sydney staff, equipment, travel and other -$9.1
Dairy Australia overhead and delivery (50% of operating costs) -$2.6
New South Wales Department of Primary Industries staff, overheads and other -$3.4
Future extension costs -$1.9
Total costs -$17.1
Net benefits ($m) -$7.5
Benefit-cost ratio 0.56
Internal rate of return -3%
Modified internal rate of return 3%
$m Base case
Incremental benefits ($m)
Avoided transition costs $4.2
Avoided cost of failure $4.8
Total benefits $8.9
Incremental costs ($m)
Future extension costs -$1.9
Total costs -$1.9
Net benefits ($m) $7.1
Benefit-cost ratio 4.8

Dairy Australia Economic evaluation of the Automatic Milking System component of the Future Dairy Program
ES.31
MARSDEN JACOB ASSOCIATES
6.3 Other observations
The AMS component of the Future Dairy program provides a number of insights into the challenges
of investing in prospective technology near or at commercial demonstration.
In the program’s early phases the program provided important public good functions by addressing
core information gaps and asymmetries. This included undertaking research to:
develop core farm system technologies to enable proof of concept;
refine on farm system technologies to demonstrate the practicality of AMS; and
provide implementation solutions in pasture based systems.
These provided private benefits to the small number of farmers that did adopt AMS, but also for those
in future that may or may not adopt, but draw on this information. While farmers over time would
have naturally gravitated to these solutions, the adoption process would have taken longer and cost
more to the industry than without the FD program.
A challenge for Dairy Australia is to carefully weigh its role in commercialisation of technologies in a
partnered investment environment. Arguably aspects of the program over time stretched beyond pure
research and development and more deeply into commercialisation problems where private benefits
tended to outweigh public benefits.
In these circumstances, it could be valuable for Dairy Australia to develop investment guidelines and
consider formation of appropriate institutions to transition investments and property rights overtime
from research and development to commercialisation and to ensure an appropriate balance of cost and
profit sharing.

Dairy Australia Economic evaluation of the Automatic Milking System component of the Future Dairy Program
ES.32
MARSDEN JACOB ASSOCIATES
7. Sensitivity analysis
The sensitivity of the results to variations for three key variables is summarised in Table 8. These key
variables relate to:
AMS adoption rate;
Profit reduction during transition;
Farmers influenced by Future Dairy during their transition phase; and
Failure rate without the Future Dairy program.
The upper and lower bound range for these variables reflects the level of uncertainty over their values.
The sensitivity analysis indicates that the adoption rate, profit reduction during transition and failure
rate without the program have the most impact on net benefits within the plausible range for these
variables. The upper bound for adoption rates increases the benefit cost ratio to 0.82 while the upper
bound for profit reduction during transition increases the benefit cost ratio to 0.73.
Interestingly, the adoption rate would have to be around 85 per cent higher than base case levels for
the benefit cost ratio to be equal to 1.
Using these same four variables, the worst case is estimated to result in a benefit cost ratio of 0.12
while the best case results in 1.42 (Table 8). While the best case results in a benefit cost ratio greater
than 1 and is within the plausible range of values, the best case result requires several optimistic
assumptions all to be true.

Dairy Australia Economic evaluation of the Automatic Milking System component of the Future Dairy Program
ES.33
MARSDEN JACOB ASSOCIATES
Table 8: Sensitivity of results to cost and price assumptions
Source: Marsden Jacob analysis
Net
benefits
($m)
Benefit
cost ratio
Internal
rate of
return
Modified
internal
rate of
return
AMS adoption rate
Base case Base case -$7.52 0.56 -3% 3%
Adoption rates are 50% lower than
base case beyond 201750% -$11.98 0.30 -9% 0%
Adoption rates are 50% higher than
base case beyond 2017150% -$3.05 0.82 1% 4%
Profit reduction during transition
Base case (12.1%) Base case -$7.52 0.56 -3% 3%
5.1% 5% -$10.41 0.39 -7% 2%
19.1% 19% -$4.66 0.73 0% 4%
Farmers influenced by Future Dairy
during transition
Base case Base case -$7.52 0.56 -3% 3%
70% 70% -$8.36 0.51 -4% 2%
100% 100% -$6.68 0.61 -2% 3%
Failure rate without program
Base case Base case -$7.52 0.56 -3% 3%
15% 15% -$10.00 0.41 -5% 2%
25% 25% -$4.82 0.72 -1% 4%
Best case
$7.20 1.42 7% 6%
Best case assumptions
Adoption rate Adoption rates
are 50% higher
than base case
beyond 2017
Profit reduction during transition 20%
Farmers influenced by Future Dairy during
transition
100%
Failure rate without the program 25%
Worst case
-$15.00 0.12 n.a. -2%
Worst case assumptions
Adoption rate Adoption rates
are 50% lower
than base case
beyond 2017
Profit reduction during transition 6%
Farmers influenced by Future Dairy during
transition
70%
Failure rate without program 15%
Best case result
Worst case result

Dairy Australia Economic evaluation of the Automatic Milking System component of the Future Dairy Program
ES.34
MARSDEN JACOB ASSOCIATES
8. Cash flows
Cash flows created under base case assumptions are provided in Table 9.
Table 9: Whole of life base case cash flows for the Future Dairy program
Benefits and costs BASE CASE
Finance and reinvestment rate 5%
-3%
Modified IRR 3%
Real dollars ($m)
Base year is 2017
-12 -11 -10 -9 -8 -7 -6 -5 -4 -3 -2 -1 0 1 2 3 4 5 6 7 8 9 10 11 12 13 14 15 16 17 18 19 20 21 22 23 24 25 26 27 28 29 30
2005 2006 2007 2008 2009 2010 2011 2012 2013 2014 2015 2016 2017 2018 2019 2020 2021 2022 2023 2024 2025 2026 2027 2028 2029 2030 2031 2032 2033 2034 2035 2036 2037 2038 2039 2040 2041 2042 2043 2044 2045 2046 2047
INCREMENTAL BENEFITS
Avoided transition costs $0.0 $0.0 $0.0 $0.0 $0.1 $0.1 $0.0 $0.0 $0.0 $0.0 $0.1 $0.1 $0.1 $0.2 $0.2 $0.2 $0.2 $0.2 $0.5 $0.5 $0.5 $0.5 $0.5 $0.6 $0.6 $0.6 $0.6 $0.6 $0.0 $0.0 $0.0 $0.0 $0.0 $0.0 $0.0 $0.0 $0.0 $0.0 $0.0 $0.0 $0.0 $0.0 $0.0
Avoided cost of failure $0.0 $0.0 $0.0 $0.0 $0.0 $0.0 $0.0 $0.0 $0.0 $0.0 $0.0 $0.0 $0.0 $0.7 $0.7 $0.7 $0.7 $0.8 $0.8 $0.6 $0.5 $0.3 $0.2 $0.0 $0.0 $0.0 $0.0 $0.0 $0.0 $0.0 $0.0 $0.0 $0.0 $0.0 $0.0 $0.0 $0.0 $0.0 $0.0 $0.0 $0.0 $0.0 $0.0
Total benefits $0.0 $0.0 $0.0 $0.0 $0.1 $0.1 $0.0 $0.0 $0.0 $0.0 $0.1 $0.1 $0.1 $0.9 $0.9 $0.9 $0.9 $1.0 $1.3 $1.1 $1.0 $0.8 $0.7 $0.6 $0.6 $0.6 $0.6 $0.6 $0.0 $0.0 $0.0 $0.0 $0.0 $0.0 $0.0 $0.0 $0.0 $0.0 $0.0 $0.0 $0.0 $0.0 $0.0
INCREMENTAL COSTS
University of Sydney staff, equipment, travel and other -$0.1 -$0.1 -$0.1 -$0.1 -$0.2 -$0.2 -$0.2 -$1.4 -$1.5 -$1.5 -$1.2 -$1.2 -$1.2
Dairy Australia overhead and delivery (50% of operating costs)$0.0 $0.0 $0.0 $0.0 -$0.1 -$0.1 -$0.1 -$0.4 -$0.4 -$0.4 -$0.4 -$0.4 -$0.4
New South Wales Department of Primary Industries staff, overheads and other-$0.2 $0.0 -$0.1 $0.0 -$0.1 -$0.1 -$0.1 -$0.9 -$1.0 -$1.0 $0.0 $0.0 $0.0
University of Melbourne $0.0 $0.0 $0.0 $0.0 $0.0 $0.0 $0.0 $0.0 $0.0 $0.0 $0.0 $0.0 $0.0
Future extension costs -$0.4 -$0.4 -$0.4 -$0.4 -$0.4 $0.0 $0.0 $0.0 $0.0 $0.0 $0.0 $0.0 $0.0 $0.0 $0.0 $0.0 $0.0 $0.0 $0.0 $0.0 $0.0 $0.0 $0.0 $0.0 $0.0 $0.0 $0.0 $0.0 $0.0 $0.0
Total costs -$0.2 -$0.1 -$0.2 -$0.2 -$0.4 -$0.4 -$0.4 -$2.8 -$2.9 -$2.9 -$1.6 -$1.6 -$1.5 -$0.4 -$0.4 -$0.4 -$0.4 -$0.4 $0.0 $0.0 $0.0 $0.0 $0.0 $0.0 $0.0 $0.0 $0.0 $0.0 $0.0 $0.0 $0.0 $0.0 $0.0 $0.0 $0.0 $0.0 $0.0 $0.0 $0.0 $0.0 $0.0 $0.0 $0.0
NET BENEFITS -$0.2 -$0.1 -$0.2 -$0.2 -$0.3 -$0.3 -$0.3 -$2.7 -$2.8 -$2.9 -$1.5 -$1.5 -$1.4 $0.4 $0.5 $0.5 $0.5 $0.5 $1.3 $1.1 $1.0 $0.8 $0.7 $0.6 $0.6 $0.6 $0.6 $0.6 $0.0 $0.0 $0.0 $0.0 $0.0 $0.0 $0.0 $0.0 $0.0 $0.0 $0.0 $0.0 $0.0 $0.0 $0.0
Discounted dollars ($m)
-12 -11 -10 -9 -8 -7 -6 -5 -4 -3 -2 -1 0 1 2 3 4 5 6 7 8 9 10 11 12 13 14 15 16 17 18 19 20 21 22 23 24 25 26 27 28 29 30
2005 2006 2007 2008 2009 2010 2011 2012 2013 2014 2015 2016 2017 2018 2019 2020 2021 2022 2023 2024 2025 2026 2027 2028 2029 2030 2031 2032 2033 2034 2035 2036 2037 2038 2039 2040 2041 2042 2043 2044 2045 2046 2047 TOTAL
INCREMENTAL BENEFITS
Avoided transition costs $0.0 $0.0 $0.0 $0.0 $0.1 $0.1 $0.0 $0.0 $0.0 $0.0 $0.1 $0.1 $0.1 $0.2 $0.2 $0.2 $0.2 $0.2 $0.4 $0.3 $0.3 $0.3 $0.3 $0.4 $0.3 $0.3 $0.3 $0.3 $0.0 $0.0 $0.0 $0.0 $0.0 $0.0 $0.0 $0.0 $0.0 $0.0 $0.0 $0.0 $0.0 $0.0 $0.0 $4.8
Avoided cost of failure $0.0 $0.0 $0.0 $0.0 $0.0 $0.0 $0.0 $0.0 $0.0 $0.0 $0.0 $0.0 $0.0 $0.6 $0.6 $0.6 $0.6 $0.6 $0.6 $0.5 $0.3 $0.2 $0.1 $0.0 $0.0 $0.0 $0.0 $0.0 $0.0 $0.0 $0.0 $0.0 $0.0 $0.0 $0.0 $0.0 $0.0 $0.0 $0.0 $0.0 $0.0 $0.0 $0.0 $4.8
Total benefits $0.0 $0.0 $0.0 $0.0 $0.1 $0.1 $0.0 $0.0 $0.0 $0.0 $0.1 $0.1 $0.1 $0.8 $0.8 $0.8 $0.8 $0.8 $1.0 $0.8 $0.7 $0.5 $0.4 $0.4 $0.3 $0.3 $0.3 $0.3 $0.0 $0.0 $0.0 $0.0 $0.0 $0.0 $0.0 $0.0 $0.0 $0.0 $0.0 $0.0 $0.0 $0.0 $0.0 $9.5
INCREMENTAL COSTS
University of Sydney staff, equipment, travel and other -$0.1 -$0.1 -$0.1 -$0.1 -$0.2 -$0.2 -$0.2 -$1.4 -$1.5 -$1.5 -$1.2 -$1.2 -$1.2 -$9.1
Dairy Australia overhead and delivery (50% of operating costs)$0.0 $0.0 $0.0 $0.0 -$0.1 -$0.1 -$0.1 -$0.4 -$0.4 -$0.4 -$0.4 -$0.4 -$0.4 -$2.6
New South Wales Department of Primary Industries staff, overheads and other-$0.2 $0.0 -$0.1 $0.0 -$0.1 -$0.1 -$0.1 -$0.9 -$1.0 -$1.0 $0.0 $0.0 $0.0 -$3.4
University of Melbourne $0.0 $0.0 $0.0 $0.0 $0.0 $0.0 $0.0 $0.0 $0.0 $0.0 $0.0 $0.0 $0.0 $0.0
Future extension costs -$0.4 -$0.4 -$0.4 -$0.4 -$0.3 $0.0 $0.0 $0.0 $0.0 $0.0 $0.0 $0.0 $0.0 $0.0 $0.0 $0.0 $0.0 $0.0 $0.0 $0.0 $0.0 $0.0 $0.0 $0.0 $0.0 $0.0 $0.0 $0.0 $0.0 $0.0 -$1.9
Total costs -$0.2 -$0.1 -$0.2 -$0.2 -$0.4 -$0.4 -$0.4 -$2.8 -$2.9 -$2.9 -$1.6 -$1.6 -$1.5 -$0.4 -$0.4 -$0.4 -$0.4 -$0.3 $0.0 $0.0 $0.0 $0.0 $0.0 $0.0 $0.0 $0.0 $0.0 $0.0 $0.0 $0.0 $0.0 $0.0 $0.0 $0.0 $0.0 $0.0 $0.0 $0.0 $0.0 $0.0 $0.0 $0.0 $0.0 -$17.1
NET BENEFITS -$0.2 -$0.1 -$0.2 -$0.2 -$0.3 -$0.3 -$0.3 -$2.7 -$2.8 -$2.9 -$1.5 -$1.5 -$1.4 $0.4 $0.4 $0.4 $0.4 $0.4 $1.0 $0.8 $0.7 $0.5 $0.4 $0.4 $0.3 $0.3 $0.3 $0.3 $0.0 $0.0 $0.0 $0.0 $0.0 $0.0 $0.0 $0.0 $0.0 $0.0 $0.0 $0.0 $0.0 $0.0 $0.0 -$7.5
Benefit-cost ratio 0.56
IRR
Time from base year (years)
Year
Time from base year (years)
Year

Insert Client name Use second line for project title
1.
9. References
Martin, P, Shafron, W and Phillips, P 2017, Farm performance: broadacre and dairy farms,
2014–15 to 2016–17, ABARES, Canberra.
Davies, L, Alford, A, Kerrisk, K, Garcia, S. no date, Economics of Automatic Milking Systems,
FutureDairy, Dairy Australia, p.13.
Kenny, S and Eastwood, C 2011, AMS Integration Draft Report, Report to Dairy Australia.
Kerrisk, K and Lyons, N 2016, Break down of Australian AMS farms by transition experience
pers comms quoted in Davies et al.
Lightfoot, C and Mulvaney, J 2002, Farm Systems for Automatic Milking in Australia, Report
prepared for the Dairy Research Development Corporation.
Nicon Rural Services 2017, The experience of Automatic Milking Systems (AMS) – Findings
From In Depth Interviews, Report to Dairy Australia.
Taing, W 2016, The economic viability of automatic milking systems in Australia’s pastured
based dairy farm systems: A case study approach, Master of Philosophy Thesis, University of
Melbourne.

Insert Client name Use second line for project title
2.
Appendix 1: Online survey
Survey questionnaire
The Marsden Jacob survey monkey questionnaire included the following questions:
1. What year did you first adopt (commence installing) robotic milking?
2. What type of robotic system (AMS) did you install?
Rotary
Box x 2 (or less)
Box x 3
Box x 4+
When did you install them?
3. Did you add additional boxes at a later stage?
1 box
2 boxes
3 or more boxes
Comment
4. Prior to adopting robotics had you heard about the FutureDairy AMS program?
YES
NO
Other (please specify)
5. If you responded 'YES' to the previous question, where?
Web Resources
Printed media (newspapers magazines)
Extension Staff
Field Day or Conference
Other AMS farmers
Equipment suppliers
Other conventional farmers
No applicable

Insert Client name Use second line for project title
3.
Comment
6. Did the FutureDairy resources help you through the decision process to adopt AMS?
YES
NO
7. What resources did you use to help you through changing your farm system?
Management Guidelines
Other Web Resources
Printed media
Research Staff
Conference
Other AMS Farmers
Supplier information
Other (please specify)
Comment
8. Do you think these resources helped with your decision process to adopt AMS sooner than
you would have otherwise, or later than you would have otherwise?
Sooner by 1 year
Sooner by 2 years
Sooner by 3+ years
Later by 1 year
Later by 2 years
Later by 3+ years
No - they did not influence when I would have adopted AMS
Comment
9. Did you access or use the FutureDairy AMS management guidelines?
YES
NO
Comment
10. Did FutureDairy staff assist you at any time with problem solving changes to your AMS
farm system?
YES

Insert Client name Use second line for project title
4.
NO
11. What other external assistance did you receive while problems solving changes to your
AMS farm system?
Robotic supplier or technician
Other AMS farmers
Internet material
Consultant
Other (please specify)
Comment
12. How long did it take you to successfully move to an AMS system (eg. pasture and herd
management) to the point you felt the new AMS farming system was operating successfully?
less than 6 months
6-12 months
12-18 months
18 months -2 years
2 years +
I abandoned implementing AMS
I still don't feel my AMS is operating successfully
Comment
13. What was the total cost of modifying your farm infrastructure to an AMS system excluding
the costs of robotics?
less than $50,000
$50,000 to $100,000
$100,000+
Comment
14. What was the cost of purchasing and installing all your robotic units including ongoing
support services?
$500,000 - $1 million
$1 -1.5 million
$1.5-$2 million +
$2 million+
Comment
Insert Client name Use second line for project title
5.
15. How did the period of moving to an AMS system impact on your farm profitability-
(exclude the impact of capital costs of installation, seasonal factors and unrelated changes to
milk prices)?
My farm profit rose
My farm profit fell
My farm profit did not change
Not Applicable
Comment
16. If you responded by clicking 'my farm profit rose' or 'my profit farm fell' to the previous
question, how great was the change?
5%
10%
15%
20% +
Not Applicable
Comment
17. Did using industry resources, staff or information reduce the length of time of moving
successfully to the AMS system (sometimes called the transition time between deciding to adopt
and successfully operating an AMS farm system)?
YES
NO
Comment
18. If you responded YES to the previous question, what would you estimate was the length of
the time reduction?
less than 6 months
6-12 months
12-18 months
18 months -2 years
2 years +
Not Applicable
Comment

Insert Client name Use second line for project title
6.
19. Did using industry resources, staff or information reduce the cost of moving successfully to
an AMS system?
YES
NO
Comment
20. If you responded YES to the previous question, by how much?
less than $20,000
$20,000 -$50,000
$50,000 - $75,000
$75,000 -$100,000
$100,000+
Not Applicable
21. If FutureDairy resources had not been available, would you have engaged someone else to
assist you with moving successfully to an AMS system (assume there were other skilled
providers available)?
YES
NO
Comment
22. If you responded 'YES' to the previous question, how much would you have been willing to
pay someone to assist you with moving successfully to an AMS system?
less than $20,000
$20,000 - $50,000
$50,000 - $75,000
$75,000 - $100,000
$100,000 +
Not Applicable
Comment
23. Knowing now what you do about AMS and were about to embark on installing AMS again
what
would be the dollar value you place on that knowledge?
less than $50,000
$50,000-$100,000
$100,000-150,000

Insert Client name Use second line for project title
7.
$200,000+
I don't know
Results of survey
Summary results produced by Survey Monkey are reproduced below.

Insert Client name Use second line for project title
8.

Insert Client name Use second line for project title
9.

Insert Client name Use second line for project title
10.

Insert Client name Use second line for project title
11.

Insert Client name Use second line for project title
12.

Insert Client name Use second line for project title
13.

Insert Client name Use second line for project title
14.

Insert Client name Use second line for project title
15.

Insert Client name Use second line for project title
16.

Insert Client name Use second line for project title
17.

Insert Client name Use second line for project title
18.