Embed Size (px)
Citation preview
ENV
IRO
NM
ENTA
LSC
IEN
CES
Economic evaluation of sea-level rise adaptationstrongly influenced by hydrodynamic feedbacksMichelle A. Hummela,1 , Robert Griffinb,c , Katie Arkemab,d, and Anne D. Guerryb,d
aDepartment of Civil Engineering, University of Texas at Arlington, Arlington, TX 76019; bThe Natural Capital Project, Stanford University, Stanford,CA 94305; cSchool for Marine Science and Technology, University of Massachusetts Dartmouth, Dartmouth, MA 02747; and dSchool of Environmentaland Forest Sciences, University of Washington, Seattle, WA 98195
Edited by Peter H. Gleick, Pacific Institute for Studies in Development, Environment, and Security, Oakland, CA, and approved May 30, 2021 (received forreview December 17, 2020)
Coastal communities rely on levees and seawalls as critical pro-tection against sea-level rise; in the United States alone, $300billion in shoreline armoring costs are forecast by 2100. However,despite the local flood risk reduction benefits, these structurescan exacerbate flooding and associated damages along otherparts of the shoreline—particularly in coastal bays and estuaries,where nearly 500 million people globally are at risk from sea-level rise. The magnitude and spatial distribution of the economicimpact of this dynamic, however, are poorly understood. Herewe combine hydrodynamic and economic models to assess theextent of both local and regional flooding and damages expectedfrom a range of shoreline protection and sea-level rise scenar-ios in San Francisco Bay, California. We find that protection ofindividual shoreline segments (5 to 75 km) can increase flood-ing in other areas by as much as 36 million m3 and damagesby $723 million for a single flood event and in some cases caneven cause regional flood damages that exceed the local damagesprevented from protection. We also demonstrate that strategicflooding of certain shoreline segments, such as those with grad-ually sloping baylands and space for water storage, can helpalleviate flooding and damages along other stretches of the coast-line. By matching the scale of the economic assessment to thescale of the threat, we reveal the previously uncounted costsassociated with uncoordinated adaptation actions and demon-strate that a regional planning perspective is essential for reduc-ing shared risk and wisely spending adaptation resources incoastal bays.
sea-level rise | adaptation | economic damages | externalities | flooding
Sea-level rise (SLR) threatens to produce more frequent andsevere flooding in coastal regions and is expected to cause
trillions of dollars in damages globally by 2100 if society does nottake action to adapt to this threat (1). Lives and livelihoods areat risk as well; globally, hundreds of millions of people could beexposed to SLR by 2100 (2–4). A critical challenge in respond-ing to this threat is that decisions about strategies for adaptationto coastal flooding are often made by individual communitiesor private entities with limited cross-jurisdictional coordinationand at a scale that does not match the hydrodynamic extent ofthe threat (5–7). Populated coastal areas are coupled human–natural systems, where spatial and temporal interactions betweenhydrodynamics and shoreline modification influence patternsof flooding, erosion, and resulting damage to communities(8, 9). In these settings, individual action tends to impact otherparties (externalities) and yield outcomes different from thosethat would arise from collective decision-making (10), generallyresulting in reduced overall social welfare (11). Even so, col-lective approaches to shoreline adaptation are often hinderedby existing governance structures that rely on local oversightof coastal management or fragmented approaches to projectpermitting and implementation (7).
Spatial externalities are common in coupled human–naturalsystems. High-profile examples include the “dead zone” in theGulf of Mexico and its link to upstream nutrient runoff from agri-
culture carried down the Mississippi, widespread acid rain in thenortheastern United States originating from power plants in theMidwest that led to revisions of the Clean Air Act in 1990, andthe visual impacts on adjacent property owners from the CapeWind offshore wind farm near Nantucket, MA, that led to itseventual demise after more than a decade of litigation. Spatialexternalities are also common and varied in the context of shore-line protection and management. In river systems, it has longbeen known that channel modifications and levee building at onelocation can influence water levels and flood potential at loca-tions both upstream and downstream (12–15). On open coasts,alongshore currents can affect the efficacy of beach nourishmentprojects through mobilization and loss of sediment to neighbor-ing beaches (16, 17). As a result, individual communities maybe incentivized to nourish their beaches less frequently, eitherto avoid paying for sediment that is subsequently lost to under-nourished beaches in neighboring communities or in the hopes ofbenefiting from sediment input from nourishment projects else-where (18). Waves can also interact with protection structures toinduce erosion in adjacent areas (19). A recent study found thatthese interactions reduced property values for adjacent shore-line properties that are ineligible to build their own protectionstructures by 8% on average in coastal Oregon (20).
Shoreline armoring will play a key role in responding to SLRmoving forward. It is forecast to represent nearly 60% of the
Significance
As sea levels rise, coastal cities will rely on shoreline protec-tion strategies such as levees and seawalls to mitigate flood-ing. Although these strategies provide local flood-reductionbenefits, they can increase inundation along other shore-lines within the same estuary or bay. Using hydrodynamicand economic models, we quantify previously unmeasuredregional economic damages (up to $723 million per floodevent) that result from the protection of individual shore-line segments in San Francisco Bay, CA. We also highlightand quantify opportunities to alleviate regional flood dam-age through strategic floodwater storage in low-lying areas.Integrating the findings into coordinated planning efforts thataccount for the regional impacts of local shoreline actionscould provide opportunities to reduce shared risk in coastalregions globally.
Author contributions: M.A.H., R.G., K.A., and A.D.G. designed research; M.A.H. and R.G.performed research; M.A.H. and R.G. analyzed data; and M.A.H., R.G., K.A., and A.D.G.wrote the paper.y
The authors declare no competing interest.y
This article is a PNAS Direct Submission.y
This open access article is distributed under Creative Commons Attribution License 4.0(CC BY).y1 To whom correspondence may be addressed. Email: [email protected]
This article contains supporting information online at https://www.pnas.org/lookup/suppl/doi:10.1073/pnas.2025961118/-/DCSupplemental.y
Published July 12, 2021.
PNAS 2021 Vol. 118 No. 29 e2025961118 https://doi.org/10.1073/pnas.2025961118 | 1 of 10
Dow
nloa
ded
by g
uest
on
Dec
embe
r 22
, 202
1
roughly $500 billion in US adaptation costs by 2100 (21). Despiteevidence for a wide range of spillover effects resulting fromshoreline modification and the billions in planned expenditureson these modifications, there is limited understanding abouthow they influence shared economic risk across the coastal zone(5). Erosion and beach nourishment are better understood thancoastal flooding, where the only economic assessment of exter-nalities is on the performance of critical infrastructure systems(22, 23).
To address these gaps and account for the physical and eco-nomic impacts of flooding on communities, here we coupledynamic simulations of coastal inundation with models of build-ing damage to examine flood damage externalities expectedunder a range of shoreline modification and SLR scenarios.We focus on the densely populated San Francisco Bay Area,as bay and estuarine systems in particular are characteristicof coastal locations that feature regional coastal hydrodynamicinteractions. In these settings, engineered protection can leadto amplification of water levels, cause additional flooding inother locations, and in some cases adversely affect coastal veg-etation and the shoreline protection benefits it provides (24, 25).Conversely, shoreline modification to strategically store water
can have the opposite effect, providing dissipation that attenu-ates water levels and produces regional flood reduction benefits(26–30). Bays and estuaries represent 21% of overall shorelinelength and 54% of global population at risk from SLR andflooding—nearly half a billion people (see Materials and Meth-ods). These densely populated areas with complex jurisdictionalboundaries are increasingly facing difficult and expensive deci-sions that demand a better understanding of shared risk alongthe coastline.
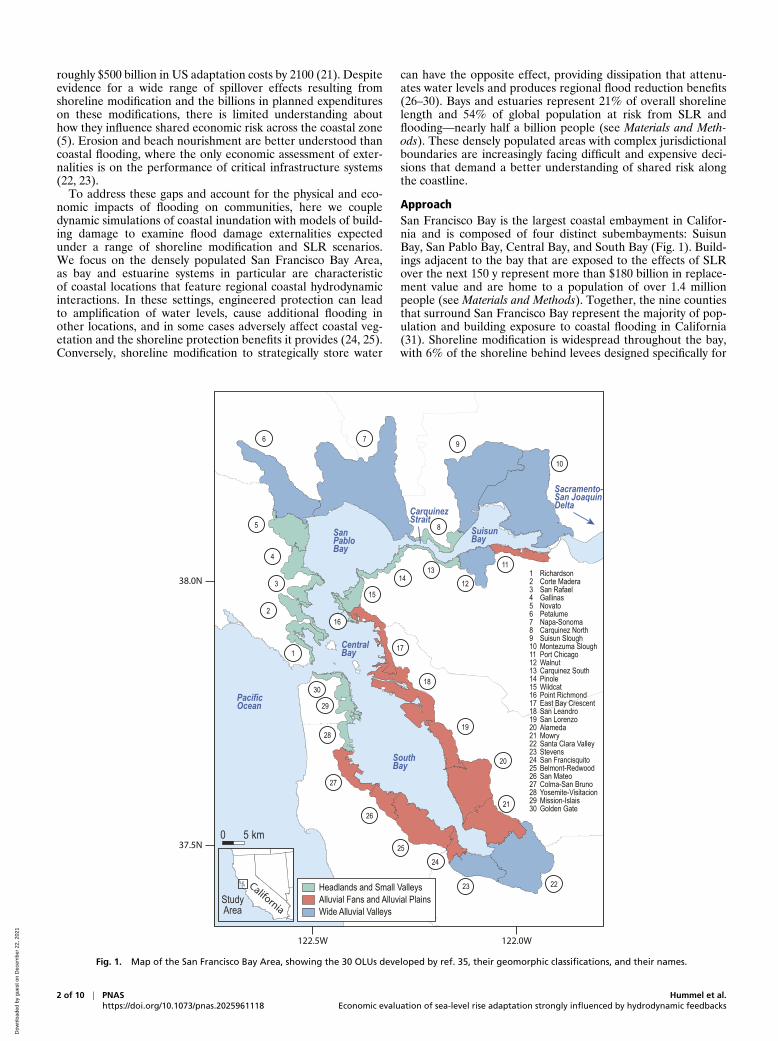
ApproachSan Francisco Bay is the largest coastal embayment in Califor-nia and is composed of four distinct subembayments: SuisunBay, San Pablo Bay, Central Bay, and South Bay (Fig. 1). Build-ings adjacent to the bay that are exposed to the effects of SLRover the next 150 y represent more than $180 billion in replace-ment value and are home to a population of over 1.4 millionpeople (see Materials and Methods). Together, the nine countiesthat surround San Francisco Bay represent the majority of pop-ulation and building exposure to coastal flooding in California(31). Shoreline modification is widespread throughout the bay,with 6% of the shoreline behind levees designed specifically for
0 5 km
1
30PacificOcean
SanPabloBay
9
8
76
5
4
3
2
29
28
27
26
25
24
23 22
21
20
19
18
17
15
16
1413
12
11
10
CentralBay
SouthBay
SuisunBay
StudyArea
California
123456789101112131415161718192021222324252627282930
RichardsonCorte MaderaSan RafaelGallinasNovatoPetalumeNapa-SonomaCarquinez NorthSuisun SloughMontezuma SloughPort ChicagoWalnutCarquinez SouthPinoleWildcatPoint RichmondEast Bay CrescentSan LeandroSan LorenzoAlamedaMowrySanta Clara ValleyStevensSan FrancisquitoBelmont-RedwoodSan MateoColma-San BrunoYosemite-VisitacionMission-IslaisGolden Gate
CarquinezStrait
Sacramento-San JoaquinDelta
122.5W 122.0W
37.5N
38.0N
Headlands and Small Valleys
Wide Alluvial ValleysAlluvial Fans and Alluvial Plains
Fig. 1. Map of the San Francisco Bay Area, showing the 30 OLUs developed by ref. 35, their geomorphic classifications, and their names.
2 of 10 | PNAShttps://doi.org/10.1073/pnas.2025961118
Hummel et al.Economic evaluation of sea-level rise adaptation strongly influenced by hydrodynamic feedbacks
Dow
nloa
ded
by g
uest
on
Dec
embe
r 22
, 202
1
ENV
IRO
NM
ENTA
LSC
IEN
CES
flood protection and 75% of the shoreline modified as berms,embankments, transportation infrastructure, or other engineer-ing that affects flooding and flood routing (32). Recent modelingstudies of shoreline adaptation and SLR in San Francisco Bayhave demonstrated that shoreline protection using engineeredstructures like seawalls can cause amplification of the tides byreducing frictional damping in shallow areas along the perimeterof the bay and enhancing reflection of the incoming tidal wave atthe shoreline (26, 28, 29). These changes in tidal amplitude caninfluence the magnitude and spatial distribution of peak waterlevels and inundation around the bay.
To assess the distribution of regional economic impacts associ-ated with local-scale shoreline protection from SLR, we quantifythe spatial change in inundation and economic damages fromimplementing protection strategies in the San Francisco BayArea under four SLR scenarios (50, 100, 150, and 200 cm abovea January 2010 baseline). SLR projections for San FranciscoBay suggest a likely range (67% probability) of 30 to 104 cmof SLR above the 1991 to 2009 mean by 2100 (33), althoughSLR exceeding 200 cm is also possible under rapid Antarc-tic ice-sheet melt (34). For each SLR scenario we simulate anexisting shoreline scenario that includes all present-day infras-tructure, as well as 30 shoreline modification scenarios in whicha single segment of the shoreline is completely protected by aseawall while the rest of the shoreline is maintained as is, suchthat it remains vulnerable to flooding where not currently pro-tected. For all SLR and shoreline modification scenarios weassume no landward migration of the shoreline. The 30 shore-line segments are based on operational landscape units (OLUs)delineated by ref. 35 along the San Francisco Bay shoreline toinform SLR adaptation planning (Fig. 1). These OLUs repre-sent terrestrial and coastal regions, ranging in coastline lengthfrom 5 to 75 km, with similar physical and ecological processesthat together provide a cohesive set of ecosystem functionsand similar adaptation possibilities (36). These are classifiedinto one of three geomorphic categories that account for thegeologic history of the region and its influence on landscape fea-tures. Wide alluvial valleys are characterized by wide baylandsand gradual slopes, alluvial fans and alluvial plains consist ofbaylands of intermediate width and moderate slopes, and head-lands and small valleys exhibit narrow baylands and steep slopes(35) (SI Appendix, Fig. S1).
We use a two-dimensional, depth-averaged hydrodynamicmodel of San Francisco Bay (37, 38) to simulate tidal circulationand interactions with the bay shorelines for each scenario (seeMaterials and Methods). Changes in tidal dynamics and bay waterlevels resulting from these modeled scenarios are described inref. 29. Here, we extract spatially varying maximum water depthsfrom the model at high tide during a spring tide cycle to captureinundation in areas that experience tidal flooding or permanentinundation. We integrate these values across the land area tofind the total volume of flood water in each OLU in each sce-nario. Comparing this flood volume to similarly derived volumeestimates for the existing shoreline scenario at the same SLRprovides spatially explicit estimates of internal (within the pro-tected OLU) and external (in other OLUs) tidal flooding foreach shoreline protection scenario. To estimate associated eco-nomic impacts from this flooding, we overlay the flood depthmaps with building stock data from the HAZUS flood model(39) and use depth-damage curves to compute changes in dam-ages between the existing and protected shoreline scenarios fora one-off flood event. We use the existing building stock datato estimate economic damages and do not attempt to forecastfuture changes in land use or shoreline habitat distribution inthe region. The combined flood and damage results allow for ananalysis of the spatial extent of interactions, from local effectson neighboring OLUs in the same subembayment to regional orbaywide effects.
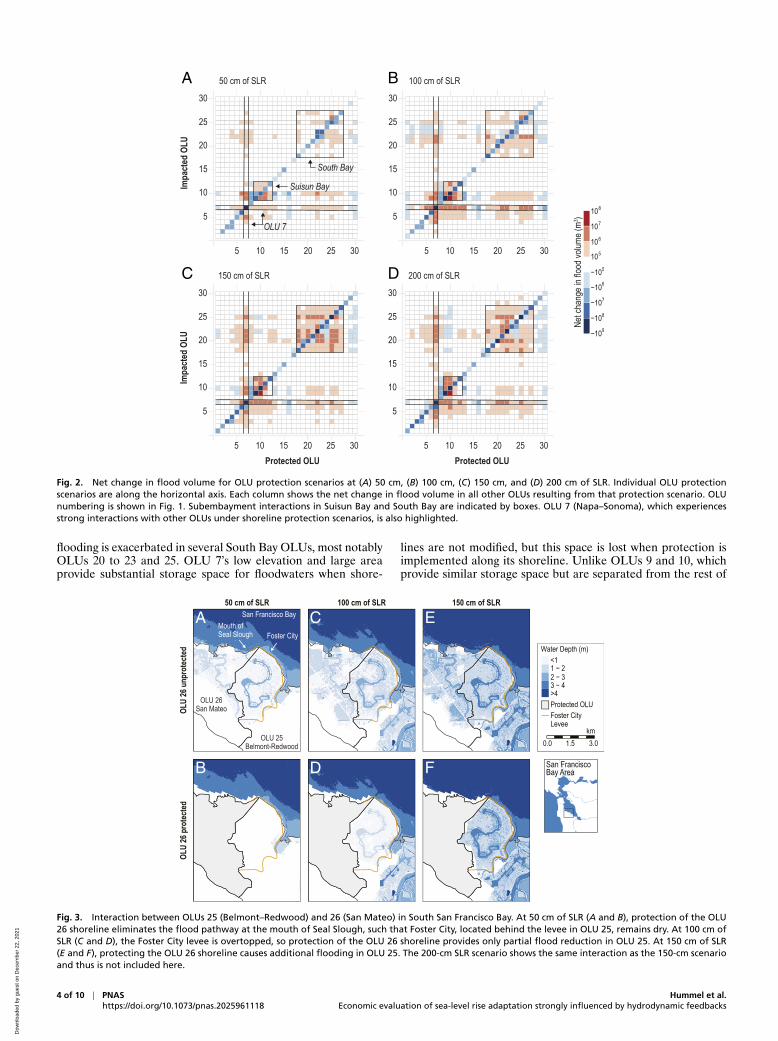
Effect of Shoreline Protection Scenarios on InundationOLU Interactions. Fig. 2 summarizes the flood impacts due to themodeled shoreline protection scenarios at (A) 50 cm, (B) 100 cm,(C) 150 cm, and (D) 200 cm of SLR. The OLU protection scenar-ios are listed along the horizontal axis. Each column shows thenet change in flood volume in all other OLUs resulting from thatprotection scenario. OLU numbering is shown in Fig. 1. Valuesalong the diagonal represent the reduction in internal floodingin the protected OLU as compared to the existing shoreline sce-nario and range from −1,900 m3 for OLU 30 (Golden Gate) at50 cm of SLR to −551 million m3 for OLU 7 (Napa–Sonoma) at200 cm of SLR.
Off-diagonal values represent protection-induced externalflooding in other OLUs, which is generally greatest betweenOLUs in the same subembayment. In Suisun Bay (OLUs 9 to 12),protection and subsequent loss of floodwater storage capacity inany one OLU typically leads to an increase in flooding in otherOLUs. For example, when OLU 10 (Montezuma Slough) pro-tects its shoreline, flooding in OLU 9 (Suisun Slough) increasesby almost 30 million m3 at 100 cm of SLR, as water that formerlyflooded OLU 10 is redirected elsewhere. In South Bay (OLUs 18to 27), protection of certain OLUs similarly exacerbates floodingin other South Bay OLUs, although the magnitude of interac-tions is smaller, with a maximum increase of 4.2 million m3 offlooding in OLU 20 (Alameda) due to protection of OLU 22(Santa Clara Valley) at 200 cm of SLR.
Notably, protection of South Bay OLUs can lead to a reduc-tion in flooding in neighboring OLUs under certain SLR scenar-ios (Fig. 2), as flood pathways across lateral OLU boundariesstretching inland from the coast are eliminated. For example,Foster City, which is part of OLU 25 (Belmont–Redwood) (Fig.3), is surrounded by a levee that provides full protection fromdirect coastal flooding at 50 cm of SLR. However, the elevatedsea level pushes additional water into the mouth of a neighbor-ing channel, Seal Slough, along the shoreline of OLU 26 (SanMateo), which leads to widespread flooding behind the levee inOLU 25 (Fig. 3A). With protection of the shoreline of OLU 26comes elimination of the flood pathway at the mouth of SealSlough, such that Foster City remains dry (Fig. 3B), leading toa reduction of 6.5 million m3 of flooding for OLU 25 due to pro-tection in OLU 26. At 100 cm of SLR, parts of the Foster Citylevee are overtopped, causing direct flooding along the shorelineof OLU 25 (Fig. 3C). However, protecting OLU 26 still providessubstantial benefits for OLU 25 (Fig. 3D), reducing flooding by5.5 million m3. At 150 cm of SLR and higher these benefitsare lost; protecting OLU 26 leads to an additional 1.1 millionm3 of flooding in OLU 25 (Fig. 3F) compared with the existingshoreline scenario (Fig. 3E). As this example demonstrates, theexternal impact of shoreline protection may change over time asSLR progresses.
Some OLU protection scenarios also cause external floodingthat extends regionally to other subembayments. These cross-embayment interactions are most notable between OLU 7 inSan Pablo Bay and OLUs in Suisun Bay and South Bay (Fig.2). In both cases, the physical characteristics and geographiclocation of OLU 7 play an important role in its relationship toregional inundation patterns. When OLUs in Suisun Bay are pro-tected, tides propagating from the ocean inlet landward towardthe Sacramento–San Joaquin Delta interact with the shorelineinfrastructure to create feedbacks that affect the down-estuary(seaward) water level response and cause additional flooding inOLU 7. Protecting the OLU 7 shoreline similarly leads to addi-tional flooding up-estuary (landward) in Suisun Bay, particularlyin OLUs 9 and 10. The relationship between South Bay OLUsand OLU 7 is also bidirectional. For example, protection ofSouth Bay shorelines (OLUs 20 to 22 and 25 to 27) causes addi-tional inundation in OLU 7. Similarly, when OLU 7 is protected,
Hummel et al.Economic evaluation of sea-level rise adaptation strongly influenced by hydrodynamic feedbacks
PNAS | 3 of 10https://doi.org/10.1073/pnas.2025961118
Dow
nloa
ded
by g
uest
on
Dec
embe
r 22
, 202
1
Impa
cted
OLU
105 15 20 25 30
5
10
15
20
25
30
105 15 20 25 30
5
10
15
20
25
30
RLSfomc001RLSfomc05
Protected OLU
Impa
cted
OLU
105 15 20 25 30
5
10
15
20
25
30
Protected OLU105 15 20 25 30
5
10
15
20
25
30
108
107
106
−106
−107
−108
Net c
hang
e in f
lood v
olume
(m3 )
−109
105
−105
Suisun Bay
South Bay
OLU 7
A B
C D
Fig. 2. Net change in flood volume for OLU protection scenarios at (A) 50 cm, (B) 100 cm, (C) 150 cm, and (D) 200 cm of SLR. Individual OLU protectionscenarios are along the horizontal axis. Each column shows the net change in flood volume in all other OLUs resulting from that protection scenario. OLUnumbering is shown in Fig. 1. Subembayment interactions in Suisun Bay and South Bay are indicated by boxes. OLU 7 (Napa–Sonoma), which experiencesstrong interactions with other OLUs under shoreline protection scenarios, is also highlighted.
flooding is exacerbated in several South Bay OLUs, most notablyOLUs 20 to 23 and 25. OLU 7’s low elevation and large areaprovide substantial storage space for floodwaters when shore-
lines are not modified, but this space is lost when protection isimplemented along its shoreline. Unlike OLUs 9 and 10, whichprovide similar storage space but are separated from the rest of
50 cm of SLR 100 cm of SLR
detcetorpnu62UL O
detcetorp62U LO
Mouth ofSeal Slough
OLU 26San Mateo
OLU 25Belmont-Redwood
Foster CityWater Depth (m)
<11 − 22 − 33 − 4>4Protected OLUFoster CityLevee
3.01.50.0km
San FranciscoBay Area
150 cm of SLRSan Francisco BayA
B
C
D
E
F
Fig. 3. Interaction between OLUs 25 (Belmont–Redwood) and 26 (San Mateo) in South San Francisco Bay. At 50 cm of SLR (A and B), protection of the OLU26 shoreline eliminates the flood pathway at the mouth of Seal Slough, such that Foster City, located behind the levee in OLU 25, remains dry. At 100 cm ofSLR (C and D), the Foster City levee is overtopped, so protection of the OLU 26 shoreline provides only partial flood reduction in OLU 25. At 150 cm of SLR(E and F), protecting the OLU 26 shoreline causes additional flooding in OLU 25. The 200-cm SLR scenario shows the same interaction as the 150-cm scenarioand thus is not included here.
4 of 10 | PNAShttps://doi.org/10.1073/pnas.2025961118
Hummel et al.Economic evaluation of sea-level rise adaptation strongly influenced by hydrodynamic feedbacks
Dow
nloa
ded
by g
uest
on
Dec
embe
r 22
, 202
1
ENV
IRO
NM
ENTA
LSC
IEN
CES
the bay via the narrow Carquinez Strait, OLU 7’s position at thenorthern boundary of the bay leads to changes in down-estuarywater levels in San Pablo Bay and Central Bay that propagateinto South Bay.
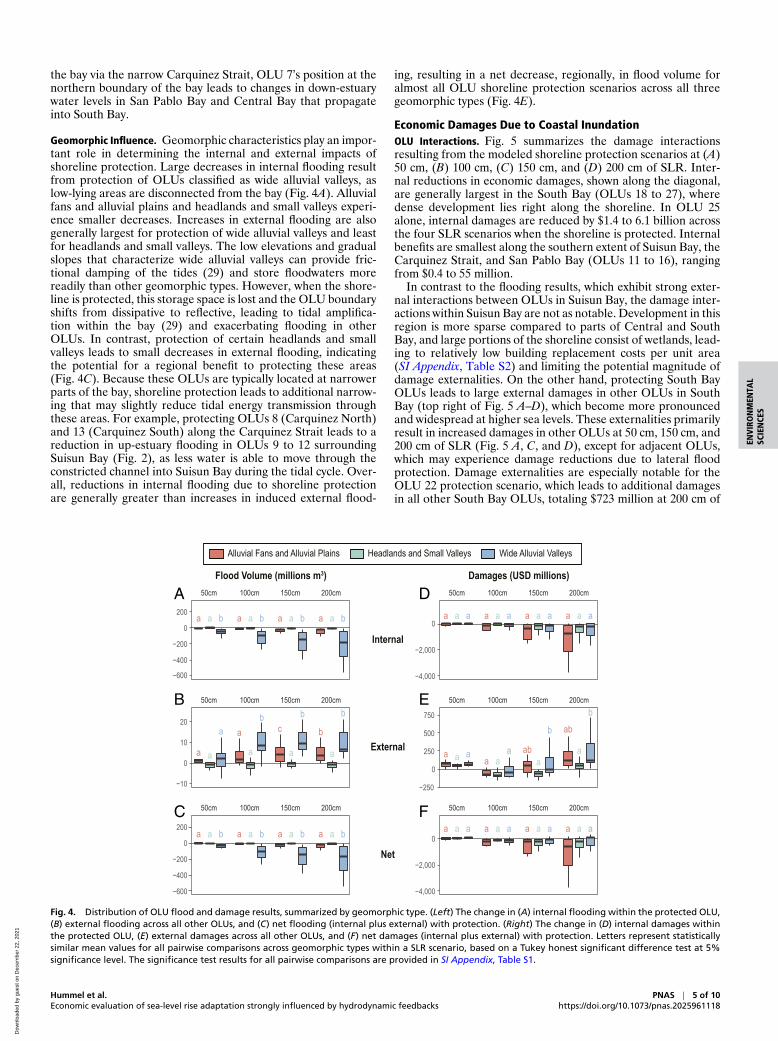
Geomorphic Influence. Geomorphic characteristics play an impor-tant role in determining the internal and external impacts ofshoreline protection. Large decreases in internal flooding resultfrom protection of OLUs classified as wide alluvial valleys, aslow-lying areas are disconnected from the bay (Fig. 4A). Alluvialfans and alluvial plains and headlands and small valleys experi-ence smaller decreases. Increases in external flooding are alsogenerally largest for protection of wide alluvial valleys and leastfor headlands and small valleys. The low elevations and gradualslopes that characterize wide alluvial valleys can provide fric-tional damping of the tides (29) and store floodwaters morereadily than other geomorphic types. However, when the shore-line is protected, this storage space is lost and the OLU boundaryshifts from dissipative to reflective, leading to tidal amplifica-tion within the bay (29) and exacerbating flooding in otherOLUs. In contrast, protection of certain headlands and smallvalleys leads to small decreases in external flooding, indicatingthe potential for a regional benefit to protecting these areas(Fig. 4C). Because these OLUs are typically located at narrowerparts of the bay, shoreline protection leads to additional narrow-ing that may slightly reduce tidal energy transmission throughthese areas. For example, protecting OLUs 8 (Carquinez North)and 13 (Carquinez South) along the Carquinez Strait leads to areduction in up-estuary flooding in OLUs 9 to 12 surroundingSuisun Bay (Fig. 2), as less water is able to move through theconstricted channel into Suisun Bay during the tidal cycle. Over-all, reductions in internal flooding due to shoreline protectionare generally greater than increases in induced external flood-
ing, resulting in a net decrease, regionally, in flood volume foralmost all OLU shoreline protection scenarios across all threegeomorphic types (Fig. 4E).
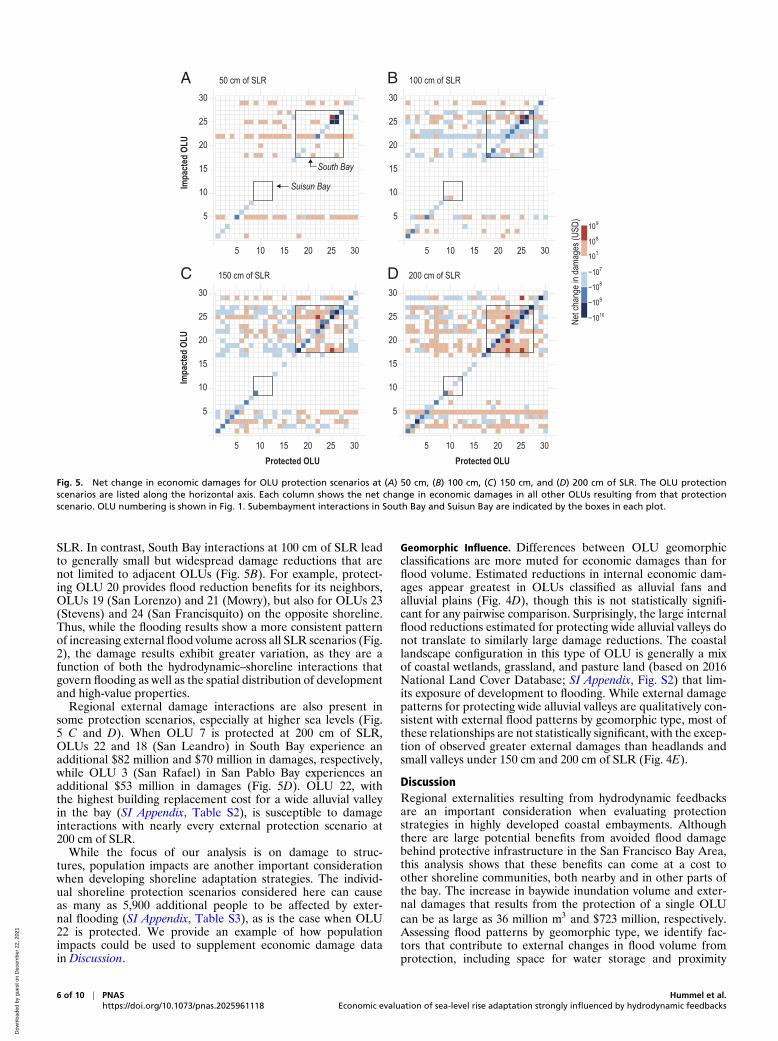
Economic Damages Due to Coastal InundationOLU Interactions. Fig. 5 summarizes the damage interactionsresulting from the modeled shoreline protection scenarios at (A)50 cm, (B) 100 cm, (C) 150 cm, and (D) 200 cm of SLR. Inter-nal reductions in economic damages, shown along the diagonal,are generally largest in the South Bay (OLUs 18 to 27), wheredense development lies right along the shoreline. In OLU 25alone, internal damages are reduced by $1.4 to 6.1 billion acrossthe four SLR scenarios when the shoreline is protected. Internalbenefits are smallest along the southern extent of Suisun Bay, theCarquinez Strait, and San Pablo Bay (OLUs 11 to 16), rangingfrom $0.4 to 55 million.
In contrast to the flooding results, which exhibit strong exter-nal interactions between OLUs in Suisun Bay, the damage inter-actions within Suisun Bay are not as notable. Development in thisregion is more sparse compared to parts of Central and SouthBay, and large portions of the shoreline consist of wetlands, lead-ing to relatively low building replacement costs per unit area(SI Appendix, Table S2) and limiting the potential magnitude ofdamage externalities. On the other hand, protecting South BayOLUs leads to large external damages in other OLUs in SouthBay (top right of Fig. 5 A–D), which become more pronouncedand widespread at higher sea levels. These externalities primarilyresult in increased damages in other OLUs at 50 cm, 150 cm, and200 cm of SLR (Fig. 5 A, C, and D), except for adjacent OLUs,which may experience damage reductions due to lateral floodprotection. Damage externalities are especially notable for theOLU 22 protection scenario, which leads to additional damagesin all other South Bay OLUs, totaling $723 million at 200 cm of
a a b a a b a a b a a b
50cm 100cm 150cm 200cm
−600
−400
−200
0
200
−4,000
−2,000
0
a a
a a
a
bc
a
b
b
a
b
−10
0
10
20
−250
0
250
500
750
a a b a a b a a b a a b
−600
−400
−200
0
200
−4,000
−2,000
0
50cm 100cm 150cm 200cm
50cm 100cm 150cm 200cm
50cm 100cm 150cm 200cm
50cm 100cm 150cm 200cm
50cm 100cm 150cm 200cm
a a a a a a a a a a a a
a a aa a
a aba
b ab
a
b
a a a a a a a a a a a a
Flood Volume (millions m3 )snoillimDSU(segamaD)
Wide Alluvial ValleysAlluvial Fans and Alluvial Plains Headlands and Small Valleys
Internal
External
Net
A
B
C
D
E
F
Fig. 4. Distribution of OLU flood and damage results, summarized by geomorphic type. (Left) The change in (A) internal flooding within the protected OLU,(B) external flooding across all other OLUs, and (C) net flooding (internal plus external) with protection. (Right) The change in (D) internal damages withinthe protected OLU, (E) external damages across all other OLUs, and (F) net damages (internal plus external) with protection. Letters represent statisticallysimilar mean values for all pairwise comparisons across geomorphic types within a SLR scenario, based on a Tukey honest significant difference test at 5%significance level. The significance test results for all pairwise comparisons are provided in SI Appendix, Table S1.
Hummel et al.Economic evaluation of sea-level rise adaptation strongly influenced by hydrodynamic feedbacks
PNAS | 5 of 10https://doi.org/10.1073/pnas.2025961118
Dow
nloa
ded
by g
uest
on
Dec
embe
r 22
, 202
1
Impa
cted
OLU
105 15 20 25 30
5
10
15
20
25
30
105 15 20 25 30
5
10
15
20
25
30
RLSfomc001RLSfomc05
Net c
hang
e in d
amag
es (U
SD)
Protected OLU
Impa
cted
OLU
105 15 20 25 30
5
10
15
20
25
30
Protected OLU105 15 20 25 30
5
10
15
20
25
30
109
108
−108
−109
−1010
107
−107
Suisun Bay
South Bay
BA
C D
Fig. 5. Net change in economic damages for OLU protection scenarios at (A) 50 cm, (B) 100 cm, (C) 150 cm, and (D) 200 cm of SLR. The OLU protectionscenarios are listed along the horizontal axis. Each column shows the net change in economic damages in all other OLUs resulting from that protectionscenario. OLU numbering is shown in Fig. 1. Subembayment interactions in South Bay and Suisun Bay are indicated by the boxes in each plot.
SLR. In contrast, South Bay interactions at 100 cm of SLR leadto generally small but widespread damage reductions that arenot limited to adjacent OLUs (Fig. 5B). For example, protect-ing OLU 20 provides flood reduction benefits for its neighbors,OLUs 19 (San Lorenzo) and 21 (Mowry), but also for OLUs 23(Stevens) and 24 (San Francisquito) on the opposite shoreline.Thus, while the flooding results show a more consistent patternof increasing external flood volume across all SLR scenarios (Fig.2), the damage results exhibit greater variation, as they are afunction of both the hydrodynamic–shoreline interactions thatgovern flooding as well as the spatial distribution of developmentand high-value properties.
Regional external damage interactions are also present insome protection scenarios, especially at higher sea levels (Fig.5 C and D). When OLU 7 is protected at 200 cm of SLR,OLUs 22 and 18 (San Leandro) in South Bay experience anadditional $82 million and $70 million in damages, respectively,while OLU 3 (San Rafael) in San Pablo Bay experiences anadditional $53 million in damages (Fig. 5D). OLU 22, withthe highest building replacement cost for a wide alluvial valleyin the bay (SI Appendix, Table S2), is susceptible to damageinteractions with nearly every external protection scenario at200 cm of SLR.
While the focus of our analysis is on damage to struc-tures, population impacts are another important considerationwhen developing shoreline adaptation strategies. The individ-ual shoreline protection scenarios considered here can causeas many as 5,900 additional people to be affected by exter-nal flooding (SI Appendix, Table S3), as is the case when OLU22 is protected. We provide an example of how populationimpacts could be used to supplement economic damage datain Discussion.
Geomorphic Influence. Differences between OLU geomorphicclassifications are more muted for economic damages than forflood volume. Estimated reductions in internal economic dam-ages appear greatest in OLUs classified as alluvial fans andalluvial plains (Fig. 4D), though this is not statistically signifi-cant for any pairwise comparison. Surprisingly, the large internalflood reductions estimated for protecting wide alluvial valleys donot translate to similarly large damage reductions. The coastallandscape configuration in this type of OLU is generally a mixof coastal wetlands, grassland, and pasture land (based on 2016National Land Cover Database; SI Appendix, Fig. S2) that lim-its exposure of development to flooding. While external damagepatterns for protecting wide alluvial valleys are qualitatively con-sistent with external flood patterns by geomorphic type, most ofthese relationships are not statistically significant, with the excep-tion of observed greater external damages than headlands andsmall valleys under 150 cm and 200 cm of SLR (Fig. 4E).
DiscussionRegional externalities resulting from hydrodynamic feedbacksare an important consideration when evaluating protectionstrategies in highly developed coastal embayments. Althoughthere are large potential benefits from avoided flood damagebehind protective infrastructure in the San Francisco Bay Area,this analysis shows that these benefits can come at a cost toother shoreline communities, both nearby and in other parts ofthe bay. The increase in baywide inundation volume and exter-nal damages that results from the protection of a single OLUcan be as large as 36 million m3 and $723 million, respectively.Assessing flood patterns by geomorphic type, we identify fac-tors that contribute to external changes in flood volume fromprotection, including space for water storage and proximity
6 of 10 | PNAShttps://doi.org/10.1073/pnas.2025961118
Hummel et al.Economic evaluation of sea-level rise adaptation strongly influenced by hydrodynamic feedbacks
Dow
nloa
ded
by g
uest
on
Dec
embe
r 22
, 202
1
ENV
IRO
NM
ENTA
LSC
IEN
CES
0 8 km642
San Pablo Bay
Water Depth (m)<11 − 22 − 33 − 4>4Highway 37
OLU 7Napa-Sonoma
OLU 6Petaluma
San FranciscoBay Area
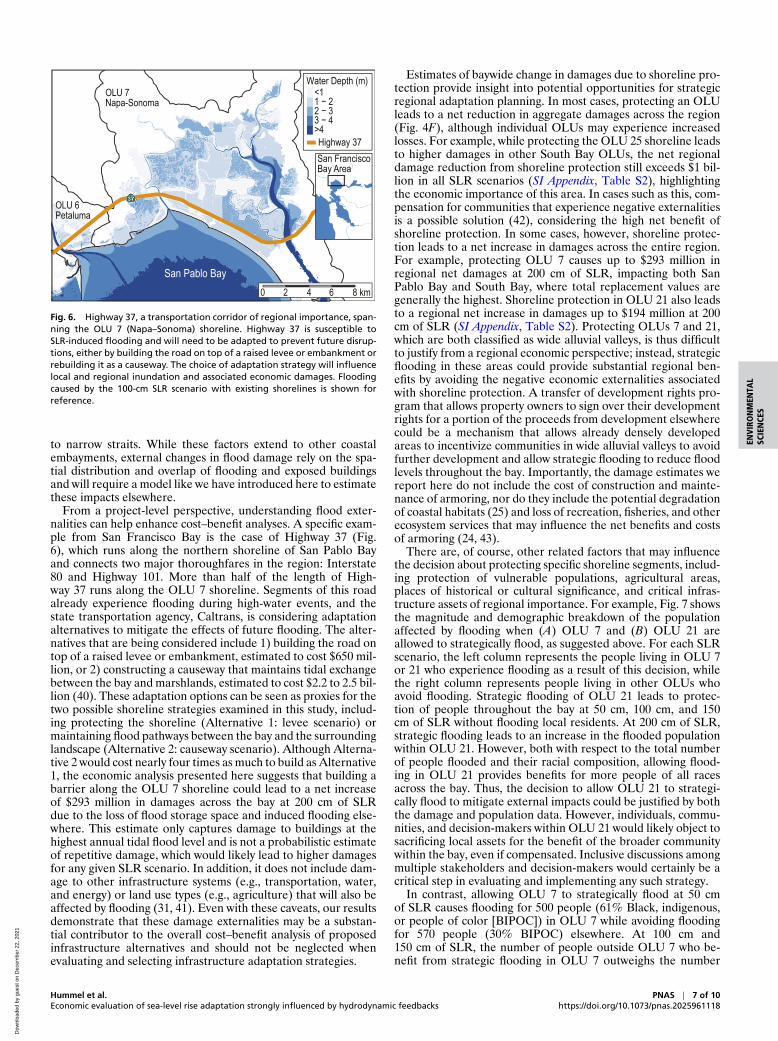
Fig. 6. Highway 37, a transportation corridor of regional importance, span-ning the OLU 7 (Napa–Sonoma) shoreline. Highway 37 is susceptible toSLR-induced flooding and will need to be adapted to prevent future disrup-tions, either by building the road on top of a raised levee or embankment orrebuilding it as a causeway. The choice of adaptation strategy will influencelocal and regional inundation and associated economic damages. Floodingcaused by the 100-cm SLR scenario with existing shorelines is shown forreference.
to narrow straits. While these factors extend to other coastalembayments, external changes in flood damage rely on the spa-tial distribution and overlap of flooding and exposed buildingsand will require a model like we have introduced here to estimatethese impacts elsewhere.
From a project-level perspective, understanding flood exter-nalities can help enhance cost–benefit analyses. A specific exam-ple from San Francisco Bay is the case of Highway 37 (Fig.6), which runs along the northern shoreline of San Pablo Bayand connects two major thoroughfares in the region: Interstate80 and Highway 101. More than half of the length of High-way 37 runs along the OLU 7 shoreline. Segments of this roadalready experience flooding during high-water events, and thestate transportation agency, Caltrans, is considering adaptationalternatives to mitigate the effects of future flooding. The alter-natives that are being considered include 1) building the road ontop of a raised levee or embankment, estimated to cost $650 mil-lion, or 2) constructing a causeway that maintains tidal exchangebetween the bay and marshlands, estimated to cost $2.2 to 2.5 bil-lion (40). These adaptation options can be seen as proxies for thetwo possible shoreline strategies examined in this study, includ-ing protecting the shoreline (Alternative 1: levee scenario) ormaintaining flood pathways between the bay and the surroundinglandscape (Alternative 2: causeway scenario). Although Alterna-tive 2 would cost nearly four times as much to build as Alternative1, the economic analysis presented here suggests that building abarrier along the OLU 7 shoreline could lead to a net increaseof $293 million in damages across the bay at 200 cm of SLRdue to the loss of flood storage space and induced flooding else-where. This estimate only captures damage to buildings at thehighest annual tidal flood level and is not a probabilistic estimateof repetitive damage, which would likely lead to higher damagesfor any given SLR scenario. In addition, it does not include dam-age to other infrastructure systems (e.g., transportation, water,and energy) or land use types (e.g., agriculture) that will also beaffected by flooding (31, 41). Even with these caveats, our resultsdemonstrate that these damage externalities may be a substan-tial contributor to the overall cost–benefit analysis of proposedinfrastructure alternatives and should not be neglected whenevaluating and selecting infrastructure adaptation strategies.
Estimates of baywide change in damages due to shoreline pro-tection provide insight into potential opportunities for strategicregional adaptation planning. In most cases, protecting an OLUleads to a net reduction in aggregate damages across the region(Fig. 4F), although individual OLUs may experience increasedlosses. For example, while protecting the OLU 25 shoreline leadsto higher damages in other South Bay OLUs, the net regionaldamage reduction from shoreline protection still exceeds $1 bil-lion in all SLR scenarios (SI Appendix, Table S2), highlightingthe economic importance of this area. In cases such as this, com-pensation for communities that experience negative externalitiesis a possible solution (42), considering the high net benefit ofshoreline protection. In some cases, however, shoreline protec-tion leads to a net increase in damages across the entire region.For example, protecting OLU 7 causes up to $293 million inregional net damages at 200 cm of SLR, impacting both SanPablo Bay and South Bay, where total replacement values aregenerally the highest. Shoreline protection in OLU 21 also leadsto a regional net increase in damages up to $194 million at 200cm of SLR (SI Appendix, Table S2). Protecting OLUs 7 and 21,which are both classified as wide alluvial valleys, is thus difficultto justify from a regional economic perspective; instead, strategicflooding in these areas could provide substantial regional ben-efits by avoiding the negative economic externalities associatedwith shoreline protection. A transfer of development rights pro-gram that allows property owners to sign over their developmentrights for a portion of the proceeds from development elsewherecould be a mechanism that allows already densely developedareas to incentivize communities in wide alluvial valleys to avoidfurther development and allow strategic flooding to reduce floodlevels throughout the bay. Importantly, the damage estimates wereport here do not include the cost of construction and mainte-nance of armoring, nor do they include the potential degradationof coastal habitats (25) and loss of recreation, fisheries, and otherecosystem services that may influence the net benefits and costsof armoring (24, 43).
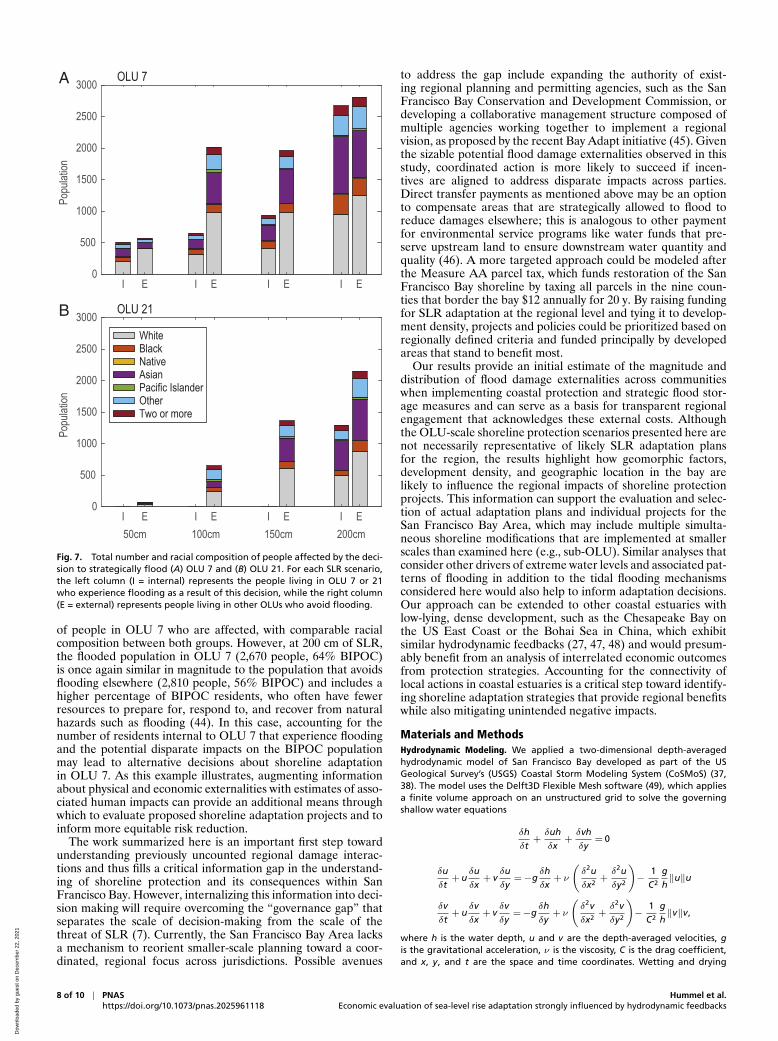
There are, of course, other related factors that may influencethe decision about protecting specific shoreline segments, includ-ing protection of vulnerable populations, agricultural areas,places of historical or cultural significance, and critical infras-tructure assets of regional importance. For example, Fig. 7 showsthe magnitude and demographic breakdown of the populationaffected by flooding when (A) OLU 7 and (B) OLU 21 areallowed to strategically flood, as suggested above. For each SLRscenario, the left column represents the people living in OLU 7or 21 who experience flooding as a result of this decision, whilethe right column represents people living in other OLUs whoavoid flooding. Strategic flooding of OLU 21 leads to protec-tion of people throughout the bay at 50 cm, 100 cm, and 150cm of SLR without flooding local residents. At 200 cm of SLR,strategic flooding leads to an increase in the flooded populationwithin OLU 21. However, both with respect to the total numberof people flooded and their racial composition, allowing flood-ing in OLU 21 provides benefits for more people of all racesacross the bay. Thus, the decision to allow OLU 21 to strategi-cally flood to mitigate external impacts could be justified by boththe damage and population data. However, individuals, commu-nities, and decision-makers within OLU 21 would likely object tosacrificing local assets for the benefit of the broader communitywithin the bay, even if compensated. Inclusive discussions amongmultiple stakeholders and decision-makers would certainly be acritical step in evaluating and implementing any such strategy.
In contrast, allowing OLU 7 to strategically flood at 50 cmof SLR causes flooding for 500 people (61% Black, indigenous,or people of color [BIPOC]) in OLU 7 while avoiding floodingfor 570 people (30% BIPOC) elsewhere. At 100 cm and150 cm of SLR, the number of people outside OLU 7 who be-nefit from strategic flooding in OLU 7 outweighs the number
Hummel et al.Economic evaluation of sea-level rise adaptation strongly influenced by hydrodynamic feedbacks
PNAS | 7 of 10https://doi.org/10.1073/pnas.2025961118
Dow
nloa
ded
by g
uest
on
Dec
embe
r 22
, 202
1
0
500
1000
1500
2000
2500
3000
Popu
lation
WhiteBlackNativeAsianPacific IslanderOtherTwo or more
Popu
lation
I E I E I E I E
50cm 100cm 150cm 200cm
0
500
1000
1500
2000
2500
3000
I E I E I E I E
A
B
Fig. 7. Total number and racial composition of people affected by the deci-sion to strategically flood (A) OLU 7 and (B) OLU 21. For each SLR scenario,the left column (I = internal) represents the people living in OLU 7 or 21who experience flooding as a result of this decision, while the right column(E = external) represents people living in other OLUs who avoid flooding.
of people in OLU 7 who are affected, with comparable racialcomposition between both groups. However, at 200 cm of SLR,the flooded population in OLU 7 (2,670 people, 64% BIPOC)is once again similar in magnitude to the population that avoidsflooding elsewhere (2,810 people, 56% BIPOC) and includes ahigher percentage of BIPOC residents, who often have fewerresources to prepare for, respond to, and recover from naturalhazards such as flooding (44). In this case, accounting for thenumber of residents internal to OLU 7 that experience floodingand the potential disparate impacts on the BIPOC populationmay lead to alternative decisions about shoreline adaptationin OLU 7. As this example illustrates, augmenting informationabout physical and economic externalities with estimates of asso-ciated human impacts can provide an additional means throughwhich to evaluate proposed shoreline adaptation projects and toinform more equitable risk reduction.
The work summarized here is an important first step towardunderstanding previously uncounted regional damage interac-tions and thus fills a critical information gap in the understand-ing of shoreline protection and its consequences within SanFrancisco Bay. However, internalizing this information into deci-sion making will require overcoming the “governance gap” thatseparates the scale of decision-making from the scale of thethreat of SLR (7). Currently, the San Francisco Bay Area lacksa mechanism to reorient smaller-scale planning toward a coor-dinated, regional focus across jurisdictions. Possible avenues
to address the gap include expanding the authority of exist-ing regional planning and permitting agencies, such as the SanFrancisco Bay Conservation and Development Commission, ordeveloping a collaborative management structure composed ofmultiple agencies working together to implement a regionalvision, as proposed by the recent Bay Adapt initiative (45). Giventhe sizable potential flood damage externalities observed in thisstudy, coordinated action is more likely to succeed if incen-tives are aligned to address disparate impacts across parties.Direct transfer payments as mentioned above may be an optionto compensate areas that are strategically allowed to flood toreduce damages elsewhere; this is analogous to other paymentfor environmental service programs like water funds that pre-serve upstream land to ensure downstream water quantity andquality (46). A more targeted approach could be modeled afterthe Measure AA parcel tax, which funds restoration of the SanFrancisco Bay shoreline by taxing all parcels in the nine coun-ties that border the bay $12 annually for 20 y. By raising fundingfor SLR adaptation at the regional level and tying it to develop-ment density, projects and policies could be prioritized based onregionally defined criteria and funded principally by developedareas that stand to benefit most.
Our results provide an initial estimate of the magnitude anddistribution of flood damage externalities across communitieswhen implementing coastal protection and strategic flood stor-age measures and can serve as a basis for transparent regionalengagement that acknowledges these external costs. Althoughthe OLU-scale shoreline protection scenarios presented here arenot necessarily representative of likely SLR adaptation plansfor the region, the results highlight how geomorphic factors,development density, and geographic location in the bay arelikely to influence the regional impacts of shoreline protectionprojects. This information can support the evaluation and selec-tion of actual adaptation plans and individual projects for theSan Francisco Bay Area, which may include multiple simulta-neous shoreline modifications that are implemented at smallerscales than examined here (e.g., sub-OLU). Similar analyses thatconsider other drivers of extreme water levels and associated pat-terns of flooding in addition to the tidal flooding mechanismsconsidered here would also help to inform adaptation decisions.Our approach can be extended to other coastal estuaries withlow-lying, dense development, such as the Chesapeake Bay onthe US East Coast or the Bohai Sea in China, which exhibitsimilar hydrodynamic feedbacks (27, 47, 48) and would presum-ably benefit from an analysis of interrelated economic outcomesfrom protection strategies. Accounting for the connectivity oflocal actions in coastal estuaries is a critical step toward identify-ing shoreline adaptation strategies that provide regional benefitswhile also mitigating unintended negative impacts.
Materials and MethodsHydrodynamic Modeling. We applied a two-dimensional depth-averagedhydrodynamic model of San Francisco Bay developed as part of the USGeological Survey’s (USGS) Coastal Storm Modeling System (CoSMoS) (37,38). The model uses the Delft3D Flexible Mesh software (49), which appliesa finite volume approach on an unstructured grid to solve the governingshallow water equations
δh
δt+
δuh
δx+
δvh
δy= 0
δu
δt+ u
δu
δx+ v
δu
δy=−g
δh
δx+ ν
(δ2u
δx2+
δ2u
δy2
)−
1
C2
g
h‖u‖u
δv
δt+ u
δv
δx+ v
δv
δy=−g
δh
δy+ ν
(δ2v
δx2+
δ2v
δy2
)−
1
C2
g
h‖v‖v,
where h is the water depth, u and v are the depth-averaged velocities, gis the gravitational acceleration, ν is the viscosity, C is the drag coefficient,and x, y, and t are the space and time coordinates. Wetting and drying
8 of 10 | PNAShttps://doi.org/10.1073/pnas.2025961118
Hummel et al.Economic evaluation of sea-level rise adaptation strongly influenced by hydrodynamic feedbacks
Dow
nloa
ded
by g
uest
on
Dec
embe
r 22
, 202
1
ENV
IRO
NM
ENTA
LSC
IEN
CES
is accomplished by adding or removing grid points from the flow domainbased on a threshold flood depth. Spatially variable roughness is appliedusing the Manning roughness formulation.
The model domain included San Francisco Bay and upstream channels inthe Sacramento–San Joaquin Delta and extended offshore to the −1,500-mdepth contour (SI Appendix, Fig. S3). Grid cells ranged in size from approx-imately 3 km in offshore areas to less than 50 m in overland areas. Weused seamless topography and bathymetry data available at 2-m horizontalresolution from the USGS Coastal National Elevation Database (50) acrossthe model domain. We further delineated existing shoreline protection fea-tures, such as engineered levees, floodwalls, berms, and embankments, inareas where the grid resolution was not fine enough to capture thesefeatures. Elevation data for these structures was extracted from the SanFrancisco Estuary Institute’s San Francisco Bay Shore Inventory database (32).
We forced the model at the oceanic boundary with January 2010 waterlevels and currents extracted from Oregon State University’s TPXO8 tidalmodel for eight harmonic constituents (M2, S2, N2, K2, K1, O1, P1, and Q1)(51). For each SLR scenario we added an additional tidal component withzero frequency and amplitude equal to the SLR increment (i.e., 50, 100, 150,and 200 cm). We applied historical discharge data for the Sacramento andSan Joaquin Rivers as point inflows into the model. We did not include mete-orological forcing in the simulations because the focus of the study is ontidally driven interactions with the shorelines. Outputs from the simulationsrepresent the inundation that would occur at high tide during a spring tidecycle, which persists for approximately 2 wk each month. This results in per-manent flooding in some low-lying areas and shorter-duration (minutes tohours) but frequent (multiple days per month) flood disruptions at higherelevations.
Shoreline Scenarios. We developed the shoreline scenarios from the OLUboundary delineation conducted by ref. 35 for the San Francisco Bay Area.Briefly, ref. 35 divided the bayshore broadly by geomorphic type, includ-ing wide alluvial valleys, alluvial fans and alluvial plains, and headlands andsmall valleys. They then further delineated the lateral boundaries betweenindividual OLUs using major watershed boundaries or the apex points ofmajor headlands and alluvial fans. In the cross-shore direction, OLUs extendfrom the offshore point where wind-driven waves are capable of mobiliz-ing sediment to the inland extent of the 500-cm SLR scenario plus a 500-mtransitional zone.
We implemented protection scenarios for each OLU shoreline individu-ally in the hydrodynamic model using infinitely high impermeable walls.The walls generally follow the coastal boundary of each OLU, as well asthe lateral boundaries up to the 200-cm SLR flooding extent modeled usingexisting shorelines. This prevents flooding between the protected OLU andits neighbors along overland flow pathways.
For each scenario, we calculated the change in inundation volume acrossthe land surface in each OLU using the integral
VOLU =
∫AOLU
∆h dA,
where VOLU is the inundation volume, AOLU is the surface area of the OLU,and ∆h is the change in water depth in each grid cell as compared to theexisting shoreline scenario for that amount of SLR.
Economic Damages. We simulated flood damages using the expected dam-age function methodology (52), estimating both the expected repair cost toflooded properties and the replacement cost of damaged building contentsunder the baseline no-intervention condition and all protection and SLR sce-narios. Using this approach, the change in repair cost between a baselinescenario and protection scenario provides an estimate of compensating vari-ation, or the social welfare gain/loss, associated with that protection scenario(53). This assumes risk neutrality of property owners and would underesti-mate the change in social welfare if affected owners were risk averse. Weconducted this analysis for structures across the San Francisco Bay region rep-resented in the Federal Emergency Management Agency’s (FEMA’s) HAZUS2015 General Building Stock database, a nationwide spatially explicit inven-tory of structures classified by occupancy type. The spatial resolution of thisdataset is the census block, and as such the expected damage function here isa lumped model where all structure classes are assumed to be evenly spreadacross the census block. We reconstructed aggregate structure and contentrepair/replacement costs by occupancy class for each census block outside ofthe HAZUS software following guidance in FEMA’s HAZUS 3.2 release notes(39). We derived total repair cost values at risk to SLR over the next 150 y byaggregating over all census blocks across OLUs, consistent with the risk profile
definition used to create the OLUs (35). We calculated the total populationat risk by aggregating across OLUs based on the Environmental ProtectionAgency’s 30-m dasymetric population map for the coterminous United Statesavailable from EnviroAtlas (54).
We assessed flood damages for each occupancy class across census blocksvia depth-damage functions that relate flood depth to repair costs, as afraction of total building replacement cost. From HAZUS, we extractedappropriate functions for all structure classes, as developed by FEMA andthe US Army Corps of Engineers using empirical data from past flood events(55, 56). Census blocks are generally less than 3 ha, but in less densely pop-ulated areas they can be much larger and in all cases in the study area werelarger than the resolution of the flood raster. To deal with variation in flooddepth and nonlinear depth-damage functions to produce a single estimateof repair cost for each census block we randomly sampled 100 cells fromthe flood map within each census block and estimated repair costs across alloccupancy types for each draw. From this we derived summary statistics foraggregate repair costs across occupancy classes for each census block andreported on sample means.
Modeling was treated as a one-off tidal flood event under each SLR sce-nario and did not account for repeat flood events. All else being equal,this significantly underpredicts long-term value estimates. We examinedonly economic damages to buildings and did not incorporate other infras-tructure systems (e.g., transportation, water, and energy) or land-use types(e.g., agriculture), which will also be affected by flooding and contributeto economic damages (31, 41). Crop agriculture is a small portion of landby area, even in wide alluvial valleys (SI Appendix, Fig. S2), so we donot expect large systematic damage underestimates. We did not accountfor changes in socioeconomic development or population distribution overtime (57), which could bias results depending on their future trajectory.While our analysis focused on property replacement values, protection ofvulnerable populations may be a priority for communities but may be under-valued through traditional property value–based analyses such as the onepresented here (58, 59).
Population at Risk in Bays and Estuaries. We defined population at risk fromSLR and flooding here as those living adjacent to the shoreline at less than10 m elevation, excluding areas that would not be hydrologically connectedto the coast, consistent with prior work estimating SLR risk in what has beentermed the “Low Elevation Coastal Zone” (2, 60). Global population in 2020was mapped using WorldPop (61), and global elevation data were sourcedfrom the Consultative Group on International Agricultural Research’s hole-filled Shuttle Radar Topography Mission global digital elevation model (62).The digital elevation model was reprocessed to identify areas below 10 min elevation that are contiguous with the coastline, using the public domainWorld Data Bank II global shoreline vector layer as the reference coastline.This layer was then used to extract the global population that met thesecriteria. Finally, using a globally mapped typology of nearshore coastal sys-tems (63), we extracted populations nearest to coastal systems defined aspredominantly tidally influenced (class 2) to estimate total population atrisk in this nearshore system. This process estimates that 864 million peopleglobally are at risk, and 468 million of these live closest to shorelines clas-sified as tidally influenced bays and estuaries. The overall global exposureestimate of 867 million here is within 4% of the mean value of two priorstudies that calculated this risk metric (2, 60).
To estimate population impacts for the shoreline protection scenariosmodeled here, we extracted block-level population counts across the SanFrancisco Bay region from the 2010 decennial census (64). We calculatedthe proportion of each census block that was flooded under each shorelinescenario and then applied that value to the block-level population countto determine the number of people affected by flooding. This approachassumes that the population is evenly distributed throughout each censusblock, which could lead to biases in larger census blocks or in areas whereresidential development is concentrated in only part of a block. We thencompared the population counts in each OLU for each protection scenariowith the existing shoreline scenario at the same SLR to determine the num-ber of people across the region who experience flooding or who obtainprotective benefits as a result of the protective action.
Data Availability. The data and code used in this analysis are avail-able through the Dryad data repository at https://doi.org/10.5061/dryad.2z34tmpmb (65) and https://doi.org/10.5061/dryad.g79cnp5pt (66).
ACKNOWLEDGMENTS. We thank Mark Stacey for insightful and construc-tive comments. This project was supported by NSF Award 1541181, theGordon and Betty Moore Foundation, the Wallenberg Foundation, and the
Hummel et al.Economic evaluation of sea-level rise adaptation strongly influenced by hydrodynamic feedbacks
PNAS | 9 of 10https://doi.org/10.1073/pnas.2025961118
Dow
nloa
ded
by g
uest
on
Dec
embe
r 22
, 202
1
National Oceanic and Atmospheric Administration’s Cooperative Institutefor the North Atlantic Region. This research used the Savio computationalcluster resource provided by the Berkeley Research Computing program
at the University of California, Berkeley (supported by the University ofCalifornia, Berkeley Chancellor, Vice Chancellor for Research, and ChiefInformation Officer).
1. J. Hinkel et al., Coastal flood damage and adaptation costs under 21st century sea-level rise. Proc. Natl. Acad. Sci. U.S.A. 111, 3292–3297 (2014).
2. S. A. Kulp, B. H. Strauss, New elevation data triple estimates of global vulnerability tosea-level rise and coastal flooding. Nat. Commun. 10, 4844 (2019).
3. B. Neumann, A. T. Vafeidis, J. Zimmermann, R. J. Nicholls, Future coastal populationgrowth and exposure to sea-level rise and coastal flooding—A global assessment.PloS One 10, e0118571 (2015).
4. World Economic Forum, “The global risks report 2019 14th edition” (Technical report,World Economic Forum, Geneva, Switzerland, 2019).
5. S. Gopalakrishnan, C. E. Landry, M. D. Smith, J. C. Whitehead, Economics of coastalerosion and adaptation to sea level rise. Annu. Rev. Res. Econ. 8, 119–139 (2016).
6. T. A. Thaler, S. J. Priest, S. Fuchs, Evolving inter-regional co-operation in flood riskmanagement: Distances and types of partnership approaches in Austria. Reg. Environ.Change 16, 841–853 (2016).
7. M. Lubell, “The governance gap: Climate adaptation and sea-level rise in the SanFrancisco Bay area” (Technical report, University of California, Davis, 2017).
8. B. T. Werner, D. E. McNamara, Dynamics of coupled human-landscape systems.Geomorphology 91, 393–407 (2007).
9. E. D. Lazarus, M. A. Ellis, A. B. Murray, D. M. Hall, An evolving research agenda forhuman–coastal systems. Geomorphology 256, 81–90 (2016).
10. W. Brock, A. Xepapadeas, Pattern formation, spatial externalities and regulationin coupled economic–ecological systems. J. Environ. Econ. Manag. 59, 149–164(2010).
11. A. C. Pigou, The Economics of Welfare (Macmillan and Company, 1929).12. G. A. Tobin, The levee love affair: A stormy relationship? J. Am. Water Res. Assoc. 31,
359–367 (1995).13. B. E. Montz, G. A. Tobin, Livin’ large with levees: Lessons learned and lost. Nat.
Hazards Rev. 9, 150–157 (2008).14. R. A. Heine, N. Pinter, Levee effects upon flood levels: An empirical assessment.
Hydrol. Process. 26, 3225–3240 (2012).15. N. Pinter, F. Huthoff, J. Dierauer, J. W. F. Remo, A. Damptz, Modeling residual flood
risk behind levees, Upper Mississippi River, USA. Environ. Sci. Pol. 58, 131–140 (2016).16. Z. C. Williams, D. E. McNamara, M. D. Smith, A. B. Murray, S. Gopalakrishnan., Cou-
pled economic-coastline modeling with suckers and free riders. J. Geophys. Res. EarthSurf. 118, 887–899 (2013).
17. D. Jin, A. D. Ashton, P. Hoagland, Optimal responses to shoreline changes: An inte-grated economic and geological model with application to curved coasts. Nat. Resour.Model. 26, 572–604 (2013).
18. S. Gopalakrishnan, D. McNamara, M. D. Smith, A. B. Murray, Decentralized manage-ment hinders coastal climate adaptation: The spatial-dynamics of beach nourishment.Environ. Resour. Econ. 67, 761–787 (2017).
19. W. J. Beasley, S. J. Dundas, Hold the line: Modeling private coastal adaptationthrough shoreline armoring decisions. J. Environ. Econ. Manag. 105, 102397 (2021).
20. S. J. Dundas, D. J. Lewis, Estimating option values and spillover damages for coastalprotection: Evidence from Oregon’s Planning Goal 18. J. Assoc. Environ. Res. Econ. 7,519–554 (2020).
21. J. E. Neumann et al., Joint effects of storm surge and sea-level rise on US coasts: Neweconomic estimates of impacts, adaptation, and benefits of mitigation policy. ClimaticChange 129, 337–349 (2014).
22. I. Papakonstantinou, J. Lee, S. M. Madanat, Game theoretic approaches for highwayinfrastructure protection against sea level rise: Co-opetition among multiple players.Transp. Res. Part B Methodol. 123, 21–37 (2019).
23. M. A. Hummel, A. T. Siwe, A. Chow, M. T. Stacey, S. M. Madanat, Interacting infras-tructure disruptions due to environmental events and long-term climate change.Earth Future 8, e2020EF001652 (2020).
24. K. K. Arkema et al., Linking social, ecological, and physical science to advance naturaland nature-based protection for coastal communities. Ann. N. Y. Acad. Sci. 1399, 5–26(2017).
25. J. E. Dugan et al., Generalizing ecological effects of shoreline armoring across softsediment environments. Estuar. Coast 41, 180–196 (2018).
26. R. C. Holleman, M. T. Stacey, Coupling of sea level rise, tidal amplification, andinundation. J. Phys. Oceanogr. 44, 1439–1455 (2014).
27. S. B. Lee, M. Li, F. Zhang, Impact of sea level rise on tidal range in Chesapeake andDelaware Bays. J. Geophys. Res.: Oceans 122, 3917–3938 (2017).
28. R. Q. Wang, M. T. Stacey, L. M. M. Herdman, P. L. Barnard, L. Erikson, The influence ofsea level rise on the regional interdependence of coastal infrastructure. Earth Future6, 677–688 (2018).
29. M. A. Hummel, M. T. Stacey, Assessing the influence of shoreline adaptation ontidal hydrodynamics: The role of shoreline typologies. J. Geophys. Res. Oceans 126,e2020JC016705 (2021).
30. C. L. Lopes, J. M. Dias, Tidal dynamics in a changing lagoon: Flooding or not floodingthe marginal regions. Estuar. Coast Shelf Sci. 167, 14–24 (2015).
31. M. Heberger, H. Cooley, P. Herrera, P. H. Gleick, E. Moore, Potential impacts ofincreased coastal flooding in California due to sea-level rise. Climatic Change 109,229–249 (2011).
32. San Francisco Estuary Institute, “San Francisco Bay shore inventory: Mapping for sealevel rise planning” (Technical report, San Francisco Estuary Institute and the AquaticScience Center, 2016).
33. G. Griggs et al., “Rising seas in California: An update on sea-level rise science”(Technical report, California Ocean Science Trust, 2017).
34. W. V. Sweet et al., “Global and regional sea level rise scenarios for the United States”(Technical report, National Oceanic and Atmospheric Administration, 2017).
35. J. Beagle et al., “San Francisco Bay shoreline adaptation atlas” (Technical report, SanFrancisco Estuary Institute and San Francisco Bay Area Planning and Urban ResearchAssociation, 2019).
36. J. T. A. Verhoeven, M. B. Soons, R. Janssen, N. Omtzigt, An Operational LandscapeUnit approach for identifying key landscape connections in wetland restoration. J.Appl. Ecol. 45, 1496–1503 (2008).
37. P. L. Barnard et al., “The framework of a coastal hazards model —A tool for predictingthe impact of severe storms” (US Geological Survey, 2009).
38. P. L. Barnard et al., Development of the Coastal Storm Modeling System (CoSMoS) forpredicting the impact of storms on high-energy, active-margin coasts. Nat. Hazards74, 1095–1125 (2014).
39. Federal Emergency Management Agency, “Hazus 3.2 user release notes” (Technicalreport, FEMA, 2016).
40. J. Villafranca, K. May, J. Vandever, “State route 37 integrated traffic, infrastructureand sea level rise analysis: Final report” (Technical report, University of California,Davis Road Ecology Center, 2015).
41. M. A. Hummel, M. S. Berry, M. T. Stacey, Sea level rise impacts on wastewatertreatment systems along the U.S. coasts. Earth Future, e312 (2018).
42. S. McCarthy, C. Viavattene, J. Sheehan, C. Green, Compensatory approaches andengagement techniques to gain flood storage in England and Wales. J. Floor RiskManag. 11, 85–94 (2018).
43. S. M. W. Reddy et al., Evaluating the role of coastal habitats and sea-level rise inhurricane risk mitigation: An ecological economic assessment method and applicationto a business decision. Integrated Environ. Assess. Manag. 12, 328–344 (2016).
44. A. Fothergill, E. G. M. Maestas, J. A. D. R. Darlington, Race, ethnicity and disasters inthe United States: A review of the literature. Disasters 23, 156–173 (1999).
45. San Francisco Bay Conservation and Development Commission. Bay Adapt: Regionalstrategy for a rising bay (2021). https://www.bayadapt.org/. Accessed 26 June 2021.
46. L. L. Bremer et al., One size does not fit all: Natural infrastructure investments withinthe Latin American water funds partnership. Ecosyst. Serv. 17, 217–236 (2016).
47. D. Song, X. H. Wang, X. Zhu, X. Bao, Modeling studies of the far-field effects of tidalflat reclamation on tidal dynamics in the East China Seas. Estuar. Coast Shelf Sci. 133,147–160 (2013).
48. L. Zhu, R. Hu, H. Zhu, S. Jiang, Y. Xu, N. Wang, Modeling studies of tidal dynamics andthe associated responses to coastline changes in the Bohai Sea, China. Ocean Dynam.68, 1625–1648 (2018).
49. Deltares. Delft3d flexible mesh suite (2020). https://www.deltares.nl/en/software/delft3d-flexible-mesh-suite/. Accessed 26 June 2021.
50. US Geological Survey. Topobathymetric model of San Francisco Bay, California (2013).https://topotools.cr.usgs.gov/topobathy viewer/. Accessed 26 June 2021.
51. G. D. Egbert, S. Y. Erofeeva, Efficient inverse modeling of barotropic ocean tides. J.Atmos. Ocean. Technol. 19, 183–204 (2002).
52. E. B. Barbier, Valuing ecosystem services as productive inputs. Econ. Pol. 22, 178–229(2007).
53. E. B. Barbier, Valuing the storm protection service of estuarine and coastalecosystems. Ecosystem Services 11, 32–38 (2015).
54. B. R. Pickard, J. Daniel, M. Mehaffey, L. E. Jackson, A. N. EnviroAtlas, A new geospa-tial tool to foster ecosystem services science and resource management. EcosystemServices 14, 45–55 (2015).
55. US Army Corps of Engineers, “Business depth-damage analysis procedures” (TechnicalReport 85-R-5, US Army Engineer Institute for Water Resources, 1985).
56. US Army Corps of Engineers, “Catalog of residential depth-damage functions”(Technical Report 92-R-3, US Army Engineer Institute for Water Resources,1992).
57. M. E. Hauer, J. M. Evans, D. R. Mishra, Millions projected to be at risk from sea-levelrise in the continental United States. Nat. Clim. Change 6, 691–695 (2016).
58. J. Martinich, J. Neumann, L. Ludwig, L. Jantarasami, Risks of sea level rise to disad-vantaged communities in the United States. Mitig. Adapt. Strategies Glob. Change18, 169–185 (2013).
59. M. A. Hummel et al., Clusters of community exposure to coastal flooding hazardsbased on storm and sea level rise scenarios—Implications for adaptation networks inthe San Francisco Bay region. Reg. Environ. Change 18, 1343–1355 (2018).
60. G. McGranahan, D. Balk, B. Anderson, The rising tide: Assessing the risks of climatechange and human settlements in low elevation coastal zones. Environ. Urbanization19, 17–37 (2007).
61. A. J. Tatem, Worldpop, open data for spatial demography. Sci. Data 4, 1–4 (2017).62. A. Jarvis et al., Hole-filled SRTM for the globe version 4. https://cgiarcsi.community/
data/srtm-90m-digital-elevation-database-v4-1/. Accessed 26 June 2021.63. H. H. Durr et al., Worldwide typology of nearshore coastal systems: Defining the
estuarine filter of river inputs to the oceans. Estuar. Coast 34, 441–458 (2011).64. US Census Bureau. 2010 census summary file 1 dataset. https://www.census.gov/data/
datasets/2010/dec/summary-file-1.html. Accessed 26 June 2021.65. R. Griffin, M. Hummel, K. Arkema, A. Guerry, Economic evaluation of sea-level
rise adaptation strongly influenced by hydrodynamic feedbacks: Dataset 1. Dryad.https://doi.org/10.5061/dryad.2z34tmpmb. Deposited 24 June 2021.
66. R. Griffin, M. Hummel, K. Arkema, A. Guerry, Economic evaluation of sea-levelrise adaptation strongly influenced by hydrodynamic feedbacks: Dataset 2. Dryad.https://doi.org/10.5061/dryad.g79cnp5pt. Deposited 24 June 2021.
10 of 10 | PNAShttps://doi.org/10.1073/pnas.2025961118
Hummel et al.Economic evaluation of sea-level rise adaptation strongly influenced by hydrodynamic feedbacks
Dow
nloa
ded
by g
uest
on
Dec
embe
r 22
, 202
1