Embed Size (px)
Citation preview
Economic Evaluation of Routine Childhood Immunization with DTaP, Hib, IPV, MMR and HepB Vaccines
in the United States, 2001
Fangjun Zhou
Health Services Research and Evaluation Branch, NIP, CDC
Collaborators
Hussain R. Yusuf, MBBS, MPH Abigail Shefer, MD Lance Rodewald, MD Susan Y. Chu, PhD Mark Messonnier, PhD Jeanne Santoli, MD, MPH
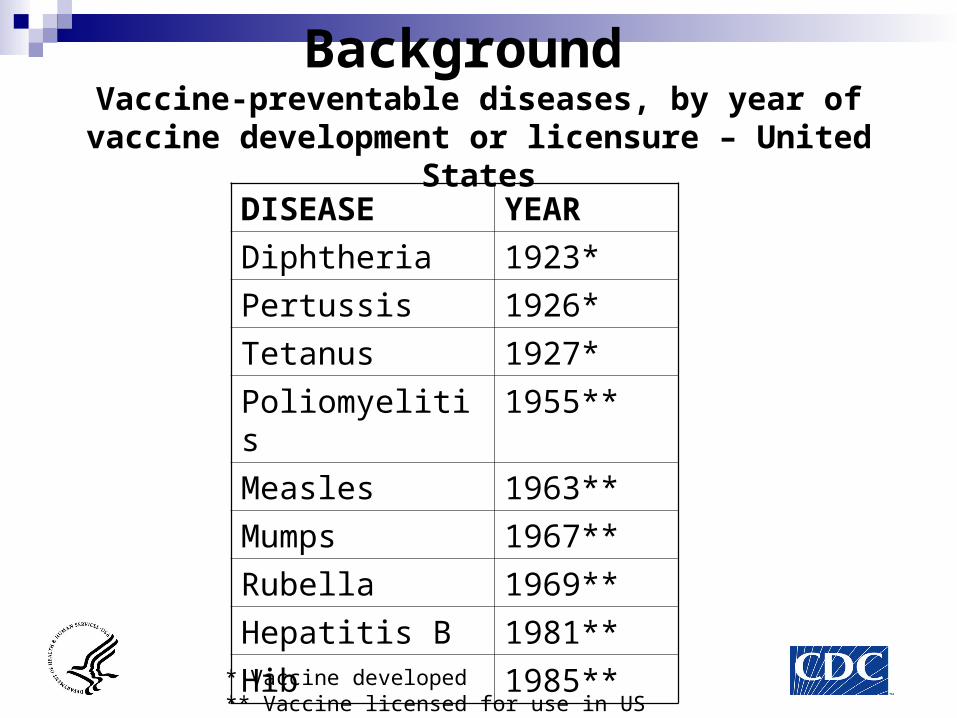
Background Vaccine-preventable diseases, by year of vaccine
development or licensure – United States
DISEASE YEAR
Diphtheria 1923*
Pertussis 1926*
Tetanus 1927*
Poliomyelitis 1955**
Measles 1963**
Mumps 1967**
Rubella 1969**
Hepatitis B 1981**
Hib 1985*** Vaccine developed** Vaccine licensed for use in US
VaccineAge
Birth1
mo2
mos4
mos
Hepatitis B1
Diphtheria, Tetanus, Pertussis2
Haemophilus influenzae Type b3
Inactivated Polio
Measles, Mumps, Rubella4
Varicella5
Pneumococcal6
Hepatitis A7
Influenza8
HepB #1
HepB #2
4-6 yrs
6 mos
12mos
15mos
18mos
24mos
11-12 yrs
13-18 yrs
HepB #3
DTaP DTaP DTaP DTaP TdDTaP
Hib Hib Hib Hib
IPV IPV IPV IPV
MMR #1 MMR #2
Varicella
PCVPCVPCVPCV
Hepatitis A series
Influenza (yearly)
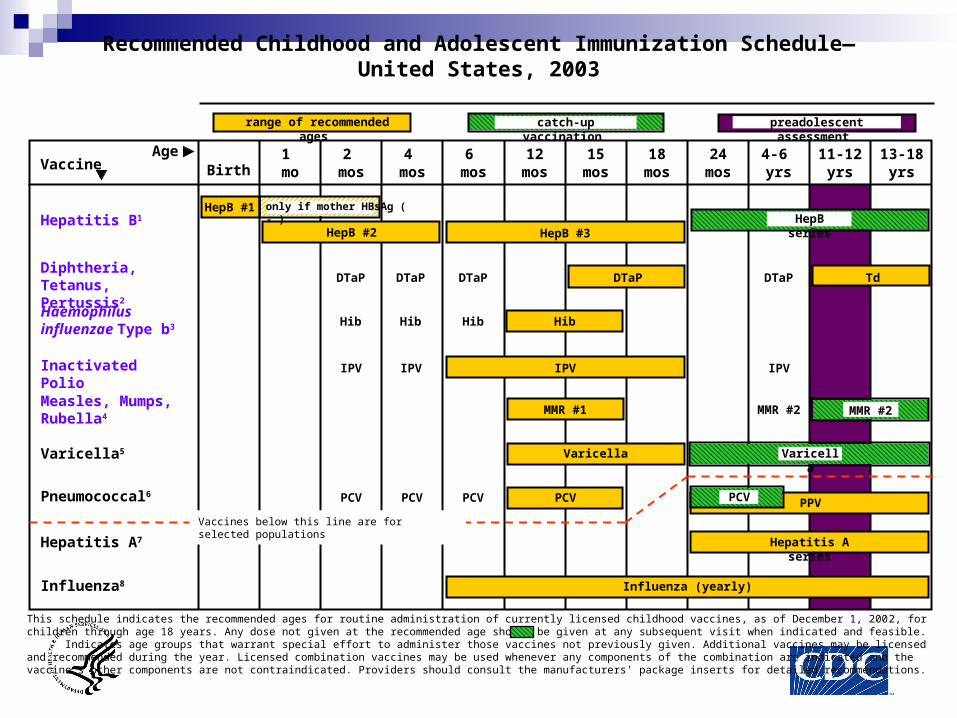
This schedule indicates the recommended ages for routine administration of currently licensed childhood vaccines, as of December 1, 2002, for children through age 18 years. Any dose not given at the recommended age should be given at any subsequent visit when indicated and feasible. Indicates age groups that warrant special effort to administer those vaccines not previously given. Additional vaccines may be licensed and recommended during the year. Licensed combination vaccines may be used whenever any components of the combination are indicated and the vaccine’s other components are not contraindicated. Providers should consult the manufacturers' package inserts for detailed recommendations.
Vaccines below this line are for selected populations
range of recommended ages
PPV
preadolescent assessment
Recommended Childhood and Adolescent Immunization Schedule—United States, 2003
catch-up vaccination
HepB series
MMR #2
Varicella
PCV
only if mother HBsAg ( - )
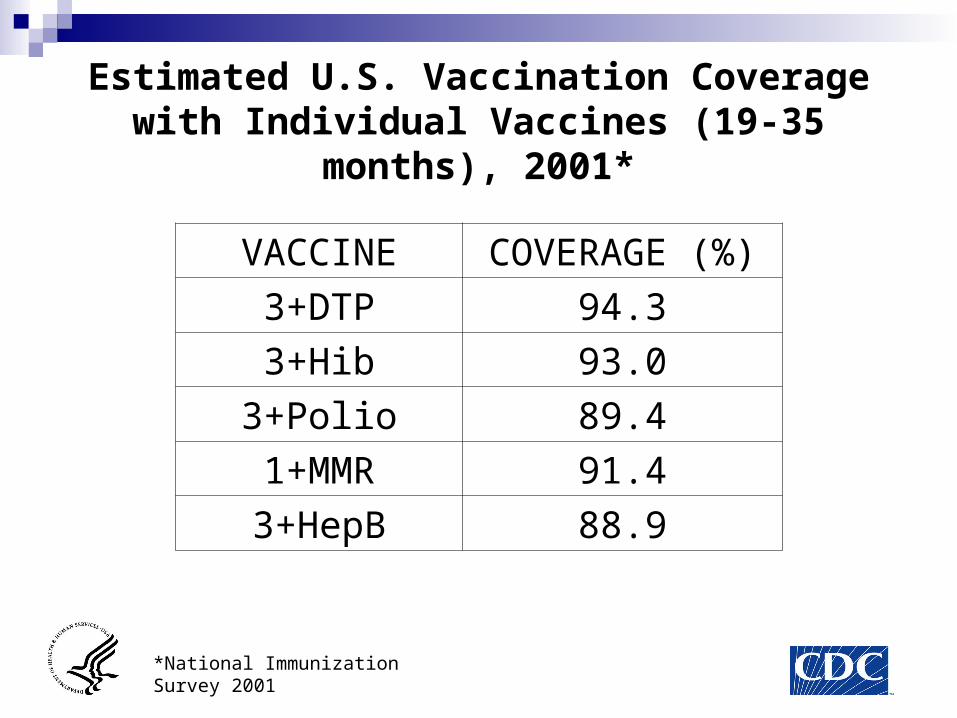
Estimated U.S. Vaccination Coverage with Individual Vaccines (19-35 months), 2001*
VACCINE COVERAGE (%)
3+DTP 94.3
3+Hib 93.0
3+Polio 89.4
1+MMR 91.4
3+HepB 88.9
*National Immunization Survey 2001
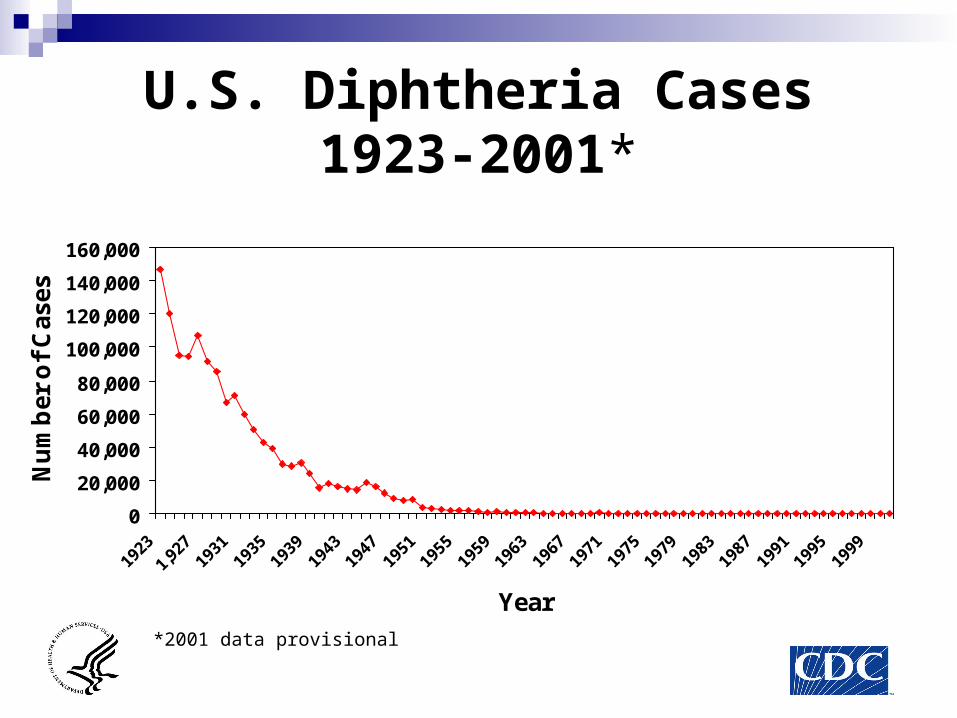
U.S. Diphtheria Cases1923-2001*
0
20,000
40,000
60,000
80,000
100,000
120,000
140,000
160,000
Year
Nu
mb
er o
f C
ases
*2001 data provisional
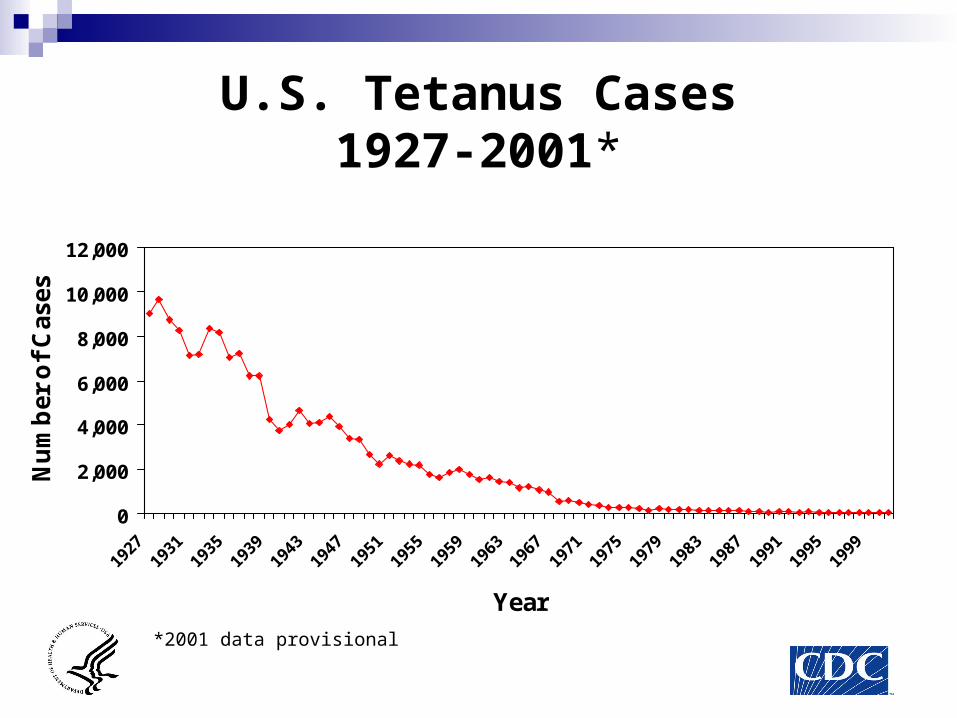
U.S. Tetanus Cases1927-2001*
0
2,000
4,000
6,000
8,000
10,000
12,000
Year
Nu
mb
er o
f C
ases
*2001 data provisional
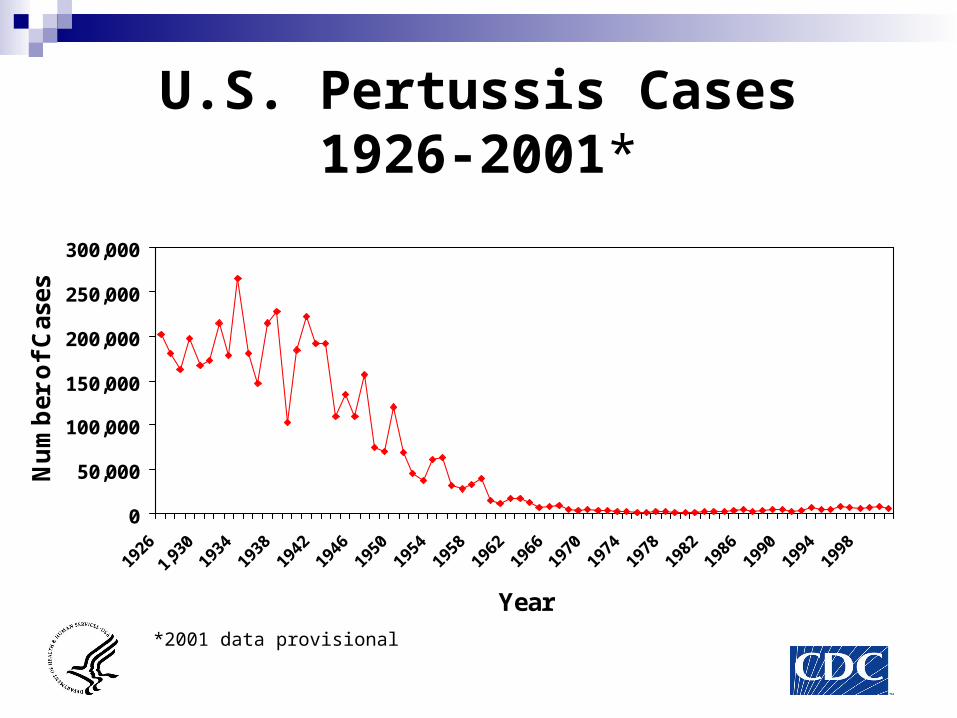
U.S. Pertussis Cases1926-2001*
0
50,000
100,000
150,000
200,000
250,000
300,000
Year
Nu
mb
er o
f C
ases
*2001 data provisional
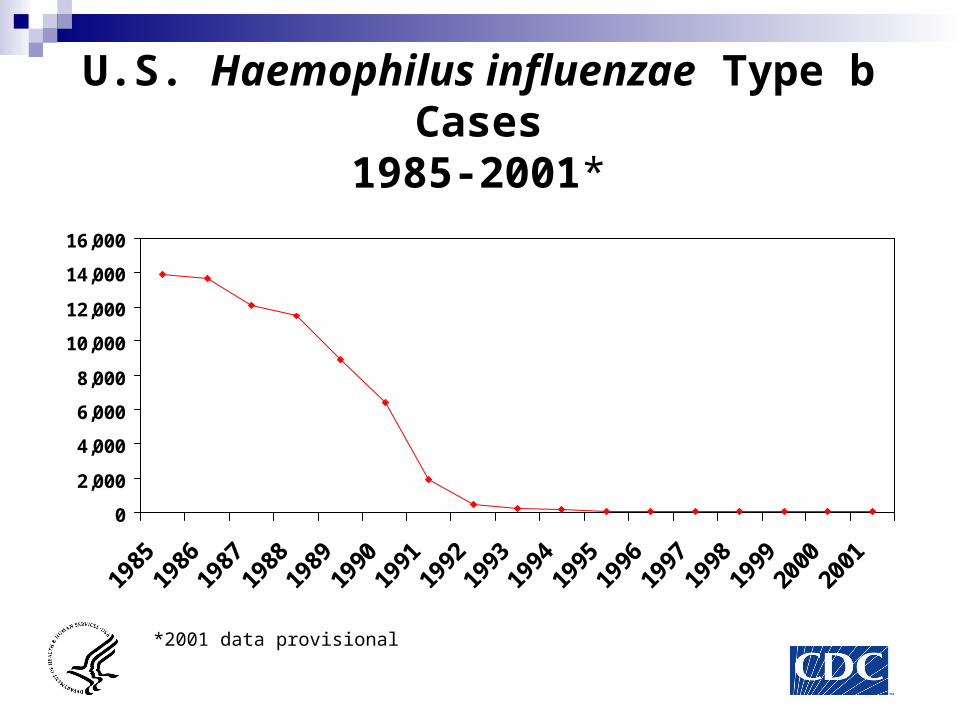
U.S. Haemophilus influenzae Type b Cases
1985-2001*
0
2,000
4,000
6,000
8,000
10,000
12,000
14,000
16,000
1985
1986
1987
1988
1989
1990
1991
1992
1993
1994
1995
1996
1997
1998
1999
2000
2001
*2001 data provisional
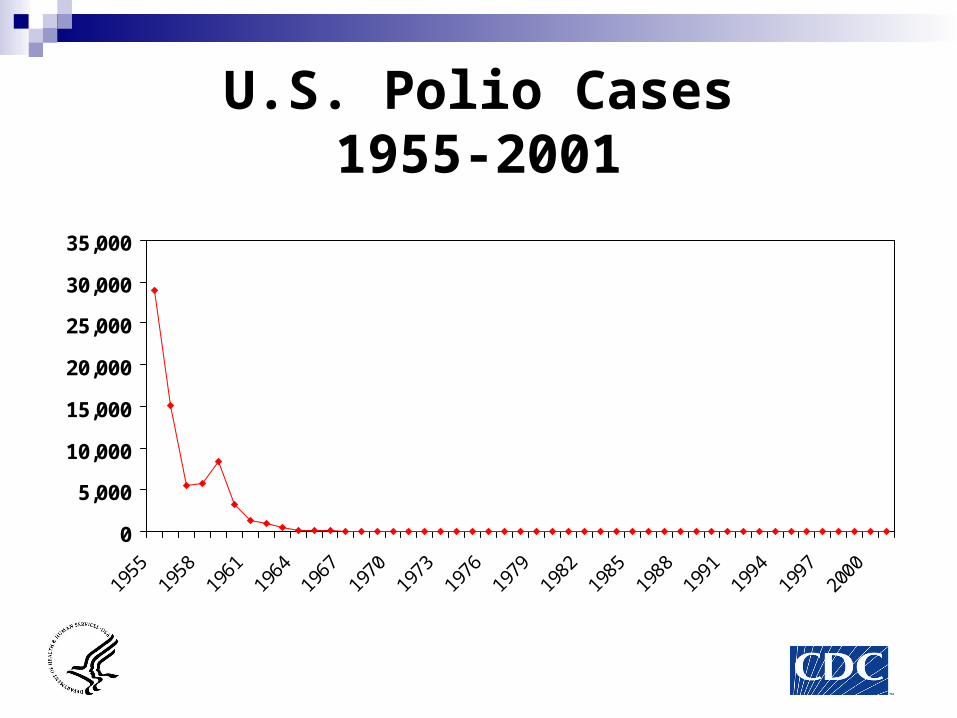
U.S. Polio Cases1955-2001
0
5,000
10,000
15,000
20,000
25,000
30,000
35,000
1955
1958
1961
1964
1967
1970
1973
1976
1979
1982
1985
1988
1991
1994
1997
2000
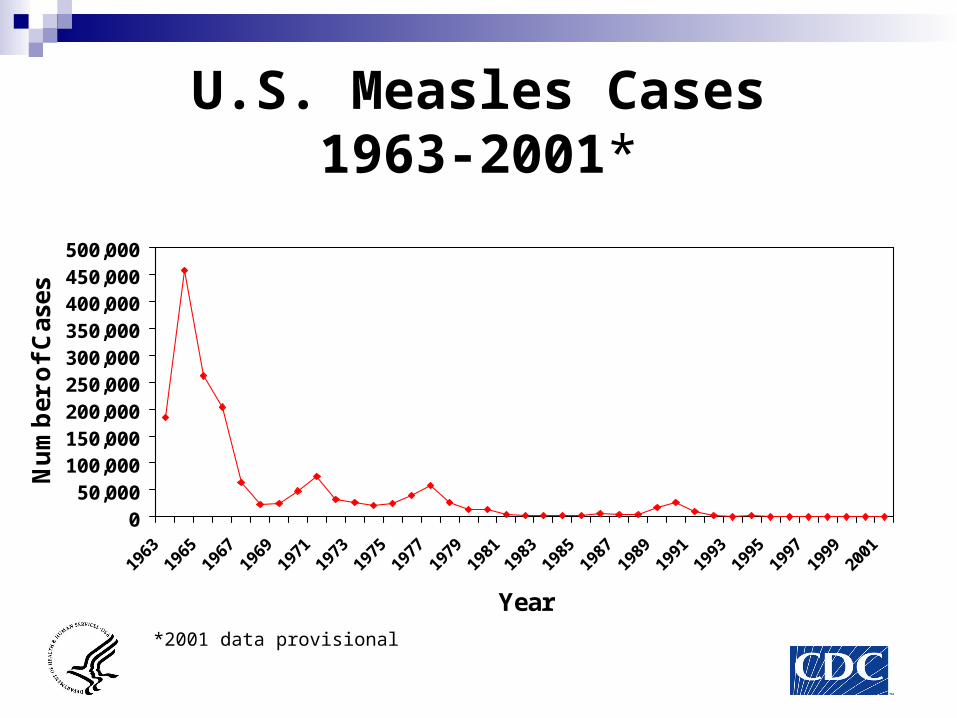
U.S. Measles Cases1963-2001*
050,000
100,000150,000200,000250,000300,000350,000400,000450,000500,000
Year
Nu
mb
er o
f C
ases
*2001 data provisional
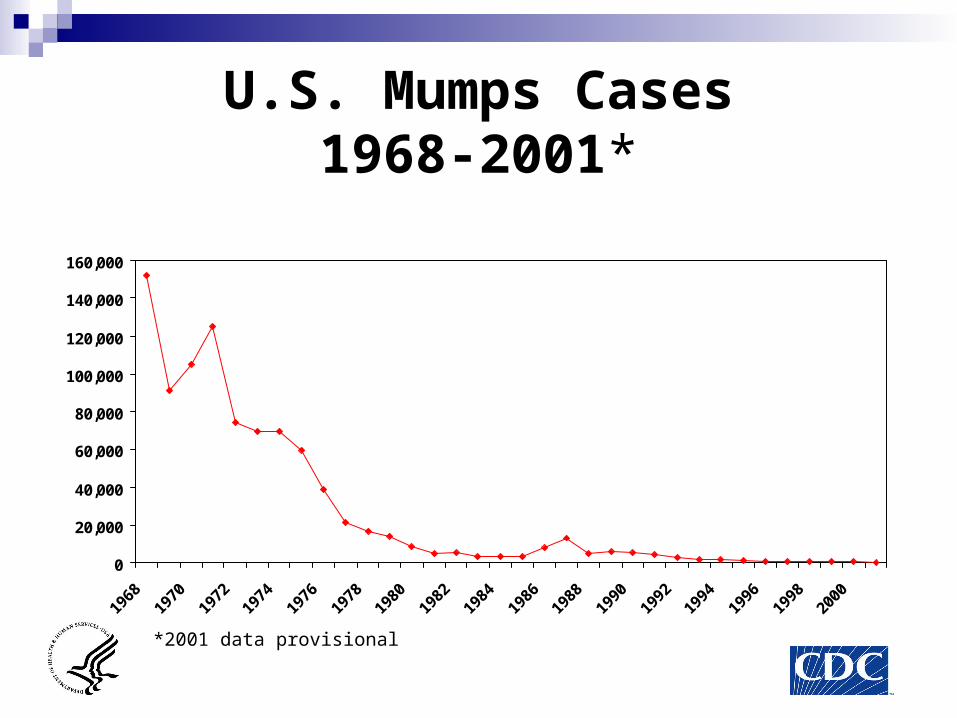
U.S. Mumps Cases1968-2001*
0
20,000
40,000
60,000
80,000
100,000
120,000
140,000
160,000
1968
1970
1972
1974
1976
1978
1980
1982
1984
1986
1988
1990
1992
1994
1996
1998
2000
*2001 data provisional
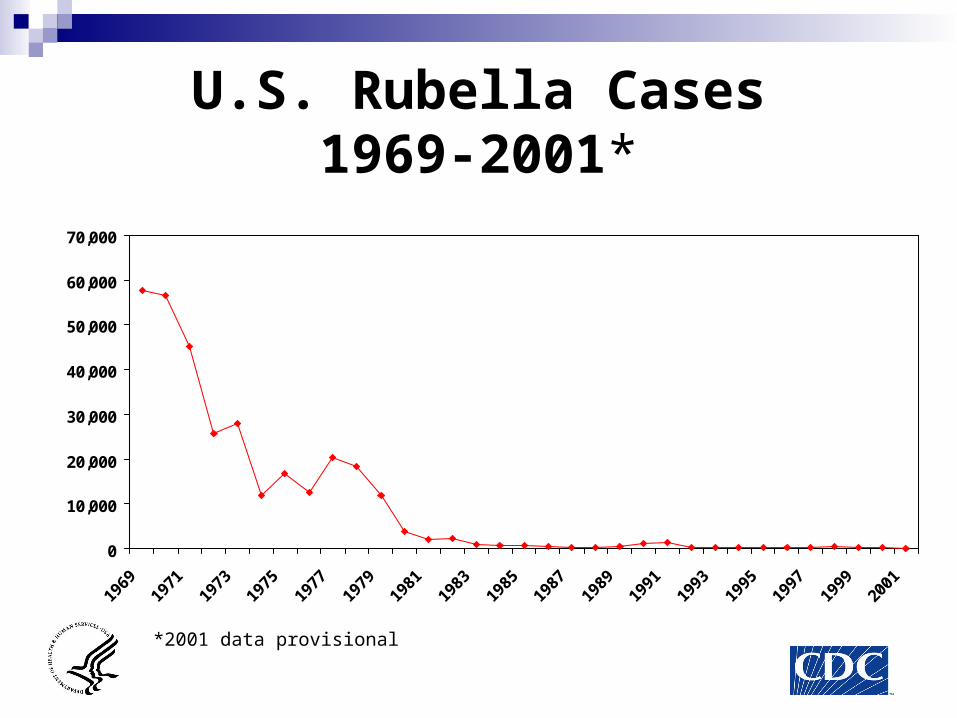
U.S. Rubella Cases1969-2001*
0
10,000
20,000
30,000
40,000
50,000
60,000
70,000
1969
1971
1973
1975
1977
1979
1981
1983
1985
1987
1989
1991
1993
1995
1997
1999
2001
*2001 data provisional
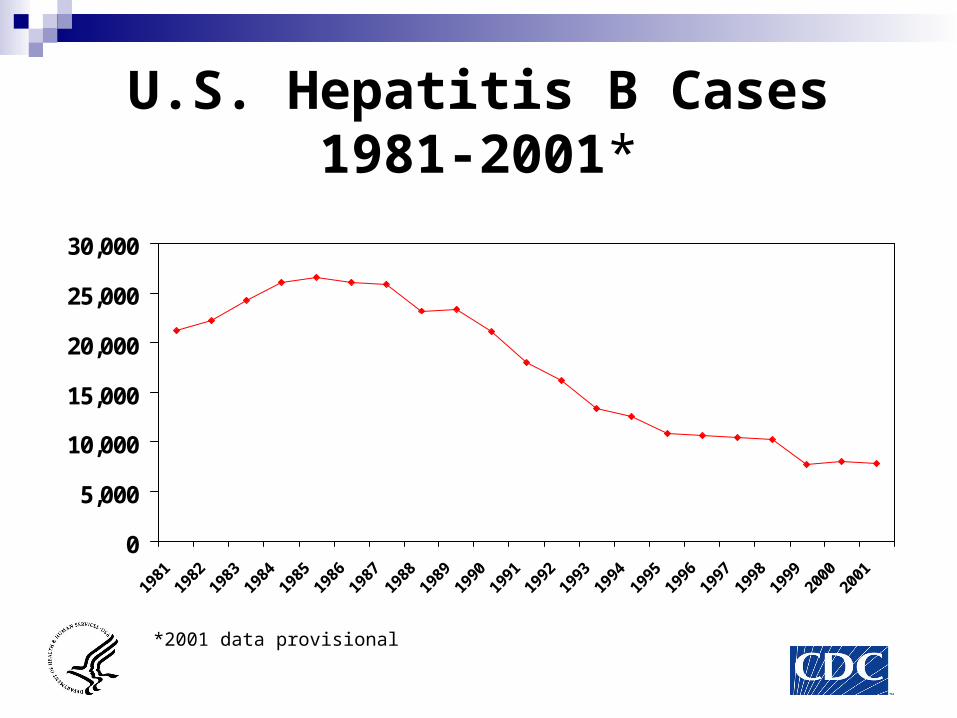
U.S. Hepatitis B Cases1981-2001*
0
5,000
10,000
15,000
20,000
25,000
30,000
1981
1982
1983
1984
1985
1986
1987
1988
1989
1990
1991
1992
1993
1994
1995
1996
1997
1998
1999
2000
2001
*2001 data provisional
Objective
To evaluate the economic impact of routine childhood immunization with DTaP, Hib, IPV, MMR and HepB vaccines in the U.S., from direct cost and societal perspectives.
Methods
Cohort based model U.S. birth cohort in 2001 over the lifetime of the cohort
Decision tree Benefit-cost ratio and net present value of
the program Year 2001 $ and 3% discount rate
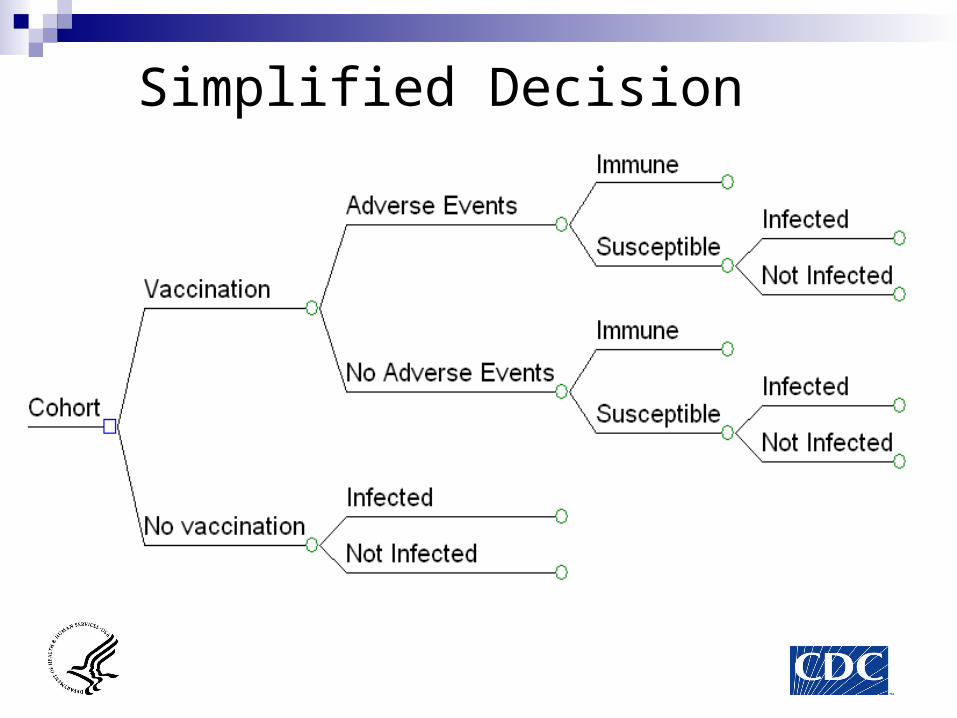
Simplified Decision Tree
B/C Ratio and Net Present Value
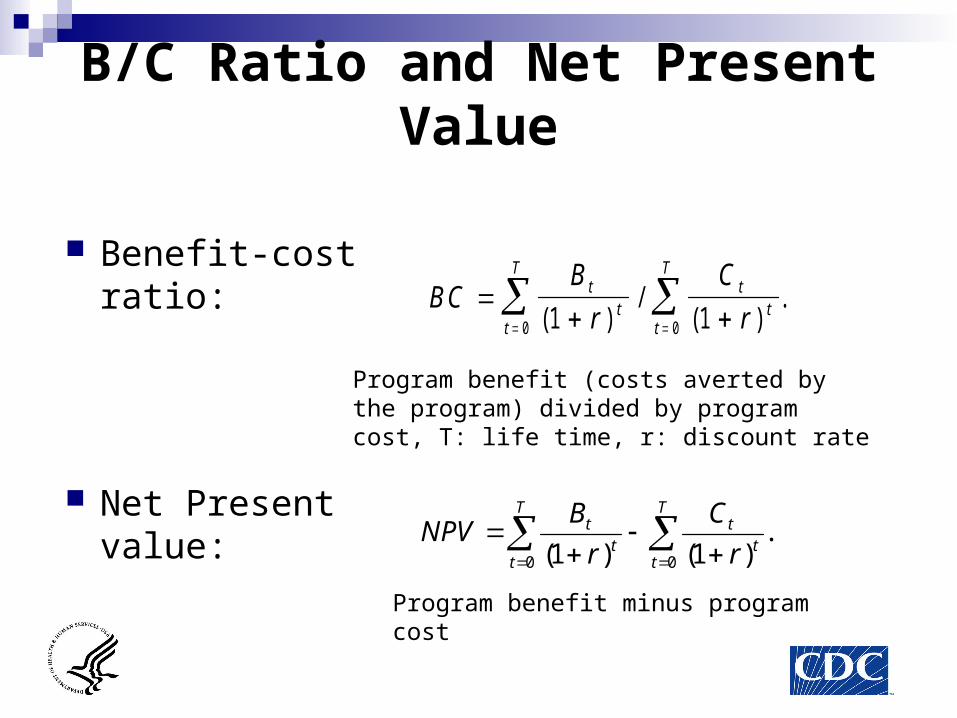
Benefit-cost ratio:
Net Present value:
BCB
r
C
rt
tt
Tt
tt
T
( )
/( )
.1 10 0
.)1()1(0 0
T
t
T
tt
tt
t
r
C
r
BNPV
Program benefit (costs averted by the program) divided by program cost, T: life time, r: discount rate
Program benefit minus program cost
Data
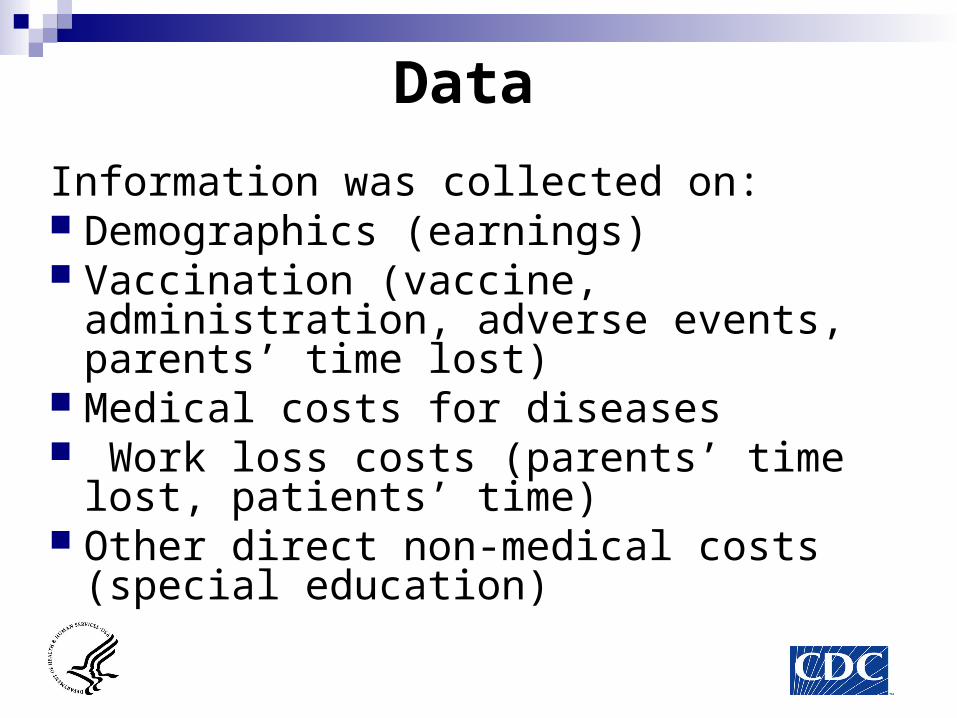
Information was collected on: Demographics (earnings) Vaccination (vaccine, administration,
adverse events, parents’ time lost) Medical costs for diseases Work loss costs (parents’ time lost,
patients’ time) Other direct non-medical costs (special
education)
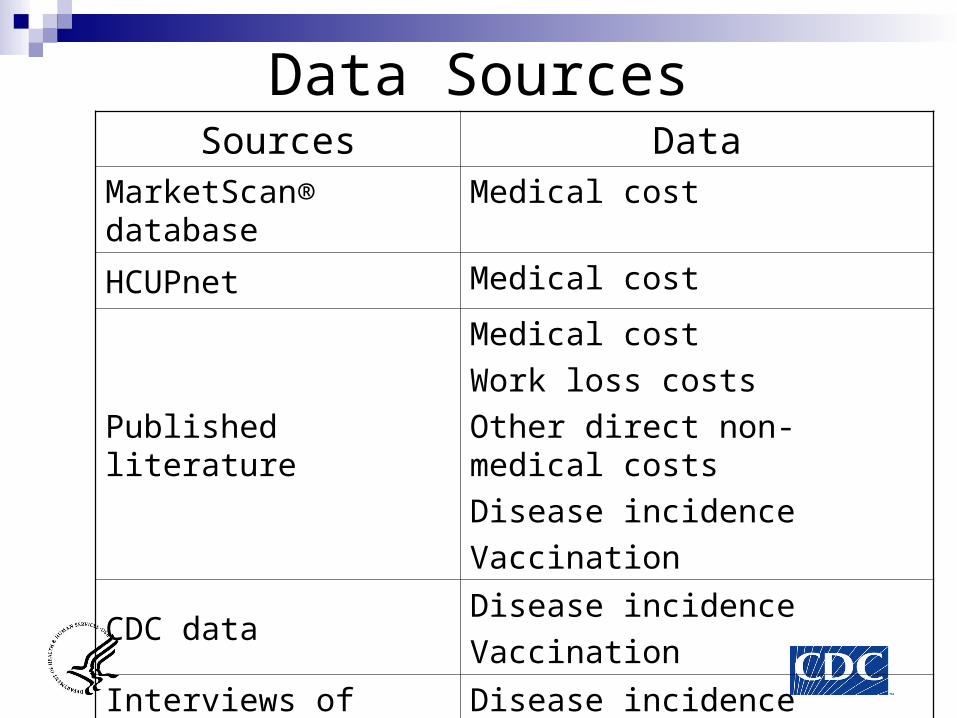
Data SourcesSources Data
MarketScan® database Medical cost
HCUPnet Medical cost
Published literature
Medical cost
Work loss costs
Other direct non-medical costs
Disease incidence
Vaccination
CDC dataDisease incidence
Vaccination
Interviews of experts Disease incidence
Preliminary Results
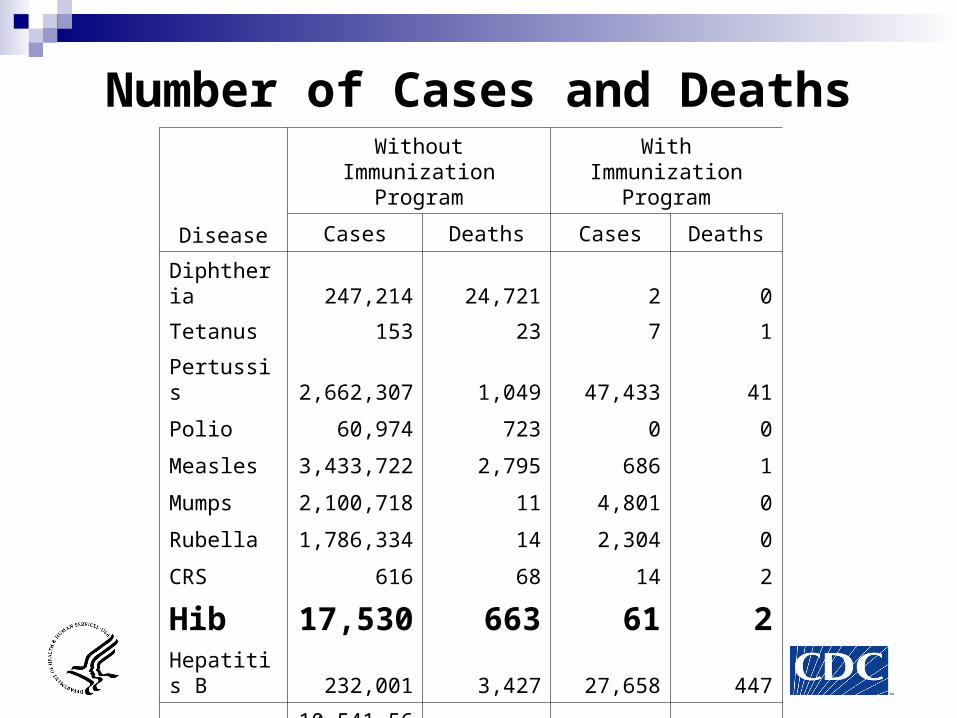
Number of Cases and Deaths
Disease
Without Immunization Program
With Immunization Program
Cases Deaths Cases Deaths
Diphtheria 247,214 24,721 2 0
Tetanus 153 23 7 1
Pertussis 2,662,307 1,049 47,433 41
Polio 60,974 723 0 0
Measles 3,433,722 2,795 686 1
Mumps 2,100,718 11 4,801 0
Rubella 1,786,334 14 2,304 0
CRS 616 68 14 2
Hib 17,530 663 61 2Hepatitis B 232,001 3,427 27,658 447
Total 10,541,569 33,494 82,966 494
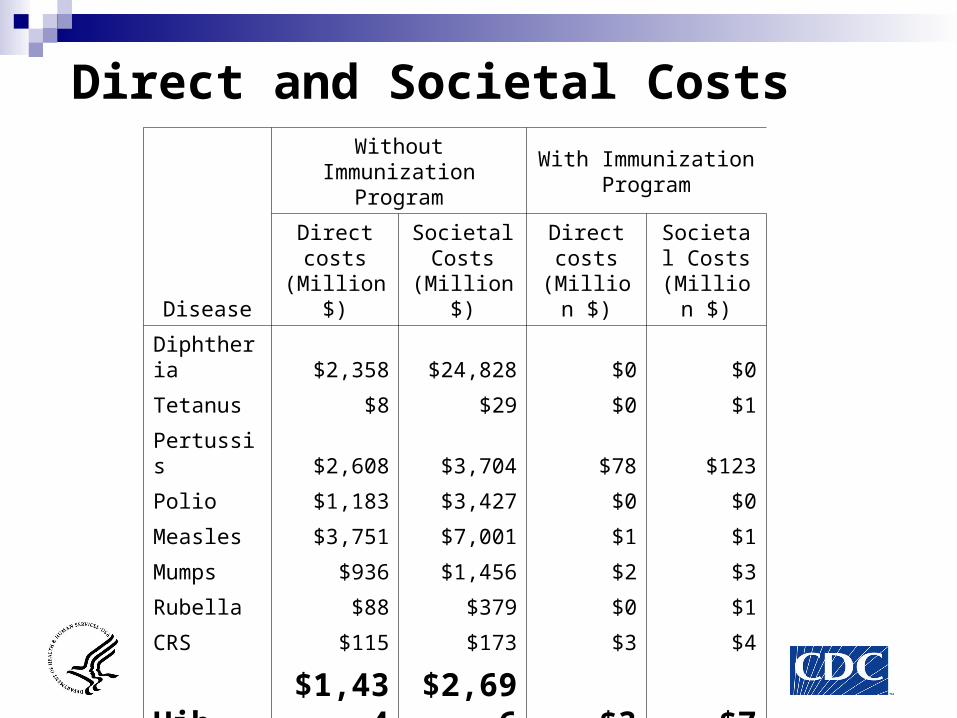
Direct and Societal Costs
Disease
Without Immunization Program
With Immunization Program
Direct costs
(Million $)
Societal Costs
(Million $)
Direct costs
(Million $)
Societal Costs
(Million $)
Diphtheria $2,358 $24,828 $0 $0
Tetanus $8 $29 $0 $1
Pertussis $2,608 $3,704 $78 $123
Polio $1,183 $3,427 $0 $0
Measles $3,751 $7,001 $1 $1
Mumps $936 $1,456 $2 $3
Rubella $88 $379 $0 $1
CRS $115 $173 $3 $4
Hib $1,434 $2,696 $3 $7Hepatitis B $168 $1,272 $21 $167
Total $12,649 $44,964 $109 $307
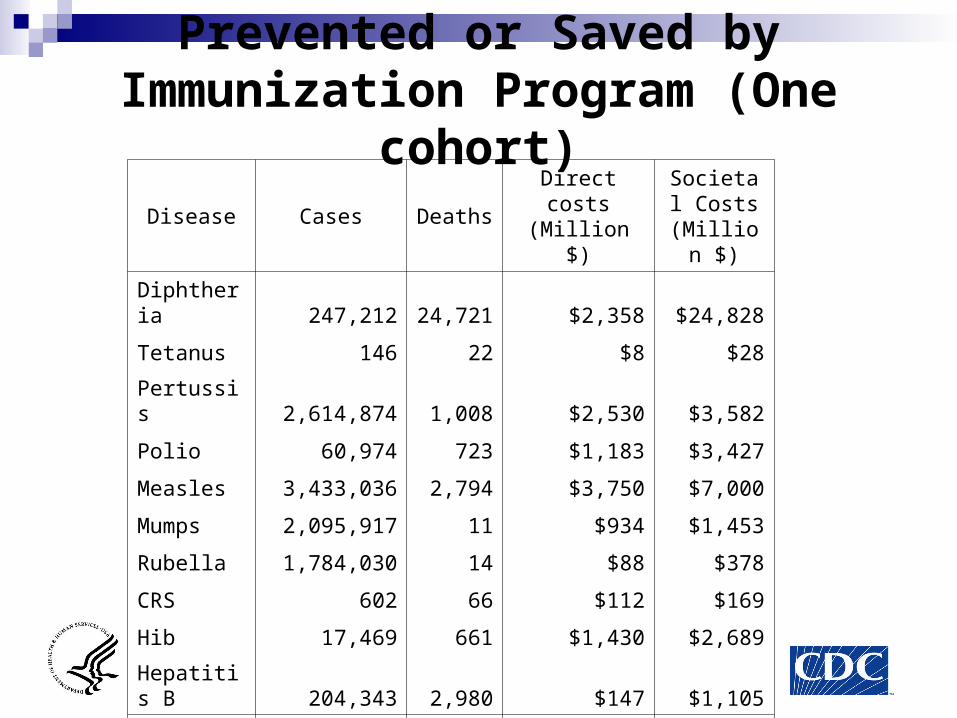
Prevented or Saved by Immunization Program (One cohort)
Disease Cases DeathsDirect costs (Million $)
Societal Costs
(Million $)
Diphtheria 247,212 24,721 $2,358 $24,828
Tetanus 146 22 $8 $28
Pertussis 2,614,874 1,008 $2,530 $3,582
Polio 60,974 723 $1,183 $3,427
Measles 3,433,036 2,794 $3,750 $7,000
Mumps 2,095,917 11 $934 $1,453
Rubella 1,784,030 14 $88 $378
CRS 602 66 $112 $169
Hib 17,469 661 $1,430 $2,689
Hepatitis B 204,343 2,980 $147 $1,105
Total 10,458,603 33,000 $12,539 $44,657
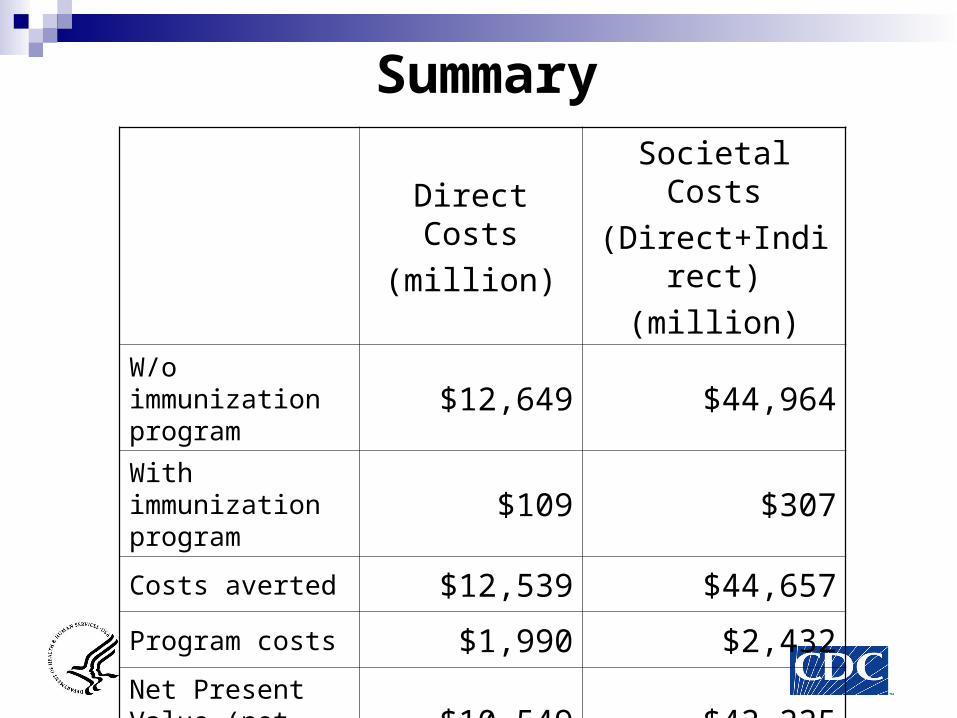
Summary
Direct Costs
(million)
Societal Costs
(Direct+Indirect)
(million)W/o immunization program $12,649 $44,964
With immunization program $109 $307
Costs averted $12,539 $44,657
Program costs $1,990 $2,432
Net Present Value (net saving) $10,549 $42,225
B/C 6.3 : 1 18.4 : 1
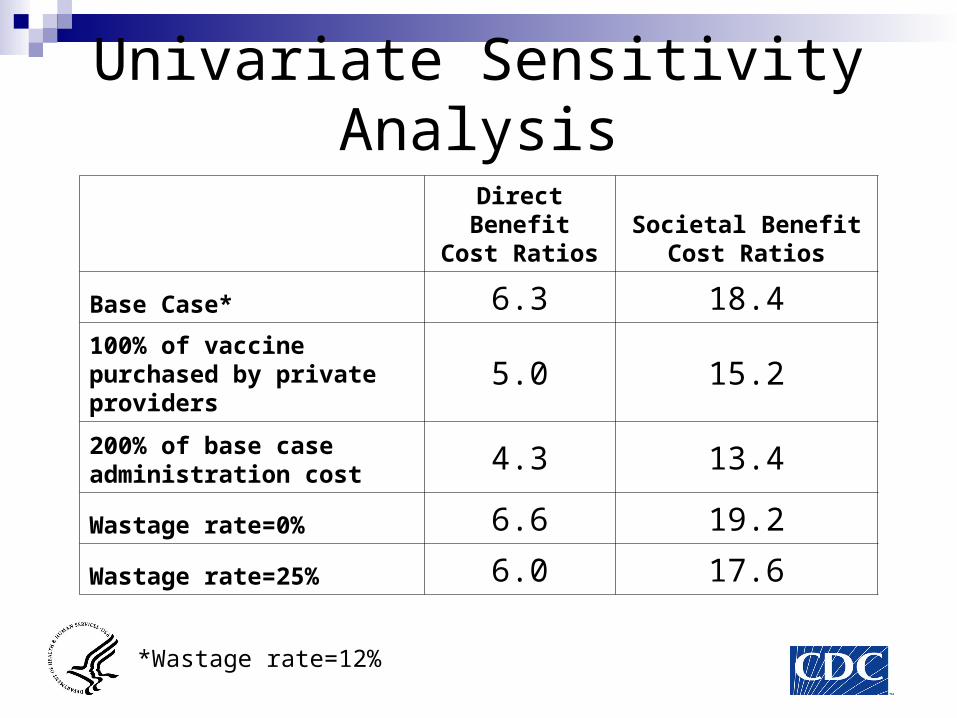
Univariate Sensitivity Analysis
Direct Benefit Cost Ratios
Societal Benefit Cost Ratios
Base Case* 6.3 18.4
100% of vaccine purchased by private providers
5.0 15.2
200% of base case administration cost 4.3 13.4
Wastage rate=0% 6.6 19.2
Wastage rate=25% 6.0 17.6
*Wastage rate=12%
Limitations
The cost data might not be representative
Underestimate of benefit pain and suffering to family and friends of the
ill patient not included in our analyses
Conclusions
The routine childhood immunization program prevents about 10.5 million cases and 33,000 deaths for one birth cohort
It is cost saving (in terms of direct costs, saves about $10.5 billion, and from societal perspective, saves about $42 billion).
Next Steps …
Validation of the model by external experts Disease experts, epidemiologists Economists
Add Varicella and Pneumococcal conjugate vaccines