Embed Size (px)
Citation preview
Economic Evaluation of a Water Network System through the Net Present ValueMethod Based on Cost and Benefit Estimations
Seong-Rin Lim, Donghee Park, Dae Sung Lee, and Jong Moon Park*
AdVanced EnVironmental Biotechnology Research Center, Department of Chemical Engineering, School ofEnVironmental Science and Engineering, Pohang UniVersity of Science and Technology, San 31, Hyoja-dong,Pohang 790-784, South Korea
Water network synthesis has been employed to conserve water resources and reduce freshwater costs for thesake of sustainable development. However, the previous economic evaluations of water network systems didnot comprehensively include all of the tradeoffs incurred in water network synthesis. The objective of thiswork was to evaluate the economic feasibility of a water network system using the net present value (NPV)method and estimate the principal cost and benefit contributors to its NPV. The procedure used for the economicevaluation consisted of water network synthesis, water system design, the estimation of the incremental costsand benefits, and the application of the NPV method. A total of 10 water-using operations in the steel andiron industry suffering from the shortage of water were used to evaluate the profitability of a water networksystem. The water network system was optimized by minimizing the freshwater consumption rates throughnonlinear mathematical programming. This water network system was specifically designed, and its incrementalcosts and benefits were estimated on the basis of the conventional water system. The principal cost contributorto the NPV was the piping cost in the construction stage, while the principal benefit contributor to the NPVwas industrial water used in the operations and maintenance stage. The results of the NPV method includingall of the tradeoffs showed that the water network system was more economical than the conventional watersystem, with reduced industrial water consumption and wastewater generation rates. This work was expectedto activate the implementation of water network systems by demonstrating the high profitability and contributeto the simple generation of a NPV-maximized water network system by estimating the principal cost andbenefit contributors to the NPV used for the streamlined objective function of mathematical formulation.
1. Introduction
Much effort has been made in almost all industries to reducecosts and increase benefits in order to enhance competitivenessand profitability. The retrofitting of processes and the applicationof new technologies are the general methods used in industrialplants to effectively reduce the costs of capital investment andoperating and maintenance (O&M). Because water is a veryimportant natural resource for washing, cleaning, and cooling,and being a product in itself, a variety of water technologieshave been developed to enhance the profitability of the watersupply, water treatment, and wastewater treatment. Since theywere first used for water network optimization in a petroleumrefinery plant in 1980, water network synthesis technologieshave been widely studied and applied to reduce freshwaterconsumption and wastewater generation rates.1-12 However, nooverall economic evaluation has been performed to demonstratethe high profitability of water network systems, with respect tothe tradeoffs of all of the costs and benefits resulting from waternetwork synthesis.
Most previous works have focused on solving the varioustypes of mathematical formulations employed in water networksynthesis, such as nonlinear programming (NLP) and mixed-integer nonlinear programming (MINLP).1-6 Because the non-convexities derived from bilinear variables in the mass balancesof contaminants make it difficult to obtain global optima,methodologies have been developed to obtain optimal solutionsmuch closer to the global optima. A genetic algorithm wasdeveloped to avoid the unacceptable local optima associatedwith MINLP in wastewater minimization.7
Pinch analysis technologies5,13-17 have been studied tographically analyze the process limiting data of water-usingoperations and heuristically produce a water network system.These graphical targeting methods suggest the minimumfreshwater consumption rate of a water system and identify thekey water-using operation which represents a bottleneck andshould be retrofitted in order to further reduce freshwaterconsumption. However, these methods did not take the economicaspects of the design into consideration, even though the useof mathematical programming approaches helped to producean economically friendly network configuration, with theobjective function of formulations manipulated.
The economic evaluation of profitability through the analysisof costs and benefits is essential to the selection of alternatives,because higher profitability is the most powerful driving forceaffecting the final decision-making process in all businesses andindustries, when it comes to choosing among alternatives. Allof the costs and benefits incurred by the various alternativesshould be comprehensively examined and estimated by con-sidering their time value of money and service life, to clearlyevaluate their profitability. In the case of a water networksystem, more accurate economic evaluations are required tosupport its higher profitability, because water network synthesisis a complicated process which incurs many tradeoffs betweenthe costs and benefits derived from the variations in the initialcapital investment and O&M costs.
To date, no detailed economic evaluations inclusive of all ofthe tradeoffs among the various cost contributors have beenmade, with the consequence that the higher profitability of waternetwork systems has not been verified. The objective of thiswork was to evaluate the economic feasibility of a water networksystem through the net present value (NPV) method, to
* To whom all correspondence should be addressed. Tel.:+82-54-279-2275. Fax:+82-54-279-2699. E-mail: [email protected].
7710 Ind. Eng. Chem. Res.2006,45, 7710-7718
10.1021/ie060565p CCC: $33.50 © 2006 American Chemical SocietyPublished on Web 09/19/2006
demonstrate its profitability, and estimate the principal cost andbenefit contributors to the NPV required for the streamlinedobjective function to simply generate a NPV-maximized waternetwork system. The procedure used for this economic evalu-ation consisted of water network synthesis, water system design,the estimation of incremental costs and benefits, and theapplication of the NPV method. A total of 10 water-usingoperations in the steel and iron industry suffering from theshortage of water were used to evaluate the profitability of awater network system. The water network system was synthe-sized on the basis of the optimal solution derived frommathematical programming, and detailed designs were com-pleted for the water network and conventional water systems.The incremental costs and benefits of the water network systemwere estimated on the basis of the conventional water system.The principal cost and benefit contributors to the NPV wereestimated. Finally, the NPV and NPV-related financial indicatorsincluding all of the tradeoffs incurred in the water network
synthesis were evaluated in order to confirm the high profit-ability of the water network system.
2. Methods
Water-using operations in the steel and iron industry sufferingfrom the shortage of water were selected as the water sourcesand sinks in this work. Operational data and field informationwere gathered through a site survey in order to examine potentialopportunities for water reuse. Most of the water-using operationsin the plant were ranked according to the rates of waterconsumption and wastewater generation. A total of 10 water-using operations were finally selected on the basis of their waterquality and regional proximity, with those operations makingconsiderable use of freshwater being prioritized. These wereused for steelmaking, continuous casting, cold forming, andelectroplating processes. The limiting process data for the waternetwork synthesis are presented in Table 1. The distance matrixfor the interconnections between the water sources and sinks,
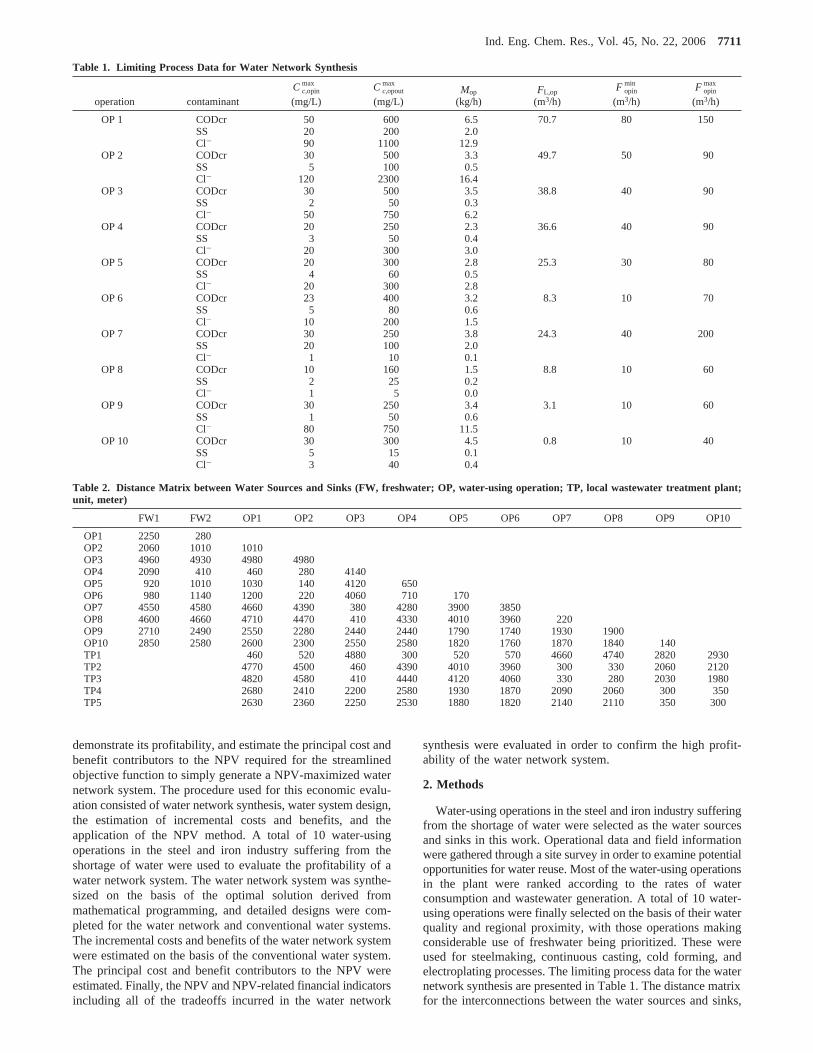
Table 1. Limiting Process Data for Water Network Synthesis
operation contaminantC c,opin
max
(mg/L)C c,opout
max
(mg/L)Mop
(kg/h)FL,op
(m3/h)F opin
min
(m3/h)F opin
max
(m3/h)
OP 1 CODcr 50 600 6.5 70.7 80 150SS 20 200 2.0Cl- 90 1100 12.9
OP 2 CODcr 30 500 3.3 49.7 50 90SS 5 100 0.5Cl- 120 2300 16.4
OP 3 CODcr 30 500 3.5 38.8 40 90SS 2 50 0.3Cl- 50 750 6.2
OP 4 CODcr 20 250 2.3 36.6 40 90SS 3 50 0.4Cl- 20 300 3.0
OP 5 CODcr 20 300 2.8 25.3 30 80SS 4 60 0.5Cl- 20 300 2.8
OP 6 CODcr 23 400 3.2 8.3 10 70SS 5 80 0.6Cl- 10 200 1.5
OP 7 CODcr 30 250 3.8 24.3 40 200SS 20 100 2.0Cl- 1 10 0.1
OP 8 CODcr 10 160 1.5 8.8 10 60SS 2 25 0.2Cl- 1 5 0.0
OP 9 CODcr 30 250 3.4 3.1 10 60SS 1 50 0.6Cl- 80 750 11.5
OP 10 CODcr 30 300 4.5 0.8 10 40SS 5 15 0.1Cl- 3 40 0.4
Table 2. Distance Matrix between Water Sources and Sinks (FW, freshwater; OP, water-using operation; TP, local wastewater treatment plant;unit, meter)
FW1 FW2 OP1 OP2 OP3 OP4 OP5 OP6 OP7 OP8 OP9 OP10
OP1 2250 280OP2 2060 1010 1010OP3 4960 4930 4980 4980OP4 2090 410 460 280 4140OP5 920 1010 1030 140 4120 650OP6 980 1140 1200 220 4060 710 170OP7 4550 4580 4660 4390 380 4280 3900 3850OP8 4600 4660 4710 4470 410 4330 4010 3960 220OP9 2710 2490 2550 2280 2440 2440 1790 1740 1930 1900OP10 2850 2580 2600 2300 2550 2580 1820 1760 1870 1840 140TP1 460 520 4880 300 520 570 4660 4740 2820 2930TP2 4770 4500 460 4390 4010 3960 300 330 2060 2120TP3 4820 4580 410 4440 4120 4060 330 280 2030 1980TP4 2680 2410 2200 2580 1930 1870 2090 2060 300 350TP5 2630 2360 2250 2530 1880 1820 2140 2110 350 300
Ind. Eng. Chem. Res., Vol. 45, No. 22, 20067711
such as the freshwater sources, water-using operations, and localwastewater treatment plants, was used for the cost estimationsof the pipes and piping works, as shown in Table 2. Water wasused for direct and indirect cooling, wet scrubbers, scalebreaking, flume flushing, cleaning, washing, and rinsing.18 Thecapacities and concentrations of the industrial and deionizedwaters of the freshwater sources are presented in Table 3.
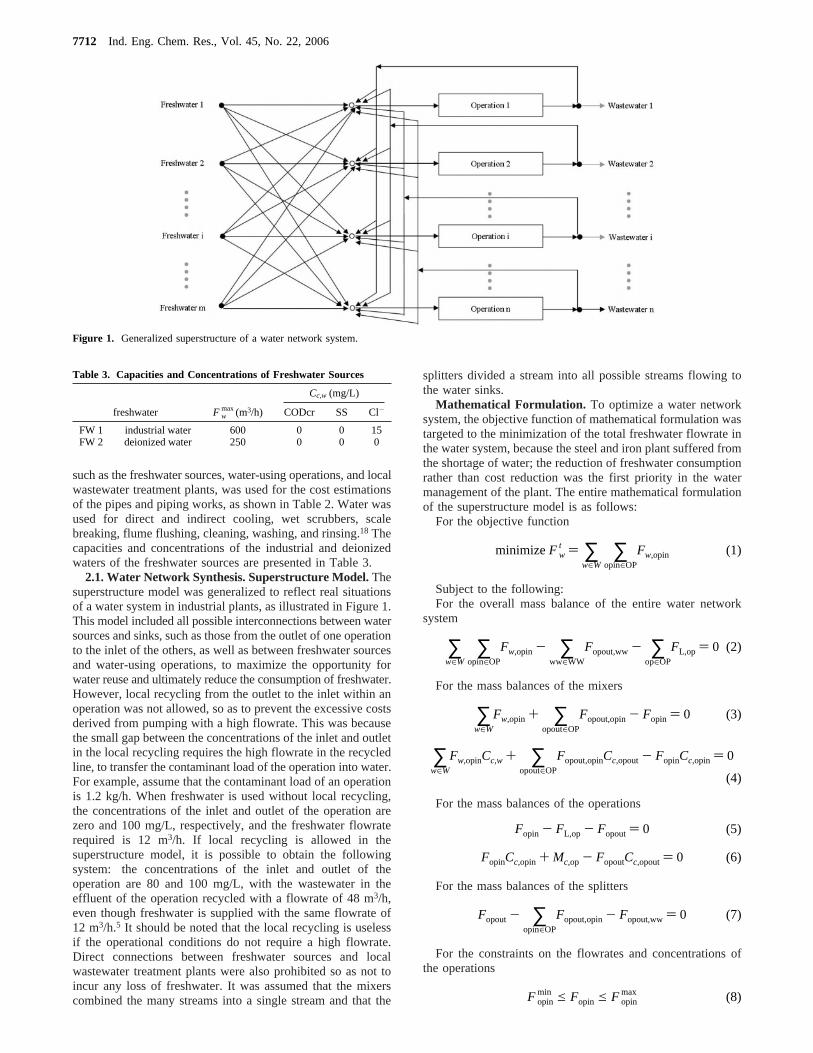
2.1. Water Network Synthesis. Superstructure Model.Thesuperstructure model was generalized to reflect real situationsof a water system in industrial plants, as illustrated in Figure 1.This model included all possible interconnections between watersources and sinks, such as those from the outlet of one operationto the inlet of the others, as well as between freshwater sourcesand water-using operations, to maximize the opportunity forwater reuse and ultimately reduce the consumption of freshwater.However, local recycling from the outlet to the inlet within anoperation was not allowed, so as to prevent the excessive costsderived from pumping with a high flowrate. This was becausethe small gap between the concentrations of the inlet and outletin the local recycling requires the high flowrate in the recycledline, to transfer the contaminant load of the operation into water.For example, assume that the contaminant load of an operationis 1.2 kg/h. When freshwater is used without local recycling,the concentrations of the inlet and outlet of the operation arezero and 100 mg/L, respectively, and the freshwater flowraterequired is 12 m3/h. If local recycling is allowed in thesuperstructure model, it is possible to obtain the followingsystem: the concentrations of the inlet and outlet of theoperation are 80 and 100 mg/L, with the wastewater in theeffluent of the operation recycled with a flowrate of 48 m3/h,even though freshwater is supplied with the same flowrate of12 m3/h.5 It should be noted that the local recycling is uselessif the operational conditions do not require a high flowrate.Direct connections between freshwater sources and localwastewater treatment plants were also prohibited so as not toincur any loss of freshwater. It was assumed that the mixerscombined the many streams into a single stream and that the
splitters divided a stream into all possible streams flowing tothe water sinks.
Mathematical Formulation. To optimize a water networksystem, the objective function of mathematical formulation wastargeted to the minimization of the total freshwater flowrate inthe water system, because the steel and iron plant suffered fromthe shortage of water; the reduction of freshwater consumptionrather than cost reduction was the first priority in the watermanagement of the plant. The entire mathematical formulationof the superstructure model is as follows:
For the objective function
Subject to the following:For the overall mass balance of the entire water network
system
For the mass balances of the mixers
For the mass balances of the operations
For the mass balances of the splitters
For the constraints on the flowrates and concentrations ofthe operations
Figure 1. Generalized superstructure of a water network system.
Table 3. Capacities and Concentrations of Freshwater Sources
Cc,w (mg/L)
freshwater F wmax(m3/h) CODcr SS Cl-
FW 1 industrial water 600 0 0 15FW 2 deionized water 250 0 0 0
minimizeF wt ) ∑
w∈W∑
opin∈OP
Fw,opin (1)
∑w∈W
∑opin∈OP
Fw,opin - ∑ww∈WW
Fopout,ww- ∑op∈OP
FL,op ) 0 (2)
∑w∈W
Fw,opin + ∑opout∈OP
Fopout,opin- Fopin ) 0 (3)
∑w∈W
Fw,opinCc,w + ∑opout∈OP
Fopout,opinCc,opout- FopinCc,opin ) 0
(4)
Fopin - FL,op - Fopout) 0 (5)
FopinCc,opin + Mc,op - FopoutCc,opout) 0 (6)
Fopout- ∑opin∈OP
Fopout,opin- Fopout,ww ) 0 (7)
F opinmin e Fopin e F opin
max (8)
7712 Ind. Eng. Chem. Res., Vol. 45, No. 22, 2006
For the constraints on the maximum flowrates of thefreshwater sources
For the constraints on the prevention of local recycling
where the value of opout is the same as that of opin.Mathematical formulation on the prevention of chemical
precipitation and scaling problems, as well as the watertemperature at the inlet and outlet of the operations, was notincluded in this model. Because the contaminant loads fromthe operations did not generate high concentrations of calcium,magnesium, sulfate, and carbonate, chemical precipitation andscaling problems were not expected in this work. Therefore,chemical oxygen demand by dichromate (CODcr), suspendedsolids (SS), and Cl- were used as good indicators of waterquality in this water network synthesis, because they representthe concentrations of organic contaminants, particles, and ions.The water temperatures at the inlet and outlet of the operationsneeded to be reflected in the mathematical optimization modelrequired for the utilization of water reuse in the direct andindirect cooling processes. However, mathematical formulationon the water temperatures was not included for the sake ofsimplicity of this model, because cooling towers, coolers, andchillers could be used to lower water temperatures at the inletof the operations.
A water network system was produced from the optimalsolution of the mathematical formulation above. GAMS/MINOS19 as an NLP solver was used to find the reasonablesolutions of the mathematical programming model. It should
be mentioned that even local solutions were very useful forindustrial applications if they achieved a significant reductionin freshwater consumption. This was because global optimacannot easily be obtained, because of the nonconvexities derivedfrom the bilinear variables in the mass balances of thecontaminants. The optimal solution of the mathematical pro-gramming model was used to directly embody a water networksystem. However, the original water network system resultingfrom the optimal solution was simplified by eliminatinginefficient interconnections with a low flowrate, to exclude theminor contributors to water reuse and easily perform the costevaluations. The wastewater streams were connected to localwastewater treatment plants, reflecting the real circumstancesin the plant. The local wastewater treatment plants wereconsidered to estimate costs related to the pipelines betweenthe operations and local wastewater treatment plants, as wellas pump pits.
2.2. Water System Design.The water network and conven-tional water systems were designed in detail for the estimationof their costs and benefits. All constituents in the two watersystems were specifically designed for practical implementa-tions. To make impartial comparisons between the two watersystems, the conventional water system was revised using thesame design criteria as those applied to the water networksystem.
Pipe Design.The pipe diameter and head loss were simul-taneously calculated with the flowrate and pipe length. Themaximum head loss criteria were applied to determine thenominal pipe diameter. The Darcy-Weisbach equation20 wasused to calculate the head loss. The maximum head loss basiswas set at 2.0 and 0.2 kgf/cm2 for pumping and gravity flow,respectively. Carbon steel was selected for the pipe material.The Korean Standard, KS D3507, was used to determine specificdata, such as the nominal diameter, wall thickness, and weight.The minimum nominal pipe diameter was set at 1 in. for thesake of simplicity of design. The distances between the watersources and sinks were used as the pipe lengths of theinterconnections.
Cc,opin e Cc,opinmax (9)
Cc,opoute Cc,opoutmax (10)
∑opin∈OP
Fw,opin - F wmax e 0 (11)
Fopout,opin) 0 (12)
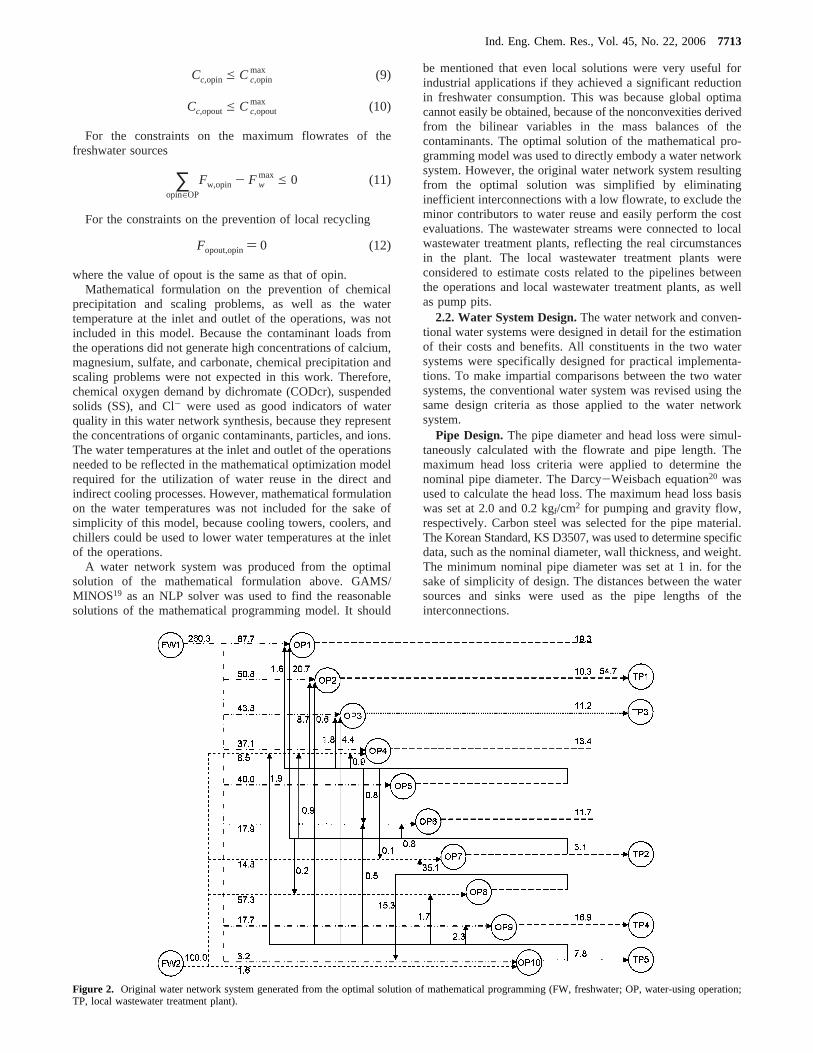
Figure 2. Original water network system generated from the optimal solution of mathematical programming (FW, freshwater; OP, water-using operation;TP, local wastewater treatment plant).
Ind. Eng. Chem. Res., Vol. 45, No. 22, 20067713
Equipment Design. The specifications of the pumps andelectric motors were determined in relation to the flowrate andwater head requirements. The flowrate was obtained from fielddata or the optimal solution of the mathematical programmingmodel for the water network synthesis. The discharge pressureof a pump was determined by summing both the head lossesthrough the pipes and the water pressure required for the water-using operation. In the case of a pump having a manifoldconnected to more than one operation, the maximum head lossamong those of the various pipelines was selected to determineits specifications. The water pressures required at the end ofthe pipe were assumed to be 2.5 and 1.0 kgf/cm2 for water-using operations and local wastewater treatment plants, respec-tively.
Pump Pit Design.Pump pits were required for the storageof wastewater prior to its being pumped to the local wastewatertreatment plants. The hydraulic retention times of the pump pitswere all set at 30 min, to prevent the short circuit of the electricmotors derived from their frequent startup.
2.3. The Estimation of Incremental Cost and Benefit.Allof the costs of the two water systems were classified andestimated over the duration of the service life on the basis oftheir detailed designs before calculating the incremental costsand benefits. The conventional costs used for the traditionalmanagement accounting were estimated in this work, becauseof their tangibility, even though the environmental accounting,which includes potentially hidden costs, contingent costs, image/relationship costs, and external costs, has recently been high-lighted.21,22 To utilize the NPV methods for the evaluation ofprofitability, the incremental costs and benefits of the waternetwork system were estimated, with the costs of the conven-tional water system used as a baseline. In other words, theincremental benefits, such as the reduction in costs comparedwith the baseline, were regarded as profits in the economicevaluation, because a water system employed as a utility forthe main production systems could not directly yield profitsthrough its own operations.23 This method was generally appliedto decision-making processes for the selection of the best optionamong alternative investments.
The cost estimations were first performed for four catego-ries: engineering and supervision, construction, O&M, anddisposal. All of the categories, with the exception of O&M,were assumed to be performed by contractors, which was normalin the field of engineering and construction. Therefore, thecontractor’s overheads and profits were estimated for the sakeof the accuracy of the cost analysis. The engineering and
supervision cost was composed of the costs of the basic anddetailed designs, as well as supervision activities. The construc-tion cost was specifically divided into the costs of pipes, pipingworks, equipment, installation, pump pit works, and constructionexpenses, as well as the contractor’s overheads and profits. TheO&M cost included the utilities consumption costs for industrialand deionized water and electricity, as well as maintenance andrepairs cost. The disposal cost consisted of decommissioning,recycling, landfill, and construction expenses, as well as thecontractor’s overheads and profits. Detailed cost estimationswere performed using a database consisting of price and costinformation.24,25 The O&M cost recurred over the service lifeof the two water systems, while the other costs, such asengineering and supervision, construction, and disposal, wereincurred at the starting and finishing points of the service life.
The incremental costs and benefits of the water networksystem were consecutively generated from the results of thepreceding cost estimations. The costs of the conventional watersystem were used as a baseline to calculate the incremental costsand benefits. The incremental costs were obtained by subtractingthe costs of the conventional water system from those of thewater network system in the categories of engineering andsupervision, construction, and disposal. Most of the incrementalcosts were derived from the complicated interconnectionsrequired for networking. The incremental benefits were calcu-lated by subtracting the costs of the water network system fromthose of the conventional water system in the O&M categoryand were derived from the reduction in the consumption ofutilities resulting from the reuse of water.
2.4. The Application of the Net Present Value Method.The NPV method was used to economically evaluate and verifythe profitability of a water network system using its incrementalcosts and benefits.23 The NPV method was based on the timevalue of money in relation to cash flows. The NPV was obtainedby summing the discounted amounts and the initial investmentafter a series of future cash flows was discounted. The morepositive the NPV, the more profitable the investment. Whentotal income taxes are included in the economic evaluation,23
the equation for the NPV can be expressed as follows:
This NPV method was useful to support the final decision-making process for alternative investments, because all of thetradeoffs between costs and benefits were comprehensivelycombined and expressed as a single value, regardless of thetime points at which they were incurred. The NPV method wasmodified to calculate the payout period23 and the internal rateof return (IRR),23 both of which were applied to the economicevaluation of alternative investments. The payout period wasregarded as the duration required for the incremental benefitsto allow for the full recovery of the initial incremental costs,with the NPV set to zero in eq 13. The IRR was obtained bycalculating the interest rate which caused the NPV to be equalto zero in eq 13. The payout period and IRR related to the NPVmethod were also used as profitability indicators for thecomparison of different alternatives.
All of the factors in the above NPV equation should bedetermined in order to accurately evaluate the profitability. Theservice life was set to 15 years with respect to the lifetime ofthe pipes and mechanical equipment. To discount future costsand benefits, the interest rate was set to 5.7%, by taking into
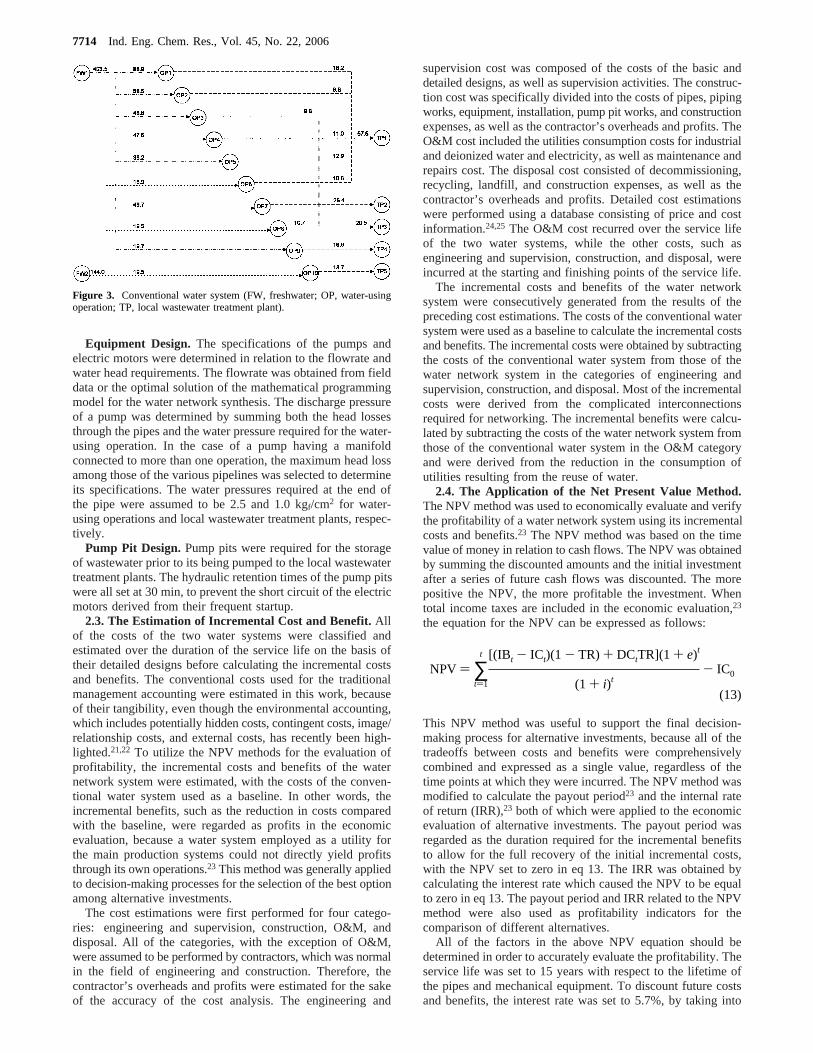
Figure 3. Conventional water system (FW, freshwater; OP, water-usingoperation; TP, local wastewater treatment plant).
NPV ) ∑t)1
t [(IB t - ICt)(1 - TR) + DCtTR](1 + e)t
(1 + i)t- IC0
(13)
7714 Ind. Eng. Chem. Res., Vol. 45, No. 22, 2006
account the yields of treasury bonds (5 years) over the last 10years in South Korea.26 The escalation rate was assumed to be3.0% targeted by the Bank of Korea for the period between2004 and 2006.27 And the sensitivity analysis of the NPV andNPV-related methods was performed to estimate the effect ofthe interest and escalation rates. Deprecation costs wereestimated by the straight-line method over the service life.23 Atotal income-tax rate of 27.5% was applied to this economicevaluation, according to the tax law in South Korea.28
3. Results and Discussion
Water Network Synthesis. The original water networksystem was generated from the optimal solution of the math-ematical programming formulated for the water network su-perstructure model after the process-limiting and freshwatersource data were applied to the formulation, as illustrated inFigure 2. When the original water network system was comparedwith the conventional water system shown in Figure 3, the totalfreshwater consumption rate was reduced by 11.1%, from 405.1to 360.3 m3/h, with the water network system contributing tothe conservation of water resources and the reduction of theoperating cost. The saving of industrial water was greater thanthat of deionized water. The flowrate of industrial waterdecreased by 12.5%, from 297.5 to 260.3 m3/h, while that ofdeionized water was diminished by 7.1%, from 107.6 to 100.0m3/h. This result was derived from the objective function ofthe mathematical programming, which was to minimize the sumof all of the freshwater flowrates, regardless of the water qualityand unit cost of the freshwater sources. The total wastewaterflowrate was also reduced by 47.7%, from 138.7 to 93.9 m3/h.Because decreasing the hydraulic loads engendered the stableequalization of contaminant loads and flowrate in the influentsof the local wastewater treatment plants, because of highhydraulic retention times in the pump pits, the enhancement ofremoval efficiencies and the reduction of operating cost were
expected in the existing local wastewater treatment plants, eventhough the contaminant loads were not changed through thewater network synthesis. In other words, because all of the localwastewater treatment plants were composed of physical andchemical treatment processes, such as coagulation, flocculation,and sedimentation, their chemical dosages and velocity gradientsfor mixing could be stably maintained without sudden variations,because of equalized concentrations and the flowrate in theinfluents of the local wastewater treatment plants. The initialcapital investment cost could be reduced by constructing smallerwastewater treatment plants if the water network system wereapplied to a new plant.
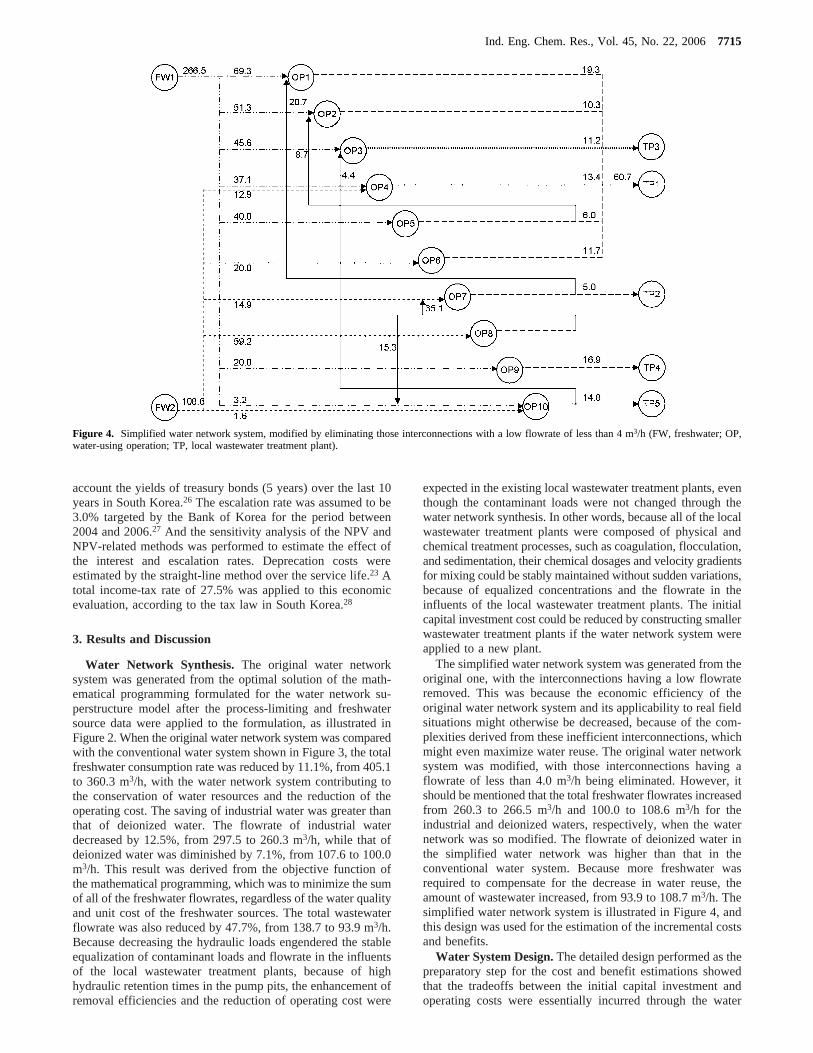
The simplified water network system was generated from theoriginal one, with the interconnections having a low flowrateremoved. This was because the economic efficiency of theoriginal water network system and its applicability to real fieldsituations might otherwise be decreased, because of the com-plexities derived from these inefficient interconnections, whichmight even maximize water reuse. The original water networksystem was modified, with those interconnections having aflowrate of less than 4.0 m3/h being eliminated. However, itshould be mentioned that the total freshwater flowrates increasedfrom 260.3 to 266.5 m3/h and 100.0 to 108.6 m3/h for theindustrial and deionized waters, respectively, when the waternetwork was so modified. The flowrate of deionized water inthe simplified water network was higher than that in theconventional water system. Because more freshwater wasrequired to compensate for the decrease in water reuse, theamount of wastewater increased, from 93.9 to 108.7 m3/h. Thesimplified water network system is illustrated in Figure 4, andthis design was used for the estimation of the incremental costsand benefits.
Water System Design.The detailed design performed as thepreparatory step for the cost and benefit estimations showedthat the tradeoffs between the initial capital investment andoperating costs were essentially incurred through the water
Figure 4. Simplified water network system, modified by eliminating those interconnections with a low flowrate of less than 4 m3/h (FW, freshwater; OP,water-using operation; TP, local wastewater treatment plant).
Ind. Eng. Chem. Res., Vol. 45, No. 22, 20067715
network synthesis, as summarized in Table 4. The total lengthand weight of the pipes increased by 38.7 and 12.9%,respectively. The total weight of the pumps and motors increasedby 7.0 and 1.4%, respectively, and the total volume of the pumppits increased by 38.6%, because four more pumps, motors, andpump pits were required for water networking. In the O&M,stage, the electricity requirement increased by 10.8%, from 99.6to 110.4 kW. These results were because the increases in thequantities of the pipe, pump, motor, pump pit, and electricityconsumption required for the water reuse outweighed thedecreases in those resulting from the decrease in the industrialwater consumption and wastewater generation. However, itshould be noted that the overall profitability derived from thesetwo different effects cannot be determined, because of thetradeoffs among the constituents of the water network system.
The Estimation of the Incremental Cost and Benefit.Allof the possible costs required for the conventional water andwater network systems were estimated throughout the servicelife, to evaluate the incremental costs and benefits. None of thecosts incurred in the O&M and disposal stages took intoconsideration the time value of money in this step, because thosecosts could be discounted in the NPV method. The costs in theO&M stage were estimated on an annual basis.
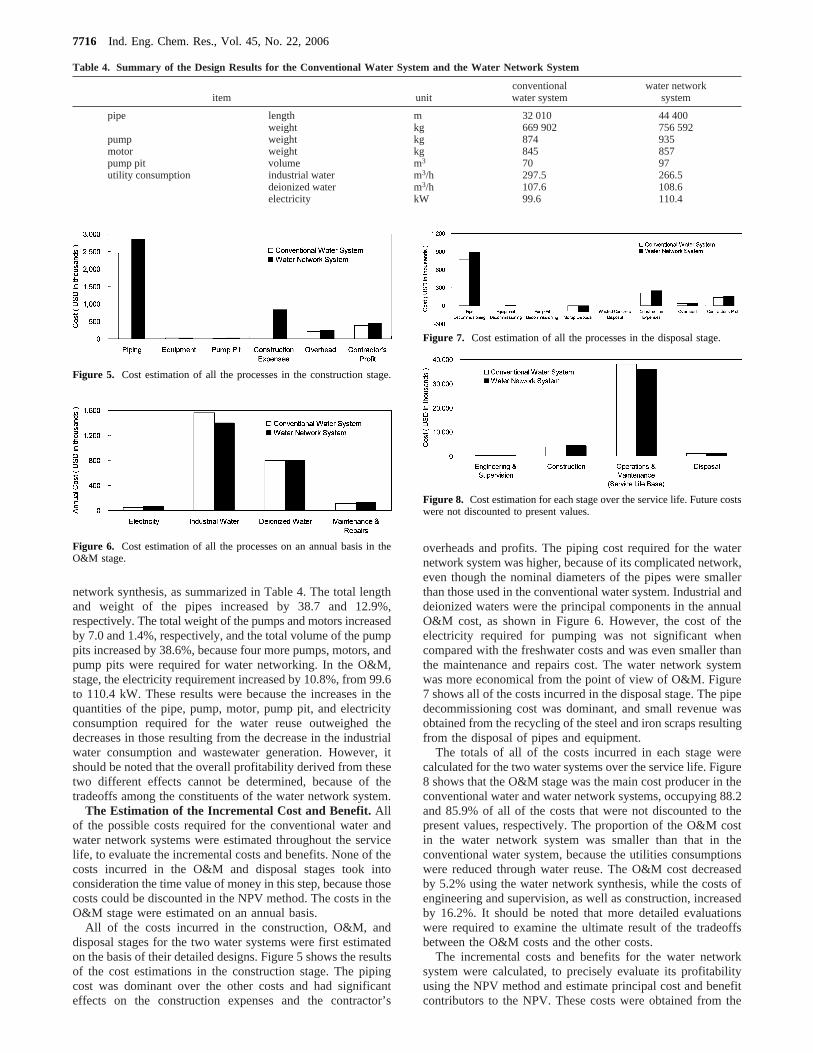
All of the costs incurred in the construction, O&M, anddisposal stages for the two water systems were first estimatedon the basis of their detailed designs. Figure 5 shows the resultsof the cost estimations in the construction stage. The pipingcost was dominant over the other costs and had significanteffects on the construction expenses and the contractor’s
overheads and profits. The piping cost required for the waternetwork system was higher, because of its complicated network,even though the nominal diameters of the pipes were smallerthan those used in the conventional water system. Industrial anddeionized waters were the principal components in the annualO&M cost, as shown in Figure 6. However, the cost of theelectricity required for pumping was not significant whencompared with the freshwater costs and was even smaller thanthe maintenance and repairs cost. The water network systemwas more economical from the point of view of O&M. Figure7 shows all of the costs incurred in the disposal stage. The pipedecommissioning cost was dominant, and small revenue wasobtained from the recycling of the steel and iron scraps resultingfrom the disposal of pipes and equipment.
The totals of all of the costs incurred in each stage werecalculated for the two water systems over the service life. Figure8 shows that the O&M stage was the main cost producer in theconventional water and water network systems, occupying 88.2and 85.9% of all of the costs that were not discounted to thepresent values, respectively. The proportion of the O&M costin the water network system was smaller than that in theconventional water system, because the utilities consumptionswere reduced through water reuse. The O&M cost decreasedby 5.2% using the water network synthesis, while the costs ofengineering and supervision, as well as construction, increasedby 16.2%. It should be noted that more detailed evaluationswere required to examine the ultimate result of the tradeoffsbetween the O&M costs and the other costs.
The incremental costs and benefits for the water networksystem were calculated, to precisely evaluate its profitabilityusing the NPV method and estimate principal cost and benefitcontributors to the NPV. These costs were obtained from the
Table 4. Summary of the Design Results for the Conventional Water System and the Water Network System
item unitconventionalwater system
water networksystem
pipe length m 32 010 44 400weight kg 669 902 756 592
pump weight kg 874 935motor weight kg 845 857pump pit volume m3 70 97utility consumption industrial water m3/h 297.5 266.5
deionized water m3/h 107.6 108.6electricity kW 99.6 110.4
Figure 5. Cost estimation of all the processes in the construction stage.
Figure 6. Cost estimation of all the processes on an annual basis in theO&M stage.
Figure 7. Cost estimation of all the processes in the disposal stage.
Figure 8. Cost estimation for each stage over the service life. Future costswere not discounted to present values.
7716 Ind. Eng. Chem. Res., Vol. 45, No. 22, 2006
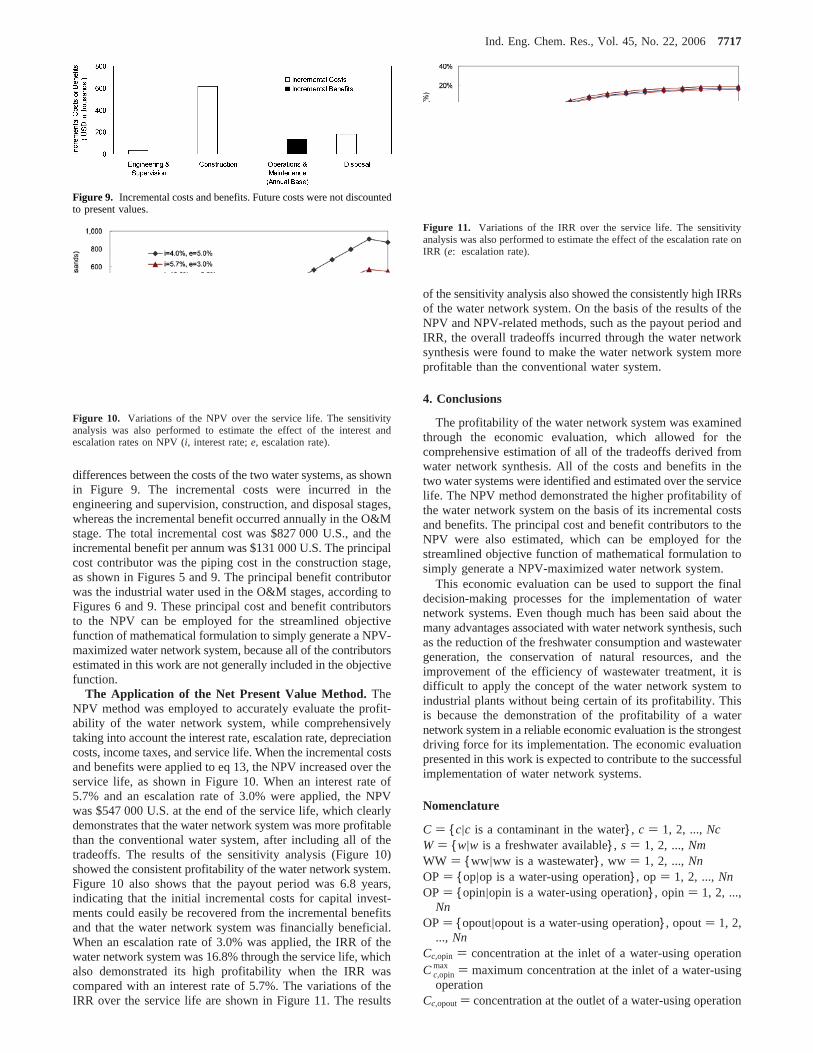
differences between the costs of the two water systems, as shownin Figure 9. The incremental costs were incurred in theengineering and supervision, construction, and disposal stages,whereas the incremental benefit occurred annually in the O&Mstage. The total incremental cost was $827 000 U.S., and theincremental benefit per annum was $131 000 U.S. The principalcost contributor was the piping cost in the construction stage,as shown in Figures 5 and 9. The principal benefit contributorwas the industrial water used in the O&M stages, according toFigures 6 and 9. These principal cost and benefit contributorsto the NPV can be employed for the streamlined objectivefunction of mathematical formulation to simply generate a NPV-maximized water network system, because all of the contributorsestimated in this work are not generally included in the objectivefunction.
The Application of the Net Present Value Method.TheNPV method was employed to accurately evaluate the profit-ability of the water network system, while comprehensivelytaking into account the interest rate, escalation rate, depreciationcosts, income taxes, and service life. When the incremental costsand benefits were applied to eq 13, the NPV increased over theservice life, as shown in Figure 10. When an interest rate of5.7% and an escalation rate of 3.0% were applied, the NPVwas $547 000 U.S. at the end of the service life, which clearlydemonstrates that the water network system was more profitablethan the conventional water system, after including all of thetradeoffs. The results of the sensitivity analysis (Figure 10)showed the consistent profitability of the water network system.Figure 10 also shows that the payout period was 6.8 years,indicating that the initial incremental costs for capital invest-ments could easily be recovered from the incremental benefitsand that the water network system was financially beneficial.When an escalation rate of 3.0% was applied, the IRR of thewater network system was 16.8% through the service life, whichalso demonstrated its high profitability when the IRR wascompared with an interest rate of 5.7%. The variations of theIRR over the service life are shown in Figure 11. The results
of the sensitivity analysis also showed the consistently high IRRsof the water network system. On the basis of the results of theNPV and NPV-related methods, such as the payout period andIRR, the overall tradeoffs incurred through the water networksynthesis were found to make the water network system moreprofitable than the conventional water system.
4. Conclusions
The profitability of the water network system was examinedthrough the economic evaluation, which allowed for thecomprehensive estimation of all of the tradeoffs derived fromwater network synthesis. All of the costs and benefits in thetwo water systems were identified and estimated over the servicelife. The NPV method demonstrated the higher profitability ofthe water network system on the basis of its incremental costsand benefits. The principal cost and benefit contributors to theNPV were also estimated, which can be employed for thestreamlined objective function of mathematical formulation tosimply generate a NPV-maximized water network system.
This economic evaluation can be used to support the finaldecision-making processes for the implementation of waternetwork systems. Even though much has been said about themany advantages associated with water network synthesis, suchas the reduction of the freshwater consumption and wastewatergeneration, the conservation of natural resources, and theimprovement of the efficiency of wastewater treatment, it isdifficult to apply the concept of the water network system toindustrial plants without being certain of its profitability. Thisis because the demonstration of the profitability of a waternetwork system in a reliable economic evaluation is the strongestdriving force for its implementation. The economic evaluationpresented in this work is expected to contribute to the successfulimplementation of water network systems.
Nomenclature
C ) {c|c is a contaminant in the water}, c ) 1, 2, ...,NcW ) {w|w is a freshwater available}, s ) 1, 2, ...,NmWW ) {ww|ww is a wastewater}, ww ) 1, 2, ...,NnOP ) {op|op is a water-using operation}, op ) 1, 2, ...,NnOP ) {opin|opin is a water-using operation}, opin ) 1, 2, ...,
NnOP ) {opout|opout is a water-using operation}, opout) 1, 2,
..., NnCc,opin ) concentration at the inlet of a water-using operationCc,opin
max ) maximum concentration at the inlet of a water-usingoperation
Cc,opout) concentration at the outlet of a water-using operation
Figure 9. Incremental costs and benefits. Future costs were not discountedto present values.
Figure 10. Variations of the NPV over the service life. The sensitivityanalysis was also performed to estimate the effect of the interest andescalation rates on NPV (i, interest rate;e, escalation rate).
Figure 11. Variations of the IRR over the service life. The sensitivityanalysis was also performed to estimate the effect of the escalation rate onIRR (e: escalation rate).
Ind. Eng. Chem. Res., Vol. 45, No. 22, 20067717
Cc,opoutmax ) maximum concentration at the outlet of a water-using operation
Cc,w ) freshwater concentrationDC ) depreciation costFL,op ) water loss rate in a water-using operationFopin ) flowrate at the inlet of a water-using operationF opin
min ) minimum flowrate at the inlet of a water-usingoperation
F opinmax ) maximum flowrate at the inlet of a water-usingoperation
Fopout ) flowrate at the outlet of a water-using operationFopout,opin ) flowrate from the outlet to the inlet of a water-
using operationFopout,ww ) flowrate from the outlet of a water-using operation
to a wastewaterF w
max ) maximum flowrate for a freshwaterFw
t ) total flowrate of freshwatersFw,opin ) flowrate from a freshwater to a water-using operationMc,op ) mass load of contaminantNPV ) net present valuee ) escalation ratei ) interest rateIBt ) incremental benefitIC0 ) initial incremental costICt ) incremental costt ) timeTR ) income-tax rate
Acknowledgment
This work was financially supported in part by the KoreanScience and Engineering Foundation (R11-2003-006-01001-1)through the Advanced Environmental Biotechnology ResearchCenter at Pohang University of Science and Technology and inpart by the Korean Ministry of Commerce, Industry, and Energythrough the Korean National Cleaner Production Center. Thiswork was also supported by the program for advanced educationof chemical engineers (second stage of BK21).
Literature Cited
(1) Takama, N.; Kuriyama, T.; Shiroko, K.; Umeda, T. Optimal WaterAllocation in a Petroleum Refinery.Comput. Chem. Eng.1980, 4, 251-258.
(2) Bagajewicz, M. A Review of Recent Design Procedures for WaterNetworks in Refineries and Process Plants.Comput. Chem. Eng.2000, 24,2093-2113.
(3) Quesada, I.; Grossmann, I. E. Global Optimization of Bilinear ProcessNetworks with Multicomponent Flows.Comput. Chem. Eng.1995, 19,1219-1242.
(4) Doyle, S.; Smith, R. Targeting Water Reuse with Multiple Con-taminants.Process Saf. EnViron. Prot. 1997, 75, 181-189.
(5) Mann, J. G.; Liu, Y. A.Industrial Water Reuse and WastewaterMinimization; McGraw-Hill: New York, 1999.
(6) Alva-Argaez, A.; Kokossis, A.; Smith, R. Wastewater Minimizationof Industrial Systems using an Integrated Approach.Comput. Chem. Eng.1998, 22, S741-S744.
(7) Prackotpol, D.; Srinophakun, T. GAPinch: Genetic AlgorithmToolbox for Water Pinch Technology.Chem. Eng. Process.2004, 43, 203-217.
(8) Huang, C. H.; Chang, C. T.; Ling, H. C.; Chang, C. C. AMathematical Programming Model for Water Usage and Treatment NetworkDesign.Ind. Eng. Chem. Res.1999, 38, 2666-2679.
(9) Bagajewicz, M.; Savelski, M. On the Use of Linear Models for theDesign of Water Utilization Systems in Process Plants with a SingleContaminant.Chem. Eng. Res. Des.2001, 79, 600-610.
(10) Yang, Y. H.; Huang, Y. L. Synthesis of an Optimal WastewaterReuse Netowork.Waste Manage. (Amsterdam, Neth)2000, 20, 311-319.
(11) Gunaratnam, M.; Alva-Argaez, A.; Kokossis, A.; Kim, J.-K.; Smith,R. Automated Design of Total Water Systems.Ind. Eng. Chem. Res.2005,44, 588-599.
(12) Thoming, J. Optimal Design of Zero-Water Discharge RinsingSystems.EnViron. Sci. Technol.2002, 36, 1107-1112.
(13) Wang, Y. P.; Smith, R. Wastewater Minimization.Chem. Eng. Sci.1994, 49, 981-1006.
(14) Wang, Y. P.; Smith, R. Wastewater Minimization with FlowrateConstraint.Trans. 1nst. Chem. Eng.1995, 73, Part A, 889-904.
(15) Kuo, W.-C.; Smith, R. Designing for the Interactions betweenWater-Use and Effluent Treatment.Chem. Eng. Res. Des.1998, 76, 287-301.
(16) Hallale, N. A New Graphical Targeting Method for WaterMinimization. AdV. EnViron. Res.2002, 6, 377-390.
(17) El-Halwagi, M. M.; Gabrien, F.; Harell, D. Rigorous GraphicalTargeting for Resource Conservation via Material Recycle/Reuse Networks.Ind. Eng. Chem. Res.2003, 42, 4319-4328.
(18) DeVelopment Document for Proposed Effluent Limitations Guide-lines and Standards for the Iron and Steel Manufacturing Point SourceCategory; EPA-821-B-00-001; U.S. Environmental Protection Agency:Washington, DC, 2000.
(19) GAMS, A User Guide; GAMS Development Corporation: Wash-ington DC, 2005.
(20) McGhee, T. J.Water Supply and Sewerage; McGraw-Hill: NewYork, 1991.
(21) An Introduction to EnVironmental Accounting as a BusinessManagement Tool: Key Concepts and Terms; U.S. Environmental ProtectionAgency: Washington, DC, 1995.
(22) The Lean and Green Supply Chain Managers to Reduce Costs andImproVe EnVironmental Performance; U.S. Environmental ProtectionAgency: Washington, DC, 2000.
(23) Peters, M. S.; Timmerhaus, K. D.Plant Design and Economicsfor Chemical Engineers; McGraw-Hill: New York, 1991.
(24) The Price Information; Korea Price Information, Corp.: Seoul,South Korea 2006; Vol. 422.
(25) The Cost Estimation; Korea Price Information, Corp.: Seoul, SouthKorea, 2006.
(26) Korea National Statistical Office. http://www.nso.go.kr (accessedJan 2006).
(27) The Bank of Korea. http://www.bok.or.kr (accessed Jan 2006).(28) Korea National Tax Service. http://www.nts.go.kr (accessed Jan
2006).
ReceiVed for reView May 5, 2006ReVised manuscript receiVed July 14, 2006
AcceptedJuly 20, 2006
IE060565P
7718 Ind. Eng. Chem. Res., Vol. 45, No. 22, 2006