Embed Size (px)
Citation preview

Journal of Substance Abuse Treatment 38 (2010) 31–41
Regular article
Economic evaluation of a prerelease substance abuse treatment programfor repeat criminal offenders
Michael T. French, (Ph.D.)a,⁎, Hai Fang, (Ph.D.)b,1, Ralph Fretz, (Ph.D.)c,2
aHealth Economics Research Group, Department of Sociology, Department of Epidemiology and Public Health, and Department of Economics,University of Miami, Coral Gables, FL 33124-2030, USA
bHealth Economics Research Group, Department of Sociology, University of Miami, Coral Gables, Florida 33146-0719, USAcCommunity Education Centers, Kearny, New Jersey 07032
Received 17 March 2009; received in revised form 27 May 2009; accepted 22 June 2009
Abstract
Substance use disorders are common conditions among repeat criminal offenders. Without addressing these underlying substance usebehaviors, parolees are significantly more likely to recidivate within 1 year of release. New Jersey is one of the first states to actively pursuesubstance abuse treatment options for inmates who are in the final stages of their sentences. Given the fiscal realities of taxpayer-supportedprograms, such initiatives must clearly demonstrate economic benefits for sustainability and growth. This article conducted one of the fewcomprehensive economic evaluations of prerelease substance abuse treatment to determine whether Community Education Centers'programs in New Jersey generated desirable outcomes, significant economic benefits, and positive net benefits. Relative to a matchedcomparison group of offenders who did not receive treatment, the intervention group returned an average economic benefit of $4,307 to$6,209 over the 1-year postrelease period. These economic benefits are underscored by the fact that the treatment program is housed in aseparate facility, with a lower average per diem from that of the general inmate population. These results provide quantitative economicevidence that prerelease substance abuse treatment programs have the potential to reduce recidivism and save taxpayer dollars without addingto existing prison resources. © 2010 Elsevier Inc. All rights reserved.
Keywords: Cost; Economic benefits; Substance abuse treatment
1. Introduction
The United States spent $204 billion (approximately $690per capita) in 2005 to incarcerate arrestees and convictedcriminals in federal, state, and local prisons/jails (U.S.Courts: The Federal Judiciary, 2006; U.S. Department ofJustice, Bureau of Justice Statistics, 2008). Adjusted forinflation, this figure has increased by 31% over the past
⁎ Corresponding author. Health Economics Research Group, Depart-ment of Sociology, Department of Epidemiology and Public Health, andDepartment of Economics, University of Miami, 5202 University Drive,Merrick Building, Room 121F, P.O. Box 248162, Coral Gables, FL 33124-2030, USA. Tel.: +1 305 284 6039; fax: +1 305 284 5310.
E-mail addresses: [email protected] (M.T. French),[email protected] (H. Fang), [email protected] (R. Fretz).
1 Tel.: +1 305 284 5405; fax: +1 305 284 5716.2 Tel.: +1 973 589 1114; fax: +1 973 589 4101.
0740-5472/09/$ – see front matter © 2010 Elsevier Inc. All rights reserved.doi:10.1016/j.jsat.2009.06.001
5 years and by 81% over the past 10 years (U.S. Departmentof Justice, 2008). Jail and prison overcrowding is at crisislevels in most states, leading to suspended sentences, earlyparoles, and construction of new facilities. Predictably, manyof the new inmates entering these facilities are actuallyreturning offenders who violated the conditions of theirparole or were arrested and convicted for new crimes.Criminal justice agencies routinely list chronic recidivism asone of their most daunting challenges (Field, 1998a).
Exact statistics are hard to come by, but approximately50% of parole or probation violators are under the influence ofdrugs while committing their latest offense, and this numbergrows with the offenders' convictions (Field, 1998b).Approximately 63% of offenders with more than twoconvictions have used drugs, comparedwith 81%of offenderswith five or more convictions (Field, 1998b). Regardless ofthe exact prevalence, most criminal justice experts would

32 M.T. French et al. / Journal of Substance Abuse Treatment 38 (2010) 31–41
agree that identification and treatment of substance abusedisorders among inmates are critical components of anysuccessful rehabilitation. Indeed, many would argue thatsubstance abuse treatment for eligible offenders is perhaps thebest approach to facilitate a transition back to the community,enhance employability, and reduce recidivism.
To confront these challenges, corrections agencies inseveral states have invested considerable resources in avariety of substance abuse interventions, including in-prisontreatment (Hiller, Knight, & Simpson, 1999; Pelissier et al.,2001; Wexler, Falkin, & Lipton, 1990), halfway houses(Pelissier et al., 2001), and aftercare programs (Hiller et al.,1999; Pelissier et al., 2001). However, the effectiveness ofthese programs is still unproven, and very few have beensubjected to an economic evaluation. At a time of flat ordeclining state budgets and increasing competition forresources, it is imperative that these programs demonstrateeconomic as well as clinical benefits.
To this end, this study completed a full economicevaluation of a prerelease substance abuse treatmentprogram for repeat male offenders in New Jersey. Commu-nity Education Centers, Inc. (CEC), under contract with theState of New Jersey, operates several assessment andtreatment centers and community corrections programsthroughout the state. The analysis programs are located innorthern New Jersey and have been functioning in theircurrent form since 1998. The period of analysis for thisarticle is from 2000 to 2001. Using criminal justice recordsfor a treatment cohort and a randomly selected comparisongroup, we estimated the economic benefits of treatment overthe 1-year period postrelease. The treatment and controlgroups were in the same level of minimum security,rendering each group eligible for residential communityrelease. Economic benefits were calculated in five areas:arrest, conviction, incarceration, victim, and productivity.Finally, assumptions were modified, and alternative estima-tion techniques were employed to assess the stability androbustness of our findings.
The remainder of the article is structured as follows:Section II reviews the literature on offender treatmentprograms and their economic implications. Section IIIdescribes the data and measures. Section IV introduces andexplains our estimation methods. Section V presents theresults. Section VI concludes with a review of researchlimitations, a discussion of policy implications, andrecommendations for future studies.
1.1. Background
1.1.1. Offender treatment programsNumerous projects have investigated the effectiveness of
substance abuse treatment services provided within prisonsor jails. Most of these studies support the premise thatcriminal sanctioning without provision of rehabilitativeservices may not succeed in reducing recidivism. (Axet al., 2007; Clements et al., 2007; Wormith et al., 2007).
Andrews et al. (1990) observed that successful offendertreatment programs shared three criteria: deliver services tohigher risk cases, target needs of offenders, and tailortreatments to the needs and learning styles of individualpatients. Antonowicz and Ross (1994) proposed six essentialcomponents of successful rehabilitation programs forcriminal offenders: (a) a sound conceptual model, (b)multifaceted programming, (c) the targeting of “crimino-genic needs,” (d) the responsivity principle, (e) role-playingand modeling, and (f) social cognitive skills training.Studying an addiction treatment program for criminaloffenders in New Jersey, Fretz, Heilbrun, and Brown(2004) found that subjects in the treatment group hadsignificantly lower probabilities of rearrest, reconviction,and reincarceration at 6-, 9-, and 12-month follow-ups thansubjects in the untreated control group.
Offender treatment programs were shown to be particu-larly effective for substance abusers (Hubbard et al., 1989;Lipton, 1995) because recidivism rates among drugoffenders without any in-prison and/or aftercare treatmentsare very high (Hepburn, 2005). Knight, Simpson, and Hiller(1999) compared reincarceration records for three groups ofdrug offenders over a 3-year postrelease period: those whoreceived in-prison treatment, those who received both in-prison treatment and aftercare, and those who received notreatment. They found that of these three groups, offenderswho received both in-prison treatment and aftercare had thelowest probability of reincarceration. Pearson and Lipton(1999) performed a meta-analysis of corrections-basedtreatments for drug abusers and found that most studiessupported the effectiveness of therapeutic community (TC)programs in reducing recidivism.
Butzin, Martin, and Inciardi (2002) studied the continuumof correctional-based TC treatment programs for drug-involved offenders, focusing specifically on the relativeimpacts of in-prison, transitional, and aftercare treatmentcomponents upon criminal recidivism and relapse to illicitdrug use. They found that the outcomes were sensitive to thedegree of completion of the continuum. De Leon, Melnick,Thomas, Kressel, and Wexler (2000) studied the role ofmotivation factors in prison treatment and outcomes andfound that motivational enhancements in prison-based TCtreatment increased entry into aftercare. Farabee et al. (1999)examined the barriers to implementing effective correctionaldrug treatment programs and identified six commonimplementation challenges for developing programs. Toimprove prison-based drug treatment programs, a census wasdeveloped that assessed program content and structure,program staff, and inmates for 118 programs in 24 stateprisons (Welsh & Zajac, 2004).
1.1.2. Economic analyses of offender treatment programsVarious offender treatment programs have proven to
reduce recidivism, but justifying the economic merits ofthese programs via cost-effectiveness analysis (CEA) orbenefit–cost analysis (BCA) requires additional research.

33M.T. French et al. / Journal of Substance Abuse Treatment 38 (2010) 31–41
Economic evaluation of correctional interventions showsthat the economic benefits often exceed the economic costs,even for violent offenders (Caldwell, Vitacco, & VanRybroek, 2006; Farrington, Petrosino, & Welsh, 2001;Welsh & Farrington, 2000).
Belenko, Patapis, and French (2005) conducted acomprehensive review of corrections-based economic stu-dies of substance abuse treatment. This systematic studyfinds that substance abuse treatment significantly reducesalcohol/drug use and criminal activities and improves healthand social functions for most clients. In addition, economicstudies consistently find robust results related to the positivenet economic benefits of crime reduction (i.e., avoidedincarceration and victimization costs). McCollister, French,& Inciardi, et al. (2003a) used data from a Delaware programand found that the incremental cost-effectiveness ratio for alltreatment clients (compared to the untreated group) was $65per incarceration day avoided. McCollister, French, Pre-ndergast, Hall, & Sacks (2004) studied data from a Californiaprison treatment and aftercare program. They found that in-prison treatment results in a cost of $45 to $65 perincarceration day avoided and is more cost-effective ifcombined with aftercare. Daley et al. (2004) examine thecosts and benefits of voluntary prison treatment programsoperated by the Connecticut Department of Correction with asample of inmates released from prison between 1996 and1997. They find a significant reduction in rearrest forsubjects in the treatment group during the 1-year periodfollowing release compared with subjects in the untreatedcomparison group. The estimated benefit–cost ratios arebetween 1.79 and 5.74 for various types of treatment options.
Robertson, Grimes, and Rogers (2001) performed ashort-run BCA of two types of community-based interven-tions for juvenile offenders: intensive supervision/monitor-ing and intensive outpatient counseling with cognitive–behavioral therapy. Both types of intervention provedsignificantly superior to probation alone for the entirejustice system. McCollister, French, & Prendergast, et al.(2003) performed a CEA of the Amity in-prison TC andVista aftercare programs for criminal offenders in Californiaand found that these treatment programs were more cost-effective than no treatment.
Griffith, Hiller, Knight, and Simpson (1999) studied thecost-effectiveness of in-prison TC treatment with 3-yearoutcome data and concluded that intensive services weremore cost-effective when the entire treatment continuumwas completed. They also found that the greatest benefit wasexperienced by high-risk offenders and accordingly pro-posed that the treatment needs of individual patients betaken into account when assigning offenders to varioustreatment options.
In summary, the literature suggests that in-prison treat-ment can be both effective and cost-effective in reducingrecidivism, possibly with the greatest impact for the mostserious offenders. Moreover, in-prison treatment coupledwith aftercare in the community returns the greatest clinical
and economic outcomes. Not all treatments work in everysetting and for every type of offender, so treatmentapproaches should be matched to settings and inmatesbased on previously developed research guidelines.
1.2. Data and measures
1.2.1. DataThis study uses longitudinal data from the New Jersey
Department of Corrections (NJDOC), which was responsiblefor assembling the treatment and control groups for ouranalysis. The treatment group includes 176 subjects that theNJDOC randomly selected from a list of offenders whocompleted CEC's continuum of care treatment and werereleased in 2000. The control group includes 395 randomlyselected subjects who were released in the same year fromthe same security level prisons but did not participate in anyoffender treatment programs. The subjects in the controlgroup were also eligible for the CEC treatment. Althoughsubjects in both groups were randomly selected from theirrespective populations, participation in the CEC continuumof care treatment was not random because the CEC groupsigned up for work release once they were notified of theireligibility. Based on the severity of their substance abuseneeds, the NJDOC placed the CEC group in a residentialsubstance abuse treatment facility prior to their release intothe community. After being released from jail in 2000, theNJDOC gathered recidivism information for each subjectduring the 1-year period following release.
Data from the NJDOC include the date on which thesubject was released in 2000, the date on which the subjectwas rearrested over the 1-year follow-up period (if applic-able), the type of crime for which the subject was rearrested,whether the subject was reconvicted, and whether the subjectwas reincarcerated. The NJDOC also provided backgroundcharacteristics for each subject, including age at release, race,and type of crime applying to the previous commitment(predatory, drug-related, property, and other crimes). Datawere not available on the duration of reincarceration forindividual subjects.
1.2.2. MeasuresWe examine four treatment outcomes of the CEC
continuum of care treatment (relative to the comparisongroup) during the 1-year period following release. One is acontinuous treatment outcome and measures the number ofdays without rearrest. The other three are dichotomous (i.e.,binary) outcomes measuring rearrest, reconviction, andreincarceration for each subject. Days without rearrest reflectthe number of days between the date that a subject wasreleased and the date that the same subject was rearrested. Ifthe subject was not rearrested during the entire 1-year periodfollowing release, this measure is set to 365. The dichot-omous measure of rearrest is set to 1 if the subject wasrearrested during this period and 0 otherwise. After the legalprocess commences, the measure of reconviction is set to 1 if

34 M.T. French et al. / Journal of Substance Abuse Treatment 38 (2010) 31–41
the subject was convicted. Victim losses should be applied toa particular crime only if the subject was convicted. Thedichotomous measure of reincarceration records whether thesubject was incarcerated after being convicted.
2. Methods
2.1. Bivariate analyses
The most straightforward estimation technique to com-pare outcome differences across two groups is bivariateanalyses. Specifically, we examined the following treatmentoutcomes during the 1-year period postrelease: days withoutrearrest, any rearrest, any reconviction, and any reincarcera-tion. Because “days without rearrest” is a continuousvariable, a t test is used to determine whether there is asignificant difference between the treatment group and thecontrol group. Rearrest, reconviction, and reincarceration areall dichotomous variables, so chi-squared tests are used toexamine the different probabilities of these dichotomousoutcomes. We also analyze available background character-istics between the two groups to ensure that both groups arecomparable. All statistical analyses were executed with Stataversion 9.2 (Stata Corporation, 2005).
2.2. Multivariate regression analyses
Because bivariate analyses cannot adjust for backgroundcharacteristics and other subject differences, we conductedmultivariate analyses to control for these factors in theoutcome estimation. The covariates include age at release,race, and previous criminal activity. Other factors such asmarital status, employment history, substance use history,and ethnicity could significantly influence the outcomes aswell, but these measures were not available. Ordinary leastsquares (OLS) regression was used to estimate days withoutrearrest, whereas logistic regression was used to estimate thedichotomous outcomes of rearrest, reconviction, and rein-carceration. Coefficient estimates are directly reported forthe OLS regression, and both estimated coefficients and oddsratios are reported in the logistic estimation.
2.3. Hazard analyses
To further study days without rearrest, we also used ahazard model (Cox & Oakes, 1984; Greene, 2007;Wooldridge, 2001), which examined whether the treatmentchanged the survival probability that a treated subject wasnot rearrested over the follow-up period. Both parametricand semiparametric hazard models were used to study the“time to failure.” In the parametric hazard analysis, twodifferent hazard distributions, exponential and Weibull, wereused. The semiparametric proportional Cox hazard modelenables us to study the treatment effect without strictlyassuming the specific hazard distribution. The hazard model
adjusts for the background characteristics discussed above,and hazard ratios are reported in the tables. The hazard modelalso examines whether the risk of rearrest in the 1-yearperiod following release is constant, monotonically increas-ing, or monotonically decreasing for the subjects in thetreatment and control groups.
2.4. Propensity score matching
The preferred design for estimating group differences inoutcomes is a randomized controlled trial (RCT). However,an RCTwas neither feasible nor ethical in this study. Becausesubjects were not randomly assigned to the treatment orcontrol groups, the selection criteria may affect the out-comes. Propensity score matching (PSM) is an alternativetechnique that is designed to address group heterogeneityand thereby mimic the redeeming features of a RCT. Forexample, observable characteristics may display significantvariation between the treatment and control groups, andthese differences may be due to the selection criteria. PSMdirectly addresses group self-selections.
The first step to executing PSM is to examine thepropensity score for being included in the treatment groupconditional on all the background characteristics available.In the second stage, we match each subject in the treatmentgroup with one or several subjects in the control group thathave a similar propensity score. A new, quasi-experimentalcontrol group is created that is systematically homogenous tothe treatment group in terms of available covariates(Rosenbaum & Rubin, 1983; Rubin, 1974). Finally, theaverage treatment effects on the treated (ATT) are reportedfor each treatment outcome. To ensure that our results arerobust with different matching algorithms, we implementedfour types of matching criteria in this article: nearestneighbor matching with three neighbors, radius matchingwith a default radius of 0.1, stratification matching with threeblocks, and kernel matching with a Gaussian distribution.When performed properly with reliable data, PSM enablesresearchers to form a balanced control group and producesestimates comparable to experimental designs (Heckman,Ichimura, & Todd, 1997; Michalopoulos, Bloom, & Hill,2004; Rosenbaum & Rubin, 1983; Smith & Todd, 2001).
2.5. Unit cost estimates for criminal activity
The economic or opportunity costs related to criminalactivity include various categories. Monzingo (1977)analyzed the costs associated with arrest, conviction,incarceration, wage loss, and victim loss during the 1-yearperiod following release from prison. Whereas the unit costsfor arrest, conviction, and victim loss differed by types ofcriminal activity (predatory, property, drug-related, miscel-laneous), the unit costs of incarceration and wage loss werethe same for all types of crimes. More recently, Aos, Miller,and Drake (2006) and Kleykamp, Rosenfeld, and Scotti(2008) analyzed the costs of criminal activity and derived

35M.T. French et al. / Journal of Substance Abuse Treatment 38 (2010) 31–41
unit cost estimates for arrest, conviction, incarceration, wageloss, and victim loss, which were used in the benefitcalculations for this article.
For this analysis, if a subject was rearrested during the 1-year period following parole, then the average cost of anarrest is included in the calculations. If the subject was alsoconvicted, then we include the unit cost of conviction as wellas the victim loss associated with each type of criminalactivity. Similarly, if the subject was incarcerated in a countyor state correctional facility after conviction, then we add thecost of incarceration and wage loss associated with not beingable to work in the community. Whereas the unit costs forarrest and conviction of a certain crime type have the samevalues for all individuals who commit those crimes,incarceration costs depend on the length of the sentence.Ideally, the total incarceration cost should be calculated asthe product of total days incarcerated and average cost perday. Our data, however, report the specific dates on whichsubjects were incarcerated but not the date they werereleased. Yet for most individuals in our sample, this is not aconcern, as anyone who is arrested, convicted, andincarcerated during the 1-year follow-up is almost certainto remain incarcerated during the remaining time. Thus, if asubject is convicted and ultimately incarcerated, we assumethat that subject stays in prison from the date of rearrest to theend of the 1-year period following the subject's initialrelease. Likewise, the wage loss is also applied from the dateof rearrest to the end of the 1-year period following release.The labor market consequences of incarceration shouldinclude both wage loss during the period of incarceration andpermanent lifetime wage loss (Sviridoff & Thompson, 1983;Western, Kling, &Weiman, 2001). Because all subjects havebeen incarcerated multiple times before the index episode,the cost of reincarceration in this study includes only thewages lost from the first day of reincarceration to the end ofthe 1-year period following the subject's initial release.
Rigorously estimating the unit costs associated witharrest, conviction, incarceration, victim loss, and wage lossis a major undertaking that could form a stand-alonearticle. As a more efficient alternative, we performed acomprehensive literature review and obtained the mostreliable unit cost estimates available from previous studies(Aos et al., 2006; Kleykamp et al., 2008). For predatorycrimes, four subtypes were analyzed—murder, sexualassault, robbery, and assault—because the costs associatedwith arrest, conviction, and victim loss for these types ofcrimes were substantially different. To come up with asingle number for all predatory crimes, the unit costs foreach type of crime were weighted by the percentageoccurrence of these four subtypes among the total numberof violent crimes committed in New Jersey in 2001 (NewJersey Law Enforcement Agency, 2001). Because theevents in our data occurred in 2000–2001, all costs relatedto criminal activity were converted to 2001 U.S. dollarsusing the inflation calculator from the Bureau of LaborStatistics (2008).
2.6. Economic benefits
After calculating the total cost of criminal activity over thefollow-up period for each subject in our sample, weconducted bivariate analyses, multivariate regression ana-lyses, and PSM techniques to estimate the economic benefitsassociated with CEC treatment. In simple terms, thedifference between the average cost of follow-up criminalactivity for the control (higher cost) and treatment (lowercost) groups is the estimated economic benefit of treatment.For reasons noted earlier, we believe PSM is the best andmost reliable method for estimating group differences withnonrandomized samples. The other approaches were imple-mented to examine the stability of the PSM estimates andproduce a likely range for the economic benefits of treatment.
3. Results
3.1. Bivariate analyses
Table 1 shows the descriptive statistics of criminalactivity measures and background characteristics. Onaverage, subjects in the treatment group had approximately296 days without rearrest in the 1-year period followingrelease, whereas subjects in the control group had 260 days.This difference is statistically significant at the 1% level (ttest). Approximately 36% of subjects in the treatment groupand 48% of subjects in the control group were rearrestedduring the 1-year period following release. The rates ofreconviction were 25% for the treatment group and 37% forthe control group. Approximately 21% of subjects in thetreatment group and 30% of subjects in the control groupwere reincarcerated. All 4 of these criminal justice outcomesprovide strong preliminary evidence that the CEC treatmentreduces recidivism and return to confinement during the 1-year period following treatment and parole. Moreover, theseresults are consistent with the earlier study by Fretz,Heilbrun, and Brown (2004),which examined 6-, 9-, and12-month criminal justice outcomes for the same sample ofCEC treatment clients.
Descriptive statistics for the background characteristicsshow that, on average, subjects in the treatment group areyounger than subjects in the control group. The racialbreakdown of the two groups is comparable, whereas thepercentage of subjects who were incarcerated for apredatory crime is higher in the treatment group than inthe control group.
3.2. Multivariate analyses
Table 2 provides the results of the multivariate analyses.Looking first at OLS estimation of days without rearrest, thecoefficient estimate for the treatment group is 37.23 (p b.01). This implies that subjects in the treatment group had anaverage of 37.23 more days without rearrest than those in the

Table 1Descriptive statistics
Variables Treatment group (n = 176) Control group (n = 395) p a
Criminal activity measuresDays without rearrest b 295.98 (108.78) 259.93 (129.11) b.01Rearrest c (%) 35.80 47.85 b.01Predatory 2.27 3.80Drugs 12.50 10.89Property 6.25 6.08Other 14.78 27.08Reconviction c (%) 25.00 36.71 b.01Predatory 0.00 1.01Drugs 9.66 7.34Property 3.98 3.54Other 11.36 24.82Reincarceration c (%) 21.02 29.87 .03Background characteristicsAge at release 32.96 (8.03) 35.13 (6.99) b.01Race (%) .49White 13.07 15.70Black 65.91 66.84Hispanic 21.02 17.46Previous commitment (%) .02Predatory 21.59 12.41Drugs 56.25 58.73Property 20.45 24.30Other 1.71 4.56
Note. Standard deviations are reported in parentheses for continuous variables.a Student's t test for continuous variables and chi-square test for categorical variables to determine significant differences between treatment and control
groups.b The number of days between release date and rearrest date during the 1-year period following release.c During the 1-year period following release.
36 M.T. French et al. / Journal of Substance Abuse Treatment 38 (2010) 31–41
control group. The magnitude of this multivariate estimate isconsistent with the bivariate estimate in Table 1.
Turning now to the dichotomous outcomes, the odds ofrearrest for the treatment group relative to the control groupis 0.59 (p b .01). Similarly, the odds ratios are 0.56 (p b .01)
Table 2Multivariate estimation
Independentvariables
Days without rearrest a Rearrest
OLSb OLS b Logit
Treatment group 37.23 ⁎⁎⁎ −0.12 ⁎⁎⁎ 0.59 ⁎
Age at release 1.16 ⁎ −0.005 ⁎ 0.98 ⁎
RaceWhite (reference)Black −25.34 ⁎ 0.08 1.40Hispanic 4.13 −0.06 0.75Previous commitmentPredatory (reference)Drugs 2.80 0.03 1.13Property −41.92 ⁎⁎ 0.17 ⁎⁎⁎ 2.07 ⁎
Other 20.89 −0.15 0.51Constant 243.00 ⁎⁎⁎ 0.55 ⁎⁎⁎ N/A
Note. N/A = not applicable.a The number of days between release date and rearrest date during the 1-yeab OLS estimation reports coefficients. OLS is linear probability model for dicc Logit estimation reports odds ratios.⁎ Significant at the 10% level.⁎⁎ Significant at the 5% level.⁎⁎⁎ Significant at the 1% level.
for reconviction and 0.62 (p b .01) for reincarceration.Considered together, the multivariate estimation stronglysupports our hypothesis that CEC treatment reduces the riskof rearrest, reconviction, and reincarceration during the 1-year period following release.
Reconviction Reincarcerationc OLSb Logit c OLSb Logit c
⁎⁎ −0.12 ⁎⁎⁎ 0.56 ⁎⁎⁎ −0.09 ⁎⁎ 0.62 ⁎⁎
−0.003 0.99 −0.003 0.99
0.05 1.26 0.04 1.23−0.05 0.76 −0.02 0.89
−0.01 0.97 −0.01 0.94⁎⁎ 0.13 ⁎⁎ 1.78 ⁎ 0.12 ⁎⁎ 1.83 ⁎
−0.16 0.44 −0.04 0.820.42 ⁎⁎⁎ N/A 0.34 ⁎⁎⁎ N/A
r period following release.hotomous variables: rearrest, reconviction, and reincarceration.

Fig. 1. Kaplan–Meier survival probability for no rearrest during the 1-yearperiod following release.
37M.T. French et al. / Journal of Substance Abuse Treatment 38 (2010) 31–41
Table 3 provides the results of hazard model estimationwith the risk of rearrest as the outcome. We find that thesubjects in the treatment group have a significantly lowerrisk of rearrest (p b .01) when we use either parametric orsemiparametric hazard models. The estimated hazard ratiosdepict the ratio of rearrest for subjects in the treatment grouprelative to subjects in the control group after adjusting forbackground characteristics.
Fig. 1 shows the Kaplan–Meier survival probability of norearrest during the 1-year period following release. We findthat subjects in the treatment group have a higher survivalprobability of no rearrest than those in the control group. Fig.1 also indicates that the risk of rearrest has a fairly constanttrajectory for subjects in both groups with a similar treatmenteffect throughout the 1-year period following release.
3.3. Propensity score matching
Because the subjects in our sample are not randomlyassigned to the study conditions, the multivariate estimatesmay be biased due to self-selection or other factors that couldinfluence the outcomes. To address these potential biases, weimplemented PSM using four types of matching methods.Our matching results show a good balance across the controlvariables, and each is statistically significant at the 1% level.The ATT are reported in Table 4. Depending on the matchingmethod, subjects in the treatment group have an estimated 36to 39 more days without rearrest than those in the controlgroups during the 1-year period following release. Theseresults are consistent with both the bivariate findings (Table1) and OLS estimates (Table 2). The ATT estimates in Table4 also show that subjects in the treatment group have lowerrisks of rearrest, reconviction, and reincarceration than those
Table 3Hazard model estimation
Independentvariables
Days without rearrest a
Parametric hazard modelSemiparametrichazard model
Exponential b Weibull b Proportional Cox b
Treatment group 0.64 ⁎⁎⁎ 0.64 ⁎⁎⁎ 0.65 ⁎⁎⁎
Age at release 0.98 ⁎ 0.98 ⁎ 0.98 ⁎
RaceWhite (reference)Black 1.27 1.27 1.28Hispanic 0.80 0.80 0.81Previous commitmentPredatory (reference)Drugs 1.07 1.07 1.07Property 1.76 ⁎⁎⁎ 1.76 ⁎⁎⁎ 1.74 ⁎⁎⁎
Other 0.61 0.61 0.61a The number of days between release date and rearrest date during the
1-year period following release.b Hazard ratios depict the ratio of rearrest for a subject in the treatment
group relative to a subject in the control group, adjusting for other variables.⁎ Significant at the 10% level.⁎⁎⁎ Significant at the 1% level.
in the control group. All PSM results are statisticallysignificant at the 1% level.
3.4. Economic benefits
To convert the outcome differences to economic benefits,we need to apply monetary conversion factors (i.e., unit costestimates). This approach is explained in detail in severalrecent articles (French & Drummond, 2005; McCollister &French, 2003; Homer, Drummond, & French, 2008). Themonetary conversion factors we used in this study can befound in Table 5. All unit cost estimates were converted to2001 U.S. dollars using the inflation calculator from theBureau of Labor Statistics (2008). The unit costs (per case)for arrest, conviction, and victim loss are national averages(Aos et al., 2006) because estimates for New Jersey are notavailable in literature. As expected, predatory crimes havethe highest unit costs of arrest, conviction, and victim loss.The unit costs for incarceration and wage loss were obtainedfrom Kleykamp et al. (2008), and these estimates apply
Table 4ATT via PSM
Matchingmethods
ATT
Days withoutrearrest Rearrest Reconviction Reincarceration
Nearestneighbors a
38.85 ⁎⁎⁎ −0.15 ⁎⁎⁎ −0.15 ⁎⁎⁎ −0.12 ⁎⁎
Radius b 39.38 ⁎⁎⁎ −0.13 ⁎⁎⁎ −0.13 ⁎⁎⁎ −0.09 ⁎⁎Stratification c 36.33 ⁎⁎⁎ −0.13 ⁎⁎⁎ −0.13 ⁎⁎⁎ −0.09 ⁎⁎Kernel
based d37.49 ⁎⁎⁎ −0.13 ⁎⁎⁎ −0.13 ⁎⁎⁎ −0.09 ⁎⁎
a Matching with 3 closest neighbors in the control group.b The size of radius is 0.1.c The number of blocks is 3. The inferiors of blocks are 0, 0.2, and 0.4.d The Gaussian kernel is used.⁎⁎ Significant at the 5% level.⁎⁎⁎ Significant at the 1% level.

Table 5Unit cost estimates for arrest, conviction, incarceration, victim loss, and wage loss
Type of crime Arrest a (case) Conviction a (case) Incarceration b (day) Victim loss a (case) Wage loss b (day)
Predatory c $6,292 $3,352 $109 $51,613 $23Property $5,048 $1,720 $109 $5,997 $23Drugs $5,048 $1,720 $109 $0 $23Other d $287 $670 $109 $0 $23
Note. Current-year dollars in specific years have been converted to 2001 dollars using the inflation calculator from the Bureau of Labor Statistics, U.S.Department of Labor.
a Aos et al. (2006).b Kleykamp et al. (2008).c The unit cost for predatory crimes is calculated as the average costs of murder, forcible rape, robbery, and aggravated assault weighted by the percentage
of each crime in New Jersey, 2001, http://www.disastercenter.com/crime/njcrimn.htm.d Other types of crime are mainly misdemeanors.
38 M.T. French et al. / Journal of Substance Abuse Treatment 38 (2010) 31–41
directly to New Jersey. The cost of incarcerating one inmatefor 1 day was $109 in 2001, and the associated wage loss wasabout $23 per day. Although the average daily wage lossmay seem low, many offenders were not working at the timeof their arrest, and securing employment after release is oftendifficult (Kleykamp et al., 2008).
Table 6 presents the average cost of rearrest, reconviction,reincarceration, victim loss, and wage loss over the 1-yearfollow-up for both treatment and control groups. For eachoutcome, the treatment group has a lower average cost thanthe control group, but not all of the differences arestatistically significant. Most important, the total costdifference is highly significant (p b .01), but it is evidentthat high incarceration costs for the control group heavilyinfluence this result. Quantitatively, the total cost of criminalactivity for an average subject in the treatment group($7,678) is $4,307 lower than the total cost for an averagesubject in the control group ($11,985).
The same cautions about potential biases associated withthe bivariate estimates of criminal justice outcomes alsoapply to the economic benefit estimates. For this reason, wepresent the range of total cost estimates that results frombivariate comparison, multivariate adjustment (OLS), andPSM (see Table 7). Compared to the bivarate or unmatcheddifference in total cost between groups ($4,307), the OLSand PSM estimates are larger, ranging from $4,323 to$6,209. All of these cost differences are statisticallysignificant at the 1% level. We discuss the plausibility andpolicy implications of these estimates in the Discussionsection that follows.
Table 6Average costs related to criminal activity during the 1-year period following relea
Treatment group (n = 176) C
Cost of rearrest $1,132 (159) $Cost of reconviction $498 (60) $Cost of reincarceration $4,797 (774) $Victim loss $239 (89) $Wage loss $1,012 (163) $Total cost $7,678 (1,058) $
Note. Standard errors are reported in the parentheses. Costs have been converteda Student's t test for expense differences between treatment and control group
3.5. Benefit–Cost analysis
Ordinarily, the total economic cost of an intervention iscompared to the total economic benefit to form a benefit–cost ratio and net benefit estimate (French, 2000; French,Salome, & Carney, 2002; French, Salome, Sindelar, &McLellan, 2002). However, the CEC treatment programpresents an interesting exception to this analysis approach.Specifically, the average daily per diem to incarcerate aninmate in a New Jersey correctional facility was approxi-mately $109 in 2001 (Kleykamp et al., 2008). During thissame period, the NJDOC reimbursed CEC at the flat rate of$75 per day for each inmate who was housed in an adjacenttreatment facility. The main reasons for the cost savings arefewer security guards, lower average salaries for all otherpersonnel, and lower overhead costs as a result of theextensive use of inmate work crews, the dormitory style ofsleeping quarters, and the decrease in monitoring equipment.Such treatment-related cost savings are highly unusual for aprogram that also generates significant economic benefitsrelative to standard incarceration.
4. Discussion and conclusion
State legislatures and other policy makers must decidehow to deal with a growing prison population that is oftencommitting drug/alcohol-related crimes or entering (andreentering) the criminal justice system with substance usedisorders. Offering reentry residential substance abuse
se
ontrol group (n = 395) Cost difference p a
1,173 (107) −$41 .83601 (42) −$103 .177,825 (659) −$3,028 b.01735 (265) −$496 .221,651 (139) −$639 b.0111,985 (887) −$4,307 b.01
to 2001 dollars.
s.
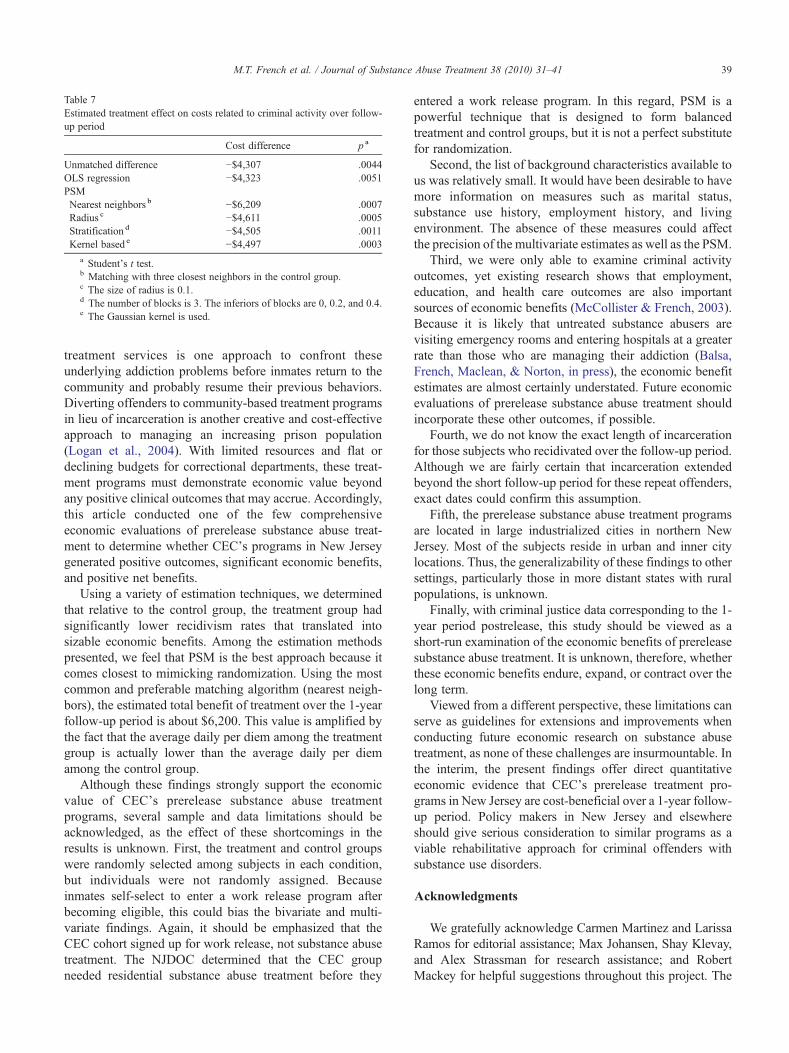
Table 7Estimated treatment effect on costs related to criminal activity over follow-up period
Cost difference p a
Unmatched difference −$4,307 .0044OLS regression −$4,323 .0051PSMNearest neighbors b −$6,209 .0007Radius c −$4,611 .0005Stratification d −$4,505 .0011Kernel based e −$4,497 .0003
a Student's t test.b Matching with three closest neighbors in the control group.c The size of radius is 0.1.d The number of blocks is 3. The inferiors of blocks are 0, 0.2, and 0.4.e The Gaussian kernel is used.
39M.T. French et al. / Journal of Substance Abuse Treatment 38 (2010) 31–41
treatment services is one approach to confront theseunderlying addiction problems before inmates return to thecommunity and probably resume their previous behaviors.Diverting offenders to community-based treatment programsin lieu of incarceration is another creative and cost-effectiveapproach to managing an increasing prison population(Logan et al., 2004). With limited resources and flat ordeclining budgets for correctional departments, these treat-ment programs must demonstrate economic value beyondany positive clinical outcomes that may accrue. Accordingly,this article conducted one of the few comprehensiveeconomic evaluations of prerelease substance abuse treat-ment to determine whether CEC's programs in New Jerseygenerated positive outcomes, significant economic benefits,and positive net benefits.
Using a variety of estimation techniques, we determinedthat relative to the control group, the treatment group hadsignificantly lower recidivism rates that translated intosizable economic benefits. Among the estimation methodspresented, we feel that PSM is the best approach because itcomes closest to mimicking randomization. Using the mostcommon and preferable matching algorithm (nearest neigh-bors), the estimated total benefit of treatment over the 1-yearfollow-up period is about $6,200. This value is amplified bythe fact that the average daily per diem among the treatmentgroup is actually lower than the average daily per diemamong the control group.
Although these findings strongly support the economicvalue of CEC's prerelease substance abuse treatmentprograms, several sample and data limitations should beacknowledged, as the effect of these shortcomings in theresults is unknown. First, the treatment and control groupswere randomly selected among subjects in each condition,but individuals were not randomly assigned. Becauseinmates self-select to enter a work release program afterbecoming eligible, this could bias the bivariate and multi-variate findings. Again, it should be emphasized that theCEC cohort signed up for work release, not substance abusetreatment. The NJDOC determined that the CEC groupneeded residential substance abuse treatment before they
entered a work release program. In this regard, PSM is apowerful technique that is designed to form balancedtreatment and control groups, but it is not a perfect substitutefor randomization.
Second, the list of background characteristics available tous was relatively small. It would have been desirable to havemore information on measures such as marital status,substance use history, employment history, and livingenvironment. The absence of these measures could affectthe precision of the multivariate estimates as well as the PSM.
Third, we were only able to examine criminal activityoutcomes, yet existing research shows that employment,education, and health care outcomes are also importantsources of economic benefits (McCollister & French, 2003).Because it is likely that untreated substance abusers arevisiting emergency rooms and entering hospitals at a greaterrate than those who are managing their addiction (Balsa,French, Maclean, & Norton, in press), the economic benefitestimates are almost certainly understated. Future economicevaluations of prerelease substance abuse treatment shouldincorporate these other outcomes, if possible.
Fourth, we do not know the exact length of incarcerationfor those subjects who recidivated over the follow-up period.Although we are fairly certain that incarceration extendedbeyond the short follow-up period for these repeat offenders,exact dates could confirm this assumption.
Fifth, the prerelease substance abuse treatment programsare located in large industrialized cities in northern NewJersey. Most of the subjects reside in urban and inner citylocations. Thus, the generalizability of these findings to othersettings, particularly those in more distant states with ruralpopulations, is unknown.
Finally, with criminal justice data corresponding to the 1-year period postrelease, this study should be viewed as ashort-run examination of the economic benefits of prereleasesubstance abuse treatment. It is unknown, therefore, whetherthese economic benefits endure, expand, or contract over thelong term.
Viewed from a different perspective, these limitations canserve as guidelines for extensions and improvements whenconducting future economic research on substance abusetreatment, as none of these challenges are insurmountable. Inthe interim, the present findings offer direct quantitativeeconomic evidence that CEC's prerelease treatment pro-grams in New Jersey are cost-beneficial over a 1-year follow-up period. Policy makers in New Jersey and elsewhereshould give serious consideration to similar programs as aviable rehabilitative approach for criminal offenders withsubstance use disorders.
Acknowledgments
We gratefully acknowledge Carmen Martinez and LarissaRamos for editorial assistance; Max Johansen, Shay Klevay,and Alex Strassman for research assistance; and RobertMackey for helpful suggestions throughout this project. The

40 M.T. French et al. / Journal of Substance Abuse Treatment 38 (2010) 31–41
authors are entirely responsible for the research and resultsreported in this article, and their position or opinions do notnecessarily represent those of theUniversity ofMiami or CEC.
References
Andrews, D. A., Zinger, I., Hoge, R. D., Bonta, J. L., Gendreau, P., &Cullen, F. T. (1990). Does correctional treatment work? A clinicallyrelevant and psychologically informed meta-analysis. Criminology, 28,369−404.
Antonowicz, D. H., & Ross, R. R. (1994). Essential components ofsuccessful rehabilitation programs for offenders. International Journalof Offender Therapy and Comparative Criminology, 38, 97−104.
Aos, S., Miller, M., & Drake, E. (2006). Evidence-based public policyoptions to reduce future prison construction, criminal justice costs, andcrime rates. Olympia: WA: Washington State Institute for Public Policy(Document ID: 06-10-1201). Available at: http://www.wsipp.wa.gov/rptfiles/06-10-1201.pdf.
Ax, R. K., Fagan, T. J., Magaletta, P. R., Morgan, R. D., Nussbaum, D., &White, T. W. (2007). Innovations in correctional assessment andtreatment. Criminal Justice and Behavior, 34, 893−905.
Balsa, A. I., French, M. T., Maclean, J. C., & Norton, E. C. in press Frompubs to scrubs: Alcohol misuse and health care use. Health ServicesResearch. DOI: 10.1111/j.1475-6773.2009.00987.x
Belenko, S., Patapis, N., & French, M. T. (2005). Economic benefits of drugtreatment: A critical review of the evidence for policy makers.Philadelphia: University of Pennsylvania, Treatment Research Institute.
Bureau of Labor Statistics. (2008). Inflation calculator. Available at: http://data.bls.gov/cgi-bin/cpicalc.pl.
Butzin, C. A., Martin, S. S., & Inciardi, J. A. (2002). Evaluating componenteffects of a prison-based treatment continuum. Journal of SubstanceAbuse Treatment, 22, 63−69.
Caldwell, M. F., Vitacco, M. J., & Van Rybroek, G. J. (2006). Are violentdelinquents worth treating? A cost–benefit analysis. Journal of Researchin Crime and Delinquency, 43, 148−168.
Clements, C. B., Althouse, R., Ax, R. K., Magaletta, P. R., Fagan, T. J., &Wormith, J. S. (2007). Systemic issues and correctional outcomes:Expanding the scope of correctional psychology. Criminal Justice andBehavior, 34, 919−932.
Cox, D. R., & Oakes, D. (1984). Analysis of survival data. London, UK:Chapman & Hall.
Daley, M., Love, C. T., Shepard, D. S., Petersen, C. B., White, K. L., & Hall,F. B. (2004). Cost effectiveness of Connecticut's in-prison substanceabuse treatment. Journal of Offender Rehabilitation, 39, 69−92.
De Leon, G., Melnick, G., Thomas, G., Kressel, D., &Wexler, H. K. (2000).Motivation for treatment in a prison-based therapeutic community. TheAmerican Journal of Drug and Alcohol Abuse, 26, 33−46.
Farabee, D., Prendergast, M., Cartier, J., Wexler, H. K., Knight, K., &Anglin, M. D. (1999). Barriers to implementing effective correctionaldrug treatment programs. The Prison Journal, 79, 150−162.
Farrington, D. P., Petrosino, A., & Welsh, B. C. (2001). Systematic reviewsand cost–benefit analyses of correctional interventions. The PrisonJournal, 81, 339−359.
Field, G. (1998a). From the institution to the community: Studies show thebenefits of continuity of care in reduced recidivism, relapse rates.Corrections Today, 60, 94−97.
Field, G. (1998b). Continuity of offender treatment for substance usedisorders from institution to community: Treatment ImprovementProtocol Series 30. (Publication Number [SMA] 98-3245). U.S.Department of Health and Human Services.
French, M. T. (2000). Economic evaluation of alcohol treatment services.Evaluation and Program Planning, 23, 27−39.
French, M. T., & Drummond, M. C. (2005). A research agenda for economicevaluation of substance abuse services. Journal of Substance AbuseTreatment, 29, 125−137.
French, M. T., Salomé, H. J., & Carney, M. (2002). Using the DATCAPand ASI to estimate the costs and benefits of residential addictiontreatment in the State of Washington. Social Science and Medicine, 55,2267−2282.
French, M. T., Salomé, H. J., Sindelar, J. L., & McLellan, A. T. (2002).Benefit–Cost analysis of addiction treatment: Methodological guidelinesand empirical application using the DATCAP and ASI. Health ServicesResearch, 37, 433−455.
Fretz, R., Heilbrun, K. S., & Brown, D. (2004). Outcome research as anintegral component of performance-based offender treatment.Corrections Compendium, 29, 1−4.
Greene, W. H. (2007). Econometric analysis, (6th ed.) Upper Saddle River,NJ: Prentice Hall.
Griffith, J. D., Hiller, M. L., Knight, K., & Simpson, D. D. (1999). A cost-effectiveness analysis of in-prison therapeutic community treatment andrisk classification. The Prison Journal, 79, 352−368.
Heckman, J. J., Ichimura, H., & Todd, P. E. (1997). Matching as aneconometric evaluation estimator: Evidence from evaluating a jobtraining programme. Review of Economic Studies, 54, 605−654.
Hepburn, J. R. (2005). Recidivism among drug offenders followingexposure to treatment. Criminal Justice Policy Review, 16, 237−259.
Hiller, M. L., Knight, K., & Simpson, D. D. (1999). Prison-based substanceabuse treatment, residential aftercare and recidivism. Addiction, 94,833−842.
Homer, J. F., Drummond, M. C., & French, M. T. (2008). Economicevaluation of adolescent addiction programs: Methodologicalchallenges and recommendations. Journal of Adolescent Health, 43,529−539.
Hubbard, R. L., Marsden, M. E., Rachal, J. V., Harwood, H. J., Cavanaugh,E. R., & Ginzburg, H. M. (1989). Drug abuse treatment: A nationalstudy of effectiveness. (NCJ Pub 120787). Chapel Hill, NC: U.S.Department of Justice Available at: http://www.ncjrs.gov/App/publications/Abstract.aspx?id=120787.
Kleykamp, M., Rosenfeld, J., & Scotti, R. (2008). Wasting money, wastinglives. New Jersey: The Drug Policy Alliance New Jersey. Available at:http://www.drugpolicy.org/docUploads/hiddencostsNJ.pdf.
Knight, K., Simpson, D. D., & Hiller, M. L. (1999). Three-year re-incarceration outcomes for in-prison therapeutic community treatment inTexas. The Prison Journal, 79, 337−351.
Lipton, D. S. (1995). The effectiveness of treatment for drug abusers undercriminal justice supervision. (NIJ Pub 157642). Rockville, MD: USDepartment of Justice Available at: http://www.ncjrs.gov/app/Publications/abstract.aspx?ID=157642.
Logan, T. K., Hoyt, W., McCollister, K. E., French, M. T., Leukefeld, C., &Lisa Minton, L. (2004). Economic evaluation of drug court: Methodol-ogy, results, and policy implications. Evaluation and Program Planning,27, 381−396.
McCollister, K. E., & French, M. T. (2003). The relative contributions ofoutcome domains in the total economic benefit of addiction interven-tions: A review of first findings. Addiction, 98, 1647−1659.
McCollister, K. E., French, M. T., Inciardi, J. A., Butzin, C. A., Martin, S. S.,& Hooper, R. M. (2003). Post-release substance abuse treatmentfor criminal offenders: A cost-effectiveness analysis. Journal ofQuantitative Criminology, 19, 389−407.
McCollister, K. E., French, M. T., Prendergast, M., Hall, E., & Sacks, S.(2004). Long-term cost-effectiveness of addiction treatment for criminaloffenders. Justice Quarterly, 21, 659−679.
McCollister, K. E., French, M. T., Prendergast, M., Wexler, H., Sacks, S., &Hall, E. (2003). Is in-prison treatment enough? A cost-effectivenessanalysis of prison-based treatment and aftercare services for substance-abusing offenders. Law & Policy, 25, 63−82.
Michalopoulos, C., Bloom, H. S., & Hill, C. J. (2004). Can propensity-scoremethods match the findings from a random assignment evaluation ofmandatory welfare-to-work programs? Review of Economics &Statistics, 86, 157−179.
Monzingo, J. E. (1977). Economic analysis of the criminal justice system.Crime & Delinquency, 23, 260−271.

41M.T. French et al. / Journal of Substance Abuse Treatment 38 (2010) 31–41
New Jersey Law Enforcement Agency. (2001).Uniform crime reports 1980–2005. Available at: http://www.disastercenter.com/crime/njcrimn.htm.
Pearson, F. S., & Lipton, D. S. (1999). A meta-analytic review of theeffectiveness of corrections-based treatments for drug abuse. The PrisonJournal, 79, 384−410.
Pelissier, B., Rhodes, W., Saylor, W., Gaes, G., Camp, S. D., Vanyur, S. D.,et al. (2001). Triad Drug Treatment Evaluation Project. FederalProbation, 65, 3−7.
Robertson, A. A., Grimes, P. W., & Rogers, K. E. (2001). A short-run cost-benefit analysis of community-based interventions for juvenile offen-ders. Crime & Delinquency, 47, 265−284.
Rosenbaum, P. R., & Rubin, D. B. (1983). The central role of the propensityscore in observational studies for causal effects. Biometrika, 70, 41−55.
Rubin, D. B. (1974). Estimating causal effects of treatments in randomisedand non-randomised studies. Journal of Educational Psychology, 66,688−701.
Smith, J. A., & Todd, P. E. (2001). Reconciling conflicting evidence on theperformance of propensity-score matching methods. American Eco-nomic Review, 91, 112−118.
Stata Corporation. (2005). Stata 9.2. College Station, TX: Stata Corporation.Sviridoff, M., & Thompson, J. W. (1983). Links between employment and
crime: A qualitative study of Rikers Island releasees. Crime &Delinquency, 29, 195−212.
U.S. Courts: The Federal Judiciary. (2006). Costs of incarceration andsupervised release. Available at: http://www.uscourts.gov/newsroom/prisoncost.html.
U.S. Department of Justice, Bureau of Justice Statistics. (2008). Directexpenditure by level of government, 1982–2005. Available at: http://www.ojp.usdoj.gov/bjs/glance/tables/expgovtab.htm.
Welsh, B. C., & Farrington, D. P. (2000). Correctional interventionprograms and cost–benefit analysis. Criminal Justice and Behavior,27, 115−133.
Welsh, W. N., & Zajac, G. (2004). A census of prison-based drug treatmentprograms: Implications for programming, policy, and evaluation. Crime& Delinquency, 50, 108−133.
Western, B., Kling, J. R., & Weiman, D. F. (2001). The labor marketconsequences of incarceration. Crime & Delinquency, 47, 410−427.
Wexler, H. K, Falkin, G. P., & Lipton, D. S. (1990). Outcome evaluation of aprison therapeutic community for substance abuse treatment. CriminalJustice and Behavior, 17, 71−92.
Wooldridge, J. M. (2001). Econometric analysis of cross section and paneldata. Cambridge, MA: The MIT Press.
Wormith, J. S., Althouse, R., Simpson, M., Reitzel, L. R., Fagan, T. J., &Morgan, R. D. (2007). The rehabilitation and reintegration of offenders.The current landscape and some future directions for correctionalpsychology. Criminal Justice and Behavior, 34, 879−892.