Embed Size (px)
Citation preview

Economic Elem;Plans-MPlan;indd;rs09/02/09
Eco
no
mic
Ele
me
nt
The City of Las Vegas Economic Element
of the Las Vegas 2020 Master Plan
was adopted by City Council
September 2, 2009 (Ordinance #6057).

page i Economic Elem;Plans-MPlan;indd;rs09/02/09
CITY OF LAS VEGAS ECONOMIC ELEMENTTABLE OF CONTENTS
EXECUTIVE SUMMARY ................................................................................................................... 1
INTRODUCTION ............................................................................................................................. 3
Purpose ................................................................................................................... 3
Enabling Legislation ............................................................................................... 3
Planning Context ................................................................................................... 4
Relationship to Master Plan ................................................................................ 4
Goals, Objectives and Policies ............................................................................ 5
BACKGROUND ................................................................................................................................. 7
Growth ................................................................................................................... 7
Infrastructure Conditions .................................................................................... 8
EXISTING CONDITIONS............................................................................................................. 10
CIP Purpose .......................................................................................................... 10
CIP Program Descriptions ................................................................................ 10
Capital Improvement Expenditures, FY 03 – FY 08 .................................... 11
Capital Improvement Funding Sources, FY 03 – FY 08 .............................. 12
ANALYSIS ........................................................................................................................................... 15
The Capital Improvement Process .................................................................. 15
Five-Year CIP Plan, FY 2009 – FY 2013 .......................................................... 17
Capital Improvement Expenditures, FY 09 – FY 13 .................................... 17
Capital Improvement Funding Sources, FY 09 – FY 13 .............................. 19
CIP Project Schedule, FY 09 – FY 13 .............................................................. 20
Restricted Funds .................................................................................................. 20
Issues ................................................................................................................. 26
IMPLEMENTATION ......................................................................................................................... 27
Recommendations .............................................................................................. 27
APPENDIX: PUBLIC PARTICIPATION ...................................................................................... 29
TABLES AND MAPS
TABLES
1. City of Las Vegas Population Density ................................................ 7
2. Population Density of Las Vegas Valley Cities and Towns .............. 8
3. CIP Expenditures FY 03 – FY 08 (in millions of dollars) ............ 11
4. CIP Expenditures, Percent of Total FY 03 – FY 08 ....................... 11
5. CIP Projects Funding Sources, FY 03 – FY 08
(in millions of dollars) ......................................................................... 12

page ii Economic Elem;Plans-MPlan;indd;rs09/02/09
6. CIP Funding Sources, Percent of Total FY 03 – FY 08 ................. 12
7. CIP Expenditures FY 09 – FY 13 (in millions of dollars) ............ 18
8. CIP Expenditures, Percent of Total FY 09 – FY 13 ....................... 18
9. CIP Projects Funding Sources, FY 09 – FY 13
(in millions of dollars) ......................................................................... 19
10. CIP Funding Sources, Percent of Total FY 09 – FY 13 ................. 19
11. City of Las Vegas SNPLMA Allocation by Round .......................... 21
12. Community Development Block Grant Allocations .................... 24
MAPS
1. Economic Element – Vacant Land .................................................... 31
2. Economic Element – Residential Construction
1983 and Earlier ................................................................................... 32
3. Economic Element – Non-Residential Construction
1983 and Earlier ................................................................................... 33
4. Economic Element – Residential Construction
1998 to Present ................................................................................... 34
5. Economic Element – Non-Residential Construction
1998 to Present ................................................................................... 35
6. Economic Element – Annexations ................................................... 36
7. Economic Element – Las Vegas Valley Population Density
per Square Mile 2008 ......................................................................... 37
8. Economic Element – BLM Disposal Boundary ............................. 38
9. Economic Element – Redevelopment Area Boundary ................ 39
10. Economic Element – Capital Improvement Projects ................... 40
11. Economic Element – SNPLMA Projects ......................................... 41
12. Economic Element – Special Improvement Districts .................. 42
13. Economic Element – Roads Built by Year ....................................... 43
Economic Elem;Plans-MPlan;indd;rs09/02/09 page 1
Ex
ecu
tive
Su
mm
ary
EXECUTIVE SUMMARYThe appropriation, allocation, and scheduling of funds
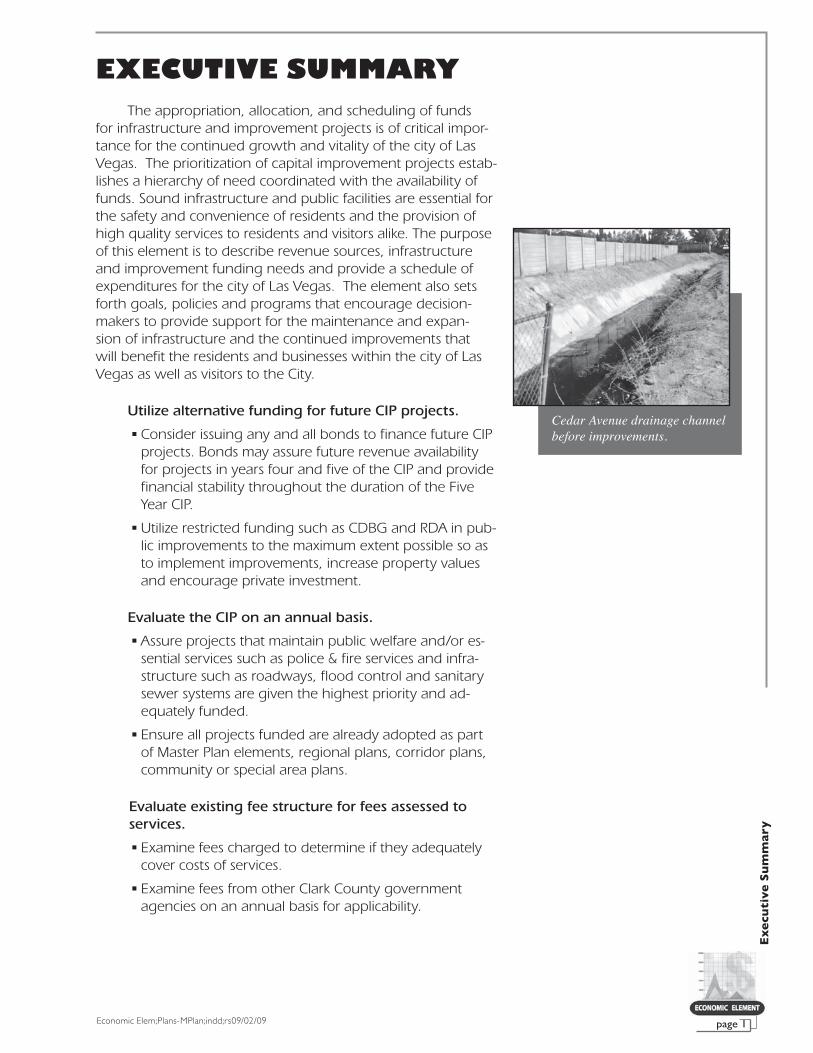
for infrastructure and improvement projects is of critical impor-tance for the continued growth and vitality of the city of Las Vegas. The prioritization of capital improvement projects estab-lishes a hierarchy of need coordinated with the availability of funds. Sound infrastructure and public facilities are essential for the safety and convenience of residents and the provision of high quality services to residents and visitors alike. The purpose of this element is to describe revenue sources, infrastructure and improvement funding needs and provide a schedule of expenditures for the city of Las Vegas. The element also sets forth goals, policies and programs that encourage decision-makers to provide support for the maintenance and expan-sion of infrastructure and the continued improvements that will benefit the residents and businesses within the city of Las Vegas as well as visitors to the City.
Utilize alternative funding for future CIP projects.
• Consider issuing any and all bonds to finance future CIP projects. Bonds may assure future revenue availability for projects in years four and five of the CIP and provide financial stability throughout the duration of the Five Year CIP.
• Utilize restricted funding such as CDBG and RDA in pub-lic improvements to the maximum extent possible so as to implement improvements, increase property values and encourage private investment.
Evaluate the CIP on an annual basis.
• Assure projects that maintain public welfare and/or es-sential services such as police & fire services and infra-structure such as roadways, flood control and sanitary sewer systems are given the highest priority and ad-equately funded.
• Ensure all projects funded are already adopted as part of Master Plan elements, regional plans, corridor plans, community or special area plans.
Evaluate existing fee structure for fees assessed to services.
• Examine fees charged to determine if they adequately cover costs of services.
• Examine fees from other Clark County government agencies on an annual basis for applicability.
Cedar Avenue drainage channel before improvements.
Economic Elem;Plans-MPlan;indd;rs09/02/09page 2
Ex
ecu
tive
Su
mm
ary
• Evaluate possibility of assigning fees to a broader range of services.
• Examine types of services where fees are applied from other government agencies.
• Audit existing services to determine if applying fees would be appropriate to cover labor and material costs.
Continue to develop public art and activity nodes
• Seek public/private “sponsorships” for funding public art and activity nodes.
Continue to add parks and open space to City inven-tory as prioritized in the Parks Element.
• Seek partnerships with developers and encourage them to donate land that the City can develop into parks, trails and open space, particularly in prioritized areas.
• Explore options to provide incentives to developers for including and developing open space in their projects.
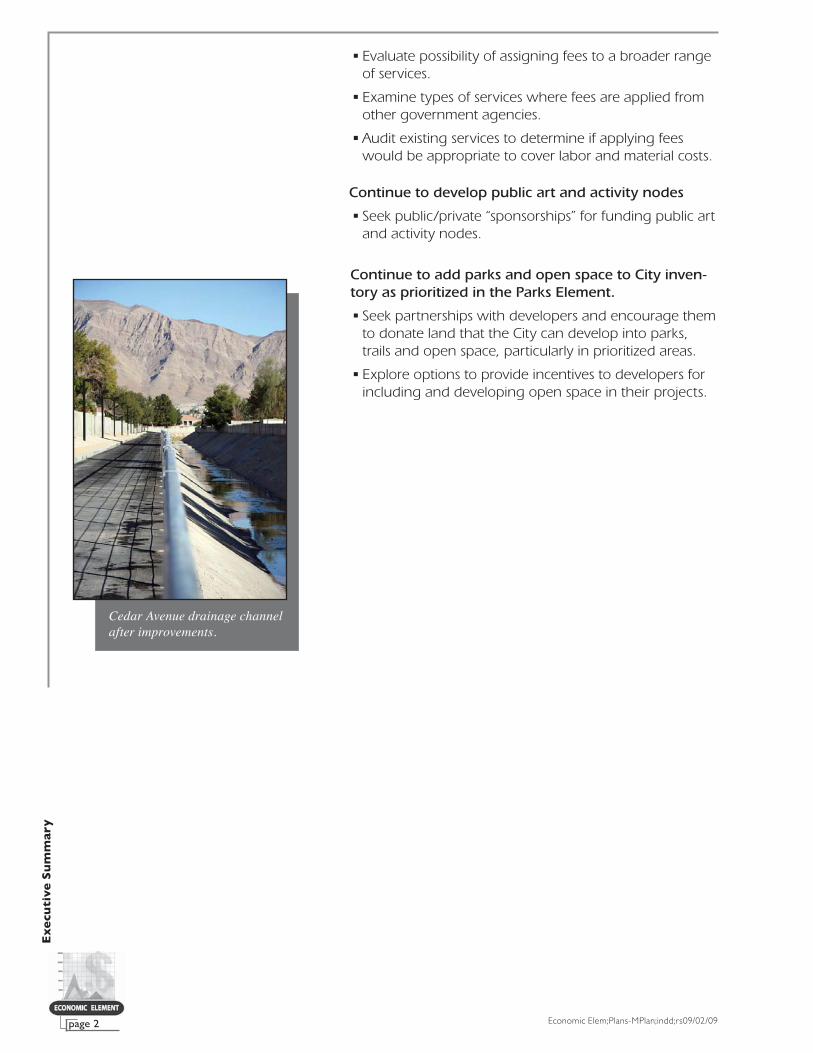
Cedar Avenue drainage channel after improvements.

Economic Elem;Plans-MPlan;indd;rs09/02/09page 3
Intr
od
uct
ion
INTRODUCTION
PURPOSE
The purpose of the Economic Element is twofold. First, this document is intended to fulfill the requirements of state law, as set forth in the Nevada Revised Statutes (NRS) 278.150 through 278.160, and second, to recommend strategies and actions to facilitate the implementation of the goals, objec-tives, and policies contained in the Las Vegas 2020 Master Plan related to the use of public money.
The Economic Development Plan must accomplish the following:
• Identify existing funding sources for 2020 Master Plan projects.
• Identify projects that require funding according to the 2020 Master Plan.
• Prepare a schedule of allocation and expenditures of public money.
ENABLING LEGISLATION
The Nevada Revised Statutes (NRS) adopted by the Nevada State Legislature in 2001, made effective in 2002 gov-ern the subject matter of the master plan. Subsection 4 of NRS 278.150 (4) states:
In counties whose population is 400,000 or more, the governing body of the city or county shall adopt a master plan for all of the city or county that must address each of the subjects set forth in subsection (1) of NRS 278.160.
The subject matter of the master plan in NRS 278.160 states:
Except as otherwise provided in Subsection 4 of NRS 278.150 and Subsection 3 of NRS 278.170, the master plan, with the accompanying charts, drawings, diagrams, schedules and reports, may include such of the following subject matter or portions thereof as are appropriate to the city, county or region, and as may be made the basis for the physical development thereof.
Among the elements to be included in the master plan as required by NRS is an Economic Plan, adopted by the Nevada Legislature in 1991:
View of the city of Las Vegas looking southeast
Economic Elem;Plans-MPlan;indd;rs09/02/09page 4
Intr
od
uct
ion
(c) “Showing recommended schedules for the allocation and expenditure of public money in order to provide for the economical and timely execution of the various com-ponents of the plan.”
Preparation and adoption of this Economic Element fulfills the City’s statutory obligation to include an economic plan in its Master Plan.
PLANNING CONTEXT
The Economic Element will replace the Economic Plan in the 1992 Las Vegas General Plan. The Economic Plan fails to address current legislation, specifically, NRS 278.150, the requirements of which pertaining to the Economic Element are shown in the Enabling Legislation section. In addition, the downturn in the Las Vegas economy requires careful planning of infrastructure and improvement projects and the allocation of necessary funds. The Economic Element is a portion of the Master Plan, adopted in September 2000, which represents Phase I of the Master Plan project, forming the framework for the contents of Phase II: a series of elements; special area plans; and long-term land use designations, including a revised future land use map. The Economic Element is among those identi-fied for completion during Phase II of the Master Plan project.
RELATIONSHIP TO THE LAS VEGAS 2020 MASTER PLAN
The Master Plan contains numerous goals, objectives, and policies pertaining directly and indirectly to Capital Im-provement Planning. As a component of the Master Plan, the Economic Element is intended to not only satisfy NRS require-ments, but also to provide a comprehensive document that will assist with the long-range planning of the future improve-ment projects to meet the needs of the city as it continues to grow. This element provides a baseline of detailed information that will aid in the decision making processes that determine the city’s funding priorities in infrastructure and improvement projects. The Economic Element links the broad policies of the Master Plan with infrastructure and improvement programming and ultimately assists in the decision making process.
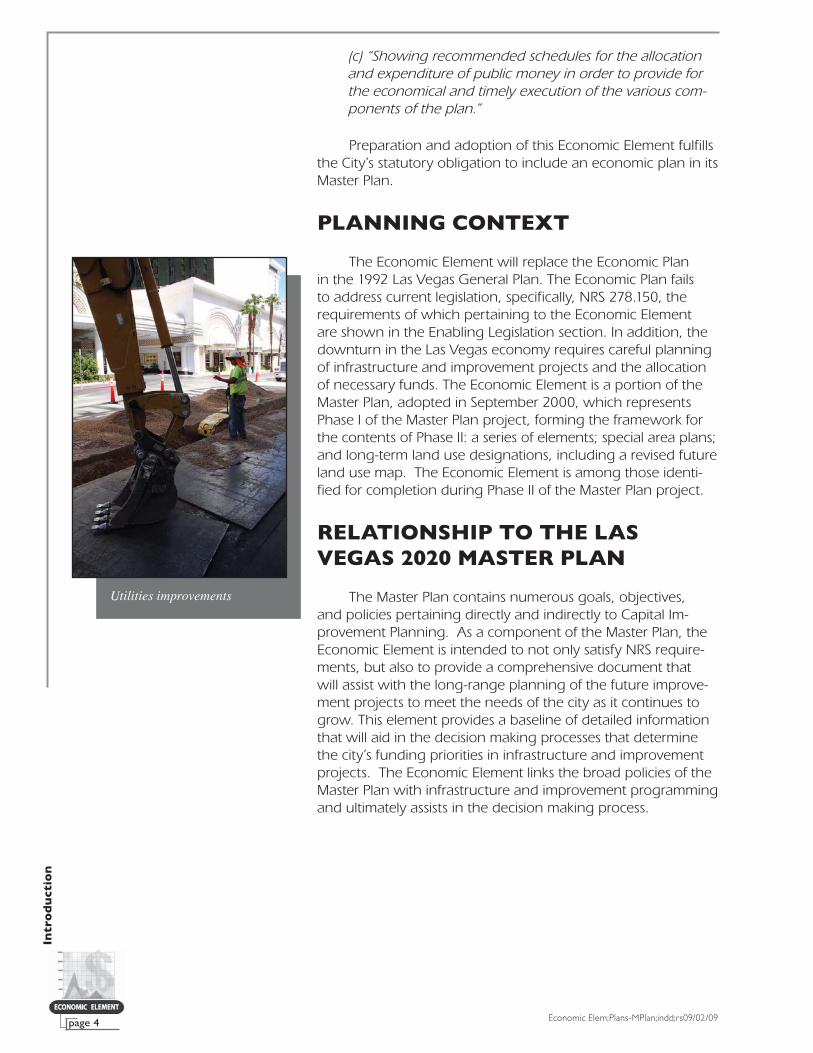
Utilities improvements

Economic Elem;Plans-MPlan;indd;rs09/02/09page 5
Intr
od
uct
ion
GOALS, OBJECTIVES AND POLICIES
The Master Plan outlines broad policies, while each individual element builds on those policies and provides the specific direction as to how the city should accommodate par-ticular Economic Development issues.
The Master Plan policies are organized into seven themes that were developed at the request of the City Council by the Master Plan Steering Committee. The steering committee was lead by the City Managers Office and comprised of Depart-ment Directors and Managers. Realization of these policies requires long-term planning commitments integrated with the strategic plan and Capital Improvement Plan.
The following goals, objectives and policies from the Las Vegas 2020 Master Plan provide the policy framework and direction for this element.
NEIGHBORHOOD REVITALIZATIONGOAL 2: Mature neighborhoods will be sustained and improved through appropriate and selective
high quality redevelopment and preservation.
OBJECTIVE 2.4: To ensure that the quality of existing residential neighborhoods within the City of Las Vegas is maintained and enhanced.
POLICY 2.4.7: That the City maintain and renovate its public infrastructure within existing neighborhoods as needed.
ECONOMIC DIVERSITYGOAL 4: The economy of the city of Las Vegas, while continuing to be strongly based on the gam-
ing and tourism industries, will broaden to include other business sectors that can take advantage of the locational, climatic and work force advantages offered by Las Vegas.
OBJECTIVE 4.1: To improve the economic resource base within the City by diversifying the range of business opportunities.
POLICY 4.1.9: That the City continue to encourage and promote a business retention strategy with regard to the business which currently operate within the city of Las Vegas.
FISCAL MANAGEMENTGOAL 6: The city of Las Vegas will link capital improvement programming and maintenance and
operations programming with long range planning.
OBJECTIVE 6.1: To ensure that capital and operating expenditures are planned and scheduled in accordance with long range planning commitments.
Street surveying

Economic Elem;Plans-MPlan;indd;rs09/02/09page 6
Intr
od
uct
ion
POLICY 6.1.1: That the City monitor and coordinate capital improvement and operat-ing/maintenance expenditures with long range planning.
POLICY 6.1.2: That the City develop and maintain an approach to fiscal management that focuses on long term life cycle solutions.
POLICY 6.1.3: That additions of expenditure items to the annual budget be approved only with the deletion of items of corresponding value from the list of priori-tized expenditures.
POLICY 6.1.4: That the City establish and follow a policy to set aside funds for public art and architecture.
POLICY 6.1.5: That the City repair and maintain its infrastructure in older areas at a pace which optimizes costs and benefits.
POLICY 6.1.6: That the City, where possible, use public/private partnerships to pay for public capital improvements.

Economic Elem;Plans-MPlan;indd;rs09/02/09 page 7
Bac
kgr
ou
nd
BACKGROUND
GROWTH
Since 1998, the population of the city of Las Vegas has grown from 448,244 to 599,087,1 an increase of 33.7 percent. More than 95 percent of the population increase during the ten-year span has occurred west of Decatur Boulevard. Over-all, the City has added 1.75 new residents every hour, around the clock between July 1998 and July 2008. To accommodate the additional residents, a new housing unit was completed, on average, every 94 minutes, around the clock during the ten-year span. Between 1998 and 2008, the density per square mile of the City’s population increased from 4,138.9 per-sons per square mile to 4,497.7 persons per square mile. Dwell-ing units also increased, going from 1,658.6 per square mile to 1.769.9 per square mile.
Table 1 – City of Las Vegas Population Density
YearPopulation
Population Dwelling UnitsPopulation per Sq. Mile
Dwelling Units per Sq. Mile
Area(Sq. Miles)
1998 448,244 179,621 4,138.9 1,658.6 108.3
2008 599,087 235,751 4,497.7 1,769.9 133.2
Difference2008-1998
150,843 56,130 358.8 111.3 24.9
Source: City of Las Vegas Planning & Development Department
When compared to cities of similar population, Las Vegas has substantially higher population density. Even when com-pared with the 10 most populous cities in the United States, Las Vegas’ population density ranks sixth among them, ahead of cities such as San Diego, Houston and Phoenix. Within the Las Vegas Valley, the city of Las Vegas is easily the most densely populated incorporated city. When Unincorporated Townships are included, the City still ranks among the most densely popu-lated areas in the Valley.
1 Southern Nevada Consensus Population Estimate, July 2008 as approved by the Southern Nevada Regional Planning Coalition Board on November 20, 2008 and reported to the city of Las Vegas City Manager on December 20, 2008
Street improvements

Economic Elem;Plans-MPlan;indd;rs09/02/09page 8
Bac
kgr
ou
nd
Table 2 – Population Density of Las Vegas Valley Cities and Towns
City/Town State PopulationArea
(Sq. Miles)Density
(Sq. Mile)
% Difference from
Las Vegas
Las Vegas NV 599,087 132 4,538.5
Henderson NV 272,063 105 2,591.1 -75.2%
North Las Vegas NV 216,672 98 2,210.9 -105.3%
Boulder City NV 16,840 202 83.4 -5344.1%
Enterprise Town NV 151,115 70 2,158.8 -110.2%
Paradise Town NV 183,972 42 4,380.3 -3.6%
Spring Valley Town NV 178,567 35 5,101.9 11.0%
Winchester Town NV 37,489 5 7,497.8 39.5%
Sunrise Manor Town NV 187,485 33 5,681.4 20.1%
Whitney Town NV 36,503 21 1,738.2 -161.1%
Source: CLV & Clark County Annual Population Estimate 2008
Las Vegas will continue to grow in the future. The most recent projections showed Las Vegas as having a 2010 popula-tion of approximately 659,000.2 The recent economic slow-down has made that figure highly unlikely. The projections also showed Las Vegas absorbing an average of 1,300 vacant acres per year between 2006 – the base year – and 2010. That figure is slightly lower than the average amount of vacant acre-age absorbed between 1998 and 2008.3 Therefore, that figure is likely too high as well.
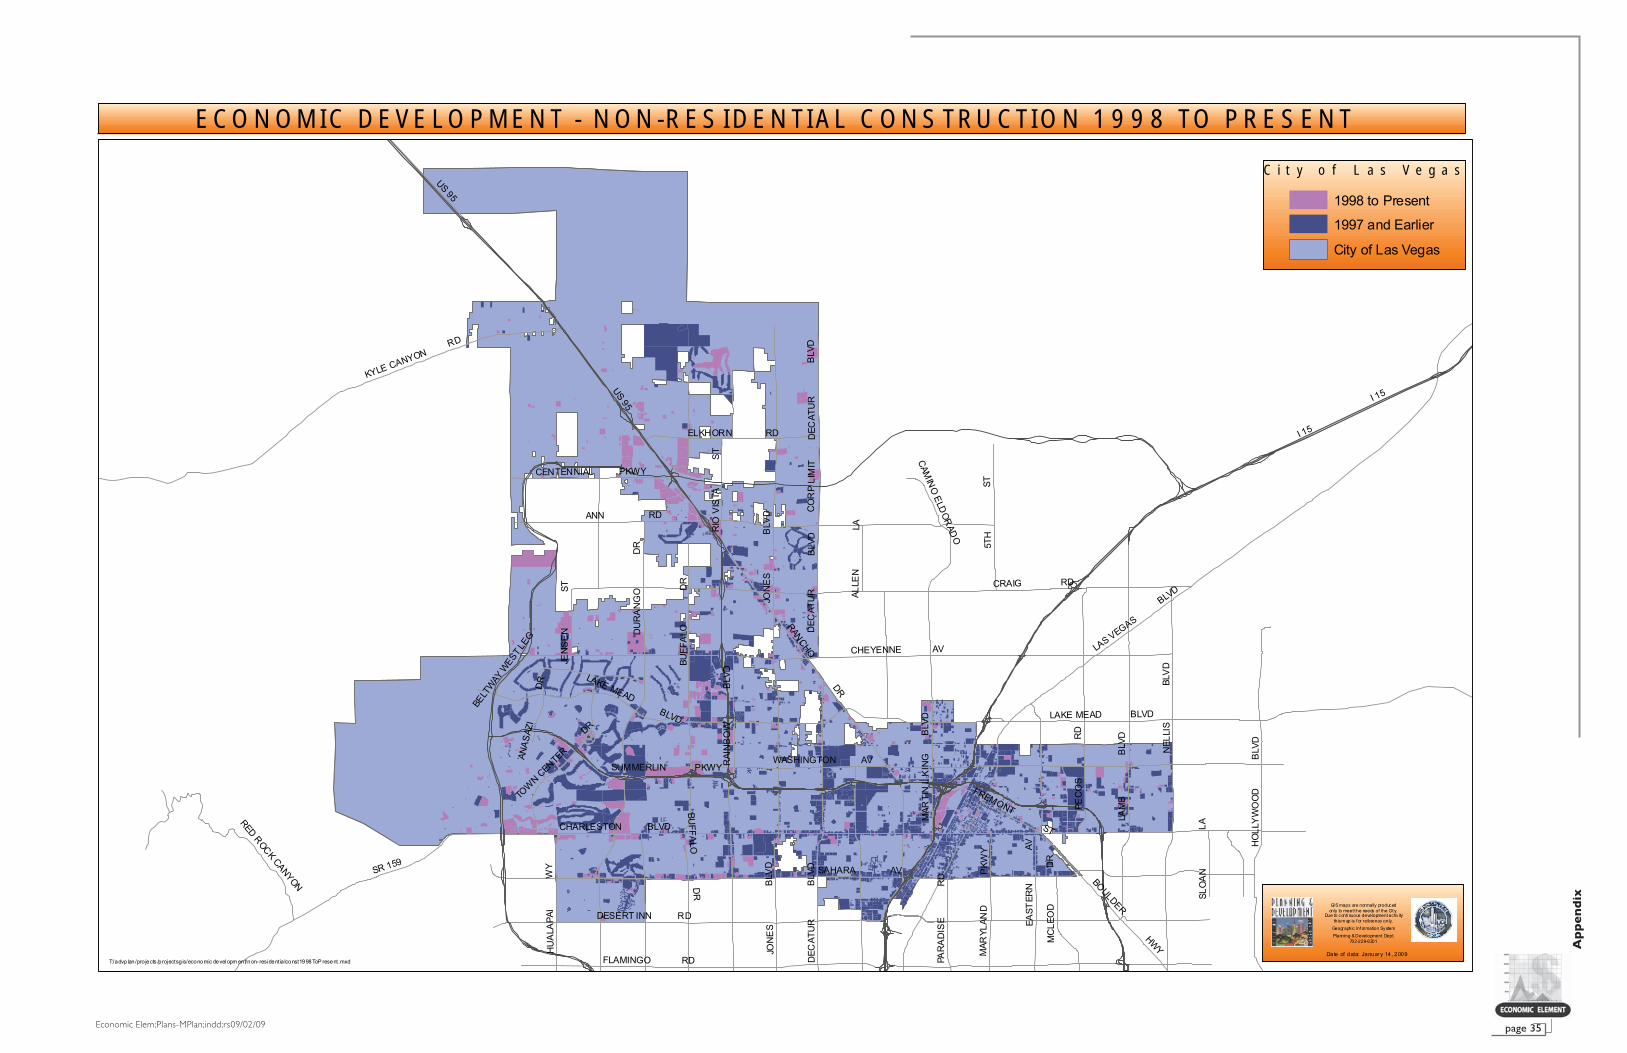
Non-residential development has seen substantial growth during the past ten years. Since 1998, 3,987 acres of land has been absorbed by commercial, industrial, utility and public uses. Non-residential land has been absorbed at a rate of 1.1 acres per day, every day, during the past ten years.
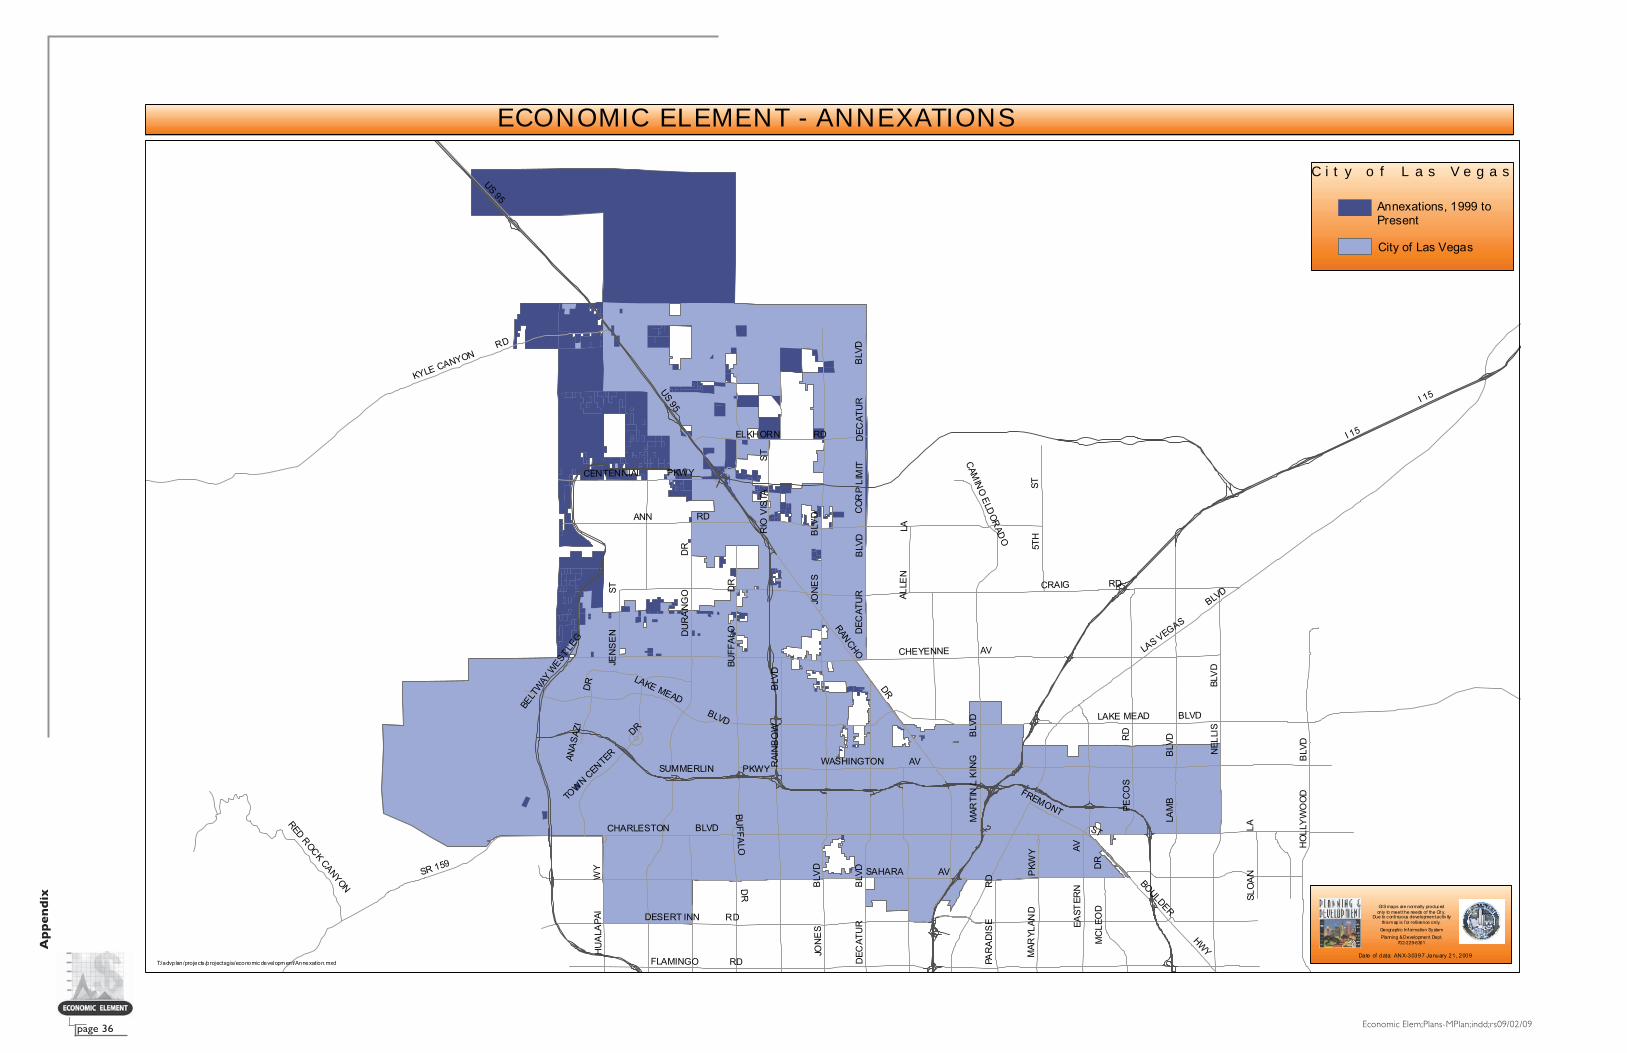
The city of Las Vegas has also grown physically since 1998, going from 108.3 square miles to its present size of 133.2 square miles, an increase of 23 percent.4 The overwhelming majority of the added area due to annexations during the past ten years, 99.2 percent, has occurred in Centennial Hills.
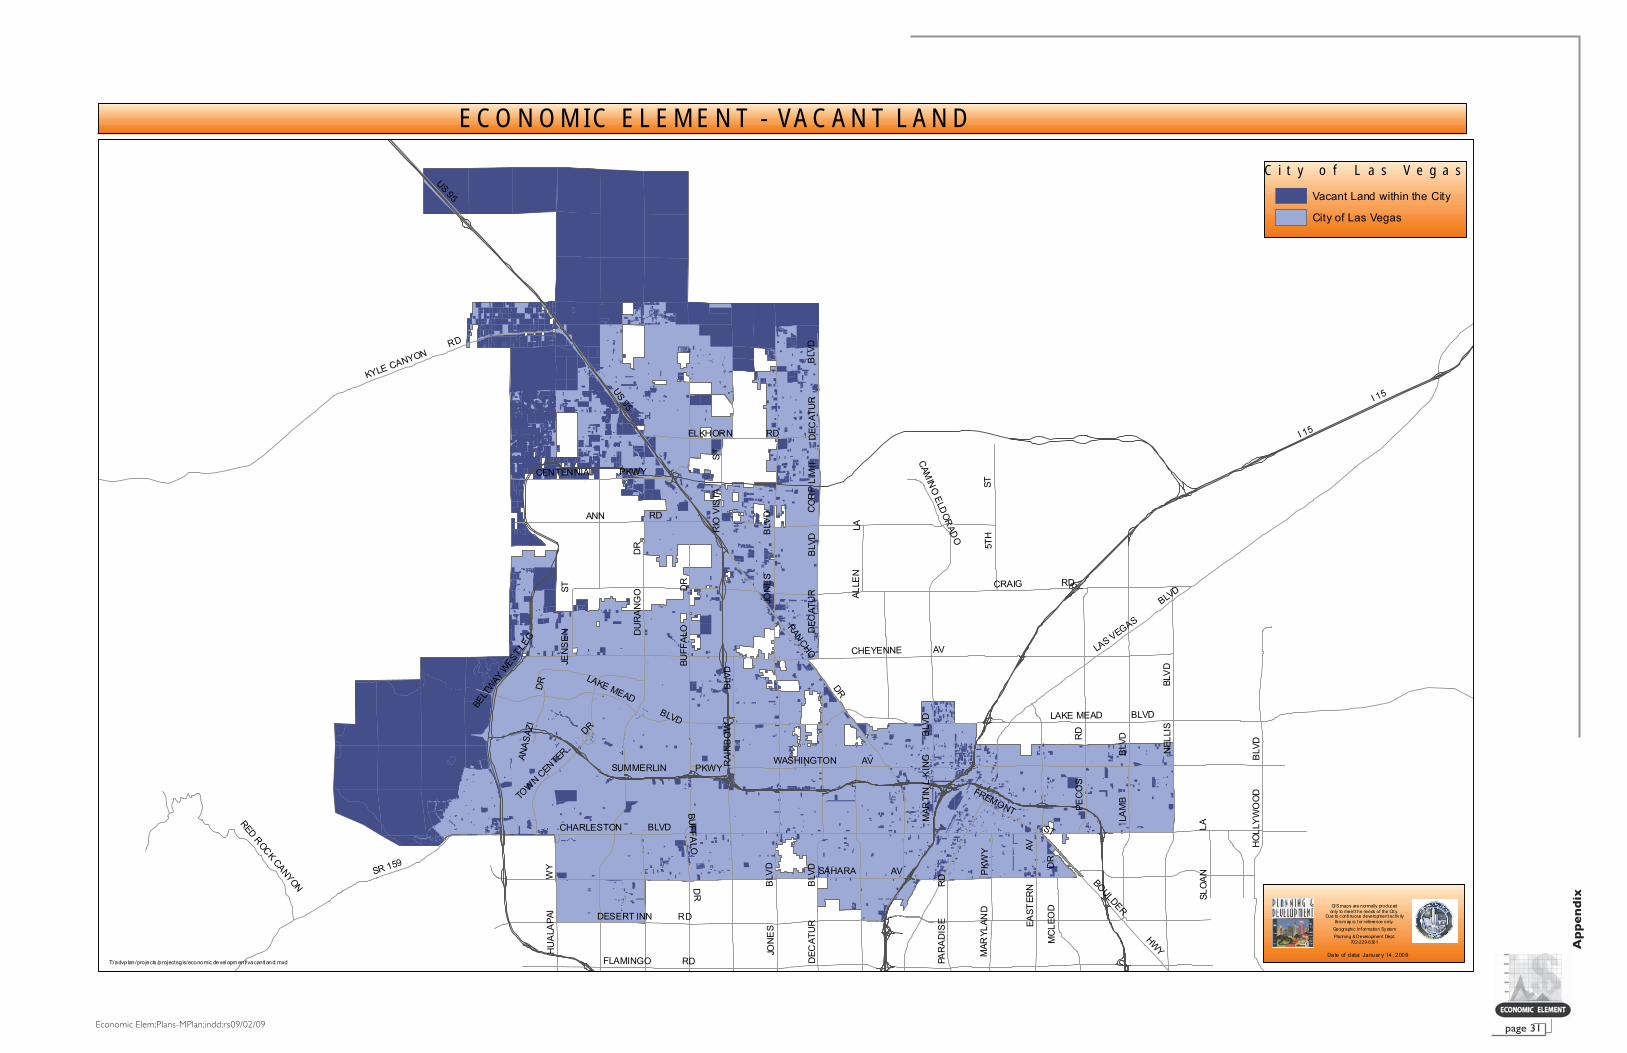
INFRASTRUCTURE CONDITIONS
The city of Las Vegas will continue to see increases in pop-ulation and the amount of vacant land absorbed. Vacant land is currently the single largest existing land use in the City with approximately 26,000 acres.5 The majority of the vacant land in the City (64.5%) is in Centennial Hills followed by the South-
2 Southern Nevada Regional Planning Coalition Land Use Work Group Consensus Forecast
3 City of Las Vegas Planning and Development Department, December 2008
4 City of Las Vegas Planning and Development Department, December 2008
5 Clark County Assessors Office, December 2008

Economic Elem;Plans-MPlan;indd;rs09/02/09 page 9
Bac
kgr
ou
nd
west with 31.8 percent. Only 3.7% of the land in the Southeast is classified as vacant. The discrepancies in the amount of vacant land between the Planning Areas indicate areas with vastly different capital investment needs in the future.
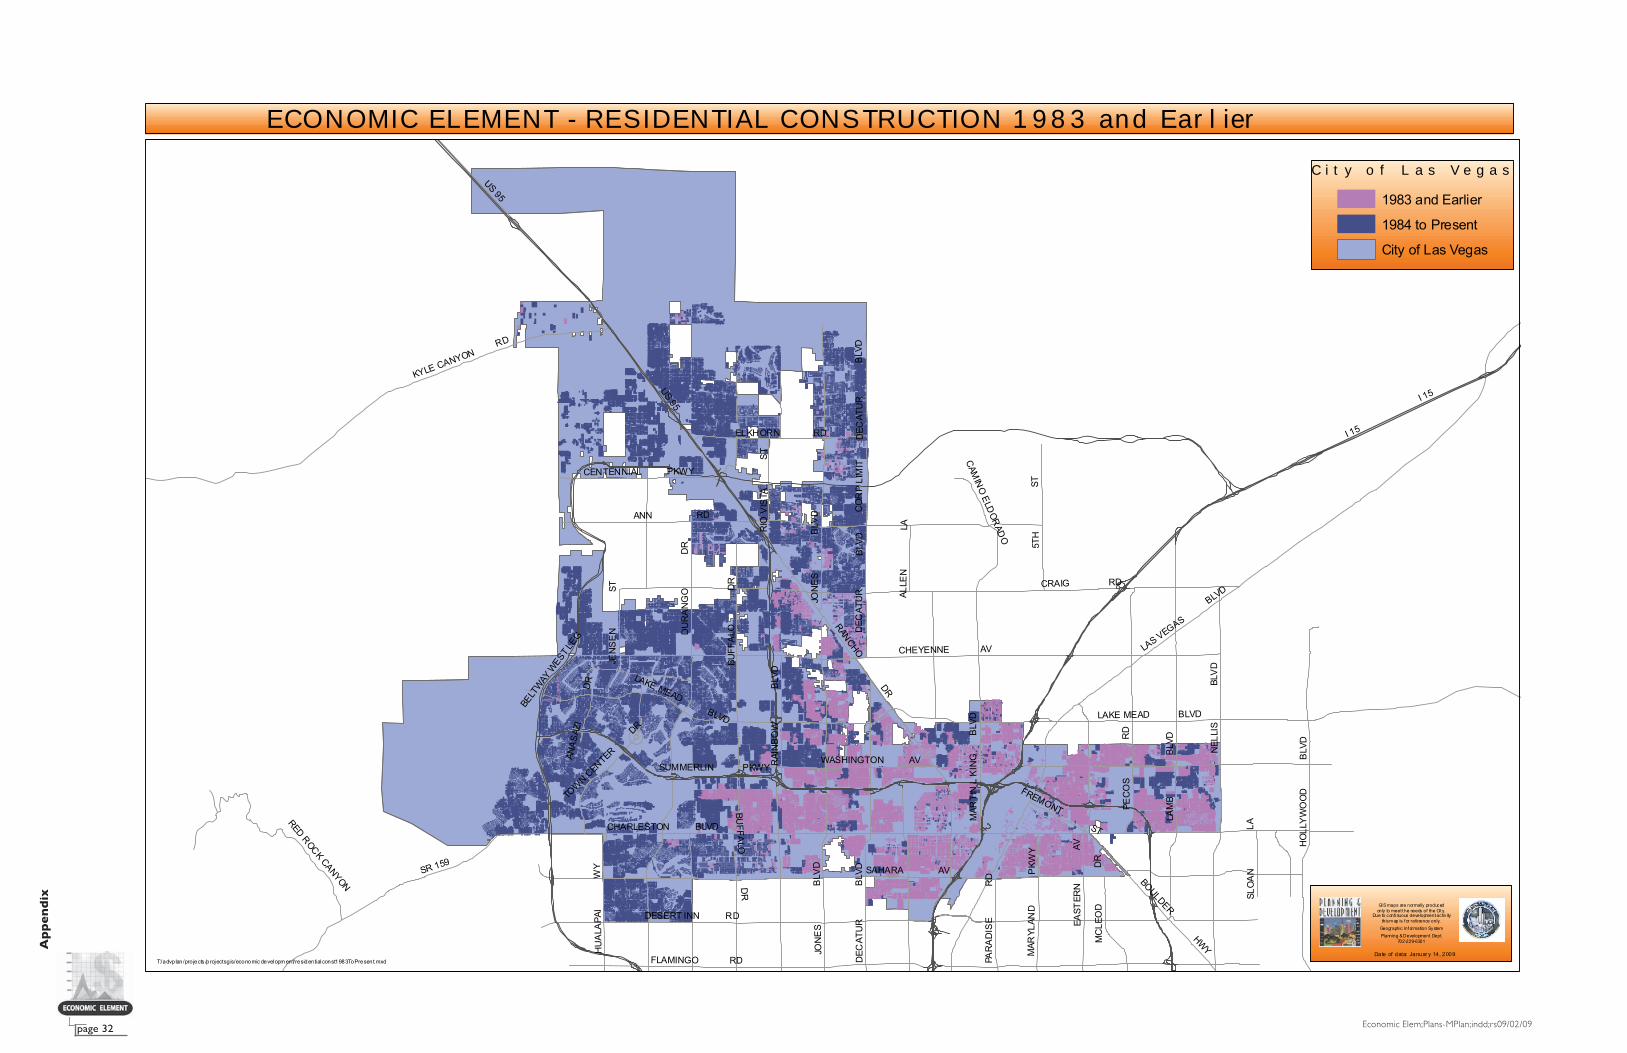
To further illustrate this point, the age of structures, resi-dential and non-residential, needs to be examined. The age of the structures can be an indicator of the age of the infrastruc-ture in the area and/or a reflection of applicable standards at the time the infrastructure was put in place.
In Centennial Hills, just over half of the residential units were built in 1998 or after. Conversely, in the Southeast, 3.6 percent of the residential units have been built during the same time. It’s a similar scenario for non-residential development. In Centennial Hills more than half of the non-residential units have been built since 1998. In the Southeast, about 10 percent of the non-residential development has occurred during the past ten years.
Perhaps as important for capital planning as the develop-ment that has occurred during the past decade is the develop-ment that took place 25 or more years ago. In the Southeast, 83.6 percent of the residential structures are 25 years old or more. In Centennial Hills that number is 8.8 percent. For non-residential development, 64.3 percent of the structures in the Southeast were built in 1983 or earlier. In Centennial Hills that number is 29.9 percent. That seemingly high number is likely due to the presence of Floyd Lamb Park and Commercial/In-dustrial structures along Rancho Drive, which at one time was the main route to the Las Vegas Valley’s northwest and points beyond.
Economic Elem;Plans-MPlan;indd;rs09/02/09page 10
Ex
isti
ng
Co
nd
itio
ns
EXISTING CONDITIONS
CIP PURPOSE
The city of Las Vegas Capital Improvement Plan is the city’s multiyear planning document that identifies and priori-tizes expenditures for a variety of public improvements. The CIP identifies individual project scopes, schedules and funding, and provides order and continuity to the repair, replacement, construction or expansion of the city’s capital assets. The CIP is funded on an annual basis and includes revenues from other government entities, bond issues, charges for services, and transfers from other city of Las Vegas funds.
The CIP process begins early each year when each depart-ment submits individual project requests to the Department of Finance’s Budget and Finance Division. Each request is evalu-ated for completeness and accuracy, fiscal impact, and avail-able funding sources. The CIP is then compared with the City’s Master Plan, which is the primary document used to guide fu-ture growth and development. All projects must be previously adopted by the City Council as part of the City’s Master Plan before receiving funding within the CIP committee. Recom-mendations are then submitted to the City Manager.
The broad categories for CIP projects are described below. The allocation of funding and expenditures for each category varies from year to year. The amount and share allotted for funding and expenditures by category are shown on the fol-lowing pages.
CIP PROGRAM DESCRIPTIONS
Public Safety: Improvements to the detention center, construction and acquisition of fire apparatus, training facilities and future fire stations, and traffic improvements.
Public Works: Infrastructure improvements to the City’s street system, sidewalks, public landscape, special improvement districts and flood and sanitary sewer conveyance systems.
Culture and Recreation: Renovation to existing parks, recreation and senior citizen facilities, and construction of additional parks, trails and recreation centers to meet the public’s increasing demand for recreational services and a performing arts center.
Economic Development: Projects aimed at attracting businesses and revitalizing speci-fied areas of the City, and providing assistance to people with low to moderate incomes.
General Government: New facilities and major renovations and upgrades to the existing City Hall and satellite facilities.
Sanitation: Water Pollution Control Facility expansion, major sewer lines and interceptors.
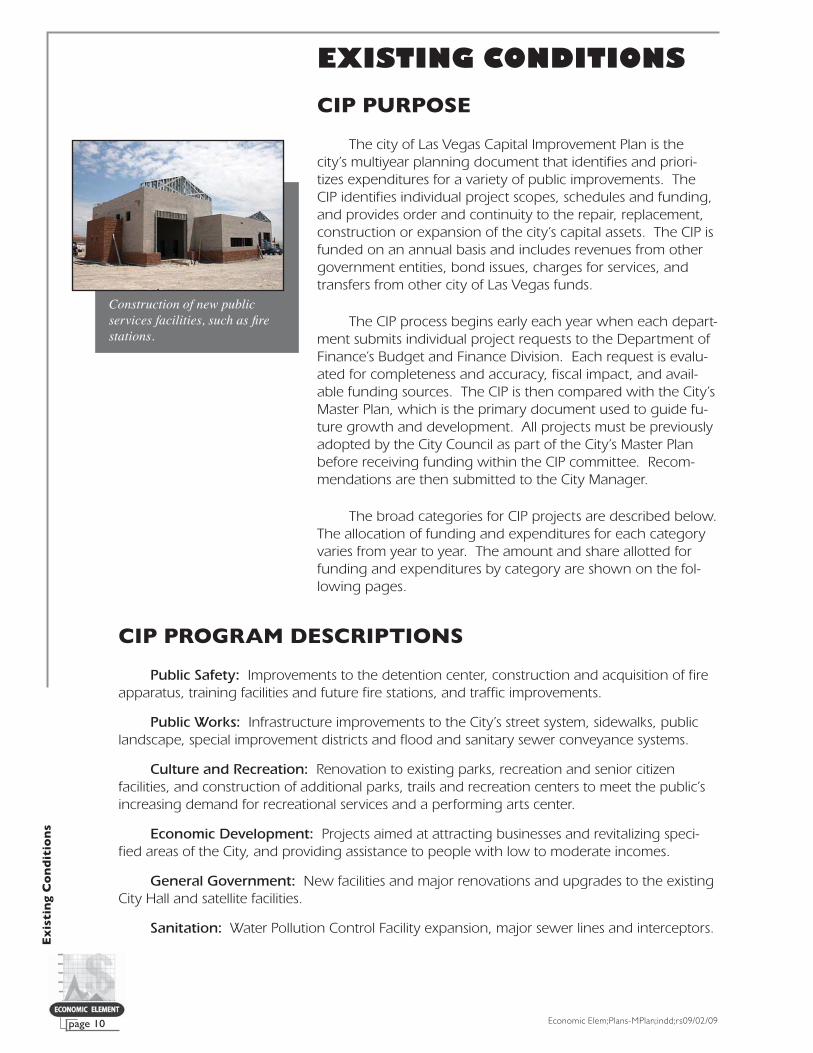
Construction of new public services facilities, such as fi re stations.

Economic Elem;Plans-MPlan;indd;rs09/02/09 page 11
Ex
isti
ng
Co
nd
itio
ns
CAPITAL IMPROVEMENT EXPENDITURES, FY 03 – FY 08
As stated previously, the amount of CIP expenditures varies from year to year. Between FY 03 and FY 08, the City averaged spending $454.4 million on CIP projects. The high mark for expenditures was $665.5 million in FY 07, the low was $318.5 million spent in FY 03. On average, $177.1 million was spent on Public Works programs during the six-year span. During the same time, an average of $149.0 million was spent on Culture and Recreation programs. The expenditures for CIP projects from FY 03 through FY 08 are shown in Table 3.
Table 3 – CIP Expenditures FY 03 – FY 08 (in millions of dollars)
Program FY 03 FY 04 FY 05 FY 06 FY 07 FY 08 Total Average
General Government $ 14.5 $ 13.6 $ 45.9 $ 42.3 $ 46.6 $ 39.8 $ 202.7 $ 33.8
Public Safety $ 29.9 $ 33.2 $ 23.0 $ 21.6 $ 38.6 $ 37.7 $ 184.0 $ 30.7
Sanitation $ 44.7 $ 43.2 $ 45.5 $ 39.2 $ 35.6 $ 35.3 $ 243.5 $ 40.6
Public Works $ 147.1 $ 128.6 $205.1 $ 195.2 $246.0 $ 140.8 $ 1,062.8 $ 177.1
Culture and Recreation $ 69.9 $ 95.1 $126.2 $ 181.6 $250.0 $ 171.4 $ 894.2 $149.0
Economic Development and Assistance
$ 12.4 $ 12.3 $ 14.4 $ 12.7 $ 48.7 $ 38.6 $ 139.1 $ 23.2
Total $318.5 $326.0 $460.1 $492.6 $665.5 $463.6 $2,726.3 $454.4
Table 4 – CIP Expenditures, Percent of Total FY 03 – FY 08
Program FY 03 FY 04 FY 05 FY 06 FY 07 FY 08 Average
GeneralGovernment
4.55% 4.17% 9.98% 8.59% 7.00% 8.58% 7.43%
Public Safety 9.39% 10.18% 5.00% 4.38% 5.80% 8.13% 6.75%
Sanitation 14.03% 13.25% 9.89% 7.96% 5.35% 7.61% 8.93%
Public Works 46.19% 39.45% 44.58% 39.63% 36.96% 30.37% 38.98%
Culture andRecreation
21.95% 29.17% 27.43% 36.87% 37.57% 36.97% 32.80%
EconomicDevelopment andAssistance
3.89% 3.77% 3.13% 2.58% 7.32% 8.33% 5.10%
Total 100.0% 100.0% 100.0% 100.0% 100.0% 100.0% 100.0%

Economic Elem;Plans-MPlan;indd;rs09/02/09page 12
Ex
isti
ng
Co
nd
itio
ns
CAPITAL IMPROVEMENT FUNDING SOURCES, FY 03 – FY 08
Similar to CIP expenditures, funding sources for CIP proj-ects vary from year to year. Nearly 40 percent of the funds for programs came from “Other Governments” during the six year span, by far the largest source. Included within this source are funds from the RTC, CCRFCD, FHWA and SNPLMA. Various bonds and service fees account for the next largest sources of funds since FY 03. Funding sources for CIP projects within the city of Las Vegas between FY 03 and FY 08 are shown in Table 5.
Table 5 – CIP Projects Funding Sources, FY 03 – FY 08 (in millions of dollars)
Funding Sources FY 03 FY 04 FY 05 FY 06 FY 07 FY 08 Total Average
OtherGovernments
116.2 94.8 154.5 149.8 305.8 242.9 1,064.0 177.3
Fees 34.7 43.2 47.2 41.2 37.2 37.1 240.6 40.1
Fund Balance 88.0 94.4 91.4 94.2 146.4 109.0 623.4 103.9
Bonds 33.5 25.7 70.3 103.8 111.7 25.3 370.3 61.7
Taxes 15.3 16.1 25.1 10.8 14.7 21.8 103.8 17.3
SpecialAssessments
20.9 22.2 42.3 45.4 39.7 27.0 197.5 32.9
Contributions 9.9 29.6 29.3 47.4 10.0 0.5 126.7 21.1
Total Funding Sources
318.5 326.0 460.1 492.6 665.5 463.6 2,726.3 454.4
Table 6 – CIP Funding Sources, Percent of Total FY 03 – FY 08
Funding Sources FY 03 FY 04 FY 05 FY 06 FY 07 FY 08 Average
Other Governments 36.48% 29.08% 33.58% 30.41% 45.95% 52.39% 39.03%
Fees 10.89% 13.25% 10.26% 8.36% 5.59% 8.00% 8.83%
Fund Balance 27.63% 28.96% 19.87% 19.12% 22.00% 23.51% 22.87%
Bonds 10.52% 7.88% 15.28% 21.07% 16.78% 5.46% 13.58%
Taxes 4.80% 4.94% 5.46% 2.19% 2.21% 4.70% 3.81%
Special Assessments 6.56% 6.81% 9.19% 9.22% 5.97% 5.82% 7.24%
Contributions 3.11% 9.08% 6.37% 9.62% 1.50% 0.11% 4.65%
Total Funding Sources 100.00% 100.00% 100.00% 100.00% 100.00% 100.00% 100.00%
Economic Elem;Plans-MPlan;indd;rs09/02/09 page 13
Ex
isti
ng
Co
nd
itio
ns
Within these sources are clearly defined resources for funding CIP projects. Many of the funding resources are de-pendent upon economic conditions and components of popu-lation growth and experience fluctuations as a result. Some ex-isting resources for CIP funding, their purpose, and the average annual amount of funding FY 03 – FY 08, are as shown below. Some funding sources are not used every year and/or are new and did not exist for the entire six-year span.
• Bonds – General obligation bonds or revenue bonds already issued which are used for parks and recreation projects, public safety facilities and city facility projects. (FY03 – 08, $37.6 million)
• Car Rental Tax – Two percent tax imposed on short-term passenger car rentals which must be used to construct, equip, operate and/or maintain a performing artscenter. (FY03 – 08, $4.8 million)
• Contributions – Businesses or individuals who either wish to fund special projects or want a particular benefit, e.g., road surfacing and drainage projects are partially funded with contributions to have the project completed. (FY03 – 08, $3.3 million)
• Clark County Regional Flood Control District (CCRFCD) – Reimbursement received from CCRFCD, funded from a voter approved 1/4 cent increase in Sales Tax to repay bonds issued to design and construct flood controlprojects. (FY03 – 08, $37.6 million)
• Fire Safety Tax Initiative – A property tax of $0.095 per $100.00 of assessed valuation to improve the City’s fire protection facilities and staffing. (FY03 – 08, $0.6million)
• Fund Balance (FB) – Reserve monies accumulated from prior years’ appropriations for work-in-progress projects. (FY03 – 08, $103.9 million)
• Future Bonds – General obligations bonds or revenue bonds to be issued in the future per the CIP recommen-dation. (FY03 – 08, $33.9 million)
• Grants – Federal monies received from: (FY03 – 08, $18.9 million)
1. Community Development Block Grant (CDBG)programs.
2. HOME Grant programs.
• Impact Fees – Imposed on new development to finance costs for constructing capital improvements or facility expansions necessitated by new development. (FY03 – 08, $1.7 million)
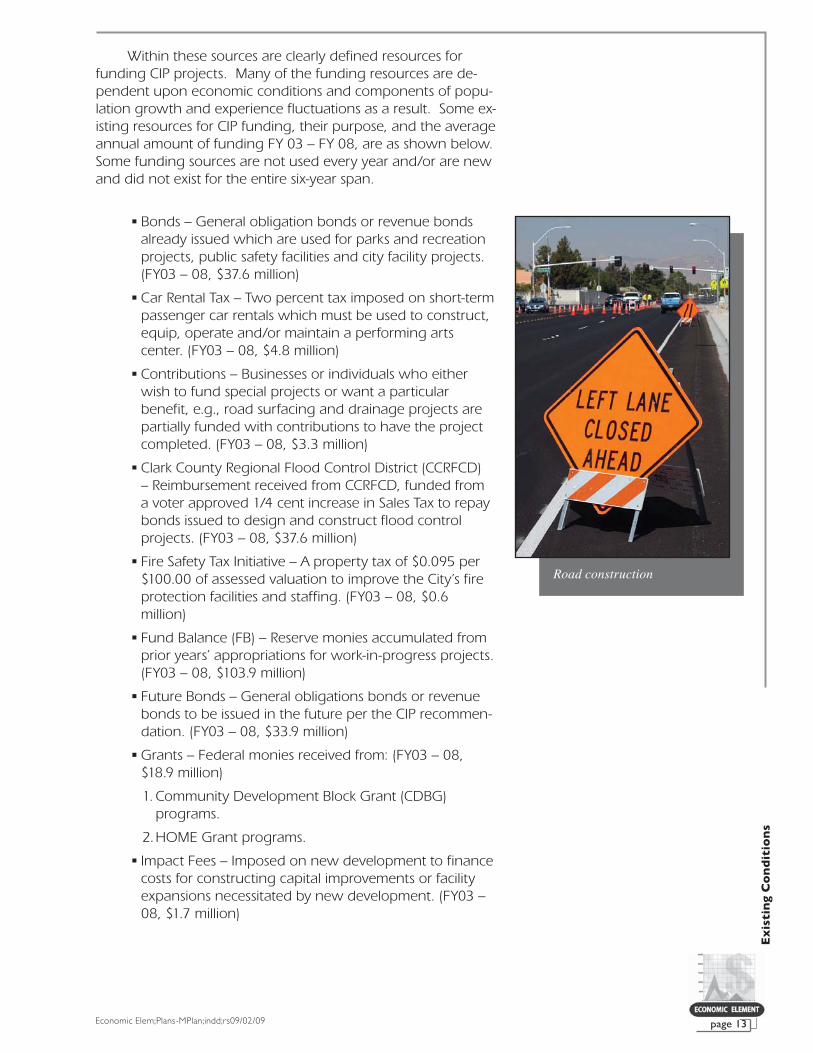
Road construction
Economic Elem;Plans-MPlan;indd;rs09/02/09page 14
Ex
isti
ng
Co
nd
itio
ns
• Land Sales – Sales of City-owned lots within industrial and business parks. (FY03 – 08, None)
• Local Governments (GOVTS) – Reimbursements from other government entities per interlocal agreements. (FY03 – 08, $3.3 million)
• Nevada Department of Transportation (NDOT) – Reim-bursements received from NDOT paid from tax rev-enue for traffic safety programs, as well as gasoline tax revenues for roadway maintenance. (FY03 – 08, $3.9 million)
• Regional Transportation Commission (RTC) – Reimburse-ments for street construction and flood control projects received from RTC bond proceeds. The debt is repaid with gasoline taxes. (FY03 – 08, $93.7 million)
• Residential Construction Tax (RCT) – Imposed on the construction of new apartment houses and residential dwelling units to pay for constructing capital improve-ments in particular districts. (FY03 – 08, $10.1 million)
• Room Tax – Monies received from the State of Nevada for a legislatively imposed 1% motel/hotel room tax to be used exclusively for transportation projects. (FY03 – 08, $11.4 million),
• Service Fees – Charges to individuals based on their us-age on special services. (FY03 – 08, $39.0 million)
• Southern Nevada Public Lands Management Act (SN-PLMA) – Public land sales to fund the development of parks, trails and natural areas. (FY03 – 08, $113.8 million)
• Special Assessments (Assessments) – Amounts received from certain property owners to defray all or part of the cost of capital improvement projects deemed to benefit those owners’ properties. (FY03, – 08 $32.9 million)
According to the City’s Five-Year Capital Improvement Plan FY 2009 – 2013, for Las Vegas to fund the necessary expansion of facilities over the next several years, management will need to consider future bond issues. The City has a legal debt limita-tion not to exceed 20% of the total assessed valuation of the taxable property within the City boundaries. Currently, the City debt is approximately 1.3% of assessed valuation. Bond issues can go to a vote of the people and, therefore, be repaid by an increase to property taxes or repaid by a designated revenue or user fee.

Economic Elem;Plans-MPlan;indd;rs09/02/09 page 15
An
aly
sis
ANALYSIS
THE CAPITAL IMPROVEMENT PLAN PROCESS
One of the principal findings of the Las Vegas 2020 Master Plan policy document adopted in 2000 was the need to link capital improvement programming and operating and maintenance programming budgets with long range planning as contained in the Master Plan. This linkage is necessary to efficiently coordinate the planning and construction of infra-structure and the development of services in anticipation of new development, or in the future, of urban redevelopment. To achieve a high level of coordination, the Master Plan high-lighted the need to have staff in place to provide a dedicated link between the Master Plan and the City departments and relevant agencies vested with developing this infrastructure and with providing these services.
To be included in the Capital Improvement Plan, a proj-ect must go through the city’s Capital Improvement Project Committee and be reviewed based on priorities contained in the Master Plan. The purpose of this process is to reduce the number of submittals and allocate the limited resources avail-able to the most worthy projects, making the CIP a valuable planning tool rather than a project wish list. Execution of the various components of the plan is the NRS stated purpose of the Economic Element of the Master Plan. The basic steps in proposing a project for inclusion in the City’s Five Year CIP in conformance with the Master Plan are as follows:
1. Identify Need and Project Sponsor – The project has been identified as the best alternative and the sponsor prepares the CIP Approval package.
2. Prepare Submittal – The project sponsor with the con-currence of their department management prepares the submittal package to Public Works for placement on the CIP Committee agenda and presents the project to the Committee. It is required of the applicant to identify the Master Plan elements where the proposed project is shown.
3. Present to the Committee – Upon review, the CIP Com-mittee may approve, deny or return the proposal to the sponsor for re-submittal, possibly with advice to revise, supplement or shelve.
Storm drains

Economic Elem;Plans-MPlan;indd;rs09/02/09page 16
An
aly
sis
4. Approval – If approved by the CIP Committee, the proj-ect becomes eligible for: (All of these actions are pend-ing final approval by the City Council.)
a) inclusion in the Five Year CIP
b) funding of the project from city revenue sources
c) approval of project interlocal agreements for the project’s development, and
d) approval to apply for grant funding and other out-side funding sources.
The project sponsoring department is the city department whose mission will most be benefited or affected by the proj-ect, regardless of who first identified the need or who controls the funding. The sponsor is never an elected official even if it championed the project. The following is a list of the city de-partments and the projects they are eligible to sponsor:
• Planning and Development – Trails, trailheads, urban pathways, streetscapes, and sidewalk projects.
• Leisure Services – All parks and facilities they operate including recreation/community center, senior centers, pools, golf courses, community schools, track break centers, and museums.
• Public Works – All streets, storm drainage, right-of-way utilities, traffic improvements, sanitation projects, and some trails and trailheads.
• Field Operations – All facility maintenance, repair and scheduled upgrade or replacement projects.
• Fire and Rescue – Fire stations and emergency training and response facilities.
• Detention and Enforcement – Detention facilities and all security upgrade projects.
• Office of Business Development – Certain economic development projects.
• Neighborhood Services – Certain economic develop-ment projects.
• Information Technologies – IT infrastructure projects.
• City Manager’s Office – Special projects.
• All Departments – New construction and remodels of facilities occupied by their staff, materials, or equipment.
• Other Organizations – Occasionally outside organiza-tions, such as the Metropolitan Police Department for its substations.

Economic Elem;Plans-MPlan;indd;rs09/02/09 page 17
An
aly
sis
FIVE-YEAR CAPITAL IMPROVEMENT PLAN,FY 2009 – 2013
The City’s Five Year CIP represents a compilation and analysis of capital needs anticipated between FY 2009 and FY 2013. This plan includes construction of new facilities and the renovation of existing facilities including city facilities, parks, transportation infrastructure, and flood control.
There is a demand for government services, facilities, and capital investments to keep current with existing challenges. Capital investments are critical in providing safe neighbor-hoods, acceptable transportation corridors, protection from flooding, sufficient waste water treatment capacity, adequate parks, and quality recreation facilities for Las Vegas residents. In addition, the City must look forward to evaluate and identify facilities that serve the public, such as customer service offices and community centers.
The Five-Year CIP is a guide for future projects and im-provements in the City. As such it is subject to change and re-vision as various council initiatives change. Years two through five represent the opinions of department heads and City management in determining identifiable long-term needs for the City. The Mayor and Council have prioritized the numerous projects proposed and only those with probable funding are reflected in the plan.
CAPITAL IMPROVEMENT EXPENDITURES, FY 09 – FY 13
Expenditures during the next five years are anticipated to average $371.8 million per year. Expenditures beyond the first fiscal year of the CIP are not appropriated or in any way obli-gated or assured. A more realistic figure would be the average expenditures over the first three Fiscal Years, FY 09 through FY11, where the average expenditures will total about $573 million per year. CIP projects in the near-term are an existing known need and short-term funding is more easily determined and likely to occur. During the first three years of the CIP, Pub-lic Works and Culture and Recreation projects will account for just over 70 percent of the expenditures. The projected expen-ditures for CIP projects from FY 09 through FY 13 are shown in Table 7.
Signal installation

Economic Elem;Plans-MPlan;indd;rs09/02/09page 18
An
aly
sis
Table 7 – CIP Expenditures FY 09 – FY 13 (in millions of dollars)
Program FY 09 FY 10 FY 11 FY 12 FY 13 Total Average
General Government $ 16.3 $ 82.1 $ 65.0 $ 5.0 $ – $ 168.4 $ 42.1
Public Safety $ 16.8 $ 26.6 $ 26.1 $ 19.9 $ 2.8 $ 92.2 $ 18.4
Sanitation $ 78.5 $ 64.6 $ 26.2 $ 22.3 $ 10.0 $ 201.6 $ 40.3
Public Works $ 311.2 $ 198.2 $ 227.0 $ 46.0 $ 24.8 $ 807.2 $ 161.4
Culture and Recreation $232.7 $ 154.1 $ 85.2 $ – $ – $ 472.0 $ 157.3
Economic Development and Assistance
$ 17.6 $ 39.7 $ 50.8 $ 9.5 $ – $ 117.6 $ 29.4
Total $673.1 $565.3 $480.3 $102.7 $37.6 $1,859.0 $371.8
Table 8 – CIP Expenditures, Percent of Total FY 09 – FY 13
Program FY 09 FY 10 FY 11 FY 12 FY 13 Average
General Government 2.42% 14.52% 13.53% 4.87% 0.00% 9.06%
Public Safety 2.50% 4.71% 5.43% 19.38% 7.45% 4.96%
Sanitation 11.66% 11.43% 5.45% 21.71% 26.60% 10.84%
Public Works 46.23% 35.06% 47.26% 44.79% 65.96% 43.42%
Culture and Recreation 34.57% 27.26% 17.74% 0.00% 0.00% 25.39%
Economic Development and Assistance 2.61% 7.02% 10.58% 9.25% 0.00% 6.33%
Total 100.00% 100.00% 100.00% 100.00% 100.00% 100.00%

Economic Elem;Plans-MPlan;indd;rs09/02/09 page 19
An
aly
sis
CAPITAL IMPROVEMENT FUNDING SOURCES, FY 09 – FY 13
Expenditures for the five-year CIP are based upon exist-ing sources of funds and their anticipated revenue. The funds generated vary due to fluctuations in activities such as resi-dential construction, gas and sales tax collected, changes in assessments, and the services for which the City can charge a fee. At this point, the City is anticipating continued consistent funding from the CCRFCD, with average annual contributions of $58.1 million. However, funding from the RTC and SNPLMA will greatly decrease due to the economic downturn. Bonds and Future Bonds are expected to have a major role in funding during the next five years, averaging $75.1 million per year. As previously stated, the city of Las Vegas Public Works Depart-ment feels that for the City to meet its future need to expand facilities, it will need to issue additional bonds or identify alter-nate funding sources such as federal grants. Funding sources for CIP projects within the city of Las Vegas between FY 09 and FY 13 are shown in Table 9.
Table 9 – CIP Projects Funding Sources, FY 09 – FY 13 (in millions of dollars)
Funding Sources FY 09 FY 10 FY 11 FY 12 FY 13 Total Average
Other Government $384.7 $ 199.3 $ 245.0 $ 64.7 $ 26.4 $ 920.1 $ 184.0
Fees $ 80.2 $ 65.4 $ 27.4 $ 23.4 $ 11.3 $ 207.7 $ 41.5
Fund Balance $ 54.0 $ 31.0 $ 3.4 $ – $ – $ 88.4 $ 29.5
Bonds $ 61.0 $ 172.2 $ 65.0 $ 5.0 $ – $ 303.2 $ 75.8
Taxes $ 32.1 $ 1.8 $ 2.3 $ – $ – $ 36.2 $ 12.1
Special Assessments $ 5.6 $ 19.4 $ 0.9 $ – $ – $ 25.9 $ 8.6
Contributions $ 55.5 $ 76.2 $ 105.8 $ – $ – $ 237.5 $ 79.2
Land Sales $ – $ – $ – $ 30.5 $ 9.5 $ 40.0 $ 20.0
Total Funding Sources $673.1 $565.3 $449.8 $123.6 $ 47.2 $1,859.0 $371.8
Table 10 – CIP Funding Sources, Percent of Total FY 09 – FY 13
Funding Sources FY 09 FY 10 FY 11 FY 12 FY 13 Average
Other Governments 57.15% 35.26% 54.47% 52.35% 55.93% 49.49%
Fees 11.92% 11.57% 6.09% 18.93% 23.94% 11.17%
Fund Balance 8.02% 5.48% 0.76% 0.00% 0.00% 4.76%
Bonds 9.06% 30.46% 14.45% 4.05% 0.00% 16.31%
Taxes 4.77% 0.32% 0.51% 0.00% 0.00% 1.95%
Special Assessments 0.83% 3.43% 0.20% 0.00% 0.00% 1.39%
Contributions 8.25% 13.48% 23.52% 0.00% 0.00% 12.78%
Land Sales 0.00% 0.00% 0.00% 24.68% 20.13% 2.15%
Total Funding Sources 100.00% 100.00% 100.00% 100.00% 100.00% 100.00%
Trail networks

Economic Elem;Plans-MPlan;indd;rs09/02/09page 20
An
aly
sis
CIP PROJECT SCHEDULE,FY09 – FY13
There are 323 approved requests for funding for projects within the 2009 – 2013 Capital Improvement Plan. Within those funding requests are 230 separate projects. The dif-ference between the number of requests and the number of projects is that some projects are on-going maintenance and/or renovations at City facilities and require a funding applica-tion for each year of activity. Others are projects that require more than one fiscal year to complete such as the public/private Performing Arts Center which also require multiple funding requests. Current requests for funds for a project total $1.86 billion. The majority of that funding, approximately $1.72 billion, is for the fiscal years 2009 through 2011. Beyond those years it is difficult to determine the amount of funding that will be available from sources that rely on activity to generate funds such as Service Fees, Residential Construction Tax, and Car Rental Tax.
RESTRICTED FUNDS
SOUTHERN NEVADA PUBLIC LANDS MANAGEMENT ACT (SNPLMA)
The SNPLMA was adopted by the 105th Congress in October of 1998 as Public Law 105-263 (PL 105-263). It allows the United States Department of the Interior’s Bureau of Land Management (BLM) to sell public land within a specific disposal boundary (See Map BLM) around the Las Vegas Valley. The initial disposal boundary was established in 1998 and encom-passed approximately 474.9 square miles. The original bound-aries were expanded in 2002 and now cover 517.5 square miles. The revenue derived from land sales is split between the State of Nevada General Education Fund (5%), the Southern Nevada Water Authority (10%), and a special account available to the Secretary of the Interior for:
• Parks, Trails, and Natural Areas
• Capital Improvements
• Conservation Initiatives
• Multi-Species Habitat Conversation Plans (MSHCP)
• Environmentally Sensitive Land Acquisitions
• Lake Tahoe Restoration Act Projects
SNPLMA funds are allocated annually in “rounds.” The Planning and Development Department’s role in the SNPLMA process has been to identify projects and determine their
Economic Elem;Plans-MPlan;indd;rs09/02/09 page 21
An
aly
sis
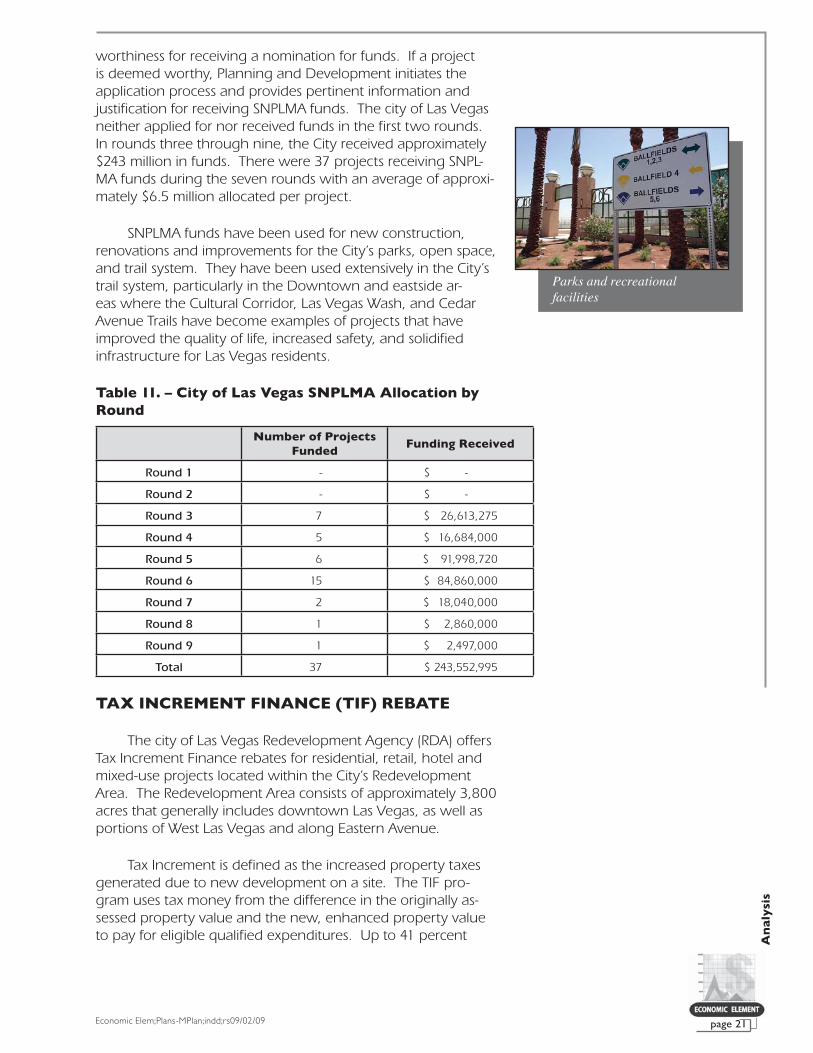
worthiness for receiving a nomination for funds. If a project is deemed worthy, Planning and Development initiates the application process and provides pertinent information and justification for receiving SNPLMA funds. The city of Las Vegas neither applied for nor received funds in the first two rounds. In rounds three through nine, the City received approximately $243 million in funds. There were 37 projects receiving SNPL-MA funds during the seven rounds with an average of approxi-mately $6.5 million allocated per project.
SNPLMA funds have been used for new construction, renovations and improvements for the City’s parks, open space, and trail system. They have been used extensively in the City’s trail system, particularly in the Downtown and eastside ar-eas where the Cultural Corridor, Las Vegas Wash, and Cedar Avenue Trails have become examples of projects that have improved the quality of life, increased safety, and solidified infrastructure for Las Vegas residents.
Table 11. – City of Las Vegas SNPLMA Allocation by Round
Number of Projects Funded
Funding Received
Round 1 - $ -
Round 2 - $ -
Round 3 7 $ 26,613,275
Round 4 5 $ 16,684,000
Round 5 6 $ 91,998,720
Round 6 15 $ 84,860,000
Round 7 2 $ 18,040,000
Round 8 1 $ 2,860,000
Round 9 1 $ 2,497,000
Total 37 $ 243,552,995
TAX INCREMENT FINANCE (TIF) REBATE
The city of Las Vegas Redevelopment Agency (RDA) offers Tax Increment Finance rebates for residential, retail, hotel and mixed-use projects located within the City’s Redevelopment Area. The Redevelopment Area consists of approximately 3,800 acres that generally includes downtown Las Vegas, as well as portions of West Las Vegas and along Eastern Avenue.
Tax Increment is defined as the increased property taxes generated due to new development on a site. The TIF pro-gram uses tax money from the difference in the originally as-sessed property value and the new, enhanced property value to pay for eligible qualified expenditures. Up to 41 percent
Parks and recreational facilities

Economic Elem;Plans-MPlan;indd;rs09/02/09page 22
An
aly
sis
of the Tax Increment can be rebated annually to a property developer for eligible qualified expenditures to a construction project. Eligible expenditures may include constructing streets, curbs, gutters, water lines, storm drainage facilities, traffic signals, paving, sidewalks, flood control improvements, utilities, other infrastructure costs and more. While the term for TIF re-bate assistance is negotiable, the rebate cannot extend past the life of the agency or more than 20 years. The RDA’s maturity date, required by Nevada state law, is in the year 2031.
VISUAL IMPROVEMENT PROGRAM (VIP)
The VIP was established to encourage the rehabilitation of Downtown Las Vegas’ commercial, industrial and mixed-use properties, which can enhance the physical appearance of the area and improve the overall economic viability of the City’s downtown core. These goals and objectives of rehabilitation can be accomplished by encouraging commercial, industrial and mixed-use property owners along with long-term tenants to reinvest in and renovate their properties. The VIP is intend-ed to improve the aesthetic nature of properties and to assist in bringing them up to current building and property code standards. In addition, the program intends to act as a catalyst for observers within the community to consider rehabilitation of their own properties with or without participation in the VIP.
To ensure that the city of Las Vegas Redevelopment Agency’s investment in the project is maximized, the appli-cant is required to provide a 100% matching contribution to the granted funds. All qualified exterior improvements must be pre-approved and must be visible from the public right-of-way. Qualified exterior improvements that will be considered include:
• Painting
• Doorways
• Signage
• Awnings
• Cleaning
• Lighting
• Landscaping
• Parking Lots
• Tuck Pointing
• Facade Repair
• Window Repair
• Window Tinting
Commercial VIP participants located within the RDA may qualify for a maximum of $50,000. Entertainment VIP

Economic Elem;Plans-MPlan;indd;rs09/02/09 page 23
An
aly
sis
participants located within the Fremont East District may qualify for between $75,000 and $95,000. Since the inception of the VIP program in 2005, Commercial and Entertainment projects have been approved for a total $1,420,619 and $322,500 respectively.
SPECIAL IMPROVEMENT DISTRICTS (SID)
A SID is a device whereby the City acts as the agent for property owners to construct streets, sidewalks, curbs and gutters, sewers, streetlights, and other local improvements. It is the only mechanism the law provides for having public im-provements made in an area when 1) the property owners in the area desire the improvement, but some or all of them can-not pay in cash, or 2) when the majority of property owners in the area want an improvement and the minority does not want to pay its fair share. The basic purpose of a SID is to af-ford a property owner the opportunity of using their property as collateral for financing their prorated share of the proposed improvement and allows payment of this indebtedness at a low rate of interest which is based on the Bond Buyers Index of 20 Municipal Bonds most recent publication of rates. Property owners have the option of paying for the costs of the improve-ment within 30 days or may extend their payments over a period of 2 to 30 years.
BUSINESS IMPROVEMENT DISTRICT (BID)
A BID provides improvements and activities – such as side-walk cleaning, trash collection, graffiti removal, security, mar-keting and events – to a commercial district. Its purpose is to supplement, not replace, government services. BIDS are based on a benefit assessment model whereby property owners in a given area agree to assess themselves additional revenues that will be used for services in that area. These revenues are not managed by the city but by property owners themselves. A BID is formed by the private sector, which in most cities must show that a majority of those who will pay the assessment are in support, usually through filing a positive petition with the city council. The BID board of directors is made up of district property and business owners who set the policies and over-see operations. The board hires professional staff to manage the district on a daily basis. Currently, Fremont Street East is the lone BID in the City.

Economic Elem;Plans-MPlan;indd;rs09/02/09page 24
An
aly
sis
COMMUNITY DEVELOPMENT BLOCK GRANT (CDBG)
CDBG is a grant program administered by the U.S. Depart-ment of Housing and Urban Development on a formula basis for entitlement communities. This grant allots money to cities and counties for housing rehabilitation and community devel-opment, including public facilities and economic development.
Table 12. – Community Development Block Grant Allocations
2008 2007 2006 2005 2004 2003
Child Care $ 191,548 $ 224,443 $ 223,715 $ 251,275 $ 196,882 $ 160,400
Life Skills $ 131,548 $ 131,555 $ 130,972 $ 153,020 $ 171,660 $ 128,380
Social Services $ 197,324 $ 164,443 $ 163,715 $ 191,275 $ 214,575 $ 160,475
Youth/Alternative Education $ 197,322 $ 197,332 $ 196,895 $ 229,530 $ 257,490 $ 192,645
Construction $ 238,900 $ 558,000 $ 649,933 $ 962,659 $ 879,163 $ 966,090
CDBG Tenant Based Rental Assistance
$ 42,566 $ 70,000 $ 70,000 $ 70,000 $ – $ –
Single Family Rehabilitation $ 200,000 $ 200,000 $ 200,000 $ 400,000 $ – $ –
East Las Vegas Community Center Bond Payment
$ 1,044,731 $1,044,606 $ 1,047,356 $ 1,048,107 $ 1,046,857 $ 1,028,232
Stupak Community Center Bond Payment
$ 1,545,175 $ – $ – $ – $ – $ –
CLV Future CDBG Construction Projects
$ 265,863 $ 1,611,077 $ 1,516,394 $ 1,500,000 $ 530,000 $ 467,802
CDBG Administration & Fair Housing (20% Max)
$ 1,013,744 $1,050,364 $ 1,050,364 $ 1,161,466 $ 1,224,400 $ 823,976
CDBG Public Service Future Projects
$ – $ – $ 2,476 $ – $ 77,693 $ –
Emerald Breeze Apartments $ 1,333,280 $ –
Affordable Housing Implemen-tation, Lead Based Paint, & Housing Quality Inspections
$ – $ – $ – $ – $ 200,000 $ 200,000
Housing Rehabilitation: Mobile Homes & Emergency Repairs
$ – $ – $ – $ – $ 150,000 $ 100,000
Total $5,068,721 $5,251,820 $5,251,820 $5,967,332 $6,282,000 $4,228,000

Economic Elem;Plans-MPlan;indd;rs09/02/09 page 25
An
aly
sis
The city of Las Vegas is an entitlement community grantee which utilizes its Community Development Block Grant (CDBG) funding to develop viable communities by providing decent housing, a suitable living environment, and opportunities to expand economic opportunities, principally for low- and moderate-income persons. HUD awards grants to entitlement community grantees to carry out a wide range of community development activities directed toward revitalizing neighbor-hoods, economic development, and providing improved com-munity facilities and services.
CENTENNIAL HISTORY GRANT
The Centennial History Grant program was established in 2005 as part of the celebration of the 100 anniversary of the founding of the city of Las Vegas. Grant monies come from the sale of a specialized license plate, featuring the famous “Welcome to Fabulous Las Vegas” sign designed by Betty Wil-lis in 1959. The plates were designed and prepared by the Nevada Department of Motor Vehicles, in cooperation with the Nevada Department of Cultural Affairs. During the Centennial year, these funds helped pay for public events that celebrated the history of Las Vegas.
The grant program is administered by the city of Las Vegas Commission for the Las Vegas Centennial. Per NRS 482.37903, grant projects much “relate to the commemora-tion of the history of the City of Las Vegas, including, without limitation, historical markers, tours of historic sites and improve-ments to or restoration of historic buildings or structures.” Projects may include: rehabilitation of historic sites, structures and archeological resources, cultural heritage and tourism, oral history, historic survey, documentation, museums and archives, and education. The rehabilitation of the historic downtown U.S. Post Office and Courthouse, La Concha Motel lobby, Floyd Lamb Park at Tule Springs, and Westside School have all re-ceived funding from the Centennial History Grant program.

Economic Elem;Plans-MPlan;indd;rs09/02/09page 26
An
aly
sis
ISSUES
The major issue with CIP projects for the City is the con-tinued ability to fund them adequately. With the decrease of available funds from sources based upon activity or variable tax rates, alternative sources such as an increase in fees for ser-vices, increased tax rates, federal grants, or issuance of bonds must be considered. The following are issues pertinent to the City’s ability to carry out the Five-Year Capital Improvement Plan Projects:
• Future revenue – Sources based on construction activity and population growth have slowed and will continue to be slow for the short-term to mid-term.
• Fees – Fallout from the slowing construction is less avail-able fee based revenue. Fees may need to be increased and/or assessed to a broader range of services.
• Taxes – Decrease in assessed valuation of property means less property tax revenue generated. Decreases in retail sales and gasoline consumption mean less tax revenue from these sources as well.
• Prioritization – Revenue shortages may require a reas-sessment of CIP project priorities. Projects that do not maintain public welfare and/or provide essential services may need to be reprioritized.
• Bonds – Revenue shortages and limitations on taxes may require the City to issue bonds to fund CIP projects.
• Debt Limitation – The City has a debt limitation of 20% of assessed valuation with current debt at 1.3% of as-sessed valuation. Assessed valuation will decline, pos-sibly sharply, causing the debt ratio to increase without incurring any additional obligations. However, even if assessed valuation were reduced by 50%, the current debt would only increase to 2.6%.
• Fund Balance – As other revenue sources decline the Fund Balance is used increasingly and reduced, putting the future status of works in progress in jeopardy.

Economic Elem;Plans-MPlan;indd;rs09/02/09 page 27
Imp
lem
en
tati
on
IMPLEMENTATION
RECOMMENDATIONS
Recommendation 1: Utilize alternative funding for future CIP projects.
• Consider issuing any and all available bonds to finance future CIP projects. Bonds may assure future revenue availability for projects in years four and five of the CIP and provide financial stability throughout the duration of the Five Year CIP.
• Utilize restricted funding such as CDBG and RDA in pub-lic improvements to the maximum extent possible so as to implement improvements, increase property values and encourage private investment.
Recommendation 2: Evaluate the CIP on an annual basis.
• Assure projects that maintain public welfare and/or es-sential services, such as police & fire services and infra-structure such as roadways, flood control and sanitary sewer systems are given the highest priority and ad-equately funded.
• Ensure all projects funded are already adopted as part of Master Plan elements, corridor plans, community or special area plans.
Recommendation 3: Evaluate existing fee structure for fees assessed to services.
• Examine fees charged to determine if they adequately cover costs of services.
• Examine fees from other government agencies on an annual basis for applicability.
• Evaluate possibility of assigning fees to a broader range of services.
• Examine types of services where fees are applied from other government agencies.
• Audit existing services to determine if applying fees would be appropriate to cover labor and material costs.
Recommendation 4: Continue to develop public art and activity nodes.
• Seek public/private “sponsorships” for funding public art and activity nodes.

Economic Elem;Plans-MPlan;indd;rs09/02/09page 28
Imp
lem
en
tati
on
Recommendation 5: Continue to add parks and open space to City inventory as prioritized in the Parks Element.
• Seek partnerships with developers and encourage them to donate land that the City can develop into parks, trails and open space, particularly in developing areas.
• Explore options to provide incentives to developers for including and developing open space in their residential projects.

Economic Elem;Plans-MPlan;indd;rs09/02/09 page 29
Ap
pe
nd
ix
APPENDIX A: PUBLIC PARTICIPATION
The Planning and Development Department facilitated the following neighborhood meetings to present the Economic Element and to receive public input:
Monday, June 15, 2009 6:30 p.m. Mirabelli Community Center
6200 Hargrove Avenue, Las Vegas, Nevada 89107
Tuesday, June 16, 2009 6:30 p.m. Centennial Hills Community Center
6601 North Buffalo Drive, Las Vegas, NV 89131
Wednesday, June 17, 2009 6:30 p.m. Rafael Rivera Community Center
2900 Stewart Avenue, Las Vegas, NV 89101
Presentation of the draft Economic Element to thePlanning Commission was made on July 9, 2009.
Presentation of the draft Economic Element was made to the City Council on August 5, 2009.
The City Council adopted the element onSeptember 2, 2009.

Economic Elem;Plans-MPlan;indd;rs09/02/09page 30
Ex
isti
ng
Co
nd
itio
ns
Back of this page intentionally blank
Ap
pe
nd
ix
Economic Elem;Plans-MPlan;indd;rs09/02/09 page 31
I 15
US 95
SAHARA AVSR 159
LAS VEGAS
BLVDCRAIG RD
CHARLESTON BLVD
FLAMINGO RD
CHEYENNE AV
ANN RD
WASHINGTON AV
KYLE CANYONRD
RANCHO
DR
LAKE MEAD BLVD
NEL
LIS
BLV
D
LAM
BB
LVD
DESERT INN RD
RAI
NB
OW
BLV
D
JON
ES
BLV
D
PEC
OS
RD
BUFF
ALO
DR
EAST
ERN
AV
MAR
TIN
LK
ING
BLV
D
REDROCK
CANYON
5TH
ST
ELKHORN RD
SUMMERLIN PKWY
HU
ALA
PAI
WY
CO
RP
LIM
IT
CENTENNIAL PKWY
DU
RA
NG
OD
R
BOULDER
HWY
FREMONT
ST
MAR
YLAN
DP
KWY
DEC
ATU
RB
LVD
PAR
AD
ISE
RD
TOW
NCENTER
DR
ALLE
NLA
JEN
SE
NST
RIO
VIS
TAS
T
SLO
AN
LA
HO
LLY
WO
OD
BLV
D
CAMIN
OELD
ORAD
O
ANA
SAZ
ID
R
BELT
WAY
WEST LE
G
MC
LEO
DD
R
I 15
BUFFA
LOD
R
JON
ES
BLV
D
LAKE MEADBLVD
DEC
ATU
RB
LVD
US95
DEC
ATU
RB
LVD
ECONOMIC ELEMENT - VACANT LAND
C i t y o f L a s V e g a sVacant Land within the City
City of Las Vegas
Date of data: Januar y 14, 2009
GISmaps are normally producedonly to meet the needs of the City.
Due to conti nuous developmentactiv itythism ap is for reference only.
Geographic Information SystemPlanning &Development Dept.
702-229-6301
T:/advplan/pro jects /projectsg is/economic developm ent/vacantland.mxd
Ap
pe
nd
ix
page 32 Economic Elem;Plans-MPlan;indd;rs09/02/09
I 15
US 95
SAHARA AVSR 159
LAS VEGAS
BLVDCRAIG RD
CHARLESTON BLVD
FLAMINGO RD
CHEYENNE AV
ANN RD
WASHINGTON AV
KYLE CANYONRD
RANCHO
DR
LAKE MEAD BLVD
NEL
LIS
BLV
D
LAM
BB
LVD
DESERT INN RD
RAI
NB
OW
BLV
D
JON
ES
BLV
D
PEC
OS
RD
BUFF
ALO
DR
EAST
ERN
AV
MAR
TIN
LK
ING
BLV
D
REDROCK
CANYON
5TH
ST
ELKHORN RD
SUMMERLIN PKWY
HU
ALA
PAI
WY
CO
RP
LIM
IT
CENTENNIAL PKWY
DU
RA
NG
OD
R
BOULDER
HWY
FREMONT
ST
MAR
YLAN
DP
KWY
DEC
ATU
RB
LVD
PAR
AD
ISE
RD
TOW
NCENTER
DR
ALLE
NLA
JEN
SE
NST
RIO
VIS
TAS
T
SLO
AN
LA
HO
LLY
WO
OD
BLV
D
CAMIN
OELD
ORAD
O
ANA
SAZ
ID
R
BELT
WAY
WEST LE
G
MC
LEO
DD
R
I 15
BUFFA
LOD
R
JON
ES
BLV
D
LAKE MEADBLVD
DEC
ATU
RB
LVD
US95
DEC
ATU
RB
LVD
ECONOMIC ELEMENT - RESIDENTIAL CONSTRUCTION 1983 and EarlierC i t y o f L a s V e g a s
1983 and Earlier
1984 to Present
City of Las Vegas
Date of data: Januar y 14, 2009
GISmaps are normally producedonly to meet the needs of the City.
Due to conti nuous developmentactiv itythism ap is for reference only.
Geographic Information SystemPlanning &Development Dept.
702-229-6301
T:/advplan/pro jects /projectsg is/economic developm ent/residentialconst1983ToPresent.mxd

Ap
pe
nd
ix
Economic Elem;Plans-MPlan;indd;rs09/02/09 page 33
I 15
US 95
SAHARA AVSR 159
LAS VEGAS
BLVDCRAIG RD
CHARLESTON BLVD
FLAMINGO RD
CHEYENNE AV
ANN RD
WASHINGTON AV
KYLE CANYONRD
RANCHO
DR
LAKE MEAD BLVD
NEL
LIS
BLV
D
LAM
BB
LVD
DESERT INN RD
RAI
NB
OW
BLV
D
JON
ES
BLV
D
PEC
OS
RD
BUFF
ALO
DR
EAST
ERN
AV
MAR
TIN
LK
ING
BLV
D
REDROCK
CANYON
5TH
ST
ELKHORN RD
SUMMERLIN PKWY
HU
ALA
PAI
WY
CO
RP
LIM
IT
CENTENNIAL PKWY
DU
RA
NG
OD
R
BOULDER
HWY
FREMONT
ST
MAR
YLAN
DP
KWY
DEC
ATU
RB
LVD
PAR
AD
ISE
RD
TOW
NCENTER
DR
ALLE
NLA
JEN
SE
NST
RIO
VIS
TAS
T
SLO
AN
LA
HO
LLY
WO
OD
BLV
D
CAMIN
OELD
ORAD
O
ANA
SAZ
ID
R
BELT
WAY
WEST LE
G
MC
LEO
DD
R
I 15
BUFFA
LOD
R
JON
ES
BLV
D
LAKE MEADBLVD
DEC
ATU
RB
LVD
US95
DEC
ATU
RB
LVD
ECONOMIC ELEMENT - NON-RESIDENTIAL CONSTRUCTION 1983 and EarlierC i t y o f L a s V e g a s
1983 and Earlier
1984 to Present
City of Las Vegas
Date of data: Januar y 14, 2009
GISmaps are normally producedonly to meet the needs of the City.
Due to conti nuous developmentactiv itythism ap is for reference only.
Geographic Information SystemPlanning &Development Dept.
702-229-6301
T:/advplan/pro jects /projectsg is/economic developm ent/residentialconst1983ToPresent.mxd

Ap
pe
nd
ix
page 34 Economic Elem;Plans-MPlan;indd;rs09/02/09
I 15
US 95
SAHARA AVSR 159
LAS VEGAS
BLVDCRAIG RD
CHARLESTON BLVD
FLAMINGO RD
CHEYENNE AV
ANN RD
WASHINGTON AV
KYLE CANYONRD
RANCHO
DR
LAKE MEAD BLVD
NEL
LIS
BLV
D
LAM
BB
LVD
DESERT INN RD
RAI
NB
OW
BLV
D
JON
ES
BLV
D
PEC
OS
RD
BUFF
ALO
DR
EAST
ERN
AV
MAR
TIN
LK
ING
BLV
D
REDROCK
CANYON
5TH
ST
ELKHORN RD
SUMMERLIN PKWY
HU
ALA
PAI
WY
CO
RP
LIM
IT
CENTENNIAL PKWY
DU
RA
NG
OD
R
BOULDER
HWY
FREMONT
ST
MAR
YLAN
DP
KWY
DEC
ATU
RB
LVD
PAR
AD
ISE
RD
TOW
NCENTER
DR
ALLE
NLA
JEN
SE
NST
RIO
VIS
TAS
T
SLO
AN
LA
HO
LLY
WO
OD
BLV
D
CAMIN
OELD
ORAD
O
ANA
SAZ
ID
R
BELT
WAY
WEST LE
G
MC
LEO
DD
R
I 15
BUFFA
LOD
R
JON
ES
BLV
D
LAKE MEADBLVD
DEC
ATU
RB
LVD
US95
DEC
ATU
RB
LVD
ECONOMIC ELEMENT - RESIDENTIAL CONSTRUCTION 1998 TO PRESENTC i t y o f L a s V e g a s
Date of data: Januar y 14, 2009
GISmaps are normally producedonly to meet the needs of the City.
Due to conti nuous developmentactiv itythism ap is for reference only.
Geographic Information SystemPlanning &Development Dept.
702-229-6301
T:/advplan/pro jects /projectsg is/economic developm ent/residentialConst1998toPresent.mxd
1998 to Present
City of Las Vegas
1997 and Earlier
Ap
pe
nd
ix
Economic Elem;Plans-MPlan;indd;rs09/02/09 page 35
I 15
US 95
SAHARA AVSR 159
LAS VEGAS
BLVDCRAIG RD
CHARLESTON BLVD
FLAMINGO RD
CHEYENNE AV
ANN RD
WASHINGTON AV
KYLE CANYONRD
RANCHO
DR
LAKE MEAD BLVD
NEL
LIS
BLV
D
LAM
BB
LVD
DESERT INN RD
RAI
NB
OW
BLV
D
JON
ES
BLV
D
PEC
OS
RD
BUFF
ALO
DR
EAST
ERN
AV
MAR
TIN
LK
ING
BLV
D
REDROCK
CANYON
5TH
ST
ELKHORN RD
SUMMERLIN PKWY
HU
ALA
PAI
WY
CO
RP
LIM
IT
CENTENNIAL PKWY
DU
RA
NG
OD
R
BOULDER
HWY
FREMONT
ST
MAR
YLAN
DP
KWY
DEC
ATU
RB
LVD
PAR
AD
ISE
RD
TOW
NCENTER
DR
ALLE
NLA
JEN
SE
NST
RIO
VIS
TAS
T
SLO
AN
LA
HO
LLY
WO
OD
BLV
D
CAMIN
OELD
ORAD
O
ANA
SAZ
ID
R
BELT
WAY
WEST LE
G
MC
LEO
DD
R
I 15
BUFFA
LOD
R
JON
ES
BLV
D
LAKE MEADBLVD
DEC
ATU
RB
LVD
US95
DEC
ATU
RB
LVD
ECONOMIC DEVELOPMENT - NON-RESIDENTIAL CONSTRUCTION 1998 TO PRESENT
Date of data: Januar y 14, 2009
GISmaps are normally producedonly to meet the needs of the City.
Due to conti nuous developmentactiv itythism ap is for reference only.
Geographic Information SystemPlanning &Development Dept.
702-229-6301
T:/advplan/pro jects /projectsg is/economic developm ent/non- residentia lconst1998ToP resent.mxd
C i t y o f L a s V e g a s
City of Las Vegas
1998 to Present
1997 and Earlier
Ap
pe
nd
ix
page 36 Economic Elem;Plans-MPlan;indd;rs09/02/09
I 15
US 95
SAHARA AVSR 159
LAS VEGAS
BLVDCRAIG RD
CHARLESTON BLVD
FLAMINGO RD
CHEYENNE AV
ANN RD
WASHINGTON AV
KYLE CANYONRD
RANCHO
DR
LAKE MEAD BLVD
NEL
LIS
BLV
D
LAM
BB
LVD
DESERT INN RD
RAI
NB
OW
BLV
D
JON
ES
BLV
D
PEC
OS
RD
BUFF
ALO
DR
EAST
ERN
AV
MAR
TIN
LK
ING
BLV
D
REDROCK
CANYON
5TH
ST
ELKHORN RD
SUMMERLIN PKWY
HU
ALA
PAI
WY
CO
RP
LIM
IT
CENTENNIAL PKWY
DU
RA
NG
OD
R
BOULDER
HWY
FREMONT
ST
MAR
YLAN
DP
KWY
DEC
ATU
RB
LVD
PAR
AD
ISE
RD
TOW
NCENTER
DR
ALLE
NLA
JEN
SE
NST
RIO
VIS
TAS
T
SLO
AN
LA
HO
LLY
WO
OD
BLV
D
CAMIN
OELD
ORAD
O
ANA
SAZ
ID
R
BELT
WAY
WEST LE
G
MC
LEO
DD
R
I 15
BUFFA
LOD
R
JON
ES
BLV
D
LAKE MEADBLVD
DEC
ATU
RB
LVD
US95
DEC
ATU
RB
LVD
ECONOMIC ELEMENT - ANNEXATIONS
C i t y o f L a s V e g a s
Date of data: ANX-30397 January 21, 2009
GISmaps are normally producedonly to meet the needs of the City.
Due to conti nuous developmentactiv itythism ap is for reference only.
Geographic Information SystemPlanning &Development Dept.
702-229-6301
T:/advplan/pro jects /projectsg is/economic developm ent/Annexation.mxd
Annexations, 1999 toPresent
City of Las Vegas

Ap
pe
nd
ix
Economic Elem;Plans-MPlan;indd;rs09/02/09 page 37
I15
US95
SR 147
SR 160
I 215
LAS VEGAS
BLVD
SR41
NEVSTATE
LINE
SR 159
US 93
SAHARA AV
CRAIG RD
CHARLESTON BLVD
TROPICANA AV
EAS
TE
RN
AV
FLAMI NGO RD
CHEYENNE AV
KYL E CANYONRD
ANN RD
BOULDER
HWY
BLUE DIAMONDRD
WASHINGTON AV
NE
LLIS
BLV
D
RA
INB
OW
BLV
D
BOU
LDERBEACH
RANCHO
DRZZ
RO
AD
LAKE MEAD BLVD
LAKE MEADDR
DE
CA
TUR
BLV
D
LAM
BB
LVD
DESERT INN RD
SUNSET RD
PABCO
RD
DU
RA
NG
OD
R
PEC
OS
RD
ST ROSE
PKWY
PEBBL E RD
CLARK COUNTY 215
HU
ALA
PA
IW
Y
5TH
ST
WARM SPRINGS RD
EL KHORN RD
VALL
EY
VIE
WB
LVD
STE
PH
AN
IES
T
RA
CE
TR
AC
KR
D
SUMMERLIN PKWY
GR
EE
NV
ALL
EY
PK
WY
CO
RP
LIM
IT
CENTENNIAL PKW Y
MA
RY
LAN
DP
KW
Y
GR
EE
NW
AYR
D
FREM ONT
ST
NEVADA HWY
SI LVERADO RANCH BLVD
AIR
PO
RT
CO
NN
NRUSSELL RD
ALLE
NL
A
MO
UN
TAIN
VIS
TAS
T
JEN
SE
NS
T
BUFF
ALO
DR
SLO
AN
LA
HO
LLY
WO
OD
BLV
D
FOO
THIL
LSD
R
WINDM ILL LA
JON
ES
BLV
DJO
NE
SB
LVD
I 215
LAKE MEAD BLVD
I 15
US93
US95
DESERT INN RD
US
95
LAS VEGAS
HENDERSON
NORTH LAS VEGAS
BOULDER CITY
CC Enterprise
CC ParadiseCC Spring Valley
CC Whitney
CC Sunrise Manor
CC Winchester
ECONOMIC ELEMENT - LAS VEGAS VALLEY POPULATION DENSITY PER SQUARE MILE 2008C i t y o f L a s V e g a s
Date of data: Ju ly 1, 2008 P opulation
GISmaps are normally producedonly to meet the needs of the City.
Due to conti nuous developmentactiv itythism ap is for reference only.
Geographic Information SystemPlanning &Development Dept.
702-229-6301
T:/advplan/pro jects /projectsg is/economic developm ent/Population.m xd
CC Townships
Cities
Less than 1,000
1,000 - 1,999
2,000 - 3,499
3,500 - 4,999
5,000 - 5,999
6,000 - 6,999
7,000 - 7,999
8,000 - 9,499
9,500 - 10,500
10,500 - 11,781

Ap
pe
nd
ix
page 38 Economic Elem;Plans-MPlan;indd;rs09/02/09
LAS VEGAS
HENDERSON
NORTH LAS VEGAS
BOULDER CITY
I15
US95
SR 147
SR 160
I 215
LAS VEGAS
BLVD
SR41
NEVSTATE
LINE
SR 159
US 93
SAHARA AV
CRAIG RD
CHARLESTON BLVD
TROPICANA AV
EAS
TE
RN
AV
FLAMI NGO RD
CHEYENNE AV
KYL E CANYONRD
ANN RD
BOULDER
HWY
BLUE DIAMONDRD
WASHINGTON AV
NE
LLIS
BLV
D
RA
INB
OW
BLV
D
BOU
LDERBEACH
RANCHO
DR
ZZR
OA
D
LAKE MEAD BLVD
LAKE MEADDR
DE
CA
TUR
BLV
D
LAM
BB
LVD
DESERT INN RD
SUNSET RD
PABCO
RD
PEC
OS
RD
ST ROSE
PKWY
PEBBL E RD
CLARK COUNTY 215
HU
ALA
PA
IW
Y
5TH
ST
WARM SPRINGS RD
EL KHORN RD
VALL
EY
VIE
WB
LVD
STE
PH
AN
IES
T
RA
CE
TR
AC
KR
D
SUMMERLIN PKWY
GR
EE
NV
ALL
EY
PK
WY
CO
RP
LIM
IT
CENTENNIAL PKW Y
MA
RY
LAN
DP
KW
Y
GR
EE
NW
AYR
D
FREM ONT
ST
SI LVERADO RANCH BLVD
AIR
PO
RT
CO
NN
NRUSSELL RD
ALLE
NL
A
MO
UN
TAIN
VIS
TAS
T
BUFF
ALO
DR
SLO
AN
LA
HO
LLY
WO
OD
BLV
D
FOO
THIL
LSD
R
WINDM ILL LA
JON
ES
BLV
DJO
NE
SB
LVD
US
95
LAKE MEAD BLVD
I 215
I 15
US93
US95
DESERT INN RD
CC Enterprise
CC ParadiseCC Spring Valley
CC Whitney
CC Sunrise Manor
CC Winchester
ECONOMIC ELEMENT - BLM Disposal BoundaryC i t y o f L a s V e g a s
Date of data: September 29, 2003
GISmaps are normally producedonly to meet the needs of the City.
Due to conti nuous developmentactiv itythism ap is for reference only.
Geographic Information SystemPlanning &Development Dept.
702-229-6301
T:/advplan/pro jects /projectsg is/economic developm ent/BLMDisposalBoundary.mxd
Cities
2003 Disposal Boundary
CC Townships
Disposal BoundaryBefore 2003
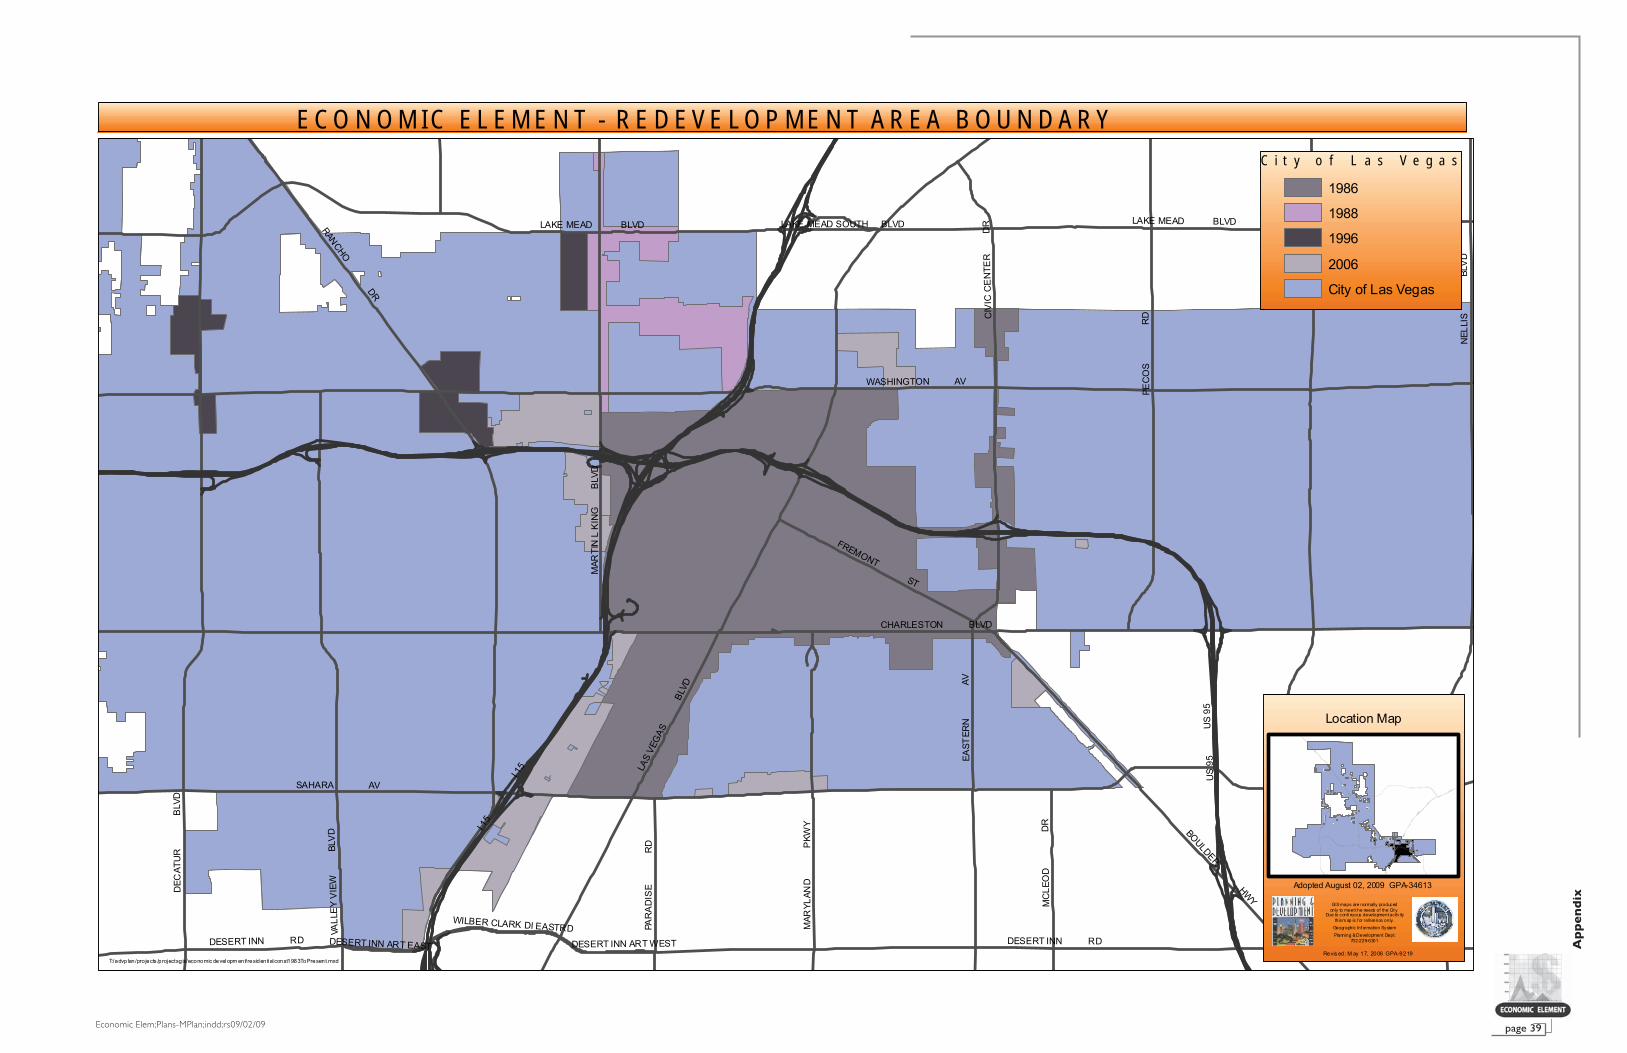
Ap
pe
nd
ix
Economic Elem;Plans-MPlan;indd;rs09/02/09 page 39
I 15
US
95
SAHARA AV
WASHINGTON AV
CHARLESTON BLVDLA
SVE
GAS
BLVD
LAM
BB
LVD
RANCHO
DR
DEC
ATU
RB
LVD
EAST
ERN
AV
LAKE MEAD BLVD
DESERT INN RD
PEC
OS
RD
VALL
EY
VIE
WBL
VD
FREMONT
ST
NEL
LIS
BLV
D
MAR
TIN
LK
ING
BLV
D
MAR
YLAN
DP
KWY
BOULDER
HWY
PAR
AD
ISE
RD
MC
LEO
DD
R
CIV
ICC
EN
TER
DR
WILBER CLARK DI EASTRD
DESERT INN ART WESTDESERT INN ART EAST
LAKE MEAD SOUTH BLVD
I 15
DESERT INN RDDESERT INN RD
US
95
LAKE MEAD BLVD
NEL
LIS
BLV
D
ECONOMIC ELEMENT - REDEVELOPMENT AREA BOUNDARYC i t y o f L a s V e g a s
1986
1988
1996
2006
City of Las Vegas
Revis ed: M ay 17, 2006 GPA-9219
GISmaps are normally producedonly to meet the needs of the City.
Due to conti nuous developmentactiv itythism ap is for reference only.
Geographic Information SystemPlanning &Development Dept.
702-229-6301
T:/advplan/pro jects /projectsg is/economic developm ent/residentialconst1983ToPresent.mxd
Location Map
Adopted August 02, 2009 GPA-34613

Ap
pe
nd
ix
page 40 Economic Elem;Plans-MPlan;indd;rs09/02/09
I 15
US95
SAHARA AVSR 159
LAS VEGAS
BLVD
CRAIG RD
CHARLESTON B LVD
FLAMINGO RD
CHEYENNE AV
ANN RD
WASHINGTON AV
KYLE CANY ONRD
RANCH
O
DR
LAKE ME AD BLV D
NE
LLI
SB
LVD
LAM
BB
LVD
DESERT INN RD
RA
INB
OW
BLV
D
JON
ES
BLV
D
PE
CO
SR
D
BU
FFA
LOD
R
EA
ST
ER
NA
V
MA
RT
INL
KIN
GB
LVD
REDROCK
CANYON
5TH
ST
VAL
LEY
VIE
WB
LVD
ELKHORN RD
RA
MP
AR
TB
LVD
SUMM ERLIN PKWY
HU
ALA
PA
IW
Y
CO
RP
LIM
IT
CENTE NNIA L PKWY
DU
RA
NG
OD
RS
IMM
ON
SS
T
FOR
TA
PA
CH
ER
D
BOULDER
HWY
FREMONT
ST
MA
RY
LA
ND
PK
WY
DE
CAT
UR
BLV
D
PAR
AD
ISE
RD
TOW
NCENTER
DR
ALL
EN
LA
JEN
SE
NS
T
CA
MIN
OA
LN
OR
TE
TRE
ELI
NE
DR
RIO
VIS
TA
ST
SLO
AN
LA
HO
LLY
WO
OD
BLV
D
SUN CITYBLV D
ANAS
AZI
DR
BELTWAY
WEST LEG
MC
LE
OD
DR
HILL
SC
ENTE
RD
R
I 15
WASHINGTON AV
DE
CAT
UR
BLV
D
HO
LLY
WO
OD
BLV
D
JON
ES
BLV
D
BU
FFA
LOD
R
DESERT INN RD
US95
LAKE ME AD BLV D
DE
CAT
UR
BLV
D
RA
INB
OW
BLV
D
DU
RA
NG
OD
R
BU
FFA
LOD
R
DESERT INN RD
FOR
TA
PA
CH
ER
D
ECONOMIC ELEMENT - CAPITAL IMPROVEMENT PROJECTS
C i t y o f L a s V e g a s
Date of data: Januar y 21, 2009
GISmaps are normally producedonly to meet the needs of the City.
Due to conti nuous developmentactiv itythism ap is for reference only.
Geographic Information SystemPlanning &Development Dept.
702-229-6301
T:/advplan/pro jects /projectsg is/economic developm ent/CapitalImprov ementPro jec ts.mx d
Source: City Of Las Vegas Publ ic Works Departm ent
City of Las Vegas
CIP Completed
CIP Construction
CIP Design
CIP Pre-design
CIP Starting soon

Ap
pe
nd
ix
Economic Elem;Plans-MPlan;indd;rs09/02/09 page 41
kj
kj
kj
kj
kj
kj
kjkj
kjkj
kj
kj
ALTA15SAHARA
95
VEGAS
CHARLESTON
ANN
RANCHO
H
WASHINGTON
BUFF
ALO
DEC
ATU
R
RAI
NBO
W
BONANZA
GOWAN
LAKE MEAD
TEN
AYA
6TH
SUMMERLIN I
CRAIG
STEWART
BRAD
LEY
OAKEY
MAI
N
ALEXANDER
CHEYENNE
RAM
PAR
T
OWENS
15TH
4TH
FARM
AZURE
JON
ES
HU
ALAP
AI
LAM
B
ELKHORN
MIC
HA
EL
RACEL
TOR
REY
PIN
ES
215
EAS
TER
N
NEL
LIS
BRU
CE
PEC
OS
10TH
HORSE
VALLEYV
IEW
14TH
ANAS
AZI
MO
JAV
E
MA
RTIN
LKI
NG
FREMONT
SHAU
MB
ER
MA
RYLA
ND
LAS
VEG
AS
ARVI
LLE
OSOBLANCA
28TH
17TH
VILLA RIDGE
SKY POINTE
SMOKE RANCH
WESTCLIFF
CIM
AR
RO
N
DEL REY
HARRIS
MA
RIO
N
CRES
TDAL
E
TOW
NC
EN
TER
SIRIUS
SAN
DH
ILL
SHAD
OW
GRAND TETON
GR
AND
CA
NYO
N
SUN CITY
TON
OPA
H
MA
RIN
ER
159
KYLE CANYON
HILLPOINTE
DEL WEBB
CANYON RUN
BONNEVILLE
PIO
NEE
R
LOG CABIN
CAREY
CIELO VISTA
13TH
DU
RAN
GO
5TH
LAKE NORTH
BUCKSKIN
BUR
NH
AM
ANTE
LOPE
3RD
TROPICAL
PALOMINO
LAKE SOUTH
BUTTON WILLOW
PENNWOOD
HIN
SON
PAVILION
CE
NTE
R
MESQUITE
INDU
STRI
AL
LA MADRE
23RD
MAV
ERIC
K
HAR
BOR
ISLA
ND
HAL
LSTO
NTHOMAS
WRYAN
LONE MOUNTAIN
HIL
LSC
ENTE
R
RIC
HFI
ELD
HAMMER
EDM
ON
DBALZAR
LEWIS
20TH
18TH
CENTENNIAL
9TH
SILVER
SIM
MO
NS
ASH
11TH
IRON MOUNTAIN
MARBLE
8TH
CORAL SHORES
DESERT INN
7TH
OSAGE
ALLE
N
ISOLA
CORBETT
POLAR
IS
GOLD
DREXEL
PEA
RLES
SEX
ARLIN
GTO
N
TRAILS END
ALPI
NE
RID
GE
CO
MM
ERC
EPA
RA
DIS
E
MC
LEO
D
LIN
DE
LL
SER
EN
E
IVY
TWIN
LAK
ES
CAM
ERO
N
GREENWAY
EDNA
WASHBURN
LOS
PR
ADO
SM
OH
AWK
VALLEY
REV
ER
E
RIL
EY
RAI
NBO
WGOWAN
I
WASHBURN
FARM
DU
RAN
GO
95
WASHBURN
TOR
REY
PIN
ES
LOG CABIN
15
TROPICAL
215
TEN
AYA
BUFF
ALO
ALEXANDER
OWENS
GRAND TETONGRAND TETON
TENAYA
215 BALZAR
JON
ES
CHARLESTON
OAKEY
LAKE MEAD
215
215
95
MAV
ERIC
K
MA
RIO
N
215
HORSE
215
RACEL
BRAD
LEY
BUCKSKIN
IRON MOUNTAIN
DEC
ATU
R
95
95
3RD
JON
ES
GR
AND
CA
NYO
N
RACEL
TOR
REY
PIN
ES
BALZAR
MIC
HA
EL
LONE MOUNTAIN
TOR
REY
PIN
ESCHEYENNE
FARM
23R
D
ANN
TEN
AYA
SKYPOINTE
RAI
NBO
W
LA MADRE
9TH
OAKEY
215
PIO
NEE
R
18TH
215
ELKHORN
95
215
CENTENNIAL
OSOBLANCA
215
CIM
AR
RO
N
TROPICAL
HU
ALAP
AI
HARRIS
SKY POINTE
CIM
AR
RO
N
DU
RAN
GO
215
JON
ES
95
215
SHAU
MB
ER
DEC
ATU
R
HU
ALAP
AI
FARM
T:/advplan/projects/projectsgis/economicdevelopment/SNPLMAProjects.mxd
LV29
LV11
LV32LV31LV14
LV21
LV07LV09LV12LV18
LV06
LV03
LV08LV13LV31
LV23
PV02
LV06ZZZ
LV14
LV28
LV28
LV14
kj
kj
kj
kj
kj
95
15
H
BONANZA
6TH
I
STEWART
MAI
N
SAHARA
WASHINGTON
OWENS
15TH
4TH
LAM
B
OAKEY
EAS
TER
N
NE
LLIS
BRU
CE
PEC
OS
10TH
14TH
MO
JAVE
FREMONT
LAS
VEG
AS
28TH
17TH
CHARLESTON
MAR
TIN
LKI
NG
HARRIS
MAR
ION
19TH
SAN
DH
ILL
SHA
DO
W
BONNEVILLE
13TH
ALTA
5TH
ADAMS
BUR
NH
AM
3RD
MAR
YLA
ND
UTAH
INDU
STR
IAL
23RD
GRAND CENTRAL
VEGAS
WALNUT
WYOMING
SPEN
CER
LEWIS
20TH
18TH
9TH
16TH
ASH
11TH
8TH
7TH
OSAGE
GOLD
PEA
RL
COM
MER
CE
PAR
ADIS
E
MC
LEO
D
ARLI
NG
TON
IVY G
ATE
WAY
PAIUTE
MESQUITE
CH
ER
RY
NE
WPO
RT
VALLEY
HILLS
IDE
JAD
E
RUSSELL
18TH
28TH
20TH
13TH
11TH
4TH
8TH
8TH
MAR
ION
18TH
23R
D
4TH
LEWIS
BRU
CE9T
H
23R
D
16TH
9TH
LEWIS
16TH
SAN
DH
ILL
16T H
14TH
16TH
8TH
10TH
VALLEY
8TH
16TH
WALNUT
7TH
HARRIS
OWENS
7TH
CHARLESTON
95
I
HARRIS
15
3RD
8TH
HARRIS
13TH
11TH
HARRIS
3RD
16TH
10TH
11TH
CC06
LV15
LV16LV30
LV22
LV19LV24
LV26
LV33
LV27
LV14
LV14
LV20
LV05
LV25
LV02
LV25
LV02
LV17
SNPLMA PROJECTSZZZ FLOYD LAMB PARK TRAIL AMENITIESCC06 PIONEER TRAILLV02 CEDAR TRAIL BRIDGELV03 BONANZA US 95 TRAILLV04 LONE MOUNTAIN TRAILLV05 LAS VEGAS WASH TRAILLV06 EQUESTRIAN PARKLV07 CENTENNIAL HILLS MULTI-USE TRAIL SEGMENTSLV08 LV SPRINGS PRESERVE TRAILSLV09 PREHISTORIC RIVERBED PRESERVATIONLV10 LONE MOUNTAIN TRAIL TRAILHEADLV11 LA MADRE MOUNTAIN TRAILHEADLV12 CENTENNIAL HILLS PARK TRAILLV13 LV SPRINGS PRESERVE TRAILS-TRAILS & DEVELOPMENTLV14 MULTI-USE TRANSPORTATION TRAILSLV15 CULTURAL CORRIDOR TRAILLV16 NEON BONEYARD PARKLV17 BOULDER PLAZA PARKLV18 CENTENNIAL HILLS PARK
LV19 SANDHILL/OWENS PARK ACQUISITIONLV20 LAS VEGAS WASH TRAIL - PH 2LV21 LONE MOUNTAIN TRAIL PH 2LV22 FREEDOM PARKLV23 LORENZI PARK RENOVATION W/ TRAILHEAD ADDITIONLV24 SANDHILL/OWENS PARK & TRAILHEADLV25 LAS VEGAS WASH TRAIL - PEDESTRIAN BRIDGELV26 SANDHILL/OWENS PARK & TRAILHEADLV27 JAYCEE PARK RENOVATIONLV28 LONE MOUNTAIN TRAIL - PEDESTRIAN BRIDGESLV29 I-215 BELTWAY TRAIL SEGMENTSLV30 CULTURAL CORRIDOR TRAIL - PEDESTRIAN BRIDGELV31 LV SPRINGS PRESERVE TRAILS-PH2&HIST PRESERVATIONLV32 DESERT NATURE PRESERVELV33 LAS VEGAS WASH TRAILHEAD BRIDGEPV01 LAS VEGAS WASH PARK PH 2PV02 DOOLITTLE PARK RENOVATIONPV03 VIAS VERDE LOOP TRAIL
LV10
PV03
C i t y o f L a s V e g a s
TRAIL PROJECTSROUND 3
ROUND 5
ROUND 6
ROUND 8
ROUND 9
Pre-Proposal Planning
PARK/TRAILHEAD PROJECTSROUND 3
ROUND 4
ROUIND 5
ROUND 6
ROUND 7
Pre-Proposal Planning
BRIDGE PROJECTSkj ROUND 3
kj ROUND 6
kj ROUND 8
Date of Last Round: Round 9 - September 23, 2008
GIS maps are normally producedonly to meet the needs of the City.
Due to continuous development activitythis map is for reference only.
Geographic Information SystemPlanning & Development Dept.
702-229-6301
Source: Public Works

Ap
pe
nd
ix
page 42 Economic Elem;Plans-MPlan;indd;rs09/02/09
I 15
US95
SAHARA AVSR 159
CRAIG RD
CHARLESTON B LVD
LAS VEGAS
BLVD
CHEYENNE AV
ANN RD
KYLE CANY ONRD
WASHINGTON AV
RANCH
O
DR
LAM
BB
LVD
NE
LLI
SB
LVD
DESERT INN RD
LAKE ME AD BLV D
JON
ES
BLV
D
RA
INB
OW
BLV
D
PE
CO
SR
D
BU
FFA
LOD
R
EA
ST
ER
NA
V
MA
RT
INL
KIN
GB
LVD
REDROCK
CANYON
5TH
ST
ELKHORN RD
VAL
LEY
VIE
WB
LVD
RA
MP
AR
TB
LVD
SUMM ERLIN PKWY
CO
RP
LIM
IT
CENTE NNIA L PKWY
HU
ALA
PA
IW
Y
DU
RA
NG
OD
R
SIM
MO
NS
ST
FREMONT
ST
FOR
TA
PA
CH
ER
D
BOULDER
HWY
MA
RY
LA
ND
PK
WY
DE
CAT
UR
BLV
D
TOW
NCENTER
DR
PAR
AD
ISE
RD
ALL
EN
LA
JEN
SE
NS
T
CA
MIN
OA
LN
OR
TE
TRE
ELI
NE
DR
RIO
VIS
TA
ST
SLO
AN
LA
HO
LLY
WO
OD
BLV
D
SUN CITYBLV D
ANAS
AZI
DR
BELTWAY
WEST LEG
MC
LE
OD
DR
HILL
SC
ENTE
RD
R
FLAMINGO RD
I 15
DE
CAT
UR
BLV
D
RA
INB
OW
BLV
D
BU
FFA
LOD
R
DU
RA
NG
OD
RWASHINGTON AV
LAKE ME AD BLV D
DESERT INN RD
FOR
TA
PA
CH
ER
D
JON
ES
BLV
D
DESERT INN RD
BU
FFA
LOD
R
US95
DE
CAT
UR
BLV
D
HO
LLY
WO
OD
BLV
D
404
707
808810
607
808
505
808809
1463
1487
1480
1503
1493
15061465
1469
1490
1450
1505
1501
1516
T:/advplan/pro jects /projectsg is/economic developm ent/Special Improv ementDistricts.mxd
1480
1493
GOW A N R D
GIL MO RE A VE
ALE XA N D ER R D
BUFFALO
DR
DURAN
GODR
LO NE MOU NT AIN R D
CIMARRO
NRDELCAPITAN
WY
FORT
APACH
ERD
RE D C O A CH A VE
HIC K AM AV E
CR A IG RD
PIONEE
RWY
RILEY
ST
CONOUG
HLN
DE LH I AV E
QUADRE
LST
ALCA
RRISONST
CAMPBE
LLRD
FLO R INE A VE
DRAINA
GECHANNEL
STA N G E A VE
VALA
DEZST
BUTLERST
PU BL IC F LO O D CH A NN E L
HE LEN A A VE
AH EY R D
MONT
ECRISTOWY
WE DL OC K LN
TOMSIKST
CLAYPE
AKDR
BEAC
ONPO
INTST
RA IN DR O P CA N YO N AV E
LO ST GO L D A V E
WHITEPLAINSDR
ALLIA
NCEST
COPPERCACTUS
DR
TIER R A S A NT A A V E
DESIGNER
WY
DE FIA NC E AV ECO N ST AN TIN O PL E A VE
NO R C O D R
DORRINGTO
NDR
CR EN S HA W WY
TIOGAWY
KEVINWY
DEER
FLAT
SST
BONITAVISTA
ST
CO R P L IM IT
TAH O E BA S IN D R
IND IG O SK Y AV E
FUNSTO
NWY
BLU E ISL AN D AV E
JULIANORD
JULIUSCT
LAS T P O INT A VE
WHITECA
STLEST
HIC K AM AV E
CO N ST AN TIN O PL E A VE
TOMSIKST
TIOGAWYCO
RPLIMIT
HIC K AM AV E
CO R P L IM IT
FLO R INE A VE
CORPLIMIT
VALA
DEZST
1506
1465
1469
1501
1516 95
9THST
BO N A NZ A R D
7THST
10TH
ST
BRUCE
ST
STE WA R T A VE
14TH
ST
6THST
FRE MO N T S T
MOJAVERD
4THST
15TH
ST
WA SH IN G TO N AV E
28TH
ST
CH A RL ES TO N BL VD
EASTERNAVE
MAINST
UPRR
LASVEG
ASBLV
D
19TH
ST
15
CE DA R A VE
MAR
YLA
NDPK
WY
8THST
CLA R K AV E
BR ID G ER A VECA R SO N AV E
JAN SE N AV E
16TH
ST M ES Q UIT E A VE
13TH
ST
3RDST
OG D E N A VE
1STST
21ST
ST
AST
30TH
ST
PO PL AR A VE
23RDST
ELM A V E
BON N EV ILLE AV E
GA R C ES AV E
HA R RIS A VE
LIN DE N A V E
WA LN UT AV E
GA S S A VE
MAR LIN A VE
CST
CASINOCEN
TERBL
VD
20TH
ST
18TH
ST
27TH
ST
KIR K AV E
17TH
ST
LEW IS A V E
11TH
ST
RY AN A VE
25TH
ST
WE ND EL L A VE
MAN
NINGST
EARL
ST
WILL O UG H B Y A VE
BU ILD ER S AV E
BE LL D R
SU NR IS E A VE
MCK
NIGHT
ST
12THST
CERV
ANT
ESST
DO R I A VE
RA MP S U S95 EA ST RN
22NDST
BR A DY A VE
HELD
RD
AS H A V E
ENCA
NTO
DR
LILLYLN
RA MPN U S 95 LV
BL VD
ALVIN
ST
GR A G SO N A VE
RU E1 3
JULIANST
THE R ES A A V E
BON A NZ A W Y
26TH
ST
VA LLE Y S T
PANIFLO
WST
EFFINGERST
WILS O N AV E
CO N TR A CT AV E
CO N ST AN TIN E AV E
MAL TA PL
ASTERLN
JOS H UA W Y
DELTAST
SYC A MOR E LN
95
RY AN A VE
3RDST
13TH
ST
11TH
ST
BR A DY A VE
12TH
ST
PO PL AR A VE
SU NR IS E A VE
21ST
ST
22NDST
BR A DY A VE
THE R ES A A V E
1STST
26TH
ST
ELM A V E
15
THERESAAVE
17TH
ST
LEW IS A V E
C
D
404
505
607
707
808
1450
1463
1465
1480
1487
1490
1493
1501
1503
1505
1506
1516
808809
808810
DistrictNumber
1480
1450
1505
JONESBLV
D
GOW A N R D
MICHAEL
WY
TORR
EYPINE
SDR
RANCH
ODRCH EY EN N E A V E
LAK E MEA D B LVD
SMOK E R A NC H R D
PEA K D R
MAD R E ME SA D R
JAY A VE
DECA
TURBLVD
BRONCO
ST
BR O O KS A VE
MAV
ERICKST
THOM
BLVD
LEONARD
LN
JEANN
EDR
RIC K Y R D
ALF RE D DR
RE ITE R A VE
SH EIL A A VE
EU G EN E A V E
CO R P L IM IT
BU C KS K IN A V E
STA C EY AV E
MIRAMARDR
MUS
TANGST
SA WY ER A VE
AU B O RN A VE
BA LZA R A VE
JAMESBILBRAYDR
DU N CA N DR
RO B ER TA LN
RIALT
ORD
LAN N IN G LN
BA R TLE TT A V E
BE VV IE D R
MAR E WY
CONCHITAST
TRI LOGYDR
YO U R A V E
SISKRD
SMITHST
APRICOTLN
HE AT HE R M IST LN
RA N CH E R A VE
DO N N IE A VE
JEA N AV E
CA R TIER A VE
ZIPCODEBDRY
ATW OOD AV E
VENICEDR
CORONA
DEL
MARDR
CLO U D S R E ST A V E
CA PR IN O A VE
CANTERDR
AN ZA LN
WINWOODST
RO S AL ITA AV E
ESP IN O SA A VE
MO SS MAN A VE
RAMRODST
CO N D OR A VE
ARLE
NEWY
SEA TT LE SLE W D R
CHER
TSEY
DR
DE AD W OOD R D
MEA D OW S LILLY A VEGENTILL
YLN
TERRYST
WILLOWBURY
DR
RE DB E RR Y ST
HA R TWOOD R DBU G LE WY
MAR R OW R D
PEA R TR EE R D
BIG P INE W Y
VIVACIR
WOODSDR
KIR K WOOD DR
LAKESID
EDR
CH LO E WY
BEES
ONCT
DU LC E A V E
TIER R A L N
MEN D OZ AC T
TAS SA R A WY
AU B O RN A VE
BRONCO
ST
RE ITE R A VE
DECA
TURBLVD
CORPLIMIT
CO R P L IM IT
EU G EN E A V E
BA
C
E1480
1450
D
ECity of Las Vegas
C i t y o f L a s V e g a sSpecial ImprovementDistricts
1450
ECONOMIC ELEMENT - SPECIAL IMPROVEMENT DISTRICTS
1487
215
ELK H O RN R D
JONESBLV
D
BRADL
EYRD
DE ER SP R ING S WY
DECA
TURBLVD
TORR
EYPINESDR
LEONAVE
THOM
BLVD
SEV ER A N CE LN
CO R P L IM IT
AN O D R
MELL O AV E
DO R R ELL LN
JEANE
TTEST
REBE
CCA
RD
WITT IG AV E
SISKRD
TUR K EY LN
RAINBO
WBLVD
BOYDLN
RO ME BL VD
PEGGO T TY A V E
CE NS U S TR A C T B DR Y
SO LA R AV E
UNICORN
ST
DO N A LD RD
MUS
TANGST
ABRUZ
ZIDR
CONVINTO
ST
COLL
INGSWORTH
ST
STLUC
IAST
RIO C A MUY A VE
CE NT EN N IAL PK WY
MO SS AG A TE DR
ZIONFAL
LSST
SILV
ERSPIRITST
WHITEHA
LLCIR
BR ID AL CA V E A VE
AFTER
NOONST
LARKMISTST
SAVA
NNA
HFA
LLSST
KO D A CT
TAR R A NT RA N CH R D
SOMERV
ELLRAN
CHST
PARA
DINGPO
KEY
ST
VIZZI CT
PR IST INE FA LLS A VE
FORZ
ACT
BARNE
YLN
HARLO
WST
RE D G A R NE T C T
CE NT EN N IAL PK WY
DO N A LD RD
DO R R ELL LN
LEONAVE
THOM
BLVD
RO ME BL VD
ROME BL VD
SO LA R AV ECE
NSUSTR
ACTBDR
YRA
INBO
WBLVD
A1503
1503
1490
95
215
AN N RD
DURAN
GODR
AZU R E D R
TENAYA
WY
HA MME R L N
TRO P IC AL PK WY
RILEY
STELCAPITAN
WY
CO R B ETT ST RIOVISTAST
FISH E R A VE
JULIANORD
CE NT EN N IALCE N TER
B LV D
SKYPOINT
EDR
CE NT EN N IAL PK WY
LA MAN C HA A VE CIMARRO
NRD
EL C A MPO GR A ND E AV E
RAMPI215
SUS95
JANEL
LDR
RE G EN A AV EEM
PER
ORWY
LISA
LN
DA R LIN G RD
GRANDMONTE
CITO
PKWY
BUFFALO
DR
BIL PA R R D
DREX
ELRD
RANCH
ODR
BUTLERST
ROYAL
CASTLELN
TAJMAH
ALDR
BR IG H T A NG E L W Y
CO R P L IM IT
LEGGETT
RD
JOC K EY A VE
AS TR AL AV E
PREC
INCT
BDRY
BONITAVISTA
ST
SH AD B U SH A VE
BE N H OGA N D R
RA MP DU R AN GO N CC 215
ROME BL VD
KEVINWY
REDSUNDR
RAMPWUS95
CENT
PK
RA MPAN N
N U S 95
ROSETH
ICKET
STDR A MAT IC WYCE
NTRA
LIAST
SAVA
NTCT
ROSEHILLS
ST
KEVINWY 95
CE NT EN N IAL PK WY
SK Y P O INT E D R
KEVINWY
CORPLIMIT
KEVINWY
RIOVISTASTB 1503
Date of data: May 04, 2005
GIS m aps ar e n orm ally pro du cedonly to m ee t th e n eed s of the City.
Due to co ntin uo us d eve lopm en t ac tivitythis m ap is fo r r efe re nce only .
Geo gra ph ic Inf orm at ion Sy stem
Pla nnin g & D evelo pm en t Dep t.702 -22 9- 630 1
1469

Ap
pe
nd
ix
Economic Elem;Plans-MPlan;indd;rs09/02/09 page 43
I 15
US95
SR41
SAHARA AV
LAS VEGAS
BLVD
CRAIG RD
CHARLESTON B LVD
CHEYENNE AV
SR 159
ANN RD
WASHINGTON AV
RANCH
O
DR
ZZR
OA
D
LAKE ME AD BLV DLAM
BB
LVD
NE
LLI
SB
LVD
DESERT INN RD
PABCO
RD
JON
ES
BLV
D
KYLE CANY ONRD
RA
INB
OW
BLV
D
PE
CO
SR
D
BU
FFA
LOD
R
EA
ST
ER
NA
V
MA
RT
INL
KIN
GB
LVD
5TH
ST
ELKHORN RD
US93
VAL
LEY
VIE
WB
LVD
RA
MP
AR
TB
LVD
SUMM ERLIN PKWY
CO
RP
LIM
IT
CENTE NNIA L PKWY
DU
RA
NG
OD
R
SIM
MO
NS
ST
HU
ALA
PA
IW
Y
FREMONT
ST
FOR
TA
PA
CH
ER
D
BOULDER
HWY
DE
CAT
UR
BLV
D
MA
RY
LA
ND
PK
WY
SR 147
TOW
NCENTER
DR
PAR
AD
ISE
RD
ALL
EN
LA
JEN
SE
NS
T
CA
MIN
OA
LN
OR
TE
TRE
ELI
NE
DR
RIO
VIS
TA
ST
SLO
AN
LA
REDR
OCK
CANY
ON
SUN CITYBLV D
HO
LLY
WO
OD
BLV
D
ANAS
AZI
DR
BELTWAY
WEST LEG
MC
LE
OD
DR
HILL
SCE
NT
ERD
R
DE
CAT
UR
BLV
D
I 15
HO
LLY
WO
OD
BLV
D
BU
FFA
LOD
R
DU
RA
NG
OD
R
RA
INB
OW
BLV
D
LAKE ME AD BLV D
DESERT INN RD
DE
CAT
UR
BLV
D
JON
ES
BLV
D
BU
FFA
LOD
R
US95
DESERT INN RD
FOR
TA
PA
CH
ER
D
ECONOMIC ELEMENT - ROADS BUILT BY YEAR
Date of data: Januar y 21, 2009
GISmaps are normally producedonly to meet the needs of the City.
Due to conti nuous developmentactiv itythism ap is for reference only.
Geographic Information SystemPlanning &Development Dept.
702-229-6301
T:/advplan/pro jects /projectsg is/economic developm ent/RoadsByYear.m xd
Source: City Of Las Vegas Publ ic Works Departm ent4TH
1STUP
RR FREMONT
LASVEGAS
OGDEN
CASINOCENTER
MAIN
3RD
5TH
UTAH
BONNEVILLE
GASS
95
GRANDCENTRAL
CLARK
STEWART
8TH
GARCES
WYOM ING
BRIDGER
HOOVER
9TH
7TH
CHARLESTON
11TH
COLORADO
10TH
13TH
6TH
SWEENEY
COMMERCE
EASTER
N
BONANZA
COOLIDGE
REXFORD
12TH
MESQUITE
INDUSTRIAL
CITY
BRACKEN
14TH
15TH
DISCOVERY
CALIFORNIA
HOUSSELS
RAMPNI15US95MLK
17TH
WENGERT
IMPERIAL
TOWER
BRUC
E
LEWIS
FRANKLIN
WILSON
CARSON
GRIFFITHBRACKEN
7TH
3RD
CARSON
8TH
10TH
95
IMPERIAL
95
LEWIS
OGDEN
OGDEN
UPRR
6TH
9TH
6TH
7TH
1ST
US 95I 15
I 15
US 95UPRR
UPRR
C i t y o f L a s V e g a sYear Public Road Built
Private Streets
1970 - 19791980 - 1989
Before 19501950 - 1969
1990 - 19992000 - 2009
City of Las Vegas

Ap
pe
nd
ix
page 44 Economic Elem;Plans-MPlan;indd;rs09/02/09
Back of this page intentionally blank