Embed Size (px)
Citation preview
United StatesDepartment ofAgriculture
AdministrativePublicationNumber 076
July 2004
Economic Effects ofU.S. Dairy Policy andAlternative Approaches to Milk Pricing
Report to Congress
AcknowledgmentsThe study was coordinated by Don Blayney and Mary Anne Normile ofUSDA’s Economic Research Service. The coordinators gratefully acknowl-edge the contributions of David Anderson, Texas A&M University; JosephBalagtas, University of California-Davis; Scott Brown, University ofMissouri; Oral Capps, Texas A&M University; Tom Cox, Bob Cropp andHooman Dabidia, University of Wisconsin; Thomas Fiddaman, VentanaSystems, Inc; Ken Hanson, USDA, ERS; Hal Harris, Clemson University;Ron Knutson, Texas A&M University; James Miller, USDA, ERS; MitchMorehart, USDA, ERS; Charles Nicholson, Cornell University; VictorOliveira, USDA, ERS; Joe Outlaw, Texas A&M University; J. MichaelPrice, USDA, ERS; James Richardson, Texas A&M University; RobertSchwart, Texas A&M University; Sara Short, USDA, ERS; MarkStephenson, Cornell University; Daniel Sumner, University of California-Davis; and Cameron Thraen, Ohio State University. The authors expresssincere thanks to Mary Bohman, USDA, ERS; Dan Colacicco, USDA, FSA;Neilson Conklin, USDA, ERS; Ralph Dutrow, USDA, FAS; Anne Effland,USDA, ERS; Bruce Gardner, University of Maryland; Larry Hamm,Michigan State University; Jay Hirschman, USDA, FNS; James Johnson,USDA, ERS; Jeff Kahn, USDA, OGC; Paul Kiendl, USDA, FAS; MiltonMadison, USDA, FSA; Lynn Maish, USDA/OBPA; Alden Manchester,(retired) USDA, ERS; Jim MacDonald, USDA, ERS; Howard McDowell,USDA, AMS; John Mengel, USDA, AMS; James Miller, USDA, ERS;Janet Perry, USDA, ERS; Larry Salathe, USDA, OCE; Scott Steele, USDA,OBPA; Richard Stillman, USDA, ERS; Daniel Sumner, University of Cali-fornia-Davis for their valuable review comments; to Chris Dicken, LouKing, and Anne Pearl, USDA, ERS, for editorial and design assistance; andto Coco Clayton, Lewrene Glaser, Agnes Prentice, and LaVerne Creek,USDA, ERS, for their work to produce the compact disc version of thereport.
1Economic Effects of U.S. Dairy Policy and Alternative Approaches to Milk Pricing
U.S. Department of Agriculture
2Economic Effects of U.S. Dairy Policy and Alternative Approaches to Milk Pricing
U.S. Department of Agriculture
ContentsOverview . . . . . . . . . . . . . . . . . . . . . . . . . . . . . . . . . . . . . . . . . . . . . . . . . . . .3
Introduction . . . . . . . . . . . . . . . . . . . . . . . . . . . . . . . . . . . . . . . . . . . . . . . . .10
The Evolution of the Modern Dairy Industry . . . . . . . . . . . . . . . . . . . . . . .13The Changing Demand for Dairy Products . . . . . . . . . . . . . . . . . . . .14Changes Beyond the Farmgate . . . . . . . . . . . . . . . . . . . . . . . . . . . . .17On the Farm—The Changing Structure of Dairy Farming . . . . . . . .22
Public Policy in the Dairy Industry . . . . . . . . . . . . . . . . . . . . . . . . . . . . . . .36Federal Milk Marketing Orders . . . . . . . . . . . . . . . . . . . . . . . . . . . . .38Federal Milk Price Support Program . . . . . . . . . . . . . . . . . . . . . . . .43State Pricing and State-Mandated Over-Order Premiums . . . . . . . .46Interstate Dairy Compacts . . . . . . . . . . . . . . . . . . . . . . . . . . . . . . . . .46Direct Payments . . . . . . . . . . . . . . . . . . . . . . . . . . . . . . . . . . . . . . . . .48Dairy Export Incentive Program . . . . . . . . . . . . . . . . . . . . . . . . . . .48Other Dairy Programs . . . . . . . . . . . . . . . . . . . . . . . . . . . . . . . . . . . .49Policy Conflicts . . . . . . . . . . . . . . . . . . . . . . . . . . . . . . . . . . . . . . . . .50Regional Effects of Dairy Programs . . . . . . . . . . . . . . . . . . . . . . . . .51
The Effects of National Dairy Programs . . . . . . . . . . . . . . . . . . . . . . . . . . .55Introduction . . . . . . . . . . . . . . . . . . . . . . . . . . . . . . . . . . . . . . . . . . . .55Dairy Program Effects on National Market Indicators . . . . . . . . . . .55National Dairy Program Effects on Price Level and Volatility . . . . .62National Dairy Program Effects at the State Level . . . . . . . . . . . . . .63Effects of National Dairy Programs on Farms . . . . . . . . . . . . . . . . .64National Dairy Programs’ Effects on Food and
Nutrition Programs . . . . . . . . . . . . . . . . . . . . . . . . . . . . . . . . . . . .67National Dairy Program Effects on Rural Economies . . . . . . . . . . .68Summary . . . . . . . . . . . . . . . . . . . . . . . . . . . . . . . . . . . . . . . . . . . . . .70
An Alternative Milk Pricing Approach . . . . . . . . . . . . . . . . . . . . . . . . . . .72The Northeast Interstate Dairy Compact . . . . . . . . . . . . . . . . . . . . . .72Compacts in Lieu of Federal Dairy Programs . . . . . . . . . . . . . . . . .75Summary . . . . . . . . . . . . . . . . . . . . . . . . . . . . . . . . . . . . . . . . . . . . . .82Implications for State Pricing and State-Mandated
Over-Order premiums . . . . . . . . . . . . . . . . . . . . . . . . . . . . . . . . . .83
Conclusions . . . . . . . . . . . . . . . . . . . . . . . . . . . . . . . . . . . . . . . . . . . . . . . . .84
References . . . . . . . . . . . . . . . . . . . . . . . . . . . . . . . . . . . . . . . . . . . . . . . . . .87
Appendix A: Mandate for Dairy Study from the 2002 Farm Security and Rural Investment Act . . . . . . . . . . . . . . . . . .98
Appendix B: Summary of Legislation Affecting National Dairy Policy . . . . . . . . . . . . . . . . . . . . . . . . . . . . . . . .99
Appendix C: FAPRI and FAPSIM Baseline Valuesfor Selected Dairy Industry Indicators . . . . . . . . . . . . . . . . . .102
Appendix D: Overview of Nutrition Programs . . . . . . . . . . . . . . . . . . . . .103Glossary . . . . . . . . . . . . . . . . . . . . . . . . . . . . . . . . . . . . . . . . . . . . . . . . . . .106
3Economic Effects of U.S. Dairy Policy and Alternative Approaches to Milk Pricing
U.S. Department of Agriculture
OverviewThe U.S. Congress, in the Farm Security and Rural Investment Act of 2002(the 2002 Act), directed the Secretary of Agriculture to conduct a “compre-hensive economic evaluation of the … effects of the various elements of thenational dairy policy.” The Act further directed the Secretary to study theeffects of (a) terminating Federal milk price support and supply manage-ment programs, and (b) allowing State cooperation to manage milk pricesand supply. Both studies deal with similar questions that relate to the effectsof government policies on economic outcomes. For this reason, the twostudies are combined into this single report.
This report examines the effects of national dairy policy and its componentprograms as defined in the 2002 Act on milk and dairy product markets,farm households, nutrition programs, and the rural economy.1 Theseprograms include:
• Federal milk marketing orders,• the Federal milk price support program,• State pricing programs and State-mandated over-order premiums,2
• interstate dairy compacts,3
• direct payments to milk producers, and• the dairy export incentive program (DEIP).
The report focuses on the following questions: what have been the measur-able effects of dairy programs on economic variables—price level andvolatility, milk production, and producer revenues? How have these marketimpacts in turn affected farms, rural economies, and nutrition programs?How might States cooperate to support prices in the absence of a Federalprice support program? The standard tools of economic analysis are used toaddress these questions, but there are also other forces at work that haveinfluenced the dairy sector. Changes in the dairy sector should be consid-ered in a larger context with a longer-run perspective. Thus, the first part ofthis report answers another, related question: what factors can we identifythat have been responsible for changes in the dairy sector?
Dairy Policy in the Context of Structural Change
Many of the individual programs that make up U.S. dairy policy were origi-nally designed to deal with the industry’s structure in the 1930s, when mostmilk production (60 percent) was destined for fluid consumption, marketswere predominantly local, and many dairy enterprises were part of diversi-fied farming operations. Today, the largest share of milk is used for manu-factured dairy products (especially cheese) rather than fluid milk; marketsfor manufactured dairy products are national in scope; and dairy farms arehighly specialized, many of them large-scale industrial-type farms.
Production technologies that provide economies of scale have led toincreased specialization and to consolidation on both sides of the farmgate.On the farm, milk yields per cow have increased steadily as a result ofgenetic improvement, better herd management, and adoption of technolo-
1Programs identified in the 2002 Actare primarily domestic. Because theAct did not request an analysis of theeffects of trade measures—and to bet-ter isolate the effects of dairy pro-grams on the U.S. industry—currentlevels of import protection for dairyproducts are assumed to remain inplace.2The qualifier “State-mandated” hasbeen added by the authors to distin-guish over-order premiums regulatedby State dairy programs from market-generated over-order premiums thatare not part of any dairy program.3Interstate dairy compacts are not partof current dairy programs.
4Economic Effects of U.S. Dairy Policy and Alternative Approaches to Milk Pricing
U.S. Department of Agriculture
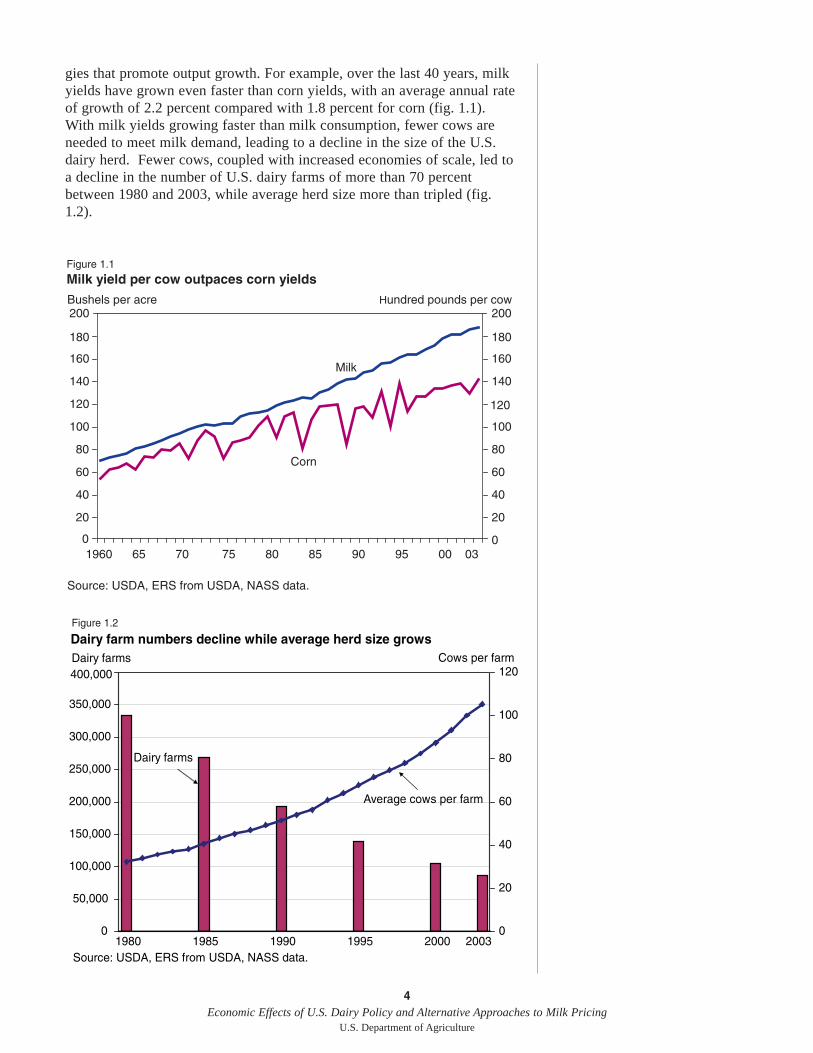
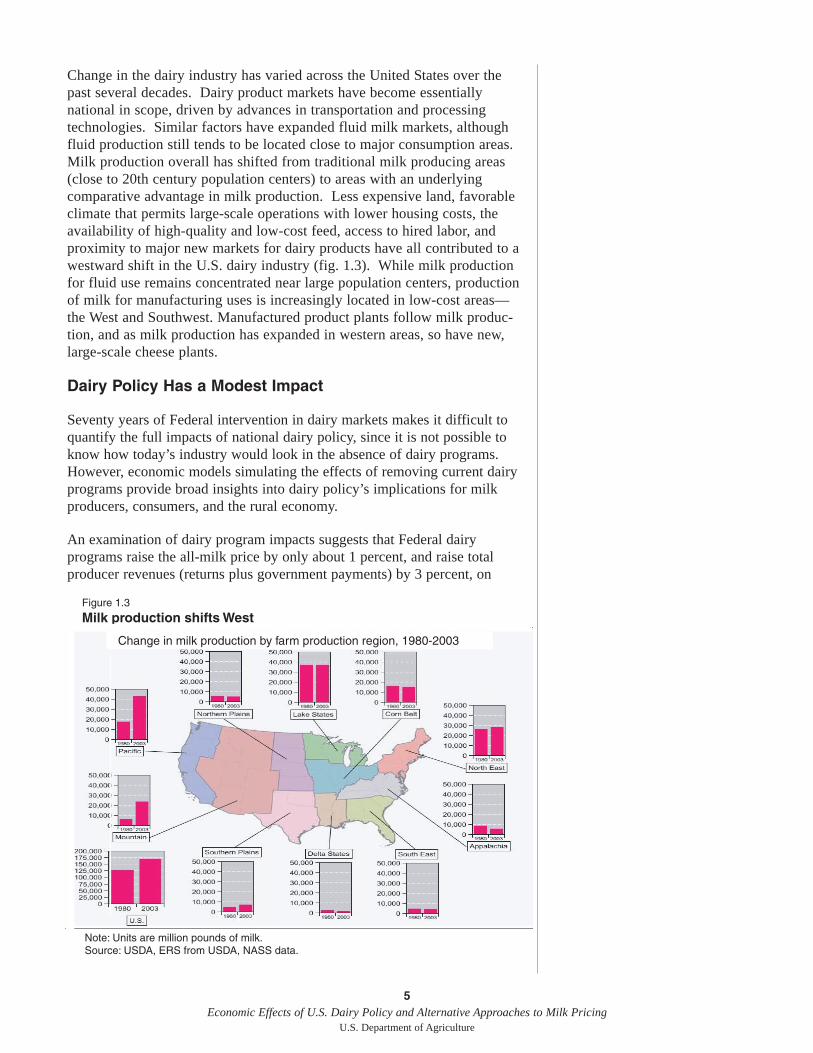
gies that promote output growth. For example, over the last 40 years, milkyields have grown even faster than corn yields, with an average annual rateof growth of 2.2 percent compared with 1.8 percent for corn (fig. 1.1).With milk yields growing faster than milk consumption, fewer cows areneeded to meet milk demand, leading to a decline in the size of the U.S.dairy herd. Fewer cows, coupled with increased economies of scale, led toa decline in the number of U.S. dairy farms of more than 70 percentbetween 1980 and 2003, while average herd size more than tripled (fig.1.2).
Figure 1.1
Milk yield per cow outpaces corn yields
0
20
40
60
80
100
120
140
160
180
200
0
20
40
60
80
100
120
140
160
180
200
Corn
Milk
Bushels per acre Hundred pounds per cow
1960 65 70 75 80 85 90 95 00 03
Source: USDA, ERS from USDA, NASS data.
0
50,000
100,000
150,000
200,000
250,000
300,000
350,000
400,000
1980 1985 1990 1995 2000 20030
20
40
60
80
100
120
Source: USDA, ERS from USDA, NASS data.
Dairy farm numbers decline while average herd size growsFigure 1.2
Dairy farms
Dairy farms
Average cows per farm
Cows per farm
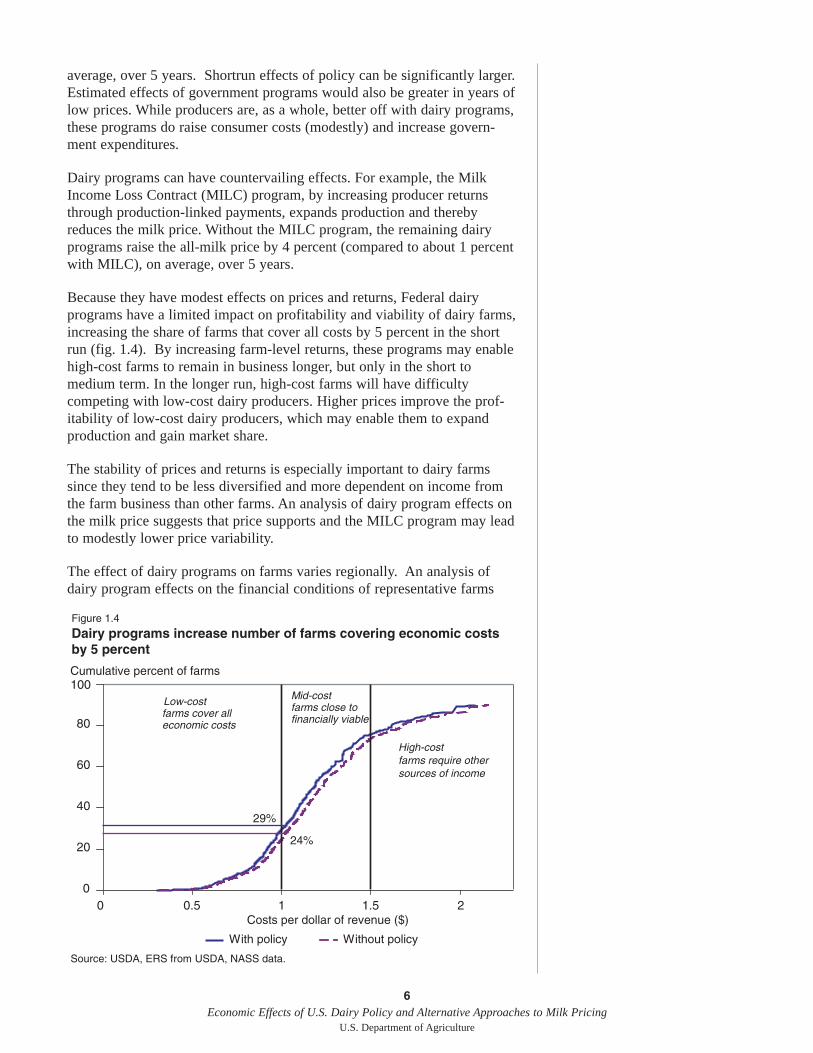
Change in the dairy industry has varied across the United States over thepast several decades. Dairy product markets have become essentiallynational in scope, driven by advances in transportation and processingtechnologies. Similar factors have expanded fluid milk markets, althoughfluid production still tends to be located close to major consumption areas.Milk production overall has shifted from traditional milk producing areas(close to 20th century population centers) to areas with an underlyingcomparative advantage in milk production. Less expensive land, favorableclimate that permits large-scale operations with lower housing costs, theavailability of high-quality and low-cost feed, access to hired labor, andproximity to major new markets for dairy products have all contributed to awestward shift in the U.S. dairy industry (fig. 1.3). While milk productionfor fluid use remains concentrated near large population centers, productionof milk for manufacturing uses is increasingly located in low-cost areas—the West and Southwest. Manufactured product plants follow milk produc-tion, and as milk production has expanded in western areas, so have new,large-scale cheese plants.
Dairy Policy Has a Modest Impact
Seventy years of Federal intervention in dairy markets makes it difficult toquantify the full impacts of national dairy policy, since it is not possible toknow how today’s industry would look in the absence of dairy programs.However, economic models simulating the effects of removing current dairyprograms provide broad insights into dairy policy’s implications for milkproducers, consumers, and the rural economy.
An examination of dairy program impacts suggests that Federal dairyprograms raise the all-milk price by only about 1 percent, and raise totalproducer revenues (returns plus government payments) by 3 percent, on
5Economic Effects of U.S. Dairy Policy and Alternative Approaches to Milk Pricing
U.S. Department of Agriculture
Note: Units are million pounds of milk.
Source: USDA, ERS from USDA, NASS data.
Figure 1.3
Milk production shifts West
Change in milk production by farm production region, 1980-2003
average, over 5 years. Shortrun effects of policy can be significantly larger.Estimated effects of government programs would also be greater in years oflow prices. While producers are, as a whole, better off with dairy programs,these programs do raise consumer costs (modestly) and increase govern-ment expenditures.
Dairy programs can have countervailing effects. For example, the MilkIncome Loss Contract (MILC) program, by increasing producer returnsthrough production-linked payments, expands production and therebyreduces the milk price. Without the MILC program, the remaining dairyprograms raise the all-milk price by 4 percent (compared to about 1 percentwith MILC), on average, over 5 years.
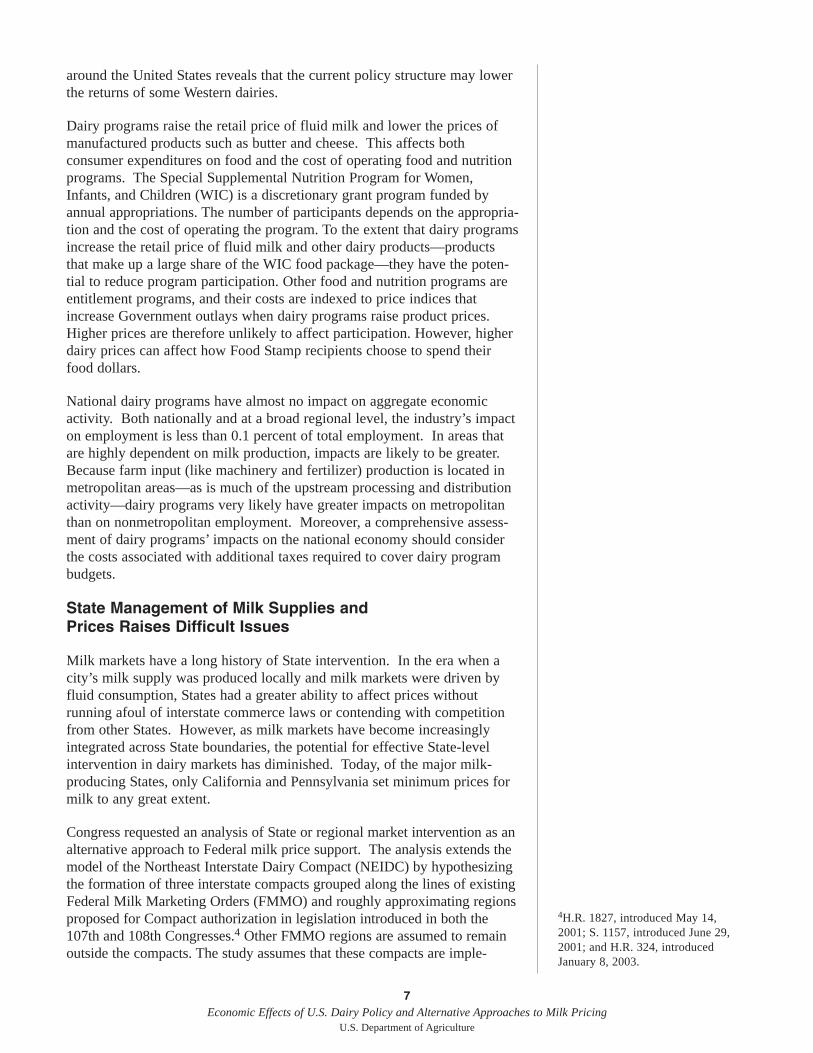
Because they have modest effects on prices and returns, Federal dairyprograms have a limited impact on profitability and viability of dairy farms,increasing the share of farms that cover all costs by 5 percent in the shortrun (fig. 1.4). By increasing farm-level returns, these programs may enablehigh-cost farms to remain in business longer, but only in the short tomedium term. In the longer run, high-cost farms will have difficultycompeting with low-cost dairy producers. Higher prices improve the prof-itability of low-cost dairy producers, which may enable them to expandproduction and gain market share.
The stability of prices and returns is especially important to dairy farmssince they tend to be less diversified and more dependent on income fromthe farm business than other farms. An analysis of dairy program effects onthe milk price suggests that price supports and the MILC program may leadto modestly lower price variability.
The effect of dairy programs on farms varies regionally. An analysis ofdairy program effects on the financial conditions of representative farms
6Economic Effects of U.S. Dairy Policy and Alternative Approaches to Milk Pricing
U.S. Department of Agriculture
Figure 1.4
Dairy programs increase number of farms covering economic costs by 5 percent
0
20
40
60
80
100
0 0.5 1 1.5 2Costs per dollar of revenue ($)
With policy Without policy
Low-costfarms cover all economic costs
Mid-costfarms close to financially viable
High-costfarms require other sources of income
29%
24%
Source: USDA, ERS from USDA, NASS data.
Cumulative percent of farms
7Economic Effects of U.S. Dairy Policy and Alternative Approaches to Milk Pricing
U.S. Department of Agriculture
around the United States reveals that the current policy structure may lowerthe returns of some Western dairies.
Dairy programs raise the retail price of fluid milk and lower the prices ofmanufactured products such as butter and cheese. This affects bothconsumer expenditures on food and the cost of operating food and nutritionprograms. The Special Supplemental Nutrition Program for Women,Infants, and Children (WIC) is a discretionary grant program funded byannual appropriations. The number of participants depends on the appropria-tion and the cost of operating the program. To the extent that dairy programsincrease the retail price of fluid milk and other dairy products—productsthat make up a large share of the WIC food package—they have the poten-tial to reduce program participation. Other food and nutrition programs areentitlement programs, and their costs are indexed to price indices thatincrease Government outlays when dairy programs raise product prices.Higher prices are therefore unlikely to affect participation. However, higherdairy prices can affect how Food Stamp recipients choose to spend theirfood dollars.
National dairy programs have almost no impact on aggregate economicactivity. Both nationally and at a broad regional level, the industry’s impacton employment is less than 0.1 percent of total employment. In areas thatare highly dependent on milk production, impacts are likely to be greater.Because farm input (like machinery and fertilizer) production is located inmetropolitan areas—as is much of the upstream processing and distributionactivity—dairy programs very likely have greater impacts on metropolitanthan on nonmetropolitan employment. Moreover, a comprehensive assess-ment of dairy programs’ impacts on the national economy should considerthe costs associated with additional taxes required to cover dairy programbudgets.
State Management of Milk Supplies and Prices Raises Difficult Issues
Milk markets have a long history of State intervention. In the era when acity’s milk supply was produced locally and milk markets were driven byfluid consumption, States had a greater ability to affect prices withoutrunning afoul of interstate commerce laws or contending with competitionfrom other States. However, as milk markets have become increasinglyintegrated across State boundaries, the potential for effective State-levelintervention in dairy markets has diminished. Today, of the major milk-producing States, only California and Pennsylvania set minimum prices formilk to any great extent.
Congress requested an analysis of State or regional market intervention as analternative approach to Federal milk price support. The analysis extends themodel of the Northeast Interstate Dairy Compact (NEIDC) by hypothesizingthe formation of three interstate compacts grouped along the lines of existingFederal Milk Marketing Orders (FMMO) and roughly approximating regionsproposed for Compact authorization in legislation introduced in both the107th and 108th Congresses.4 Other FMMO regions are assumed to remainoutside the compacts. The study assumes that these compacts are imple-
4H.R. 1827, introduced May 14,2001; S. 1157, introduced June 29,2001; and H.R. 324, introducedJanuary 8, 2003.
8Economic Effects of U.S. Dairy Policy and Alternative Approaches to Milk Pricing
U.S. Department of Agriculture
mented while eliminating the Federal milk price support program (there is noFederal supply management of milk), but all other programs—primarilyMILC and Federal milk marketing orders—are assumed to remain in place.This scenario provides some general insights into the economic and policyissues associated with State and/or regional management of milk prices.
In general, compacts establish a minimum regional price that processorsare required to pay for Class I milk, the milk used in fluid beverage prod-ucts. When the compact price is greater than the FMMO price, the differ-ence (or some share of it) is returned to producers selling milk in thecompact region. Higher returns to these producers lead to increased milkproduction, and fluid milk consumption drops as consumers react to thehigher retail prices. The resulting excess supply of milk above fluidrequirements within the compact region spills over to the manufacturingmilk market. As a result, manufacturing milk prices decline, as does theprice of fluid milk in areas outside the compacts. These effects are greatestduring low-price years.
As long as fluid utilization is high enough, returns to dairy farmerssupplying the compact region increase as the higher fluid milk price morethan offsets any decline in the price of manufacturing milk. However, lowermanufacturing milk prices are felt nationally and returns to dairy farmersoutside the compact region decline. Farmers in regions with higher levels ofmanufacturing use for their milk suffer the greatest losses because theyreceive no MILC payment to dampen the loss of revenues from fluid milk.
In this scenario, farmers in the Southeast compact region reaped the largestgains while milk producers in the Southwest and Arizona (non-compactregions) suffered the greatest losses. Direct payments under the MILCprogram would offset some of the impact on farmers outside the compactregion.5 Consumers both outside and within the compact region benefitfrom lower prices for manufactured dairy products. However, consumerswithin compact regions spend more on fluid milk, while consumers outsidethe compact region would spend less on fluid milk.
Thus, the general net effect of an interstate compact is to benefit dairyfarmers within and consumers outside the compact region. The costs of thecompact are borne by consumers within the compact region, by dairyfarmers outside compact areas, and, in the event direct payments arecontinued, by taxpayers.
Compacts may provide regional price support, as long as a large proportionof production in the compact region is sold into the higher priced fluid milkmarket, but are unlikely to substitute for price support on a national level.Extending compacts across the entire country would increase the impact onnational milk production. Without some form of supply control, higher fluidprices applied to all producers would induce increased milk production thatwould spill over to the manufacturing milk market, driving down the priceof milk for manufacturing use even further. The average producer priceacross all uses would decline further, rendering price management effortsineffective.
5The analysis assumed that MILC con-tinued following the introduction of acompact.
This analysis raises questions regarding other means of State support. WereStates to pursue a support program similar to the Federal milk price supportprogram, States would need to address the issues of program funding, howprice support levels would be established, and, if product purchase programswere implemented, the disposition of product stocks. If supply controlprograms were adopted, additional considerations include establishing andenforcing quota levels and penalties or incentives for compliance. Suchsystems raise questions regarding cross-border issues—how to deal withmilk flowing to areas with different price support or quota levels. WhileState or regional management of milk prices has received considerableattention as a possible alternative to current policy, this analysis suggeststhat it likely raises even more difficult issues than current policy.
Conclusions
The analysis shows that effects of dairy programs on markets are modestand current dairy programs are limited in their ability to change the long-term economic viability of dairy farms.
Other forces—technology, changing consumer demand, and changes in themarketing and processing sectors—while difficult to measure, are likelymore important to the future of the dairy industry.
While State or regional dairy policy approaches have received much atten-tion, this analysis suggests that they may increase producer returns in Statesor regions that implement them, but can reduce returns elsewhere.Extending these approaches nationwide, in the absence of an underlyingFederal milk price support program, is unlikely to increase producer returnswithout requiring supply control measures.
Future policies should include clearly defined goals to devise targeted meas-ures that take into account underlying forces driving the transformation ofthe U.S. dairy sector.
9Economic Effects of U.S. Dairy Policy and Alternative Approaches to Milk Pricing
U.S. Department of Agriculture
10Economic Effects of U.S. Dairy Policy and Alternative Approaches to Milk Pricing
U.S. Department of Agriculture
IntroductionNational dairy policy and the programs designed to promote it have been inexistence in various forms for about 70 years. Dairy programs now includeprice support and product storage, import protection, marketing regulationsthat set minimum prices by use and pool revenues for producers, exportsubsidies, and direct producer payments. The dairy industry of today—fromthe farm level through processing, manufacturing, distribution to retailing—has been shaped in part by the mix of policies and programs in effectthroughout its development.
The U.S. Congress, in the Farm Security and Rural Investment Act of 2002(the 2002 Act), directed the Secretary of Agriculture to conduct a “compre-hensive economic evaluation of the … effects of the various elements of thenational dairy policy.” The Act further directed the Secretary to study theeffects of (a) terminating Federal milk price support and supply manage-ment programs,1 and (b) allowing State cooperation to manage milk pricesand supply. (See Appendix A for the sections of the Act that comprise themandate for the two studies.) Since both studies focus on similar questionsthat relate to the effects of government policies on economic outcomes, theyare combined into a single report.
The 2002 Act defines “national dairy policy” to mean the dairy policy of theUnited States as demonstrated by the following programs:
• Federal milk marketing orders,• the Federal milk price support program,• State pricing programs and State-mandated over-order premiums,2
• interstate dairy compacts,3
• direct payments to milk producers, and• export programs such as the dairy export incentive program
(DEIP).
The 2002 Act also defines the primary questions to be addressed in this report:
• What are the effects of dairy policy on farms and rural economies? • How do these policies affect government nutrition programs,
participating institutions, and program recipients? • What are the impacts of dairy policy on markets for dairy products?
Any attempt to evaluate the effects of dairy programs must recognize thatforces other than national dairy policy have influenced the dairy sector’sdevelopment and contribute to economic outcomes. Changes in demand;advances in production, transportation, and communication technology; theexpanding scope of markets for dairy products; and productivity growthhave been important factors. Consolidation at all levels of the industry canbe explained by these forces and the incentive to reduce costs by exploitingeconomies of scale in a competitive industry. Many of these factors areresponsible for regional shifts in milk production. The role of dairy
1There are currently no supply man-agement programs for milk or dairyproducts in the United States.
2The qualifier “State-mandated” hasbeen added by the authors to distin-guish over-order premiums regulatedby State dairy programs from market-generated over-order premiums thatare not part of any dairy program.3Interstate dairy compacts are not partof current dairy programs.
11Economic Effects of U.S. Dairy Policy and Alternative Approaches to Milk Pricing
U.S. Department of Agriculture
programs has at times been to support milk producer prices and/or incomesto help them deal with the impacts of some of these forces.
Observations of the changing structure of the dairy sector frequentlyunderlie policy concerns. The extensive structural changes that have takenplace throughout the U.S. dairy industry have been the result of manyforces, not all policy-related. “The Evolution of the Modern DairyIndustry” assesses the forces influencing the dairy sector and, wherepossible, relates changes in the structure of the dairy industry to the interac-tion between dairy programs and other forces.
“Public Policy in the Dairy Industry” provides a brief description of thedairy programs covered by the study, and places them in the context of theevolution of U.S. dairy policies and programs. This chapter is intended toprovide an overview of the operations of the programs that will be evalu-ated in subsequent chapters.
“The Effects of National Dairy Programs” presents the results of theanalyses of the effects of four key Federal dairy programs. (State andregional dairy programs are addressed in “An Alternative Milk PricingApproach.”) A multifaceted approach to analyzing the effects of the dairyprograms is necessary given the wide range of issues to be addressed.Model-based analyses provide quantitative estimates of the effects of dairypolicy on market outcomes—price, revenue, production, and consumption.Several quantitative analytical frameworks are used to provide the model-based analysis in “The Effects of National Dairy Programs,” including twofarm sector models, a representative farms model, an Input-Output model,and a system dynamics model.
Because at least some national dairy programs have been in place for manydecades, there are effectively no observations of the modern U.S. dairyindustry in the absence of government policy.4 Consequently, a modified“counterfactual” approach was used to derive estimates of dairy programeffects. A simulation of the dairy industry without programs is comparedwith a baseline industry simulation that includes programs. Effects derivedfrom the simulation results are then applied in other analytical frameworksto estimate program effects on representative dairy farms and subnationaleconomies. The system dynamics model is used to evaluate changes inselected dairy programs as they relate to milk price volatility
“An Alternative Milk Pricing Approach” examines the implications ofadopting an alternative mechanism for establishing minimum milk priceswhile at the same time eliminating the Federal milk price support program.In doing so, this chapter analyzes the effects of interstate compacts ingeneral. An interregional model of the dairy sector is used to examine theeffects of replacing the Federal price support program with a system ofinterstate dairy compacts, similar to the Northeast Interstate Dairy Compact(NEIDC). While there are numerous possible scenarios for interstate coop-eration to manage prices, the NEIDC provides a historical model for coop-erative efforts by States.
4While we have no observations of theU.S. industry in the absence of exten-sive dairy programs, the experience ofpolicy reform in other countries mayprovide some insights. Australia'sderegulation of their dairy industry isdescribed in an ABARE report on theimpact of an open market in fluid milksupply at: http://abareonlineshop.com/product.asp?prodid=12204. The U.S.International Trade Commission hasreviewed this report in Conditions ofCompetition for Milk Protein Productsin the U.S. Market, Investigation No.332-453, Publication 3692, May 2004.ftp://ftp.usitc.gov/pub/reports/studies/pub3692.pdf, p. 4-44 through 4-47.
12Economic Effects of U.S. Dairy Policy and Alternative Approaches to Milk Pricing
U.S. Department of Agriculture
This report is a synthesis of the results of several studies by a team of dairyindustry experts including personnel of the Economic Research Service(ERS) of the U.S. Department of Agriculture and researchers at severaluniversities. The quantitative analysis of farm sector impacts was under-taken by ERS, using the Food and Agricultural Policy Simulator (FAPSIM),and by the University of Missouri Food and Agricultural Policy ResearchInstitute (FAPRI) using the FAPRI dairy model (Price, 2004; Brown, 2003).The effects of dairy programs on farms were analyzed using the Farm LevelIncome and Policy Simulator (FLIPSIM) model developed at the TexasA&M University (Outlaw et al., 2003). The analysis of the effects of dairyprograms on the volatility of dairy prices was performed using a SystemDynamics model developed at Cornell University (Nicholson andFiddaman, 2003). Impacts of dairy programs on rural economies weredeveloped by ERS using an Input-Output model (USDA, ERS, 2004). Theanalysis of the effects of dairy programs on farm viability was based onERS’ Agricultural Resource Management System (ARMS) data (Morehartet al., 2000). The analysis of the impacts of cooperative efforts by States tomanage minimum prices was carried out using the University of Wisconsin-Madison Dairy Sector Interregional Competition Model (Cox and Dabidia,2003). Knutson et al. (2003) contributed the summary of studies of theeffects of the Northeast Interstate Dairy Compact in “An Alternative MilkPricing Approach.” Contributors to “The Evolution of the Modern DairyIndustry” and “Public Policy in the Dairy Industry” included researchersfrom the Texas A&M University (Anderson et al., 2003; Knutson et al.,2003); the University of Wisconsin-Madison (Cropp, 2003); ClemsonUniversity (Harris, 2003); University of California, Davis (Balagtas andSumner, unpublished); and ERS (Blayney and Miller, 2003). ERSpersonnel provided overall project coordination, established the guidelinesfor analyzing the dairy program effects by defining the scenarios foranalyzing program effects, and produced the final synthesis report.
The complete studies underlying many of the analyses presented in thisreport may be found on the web site of the Cornell Program on DairyMarkets and Policy (http://www.dairy.cornell.edu/CPDMP/Pages/Work-shops/Memphis03/), and on the ERS web site (Price, 2004;http://www.ers.usda.gov/publications/tb-1910).
The Evolution of the ModernDairy IndustryUnderstanding the current state of the U.S. dairy industry and how it haschanged over time is fundamental to a comprehensive economic evaluationof policy effects on the industry. This chapter examines changing demandfor dairy products; changes in dairy processing, manufacturing, milkassembly, and distribution; structural change at the farm level; and changesin public policy—and identifies the forces underlying these changes.
Consolidation has changed the structure at all levels of the dairy industry—fluid processing, product manufacturing, producer cooperatives, and at thefarm level. Advances in transportation, distribution, communication, andinformation technology have continued to expand the scope of dairymarkets, lead to greater market integration, and change the nature of dairymarkets from local markets for primarily fluid milk to national marketswhere manufacturing milk is dominant. These advances have allowed themarket to be served by fewer, larger operations. Farm production systemshave changed, new production systems have emerged, and productioncontinues to be increasingly industrialized as labor is replaced withmachinery and equipment. Productivity growth has allowed more milk to beproduced with fewer cows, reduced production costs, and allowed producersto realize efficiencies from economies of scale. Dairy farms have becomelarger and more specialized in milk production, although there are still alarge number of small dairy farms.
Changing consumer demand for dairy products has affected the structure ofdairy farms. Slow growth in demand for dairy products, coupled withproductivity growth, is driving this change. Since 1980, consumption of alldairy products has increased by 1.4 percent per year, while milk per cowhas risen by an average of 2.1 percent per year (USDA, NASS). Fewercows are needed to satisfy demand, but new dairy technologies requirelarger farms to justify the cost of adoption, resulting in fewer dairy farms(Cropp and Stephenson, 2001).
Regional shifts in milk production are a manifestation of some of the under-lying forces shaping the dairy industry. The growth of milk production inthe Western United States and the emergence of large operations in thisregion have resulted in increased regional concentration of milk production,whereas farms remain more dispersed regionally. These shifts can haveimportant impacts on the long-term prospects of milk producers in regionswhere production is declining.
Dairy policy has responded to structural change and the market conditionsthat give rise to this change as policymakers address problems that resultfrom the effects of structural adjustment. National dairy policy has played,and continues to play, a role in the industry’s evolution, but the impor-tance of policy as an agent of change is surpassed by the influence ofthese other factors.
13Economic Effects of U.S. Dairy Policy and Alternative Approaches to Milk Pricing
U.S. Department of Agriculture
14Economic Effects of U.S. Dairy Policy and Alternative Approaches to Milk Pricing
U.S. Department of Agriculture
1 Note: terms in bold italics aredefined in the glossary.
At the same time, policy has been influenced by changes in the dairy sector.Institutions that comprise the U.S. dairy industry form an extensive andhighly interrelated system, and changes in any or all of these institutions canrequire change in individual dairy programs (Hamm, 1991). Even thoughmany of the policies examined in this report have been in effect since the1930s and 1940s, the programs designed to achieve the policy objectiveshave been substantially changed in response to changes in market conditions.
The Changing Demand for Dairy Products
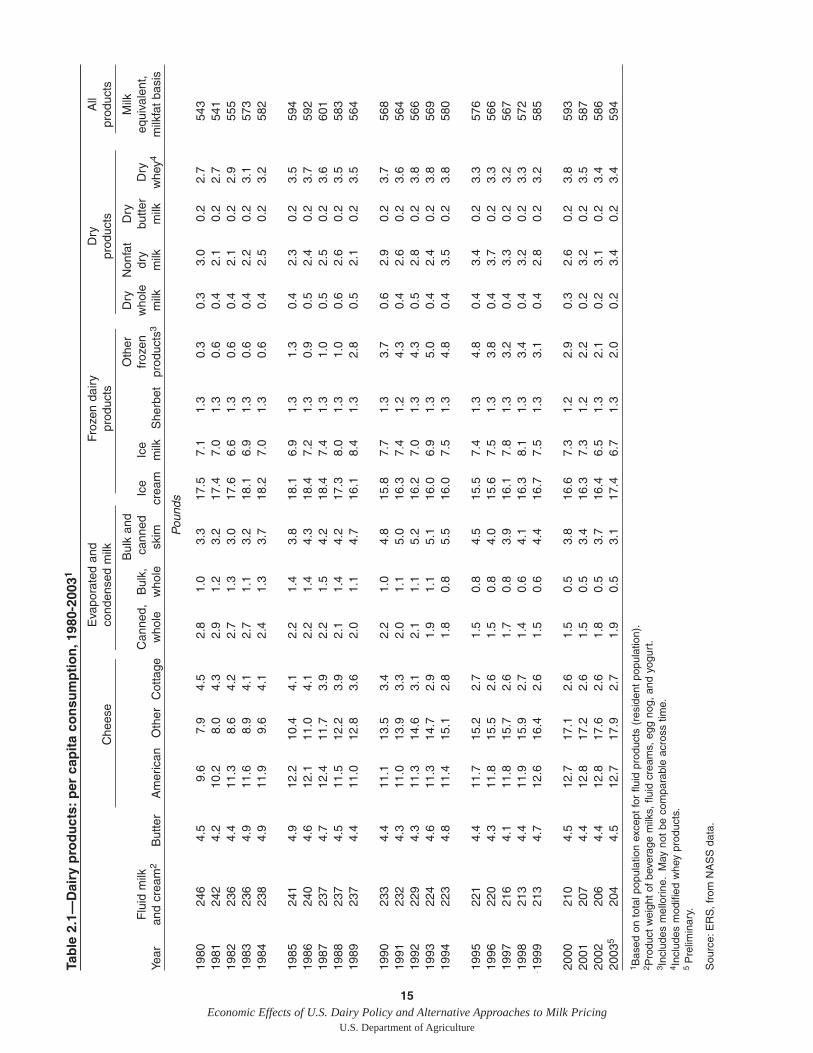
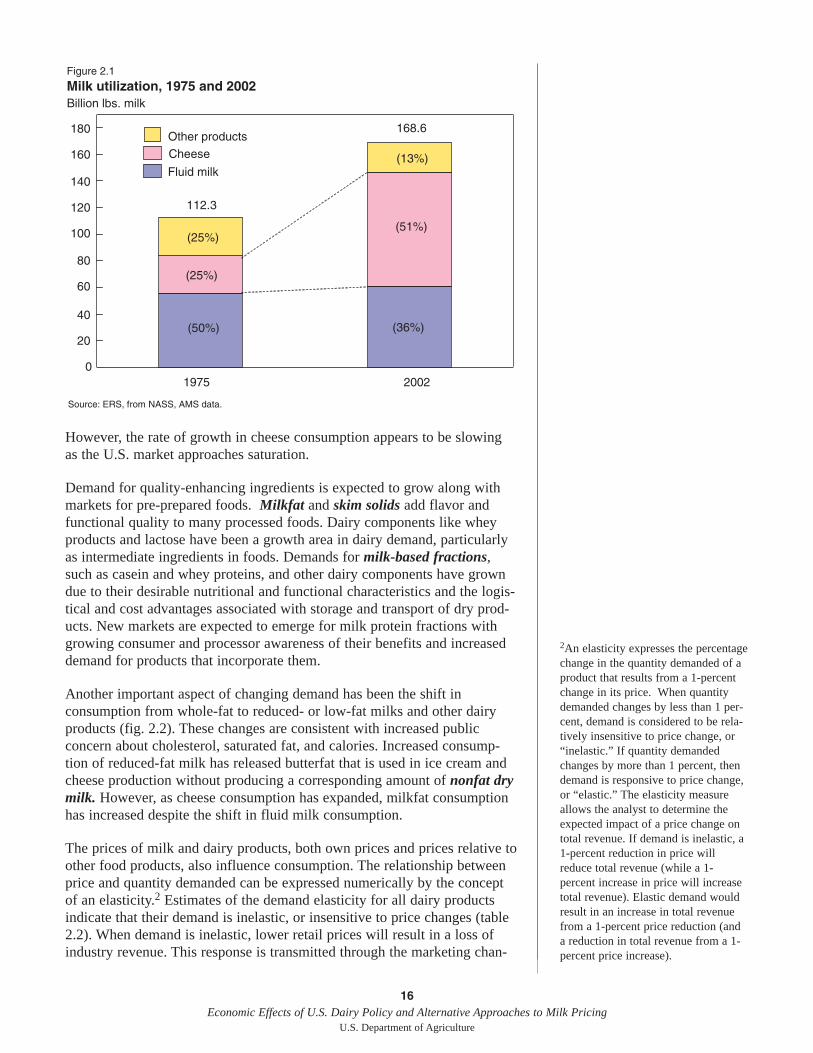
Changes in the demand for milk and dairy products have contributed to thetransformation of the dairy industry. Per capita consumption of dairy productsin the aggregate has risen over the past 20 years, while trends vary amongindividual products—fluid milk consumption has declined and cheeseconsumption has increased (table 2.1). Rising incomes, demographic shifts,and changing preferences have contributed in varying ways to consumerdemand for individual dairy products. For example, fluid milk products,1which were once the major use for milk, now represent 36 percent of milkutilization (fig. 2.1). Other products, especially cheese, are the primary sourceof demand for milk. The shift in consumption from perishable fluid milktoward more storable and easily transported manufactured dairy products hascontributed to the development of an increasingly national market for milk.
Total sales of fluid milk are now virtually the same as in the mid-1970s,while per capita consumption has declined. A number of factors havecontributed to this decline, including a smaller share of children in thepopulation, the increase in meals eaten away from home, children’s greatercontrol over their food consumption, and stronger and more diverse compe-tition from other beverages, particularly carbonated soft drinks, fruit andhigh-energy drinks, and bottled water. The negative effect of income onmilk consumption is due to the increase in meals away from home asincomes rise. Since most fluid milk is consumed at home, fluid milkconsumption falls as consumers eat out more frequently.
As incomes continue to rise, per capita consumption of fluid milk isexpected to decline further, while per capita consumption of cheese andyogurt is expected to increase (Lin et al., 2003). Population growth isprojected to outpace growth in per capita consumption of other dairy prod-ucts such that total consumption is expected to rise.
Cheese has become a key element of dairy demand, with per capitaconsumption increasing by 75 percent between 1980 and 2002. Risingfamily incomes, the increased use of cheese as an ingredient in cooking, andincreased consumption of cheese-heavy ethnic foods (like Italian andMexican) have all expanded cheese use. The greater diversity and avail-ability of cheeses has also fueled increases in total sales.
Less than half of all cheese is now sold at retail as cheese, but it is a majoringredient in many other foods sold through restaurants and grocery stores.The shift from at-home food preparation to consumption of partially or fullyprepared foods has benefited cheese sales. Pizza and similar products mayaccount for as much as one-third of total cheese use, and have been amongthe most important contributors to overall demand for dairy products.
15Economic Effects of U.S. Dairy Policy and Alternative Approaches to Milk Pricing
U.S. Department of Agriculture
Tab
le 2
.1—
Dai
ry p
rod
uct
s:p
er c
apit
a co
nsu
mp
tio
n,1
980-
2003
1
Eva
pora
ted
and
Froz
en d
airy
Dry
All
Che
ese
cond
ense
d m
ilkpr
oduc
tspr
oduc
tspr
oduc
ts
Bul
k an
dO
ther
Dry
Non
fat
Dry
Milk
Flu
id m
ilkC
anne
d,B
ulk,
cann
edIc
eIc
efr
ozen
who
ledr
ybu
tter
Dry
equi
vale
nt,
Year
and
crea
m2
But
ter
Am
eric
anO
ther
Cot
tage
who
lew
hole
skim
crea
mm
ilkS
herb
etpr
oduc
ts3
milk
milk
milk
whe
y4m
ilkfa
t ba
sis
Pou
nds
1980
246
4.5
9.6
7.9
4.5
2.8
1.0
3.3
17.5
7.1
1.3
0.3
0.3
3.0
0.2
2.7
543
1981
242
4.2
10.2
8.0
4.3
2.9
1.2
3.2
17.4
7.0
1.3
0.6
0.4
2.1
0.2
2.7
541
1982
236
4.4
11.3
8.6
4.2
2.7
1.3
3.0
17.6
6.6
1.3
0.6
0.4
2.1
0.2
2.9
555
1983
236
4.9
11.6
8.9
4.1
2.7
1.1
3.2
18.1
6.9
1.3
0.6
0.4
2.2
0.2
3.1
573
1984
238
4.9
11.9
9.6
4.1
2.4
1.3
3.7
18.2
7.0
1.3
0.6
0.4
2.5
0.2
3.2
582
1985
241
4.9
12.2
10.4
4.1
2.2
1.4
3.8
18.1
6.9
1.3
1.3
0.4
2.3
0.2
3.5
594
1986
240
4.6
12.1
11.0
4.1
2.2
1.4
4.3
18.4
7.2
1.3
0.9
0.5
2.4
0.2
3.7
592
1987
237
4.7
12.4
11.7
3.9
2.2
1.5
4.2
18.4
7.4
1.3
1.0
0.5
2.5
0.2
3.6
601
1988
237
4.5
11.5
12.2
3.9
2.1
1.4
4.2
17.3
8.0
1.3
1.0
0.6
2.6
0.2
3.5
583
1989
237
4.4
11.0
12.8
3.6
2.0
1.1
4.7
16.1
8.4
1.3
2.8
0.5
2.1
0.2
3.5
564
1990
233
4.4
11.1
13.5
3.4
2.2
1.0
4.8
15.8
7.7
1.3
3.7
0.6
2.9
0.2
3.7
568
1991
232
4.3
11.0
13.9
3.3
2.0
1.1
5.0
16.3
7.4
1.2
4.3
0.4
2.6
0.2
3.6
564
1992
22
94.
311
.314
.63.
12.
11.
15.
216
.27.
01.
34.
30.
52.
80.
23.
856
619
93
224
4.6
11.3
14.7
2.9
1.9
1.1
5.1
16.0
6.9
1.3
5.0
0.4
2.4
0.2
3.8
569
1994
223
4.8
11.4
15.1
2.8
1.8
0.8
5.5
16.0
7.5
1.3
4.8
0.4
3.5
0.2
3.8
580
1995
221
4.4
11.7
15.2
2.7
1.5
0.8
4.5
15.5
7.4
1.3
4.8
0.4
3.4
0.2
3.3
576
1996
220
4.3
11.8
15.5
2.6
1.5
0.8
4.0
15.6
7.5
1.3
3.8
0.4
3.7
0.2
3.3
566
1997
216
4.1
11.8
15.7
2.6
1.7
0.8
3.9
16.1
7.8
1.3
3.2
0.4
3.3
0.2
3.2
567
1998
21
34.
411
.915
.92.
71.
40.
64.
116
.38.
11.
33.
40.
43.
20.
23.
357
219
99
213
4.7
12.6
16.4
2.6
1.5
0.6
4.4
16.7
7.5
1.3
3.1
0.4
2.8
0.2
3.2
585
2000
21
04.
512
.717
.12.
61.
50.
53.
816
.67.
31.
22.
90.
32.
60.
23.
859
320
0120
74.
412
.817
.22.
61.
50.
53.
416
.37.
31.
22.
20.
23.
20.
23.
558
720
0220
64.
412
.817
.62.
61.
80.
53.
716
.46.
51.
32.
10.
23.
10.
23.
458
620
035
204
4.5
12.7
17.9
2.7
1.9
0.5
3.1
17.4
6.7
1.3
2.0
0.2
3.4
0.2
3.4
594
1 Bas
ed o
n to
tal p
opul
atio
n ex
cept
for
fluid
pro
duct
s (r
esid
ent
popu
latio
n).
2 Pro
duct
wei
ght
of b
ever
age
milk
s, f
luid
cre
ams,
egg
nog
, an
d yo
gurt
.3 I
nclu
des
mel
lorin
e.M
ay n
ot b
e co
mpa
rabl
e ac
ross
tim
e.4 I
nclu
des
mod
ified
whe
y pr
oduc
ts.
5 P
relim
inar
y.
Sou
rce:
ER
S,
from
NA
SS
dat
a.
16Economic Effects of U.S. Dairy Policy and Alternative Approaches to Milk Pricing
U.S. Department of Agriculture
However, the rate of growth in cheese consumption appears to be slowingas the U.S. market approaches saturation.
Demand for quality-enhancing ingredients is expected to grow along withmarkets for pre-prepared foods. Milkfat and skim solids add flavor andfunctional quality to many processed foods. Dairy components like wheyproducts and lactose have been a growth area in dairy demand, particularlyas intermediate ingredients in foods. Demands for milk-based fractions,such as casein and whey proteins, and other dairy components have growndue to their desirable nutritional and functional characteristics and the logis-tical and cost advantages associated with storage and transport of dry prod-ucts. New markets are expected to emerge for milk protein fractions withgrowing consumer and processor awareness of their benefits and increaseddemand for products that incorporate them.
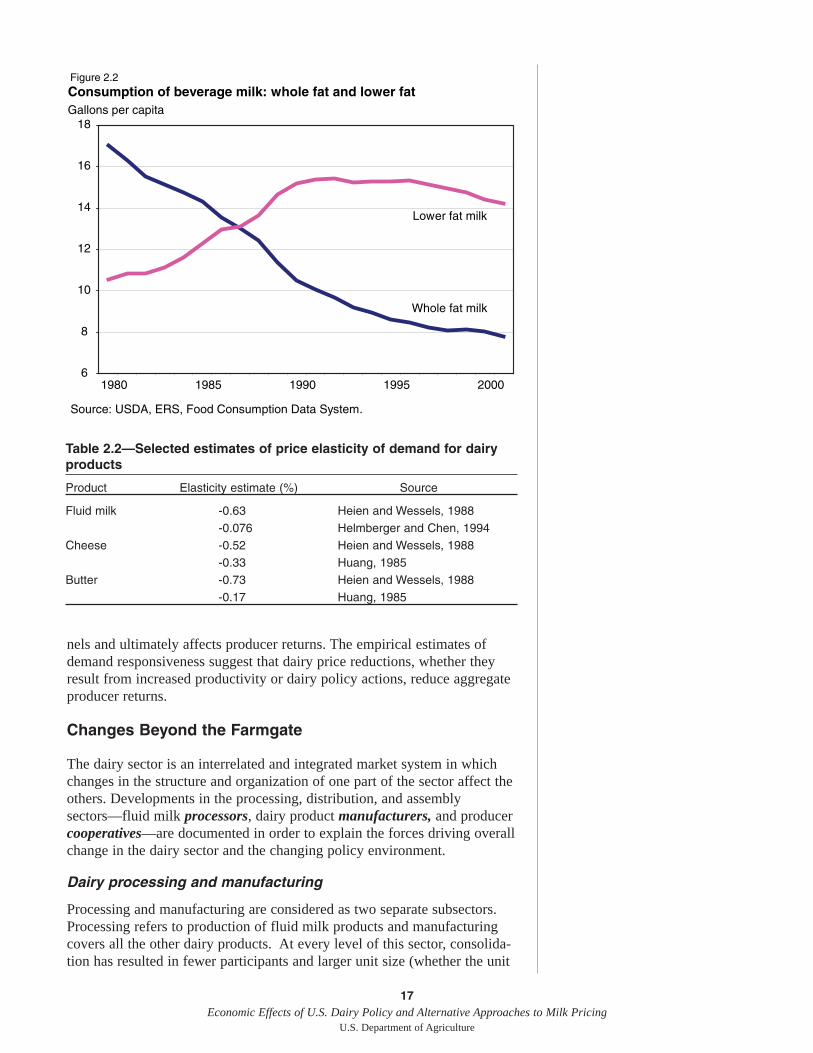
Another important aspect of changing demand has been the shift inconsumption from whole-fat to reduced- or low-fat milks and other dairyproducts (fig. 2.2). These changes are consistent with increased publicconcern about cholesterol, saturated fat, and calories. Increased consump-tion of reduced-fat milk has released butterfat that is used in ice cream andcheese production without producing a corresponding amount of nonfat drymilk. However, as cheese consumption has expanded, milkfat consumptionhas increased despite the shift in fluid milk consumption.
The prices of milk and dairy products, both own prices and prices relative toother food products, also influence consumption. The relationship betweenprice and quantity demanded can be expressed numerically by the conceptof an elasticity.2 Estimates of the demand elasticity for all dairy productsindicate that their demand is inelastic, or insensitive to price changes (table2.2). When demand is inelastic, lower retail prices will result in a loss ofindustry revenue. This response is transmitted through the marketing chan-
Figure 2.1
Milk utilization, 1975 and 2002
0
20
40
60
80
100
120
140
160
180
1975 2002
Other products
(25%)
Cheese
(25%)
Fluid milk
(50%)
(13%)
(51%)
(36%)
Source: ERS, from NASS, AMS data.
112.3
168.6
Billion lbs. milk
2An elasticity expresses the percentagechange in the quantity demanded of aproduct that results from a 1-percentchange in its price. When quantitydemanded changes by less than 1 per-cent, demand is considered to be rela-tively insensitive to price change, or“inelastic.” If quantity demandedchanges by more than 1 percent, thendemand is responsive to price change,or “elastic.” The elasticity measureallows the analyst to determine theexpected impact of a price change ontotal revenue. If demand is inelastic, a1-percent reduction in price willreduce total revenue (while a 1-percent increase in price will increasetotal revenue). Elastic demand wouldresult in an increase in total revenuefrom a 1-percent price reduction (anda reduction in total revenue from a 1-percent price increase).
17Economic Effects of U.S. Dairy Policy and Alternative Approaches to Milk Pricing
U.S. Department of Agriculture
nels and ultimately affects producer returns. The empirical estimates ofdemand responsiveness suggest that dairy price reductions, whether theyresult from increased productivity or dairy policy actions, reduce aggregateproducer returns.
Changes Beyond the Farmgate
The dairy sector is an interrelated and integrated market system in whichchanges in the structure and organization of one part of the sector affect theothers. Developments in the processing, distribution, and assemblysectors—fluid milk processors, dairy product manufacturers, and producercooperatives—are documented in order to explain the forces driving overallchange in the dairy sector and the changing policy environment.
Dairy processing and manufacturing
Processing and manufacturing are considered as two separate subsectors.Processing refers to production of fluid milk products and manufacturingcovers all the other dairy products. At every level of this sector, consolida-tion has resulted in fewer participants and larger unit size (whether the unit
6
8
10
12
14
16
18
1980 1985 1990 1995 2000
Figure 2.2Consumption of beverage milk: whole fat and lower fat
Lower fat milk
Whole fat milk
Source: USDA, ERS, Food Consumption Data System.
Gallons per capita
Table 2.2—Selected estimates of price elasticity of demand for dairyproducts
Product Elasticity estimate (%) Source
Fluid milk -0.63 Heien and Wessels, 1988-0.076 Helmberger and Chen, 1994
Cheese -0.52 Heien and Wessels, 1988-0.33 Huang, 1985
Butter -0.73 Heien and Wessels, 1988-0.17 Huang, 1985
18Economic Effects of U.S. Dairy Policy and Alternative Approaches to Milk Pricing
U.S. Department of Agriculture
is a cooperative, a plant, or a firm). Structural change in this sector has beendriven by both supply and demand factors.
Throughout the processing and manufacturing sector, fewer plants processfluid milk and manufacture dairy products. As advances in technologiesassociated with milk handling, storage, processing, manufacturing, andmarketing have continued to create economies of scale and eroded diseconomies, profit-seeking firms have expanded production facilities to takeadvantage. Plant size (measured by volume produced or sold) has grownconsiderably, providing evidence that scale economies are important in allsegments of processing and manufacturing. Improved packaging, bettercoordination among storage and distribution activities, and transportationimprovements have reduced the higher costs associated with increased plantsize, such as higher distribution costs resulting from an industry structure offewer and more centralized plants.
Developments in information technology have also improved coordinationof product movement both within and between firms. Pressure from down-stream businesses, including high-volume retailers, large restaurant chains,and food processors, have spurred dairy processors and manufacturers togrow large enough to serve customers efficiently; to satisfy requirements formore retail and other support activities, adoption of compatible technolo-gies, improved product quality and uniformity, and production to firm-specific standards; as well as to offset market power of the largedownstream entities (Kaufman, 2000; Blayney and Miller, 2003).
Structural change in processing and manufacturing has also been induced bysupply changes. Despite advances in transport and other technologies thatfavor more centralized operations, many dairy processing and manufacturingfirms still prefer to have an adequate, readily available local milk supply forplant operations. Farm milk production is geographically dispersed, and thereare still cost advantages in producing perishable products close to consumers.Regional shifts in milk production have contributed to changes in the locationof processing and manufacturing. As a result of the growth of milk supplies inIdaho, California, New Mexico, and Washington, butter, cheese, and nonfatdry milk production are increasingly located in the West.
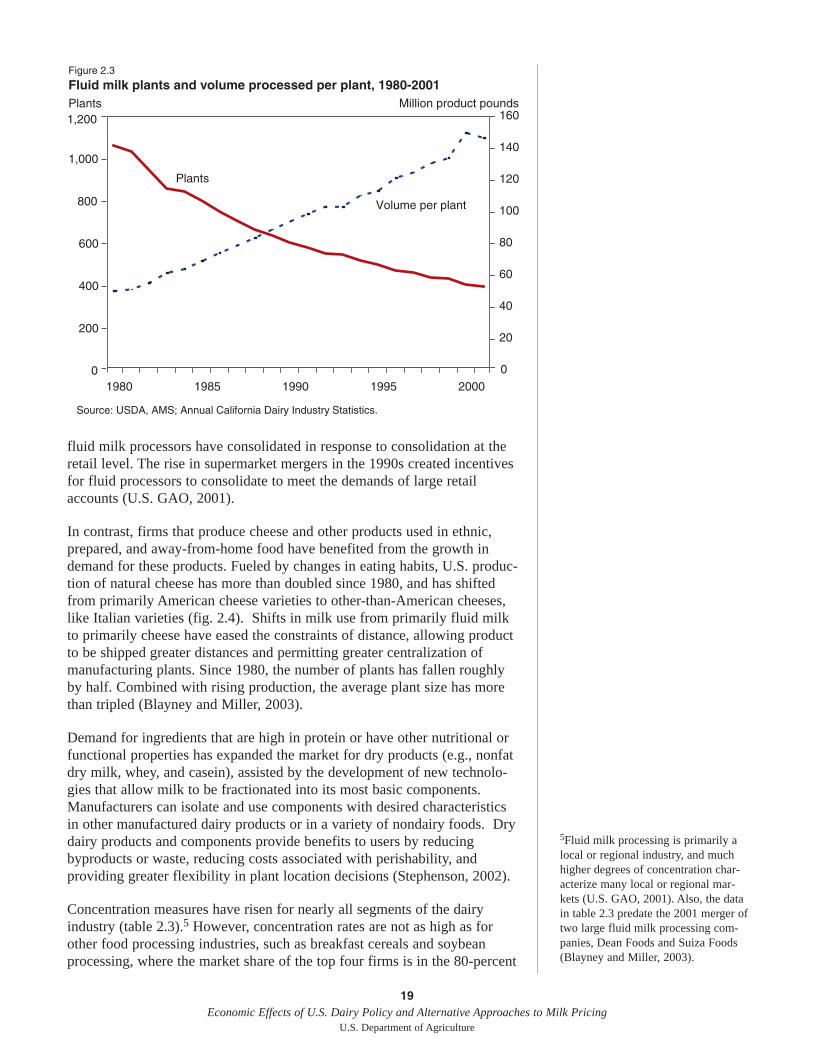
Changes in consumer demand for dairy products have stimulated changes inproduct mix, structure, and organization. Fluid milk processing has beenaffected by changing demand for fluid products. Processors have struggledwith changing fluid milk consumption, and have aggressively restructuredin the face of sluggish fluid demand.3 The number of fluid milk processingplants has declined continuously, while the average volume processed perplant has increased (fig. 2.3).4 The number of firms has contracted as largeproprietary fluid milk processing companies have consolidated throughmergers and acquisitions. Over time, scale economies have been the majorfactor influencing consolidation of fluid processing plants, as the minimumefficient size continues to increase (Manchester and Blayney, 1997). Newtechnologies in fluid processing raise costs, requiring a larger volume tocover costs. Fluid milk processing produces a homogenous product, withlittle opportunity for product differentiation, so lower costs are critical to theplant’s ability to compete (Manchester and Blayney, 1997). In recent years,
3For more information on structuralchange in the processing and manu-facturing sector, see Blayney andMiller, 2003; Miller, 2002; andManchester and Blayney, 1997.4This pattern of declining plant num-bers and increasing plant size can beseen in all segments of the dairy pro-cessing and manufacturing sector.Similar figures for the other subsec-tors are not reproduced here, but canbe found in Blayney and Miller, 2003.
fluid milk processors have consolidated in response to consolidation at theretail level. The rise in supermarket mergers in the 1990s created incentivesfor fluid processors to consolidate to meet the demands of large retailaccounts (U.S. GAO, 2001).
In contrast, firms that produce cheese and other products used in ethnic,prepared, and away-from-home food have benefited from the growth indemand for these products. Fueled by changes in eating habits, U.S. produc-tion of natural cheese has more than doubled since 1980, and has shiftedfrom primarily American cheese varieties to other-than-American cheeses,like Italian varieties (fig. 2.4). Shifts in milk use from primarily fluid milkto primarily cheese have eased the constraints of distance, allowing productto be shipped greater distances and permitting greater centralization ofmanufacturing plants. Since 1980, the number of plants has fallen roughlyby half. Combined with rising production, the average plant size has morethan tripled (Blayney and Miller, 2003).
Demand for ingredients that are high in protein or have other nutritional orfunctional properties has expanded the market for dry products (e.g., nonfatdry milk, whey, and casein), assisted by the development of new technolo-gies that allow milk to be fractionated into its most basic components.Manufacturers can isolate and use components with desired characteristicsin other manufactured dairy products or in a variety of nondairy foods. Drydairy products and components provide benefits to users by reducingbyproducts or waste, reducing costs associated with perishability, andproviding greater flexibility in plant location decisions (Stephenson, 2002).
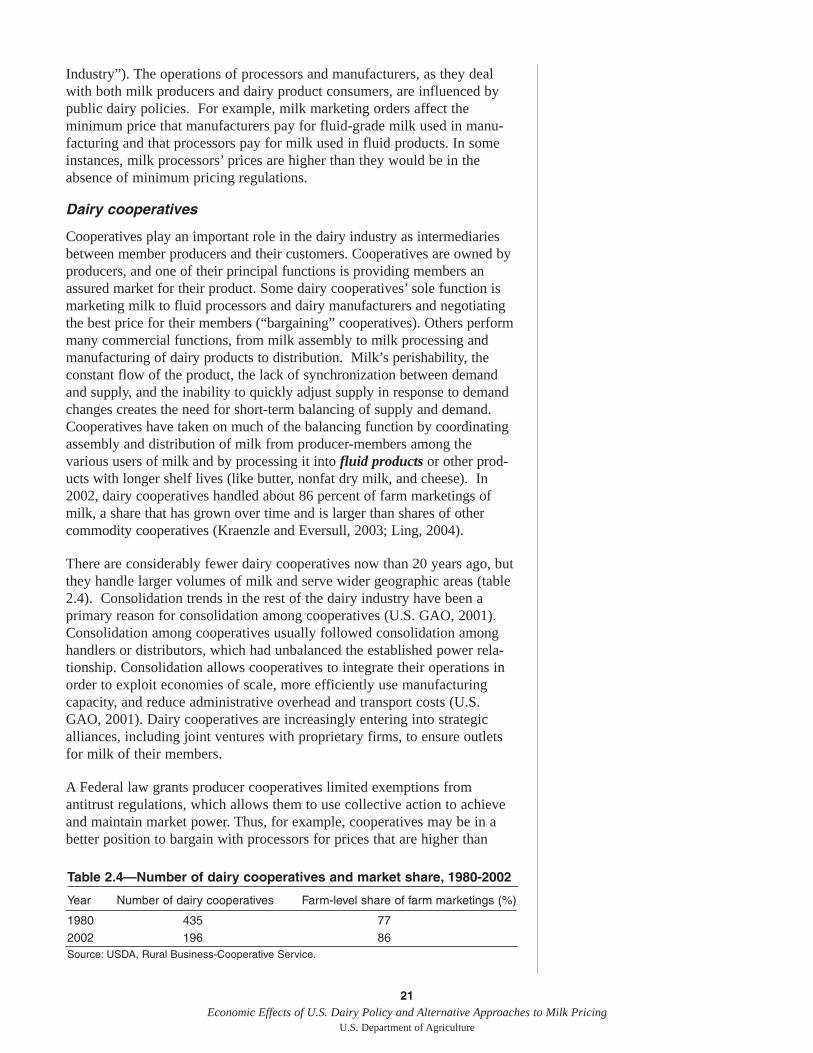
Concentration measures have risen for nearly all segments of the dairyindustry (table 2.3).5 However, concentration rates are not as high as forother food processing industries, such as breakfast cereals and soybeanprocessing, where the market share of the top four firms is in the 80-percent
19Economic Effects of U.S. Dairy Policy and Alternative Approaches to Milk Pricing
U.S. Department of Agriculture
Figure 2.3
Fluid milk plants and volume processed per plant, 1980-2001
0
200
400
600
800
1,000
1,200
1980 1985 1990 1995 20000
20
40
60
80
100
120
140
160
Source: USDA, AMS; Annual California Dairy Industry Statistics.
Plants
Volume per plant
Plants Million product pounds
5Fluid milk processing is primarily alocal or regional industry, and muchhigher degrees of concentration char-acterize many local or regional mar-kets (U.S. GAO, 2001). Also, the datain table 2.3 predate the 2001 merger oftwo large fluid milk processing com-panies, Dean Foods and Suiza Foods(Blayney and Miller, 2003).
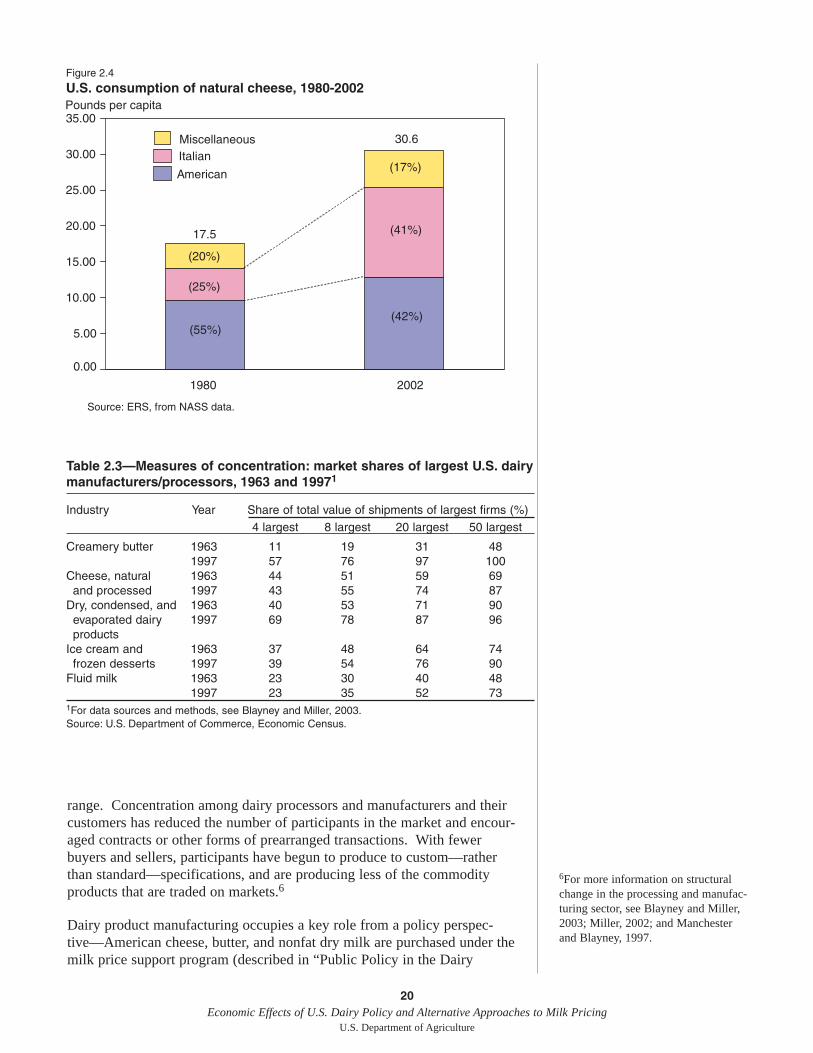
range. Concentration among dairy processors and manufacturers and theircustomers has reduced the number of participants in the market and encour-aged contracts or other forms of prearranged transactions. With fewerbuyers and sellers, participants have begun to produce to custom—ratherthan standard—specifications, and are producing less of the commodityproducts that are traded on markets.6
Dairy product manufacturing occupies a key role from a policy perspec-tive—American cheese, butter, and nonfat dry milk are purchased under themilk price support program (described in “Public Policy in the Dairy
20Economic Effects of U.S. Dairy Policy and Alternative Approaches to Milk Pricing
U.S. Department of Agriculture
Figure 2.4
U.S. consumption of natural cheese, 1980-2002
0.00
5.00
10.00
15.00
20.00
25.00
30.00
35.00
1980 2002
Miscellaneous
(20%)
Italian
(25%)
American
(55%)
(17%)
(41%)
(42%)
Source: ERS, from NASS data.
17.5
30.6
Pounds per capita
Table 2.3—Measures of concentration: market shares of largest U.S. dairymanufacturers/processors, 1963 and 19971
Industry Year Share of total value of shipments of largest firms (%)4 largest 8 largest 20 largest 50 largest
Creamery butter 1963 11 19 31 481997 57 76 97 100
Cheese, natural 1963 44 51 59 69and processed 1997 43 55 74 87
Dry, condensed, and 1963 40 53 71 90evaporated dairy 1997 69 78 87 96products
Ice cream and 1963 37 48 64 74frozen desserts 1997 39 54 76 90
Fluid milk 1963 23 30 40 481997 23 35 52 73
1For data sources and methods, see Blayney and Miller, 2003.Source: U.S. Department of Commerce, Economic Census.
6For more information on structuralchange in the processing and manufac-turing sector, see Blayney and Miller,2003; Miller, 2002; and Manchesterand Blayney, 1997.
21Economic Effects of U.S. Dairy Policy and Alternative Approaches to Milk Pricing
U.S. Department of Agriculture
Industry”). The operations of processors and manufacturers, as they dealwith both milk producers and dairy product consumers, are influenced bypublic dairy policies. For example, milk marketing orders affect theminimum price that manufacturers pay for fluid-grade milk used in manu-facturing and that processors pay for milk used in fluid products. In someinstances, milk processors’ prices are higher than they would be in theabsence of minimum pricing regulations.
Dairy cooperatives
Cooperatives play an important role in the dairy industry as intermediariesbetween member producers and their customers. Cooperatives are owned byproducers, and one of their principal functions is providing members anassured market for their product. Some dairy cooperatives’ sole function ismarketing milk to fluid processors and dairy manufacturers and negotiatingthe best price for their members (“bargaining” cooperatives). Others performmany commercial functions, from milk assembly to milk processing andmanufacturing of dairy products to distribution. Milk’s perishability, theconstant flow of the product, the lack of synchronization between demandand supply, and the inability to quickly adjust supply in response to demandchanges creates the need for short-term balancing of supply and demand.Cooperatives have taken on much of the balancing function by coordinatingassembly and distribution of milk from producer-members among thevarious users of milk and by processing it into fluid products or other prod-ucts with longer shelf lives (like butter, nonfat dry milk, and cheese). In2002, dairy cooperatives handled about 86 percent of farm marketings ofmilk, a share that has grown over time and is larger than shares of othercommodity cooperatives (Kraenzle and Eversull, 2003; Ling, 2004).
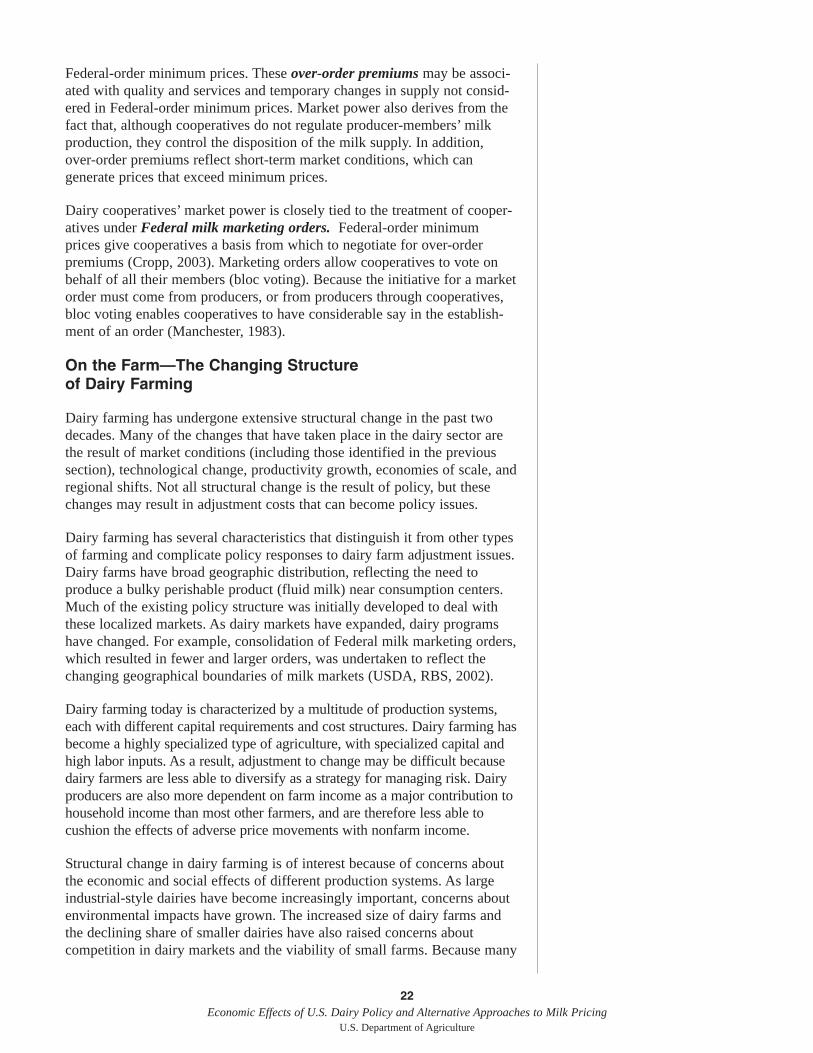
There are considerably fewer dairy cooperatives now than 20 years ago, butthey handle larger volumes of milk and serve wider geographic areas (table2.4). Consolidation trends in the rest of the dairy industry have been aprimary reason for consolidation among cooperatives (U.S. GAO, 2001).Consolidation among cooperatives usually followed consolidation amonghandlers or distributors, which had unbalanced the established power rela-tionship. Consolidation allows cooperatives to integrate their operations inorder to exploit economies of scale, more efficiently use manufacturingcapacity, and reduce administrative overhead and transport costs (U.S.GAO, 2001). Dairy cooperatives are increasingly entering into strategicalliances, including joint ventures with proprietary firms, to ensure outletsfor milk of their members.
A Federal law grants producer cooperatives limited exemptions fromantitrust regulations, which allows them to use collective action to achieveand maintain market power. Thus, for example, cooperatives may be in abetter position to bargain with processors for prices that are higher than
Table 2.4—Number of dairy cooperatives and market share, 1980-2002
Year Number of dairy cooperatives Farm-level share of farm marketings (%)
1980 435 772002 196 86Source: USDA, Rural Business-Cooperative Service.
22Economic Effects of U.S. Dairy Policy and Alternative Approaches to Milk Pricing
U.S. Department of Agriculture
Federal-order minimum prices. These over-order premiums may be associ-ated with quality and services and temporary changes in supply not consid-ered in Federal-order minimum prices. Market power also derives from thefact that, although cooperatives do not regulate producer-members’ milkproduction, they control the disposition of the milk supply. In addition,over-order premiums reflect short-term market conditions, which cangenerate prices that exceed minimum prices.
Dairy cooperatives’ market power is closely tied to the treatment of cooper-atives under Federal milk marketing orders. Federal-order minimumprices give cooperatives a basis from which to negotiate for over-orderpremiums (Cropp, 2003). Marketing orders allow cooperatives to vote onbehalf of all their members (bloc voting). Because the initiative for a marketorder must come from producers, or from producers through cooperatives,bloc voting enables cooperatives to have considerable say in the establish-ment of an order (Manchester, 1983).
On the Farm—The Changing Structure of Dairy Farming
Dairy farming has undergone extensive structural change in the past twodecades. Many of the changes that have taken place in the dairy sector arethe result of market conditions (including those identified in the previoussection), technological change, productivity growth, economies of scale, andregional shifts. Not all structural change is the result of policy, but thesechanges may result in adjustment costs that can become policy issues.
Dairy farming has several characteristics that distinguish it from other typesof farming and complicate policy responses to dairy farm adjustment issues.Dairy farms have broad geographic distribution, reflecting the need toproduce a bulky perishable product (fluid milk) near consumption centers.Much of the existing policy structure was initially developed to deal withthese localized markets. As dairy markets have expanded, dairy programshave changed. For example, consolidation of Federal milk marketing orders,which resulted in fewer and larger orders, was undertaken to reflect thechanging geographical boundaries of milk markets (USDA, RBS, 2002).
Dairy farming today is characterized by a multitude of production systems,each with different capital requirements and cost structures. Dairy farming hasbecome a highly specialized type of agriculture, with specialized capital andhigh labor inputs. As a result, adjustment to change may be difficult becausedairy farmers are less able to diversify as a strategy for managing risk. Dairyproducers are also more dependent on farm income as a major contribution tohousehold income than most other farmers, and are therefore less able tocushion the effects of adverse price movements with nonfarm income.
Structural change in dairy farming is of interest because of concerns aboutthe economic and social effects of different production systems. As largeindustrial-style dairies have become increasingly important, concerns aboutenvironmental impacts have grown. The increased size of dairy farms andthe declining share of smaller dairies have also raised concerns aboutcompetition in dairy markets and the viability of small farms. Because many
of the largest dairies are in the West, where milk production is growing,shifts in competitiveness and measures to deal with their effects havebecome increasingly divisive regional issues.
Milk production: more milk from fewer cows
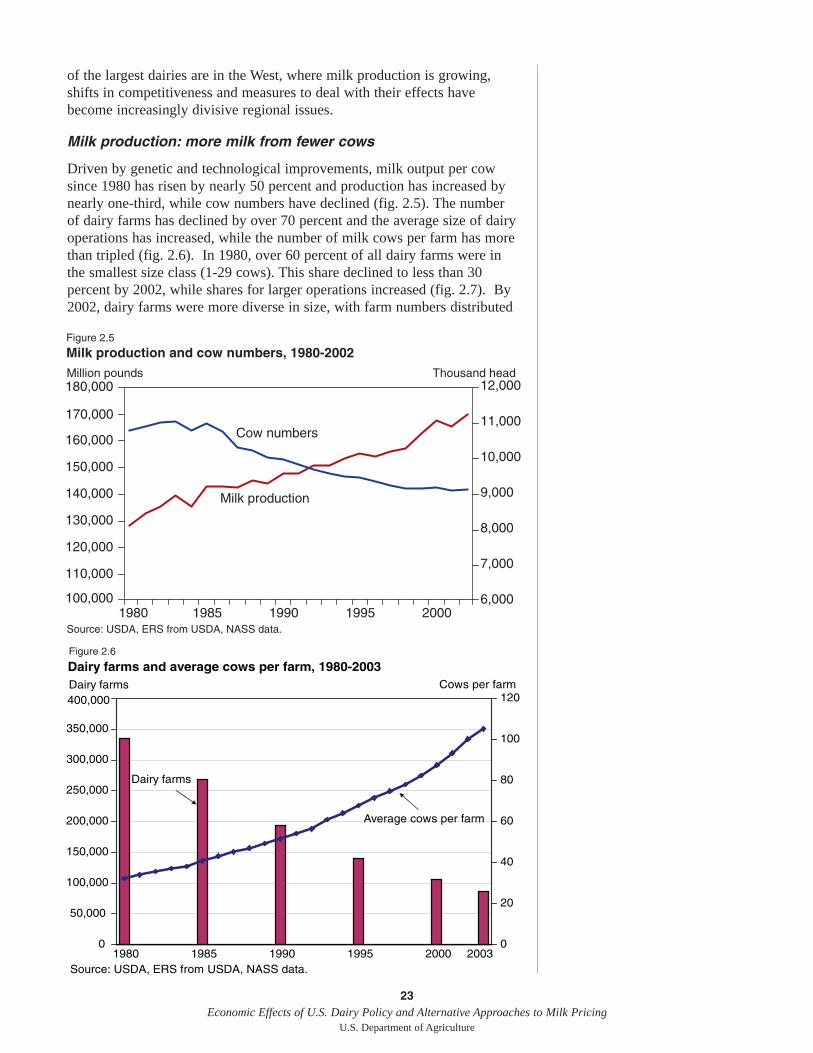
Driven by genetic and technological improvements, milk output per cowsince 1980 has risen by nearly 50 percent and production has increased bynearly one-third, while cow numbers have declined (fig. 2.5). The numberof dairy farms has declined by over 70 percent and the average size of dairyoperations has increased, while the number of milk cows per farm has morethan tripled (fig. 2.6). In 1980, over 60 percent of all dairy farms were inthe smallest size class (1-29 cows). This share declined to less than 30percent by 2002, while shares for larger operations increased (fig. 2.7). By2002, dairy farms were more diverse in size, with farm numbers distributed
23Economic Effects of U.S. Dairy Policy and Alternative Approaches to Milk Pricing
U.S. Department of Agriculture
Figure 2.5
Milk production and cow numbers, 1980-2002
100,000
110,000
120,000
130,000
140,000
150,000
160,000
170,000
180,000
1980 1985 1990 1995 20006,000
7,000
8,000
9,000
10,000
11,000
12,000
Cow numbers
Milk production
Million pounds Thousand head
Source: USDA, ERS from USDA, NASS data.
0
50,000
100,000
150,000
200,000
250,000
300,000
350,000
400,000
1980 1985 1990 1995 2000 20030
20
40
60
80
100
120
Source: USDA, ERS from USDA, NASS data.
Dairy farms and average cows per farm, 1980-2003Figure 2.6
Dairy farms
Dairy farms
Average cows per farm
Cows per farm
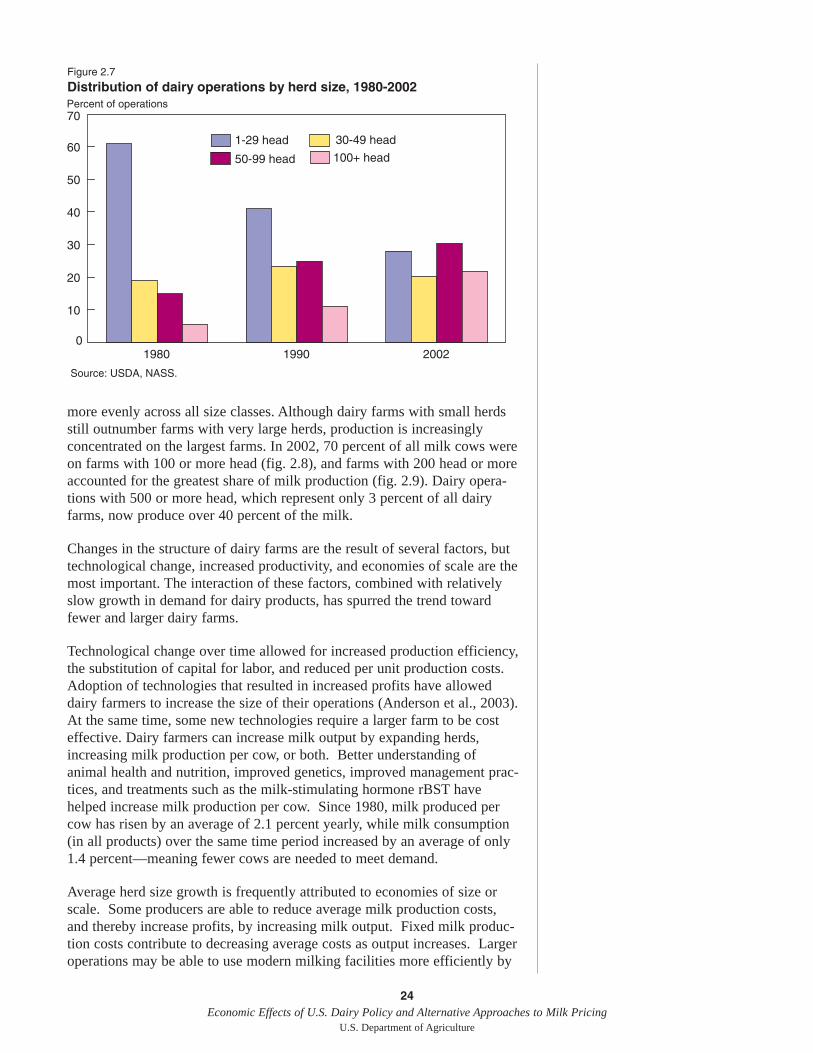
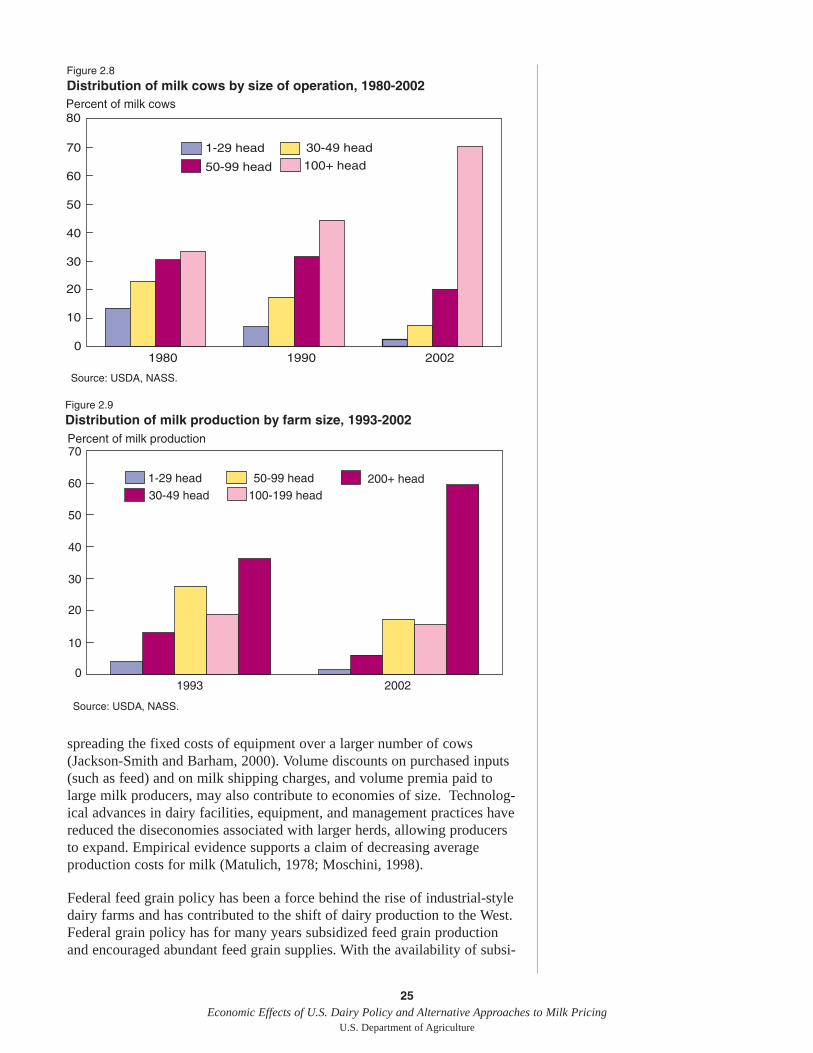
more evenly across all size classes. Although dairy farms with small herdsstill outnumber farms with very large herds, production is increasinglyconcentrated on the largest farms. In 2002, 70 percent of all milk cows wereon farms with 100 or more head (fig. 2.8), and farms with 200 head or moreaccounted for the greatest share of milk production (fig. 2.9). Dairy opera-tions with 500 or more head, which represent only 3 percent of all dairyfarms, now produce over 40 percent of the milk.
Changes in the structure of dairy farms are the result of several factors, buttechnological change, increased productivity, and economies of scale are themost important. The interaction of these factors, combined with relativelyslow growth in demand for dairy products, has spurred the trend towardfewer and larger dairy farms.
Technological change over time allowed for increased production efficiency,the substitution of capital for labor, and reduced per unit production costs.Adoption of technologies that resulted in increased profits have alloweddairy farmers to increase the size of their operations (Anderson et al., 2003).At the same time, some new technologies require a larger farm to be costeffective. Dairy farmers can increase milk output by expanding herds,increasing milk production per cow, or both. Better understanding ofanimal health and nutrition, improved genetics, improved management prac-tices, and treatments such as the milk-stimulating hormone rBST havehelped increase milk production per cow. Since 1980, milk produced percow has risen by an average of 2.1 percent yearly, while milk consumption(in all products) over the same time period increased by an average of only1.4 percent—meaning fewer cows are needed to meet demand.
Average herd size growth is frequently attributed to economies of size orscale. Some producers are able to reduce average milk production costs,and thereby increase profits, by increasing milk output. Fixed milk produc-tion costs contribute to decreasing average costs as output increases. Largeroperations may be able to use modern milking facilities more efficiently by
24Economic Effects of U.S. Dairy Policy and Alternative Approaches to Milk Pricing
U.S. Department of Agriculture
Figure 2.7
Distribution of dairy operations by herd size, 1980-2002
0
10
20
30
40
50
60
70
1980 1990 2002
1-29 head 30-49 head
50-99 head 100+ head
Source: USDA, NASS.
Percent of operations
spreading the fixed costs of equipment over a larger number of cows(Jackson-Smith and Barham, 2000). Volume discounts on purchased inputs(such as feed) and on milk shipping charges, and volume premia paid tolarge milk producers, may also contribute to economies of size. Technolog-ical advances in dairy facilities, equipment, and management practices havereduced the diseconomies associated with larger herds, allowing producersto expand. Empirical evidence supports a claim of decreasing averageproduction costs for milk (Matulich, 1978; Moschini, 1998).
Federal feed grain policy has been a force behind the rise of industrial-styledairy farms and has contributed to the shift of dairy production to the West.Federal grain policy has for many years subsidized feed grain productionand encouraged abundant feed grain supplies. With the availability of subsi-
25Economic Effects of U.S. Dairy Policy and Alternative Approaches to Milk Pricing
U.S. Department of Agriculture
Figure 2.8
Distribution of milk cows by size of operation, 1980-2002
0
10
20
30
40
50
60
70
80
1980 1990 2002
Percent of milk cows
1-29 head 30-49 head
50-99 head 100+ head
Source: USDA, NASS.
Figure 2.9
Distribution of milk production by farm size, 1993-2002
0
10
20
30
40
50
60
70
1993 2002
1-29 head30-49 head
50-99 head100-199 head
200+ head
Source: USDA, NASS.
Percent of milk production
26Economic Effects of U.S. Dairy Policy and Alternative Approaches to Milk Pricing
U.S. Department of Agriculture
7Hamm, Larry G., Michigan StateUniversity, personal communication.
dized feed grains, the dairy cow was altered from being a harvester ofgrasses and legumes grown on marginal crop land and in locations withmarginal crop-growing weather into a consumer of energy in the form ofgrains. Since 1985, reductions in support prices have made feed grains lessexpensive due to Federal programs that increasingly relied on directpayments rather than price support and acreage restrictions to maintaingrower returns. These changes helped make it possible to locate large dairyfarms in hospitable climates without the need for extensive land require-ments.7
The distributional effects of dairy programs can vary with farm size. Pricesupports without production limits, while available to all producers, providemore support as the size of the operation increases. However, output-limitedpayments like those provided by the Milk Income Loss Contract (MILC)program provide greater relative support to smaller operations. Moreover, asaverage herd sizes tend to vary by region, dairy programs may havedifferent regional impacts.
Production systems may affect costs
Dairy farming is characterized by a variety of production systems. Someproduction systems are more adaptable to some areas of the country thanothers. Different production systems have implications for the competitive-ness and longrun viability of dairy farms and regional dairy industriesbecause of the close association between production systems and productioncosts.
Specialized dairy operations can be categorized in a variety of ways into afew basic types of production systems. The following is a broad characteriza-tion that focuses on feeding and housing methods that affect production costs.
• Confinement feeding systems may range from small to intermediatesize operations, where feed is primarily homegrown and labor is supplied mostly by the family, to large operations (500 or more cows) with free-stall barns and extensive use of purchased feed andhired labor. Confinement operations are characterized by high capi-tal requirements in buildings and machinery and their size may affect both costs and productivity.
• Pasture-based operations rely on grasses and other forages as the primary feed source. Pasture-based systems are characterized by reduced feed purchases, lower labor costs (cows harvest feed), and lower investment in machinery and buildings. A variant of this sys-tem, intensive rotational grazing, generally requires additional man-agement skill involved with managing the pastures. Milk output percow may be lower than in other production systems, but profit may be higher because of reduced costs.
• Dry-lot operations are relatively new, developing as dairying grew on a large scale in arid and semi-arid regions, particularly the West.Dry-lot systems generally feature a large number of cows, heavy use of purchased feed, and intensive, rather than extensive, use of land. They are among the lowest cost production systems because
of low capital requirements and large size that allows for economies of size.
Each basic production system may vary according to the use of homegrownfeed or purchased feed, the number of cows, the use of hired versus familylabor, and other factors. Operations may also combine features of differentproduction systems (e.g., part pasture, part confinement). The productionsystem used will depend on climate; capital availability; availability ofpasture, water, and land; costs of other inputs like feed and labor; and theproducer’s skill or preference.
It is impossible to make categorical statements about relative costs by typeof production system—efficient, competitive farms can be found in eachcategory. However, size matters. Larger operations benefit from the abilityto spread capital costs over more units of production, and generally makemore efficient use of inputs as the size of operation increases. Milkproducers in the West have been found to have a significant cost advantageover producers in other regions because their operations are significantlylarger (Short, 2004). Most dry-lot operations, which tend not only to belarge but also have lower capital requirements, are located in the West,which may contribute to the West’s lower unit costs.
In 2000, more Western dairy producers (50 percent) were able to cover totaleconomic (operating and ownership) costs than operations in the upperMidwest and Northeast (30 percent each). An even smaller share (20 percent)of operations in the Corn Belt and Appalachia covered total economic costsin that year (Short, 2004). Declines in regional production shares have givenrise to concerns about how to improve cost competitiveness in these regions(Eberle et al., 2003; Jesse, 2002; LaDue et al., 2003). Increasing herd size toreduce unit costs, adopting elements of lower cost production systems, orreducing input costs are some of the options considered.
Milk production growing in the West
Milk is produced in all 50 States and the top five in 2003 were California,Wisconsin, New York, Pennsylvania, and Idaho. These States now accountfor over half the Nation’s milk output. The top 10 States accounted for 71percent of all U.S. milk production in 2003 compared with 66 percent in1980, indicating a slight increase in regional concentration of milk output.During that time period, New Mexico and Idaho—two of the fastestgrowing milk-producing States—replaced the Corn Belt’s Ohio and Iowa inthe list of the top 10 producing States. While the fastest growth in milkproduction has occurred in the West and Southwest, the Midwest and North-east remain important milk-producing regions.
Despite the nationwide decline in dairy cows, a handful of States in theWest and Southwest have added cows. Since 1980, the average herd size ofdairy farms has risen several-fold in the Mountain, Pacific, Southeast, andSouthern Plains and more modestly in the traditional dairy-producingregions (fig. 2.10). Traditional dairy-producing regions like the Lake Statesand the Northeast still account for high (but declining) shares of milk cows.
27Economic Effects of U.S. Dairy Policy and Alternative Approaches to Milk Pricing
U.S. Department of Agriculture
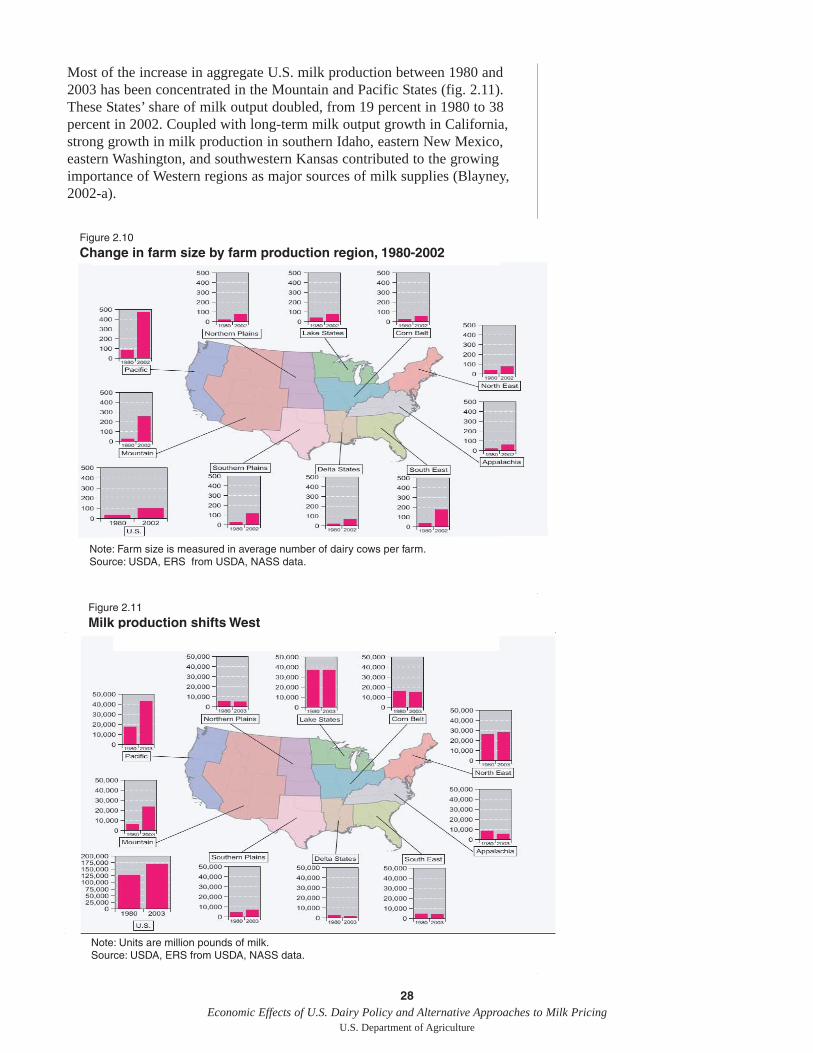
Most of the increase in aggregate U.S. milk production between 1980 and2003 has been concentrated in the Mountain and Pacific States (fig. 2.11).These States’ share of milk output doubled, from 19 percent in 1980 to 38percent in 2002. Coupled with long-term milk output growth in California,strong growth in milk production in southern Idaho, eastern New Mexico,eastern Washington, and southwestern Kansas contributed to the growingimportance of Western regions as major sources of milk supplies (Blayney,2002-a).
28Economic Effects of U.S. Dairy Policy and Alternative Approaches to Milk Pricing
U.S. Department of Agriculture
Figure 2.10
Change in farm size by farm production region, 1980-2002
Note: Farm size is measured in average number of dairy cows per farm.Source: USDA, ERS from USDA, NASS data.
Note: Units are million pounds of milk.
Source: USDA, ERS from USDA, NASS data.
Figure 2.11
Milk production shifts West
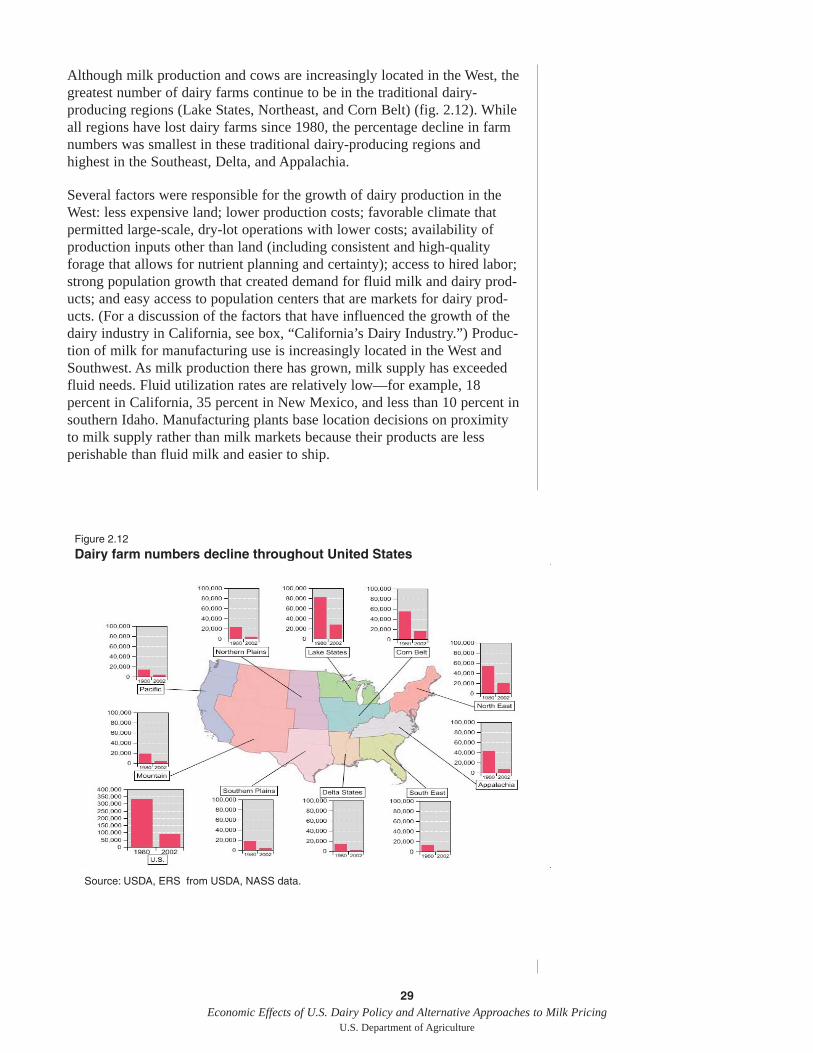
Although milk production and cows are increasingly located in the West, thegreatest number of dairy farms continue to be in the traditional dairy-producing regions (Lake States, Northeast, and Corn Belt) (fig. 2.12). Whileall regions have lost dairy farms since 1980, the percentage decline in farmnumbers was smallest in these traditional dairy-producing regions andhighest in the Southeast, Delta, and Appalachia.
Several factors were responsible for the growth of dairy production in theWest: less expensive land; lower production costs; favorable climate thatpermitted large-scale, dry-lot operations with lower costs; availability ofproduction inputs other than land (including consistent and high-qualityforage that allows for nutrient planning and certainty); access to hired labor;strong population growth that created demand for fluid milk and dairy prod-ucts; and easy access to population centers that are markets for dairy prod-ucts. (For a discussion of the factors that have influenced the growth of thedairy industry in California, see box, “California’s Dairy Industry.”) Produc-tion of milk for manufacturing use is increasingly located in the West andSouthwest. As milk production there has grown, milk supply has exceededfluid needs. Fluid utilization rates are relatively low—for example, 18percent in California, 35 percent in New Mexico, and less than 10 percent insouthern Idaho. Manufacturing plants base location decisions on proximityto milk supply rather than milk markets because their products are lessperishable than fluid milk and easier to ship.
29Economic Effects of U.S. Dairy Policy and Alternative Approaches to Milk Pricing
U.S. Department of Agriculture
Figure 2.12
Dairy farm numbers decline throughout United States
Source: USDA, ERS from USDA, NASS data.
U.S.
30Economic Effects of U.S. Dairy Policy and Alternative Approaches to Milk Pricing
U.S. Department of Agriculture
Changing economics of the dairy farm
Changes in farm income and the farm price of milk result from both marketforces and changes in the dairy program. These factors are affecting theeconomics of milk production and may be creating pressures for additionalchange in the sector.
Farm income and profitability. Many agricultural policies and programs,including those for dairy, are designed to raise the level of farm income.ERS research has shown that as the economic activities of farm householdshave broadened, household income, household wealth, and other measuresthat focus on the farm household are better indicators of the well-being offarm families than the traditional farm income measure (Mishra et al.,2002). Between 1991 and 2001, dairy farm household income was slightlylower on average than the income of all farm households—$48,500 versus$51,000—and was close to average U.S. household income (data are from
California’s Dairy Industry
California became the largest milk-producing state in 1993 and hascontinued to grow since. In 2003, it accounted for almost 21 percent oftotal U.S. milk production, and was also the largest producer of butter,nonfat dry milk, ice cream, cottage cheese, and whey protein concentrates.Cheese production is approaching that of the leading state, Wisconsin, andis projected to surpass it.
Climate, geography, natural resources, population, and technology havecontributed to milk production and industry structure in California. Analmost ideal climate provides a significant cost advantage relative to colderdairy-producing regions, and encourages large-scale intensive dairy opera-tions with related economies of scale. The climate also favors the produc-tion of high-quality alfalfa as well as a large variety of crops whosebyproducts are often cost-effective alternatives to conventional feeds. Cali-fornia milk production and milk and dairy product demand centers aregeographically isolated relative to the rest of the United States, which hastended to constrain milk shipments into and out of the State. Thus, Cali-fornia has always had to assure itself of sufficient in-State fluid milkprocessing capacity. California’s large and diverse population benefits theState’s dairy industry by providing growing demand for dairy products andthus an impetus for industry growth. California’s dairy industry has alsobenefited from early adoption of technology.
California suffers from irregularity of winter rain and snowpack that supplythe water to the State’s vast water storage and distribution system. Water is acrucial input for growing alfalfa, an important feed input to the dairyindustry. Among crops that benefit from water subsidies, alfalfa receivesthe largest water subsidy, about $70 million (Kuminoff et al., 2000).
Several factors could significantly change the trajectory of California’s dairyindustry, notably water issues and environmental concerns. Competition forwater supplies from a rapidly increasing population threatens agriculture’shistoric claims. Continued water availability in the future is likely aconstraint on, rather than an advantage to, dairy production in California.Larger dairies, like those that are typical of California, tend to be moreheavily targeted for environmental scrutiny (Jesse, 2002).
the Agricultural Resource Management Survey, or ARMS—see box, “Agri-cultural Resource Management System (ARMS) Data”). During this period,dairy farm household income ranged from 75 percent of the average incomefor all U.S. households in 1994 to 120 percent in 1999 and 2001.
Off-farm income, which includes earnings from off-farm employment,income from nonfarm businesses, pensions, and earnings from varioushousehold assets, has become more important to U.S. farm households formeeting household expenses (Mishra et al., 2002). Between 1991 and 2001,dairy farm households received a smaller share of their income—about one-third—from off-farm sources, compared with almost 90 percent for allfarms. Larger dairy farms also receive a smaller share of household incomefrom off-farm sources. If the trend toward larger dairy farms continues, off-farm income could comprise an even smaller share of dairy farm householdincome in the future.
Dairy farming is labor- and management-intensive, leaving less time for off-farm work than many other types of farming. In 1997, 79 percent of dairyfarmers reported no off-farm work, compared with 42 percent of all farmers.Of those reporting any off-farm work, dairy farmers were much less likelythan farmers in general (about 40 percent compared with nearly 70 percent)to work off-farm 200 or more days—essentially full-time.
In addition to income level, variability of farm household income andhousehold wealth can affect the household’s financial well-being. Owing totheir dependence on farm income and the variation in dairy prices, dairyfarm households experienced higher levels of income variation than theother types of farms studied (Mishra et al., 2002). The wealth (net worth) ofdairy farm households was among the highest examined, but it is heldmostly as illiquid farm assets, reflecting the large investment in specializedequipment.
Dairy farm households are less likely to have off-farm income to supple-ment returns from milk production, so profitability of the dairy enterprise isimportant. A long-term concept of profitability is defined as the difference
31Economic Effects of U.S. Dairy Policy and Alternative Approaches to Milk Pricing
U.S. Department of Agriculture
Agricultural Resource Management System (ARMS) Data
The primary source of data for farm accounts, including householdincome, production costs, and farm profitability is the AgriculturalResource Management Survey (ARMS). The ARMS survey collects datafrom a sample of commercial farms that provides information about farmfinancial conditions and agricultural resource use and costs. ARMS surveydata provides valuable information on the financial condition of dairy farmhouseholds, including income, assets, and debts from farming and fromoff-farm sources. Examining the sources, levels, and variability of incomeand other measures of well-being may provide information not availableby focusing on performance of the farm business on how farm familieswill respond to changes in dairy policies and programs.
For more information on the ARMS survey and data, see the ARMSBriefing Room on the ERS web site at http://www.ers.usda.gov/Briefing/ARMS/.
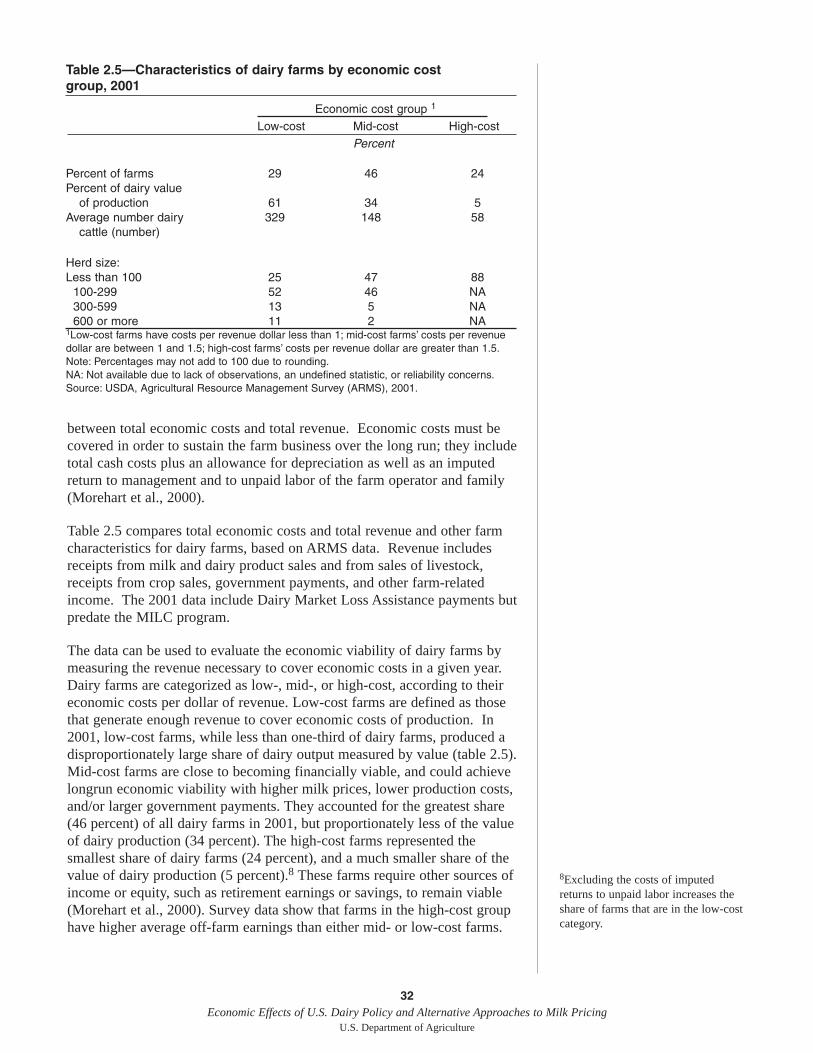
between total economic costs and total revenue. Economic costs must becovered in order to sustain the farm business over the long run; they includetotal cash costs plus an allowance for depreciation as well as an imputedreturn to management and to unpaid labor of the farm operator and family(Morehart et al., 2000).
Table 2.5 compares total economic costs and total revenue and other farmcharacteristics for dairy farms, based on ARMS data. Revenue includesreceipts from milk and dairy product sales and from sales of livestock,receipts from crop sales, government payments, and other farm-relatedincome. The 2001 data include Dairy Market Loss Assistance payments butpredate the MILC program.
The data can be used to evaluate the economic viability of dairy farms bymeasuring the revenue necessary to cover economic costs in a given year.Dairy farms are categorized as low-, mid-, or high-cost, according to theireconomic costs per dollar of revenue. Low-cost farms are defined as thosethat generate enough revenue to cover economic costs of production. In2001, low-cost farms, while less than one-third of dairy farms, produced adisproportionately large share of dairy output measured by value (table 2.5).Mid-cost farms are close to becoming financially viable, and could achievelongrun economic viability with higher milk prices, lower production costs,and/or larger government payments. They accounted for the greatest share(46 percent) of all dairy farms in 2001, but proportionately less of the valueof dairy production (34 percent). The high-cost farms represented thesmallest share of dairy farms (24 percent), and a much smaller share of thevalue of dairy production (5 percent).8 These farms require other sources ofincome or equity, such as retirement earnings or savings, to remain viable(Morehart et al., 2000). Survey data show that farms in the high-cost grouphave higher average off-farm earnings than either mid- or low-cost farms.
32Economic Effects of U.S. Dairy Policy and Alternative Approaches to Milk Pricing
U.S. Department of Agriculture
Table 2.5—Characteristics of dairy farms by economic cost group, 2001
Economic cost group 1
Low-cost Mid-cost High-costPercent
Percent of farms 29 46 24Percent of dairy value
of production 61 34 5Average number dairy 329 148 58
cattle (number)
Herd size:Less than 100 25 47 88
100-299 52 46 NA300-599 13 5 NA600 or more 11 2 NA
1Low-cost farms have costs per revenue dollar less than 1; mid-cost farms’ costs per revenuedollar are between 1 and 1.5; high-cost farms’ costs per revenue dollar are greater than 1.5.Note: Percentages may not add to 100 due to rounding.NA: Not available due to lack of observations, an undefined statistic, or reliability concerns.Source: USDA, Agricultural Resource Management Survey (ARMS), 2001.
8Excluding the costs of imputedreturns to unpaid labor increases theshare of farms that are in the low-costcategory.
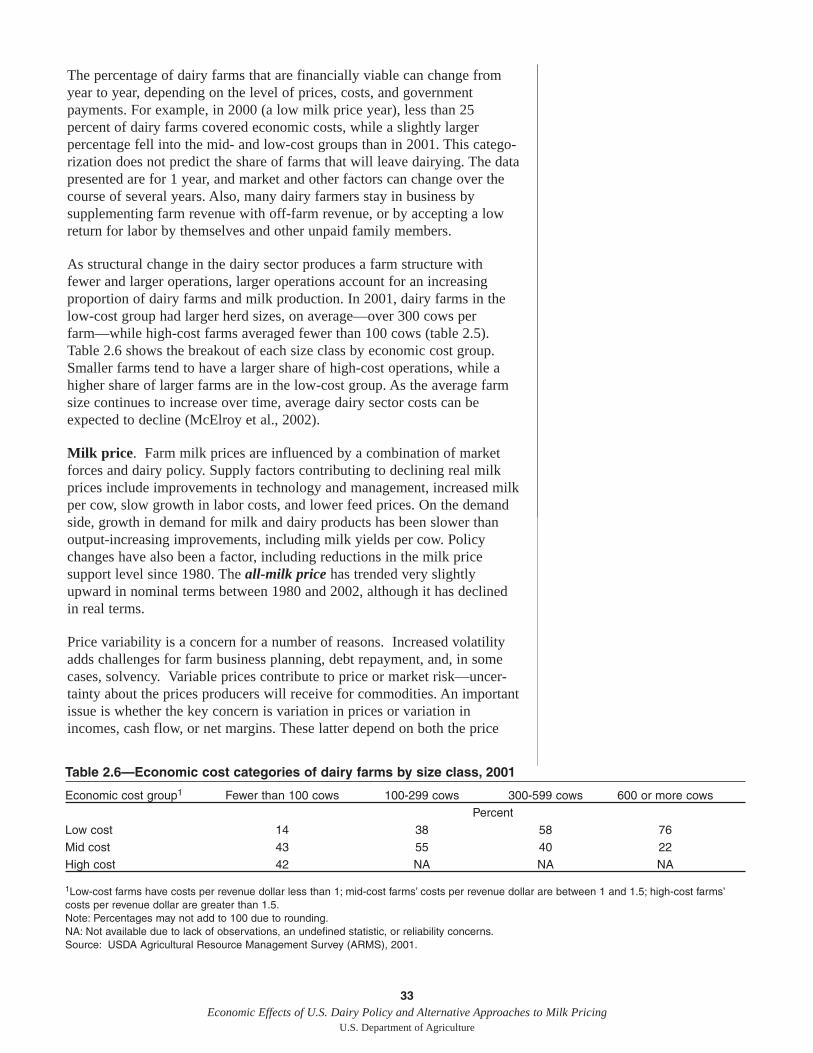
The percentage of dairy farms that are financially viable can change fromyear to year, depending on the level of prices, costs, and governmentpayments. For example, in 2000 (a low milk price year), less than 25percent of dairy farms covered economic costs, while a slightly largerpercentage fell into the mid- and low-cost groups than in 2001. This catego-rization does not predict the share of farms that will leave dairying. The datapresented are for 1 year, and market and other factors can change over thecourse of several years. Also, many dairy farmers stay in business bysupplementing farm revenue with off-farm revenue, or by accepting a lowreturn for labor by themselves and other unpaid family members.
As structural change in the dairy sector produces a farm structure withfewer and larger operations, larger operations account for an increasingproportion of dairy farms and milk production. In 2001, dairy farms in thelow-cost group had larger herd sizes, on average—over 300 cows perfarm—while high-cost farms averaged fewer than 100 cows (table 2.5).Table 2.6 shows the breakout of each size class by economic cost group.Smaller farms tend to have a larger share of high-cost operations, while ahigher share of larger farms are in the low-cost group. As the average farmsize continues to increase over time, average dairy sector costs can beexpected to decline (McElroy et al., 2002).
Milk price. Farm milk prices are influenced by a combination of marketforces and dairy policy. Supply factors contributing to declining real milkprices include improvements in technology and management, increased milkper cow, slow growth in labor costs, and lower feed prices. On the demandside, growth in demand for milk and dairy products has been slower thanoutput-increasing improvements, including milk yields per cow. Policychanges have also been a factor, including reductions in the milk pricesupport level since 1980. The all-milk price has trended very slightlyupward in nominal terms between 1980 and 2002, although it has declinedin real terms.
Price variability is a concern for a number of reasons. Increased volatilityadds challenges for farm business planning, debt repayment, and, in somecases, solvency. Variable prices contribute to price or market risk—uncer-tainty about the prices producers will receive for commodities. An importantissue is whether the key concern is variation in prices or variation inincomes, cash flow, or net margins. These latter depend on both the price
33Economic Effects of U.S. Dairy Policy and Alternative Approaches to Milk Pricing
U.S. Department of Agriculture
Table 2.6—Economic cost categories of dairy farms by size class, 2001
Economic cost group1 Fewer than 100 cows 100-299 cows 300-599 cows 600 or more cowsPercent
Low cost 14 38 58 76Mid cost 43 55 40 22High cost 42 NA NA NA
1Low-cost farms have costs per revenue dollar less than 1; mid-cost farms’ costs per revenue dollar are between 1 and 1.5; high-cost farms’costs per revenue dollar are greater than 1.5.Note: Percentages may not add to 100 due to rounding.NA: Not available due to lack of observations, an undefined statistic, or reliability concerns.Source: USDA Agricultural Resource Management Survey (ARMS), 2001.
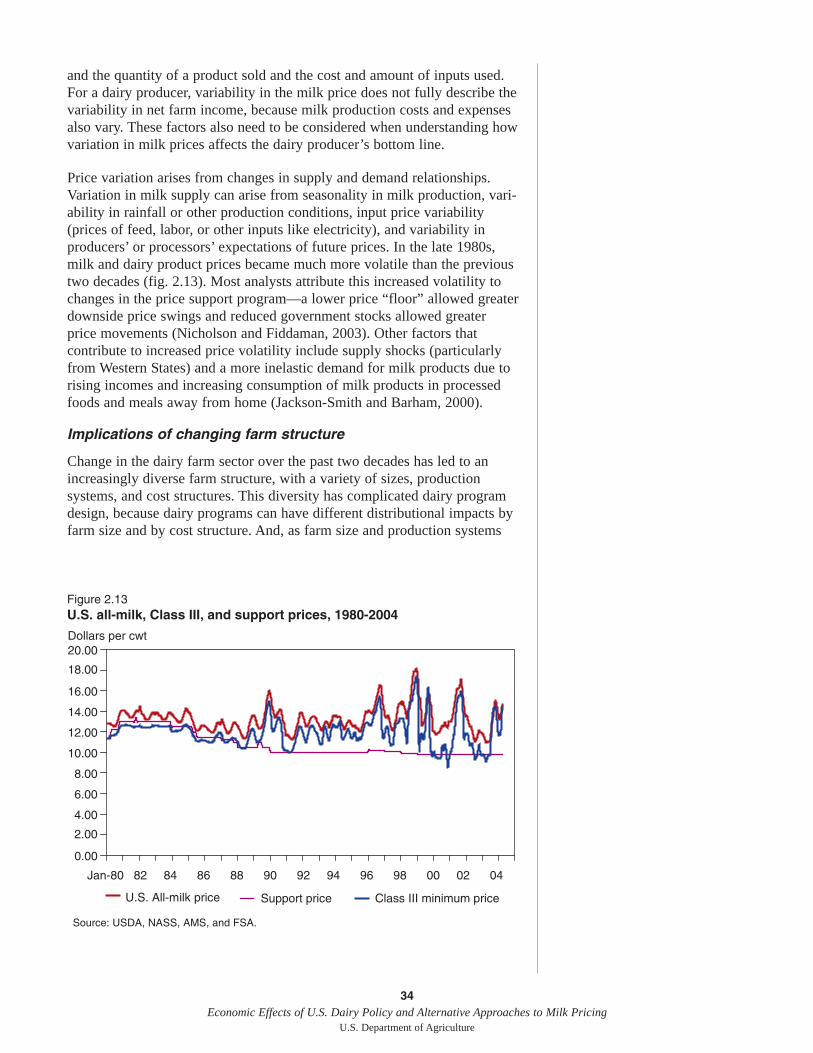
and the quantity of a product sold and the cost and amount of inputs used.For a dairy producer, variability in the milk price does not fully describe thevariability in net farm income, because milk production costs and expensesalso vary. These factors also need to be considered when understanding howvariation in milk prices affects the dairy producer’s bottom line.
Price variation arises from changes in supply and demand relationships.Variation in milk supply can arise from seasonality in milk production, vari-ability in rainfall or other production conditions, input price variability(prices of feed, labor, or other inputs like electricity), and variability inproducers’ or processors’ expectations of future prices. In the late 1980s,milk and dairy product prices became much more volatile than the previoustwo decades (fig. 2.13). Most analysts attribute this increased volatility tochanges in the price support program—a lower price “floor” allowed greaterdownside price swings and reduced government stocks allowed greaterprice movements (Nicholson and Fiddaman, 2003). Other factors thatcontribute to increased price volatility include supply shocks (particularlyfrom Western States) and a more inelastic demand for milk products due torising incomes and increasing consumption of milk products in processedfoods and meals away from home (Jackson-Smith and Barham, 2000).
Implications of changing farm structure
Change in the dairy farm sector over the past two decades has led to anincreasingly diverse farm structure, with a variety of sizes, productionsystems, and cost structures. This diversity has complicated dairy programdesign, because dairy programs can have different distributional impacts byfarm size and by cost structure. And, as farm size and production systems
34Economic Effects of U.S. Dairy Policy and Alternative Approaches to Milk Pricing
U.S. Department of Agriculture
Figure 2.13U.S. all-milk, Class III, and support prices, 1980-2004
0.00
2.00
4.00
6.00
8.00
10.00
12.00
14.00
16.00
18.00
20.00
U.S. All-milk price Support price
Source: USDA, NASS, AMS, and FSA.
Dollars per cwt
Class III minimum price
Jan-80 82 84 86 88 90 92 94 96 98 00 02 04
tend to vary by region, dairy programs can have different regional impacts.Increased diversity has created new policy challenges to address the effectsof adjustment to changing market shares, new production patterns, andincreased competition for a market that is growing more slowly than milkproduction capacity.
Conclusions
With per capita consumption flat or declining for almost all products exceptcheese, higher output at the farm level has led to lower real producer prices.Declining real prices have pressured dairy farmers to expand herds, adoptlower cost production systems, or exit dairying, leading to continued struc-tural adjustment. Attempts to shelter dairy farmers from a set of diverse,powerful forces with a complex web of policies including price supports,import protection, regulated minimum pricing, and direct payments havedone little to prevent structural change. The rate of structural change in thedairy sector is likely to accelerate as new technologies appear, and otherfactors (environmental regulation, land use, and contractual arrangements)continue the pressure for further consolidation and structural change(Anderson et al., 2003).
35Economic Effects of U.S. Dairy Policy and Alternative Approaches to Milk Pricing
U.S. Department of Agriculture
Public Policy in the Dairy Industry“National dairy policy,” as defined in the Congressional mandate, includesthe following U.S. dairy programs:
• Federal milk marketing orders,• the Federal milk price support program,• State pricing programs and State mandated over-order premiums,1
• interstate dairy compacts,2
• direct payments to milk producers, and• export programs such as the dairy export incentive program
(DEIP).3
The above list is not exhaustive, and excludes import protection; supplymanagement programs; demand enhancement programs; milk safety, sani-tary, and environmental regulations; antitrust regulations (and limitedexemptions); programs affecting input pricing and availability (like the feedgrains program); and interactions with other commodity programs, amongothers. These programs are assumed to continue in their present form inorder to isolate the effects of U.S. dairy policies identified in the mandate.Export credit programs, while a type of export program, are not evaluatedbecause they are available for a range of commodities.
Policy or program objectives underlay a comprehensive evaluation of theeconomic effects of national dairy policy. Dairy program objectives, asstated in public documents such as authorizing legislation or mission state-ments of implementing agencies, are usually broad statements of purpose.Policy objectives may also be inferred from program provisions or opera-tions. Generally, dairy policy seeks to enhance dairy producers’ incomes,either directly through payments, or—more frequently—indirectly throughprice; and to maintain rural farm communities by promoting value-addedagricultural activity (Hamm, 1991). Specific objectives vary according toeach program, and include the support and stabilization of dairy farmincomes, ensuring stable and adequate supplies of milk and dairy products,providing stable marketing conditions for farm milk, and developing exportmarkets for dairy products.
Table 3.1 presents an overview of the main U.S. dairy programs discussedin this report. Each program is related to its objectives, the main instru-ments used by each program, and the dairy products that each programtargets directly.
Several existing dairy programs were originally designed to deal with theindustry structures and economic failures of the 1930s. While the details ofthe programs have changed since then, their basic objectives and frame-works have remained largely the same. Seventy years ago, milk use wasdominated by fluid consumption, markets were predominantly local, andmany dairy enterprises were part of diversified farming operations. Today,consumption of cheese (rather than fluid milk) is the major use for milk,dairy product markets are increasingly national in scope, most dairy farmsare highly specialized, and many are large-scale industrial operations. These
36Economic Effects of U.S. Dairy Policy and Alternative Approaches to Milk Pricing
U.S. Department of Agriculture
1The qualifier “State-mandated” hasbeen added by the authors to distin-guish over-order premiums regulatedby State dairy programs from market-generated over-order premiums thatare not part of any dairy program.2Interstate dairy compacts are not partof current dairy programs.3This chapter is intended to provide anoverview only of the programs listed.For detailed information on programoperations, the reader is referred to theweb sites of the USDA program agen-cies, provided in the References.
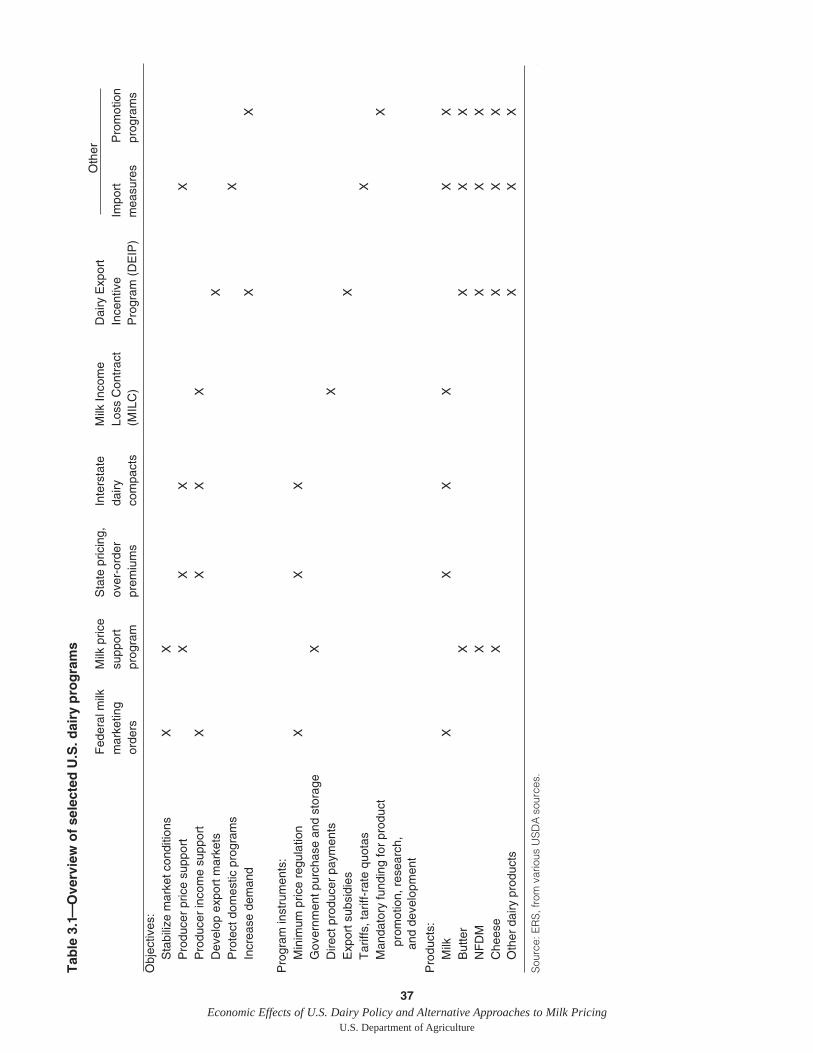
37Economic Effects of U.S. Dairy Policy and Alternative Approaches to Milk Pricing
U.S. Department of Agriculture
Tab
le 3
.1
Ove
rvie
w o
f se
lect
ed U
.S. d
airy
pro
gra
ms
Fed
eral
milk
Milk
pric
e S
tate
pric
ing,
Inte
rsta
teM
ilk In
com
e D
airy
Exp
ort
mar
ketin
g
supp
ort
over
-ord
er
dairy
Lo
ss C
ontr
act
Ince
ntiv
eIm
port
P
rom
otio
n
orde
rspr
ogra
mpr
emiu
ms
com
pact
s(M
ILC
)P
rogr
am (
DE
IP)
mea
sure
spr
ogra
ms
Obj
ectiv
es:
S
tabi
lize
mar
ket c
ondi
tions
XX
P
rodu
cer
pric
e su
ppor
tX
XX
X
Pro
duce
r in
com
e su
ppor
tX
XX
X
Dev
elop
exp
ort m
arke
tsX
P
rote
ct d
omes
tic p
rogr
ams
X
Incr
ease
dem
and
XX
Pro
gram
inst
rum
ents
:
Min
imum
pric
e re
gula
tion
XX
X
Gov
ernm
ent p
urch
ase
and
stor
age
X
Dire
ct p
rodu
cer
paym
ents
X
E
xpor
t sub
sidi
esX
T
ariff
s, ta
riff-
rate
quo
tas
X
Man
dato
ry fu
ndin
g fo
r pr
oduc
tX
pro
mot
ion,
res
earc
h,
and
dev
elop
men
t
Pro
duct
s:
Milk
XX
XX
XX
B
utte
rX
XX
X
NF
DM
XX
XX
C
hees
eX
XX
X
Oth
er d
airy
pro
duct
sX
XX
Sou
rce:
ER
S, f
rom
var
ious
US
DA
sou
rces
.
Oth
er
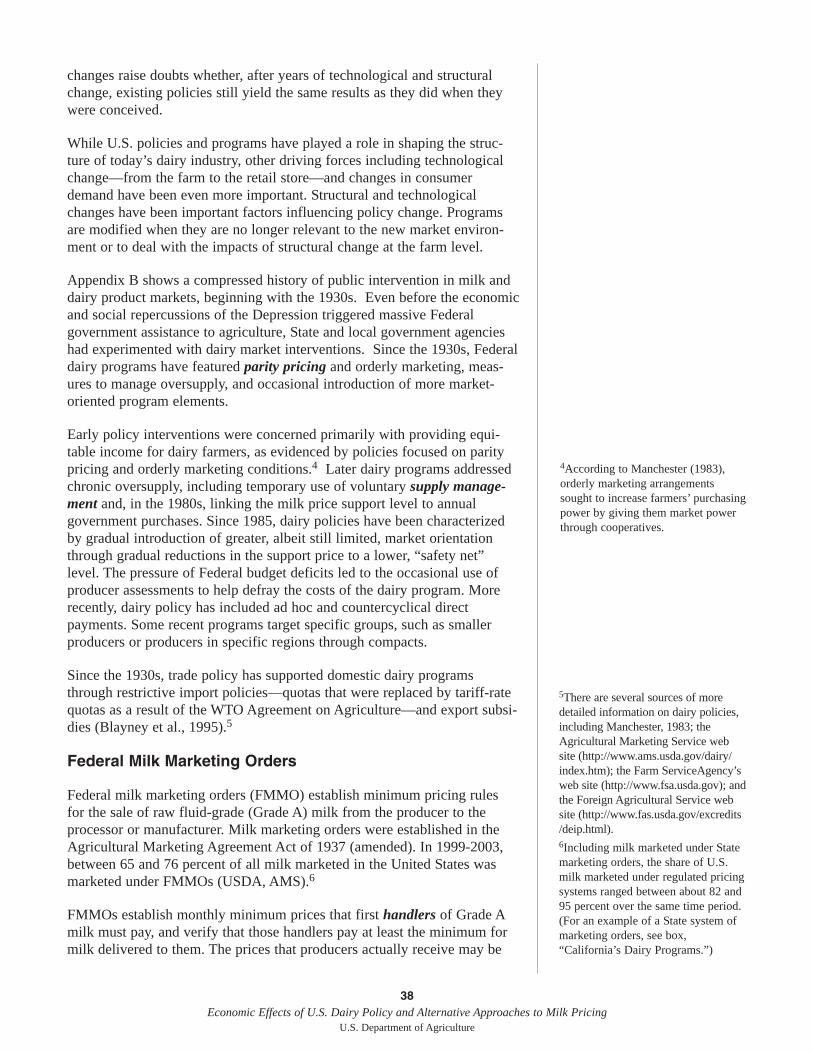
changes raise doubts whether, after years of technological and structuralchange, existing policies still yield the same results as they did when theywere conceived.
While U.S. policies and programs have played a role in shaping the struc-ture of today’s dairy industry, other driving forces including technologicalchange—from the farm to the retail store—and changes in consumerdemand have been even more important. Structural and technologicalchanges have been important factors influencing policy change. Programsare modified when they are no longer relevant to the new market environ-ment or to deal with the impacts of structural change at the farm level.
Appendix B shows a compressed history of public intervention in milk anddairy product markets, beginning with the 1930s. Even before the economicand social repercussions of the Depression triggered massive Federalgovernment assistance to agriculture, State and local government agencieshad experimented with dairy market interventions. Since the 1930s, Federaldairy programs have featured parity pricing and orderly marketing, meas-ures to manage oversupply, and occasional introduction of more market-oriented program elements.
Early policy interventions were concerned primarily with providing equi-table income for dairy farmers, as evidenced by policies focused on paritypricing and orderly marketing conditions.4 Later dairy programs addressedchronic oversupply, including temporary use of voluntary supply manage-ment and, in the 1980s, linking the milk price support level to annualgovernment purchases. Since 1985, dairy policies have been characterizedby gradual introduction of greater, albeit still limited, market orientationthrough gradual reductions in the support price to a lower, “safety net”level. The pressure of Federal budget deficits led to the occasional use ofproducer assessments to help defray the costs of the dairy program. Morerecently, dairy policy has included ad hoc and countercyclical directpayments. Some recent programs target specific groups, such as smallerproducers or producers in specific regions through compacts.
Since the 1930s, trade policy has supported domestic dairy programsthrough restrictive import policies—quotas that were replaced by tariff-ratequotas as a result of the WTO Agreement on Agriculture—and export subsi-dies (Blayney et al., 1995).5
Federal Milk Marketing Orders
Federal milk marketing orders (FMMO) establish minimum pricing rulesfor the sale of raw fluid-grade (Grade A) milk from the producer to theprocessor or manufacturer. Milk marketing orders were established in theAgricultural Marketing Agreement Act of 1937 (amended). In 1999-2003,between 65 and 76 percent of all milk marketed in the United States wasmarketed under FMMOs (USDA, AMS).6
FMMOs establish monthly minimum prices that first handlers of Grade Amilk must pay, and verify that those handlers pay at least the minimum formilk delivered to them. The prices that producers actually receive may be
38Economic Effects of U.S. Dairy Policy and Alternative Approaches to Milk Pricing
U.S. Department of Agriculture
4According to Manchester (1983),orderly marketing arrangementssought to increase farmers’ purchasingpower by giving them market powerthrough cooperatives.
5There are several sources of moredetailed information on dairy policies,including Manchester, 1983; theAgricultural Marketing Service website (http://www.ams.usda.gov/dairy/index.htm); the Farm ServiceAgency’sweb site (http://www.fsa.usda.gov); andthe Foreign Agricultural Service website (http://www.fas.usda.gov/excredits/deip.html).6Including milk marketed under Statemarketing orders, the share of U.S.milk marketed under regulated pricingsystems ranged between about 82 and95 percent over the same time period.(For an example of a State system ofmarketing orders, see box,“California’s Dairy Programs.”)
higher, depending on market conditions. The differences between actualprices paid and the Federal order minimum price are called over-orderpayments, are market-generated, and paid outside of the order system.
A system of classified pricing establishes minimum prices for each enduse—the fluid (class I) price is the highest, reflecting the higher cost ofservicing the fluid market. Formulas relate the minimum prices for milk ineach class to wholesale market prices for dairy products, which in turn areinfluenced by the milk price support program (fig. 3.1). The minimum pricepaid to producers is a blend price of all uses at the FMMO minimum Classprices (see box, “How Federal Milk Marketing Order Pricing Works”).
Class I prices vary across the Federal milk order system. The Class I milkprice is the higher of the Class III or IV price plus a location differential(Class I differential) specific to each pricing point in the country.7 Regionaldifferences among Class I differentials reflect the variation in the value ofmilk across regions. Class I differentials are set to encourage the movementof milk from milk-surplus areas into the milk-deficit areas (USDA, AMS,1999). Despite that, substantial over-order premiums generated by themarket are frequently needed to move milk to where it is needed to satisfyfluid demand.
Federal milk marketing orders were established during the 1930s to dealwith the collapse of prices in milk markets and the seasonal loss of marketsfor many producers. FMMO evolved to address concerns that arise from thefollowing characteristics of the milk market:
• raw milk is highly perishable; • raw milk buyers are relatively concentrated compared with milk
sellers;
39Economic Effects of U.S. Dairy Policy and Alternative Approaches to Milk Pricing
U.S. Department of Agriculture
7The Class I price differential is theamount added to a manufacturing milkprice (the higher of the Class III orClass IV price) to derive the Class Imilk price. It provides a minimumprice that is reflective of the locationvalue of milk.
Figure 3.1
Linkages between the milk price support program and the FederalMilk Marketing Orders
Farm milk Marketprice effects
Milk production Milk
(marketings)use
Milk productionMinimum blend
costsprice
Milk support priceMinimumprices:
Support purchase Wholesale Class Iprices for products product prices
Milk price support program Class III
Class IV
Federal Milk Marketing Orders
Source: Manchester and Blayney, 2001.
Class II
40Economic Effects of U.S. Dairy Policy and Alternative Approaches to Milk Pricing
U.S. Department of Agriculture
9For more information on how produc-er cooperatives interact with Federalmilk marketing orders, see the discus-sion of dairy cooperatives in “TheEvolution of the Modern DairyIndustry,” and Cropp, 2003.
• fluid product and manufactured product demands are different, as are the costs of servicing those markets; and
• quantity of milk produced and quantity of milk demanded have different temporal patterns.
For example, Class I prices under Federal orders are set high enough toensure that there will be sufficient supplies of perishable fluid milk to meetpeak demand, while stabilizing the price to producers despite seasonal,weekly, or daily variability of production. In addition, requiring manufac-turers and processors to pay minimum prices for milk was intended tobalance the market power between producers and processors.
However, some of the characteristics of the milk market that gave rise tothe order system were more prominent in the context of the technology andmarket structure of the early-to-mid twentieth century—advances in trans-portation and storage technologies, for example, have reduced (although noteliminated) marketing problems associated with perishability. Consolidationamong dairy cooperatives and their increased share of milk marketings mayhave gone a long way toward redressing the imbalance in market powerbetween milk sellers (producers, through cooperatives) and buyers (milkprocessors and dairy product manufacturers).8 Cooperatives now bearmore of the costs of coordinating and marketing milk from farm to plants.Other factors—like the disparity in timing between milk production anddemand—still characterize dairy markets, although their impact on marketflows is diminished. Because milk marketing orders—both Federal andState—have been in effect for so long, it is difficult to determine the extentto which these characteristics would emerge in the absence of FMMOs.
FMMOs are fundamentally aimed at equalizing competition betweenproprietary handlers and producers and promoting a greater degree ofstability in marketing relationships.9 Such a system effectively prevents aconcentrated processing sector from exercising noncompetitive marketpower over milk producers by establishing minimum prices that all proces-sors must pay for milk. Discriminatory pricing, to the extent that pricesdiffer by more than the additional transportation and other costs entailed inmeeting Class I demand, can increase revenue by charging a higher price ina market with more inelastic demand (where consumption is relativelyunresponsive to price changes), and a lower price in a market with lessinelastic (more price-responsive) demand (Tomek and Robinson, 1972;Manchester, 1983). Demand for fluid milk tends to be more inelastic thanthe demand for manufactured products. Thus, increasing the fluid price canincrease total producer returns.
Milk marketing orders can have important impacts on the consumption ofdairy products through their effects on prices. To the extent that classifiedpricing under the Federal (and some State) milk marketing orders raises theprice of fluid milk and milk used in soft dairy products (cream products,cottage cheese, ice cream and related products) above what it would be inan unregulated market, the quantities demanded of these products arereduced. This increases the quantity of milk available for manufacturinguses (cheese, butter, and dried milk products), and lowers the price ofGrade A milk used in manufacturing, increasing consumption of manufac-tured dairy products. Pooling milk revenues from all uses also provides
8However, the processing industry hasfurther concentrated as well. See thediscussion of concentration amongcooperatives and processors in “TheEvolution of the Modern DairyIndustry.”
incentives for production of manufacturing milk—a dairy farmer producingmainly milk for manufacturing may receive a higher price because receiptsfrom the sale of manufacturing milk are pooled with receipts from higherpriced fluid milk sales (see box, “How Federal Milk Marketing OrderPricing Works,” for an example of how revenue pooling works). This situa-tion provides incentives for production of manufacturing milk and manufac-tured dairy products, resulting in lower prices and increased consumption.
In the Federal Agriculture Improvement and Reform Act of 1996, Congressmandated that the number of milk marketing orders be reduced and thatseveral pricing issues be reexamined. The reform of the Federal milkmarketing order system, effective January 1, 2000, reduced the number ofFederal milk marketing orders from 31 to 11 to better reflect movements ofmilk, natural market boundaries, and existing institutional or marketarrangements (USDA, AMS, 1999). It also made changes to pricing provi-sions, establishing a new Class I pricing structure, and established newminimum pricing formulas for Class II, III, and IV milk. The purpose of thepricing provision changes was to provide incentives for greater structuralefficiencies in the assembly and shipment of milk for fluid milk productswhile maintaining equity among processors of fluid milk selling inmarketing order areas and among dairy farmers supplying milk for fluidmarkets (USDA, AMS, 1999).
41Economic Effects of U.S. Dairy Policy and Alternative Approaches to Milk Pricing
U.S. Department of Agriculture
How Federal Milk Marketing Order Pricing Works
Two concepts form the core of Federal milk marketing orders: classifiedpricing and market-wide revenue pooling. Classified pricing means thatmilk is priced based on its end use or “class.” Under revenue pooling, allproducers selling milk under a particular milk marketing order share equi-tably in the market’s revenue through a “uniform” or “blend” price, adjustedfor location. Federal order minimum blend prices are the outcome of anaccounting of how much milk is purchased by regulated handlers, and howthat milk is used.
Classified pricing
Federal milk marketing orders establish minimum prices that regulatedhandlers must pay for Grade A milk 10 based on its use. The prices set areminimums—producers and/or their cooperatives are free to negotiate forprices above the minimum with the handlers buying their milk (Blayney etal., 1995). Market conditions and services provided by producers or theircooperatives can and often do lead to prices higher than the minimums.
There are four classes of milk under Federal orders; each class depends onhow the milk is used:
Class I: Beverage (fluid) milk.
Class II: Fluid cream products, yogurt, perishable manufactured products (ice cream, cottage cheese, and others).
Class III: Cream cheese and hard manufactured cheese.
Class IV: Butter and milk in dried form.
10Grade A milk is milk that is pro-duced under sanitary conditions thatqualify it for fluid (beverage) con-sumption, although it may also beused to produce other products. GradeA is a quality designation, while theclass price is based on how the milk isused.
Continued on page 42
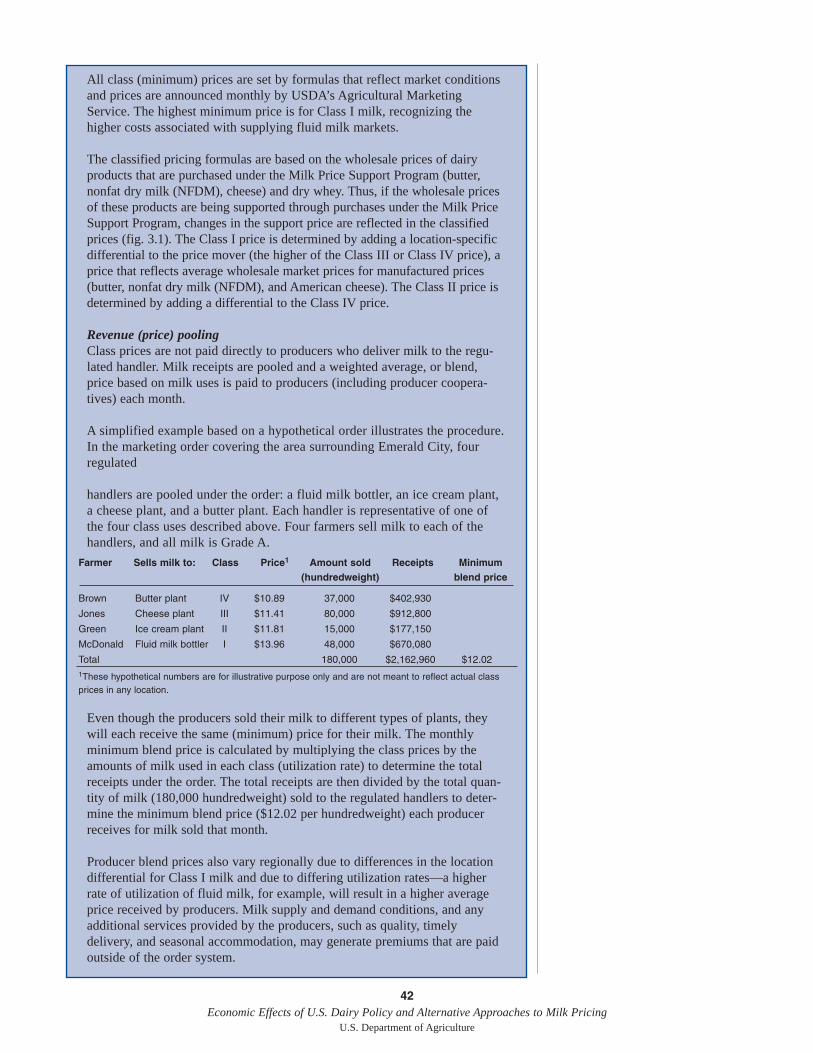
42Economic Effects of U.S. Dairy Policy and Alternative Approaches to Milk Pricing
U.S. Department of Agriculture
All class (minimum) prices are set by formulas that reflect market conditionsand prices are announced monthly by USDA’s Agricultural MarketingService. The highest minimum price is for Class I milk, recognizing thehigher costs associated with supplying fluid milk markets.
The classified pricing formulas are based on the wholesale prices of dairyproducts that are purchased under the Milk Price Support Program (butter,nonfat dry milk (NFDM), cheese) and dry whey. Thus, if the wholesale pricesof these products are being supported through purchases under the Milk PriceSupport Program, changes in the support price are reflected in the classifiedprices (fig. 3.1). The Class I price is determined by adding a location-specificdifferential to the price mover (the higher of the Class III or Class IV price), aprice that reflects average wholesale market prices for manufactured prices(butter, nonfat dry milk (NFDM), and American cheese). The Class II price isdetermined by adding a differential to the Class IV price.
Revenue (price) poolingClass prices are not paid directly to producers who deliver milk to the regu-lated handler. Milk receipts are pooled and a weighted average, or blend,price based on milk uses is paid to producers (including producer coopera-tives) each month.
A simplified example based on a hypothetical order illustrates the procedure.In the marketing order covering the area surrounding Emerald City, fourregulated
handlers are pooled under the order: a fluid milk bottler, an ice cream plant,a cheese plant, and a butter plant. Each handler is representative of one ofthe four class uses described above. Four farmers sell milk to each of thehandlers, and all milk is Grade A.
Even though the producers sold their milk to different types of plants, theywill each receive the same (minimum) price for their milk. The monthlyminimum blend price is calculated by multiplying the class prices by theamounts of milk used in each class (utilization rate) to determine the totalreceipts under the order. The total receipts are then divided by the total quan-tity of milk (180,000 hundredweight) sold to the regulated handlers to deter-mine the minimum blend price ($12.02 per hundredweight) each producerreceives for milk sold that month.
Producer blend prices also vary regionally due to differences in the locationdifferential for Class I milk and due to differing utilization rates—a higherrate of utilization of fluid milk, for example, will result in a higher averageprice received by producers. Milk supply and demand conditions, and anyadditional services provided by the producers, such as quality, timelydelivery, and seasonal accommodation, may generate premiums that are paidoutside of the order system.
Farmer Sells milk to: Class Price1 Amount sold Receipts Minimum(hundredweight) blend price
Brown Butter plant IV $10.89 37,000 $402,930
Jones Cheese plant III $11.41 80,000 $912,800
Green Ice cream plant II $11.81 15,000 $177,150
McDonald Fluid milk bottler I $13.96 48,000 $670,080
Total 180,000 $2,162,960 $12.021These hypothetical numbers are for illustrative purpose only and are not meant to reflect actual classprices in any location.
Federal Milk Price Support Program
The Federal milk price support program was first authorized by the Agricul-tural Adjustment Act of 1933. Permanent authority for milk price supportwas provided by the Agricultural Act of 1949. Under the 1949 Act, whichis currently suspended, the Secretary of Agriculture is directed to supportthe price of manufacturing grade milk through Commodity Credit Corpora-tion (CCC) purchases of manufactured dairy products (mainly butter, nonfatdry milk, and cheese) at between 75 and 90 percent of parity (a price basedon the relationship between farm milk prices and prices of farm inputs in abase period). These purchase prices are set at levels that enable manufac-turers of average efficiency to pay farmers the support price for milk.
Farmers can receive more or less than the support price, depending onsupply and demand conditions and market competitiveness. Plant location,the type of product manufactured, the quantity of milk delivered, milkcomposition, local competition between users of milk supplies, and plantoperating efficiency all play a role in determining the price individual dairyfarmers receive for their milk (Blayney et al., 1995). The dairy price supportprogram supports the price of all dairy products in the United States.
For the first several decades of the program, the milk support price wasestablished to maintain parity pricing. In the 1980s, concern overburgeoning stocks and rising program costs led Congress to sever the linkbetween the support price and parity and gradually lower the support price.In 1988-95, triggers related to quantities of products purchased were used toprompt changes in the price support level.
The Federal Agriculture Improvement and Reform Act of 1996 (the 1996Act) included a schedule for eliminating the support purchase program andreplacing it with a processor recourse loan program. In the late 1990s,responding to low dairy prices, Congress instituted emergency supplementalpayments to dairy producers and extended the support price program annu-ally. The 2002 Act authorizes the support purchase program at the fixedsupport level of $9.90 per hundredweight through 2007 (see box, “Adjust-ments in Dairy Product Purchase Prices”). While there has been very littlechange in the milk support price since 1990, overall it has declined over thelast two decades.
Outlays for product purchases and associated costs under the dairy pricesupport have been variable. Since the early-to-mid 1990s, expendituresrelated to purchases of butter and cheese have declined substantially, whileexpenditures on nonfat dry milk have risen (table 3.2). The decline in totalexpenditures under the dairy price support program reflects the reductions inthe milk support price in the mid-to-late 1980s (see fig. 2.13 in “The Evolu-tion of the Modern Dairy Industry”). Dairy product purchases were lower,on average, in the 1990s than in the previous decade, although purchases ofNFDM have risen in the past several years (fig. 3.2).
43Economic Effects of U.S. Dairy Policy and Alternative Approaches to Milk Pricing
U.S. Department of Agriculture
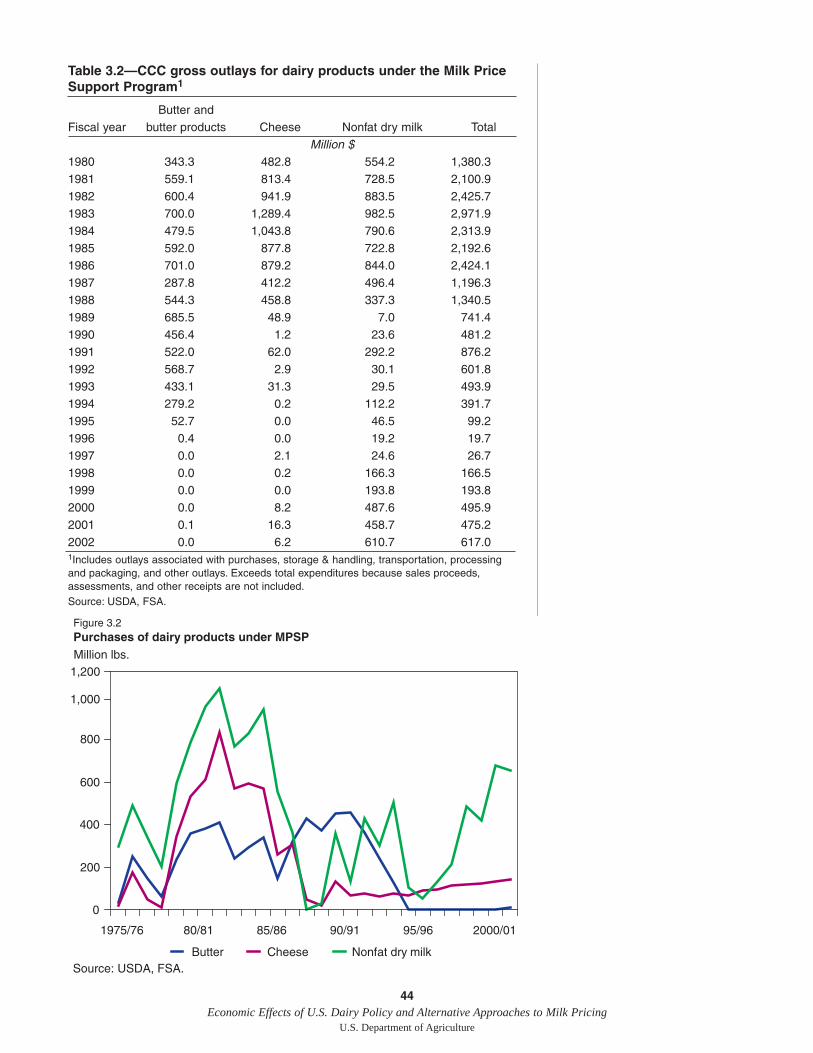
44Economic Effects of U.S. Dairy Policy and Alternative Approaches to Milk Pricing
U.S. Department of Agriculture
Table 3.2—CCC gross outlays for dairy products under the Milk PriceSupport Program1
Butter and Fiscal year butter products Cheese Nonfat dry milk Total
Million $1980 343.3 482.8 554.2 1,380.31981 559.1 813.4 728.5 2,100.91982 600.4 941.9 883.5 2,425.71983 700.0 1,289.4 982.5 2,971.91984 479.5 1,043.8 790.6 2,313.91985 592.0 877.8 722.8 2,192.61986 701.0 879.2 844.0 2,424.11987 287.8 412.2 496.4 1,196.31988 544.3 458.8 337.3 1,340.51989 685.5 48.9 7.0 741.41990 456.4 1.2 23.6 481.21991 522.0 62.0 292.2 876.21992 568.7 2.9 30.1 601.81993 433.1 31.3 29.5 493.91994 279.2 0.2 112.2 391.71995 52.7 0.0 46.5 99.21996 0.4 0.0 19.2 19.71997 0.0 2.1 24.6 26.71998 0.0 0.2 166.3 166.51999 0.0 0.0 193.8 193.82000 0.0 8.2 487.6 495.92001 0.1 16.3 458.7 475.22002 0.0 6.2 610.7 617.01Includes outlays associated with purchases, storage & handling, transportation, processingand packaging, and other outlays. Exceeds total expenditures because sales proceeds,assessments, and other receipts are not included.Source: USDA, FSA.
Figure 3.2Purchases of dairy products under MPSP
0
200
400
600
800
1,000
Butter Cheese Nonfat dry milk
1975/76 80/81 85/86 90/91 95/96 2000/01
Million lbs.1,200
Source: USDA, FSA.
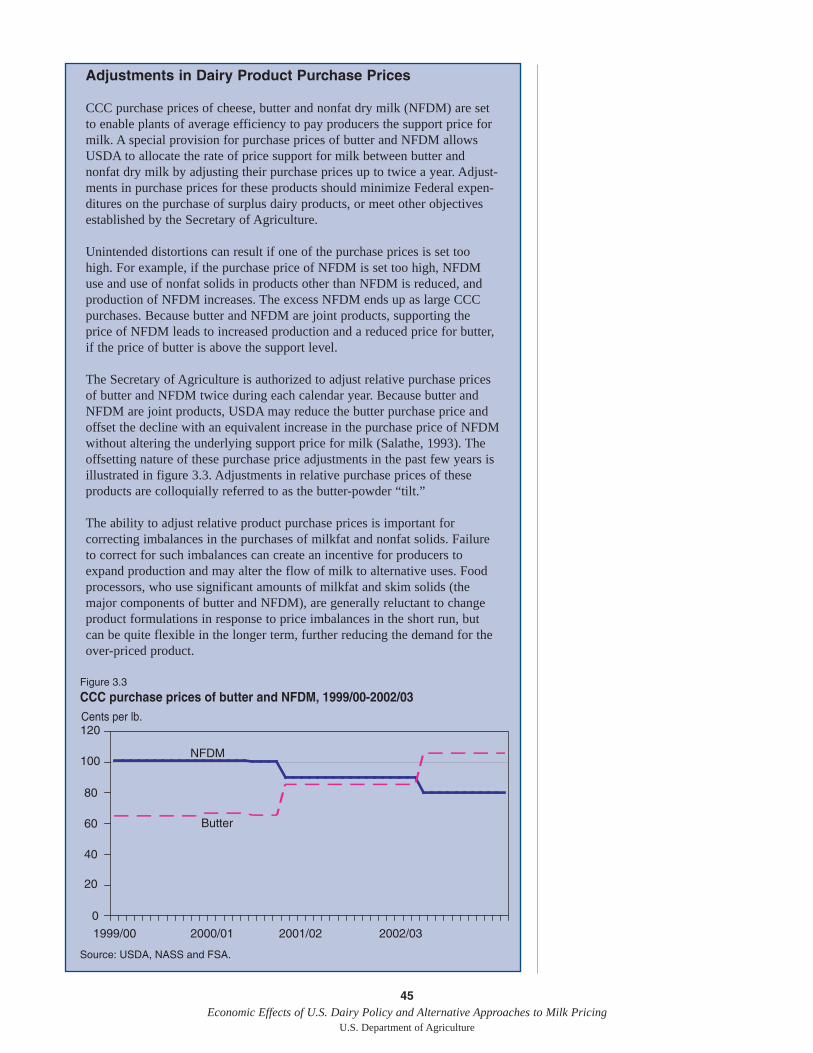
45Economic Effects of U.S. Dairy Policy and Alternative Approaches to Milk Pricing
U.S. Department of Agriculture
Adjustments in Dairy Product Purchase Prices
CCC purchase prices of cheese, butter and nonfat dry milk (NFDM) are setto enable plants of average efficiency to pay producers the support price formilk. A special provision for purchase prices of butter and NFDM allowsUSDA to allocate the rate of price support for milk between butter andnonfat dry milk by adjusting their purchase prices up to twice a year. Adjust-ments in purchase prices for these products should minimize Federal expen-ditures on the purchase of surplus dairy products, or meet other objectivesestablished by the Secretary of Agriculture.
Unintended distortions can result if one of the purchase prices is set toohigh. For example, if the purchase price of NFDM is set too high, NFDMuse and use of nonfat solids in products other than NFDM is reduced, andproduction of NFDM increases. The excess NFDM ends up as large CCCpurchases. Because butter and NFDM are joint products, supporting theprice of NFDM leads to increased production and a reduced price for butter,if the price of butter is above the support level.
The Secretary of Agriculture is authorized to adjust relative purchase pricesof butter and NFDM twice during each calendar year. Because butter andNFDM are joint products, USDA may reduce the butter purchase price andoffset the decline with an equivalent increase in the purchase price of NFDMwithout altering the underlying support price for milk (Salathe, 1993). Theoffsetting nature of these purchase price adjustments in the past few years isillustrated in figure 3.3. Adjustments in relative purchase prices of theseproducts are colloquially referred to as the butter-powder “tilt.”
The ability to adjust relative product purchase prices is important forcorrecting imbalances in the purchases of milkfat and nonfat solids. Failureto correct for such imbalances can create an incentive for producers toexpand production and may alter the flow of milk to alternative uses. Foodprocessors, who use significant amounts of milkfat and skim solids (themajor components of butter and NFDM), are generally reluctant to changeproduct formulations in response to price imbalances in the short run, butcan be quite flexible in the longer term, further reducing the demand for theover-priced product.
Figure 3.3
CCC purchase prices of butter and NFDM, 1999/00-2002/03
0
20
40
60
80
100
120
1999/00 2000/01 2001/02 2002/03
NFDM
Butter
Source: USDA, NASS and FSA.
Cents per lb.
State Pricing and State-Mandated Over-Order Premiums
Individual States began to consider intervention in milk and dairy productmarkets during the Depression following legal constraints on Federalactions to regulate intrastate activity through marketing agreements(Manchester, 1983).11 States focused first on price and income assistancefor dairy farmers, but many extended their reach to both wholesale andretail milk and dairy product prices. State action to support fluid milkprices was economically feasible because fluid milk was the major use andfluid markets were primarily within State boundaries.
The number of State milk pricing programs has declined significantly—particularly since the 1960s—as interstate transportation of bulk and pack-aged milk made it more difficult for States to control in-State milk prices(Alexander et al., 1998). In 1998, Alexander et al. listed nine States withactive State pricing or State-mandated over-order premium programs—Cali-fornia, Hawaii, Maine, Montana, Nevada, Western New York, NorthDakota, Pennsylvania, and Virginia. California is the largest major milk-producing State that currently has an extensive state-level milk-pricingprogram (see box, “California’s Dairy Programs”).
States have used several methods to establish farm-level milk prices. MostStates use regulatory authority to set minimum prices or mandate over-orderpremiums to be paid to producers above the Federal or State class price.These programs usually adopted the minimum Class I price in a nearbyFederal order as the starting point for establishing the in-State Class I price.Some States then added a mandated over-order premium to the FederalClass I price to arrive at the State Class I price. These prices are, likeFederal order prices, only minimums. For States, it is easier to control milkprices for fluid use because fluid markets tend to be more local in character.
Increasing market integration across State lines makes it difficult for indi-vidual States to operate over-order pricing plans.12 Today, Pennsylvania isthe only major dairy-producing State with over-order pricing. In addition,Pennsylvania uses wholesale and retail price control to prevent processorsfrom undercutting Pennsylvania prices with lower-priced milk from otherStates (Alexander et al., 1998).
Interstate Dairy Compacts
A compact between or among States is an agreement to regulate some areaof commerce that must be approved in identical form by each party (State)and authorized by the U.S. Congress. The authority for the Northeast Inter-state Dairy Compact (NEIDC) was included in the 1996 Act, subject to afinding by the Secretary of Agriculture of a compelling public interest in theCompact region. Connecticut, Maine, Massachusetts, New Hampshire,Rhode Island and Vermont were included in the NEIDC.
The NEIDC established a minimum price of $16.94 for Class I milk, themilk used in fluid beverage products, in Boston, MA. The Compact pricewas generally, although not always, above the Federal Milk Marketing
46Economic Effects of U.S. Dairy Policy and Alternative Approaches to Milk Pricing
U.S. Department of Agriculture
11According to Manchester, “Sincenearly all fluid milk markets werelocal in character and many wereentirely within one State..., there wasa question as to whether Federal mar-keting agreements...could be used.Early court decisions found thatFederal regulation of purely intrastatemarkets was not legal.”
12“An Alternative Milk PricingApproach” discusses some of theissues involved in States operatingover-order milk pricing programsthrough interstate compacts.
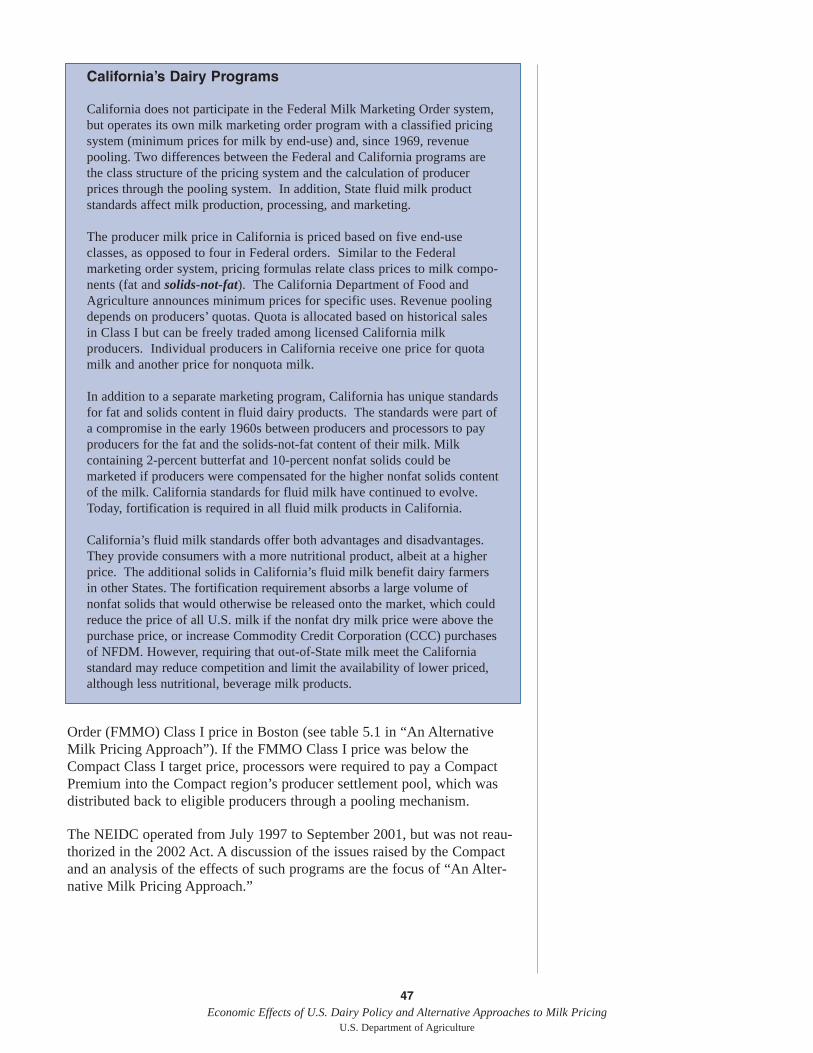
Order (FMMO) Class I price in Boston (see table 5.1 in “An AlternativeMilk Pricing Approach”). If the FMMO Class I price was below theCompact Class I target price, processors were required to pay a CompactPremium into the Compact region’s producer settlement pool, which wasdistributed back to eligible producers through a pooling mechanism.
The NEIDC operated from July 1997 to September 2001, but was not reau-thorized in the 2002 Act. A discussion of the issues raised by the Compactand an analysis of the effects of such programs are the focus of “An Alter-native Milk Pricing Approach.”
47Economic Effects of U.S. Dairy Policy and Alternative Approaches to Milk Pricing
U.S. Department of Agriculture
California’s Dairy Programs
California does not participate in the Federal Milk Marketing Order system,but operates its own milk marketing order program with a classified pricingsystem (minimum prices for milk by end-use) and, since 1969, revenuepooling. Two differences between the Federal and California programs arethe class structure of the pricing system and the calculation of producerprices through the pooling system. In addition, State fluid milk productstandards affect milk production, processing, and marketing.
The producer milk price in California is priced based on five end-useclasses, as opposed to four in Federal orders. Similar to the Federalmarketing order system, pricing formulas relate class prices to milk compo-nents (fat and solids-not-fat). The California Department of Food andAgriculture announces minimum prices for specific uses. Revenue poolingdepends on producers’ quotas. Quota is allocated based on historical salesin Class I but can be freely traded among licensed California milkproducers. Individual producers in California receive one price for quotamilk and another price for nonquota milk.
In addition to a separate marketing program, California has unique standardsfor fat and solids content in fluid dairy products. The standards were part ofa compromise in the early 1960s between producers and processors to payproducers for the fat and the solids-not-fat content of their milk. Milkcontaining 2-percent butterfat and 10-percent nonfat solids could bemarketed if producers were compensated for the higher nonfat solids contentof the milk. California standards for fluid milk have continued to evolve.Today, fortification is required in all fluid milk products in California.
California’s fluid milk standards offer both advantages and disadvantages.They provide consumers with a more nutritional product, albeit at a higherprice. The additional solids in California’s fluid milk benefit dairy farmersin other States. The fortification requirement absorbs a large volume ofnonfat solids that would otherwise be released onto the market, which couldreduce the price of all U.S. milk if the nonfat dry milk price were above thepurchase price, or increase Commodity Credit Corporation (CCC) purchasesof NFDM. However, requiring that out-of-State milk meet the Californiastandard may reduce competition and limit the availability of lower priced,although less nutritional, beverage milk products.
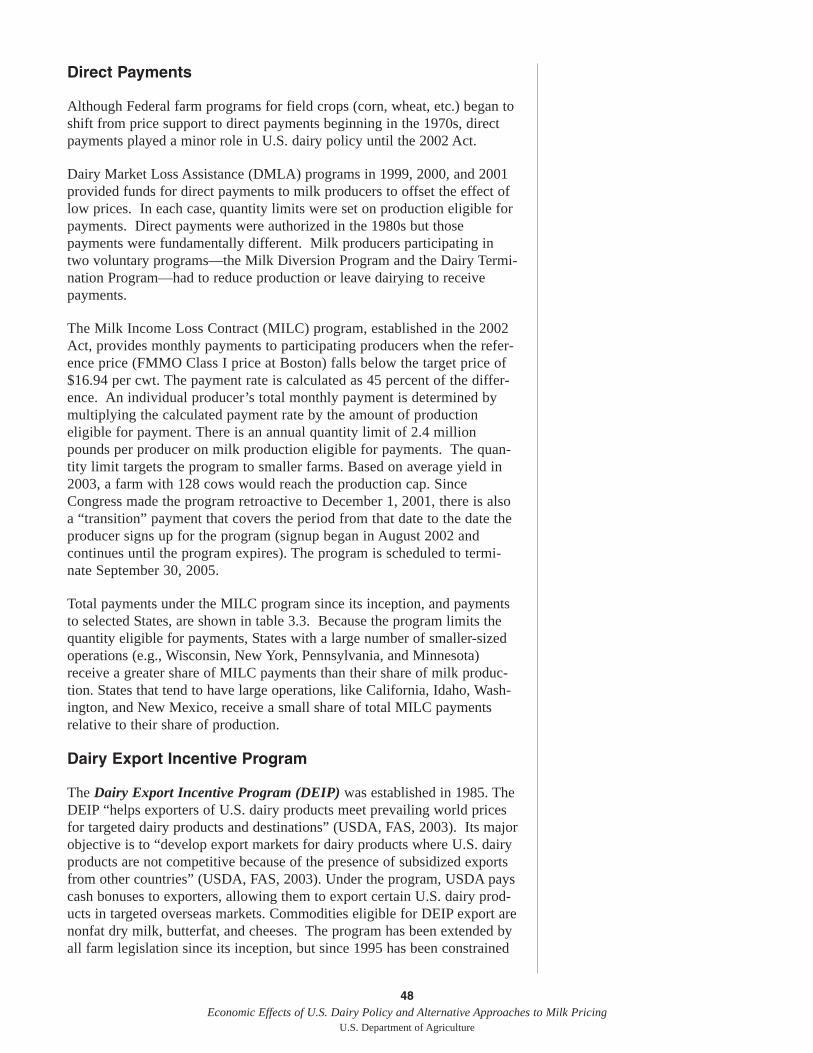
48Economic Effects of U.S. Dairy Policy and Alternative Approaches to Milk Pricing
U.S. Department of Agriculture
Direct Payments
Although Federal farm programs for field crops (corn, wheat, etc.) began toshift from price support to direct payments beginning in the 1970s, directpayments played a minor role in U.S. dairy policy until the 2002 Act.
Dairy Market Loss Assistance (DMLA) programs in 1999, 2000, and 2001provided funds for direct payments to milk producers to offset the effect oflow prices. In each case, quantity limits were set on production eligible forpayments. Direct payments were authorized in the 1980s but thosepayments were fundamentally different. Milk producers participating intwo voluntary programs—the Milk Diversion Program and the Dairy Termi-nation Program—had to reduce production or leave dairying to receivepayments.
The Milk Income Loss Contract (MILC) program, established in the 2002Act, provides monthly payments to participating producers when the refer-ence price (FMMO Class I price at Boston) falls below the target price of$16.94 per cwt. The payment rate is calculated as 45 percent of the differ-ence. An individual producer’s total monthly payment is determined bymultiplying the calculated payment rate by the amount of productioneligible for payment. There is an annual quantity limit of 2.4 millionpounds per producer on milk production eligible for payments. The quan-tity limit targets the program to smaller farms. Based on average yield in2003, a farm with 128 cows would reach the production cap. SinceCongress made the program retroactive to December 1, 2001, there is alsoa “transition” payment that covers the period from that date to the date theproducer signs up for the program (signup began in August 2002 andcontinues until the program expires). The program is scheduled to termi-nate September 30, 2005.
Total payments under the MILC program since its inception, and paymentsto selected States, are shown in table 3.3. Because the program limits thequantity eligible for payments, States with a large number of smaller-sizedoperations (e.g., Wisconsin, New York, Pennsylvania, and Minnesota)receive a greater share of MILC payments than their share of milk produc-tion. States that tend to have large operations, like California, Idaho, Wash-ington, and New Mexico, receive a small share of total MILC paymentsrelative to their share of production.
Dairy Export Incentive Program
The Dairy Export Incentive Program (DEIP) was established in 1985. TheDEIP “helps exporters of U.S. dairy products meet prevailing world pricesfor targeted dairy products and destinations” (USDA, FAS, 2003). Its majorobjective is to “develop export markets for dairy products where U.S. dairyproducts are not competitive because of the presence of subsidized exportsfrom other countries” (USDA, FAS, 2003). Under the program, USDA payscash bonuses to exporters, allowing them to export certain U.S. dairy prod-ucts in targeted overseas markets. Commodities eligible for DEIP export arenonfat dry milk, butterfat, and cheeses. The program has been extended byall farm legislation since its inception, but since 1995 has been constrained
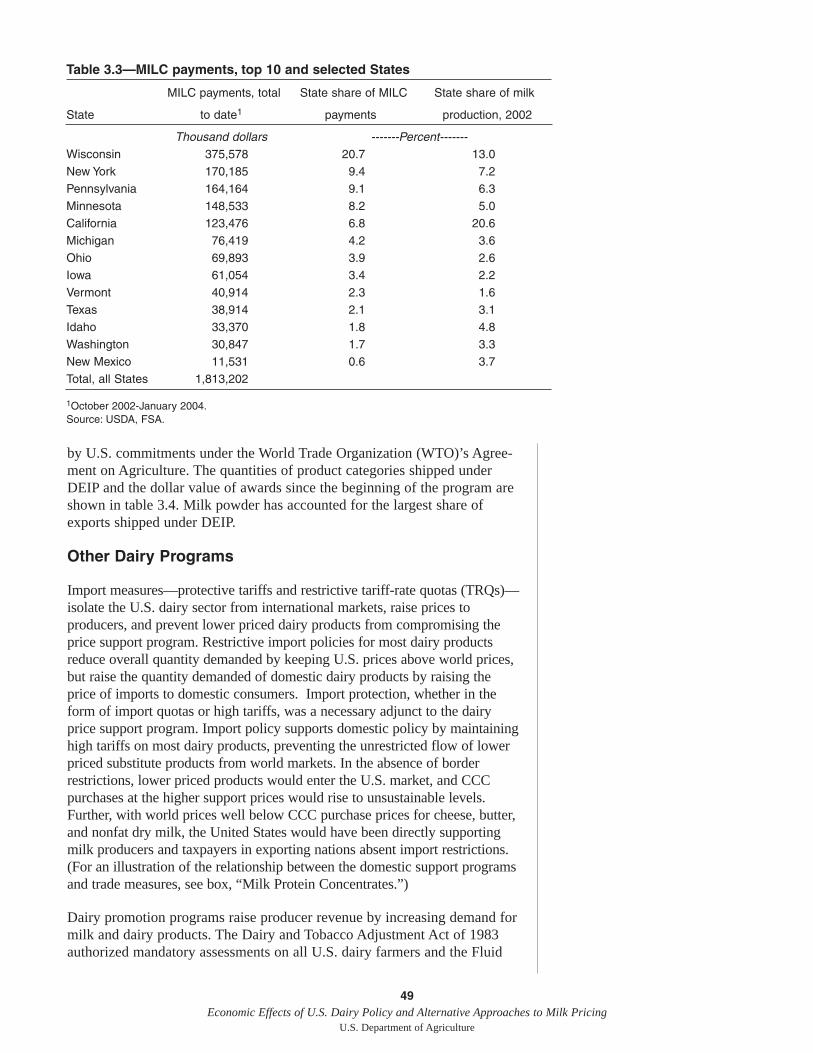
by U.S. commitments under the World Trade Organization (WTO)’s Agree-ment on Agriculture. The quantities of product categories shipped underDEIP and the dollar value of awards since the beginning of the program areshown in table 3.4. Milk powder has accounted for the largest share ofexports shipped under DEIP.
Other Dairy Programs
Import measures—protective tariffs and restrictive tariff-rate quotas (TRQs)—isolate the U.S. dairy sector from international markets, raise prices toproducers, and prevent lower priced dairy products from compromising theprice support program. Restrictive import policies for most dairy productsreduce overall quantity demanded by keeping U.S. prices above world prices,but raise the quantity demanded of domestic dairy products by raising theprice of imports to domestic consumers. Import protection, whether in theform of import quotas or high tariffs, was a necessary adjunct to the dairyprice support program. Import policy supports domestic policy by maintaininghigh tariffs on most dairy products, preventing the unrestricted flow of lowerpriced substitute products from world markets. In the absence of borderrestrictions, lower priced products would enter the U.S. market, and CCCpurchases at the higher support prices would rise to unsustainable levels.Further, with world prices well below CCC purchase prices for cheese, butter,and nonfat dry milk, the United States would have been directly supportingmilk producers and taxpayers in exporting nations absent import restrictions.(For an illustration of the relationship between the domestic support programsand trade measures, see box, “Milk Protein Concentrates.”)
Dairy promotion programs raise producer revenue by increasing demand formilk and dairy products. The Dairy and Tobacco Adjustment Act of 1983authorized mandatory assessments on all U.S. dairy farmers and the Fluid
49Economic Effects of U.S. Dairy Policy and Alternative Approaches to Milk Pricing
U.S. Department of Agriculture
Table 3.3—MILC payments, top 10 and selected States
MILC payments, total State share of MILC State share of milk
State to date1 payments production, 2002
Thousand dollars -------Percent-------Wisconsin 375,578 20.7 13.0New York 170,185 9.4 7.2Pennsylvania 164,164 9.1 6.3Minnesota 148,533 8.2 5.0California 123,476 6.8 20.6Michigan 76,419 4.2 3.6Ohio 69,893 3.9 2.6Iowa 61,054 3.4 2.2Vermont 40,914 2.3 1.6Texas 38,914 2.1 3.1Idaho 33,370 1.8 4.8Washington 30,847 1.7 3.3New Mexico 11,531 0.6 3.7Total, all States 1,813,202
1October 2002-January 2004.Source: USDA, FSA.
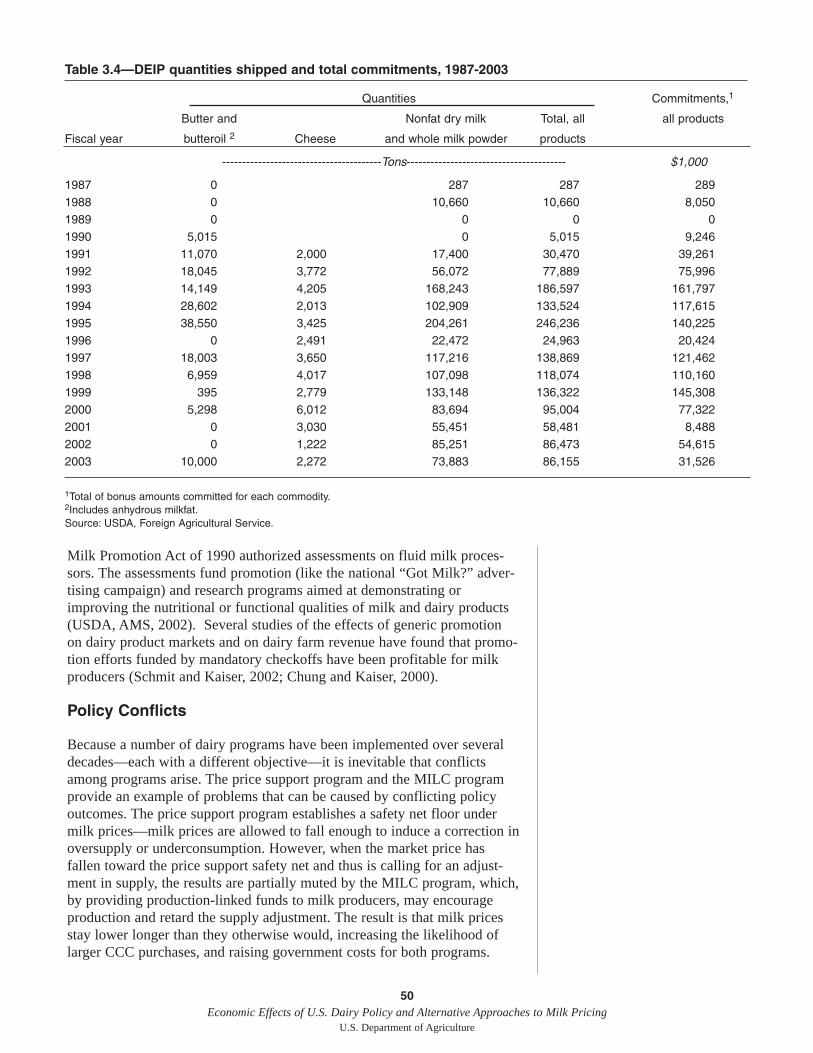
Milk Promotion Act of 1990 authorized assessments on fluid milk proces-sors. The assessments fund promotion (like the national “Got Milk?” adver-tising campaign) and research programs aimed at demonstrating orimproving the nutritional or functional qualities of milk and dairy products(USDA, AMS, 2002). Several studies of the effects of generic promotionon dairy product markets and on dairy farm revenue have found that promo-tion efforts funded by mandatory checkoffs have been profitable for milkproducers (Schmit and Kaiser, 2002; Chung and Kaiser, 2000).
Policy Conflicts
Because a number of dairy programs have been implemented over severaldecades—each with a different objective—it is inevitable that conflictsamong programs arise. The price support program and the MILC programprovide an example of problems that can be caused by conflicting policyoutcomes. The price support program establishes a safety net floor undermilk prices—milk prices are allowed to fall enough to induce a correction inoversupply or underconsumption. However, when the market price hasfallen toward the price support safety net and thus is calling for an adjust-ment in supply, the results are partially muted by the MILC program, which,by providing production-linked funds to milk producers, may encourageproduction and retard the supply adjustment. The result is that milk pricesstay lower longer than they otherwise would, increasing the likelihood oflarger CCC purchases, and raising government costs for both programs.
50Economic Effects of U.S. Dairy Policy and Alternative Approaches to Milk Pricing
U.S. Department of Agriculture
Table 3.4—DEIP quantities shipped and total commitments, 1987-2003
Quantities Commitments,1
Butter and Nonfat dry milk Total, all all products
Fiscal year butteroil 2 Cheese and whole milk powder products
----------------------------------------Tons---------------------------------------- $1,000
1987 0 287 287 2891988 0 10,660 10,660 8,0501989 0 0 0 01990 5,015 0 5,015 9,2461991 11,070 2,000 17,400 30,470 39,2611992 18,045 3,772 56,072 77,889 75,9961993 14,149 4,205 168,243 186,597 161,7971994 28,602 2,013 102,909 133,524 117,6151995 38,550 3,425 204,261 246,236 140,2251996 0 2,491 22,472 24,963 20,4241997 18,003 3,650 117,216 138,869 121,4621998 6,959 4,017 107,098 118,074 110,1601999 395 2,779 133,148 136,322 145,3082000 5,298 6,012 83,694 95,004 77,3222001 0 3,030 55,451 58,481 8,4882002 0 1,222 85,251 86,473 54,6152003 10,000 2,272 73,883 86,155 31,526
1Total of bonus amounts committed for each commodity.2Includes anhydrous milkfat.Source: USDA, Foreign Agricultural Service.
“The Effects of National Dairy Programs” will examine the interactionbetween MILC and other dairy programs in more detail.
Regional Effects of Dairy Programs
Although most of the programs examined in this study are national in scope,many have effects that vary by region. The Milk Price Support Programsupports dairy prices in the entire country, and the market-expanding bene-fits of DEIP benefit producers nationwide. Federal Milk Marketing Ordershave different regional effects in those regions covered by orders. Classprices are based on the use of milk, and the blend price reflects the mix ofuses in a region. Regions with low utilization of higher valued fluid milkwill tend, other things equal, to have lower blend prices than regions withhigher fluid utilization. Many of the fastest-growing milk-producingregions, like Idaho and New Mexico, tend to have low fluid utilization rates.
MILC, because of the limit on the quantity of milk eligible for payments,favors regions with large numbers of smaller farms. States with very largefarms tend not to benefit as much from the MILC program, and may bedisadvantaged by the program altogether due to the supply-inducing effectsof MILC payments.
State pricing, State-mandated over-order premiums, and interstate dairycompacts may bolster dairy prices within the State or region covered by theprogram. The direct and indirect effects of interstate compacts will be exam-ined in detail in “An Alternative Milk Pricing Approach.”
51Economic Effects of U.S. Dairy Policy and Alternative Approaches to Milk Pricing
U.S. Department of Agriculture
52Economic Effects of U.S. Dairy Policy and Alternative Approaches to Milk Pricing
U.S. Department of Agriculture
13The term MPC is used here toinclude both liquid ultra-filtered milkproducts and dry products.
14MPCs may be used in the productionof nonstandardized cheese, or cheesefor which FDA does not regulate ingre-dients through its standards of identity(GAO, 2001).
Milk Protein Concentrates
Imports of milk protein products, including milk protein concentrates(MPCs), casein, and caseinates, highlight the interrelationship between tradepolicy and domestic dairy policy (Harris, 2003). While imports of caseinhave been an issue for over 20 years, the recent surge in MPC imports hasdriven the current debate.
MPCs and the U.S. Dairy Industry
In general, MPCs are processed milk products derived from skim milk.Development of ultra-filtration, which removes most of milk’s fluid compo-nents and lactose while leaving a high concentration of milk protein, waslargely responsible for the commercialization of this product (GAO,2001).13 Other forms of MPCs are manufactured by blending various prod-ucts containing dairy proteins or manufactured through a precipitationprocess (Cessna, 2004). MPCs may contain from 40 percent to 90 percentprotein and may be substituted for nonfat dry milk in some uses.
MPCs also have functional attributes that make them preferred for use insome products. For example, their low level of lactose enhances the effi-ciency of cheesemaking.14 They are also commonly used in other foods,including frozen desserts, bakery products, and nutritional foods (high-protein sports drinks, energy bars, and nutrition supplements), and somenonfood uses (GAO, 2001). Because there is limited U.S. commercialproduction of MPC, and because these products enter the United Statesessentially duty-free, demand for the product is filled almost entirely byimports. Imports of MPCs increased rapidly in recent years, rising from4,000 metric tons in 1989 to 65,000 metric tons in 2000, but have droppedoff in recent years. In 2003, U.S. imports of MPCs amounted to over 48,000metric tons (Cessna, 2004).
MPCs, Trade Policy, and Domestic Dairy Policy
The rise in U.S. MPC imports can be viewed as a secondary effect of U.S.agricultural and trade policy—the milk price support program and tariffs—and of technology and demand factors. The rapid rise in utilization andimports of MPCs has been the result of increased demand from the processedcheese industry, the U.S. nutritional foods industry and many other productsthat use MPCs, and low tariffs (GAO, 2001; U.S. International TradeCommission, 2004).
Trade policy is a major factor contributing to the rise in MPC imports.Under the World Trade Organization (WTO)’s Agreement on Agriculture,U.S. import quotas were converted to tariff-rate quotas (TRQs) withnominal within-quota tariffs that decline over time, and high over-quotatariffs. These over-quota tariffs have continued to insulate the U.S. dairymarket. Prior to the WTO agreement, MPCs, in contrast to most other dairyproducts, were not covered by Section 22 quotas, and therefore were notsubject to tariff-rate quotas under the WTO agreement (U.S. InternationalTrade Commission, 2004).
MPCs were produced and traded in small quantities when the WTO agree-ment was negotiated, and consequently tariffs were low or nonexistent. Theimprovement of ultrafiltration technology allowed MPCs to be produced in
Continued on page 53
53Economic Effects of U.S. Dairy Policy and Alternative Approaches to Milk Pricing
U.S. Department of Agriculture
commercial quantities at reasonable cost, leading to an increase in quantitydemanded of MPCs. MPC imports rose, taking advantage of the low tariffs.Under the WTO agreement, all agricultural tariffs are bound—once estab-lished, they cannot be raised without compensating the affected parties.
MPC use has also been encouraged by the high purchase price of nonfatdry milk (NFDM) under the dairy price support program that discourageddomestic production of MPCs and encouraged manufacturers to use othersources of protein, like MPCs.
The U.S. International Trade Commission found that the higher supportpurchase price for NFDM contributed to a higher return to processors onNFDM production than on production of MPCs, and concluded that themilk price support program created a disincentive to manufacture MPC inthe United States (U.S. International Trade Commission, 2004).
The effects of MPC imports on government purchases and farm prices havebeen the subject of debate. Some analysts conclude that increased importsof MPCs have not only displaced some NFDM use in the United States, buthave also resulted in an increase in government purchases over the past 5years. The U.S. International Trade Commission estimated that importedmilk proteins (including casein and caseinates) may have contributed about25-35 percent to the growth in CCC stocks of NFDM during 1996-2002(U.S. International Trade Commission, 2004), but that the effect on thefarm price of milk was unclear. Bailey (2003) supports the hypothesis thatMPC imports did not likely displace large amounts of domesticallyproduced nonfat dry milk in cheese production during 2002 and concludesthat any direct effect on farm milk prices would have been minimal.
Dairy farmer groups are concerned that MPC imports are displacingdomestic milk used for cheesemaking and depressing farm milk prices.Some groups have urged the government to examine trade policy optionsfor addressing MPC imports (Chite, 2001). Possible responses includeproposed legislation to impose TRQs or quotas on imports and to provideFederal assistance to promote domestic MPC production.
The U.S. International Trade Commission (ITC) recently published theresults of a fact-finding investigation on U.S. market conditions for milkprotein products, focusing on MPCs, casein, and caseinate. For the fullreport see ftp://ftp.usitc.gov/pub/reports/studies/PUB3692.PDF.
For additional information see:
Bailey, Kenneth. Impact of MPC Imports on 2002 U.S. Cheese Production.Staff Paper 362. Dept. of Agricultural Economics and Rural Sociology, ThePennsylvania State University. March 2003.
Bailey, Kenneth. Implications of Dairy Imports: The Case of Milk ProteinConcentrates. Staff Paper 353. Dept. of Agricultural Economics and RuralSociology, The Pennsylvania State University. June 2002.
Bailey, Kenneth. Imports of Milk Protein Concentrates: Assessing theConsequences. Staff Paper 343. Dept. of Agricultural Economics and RuralSociology, The Pennsylvania State University. November 2001.
Continued on page 54
54Economic Effects of U.S. Dairy Policy and Alternative Approaches to Milk Pricing
U.S. Department of Agriculture
Cessna, Jerry. Milk Protein Products and Related Government PolicyIssues. USDA, Agricultural Marketing Service. February 2004.
Jesse, Ed. U.S. Imports of Concentrated Milk Proteins: What We Know andDon’t Know. Market and Policy Briefing Paper 80. Dept. of Agriculturaland Applied Economics, University of Wisconsin-Madison. February 2003.
U.S. General Accounting Office. Dairy Products: Imports, DomesticProduction, and Regulation of Ultra-filtered Milk. March 2001.
U.S. International Trade Commission. Conditions of Competition forMilk Protein Products in the U.S. Market. Investigation No. 332-453,USITC Publication 3692. May 2004.
The Effects of NationalDairy Programs
Introduction
Some of the dairy programs described in the previous chapter have been inplace since the 1930s in the United States (see appendix B). Consequently,our understanding of their effects is limited because we have no observa-tions of a “state of the industry” without programs.1 Analysis of dairyprograms’ effects is therefore often based on counterfactual or, as used here,“modified” counterfactual approaches (see box, “Empirical Analysis ofDairy Programs Using Baseline Models”). For the purposes of this study,four national dairy programs are examined: Federal milk marketing orders(FMMOs), Federal milk price support, the direct payments to milkproducers known as the Milk Income Loss Contract (MILC) program, andthe Dairy Export Incentive Program (DEIP). These are only a subset of theprograms that have been applied to the industry.2
Dairy Program Effects on National Market Indicators
The main focus of the results presented in this section is national, althoughwe can, and do, report some effects for key milk-producing States. Themethodological approach underlying the results is that the four nationaldairy programs are eliminated one at a time, and a simulation of industryindicators reflecting each removal is estimated. The final set of simulatedindustry indicators represents the cumulative effects of the programremovals. In keeping with the mandate’s objective to analyze the effects ofprograms, we compare the baseline simulation values to the final no-program estimates of the industry indicators. No changes in State-levelprograms are included, a potentially significant issue given California’sposition in the U.S. dairy economy (see box, “California’s Dairy Programs”in “Public Policy in the Dairy Industry”). Nor are interstate dairy compactsconsidered given the “current policy” emphasis of the baseline models.
Two empirical modeling frameworks, FAPRI (University of Missouri) andFAPSIM (USDA, ERS) were used to estimate the effects of dairy programs(see box, “Empirical Analysis of Dairy Programs Using Baseline Models”).The two models are similar, but each offers advantages in terms of variablesincluded, regional detail, and links to other analytical frameworks.Obtaining similar results from the two different frameworks providesanalysts with greater confidence regarding the reliability of those results.
The empirical analysis exposes both the marginal effects of individual dairyprograms and the cumulative effects of all the programs together. Further,the use of baseline frameworks provides year-by-year results. Strictlyspeaking, direct comparisons between the results derived from the twomodeling frameworks are not appropriate—different baseline assumptionswere used, a different order of program analysis was followed, and the aver-ages are based on different time periods. The results are presented in termsof the effects of implementing programs—not eliminating programs. Thus,
55Economic Effects of U.S. Dairy Policy and Alternative Approaches to Milk Pricing
U.S. Department of Agriculture
1While we have no observations of theU.S. industry in the absence of exten-sive dairy programs, the experience ofpolicy reform in other countries mayprovide some insights. Australia'sderegulation of its dairy industry isdescribed in an ABARE report on theimpact of an open market in fluid milksupply at: http://abareonlineshop.com/product.asp?prodid=12204. The U.S.International Trade Commission hasreviewed this report in Conditions ofCompetition for Milk Protein Productsin the U.S. Market, Investigation No.332-453, Publication 3692, May 2004.ftp://ftp.usitc.gov/pub/reports/studies/pub3692.pdf, p. 4-44 through 4-47.
2Two other elements of dairy policywere enumerated in the 2002 Act studymandate: State programs and over-order premiums; and interstate dairycompacts. Compacts are discussed in“An Alternative Milk PricingApproach.” We assume no changes inState programs since extensive State-level detail is lacking in the modelsunderlying the analysis.
56Economic Effects of U.S. Dairy Policy and Alternative Approaches to Milk Pricing
U.S. Department of Agriculture
Empirical Analysis of Dairy Programs Using Baseline Models
The questions posed by the study of the dairy industry mandated in the 2002Act are wide-ranging. No single model can provide the comprehensiveanalysis of the issues required by the Act. USDA marshaled, through cooper-ative agreements with Land-Grant University dairy economists, analyticalcapabilities available through existing modeling frameworks to address thequestions. A major component of the analysis was utilization of “baselinemodels.” Both the Food and Agricultural Policy Research Institute (FAPRI)and the Economic Research Service (ERS) of the USDA have devoted consid-erable resources to developing baselines for policy and program analysis. TheFAPRI framework has a direct link to a farm-level analytical framework,FLIPSIM, housed at the Agricultural and Food Policy Center at Texas A&MUniversity; the USDA model focuses on predominantly national questions.
The baseline models rely on a set of assumptions for a period of years intothe future. For example, milk production responses to price changes aredefined by fixed model parameters. Similarly, a set of parameters definesthe demand side of the industry. The assumptions underlying the baselinevalues of dairy industry indicators are available at the following web sites:http://www.fapri.missouri.edu/Publications/2003Publications/Brief-ingBk03/03BriefingBk.pdf (FAPRI), and http://www.ers.usda.gov/publica-tions/waob031/ (FAPSIM). Appendix C shows the baseline values for keydairy industry indicators used in the analyses.
The baseline models are developed in the context of existing programs.Baseline values reflect the assumption that current dairy programs are inoperation. Program effects are then estimated mechanically, by derivingchanges from baseline values in the absence of the programs. We hypothe-sized elimination of programs one at a time, an approach that uncoversboth marginal and total effects, subject to underlying assumptionsregarding program operations. No changes in border measures weremade—the mandate emphasized domestic dairy program relationships asthe priority.
Many analysts have noted that the annual basis for the baseline models can beproblematic for program analysis. Baselines embody the best estimates ofconditions that will exist in the context of program continuation and otherfactors such as normal weather patterns. Programs may be adjusted during theyear. For example, the milk price support program may be altered by changingthe combination of purchase prices for butter and nonfat dry milk known as the“tilt”. Annual baseline models do not capture such a change unless it is built infrom the beginning. More will be said on this point as needed.
The use of the baseline frameworks as described above is a modified coun-terfactual approach for determining dairy program effects. It is a modifiedapproach because two simulations are used, one a baseline which includesprogram effects and the other a “without programs” alternative. A truecounterfactual analysis generally rests on comparisons of estimated valuesof variables with actual values. Counterfactual approaches do not implysupport or criticism of any particular policy—they are only a means ofanalyzing economic relationships under alternative hypothetical situations.It bears repeating that the study mandate does not call for an analysis ofdairy program elimination. Elimination is only an artifice of the empiricalanalysis to derive program effects.
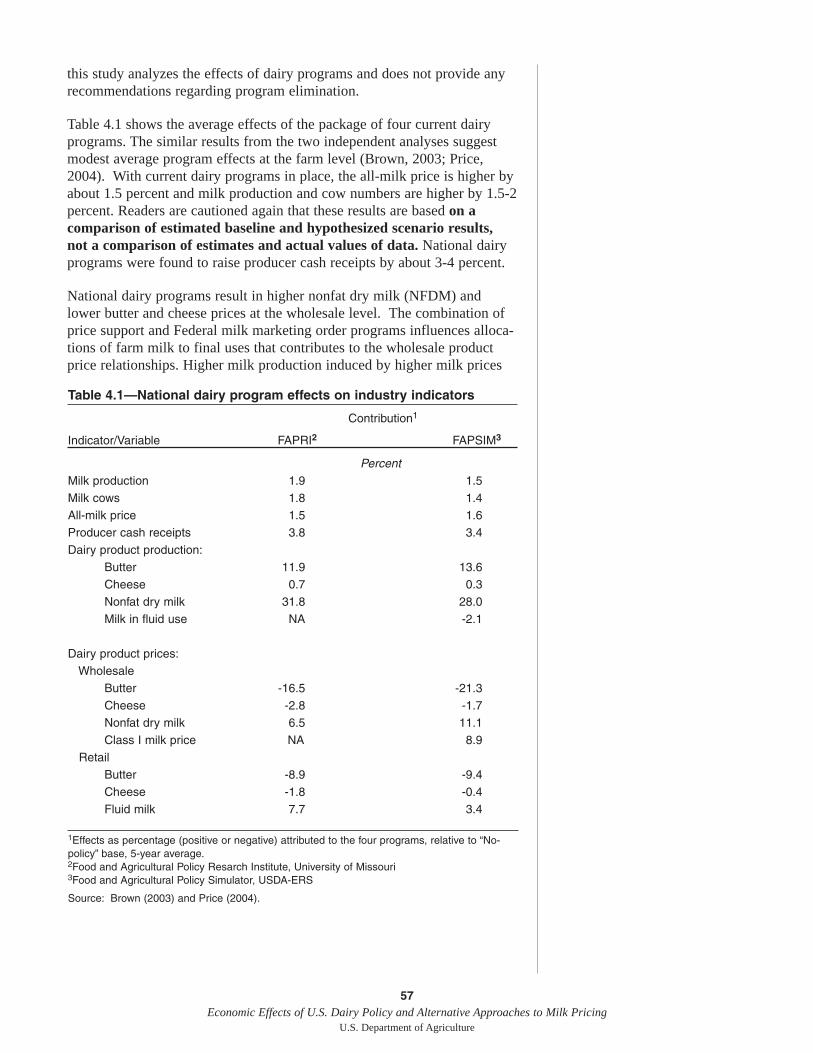
57Economic Effects of U.S. Dairy Policy and Alternative Approaches to Milk Pricing
U.S. Department of Agriculture
this study analyzes the effects of dairy programs and does not provide anyrecommendations regarding program elimination.
Table 4.1 shows the average effects of the package of four current dairyprograms. The similar results from the two independent analyses suggestmodest average program effects at the farm level (Brown, 2003; Price,2004). With current dairy programs in place, the all-milk price is higher byabout 1.5 percent and milk production and cow numbers are higher by 1.5-2percent. Readers are cautioned again that these results are based on acomparison of estimated baseline and hypothesized scenario results, not a comparison of estimates and actual values of data. National dairyprograms were found to raise producer cash receipts by about 3-4 percent.
National dairy programs result in higher nonfat dry milk (NFDM) andlower butter and cheese prices at the wholesale level. The combination ofprice support and Federal milk marketing order programs influences alloca-tions of farm milk to final uses that contributes to the wholesale productprice relationships. Higher milk production induced by higher milk prices
Table 4.1—National dairy program effects on industry indicators
Contribution1
Indicator/Variable FAPRI2 FAPSIM3
PercentMilk production 1.9 1.5Milk cows 1.8 1.4All-milk price 1.5 1.6Producer cash receipts 3.8 3.4Dairy product production:
Butter 11.9 13.6Cheese 0.7 0.3Nonfat dry milk 31.8 28.0Milk in fluid use NA -2.1
Dairy product prices:Wholesale
Butter -16.5 -21.3Cheese -2.8 -1.7Nonfat dry milk 6.5 11.1Class I milk price NA 8.9
RetailButter -8.9 -9.4Cheese -1.8 -0.4Fluid milk 7.7 3.4
1Effects as percentage (positive or negative) attributed to the four programs, relative to “No-policy” base, 5-year average.2Food and Agricultural Policy Resarch Institute, University of Missouri3Food and Agricultural Policy Simulator, USDA-ERS
Source: Brown (2003) and Price (2004).
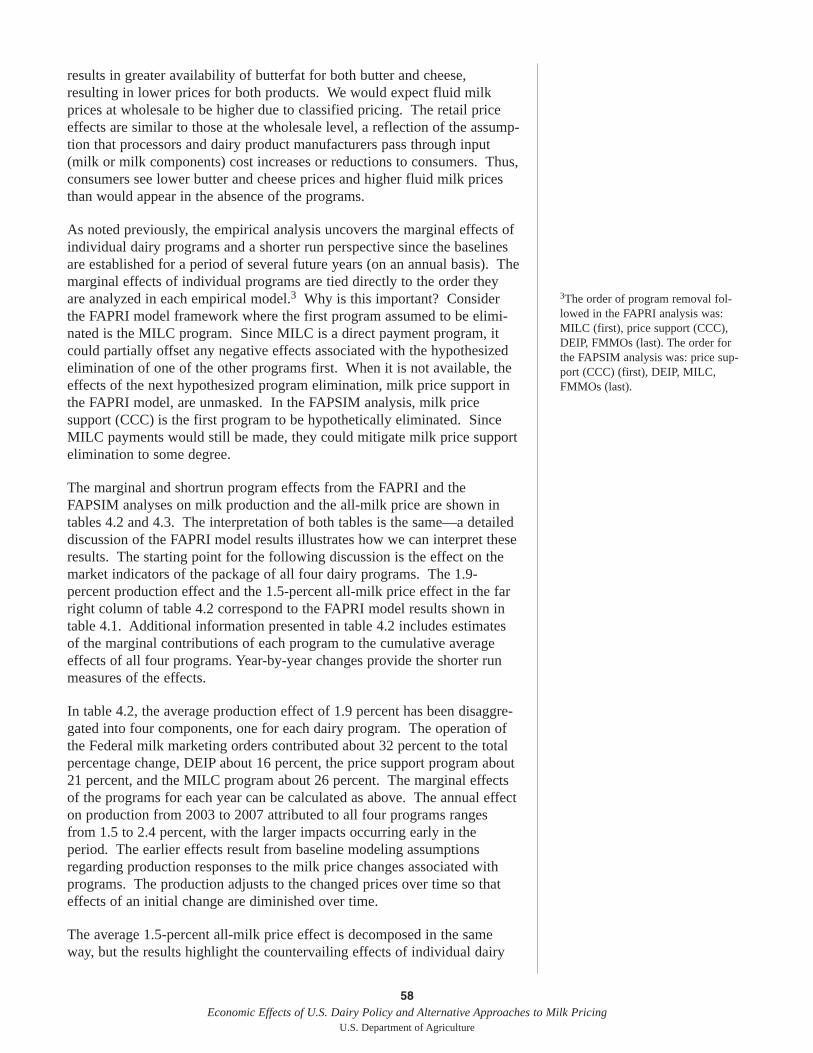
results in greater availability of butterfat for both butter and cheese,resulting in lower prices for both products. We would expect fluid milkprices at wholesale to be higher due to classified pricing. The retail priceeffects are similar to those at the wholesale level, a reflection of the assump-tion that processors and dairy product manufacturers pass through input(milk or milk components) cost increases or reductions to consumers. Thus,consumers see lower butter and cheese prices and higher fluid milk pricesthan would appear in the absence of the programs.
As noted previously, the empirical analysis uncovers the marginal effects ofindividual dairy programs and a shorter run perspective since the baselinesare established for a period of several future years (on an annual basis). Themarginal effects of individual programs are tied directly to the order theyare analyzed in each empirical model.3 Why is this important? Considerthe FAPRI model framework where the first program assumed to be elimi-nated is the MILC program. Since MILC is a direct payment program, itcould partially offset any negative effects associated with the hypothesizedelimination of one of the other programs first. When it is not available, theeffects of the next hypothesized program elimination, milk price support inthe FAPRI model, are unmasked. In the FAPSIM analysis, milk pricesupport (CCC) is the first program to be hypothetically eliminated. SinceMILC payments would still be made, they could mitigate milk price supportelimination to some degree.
The marginal and shortrun program effects from the FAPRI and theFAPSIM analyses on milk production and the all-milk price are shown intables 4.2 and 4.3. The interpretation of both tables is the same—a detaileddiscussion of the FAPRI model results illustrates how we can interpret theseresults. The starting point for the following discussion is the effect on themarket indicators of the package of all four dairy programs. The 1.9-percent production effect and the 1.5-percent all-milk price effect in the farright column of table 4.2 correspond to the FAPRI model results shown intable 4.1. Additional information presented in table 4.2 includes estimatesof the marginal contributions of each program to the cumulative averageeffects of all four programs. Year-by-year changes provide the shorter runmeasures of the effects.
In table 4.2, the average production effect of 1.9 percent has been disaggre-gated into four components, one for each dairy program. The operation ofthe Federal milk marketing orders contributed about 32 percent to the totalpercentage change, DEIP about 16 percent, the price support program about21 percent, and the MILC program about 26 percent. The marginal effectsof the programs for each year can be calculated as above. The annual effecton production from 2003 to 2007 attributed to all four programs rangesfrom 1.5 to 2.4 percent, with the larger impacts occurring early in theperiod. The earlier effects result from baseline modeling assumptionsregarding production responses to the milk price changes associated withprograms. The production adjusts to the changed prices over time so thateffects of an initial change are diminished over time.
The average 1.5-percent all-milk price effect is decomposed in the sameway, but the results highlight the countervailing effects of individual dairy
58Economic Effects of U.S. Dairy Policy and Alternative Approaches to Milk Pricing
U.S. Department of Agriculture
3The order of program removal fol-lowed in the FAPRI analysis was:MILC (first), price support (CCC),DEIP, FMMOs (last). The order forthe FAPSIM analysis was: price sup-port (CCC) (first), DEIP, MILC,FMMOs (last).
programs. That is, the programs have both increasing and decreasingeffects on the all-milk price. The argument that there is a basic incompati-bility involved in operating both the price support program and the MILCprogram simultaneously is supported by these results. However, the twoprograms operate in fundamentally different ways. The milk price supportprogram is designed to affect prices through markets for manufactured dairyproducts. MILC payments are made directly to individual milk producers.Without the MILC program, the remaining dairy programs raise the all-milkprice by 3.8 percent over a 5-year period—when MILC is included, theincrease is only 1.5 percent.
Annual estimates of all milk-price effects suggest there are significantunderlying shortrun effects of dairy programs that must be recognized. Forexample, the effect of the milk price support program on the all-milk priceis larger in the first year than in later years as milk supply adjustments takeplace. The differences in the annual baseline values of Commodity CreditCorporation butter, cheese, and nonfat dry milk (NFDM) price supportpurchases also play a significant role in determination of the price effects.
The FAPSIM results displayed in table 4.3 are interpreted in the same way.However, two aspects of the model are different from the FAPRI approach:the order of program elimination and the time frame for estimating longerterm average effects. Since MILC is a direct payment program, its effectscan offset negative effects associated with the elimination of otherprograms. Even with the differences described, the following similaritiesare seen: 1) the shortrun effects are greatest early in the time period ofanalysis, and 2) the offsetting all-milk price effects of the MILC and pricesupport programs are present.
59Economic Effects of U.S. Dairy Policy and Alternative Approaches to Milk Pricing
U.S. Department of Agriculture
Table 4.2—Shortrun effects of selected dairy programs on dairy market indicators, FAPRI analysis
2003 2004 2005 2006 2007 Average
Effects on milk productionScenario1 Percent changeMILC 0.5 0.9 0.6 0.4 0.2 0.5CCC 0.5 0.6 0.6 0.3 0.2 0.4DEIP 0.0 0.0 0.3 0.5 0.5 0.3FMMO 0.5 0.9 0.6 0.6 0.6 0.6
All selected programs 1.5 2.4 2.2 1.7 1.6 1.9
Effects on all-milk price
MILC -2.1 -2.9 -3.5 -1.8 -1.2 -2.3CCC 3.4 3.8 -0.9 -0.9 -0.5 1.0DEIP 0.0 0.0 2.2 1.7 1.3 1.0FMMO 3.9 4.3 0.2 0.2 0.3 1.8
All selected programs 5.4 5.2 -2.1 -0.8 -0.2 1.51 See text for scenario descriptions.Source: Brown (2003).
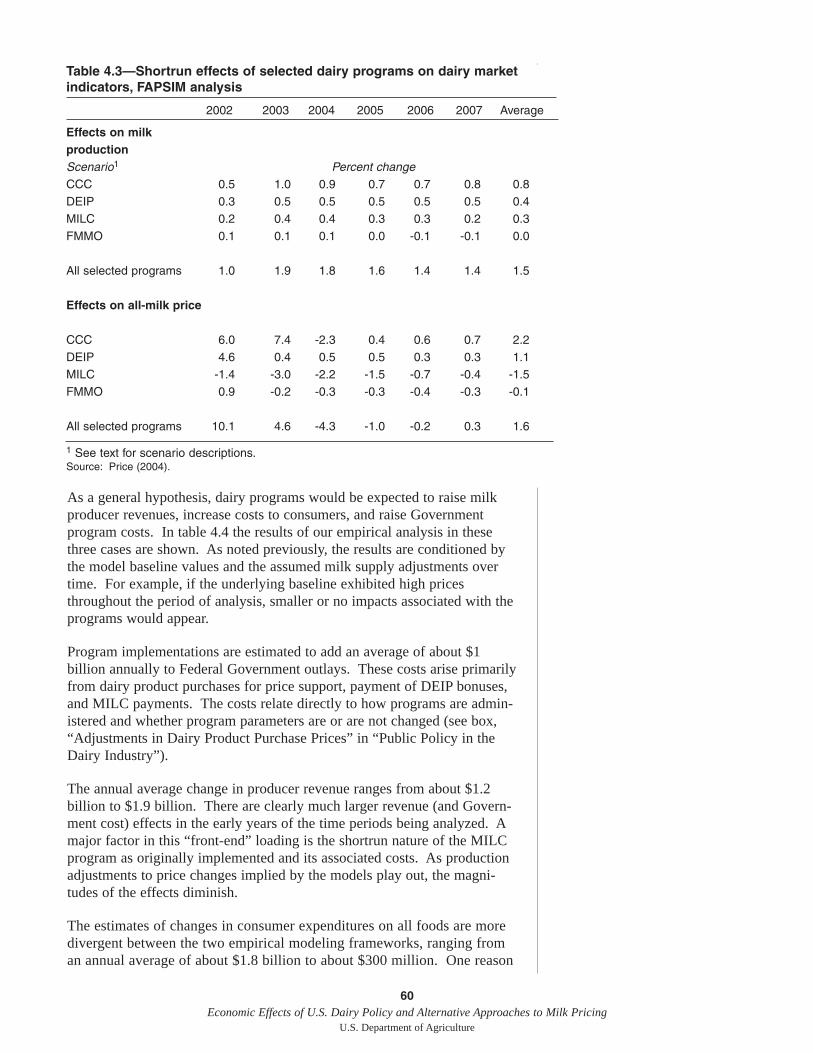
As a general hypothesis, dairy programs would be expected to raise milkproducer revenues, increase costs to consumers, and raise Governmentprogram costs. In table 4.4 the results of our empirical analysis in thesethree cases are shown. As noted previously, the results are conditioned bythe model baseline values and the assumed milk supply adjustments overtime. For example, if the underlying baseline exhibited high pricesthroughout the period of analysis, smaller or no impacts associated with theprograms would appear.
Program implementations are estimated to add an average of about $1billion annually to Federal Government outlays. These costs arise primarilyfrom dairy product purchases for price support, payment of DEIP bonuses,and MILC payments. The costs relate directly to how programs are admin-istered and whether program parameters are or are not changed (see box,“Adjustments in Dairy Product Purchase Prices” in “Public Policy in theDairy Industry”).
The annual average change in producer revenue ranges from about $1.2billion to $1.9 billion. There are clearly much larger revenue (and Govern-ment cost) effects in the early years of the time periods being analyzed. Amajor factor in this “front-end” loading is the shortrun nature of the MILCprogram as originally implemented and its associated costs. As productionadjustments to price changes implied by the models play out, the magni-tudes of the effects diminish.
The estimates of changes in consumer expenditures on all foods are moredivergent between the two empirical modeling frameworks, ranging froman annual average of about $1.8 billion to about $300 million. One reason
60Economic Effects of U.S. Dairy Policy and Alternative Approaches to Milk Pricing
U.S. Department of Agriculture
Table 4.3—Shortrun effects of selected dairy programs on dairy marketindicators, FAPSIM analysis
2002 2003 2004 2005 2006 2007 Average
Effects on milk productionScenario1 Percent changeCCC 0.5 1.0 0.9 0.7 0.7 0.8 0.8DEIP 0.3 0.5 0.5 0.5 0.5 0.5 0.4MILC 0.2 0.4 0.4 0.3 0.3 0.2 0.3FMMO 0.1 0.1 0.1 0.0 -0.1 -0.1 0.0
All selected programs 1.0 1.9 1.8 1.6 1.4 1.4 1.5
Effects on all-milk price
CCC 6.0 7.4 -2.3 0.4 0.6 0.7 2.2DEIP 4.6 0.4 0.5 0.5 0.3 0.3 1.1MILC -1.4 -3.0 -2.2 -1.5 -0.7 -0.4 -1.5FMMO 0.9 -0.2 -0.3 -0.3 -0.4 -0.3 -0.1
All selected programs 10.1 4.6 -4.3 -1.0 -0.2 0.3 1.6
1 See text for scenario descriptions.Source: Price (2004).
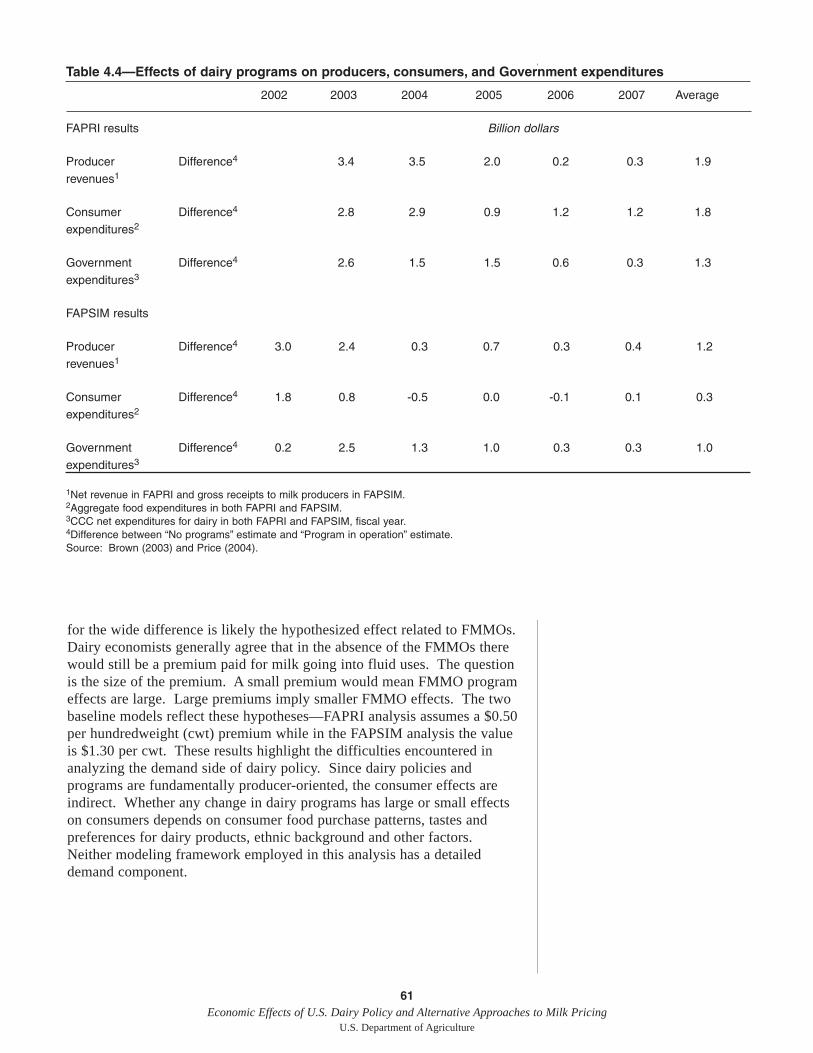
for the wide difference is likely the hypothesized effect related to FMMOs.Dairy economists generally agree that in the absence of the FMMOs therewould still be a premium paid for milk going into fluid uses. The questionis the size of the premium. A small premium would mean FMMO programeffects are large. Large premiums imply smaller FMMO effects. The twobaseline models reflect these hypotheses—FAPRI analysis assumes a $0.50per hundredweight (cwt) premium while in the FAPSIM analysis the valueis $1.30 per cwt. These results highlight the difficulties encountered inanalyzing the demand side of dairy policy. Since dairy policies andprograms are fundamentally producer-oriented, the consumer effects areindirect. Whether any change in dairy programs has large or small effectson consumers depends on consumer food purchase patterns, tastes andpreferences for dairy products, ethnic background and other factors.Neither modeling framework employed in this analysis has a detaileddemand component.
61Economic Effects of U.S. Dairy Policy and Alternative Approaches to Milk Pricing
U.S. Department of Agriculture
Table 4.4—Effects of dairy programs on producers, consumers, and Government expenditures
2002 2003 2004 2005 2006 2007 Average
FAPRI results Billion dollars
Producer Difference4 3.4 3.5 2.0 0.2 0.3 1.9revenues1
Consumer Difference4 2.8 2.9 0.9 1.2 1.2 1.8expenditures2
Government Difference4 2.6 1.5 1.5 0.6 0.3 1.3expenditures3
FAPSIM results
Producer Difference4 3.0 2.4 0.3 0.7 0.3 0.4 1.2revenues1
Consumer Difference4 1.8 0.8 -0.5 0.0 -0.1 0.1 0.3expenditures2
Government Difference4 0.2 2.5 1.3 1.0 0.3 0.3 1.0expenditures3
1Net revenue in FAPRI and gross receipts to milk producers in FAPSIM.2Aggregate food expenditures in both FAPRI and FAPSIM.3CCC net expenditures for dairy in both FAPRI and FAPSIM, fiscal year.4Difference between “No programs” estimate and “Program in operation” estimate.Source: Brown (2003) and Price (2004).
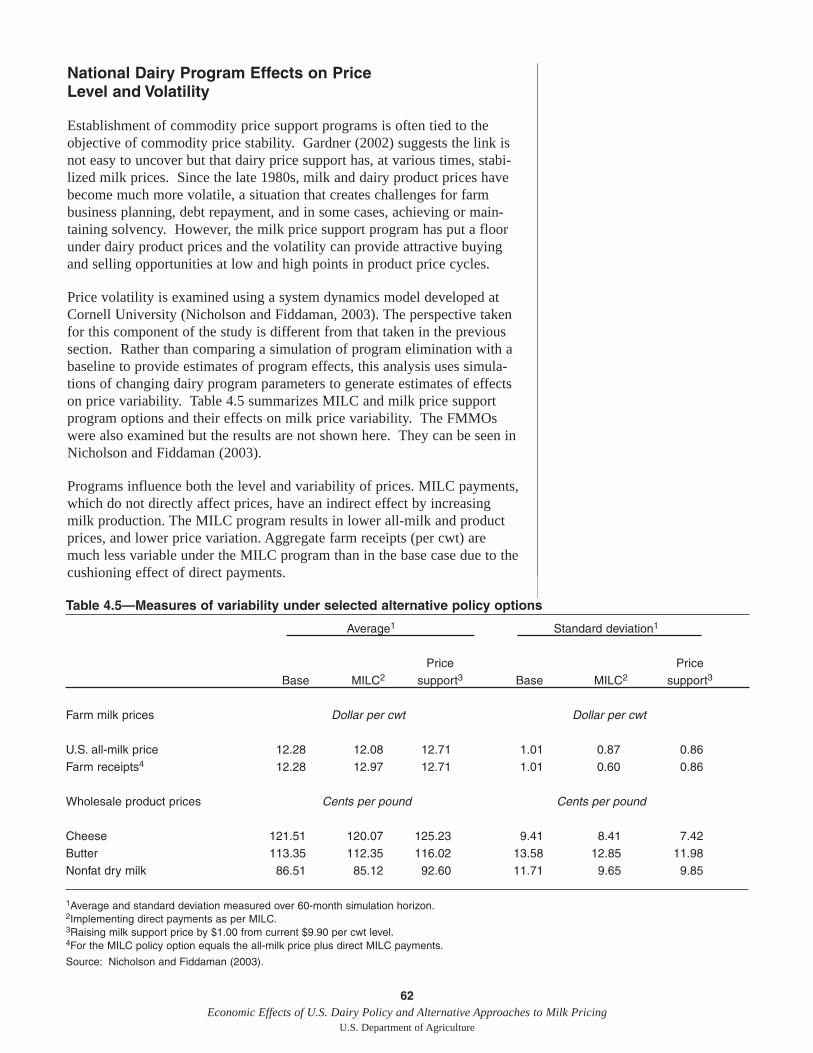
National Dairy Program Effects on Price Level and Volatility
Establishment of commodity price support programs is often tied to theobjective of commodity price stability. Gardner (2002) suggests the link isnot easy to uncover but that dairy price support has, at various times, stabi-lized milk prices. Since the late 1980s, milk and dairy product prices havebecome much more volatile, a situation that creates challenges for farmbusiness planning, debt repayment, and in some cases, achieving or main-taining solvency. However, the milk price support program has put a floorunder dairy product prices and the volatility can provide attractive buyingand selling opportunities at low and high points in product price cycles.
Price volatility is examined using a system dynamics model developed atCornell University (Nicholson and Fiddaman, 2003). The perspective takenfor this component of the study is different from that taken in the previoussection. Rather than comparing a simulation of program elimination with abaseline to provide estimates of program effects, this analysis uses simula-tions of changing dairy program parameters to generate estimates of effectson price variability. Table 4.5 summarizes MILC and milk price supportprogram options and their effects on milk price variability. The FMMOswere also examined but the results are not shown here. They can be seen inNicholson and Fiddaman (2003).
Programs influence both the level and variability of prices. MILC payments,which do not directly affect prices, have an indirect effect by increasingmilk production. The MILC program results in lower all-milk and productprices, and lower price variation. Aggregate farm receipts (per cwt) aremuch less variable under the MILC program than in the base case due to thecushioning effect of direct payments.
62Economic Effects of U.S. Dairy Policy and Alternative Approaches to Milk Pricing
U.S. Department of Agriculture
Table 4.5—Measures of variability under selected alternative policy options
Average1 Standard deviation1
Price PriceBase MILC2 support3 Base MILC2 support3
Farm milk prices Dollar per cwt Dollar per cwt
U.S. all-milk price 12.28 12.08 12.71 1.01 0.87 0.86Farm receipts4 12.28 12.97 12.71 1.01 0.60 0.86
Wholesale product prices Cents per pound Cents per pound
Cheese 121.51 120.07 125.23 9.41 8.41 7.42Butter 113.35 112.35 116.02 13.58 12.85 11.98Nonfat dry milk 86.51 85.12 92.60 11.71 9.65 9.85
1Average and standard deviation measured over 60-month simulation horizon.2Implementing direct payments as per MILC.3Raising milk support price by $1.00 from current $9.90 per cwt level.4For the MILC policy option equals the all-milk price plus direct MILC payments.
Source: Nicholson and Fiddaman (2003).
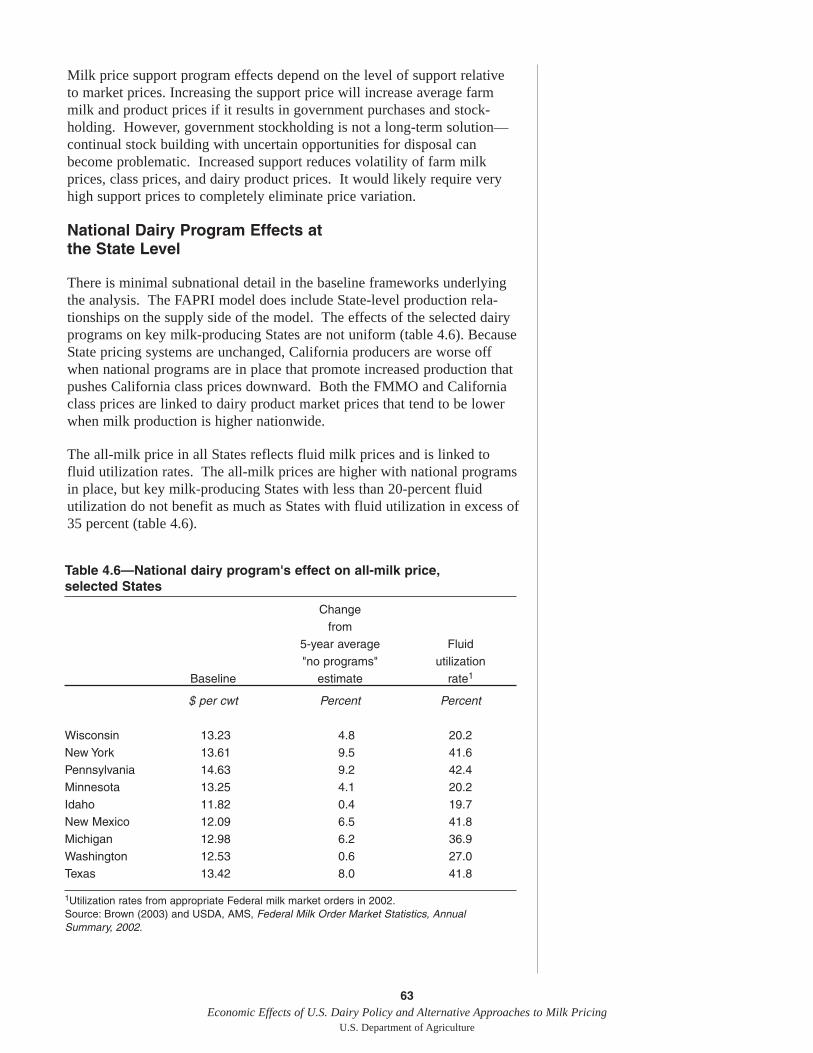
Milk price support program effects depend on the level of support relativeto market prices. Increasing the support price will increase average farmmilk and product prices if it results in government purchases and stock-holding. However, government stockholding is not a long-term solution—continual stock building with uncertain opportunities for disposal canbecome problematic. Increased support reduces volatility of farm milkprices, class prices, and dairy product prices. It would likely require veryhigh support prices to completely eliminate price variation.
National Dairy Program Effects atthe State Level
There is minimal subnational detail in the baseline frameworks underlyingthe analysis. The FAPRI model does include State-level production rela-tionships on the supply side of the model. The effects of the selected dairyprograms on key milk-producing States are not uniform (table 4.6). BecauseState pricing systems are unchanged, California producers are worse offwhen national programs are in place that promote increased production thatpushes California class prices downward. Both the FMMO and Californiaclass prices are linked to dairy product market prices that tend to be lowerwhen milk production is higher nationwide.
The all-milk price in all States reflects fluid milk prices and is linked tofluid utilization rates. The all-milk prices are higher with national programsin place, but key milk-producing States with less than 20-percent fluidutilization do not benefit as much as States with fluid utilization in excess of35 percent (table 4.6).
63Economic Effects of U.S. Dairy Policy and Alternative Approaches to Milk Pricing
U.S. Department of Agriculture
Table 4.6—National dairy program's effect on all-milk price,selected States
Changefrom
5-year average Fluid"no programs" utilization
Baseline estimate rate1
$ per cwt Percent Percent
Wisconsin 13.23 4.8 20.2New York 13.61 9.5 41.6Pennsylvania 14.63 9.2 42.4Minnesota 13.25 4.1 20.2Idaho 11.82 0.4 19.7New Mexico 12.09 6.5 41.8Michigan 12.98 6.2 36.9Washington 12.53 0.6 27.0Texas 13.42 8.0 41.8
1Utilization rates from appropriate Federal milk market orders in 2002.Source: Brown (2003) and USDA, AMS, Federal Milk Order Market Statistics, AnnualSummary, 2002.
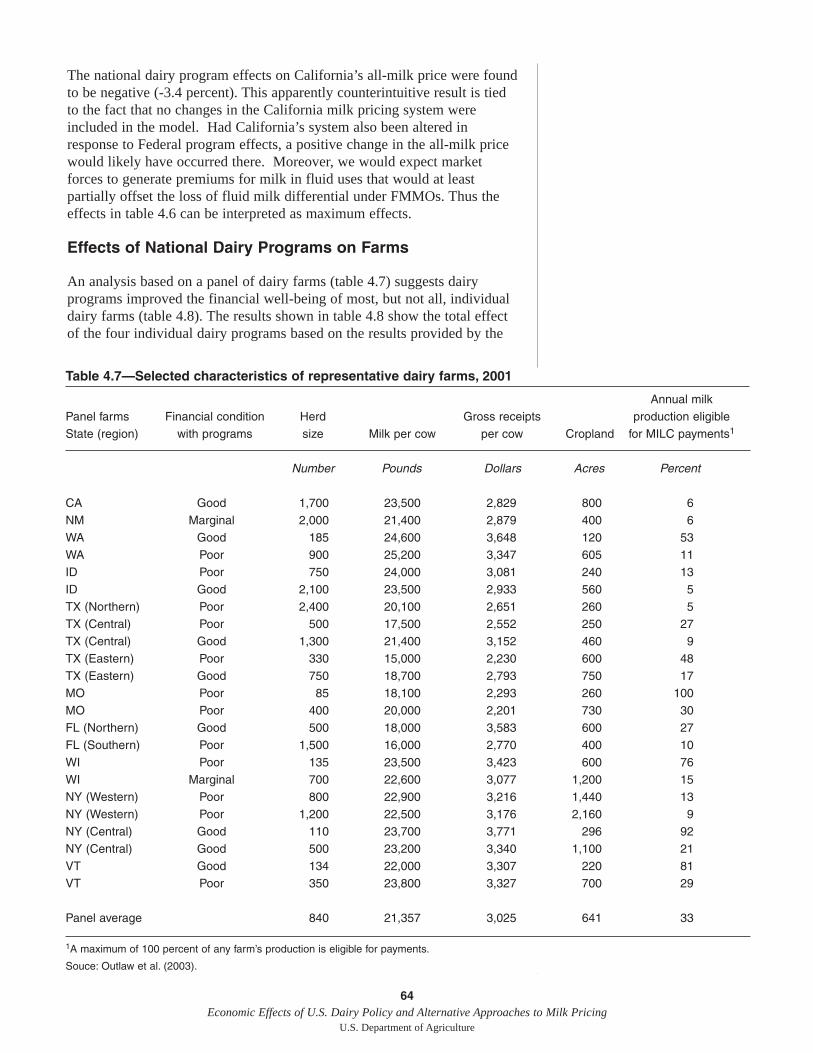
The national dairy program effects on California’s all-milk price were foundto be negative (-3.4 percent). This apparently counterintuitive result is tiedto the fact that no changes in the California milk pricing system wereincluded in the model. Had California’s system also been altered inresponse to Federal program effects, a positive change in the all-milk pricewould likely have occurred there. Moreover, we would expect marketforces to generate premiums for milk in fluid uses that would at leastpartially offset the loss of fluid milk differential under FMMOs. Thus theeffects in table 4.6 can be interpreted as maximum effects.
Effects of National Dairy Programs on Farms
An analysis based on a panel of dairy farms (table 4.7) suggests dairyprograms improved the financial well-being of most, but not all, individualdairy farms (table 4.8). The results shown in table 4.8 show the total effectof the four individual dairy programs based on the results provided by the
64Economic Effects of U.S. Dairy Policy and Alternative Approaches to Milk Pricing
U.S. Department of Agriculture
Table 4.7—Selected characteristics of representative dairy farms, 2001
Annual milk Panel farms Financial condition Herd Gross receipts production eligibleState (region) with programs size Milk per cow per cow Cropland for MILC payments1
Number Pounds Dollars Acres Percent
CA Good 1,700 23,500 2,829 800 6NM Marginal 2,000 21,400 2,879 400 6WA Good 185 24,600 3,648 120 53WA Poor 900 25,200 3,347 605 11ID Poor 750 24,000 3,081 240 13ID Good 2,100 23,500 2,933 560 5TX (Northern) Poor 2,400 20,100 2,651 260 5TX (Central) Poor 500 17,500 2,552 250 27TX (Central) Good 1,300 21,400 3,152 460 9TX (Eastern) Poor 330 15,000 2,230 600 48TX (Eastern) Good 750 18,700 2,793 750 17MO Poor 85 18,100 2,293 260 100MO Poor 400 20,000 2,201 730 30FL (Northern) Good 500 18,000 3,583 600 27FL (Southern) Poor 1,500 16,000 2,770 400 10WI Poor 135 23,500 3,423 600 76WI Marginal 700 22,600 3,077 1,200 15NY (Western) Poor 800 22,900 3,216 1,440 13NY (Western) Poor 1,200 22,500 3,176 2,160 9NY (Central) Good 110 23,700 3,771 296 92NY (Central) Good 500 23,200 3,340 1,100 21VT Good 134 22,000 3,307 220 81VT Poor 350 23,800 3,327 700 29
Panel average 840 21,357 3,025 641 33
1A maximum of 100 percent of any farm’s production is eligible for payments.
Souce: Outlaw et al. (2003).
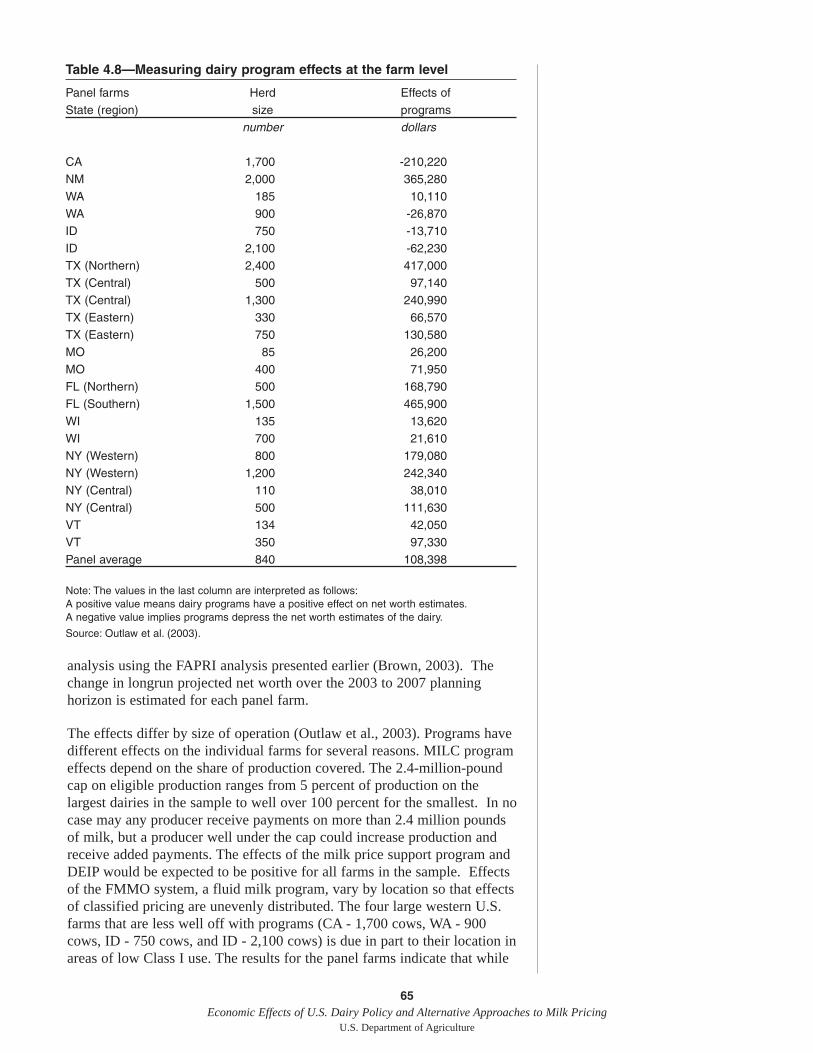
analysis using the FAPRI analysis presented earlier (Brown, 2003). Thechange in longrun projected net worth over the 2003 to 2007 planninghorizon is estimated for each panel farm.
The effects differ by size of operation (Outlaw et al., 2003). Programs havedifferent effects on the individual farms for several reasons. MILC programeffects depend on the share of production covered. The 2.4-million-poundcap on eligible production ranges from 5 percent of production on thelargest dairies in the sample to well over 100 percent for the smallest. In nocase may any producer receive payments on more than 2.4 million poundsof milk, but a producer well under the cap could increase production andreceive added payments. The effects of the milk price support program andDEIP would be expected to be positive for all farms in the sample. Effectsof the FMMO system, a fluid milk program, vary by location so that effectsof classified pricing are unevenly distributed. The four large western U.S.farms that are less well off with programs (CA - 1,700 cows, WA - 900cows, ID - 750 cows, and ID - 2,100 cows) is due in part to their location inareas of low Class I use. The results for the panel farms indicate that while
65Economic Effects of U.S. Dairy Policy and Alternative Approaches to Milk Pricing
U.S. Department of Agriculture
Table 4.8—Measuring dairy program effects at the farm level
Panel farms Herd Effects ofState (region) size programs
number dollars
CA 1,700 -210,220NM 2,000 365,280WA 185 10,110WA 900 -26,870ID 750 -13,710ID 2,100 -62,230TX (Northern) 2,400 417,000TX (Central) 500 97,140TX (Central) 1,300 240,990TX (Eastern) 330 66,570TX (Eastern) 750 130,580MO 85 26,200MO 400 71,950FL (Northern) 500 168,790FL (Southern) 1,500 465,900WI 135 13,620WI 700 21,610NY (Western) 800 179,080NY (Western) 1,200 242,340NY (Central) 110 38,010NY (Central) 500 111,630VT 134 42,050VT 350 97,330Panel average 840 108,398
Note: The values in the last column are interpreted as follows:A positive value means dairy programs have a positive effect on net worth estimates.A negative value implies programs depress the net worth estimates of the dairy.
Source: Outlaw et al. (2003).

some program changes might be necessary to keep the production sector ofthe dairy industry moving toward sound financial condition, not allproducers benefit from or even desire such changes.
USDA’s ARMS data (see box, “Agricultural Resource Management System(ARMS) Data” in “The Evolution of the Modern Dairy Industry”) providesadditional insight on the effects of national dairy programs on dairy farmsand their long-term profitability.4 Using the ARMS data, dairy farms can bedivided into three groups according to their economic costs per dollar ofrevenue. Low-cost farms generate enough revenue to cover economic costsof production (costs per dollar of revenue are less than 1). In 2001, an esti-mated 29 percent of dairy farms were in the low-cost group and theyproduced 62 percent of dairy output measured by value. Mid-cost farms(those with costs per dollar of revenue between 1 and 1.5) are those close tobecoming financially viable and could do so with higher milk prices, lowerproduction costs, and/or larger government payments. They accounted forabout 46 percent of all dairy farms in 2001, and 33 percent of the value ofdairy production. The high-cost farms (costs per revenue dollar of 1.5 orhigher) represented about 24 percent of dairy farms, but only 5 percent ofthe value of dairy production. These farms require other sources of incomeor equity, such as off-farm employment, retirement earnings, or savings toremain viable (Morehart et al., 2000). The data show that high-cost farmshave higher average off-farm earnings than either mid- or low-cost farms.
One approach for assessing the viability of dairy farms in any given year isto measure the revenue necessary to cover long-term economic costs. Theshare of dairy farms that are financially viable can change from year to year,depending on the level of prices, costs, and government payments. Forexample, in 2000 (a low milk price year), less than 25 percent coveredeconomic costs, allowing them to sustain the farm business over many years.A larger percentage fell into the mid- and low-cost groups than in 2001.
Government policy can affect farm viability through revenue impactsrelated to milk price (market receipts), and through direct governmentpayments. While ARMS provides data on government payments, it is notpossible to discern the influence of policy on price. The set of selectednational dairy programs—the milk price support program, DEIP, andFMMOs—raises the all-milk price by an average 4 percent over a 5-yearperiod. Because ARMS data do not include MILC payments, the effects ofMILC on the all-milk price are excluded.
A static analysis based on 2001 data shows that higher milk prices resultingfrom national dairy programs improved the short- to medium-term prof-itability and viability of dairy producers. The share of dairy farms thatwould cover longrun economic costs increases from 24 to 29 percent (fig.4.1), and the share of farms that require other sources of income or equity toremain viable declines from 26 to 24 percent. A targeted direct paymentprogram like MILC will improve the viability of mid- and high-costproducers who have high percentages of their production eligible forpayments. Lower cost producers will always be profitable in the long run,making it possible for them to expand production to gain market share.
66Economic Effects of U.S. Dairy Policy and Alternative Approaches to Milk Pricing
U.S. Department of Agriculture
4Long-term profitability is defined asthe difference between economic costsand total revenue. Economic costsmust be covered in order to sustainthe farm business over the long run.They include total cash costs plus anallowance for depreciation as well asan imputed return to management andto unpaid labor of the farm operatorand family (Morehart et al., 2000).Revenue includes receipts from milkand dairy product sales, governmentpayments, and crop insurance indem-nity payments. The 2001 ARMS dataincludes Dairy Market LossAssistance payments but predates theMILC program.
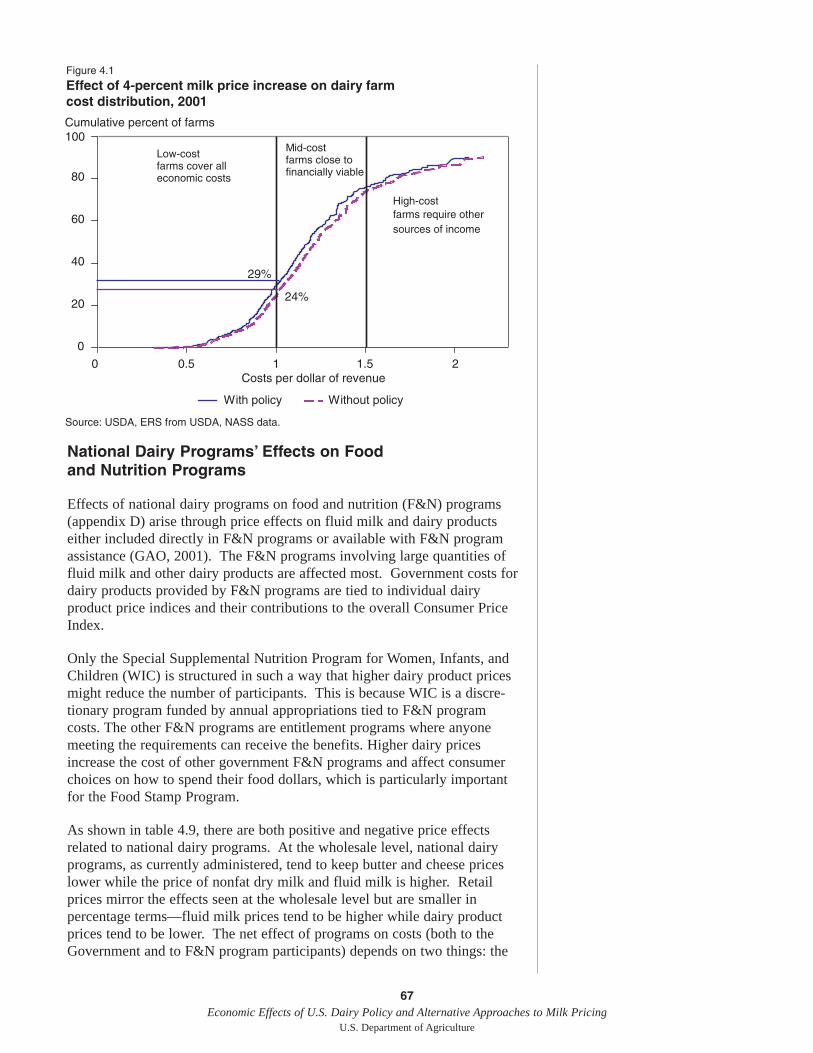
National Dairy Programs’ Effects on Foodand Nutrition Programs
Effects of national dairy programs on food and nutrition (F&N) programs(appendix D) arise through price effects on fluid milk and dairy productseither included directly in F&N programs or available with F&N programassistance (GAO, 2001). The F&N programs involving large quantities offluid milk and other dairy products are affected most. Government costs fordairy products provided by F&N programs are tied to individual dairyproduct price indices and their contributions to the overall Consumer PriceIndex.
Only the Special Supplemental Nutrition Program for Women, Infants, andChildren (WIC) is structured in such a way that higher dairy product pricesmight reduce the number of participants. This is because WIC is a discre-tionary program funded by annual appropriations tied to F&N programcosts. The other F&N programs are entitlement programs where anyonemeeting the requirements can receive the benefits. Higher dairy pricesincrease the cost of other government F&N programs and affect consumerchoices on how to spend their food dollars, which is particularly importantfor the Food Stamp Program.
As shown in table 4.9, there are both positive and negative price effectsrelated to national dairy programs. At the wholesale level, national dairyprograms, as currently administered, tend to keep butter and cheese priceslower while the price of nonfat dry milk and fluid milk is higher. Retailprices mirror the effects seen at the wholesale level but are smaller inpercentage terms—fluid milk prices tend to be higher while dairy productprices tend to be lower. The net effect of programs on costs (both to theGovernment and to F&N program participants) depends on two things: the
67Economic Effects of U.S. Dairy Policy and Alternative Approaches to Milk Pricing
U.S. Department of Agriculture
Figure 4.1
Effect of 4-percent milk price increase on dairy farm cost distribution, 2001
0
20
40
60
80
100
0 0.5 1 1.5 2Costs per dollar of revenue
With policy Without policy
Low-costfarms cover all economic costs
Mid-costfarms close to financially viable
High-costfarms require other sources of income
29%
24%
Source: USDA, ERS from USDA, NASS data.
Cumulative percent of farms
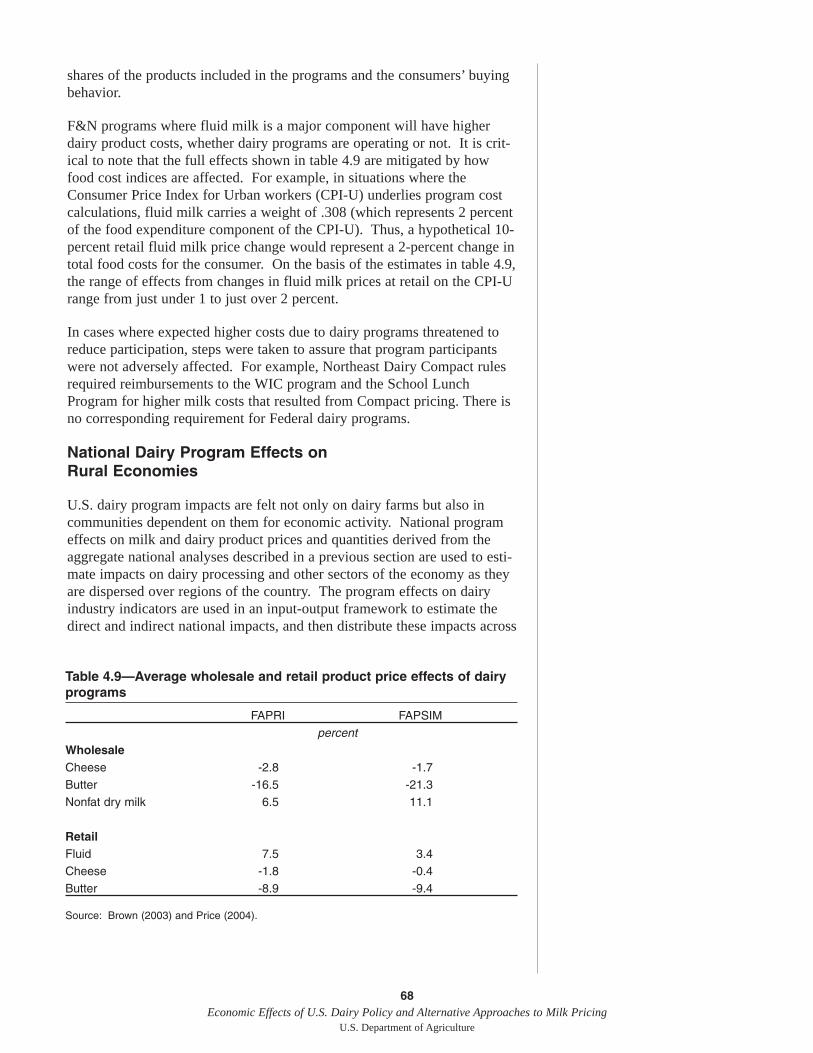
shares of the products included in the programs and the consumers’ buyingbehavior.
F&N programs where fluid milk is a major component will have higherdairy product costs, whether dairy programs are operating or not. It is crit-ical to note that the full effects shown in table 4.9 are mitigated by howfood cost indices are affected. For example, in situations where theConsumer Price Index for Urban workers (CPI-U) underlies program costcalculations, fluid milk carries a weight of .308 (which represents 2 percentof the food expenditure component of the CPI-U). Thus, a hypothetical 10-percent retail fluid milk price change would represent a 2-percent change intotal food costs for the consumer. On the basis of the estimates in table 4.9,the range of effects from changes in fluid milk prices at retail on the CPI-Urange from just under 1 to just over 2 percent.
In cases where expected higher costs due to dairy programs threatened toreduce participation, steps were taken to assure that program participantswere not adversely affected. For example, Northeast Dairy Compact rulesrequired reimbursements to the WIC program and the School LunchProgram for higher milk costs that resulted from Compact pricing. There isno corresponding requirement for Federal dairy programs.
National Dairy Program Effects on Rural Economies
U.S. dairy program impacts are felt not only on dairy farms but also incommunities dependent on them for economic activity. National programeffects on milk and dairy product prices and quantities derived from theaggregate national analyses described in a previous section are used to esti-mate impacts on dairy processing and other sectors of the economy as theyare dispersed over regions of the country. The program effects on dairyindustry indicators are used in an input-output framework to estimate thedirect and indirect national impacts, and then distribute these impacts across
68Economic Effects of U.S. Dairy Policy and Alternative Approaches to Milk Pricing
U.S. Department of Agriculture
Table 4.9—Average wholesale and retail product price effects of dairyprograms
FAPRI FAPSIMpercent
WholesaleCheese -2.8 -1.7Butter -16.5 -21.3Nonfat dry milk 6.5 11.1
Retail Fluid 7.5 3.4Cheese -1.8 -0.4Butter -8.9 -9.4
Source: Brown (2003) and Price (2004).
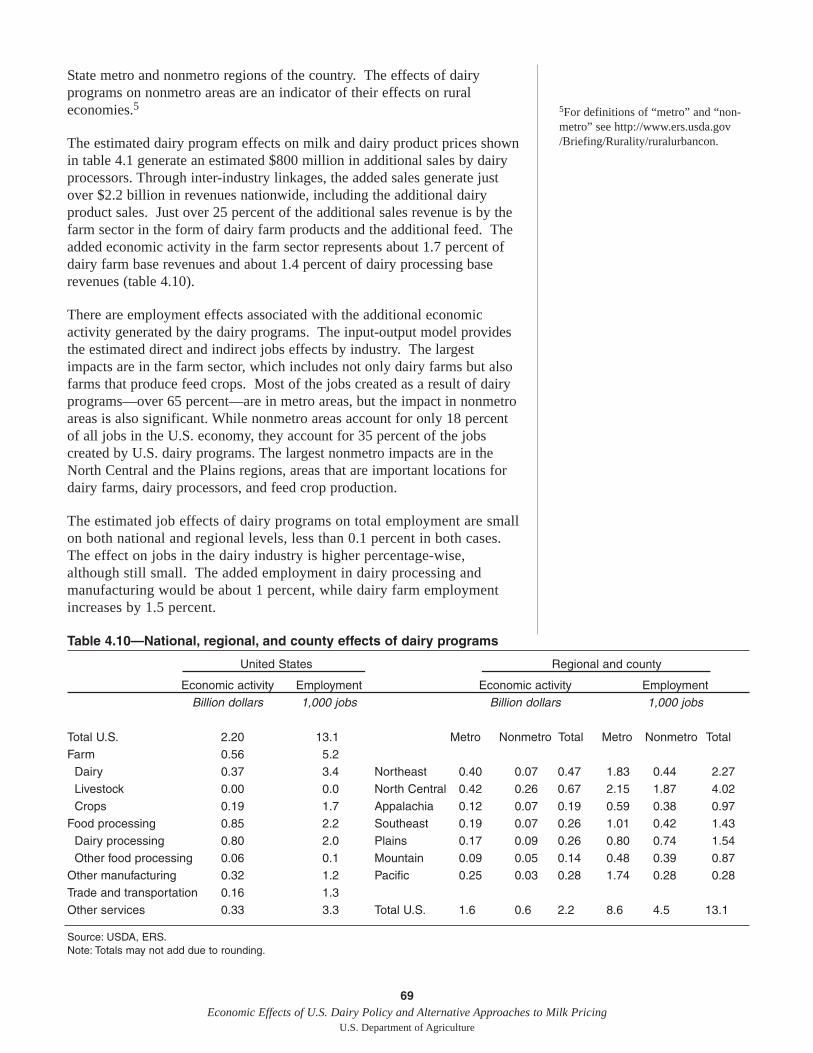
State metro and nonmetro regions of the country. The effects of dairyprograms on nonmetro areas are an indicator of their effects on ruraleconomies.5
The estimated dairy program effects on milk and dairy product prices shownin table 4.1 generate an estimated $800 million in additional sales by dairyprocessors. Through inter-industry linkages, the added sales generate justover $2.2 billion in revenues nationwide, including the additional dairyproduct sales. Just over 25 percent of the additional sales revenue is by thefarm sector in the form of dairy farm products and the additional feed. Theadded economic activity in the farm sector represents about 1.7 percent ofdairy farm base revenues and about 1.4 percent of dairy processing baserevenues (table 4.10).
There are employment effects associated with the additional economicactivity generated by the dairy programs. The input-output model providesthe estimated direct and indirect jobs effects by industry. The largestimpacts are in the farm sector, which includes not only dairy farms but alsofarms that produce feed crops. Most of the jobs created as a result of dairyprograms—over 65 percent—are in metro areas, but the impact in nonmetroareas is also significant. While nonmetro areas account for only 18 percentof all jobs in the U.S. economy, they account for 35 percent of the jobscreated by U.S. dairy programs. The largest nonmetro impacts are in theNorth Central and the Plains regions, areas that are important locations fordairy farms, dairy processors, and feed crop production.
The estimated job effects of dairy programs on total employment are smallon both national and regional levels, less than 0.1 percent in both cases.The effect on jobs in the dairy industry is higher percentage-wise,although still small. The added employment in dairy processing andmanufacturing would be about 1 percent, while dairy farm employmentincreases by 1.5 percent.
69Economic Effects of U.S. Dairy Policy and Alternative Approaches to Milk Pricing
U.S. Department of Agriculture
5For definitions of “metro” and “non-metro” see http://www.ers.usda.gov/Briefing/Rurality/ruralurbancon.
Table 4.10—National, regional, and county effects of dairy programs
United States Regional and county
Economic activity Employment Economic activity EmploymentBillion dollars 1,000 jobs Billion dollars 1,000 jobs
Total U.S. 2.20 13.1 Metro Nonmetro Total Metro Nonmetro TotalFarm 0.56 5.2
Dairy 0.37 3.4 Northeast 0.40 0.07 0.47 1.83 0.44 2.27Livestock 0.00 0.0 North Central 0.42 0.26 0.67 2.15 1.87 4.02Crops 0.19 1.7 Appalachia 0.12 0.07 0.19 0.59 0.38 0.97
Food processing 0.85 2.2 Southeast 0.19 0.07 0.26 1.01 0.42 1.43Dairy processing 0.80 2.0 Plains 0.17 0.09 0.26 0.80 0.74 1.54Other food processing 0.06 0.1 Mountain 0.09 0.05 0.14 0.48 0.39 0.87
Other manufacturing 0.32 1.2 Pacific 0.25 0.03 0.28 1.74 0.28 0.28Trade and transportation 0.16 1.3Other services 0.33 3.3 Total U.S. 1.6 0.6 2.2 8.6 4.5 13.1
Source: USDA, ERS.Note: Totals may not add due to rounding.
Most of the economic activity due to national dairy programs is distributedover the country in a pattern similar to the job effects (table 4.10). Thelargest nonmetro impacts are again in the North Central region. The esti-mated economic impacts are small on both the national and regional levels.However, even small effects for large regions may be important if they arecentered in nonmetro areas where smaller communities depend on economicactivity from dairy farms and dairy processing.
Summary
The quantitative analyses in this study examined national dairy programeffects on market and farm-level indicators, the well-being of dairy farms,milk price volatility, food and nutrition (F&N) programs, and ruraleconomic activity. Several empirical approaches were used because there isno comprehensive modeling framework available at this time that incorpo-rates all of the relationships needed for the study.
The average effects of national dairy programs are modest. These resultssuggest that most market indicators are not sensitive to program interven-tion in the longer term. However, the results show that there are larger (ona percentage basis) shortrun effects in the early years as the industry adjuststo change. The results reflect the difficulty of modeling dramatic programchanges when their effects are embedded in data and the assumptions andparameters underlying the analytical frameworks. It is possible that amarket indicator, the all-milk price for example, might not differ from base-line values in the longer term as dairy programs are changed. Or, the diver-gence from baseline values might be significant. The key to making use ofthis type of analysis is examination of the revealed changes in market indi-cators from baseline conditions and the direction of those changes.
The analysis presented here is limited to effects on market variables—price,production, and consumption—and reveals little about program effects onthe structure of the dairy sector. Dairy programs are estimated to raise theall-milk price by less than 2 percent on average over a 5- or 6-year periodwhile cash receipts increase by about 3 to 4 percent. To the extent thathigher prices keep some marginal milk producers in production, dairyprograms may slow structural change at the farm level, which is also drivenby technological advances and changing consumer demands. Technology,changing consumer demand, and changes in upstream and downstreamsectors are more important determinants of the structural change seen in thedairy industry.
Price levels are not the only concern of milk producers and other dairyindustry participants—volatility has become an issue as well. Price stabilityis a goal of some dairy programs. The dynamic simulation analysisprovides some empirical evidence supporting that conjecture but moreextensive work is needed. The MILC and dairy support programs do appearto reduce price volatility as measured by the standard deviation of selectedmilk and dairy product prices.
The results give us a first cut at some of the distributional effects of dairyprograms. While the average effects of dairy programs may be small, the
70Economic Effects of U.S. Dairy Policy and Alternative Approaches to Milk Pricing
U.S. Department of Agriculture
impacts are likely to vary according to the size and location of individualdairy farms. Results of farm-level analysis show that, on average, dairyfarms are better off with dairy programs in effect. But that is not auniversal result. A second analysis of farm viability suggests that a highermilk price would allow a larger share of farms to be profitable or viable inthe short to medium term.
However, in the longer term, without dramatic changes in the cost structureof dairy farms, low-cost farmers will be more profitable with higher prices,but expanding production will drive milk prices lower. This result presentsa quandary—it is not likely that all farms will be willing or able to be in thelow-cost category. Given that situation, the solution to the long-term exis-tence of medium- and high-cost farms may be direct payments to farmersmeeting certain criteria rather than market intervention designed to affectprices. It is possible that budget exposure might also be reduced with adirect payment program. In that sense, current milk programs, except forMILC, may accelerate structural change.
Effects on food and nutrition (F&N) programs are mainly cost-related. Inonly one case, the Special Supplemental Nutrition Program for Women,Infants, and Children (WIC), is participation and cost linked in such a wayas to possibly reduce participation as costs rise. The other F&N programsare entitlements and participation means essentially taking advantage of thebenefits of the programs to obtain dairy products. In the case of foodstamps, higher food costs affect consumer food demand which in and ofitself does not necessarily reduce program participation. Higher food costsclearly could affect the share of food stamp dollars spent on dairy products.
In the context of regional economic effects, the modest national effects ofdairy programs are distributed throughout the U.S. according to the impor-tance of dairy farming and dairy-related sectors in local economies. Notsurprisingly, the greatest effects are in areas where dairy farming and dairyproduction are still significant economic sectors. Also of interest are themeasures of effects on metro areas where many milk processing or manu-facturing operations are located. The fact that dairy programs affect changein all the components of the dairy industry (producers, processors, or manu-facturers) contributes to this result.
Finally, forces other than dairy policy and programs—such as technologyand changing consumer food preferences—are affecting the U.S. dairyindustry, the effects of which are embedded in model structure, parameters,and data. These forces are likely to continue to move the dairy industry inthe direction exhibited by long-term trends. The effects of some of theseforces may be more important than the effects of national dairy programs onaggregate dairy market indicators.
71Economic Effects of U.S. Dairy Policy and Alternative Approaches to Milk Pricing
U.S. Department of Agriculture
72Economic Effects of U.S. Dairy Policy and Alternative Approaches to Milk Pricing
U.S. Department of Agriculture
An Alternative Milk Pricing ApproachSection 1508(A) of the 2002 Food Security and Rural Investment Act calledfor USDA to “conduct a study on the effects of—(1) terminating all Federalprograms relating to price support and supply management; and (2) grantingthe consent of Congress to cooperative efforts by States to manage milkprices and supply.” It is not clear what “cooperative efforts by States. . .”means specifically in the context of the request, but the Northeast InterstateDairy Compact (NEIDC, or the Compact) that operated from July 1997 toSeptember 2001 is a recent example of such an effort.1 The NEIDC was arealization of the wide array of possibilities for defining compacts and theirobjectives.
The answers to important economic questions regarding compacts rest onassessments of benefits and costs to stakeholders in the industry. Who getsthe benefits and who bears the costs depends on the specific design of thecompact arrangements. Legislation to reauthorize dairy compacts has beenintroduced periodically but not enacted. The congressional mandate in the2002 Act offers an opportunity to review this program and to analyze theeffects of its potential reintroduction under a particular set of assumptions.
The Northeast Interstate Dairy Compact
New York State legislators pressed for a dairy compact in the Northeast inthe late 1980s. By 1993, the six New England States had passed the legisla-tion required to form a Compact and the governors were in agreement.Congress consented to the Compact with the passage of the 1996 FederalAgriculture Improvement and Reform Act. Connecticut, Maine, Massachu-setts, New Hampshire, Rhode Island, and Vermont were authorized to enterinto the NEIDC as specified in section 1, Senate Joint Resolution 28 of the104th Congress, subject to the Secretary of Agriculture finding compellingpublic interest in the Compact region.
The objectives of the NEIDC included: 1) increasing dairy farmer income toassure continued viability of dairy farming in the region; 2) assuringconsumers in the region an adequate local supply of pure and wholesomemilk; 3) encouraging the vitality of the region’s rural economy; and 4)preserving open spaces. Farm milk price volatility and the effects of theCompact on wholesale and retail milk prices were also concerns. Fluidmilk price regulation was the key—dairy farmers receiving a “fair and equi-table” price for their milk would ensure an adequate local milk supply andcontinued vitality of the dairy industry. A commission was established tocarry out the Compact’s objectives.
The Compact commission’s pricing authority was limited to Class I milk,the milk used in fluid beverage products. Table 5.1 shows the average2
annual Compact price, the relevant Federal Milk Market Order (FMMO)price for Class I milk, and the Compact premium—the amount in excess ofthe FMMO price that processors were required to pay for Class I milk.Revenue generated by the Compact regulation was returned to eligibleproducers through a pooling mechanism.
1The NEIDC did not impose supplymanagement but the issue was raisedtoward the end of its operation.
2Calculations and Compact payments,when made, were on a monthly basis.See http:\\www.dairycompact.org forthe monthly prices.
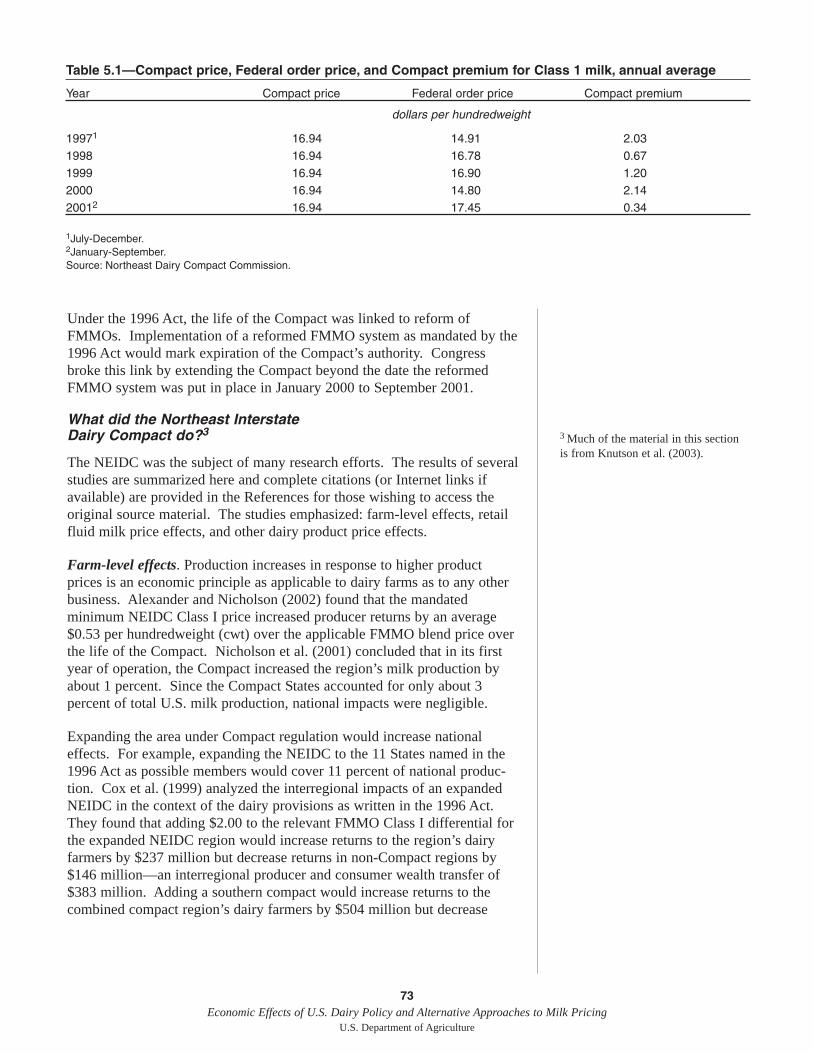
73Economic Effects of U.S. Dairy Policy and Alternative Approaches to Milk Pricing
U.S. Department of Agriculture
3 Much of the material in this sectionis from Knutson et al. (2003).
Under the 1996 Act, the life of the Compact was linked to reform ofFMMOs. Implementation of a reformed FMMO system as mandated by the1996 Act would mark expiration of the Compact’s authority. Congressbroke this link by extending the Compact beyond the date the reformedFMMO system was put in place in January 2000 to September 2001.
What did the Northeast Interstate Dairy Compact do?3
The NEIDC was the subject of many research efforts. The results of severalstudies are summarized here and complete citations (or Internet links ifavailable) are provided in the References for those wishing to access theoriginal source material. The studies emphasized: farm-level effects, retailfluid milk price effects, and other dairy product price effects.
Farm-level effects. Production increases in response to higher productprices is an economic principle as applicable to dairy farms as to any otherbusiness. Alexander and Nicholson (2002) found that the mandatedminimum NEIDC Class I price increased producer returns by an average$0.53 per hundredweight (cwt) over the applicable FMMO blend price overthe life of the Compact. Nicholson et al. (2001) concluded that in its firstyear of operation, the Compact increased the region’s milk production byabout 1 percent. Since the Compact States accounted for only about 3percent of total U.S. milk production, national impacts were negligible.
Expanding the area under Compact regulation would increase nationaleffects. For example, expanding the NEIDC to the 11 States named in the1996 Act as possible members would cover 11 percent of national produc-tion. Cox et al. (1999) analyzed the interregional impacts of an expandedNEIDC in the context of the dairy provisions as written in the 1996 Act.They found that adding $2.00 to the relevant FMMO Class I differential forthe expanded NEIDC region would increase returns to the region’s dairyfarmers by $237 million but decrease returns in non-Compact regions by$146 million—an interregional producer and consumer wealth transfer of$383 million. Adding a southern compact would increase returns to thecombined compact region’s dairy farmers by $504 million but decrease
Table 5.1—Compact price, Federal order price, and Compact premium for Class 1 milk, annual average
Year Compact price Federal order price Compact premium
dollars per hundredweight
19971 16.94 14.91 2.031998 16.94 16.78 0.671999 16.94 16.90 1.202000 16.94 14.80 2.1420012 16.94 17.45 0.34
1July-December.2January-September.Source: Northeast Dairy Compact Commission.
returns in non-Compact regions by $340 million—an interregional producerand consumer wealth transfer of $844 million.4
Retail fluid milk price effects. Food prices tend to be “sticky” downward,meaning they readily rise when farm prices rise but are slow to declinewhen farm prices drop. Outlaw et al. (1994) and Hall et al. (1993) reportedfinding little relationship between prices producers receive for their productsand retail prices. Brand (1963) and Padberg et al. (1993) found that pricingdecisions made by food processors, supermarket operators, and other foodretailers involve complex issues that have little direct relationship to farmprices. Because of retail price stickiness, analyzing the effects of compacts,particularly on consumers, may not be straightforward.
If higher Class I milk prices to fluid milk processors are indeed passed on toretailers, it is reasonable to expect higher consumer prices for fluid milk.Studies verify that this happened in the NEIDC on at least a penny-for-penny basis. Lass et al. (2001) found that average retail price increases inBoston, MA and Hartford, CT were about equal to increases in processors’milk input costs. However, Cotterill and Franklin (2001) found supermarketprices were higher than could be explained by increases in Class I milkprices due to the Compact. Neither study analyzed milk prices or pricespreads over the entire Compact period.
There were occasions during the life of the Compact when the relevantFMMO Class I minimum price rose above or fell below the minimumCompact Class I price. Retail milk prices did not decrease as rapidly whenthe prices fell—a consequence of stickiness as noted above. In any event,the increase in the price of milk was estimated by Cox to result in less thana 1-percent reduction in the region’s demand for fluid milk.
Retail prices reported by FMMO Administrators and processor/retailer pricespreads for whole and 2-percent milk for two Compact markets (Hartford,CT and Boston, MA) and four non-Compact markets (Atlanta, GA,Chicago, IL, Dallas, TX, and Seattle, WA) were analyzed for the periodbetween January 1994 and October 2002.5 When adjusted for labor andfuel costs and seasonality, the processor/retailer price spreads were nohigher for either whole milk or 2-percent milk in the Compact markets thanin the non-Compact markets. Of the six markets studied, price spreads werelowest in Boston (by $0.10 per gallon) and Hartford (by $0.09 per gallon)during the Compact period. Following the Compact period, theprocessor/retailer price spread widened by $0.068 per gallon on whole milkand $0.074 per gallon on 2-percent milk as the cooperative price fell by$0.12 per gallon in the Compact markets. However, it is important to notethat the spread increased even more in the non-Compact markets—by$0.093 per gallon on whole milk and $0.108 per gallon on 2-percent milk.These results suggest that retail prices indeed were sticky in the Compactmarkets, but they were even stickier in the non-Compact markets (Knutsonet al., 2003).
74Economic Effects of U.S. Dairy Policy and Alternative Approaches to Milk Pricing
U.S. Department of Agriculture
4The same type of interregionalwealth transfers occurs when FMMOClass I price differentials areincreased. This occurs because ofregional differences in fluid utilizationamong markets. While liberal poolingprovisions reduce the distortions inproducer revenues, they do not elimi-nate the distortions in product prices.
5Retail prices were those reported bythe USDA’s Agricultural MarketingService (AMS) which, because of lim-ited sampling, may not reflect an aver-age city or municipal area price. Forthe Compact markets, the retail priceworksheets, provided by AMS, wereused to calculate the Compact pricedifferential, which was added to theAMS’s cooperative Class I quotedprice. All city prices were adjusted tothe designated 3.25-percent or 2-per-cent butterfat and converted to a priceper gallon. The price spread was thegallon retail price minus the milk cost.
Other dairy product price effects. The combination of increased milksupply and reduced demand for Class I milk, both due to a higher Compactprice, affects not only fluid milk markets but other dairy product markets aswell. Increased production results in a spillover into manufacturing use,which would be expected to reduce dairy product prices. Cox et al. (1999)found that under alternative scenarios related to an expanded NEIDC, aSouthern Compact, and a combined NEIDC/Southern Compact, averagemanufactured dairy product prices generally fell, particularly for Americancheese ($0.07 to $0.174 per pound) and nonfat dry milk ($0.115 to $0.384per pound). Butter prices actually increased somewhat.
The previous analyses we have reviewed and summarized all concluded thatcertain producers—those supplying milk to the Compact area—receivedextra income through Compact premium payments. However, these bene-fits generated costs for other segments of the dairy industry both inside andoutside the Compact. Higher fluid milk prices inside the Compact raisedcosts to consumers in the Compact area and led to efforts by the CompactCommission to offset them, at least for some consumers (those in the WICprogram for example). Reduced fluid milk consumption due to the higherprices made more milk available for manufacturing so that dairy productprices, on the whole, declined somewhat. If production in the Compactregion expanded at a rate greater than the national average and price supportpurchases were occurring, the Compact producers had to cover that addedCCC product purchase cost. Lower product prices also affected producersoutside the Compact(s) by lowering the value of milk in manufacturinguses. Expanding the area under compact programs implied greater adjust-ments by non-Compact producers
Compacts in Lieu of Federal Dairy Programs
Termination of the NEIDC in 2001 did not quell interest in dairy compacts.In January 2003, legislation was introduced in the House of Representativescalling for restoring the consent of Congress to the Compact and grantingconsent to a Southern Dairy Compact, a Pacific Northwest Dairy Compact,and an Intermountain Dairy Compact.6 The analysis in this report is basedon a scenario similar to the January 2003 proposal. For our analysis, threeCompacts are defined: the Northeast, the Southern, and the Western. Thereare non-Compact areas in the scenario we have chosen to consider. Morewill be said about these areas in a following section.
The analytical framework
The interregional impacts of alternative U.S. dairy policies and programshave been examined using the University of Wisconsin-Madison DairySector Interregional Competition Model (UW-IRCM). The model isdesigned to represent regional supply and demand conditions and dairy poli-cies in the United States at particular points in time. It relies on theFMMOs and California as the basis for spatial definitions and makes exten-sive use of milk component balancing and pricing.7
Two “policy bases,” 2000 BASE and 2001 BASE, were derived to charac-terize the U.S. dairy industry under recent low-price (2000) and high-price(2001) supply and demand situations. The base-year models have been
75Economic Effects of U.S. Dairy Policy and Alternative Approaches to Milk Pricing
U.S. Department of Agriculture
6The legislation, H.R. 324, was intro-duced January 8, 2003, byRepresentative Vitter of Louisiana andwas referred to the Committee on theJudiciary.
7Additional details about the UW-IRCM can be found in Cox andChavas (2001) and Chavas et al.(1998).
76Economic Effects of U.S. Dairy Policy and Alternative Approaches to Milk Pricing
U.S. Department of Agriculture
adjusted to reflect current (2002) program features so that the empiricalresults represent changes from a base that includes current programs. Thesimulations of the base years include the following current policy orprogram features: FMMO pricing as implemented in 2000 for 11 FMMOs;support price at $9.90 per cwt with the butter-powder tilt as in 2002; Cali-fornia pricing rules and MILC payments as defined under the program.The MILC payments were retained given the interpretation that the onlyFederal program eliminated was milk price support. More will be saidabout the implications of this assumption in the sections reporting empir-ical results. Trade-related policies and programs are unchanged fromthose in place in 2002. The base-year simulations are calibrated to U.S.and California production and prices in the base years as well ascommodity reference prices, an example being the Chicago MercantileExchange price for cheese (Cox and Dabidia, 2003).
Defining compacts for analysis
Several States have either expressed strong interest in or have passed legis-lation for participating in potential interregional dairy compact programs.The UW-IRCM model cannot precisely incorporate some individual States’potential participation in an interstate dairy compact. However, by allo-cating these States to the existing FMMO regions defined in the UW-IRCMframework, Compacts may be defined.
The three Compact regions formed for our analysis are the Northeast, theSouthern, and the Western. The Northeast includes the six New EnglandStates plus New York and Pennsylvania. The Southern is comprised ofNorth Carolina, South Carolina, Georgia, Alabama, Mississippi, Louisiana,Arkansas, Tennessee, Missouri, Kentucky, Oklahoma, Kansas, Nebraska,South Dakota, Iowa, Illinois, and Colorado. It is by far the largestCompact, at least in terms of geographic area. Finally, the WesternCompact includes Idaho, Utah, Nevada, Washington, Oregon, and Cali-fornia. The Upper Midwest, Mideast, Southwest, Arizona and FloridaFMMO regions do not directly participate in the defined compacts.
There are other key issues involved with modeling compacts, including thetarget Class I price, pooling provisions, and how milk from outside compactareas is addressed. The Compact Class I target price is assumed to be$16.94 per cwt in all three compact areas. If the relevant FMMO Class Iprice is below the Compact Class I target price, processors must pay acompact premium into the compact region’s producer settlement pool whichin turn will be distributed back to producers.
As for milk entering from outside compacts and compact pooling provi-sions, the UW-IRCM framework includes neither individual farms norplants, so the pooling provisions are difficult to model well. As the NEIDCillustrated, milk produced outside the Compact area still entered that areaand was subject to Compact pricing rules. The analysis here is based onassumed full compact border protection which simplifies the analysis andprovides “upper-bound” simulation results. There are also some restrictionson movements of milk among areas within compact areas that limit extremeresults that run counter to well-established relationships.
77Economic Effects of U.S. Dairy Policy and Alternative Approaches to Milk Pricing
U.S. Department of Agriculture
Simulation results
The alternative dairy policy scenario posits elimination of the Federal dairyprice support program and authorization for three compacts to carry outmilk pricing functions (Cox and Dabidia, 2003). The empirical resultsdiscussed here are presented in tables 5.2 through 5.4. The model solutionsrepresent intermediate run (3-5 years) adjustments to the base scenariosinduced by policy changes and/or supply- or demand-generated shocks Theimplications for the farm level, the wholesale/processing and manufacturinglevel, wholesale and classified prices, government costs, and welfare meas-ures are described. For analyses such as the one presented here it is crit-ical to remember that changes from the base year variable levels areimportant, not the actual levels of the variables that appear.
Farm-level effects
The U.S. average farm milk price (the average over all classes andincluding MILC payments) declines from the 2000 base by almost 3 percentwith the elimination of Federal price support and establishment of threecompact areas (table 5.2). The results are presented in terms of the FMMOregions that still underlie the definitions of the Compact regions in themodel plus California. The nationwide manufacturing milk price declinesand fluid milk price declines in non-Compact regions outweigh the MILCpayment increases. Aggregate production rises by about 0.4 percent(compact region increases exceed non-Compact region decreases), whilerevenues (market returns plus MILC payments) fall by 2.5 percent.
Relatively wide variations in percentage measures of change are observedacross the spatial regions in the model. California shows the largest pricedecrease while the largest increase is in the Southeast. Recall that Cali-fornia’s State pricing regulations are unchanged. The implementation of aWestern Compact does not preclude operation of the State’s own classifiedpricing plan, just as no elimination of Federal milk marketing orders isproposed. The Compact-pricing rule refers to Class I utilization for a muchwider area. In addition, since such a large percentage of California produc-tion goes into manufactured products, the elimination of a program thatdirectly affects those products would be expected to have an impact.Production, on a percentage basis, declines the most in Arizona andincreases the most in the Southeast. Regional revenue changes mirror theprice changes.
Compared with the 2001 base, reflecting a high-price situation, the averageU.S. price rises less than 1 percent, as do production and revenue. Pricedeclines in the non-Compact areas are smaller relative to the 2001 base situ-ation (table 5.2) and regional price changes are smaller in percentage terms.The price still declines most in California, but by only 2.5 percent, andincreases 10.4 percent in the Southeast. Changes in production andrevenues are also less than in the 2000 base case—only in the Southeast isany production change greater than 1 percent in either direction. Revenuefalls most in Arizona (2.9 percent) and the increase is greatest in the South-east (15 percent).
The pattern of gains and losses among the regions exhibits one clearfeature—the Southeast subarea of the larger Southeastern Compact benefits
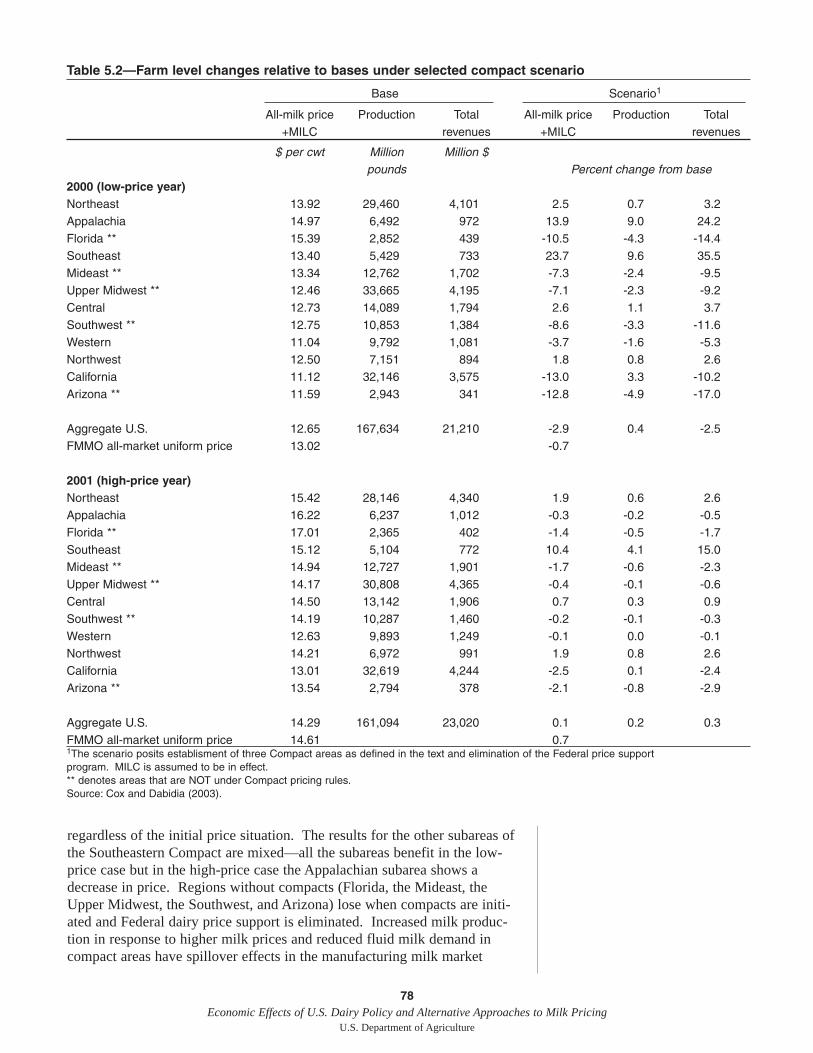
regardless of the initial price situation. The results for the other subareas ofthe Southeastern Compact are mixed—all the subareas benefit in the low-price case but in the high-price case the Appalachian subarea shows adecrease in price. Regions without compacts (Florida, the Mideast, theUpper Midwest, the Southwest, and Arizona) lose when compacts are initi-ated and Federal dairy price support is eliminated. Increased milk produc-tion in response to higher milk prices and reduced fluid milk demand incompact areas have spillover effects in the manufacturing milk market
78Economic Effects of U.S. Dairy Policy and Alternative Approaches to Milk Pricing
U.S. Department of Agriculture
Table 5.2—Farm level changes relative to bases under selected compact scenario
Base Scenario1
All-milk price Production Total All-milk price Production Total+MILC revenues +MILC revenues
$ per cwt Million Million $pounds Percent change from base
2000 (low-price year)Northeast 13.92 29,460 4,101 2.5 0.7 3.2Appalachia 14.97 6,492 972 13.9 9.0 24.2Florida ** 15.39 2,852 439 -10.5 -4.3 -14.4Southeast 13.40 5,429 733 23.7 9.6 35.5Mideast ** 13.34 12,762 1,702 -7.3 -2.4 -9.5Upper Midwest ** 12.46 33,665 4,195 -7.1 -2.3 -9.2Central 12.73 14,089 1,794 2.6 1.1 3.7Southwest ** 12.75 10,853 1,384 -8.6 -3.3 -11.6Western 11.04 9,792 1,081 -3.7 -1.6 -5.3Northwest 12.50 7,151 894 1.8 0.8 2.6California 11.12 32,146 3,575 -13.0 3.3 -10.2Arizona ** 11.59 2,943 341 -12.8 -4.9 -17.0
Aggregate U.S. 12.65 167,634 21,210 -2.9 0.4 -2.5FMMO all-market uniform price 13.02 -0.7
2001 (high-price year)Northeast 15.42 28,146 4,340 1.9 0.6 2.6Appalachia 16.22 6,237 1,012 -0.3 -0.2 -0.5Florida ** 17.01 2,365 402 -1.4 -0.5 -1.7Southeast 15.12 5,104 772 10.4 4.1 15.0Mideast ** 14.94 12,727 1,901 -1.7 -0.6 -2.3Upper Midwest ** 14.17 30,808 4,365 -0.4 -0.1 -0.6Central 14.50 13,142 1,906 0.7 0.3 0.9Southwest ** 14.19 10,287 1,460 -0.2 -0.1 -0.3Western 12.63 9,893 1,249 -0.1 0.0 -0.1Northwest 14.21 6,972 991 1.9 0.8 2.6California 13.01 32,619 4,244 -2.5 0.1 -2.4Arizona ** 13.54 2,794 378 -2.1 -0.8 -2.9
Aggregate U.S. 14.29 161,094 23,020 0.1 0.2 0.3
FMMO all-market uniform price 14.61 0.71The scenario posits establisment of three Compact areas as defined in the text and elimination of the Federal price supportprogram. MILC is assumed to be in effect.** denotes areas that are NOT under Compact pricing rules.Source: Cox and Dabidia (2003).
which are no longer mitigated by price support activities. These impacts aregreater in a low-price supply and demand context, e.g. 2000, than a high-price context, e.g. 2001. Some of these 2000 (versus 2001) regionalrevenue losses are substantial: the Mideast (-9.5 percent vs. -2.3 percent);the Upper Midwest (-9.2 percent vs. -0.6 percent); and California (-10.2percent vs. -2.4 percent).
Wholesale/processing and manufacturing level effects
Elimination of the dairy price support program results in decreased whole-sale prices for all products except fluid milk and butter compared with thebase scenarios (table 5.3). All the prices are national averages, i.e. averagedover all the regional results. Average fluid milk prices increase 11.9 percentfor the 2000 base situation and butter is up 3.2 percent. The higher fluidprices in the compacts generate an average 1.6-percent decline in fluid milkproduction (which generally is assumed equal to consumption). As moremilk becomes available for manufactured products, production increases,but not in all cases. The price increases for fluid milk and butter are 7.6 and2 percent, respectively, in the 2001 base situation, with fluid consumptiondown 1 percent.
The importance of the dairy price support program in a low-price year isevident in the comparison of the reduction in American cheese prices (-12.9percent in 2000 vs. -3.1 percent in 2001), and nonfat dry milk prices (-28.6percent vs. -5.3 percent). American cheese production falls 4.3 percent inthe 2000 case and increases slightly in the 2001 case. Aggregate U.S.wholesale dairy product revenues decrease 2.4 percent under 2000 marketconditions while increasing 0.6 percent under 2001 conditions. Fluid milkprocessors’ revenues increase in both cases, by 10 percent for 2000 and by6.5 percent for 2001.
Classified prices
Given the drops in the wholesale prices of American cheese and nonfat drymilk in the two scenarios, FMMO Class III and California Class 4b pricesfall about 17 and 13.4 percent, respectively, from the 2000 base, and 4.1 and3.2 percent, respectively, from the 2001 base (table 5.4). FMMO Class IVand California Class 4a prices fall by 15 and 16 percent, respectively,(2000) and 2.7 and 2.7 percent (2001). These lower classified pricesgenerate considerably less regional price differences that are offset by largercompact premiums and larger MILC payments. Assessing these offsettingimpacts analytically is very difficult.
Government costs and economicsurplus measures
Because the scenario posits elimination of the Federal dairy price supportprogram, CCC costs drop sharply (-62.3 percent) in 2000, and are elimi-nated in 2001 (table 5.4). However, removing CCC purchase program coststends to raise other costs, including MILC program costs. Lower Class IIIand Class IV (manufacturing milk) prices in FMMOs—the Class I pricemovers—reduce relevant Class I reference prices in compacts, therebyincreasing both the compact premium and the MILC payment rate. MILC
79Economic Effects of U.S. Dairy Policy and Alternative Approaches to Milk Pricing
U.S. Department of Agriculture
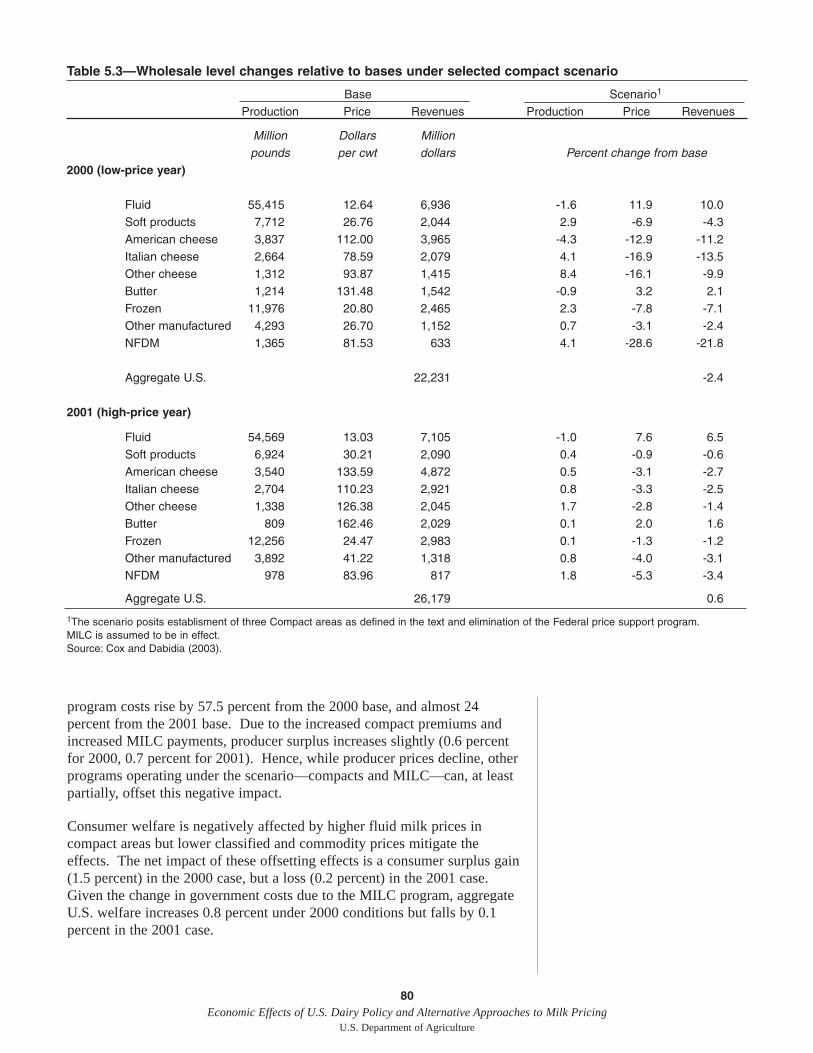
program costs rise by 57.5 percent from the 2000 base, and almost 24percent from the 2001 base. Due to the increased compact premiums andincreased MILC payments, producer surplus increases slightly (0.6 percentfor 2000, 0.7 percent for 2001). Hence, while producer prices decline, otherprograms operating under the scenario—compacts and MILC—can, at leastpartially, offset this negative impact.
Consumer welfare is negatively affected by higher fluid milk prices incompact areas but lower classified and commodity prices mitigate theeffects. The net impact of these offsetting effects is a consumer surplus gain(1.5 percent) in the 2000 case, but a loss (0.2 percent) in the 2001 case.Given the change in government costs due to the MILC program, aggregateU.S. welfare increases 0.8 percent under 2000 conditions but falls by 0.1percent in the 2001 case.
80Economic Effects of U.S. Dairy Policy and Alternative Approaches to Milk Pricing
U.S. Department of Agriculture
Table 5.3—Wholesale level changes relative to bases under selected compact scenario
Base Scenario1
Production Price Revenues Production Price Revenues
Million Dollars Millionpounds per cwt dollars Percent change from base
2000 (low-price year)
Fluid 55,415 12.64 6,936 -1.6 11.9 10.0Soft products 7,712 26.76 2,044 2.9 -6.9 -4.3American cheese 3,837 112.00 3,965 -4.3 -12.9 -11.2Italian cheese 2,664 78.59 2,079 4.1 -16.9 -13.5Other cheese 1,312 93.87 1,415 8.4 -16.1 -9.9Butter 1,214 131.48 1,542 -0.9 3.2 2.1Frozen 11,976 20.80 2,465 2.3 -7.8 -7.1Other manufactured 4,293 26.70 1,152 0.7 -3.1 -2.4NFDM 1,365 81.53 633 4.1 -28.6 -21.8
Aggregate U.S. 22,231 -2.4
2001 (high-price year)
Fluid 54,569 13.03 7,105 -1.0 7.6 6.5Soft products 6,924 30.21 2,090 0.4 -0.9 -0.6American cheese 3,540 133.59 4,872 0.5 -3.1 -2.7Italian cheese 2,704 110.23 2,921 0.8 -3.3 -2.5Other cheese 1,338 126.38 2,045 1.7 -2.8 -1.4Butter 809 162.46 2,029 0.1 2.0 1.6Frozen 12,256 24.47 2,983 0.1 -1.3 -1.2Other manufactured 3,892 41.22 1,318 0.8 -4.0 -3.1NFDM 978 83.96 817 1.8 -5.3 -3.4
Aggregate U.S. 26,179 0.6
1The scenario posits establisment of three Compact areas as defined in the text and elimination of the Federal price support program.MILC is assumed to be in effect.Source: Cox and Dabidia (2003).
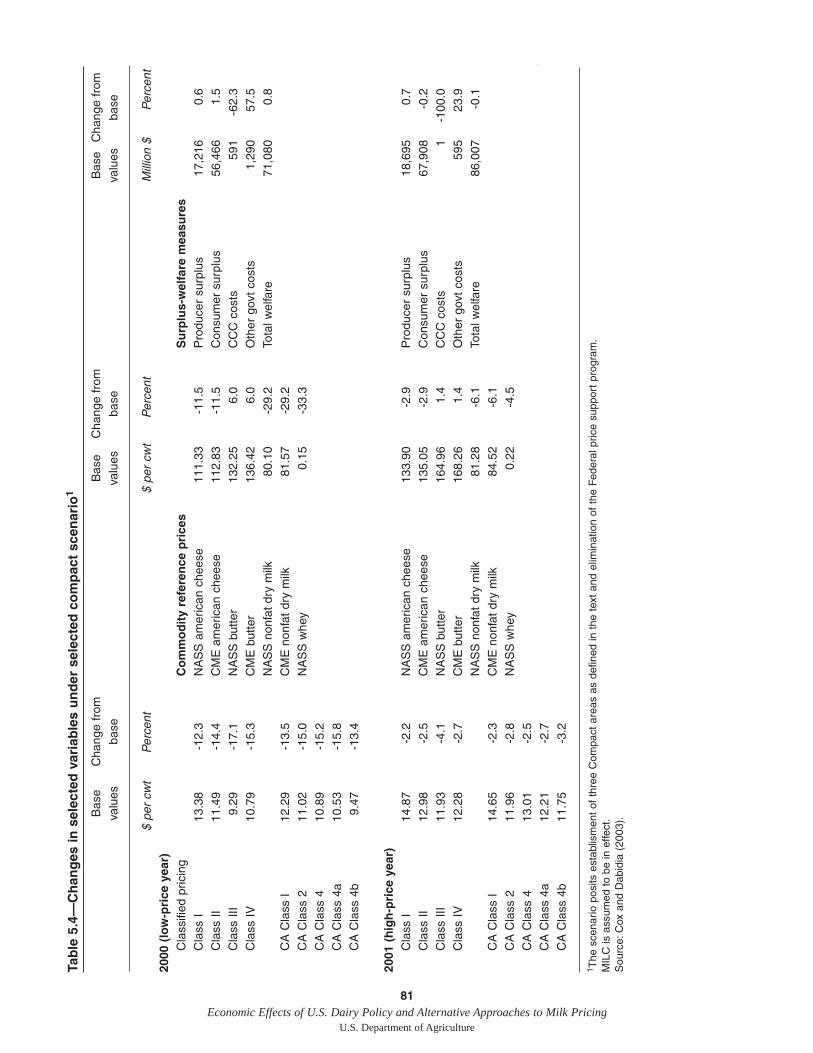
81Economic Effects of U.S. Dairy Policy and Alternative Approaches to Milk Pricing
U.S. Department of Agriculture
Tab
le 5
.4—
Ch
ang
es in
sel
ecte
d v
aria
ble
s u
nd
er s
elec
ted
co
mp
act
scen
ario
1
Bas
eC
hang
e fr
om
Bas
e C
hang
e fr
om
Bas
eC
hang
e fr
omva
lues
base
valu
esba
seva
lues
base
$ pe
r cw
tP
erce
nt$
per
cwt
Per
cent
Mill
ion
$P
erce
nt20
00 (
low
-pri
ce y
ear)
Cla
ssifi
ed p
ricin
g C
om
mo
dit
y re
fere
nce
pri
ces
Su
rplu
s-w
elfa
re m
easu
res
Cla
ss I
13.3
8 -1
2.3
NA
SS
am
eric
an c
hees
e11
1.33
-1
1.5
Pro
duce
r su
rplu
s17
,216
0.6
Cla
ss I
I11
.49
-14.
4C
ME
am
eric
an c
hees
e11
2.83
-1
1.5
Con
sum
er s
urpl
us56
,466
1.5
Cla
ss I
II9.
29
-17.
1N
AS
S b
utte
r13
2.25
6.
0C
CC
cos
ts59
1-6
2.3
Cla
ss I
V10
.79
-15.
3C
ME
but
ter
136.
42
6.0
Oth
er g
ovt
cost
s1,
290
57.5
NA
SS
non
fat
dry
milk
80.1
0 -2
9.2
Tota
l wel
fare
71,0
800.
8C
A C
lass
I12
.29
-13.
5C
ME
non
fat
dry
milk
81.5
7 -2
9.2
CA
Cla
ss 2
11.0
2 -1
5.0
NA
SS
whe
y0.
15
-33.
3C
A C
lass
410
.89
-15.
2C
A C
lass
4a
10.5
3 -1
5.8
CA
Cla
ss 4
b9.
47
-13.
4
2001
(h
igh
-pri
ce y
ear)
Cla
ss I
14.8
7 -2
.2N
AS
S a
mer
ican
che
ese
133.
90
-2.9
Pro
duce
r su
rplu
s18
,695
0.7
Cla
ss I
I12
.98
-2.5
CM
E a
mer
ican
che
ese
135.
05
-2.9
Con
sum
er s
urpl
us67
,908
-0.2
Cla
ss I
II11
.93
-4.1
NA
SS
but
ter
164.
96
1.4
CC
C c
osts
1-1
00.0
Cla
ss I
V12
.28
-2.7
CM
E b
utte
r16
8.26
1.
4O
ther
gov
t co
sts
595
23.9
NA
SS
non
fat
dry
milk
81.2
8 -6
.1To
tal w
elfa
re86
,007
-0.1
CA
Cla
ss I
14.6
5 -2
.3C
ME
non
fat
dry
milk
84.5
2 -6
.1C
A C
lass
211
.96
-2.8
NA
SS
whe
y0.
22
-4.5
CA
Cla
ss 4
13.0
1 -2
.5C
A C
lass
4a
12.2
1 -2
.7C
A C
lass
4b
11.7
5 -3
.2
1 The
sce
nario
pos
its e
stab
lism
ent
of t
hree
Com
pact
are
as a
s de
fined
in t
he t
ext
and
elim
inat
ion
of t
he F
eder
al p
rice
supp
ort
prog
ram
.M
ILC
is a
ssum
ed t
o be
in e
ffect
.S
ourc
e:C
ox a
nd D
abid
ia (
2003
).
Summary
The analysis suggests that compacts can generate substantive gains to theirregions and that these gains will be larger in years with lower prices.Compacts increase Class I price differences among regions. To the extentthat compacts increase regional milk prices, regional milk productionincreases while the higher Class I prices lead to reduced fluid milkconsumption. This generates more milk that must find an outlet in themanufacturing product sector, hence reducing manufactured dairy productprices. Regions with substantial manufacturing use generally suffer lossesdue to this type of policy. Consumers of fluid milk in compact areas losedue to higher Class I prices in the compact regions, while consumers ofmanufactured dairy products tend to gain due to the spillovers of extra milkon manufacturing markets, which lowers manufactured dairy product prices.In aggregate, however, consumers lose due to higher expenditure on Class Imilk dominating reduced manufactured expenditures.
Direct payment programs like the 2002 MILC program can partially offsetlosses (or enhance the gains) due to compacts, but there is a cost. That costis borne by taxpayers in the form of the direct government payments.Whenever the Class I price mover is reduced relative to the MILC targetprice, then the MILC payments will be increased. This is evident in thescenario presented here—eliminating the dairy price support programresults in lower prices for all classes of milk (by lowering both the Class IIIand Class IV prices). However, with compacts in place, lowering the ClassI price mover will increase the compact premium and offset the loweroverall reduction in class prices in those regions with compacts. Under theconstraints we have placed on the empirical model here, it appears elimina-tion of the Federal price support program, which underpins all producerprices, results in price effects that Compact payments and MILC paymentsdo not offset. If the compacts were to try to address these negative priceeffects, they would have the same options available to the Federal Govern-ment—they could operate a purchase program (unlikely) or attempt tomanage supply. Whether supply management could be implemented atsome subnational level is open to question.
The scenario employed in this analysis is similar to a proposal made inJanuary 2003 to reauthorize and expand compacts. The scenario envisionedthe existence of non-Compact areas and employed some rather restrictiveassumptions to derive empirical estimates of the effects on dairy industrymarket indicators (e.g., prices and production). The net impacts of gainsand losses will vary by region, depending on several factors. Those factorsinclude whether the region has a compact; the magnitude of Class I salesand/or utilization, the shares of milk going into manufactured products(especially cheese and nonfat dry milk), the shares of milk productioneligible for MILC payments, and interregional competitiveness.
There are obvious alternative specifications of this scenario. It could behypothesized that compact pricing across the areas defined would not be thesame. There could also be more or fewer compacts defined. The retentionof the MILC payment program for all producers could be modified so thatonly non-Compact producers, in cases where there are such areas, would
82Economic Effects of U.S. Dairy Policy and Alternative Approaches to Milk Pricing
U.S. Department of Agriculture
receive them. Or, MILC payments could be eliminated. Each individualscenario that might be considered has its own unique features to be incorpo-rated in an empirical analysis.
Even if compacts covered the entire country, there would still be gains andlosses. Compacts could not readily restrict commerce so that the pricesreceived by producers in any one area could be the result of marketingactivities in another. Compacts do not inherently alter sales patterns orutilization rates. And, competitiveness among producers, regardless of loca-tion, will still be linked to local conditions that affect production costs. Thecontrasts between the results for a low-price year (2000) and for a high-price year (2001) are as expected—contemplated or hypothesized dairypolicy changes have smaller effects in periods of strong prices.
Implications for State Pricing and State-Mandated Over-Order Premiums
State pricing and over-order premium programs bear many similarities tointerstate compacts. Like State pricing programs, which operate in conjunc-tion with, or in lieu of, Federal milk marketing orders, the Compact analysisassumed that Federal marketing orders remained in effect. Most Statepricing programs, like the hypothetical compacts analyzed in this chapter,establish Class I milk prices.
The analysis of interstate compacts can provide some insights into theeffects of some State pricing and State-mandated over-order premiumprograms. State pricing programs that establish Class I prices above theprevailing Federal market order price in surrounding States raise the price offluid milk to consumers in the State and reduce fluid consumption. Higherfluid milk prices may induce an increase in milk production, which finds anoutlet in manufacturing use. If the spillover to the manufacturing market islarge, manufacturing milk prices could fall, as they do in the hypotheticalcompact example. In this instance, producers in States without pricingprograms would be adversely affected.
However, there are several important differences between compacts andState programs. While the compact analysis assumed that all compacts usedthe same price for Class I milk, existing State pricing programs may havedifferent prices. The compacts regulate only Class I milk, while some States(like California) regulate other milk classes. And while the analysis assumedthat compacts augment the Class I price, some State pricing programs—notably California—may result in Class I prices below those of thesurrounding Federal marketing order market areas.
83Economic Effects of U.S. Dairy Policy and Alternative Approaches to Milk Pricing
U.S. Department of Agriculture
Conclusions
Dairy Policy Has a Modest Impact
An examination of dairy program impacts suggests that Federal dairyprograms raise the all-milk price by only about 1 percent, and raise totalproducer revenues (returns plus Government payments) by 3 percent, onaverage, over 5 years. While producers are, as a whole, better off withdairy programs, these programs do raise consumer costs, albeit modestly,and increase Government expenditures.
The analysis shows that current programs both increase and decrease the all-milk price. The Milk Income Loss Contract (MILC) program, by increasingproducer returns through production-linked payments, expands production,and reduces the milk price. Without the MILC program, the remaining dairyprograms raise the all-milk price by a greater amount—4 percent as opposedto about 1 percent—on average over 5 years.
Federal dairy programs, by increasing farm-level returns, may enablehigh-cost farms to remain in business longer. But higher prices can onlyimprove the viability of high-cost farms in the short to medium term. Inthe longer run, high-cost farms will have difficulty competing with low-cost dairy producers. Higher prices improve the profitability of low-costdairy producers, which may enable them to expand production and gainmarket share.
The stability of prices and returns is especially important to dairy farmssince, on average, they tend to be less diversified and more dependent onincome from the farm business than other farms. Intervention’s impact onfarms varies regionally. An analysis of dairy program effects on the finan-cial conditions of representative farms around the United States reveals thatthe current policy structure may lower the returns of some Western dairies.
Dairy programs raise the retail price of fluid milk, which affects bothconsumer expenditures on food and the cost of operating food and nutritionprograms. In the case of the Special Supplemental Nutrition Program forWomen, Infants, and Children (WIC), it is possible that higher fluid milkprices could affect participation. Because WIC is a discretionary grantprogram funded by annual appropriations, the number of participantsdepends on the appropriation and the cost of operating the program. Otherfood and nutrition programs are entitlement programs, and their costs areindexed to price indices that increase Government outlays when dairyprograms raise product prices. Higher dairy prices are therefore unlikely toaffect participation, but could affect how food stamp recipients choose tospend their food dollars.
National dairy programs have almost no impact on aggregate economicactivity. Both nationally and at a broad regional level the industry’s impacton employment is less than one-tenth of 1 percent of total employment. Inareas that are highly dependent on milk production, impacts are likely to begreater. Because farm input (like machinery and fertilizer) production islocated in metropolitan areas—as is much of the upstream processing and
84Economic Effects of U.S. Dairy Policy and Alternative Approaches to Milk Pricing
U.S. Department of Agriculture
distribution activity—dairy programs very likely have greater impacts onmetropolitan than on nonmetropolitan employment.
State Management of Milk Supplies and PricesRaises Difficult Issues
Unlike most other agricultural commodity markets, milk markets have along history of State intervention. However, as milk markets have becomeincreasingly integrated across State boundaries, the potential for effectiveState-level intervention in dairy markets has diminished. Today, of themajor milk-producing States, only California and Pennsylvania setminimum prices for milk to any great extent.
The analysis of a State-level mechanism for managing milk prices extendsthe model of the Northeast Interstate Dairy Compact (NEIDC) by hypothe-sizing the formation of three interstate compacts. The study assumes thatthese compacts are implemented while eliminating the Federal milk pricesupport program (there is no Federal supply management of milk) but allother programs—primarily MILC and Federal milk marketing orders—areassumed to remain in place.
In general, compacts establish a minimum price that processors are requiredto pay for Class I milk, the milk used in fluid beverage products. When thiscompact price is greater than the Federal Milk Marketing Order price, thedifference (or some share of it) is returned to producers selling milk in thecompact region. Higher returns to these producers lead to increased milkproduction and lower fluid milk consumption as consumers react to thehigher retail prices. The resulting excess supply of milk above fluid require-ments within the compact region spills over to the manufacturing milkmarket. As a result, manufacturing milk prices decline, as does the price offluid milk in areas outside the compacts. These effects are greatest duringlow-price years.
As long as fluid utilization is high enough, returns to dairy farmerssupplying the compact region increase as the higher fluid milk price morethan offsets any decline in the price of manufacturing milk. However, lowermanufacturing milk prices are felt nationally and the returns to dairyfarmers outside the compact region decline. Farmers in regions with higherlevels of manufacturing use for their milk suffer the greatest losses from thistype of program because they do not receive a MILC payment that dampensthe loss of revenues from fluid milk.
Consumers both outside and within the compact region benefit from lowerprices for manufactured dairy products. However, consumers withincompact regions spend more on fluid milk, while consumers outside thecompact region would spend less on fluid milk.
Regional compacts may substitute for price support within these regions, aslong as a large proportion of production is sold into the higher-priced fluidmilk market, but are unlikely to substitute for price support on a nationallevel. Extending compacts across the entire country would increase theimpact on national milk production. Without some form of supply control,
85Economic Effects of U.S. Dairy Policy and Alternative Approaches to Milk Pricing
U.S. Department of Agriculture
higher fluid prices applied to all producers would induce increased milkproduction that would spill over to the manufacturing milk market, drivingdown the price of milk for manufacturing use even further. The averageproducer price across all uses would decline further, rendering pricemanagement efforts ineffective.
This analysis raises questions regarding other means of State support. WereStates to pursue a support program similar to the Federal milk price supportprogram, States would need to address program funding, establish pricesupport levels, and, if product purchase programs were implemented,dispose of surplus stocks. If supply control programs were adopted, addi-tional considerations include establishing and enforcing quota levels andpenalties or incentives for compliance. Such systems raise questionsregarding cross-border issues—how to deal with milk flowing to areas withdifferent price support or quota levels. While State or regional managementof milk prices has received considerable attention as a possible alternative tocurrent policy, this analysis suggests that it likely raises even more difficultissues than current policy.
86Economic Effects of U.S. Dairy Policy and Alternative Approaches to Milk Pricing
U.S. Department of Agriculture
ReferencesAlexander, Craig, and Charles Nicholson, “Interstate Dairy Compacts,”Extension Education Committee, National Institute for Livestock and DairyPolicy and Cornell Program on Dairy Markets and Policy, Cornell Univer-sity, Ithaca, NY, 2002.
Alexander, Craig, John Siebert, David Anderson, and Ron Knutson. “StateMilk Marketing Order Regulation and Interstate Dairy Compacts.” DairyMarkets and Policy: Issues and Options, Cornell University Program onDairy Markets and Policy, No. O-11, Ithaca, NY, October 1998.
Anderson, David P., Joe L. Outlaw, and Robert B. Schwart. “StructuralChange in the Dairy Industry.” Paper presented to Looking Ahead…orLooking Behind? 10th Annual Workshop for Dairy Economists and PolicyAnalysts. Memphis, TN, April 23-24, 2003, http://www.dairy.cornell.edu/CPDMP/Pages/Workshops/Memphis03/Anderson.pdf.
Bailey, Kenneth W. Impact of MPC Imports on 2002 U.S. Cheese Produc-tion. Staff Paper 362. Department of Agricultural Economics and Rural Soci-ology, The Pennsylvania State University, University Park, PA, March 2003.
_________________. “Impact of the Northeast Dairy Compact onConsumer Prices for Fluid Milk.” Review of Agricultural Economics.Volume 25, Number 1, 2003, pp. 108-122.
_________________. Implications of Dairy Imports: The Case of MilkProtein Concentrates. Staff Paper 353. Department of AgriculturalEconomics and Rural Sociology, The Pennsylvania State University,University Park, PA, June 2002.
_______________. Imports of Milk Protein Concentrates: Assessing theConsequences. Staff Paper 343. Department of Agricultural Economics andRural Sociology, The Pennsylvania State University, University Park, PA,November 2001.
Balagtas, Joseph V., Bradley J. Rickard, and Daniel A. Sumner. “Effectsof Proposed Trade Barriers for Milk Protein Concentrate and CaseinImports on the U.S. Dairy Industry.” Paper presented at American Agri-cultural Economics Association annual meeting, Long Beach, CA. July28-31, 2002.
Balagtas, Joseph V., and Daniel A. Sumner. “Forces Shaping the U.S. DairyIndustry,” University of California, Davis, unpublished manuscript, April2003.
__________________________________. “The Effect of the NortheastDairy Compact on Producers and Consumers, with Implications of CompactContagion.” Review of Agricultural Economics. Volume 25, Number 1,2003, pp. 123-144.
87Economic Effects of U.S. Dairy Policy and Alternative Approaches to Milk Pricing
U.S. Department of Agriculture
Blayney, Don P. The Changing Landscape of U.S. Milk Production. U.S.Department of Agriculture, Economic Research Service. Statistical BulletinNo. 978, June 2002 (a).
_______________. “Structural Changes in Fluid Milk ProcessingContinue.” Livestock, Dairy and Poultry Outlook. U.S. Department ofAgriculture, Economic Research Service, LDP-M-101. November 2002 (b).
Blayney, Don P., and Alden C. Manchester. “Large Companies Active inChanging Dairy Industry.” FoodReview, Volume 23, Issue 2. U.S. Depart-ment of Agriculture, Economic Research Service, May-August 2000.
Blayney, Don P., and James Miller. “Concentration and Structural Change inDairy Processing and Manufacturing.” Paper presented to LookingAhead…or Looking Behind? 10th Annual Workshop for Dairy Economistsand Policy Analysts. Memphis, TN, April 23-24, 2003,http://www.dairy.cornell.edu/CPDMP/Pages/Workshops/Memphis03/Blayney.pdf.
Blayney, Don P., James J. Miller, and Richard P. Stillman. Dairy: Back-ground for 1995 Farm Legislation. U. S. Department of Agriculture,Economic Research Service, Agricultural Economic Report No. 705, April1995.
Boynton, Robert D. “Milk Marketing in California.” Dairy Institute of Cali-fornia, Sacramento, CA, February 1992.
Brand, E.A. Modern Supermarket Operation. Fairchild Publications, NewYork, NY, 1963.
Brown, S. “The Effect on the United States Dairy Industry of RemovingCurrent Federal Regulations.” Food and Agricultural Policy Research Insti-tute, University of Missouri, Columbia, MO, FAPRI-UMC report #03-03,April 2003.
Butler, L.J. “How did California become king of milk mountain?” Hoard’sDairyman, March 10, 2002.
_____________. Maintaining the Competitive Edge. University of Cali-fornia—Agricultural Issues Center. 1992.
______________. “The California Make Allowance,” Testimony submittedto the House Agriculture subcommittee on Livestock, Dairy and Poultry,Washington, DC, April 30, 1990.
California Department of Food and Agriculture. California Dairy IndustryStatistics, 1950-1998.
___________________. California Dairy Information Bulletin, Decemberissues, 1950-1998.
88Economic Effects of U.S. Dairy Policy and Alternative Approaches to Milk Pricing
U.S. Department of Agriculture
California Department of Food and Agriculture, Dairy Marketing Branch.“California Milk Pricing Formulas,”http://www.cdfa.ca.gov/dairy/pdf/SP108_Milk_PricFormulas_2003.pdf.
Cessna, Jerry. Milk Protein Products and Related Government Policy Issues.U.S. Department of Agriculture, Agricultural Marketing Service, February2004, http://www.ams.usda.gov/dairy/mlk_protein_rpt.pdf.
Chavas, J-P., T.L. Cox, and E.V. Jesse. “Spatial Allocation and theShadow Pricing of Product Characteristics.” Agricultural Economics.1998, pp. 1-19.
Chite, Ralph M. Dairy Policy Issues. CRS Issue Brief for Congress. Libraryof Congress, Congressional Research Service, Order Code IB97011,updated July 30, 2003, http://www.ncseonline.org/NLE/CRSreports/03Aug/IB97011.pdf.
Chung, Chanjin, and Harry M. Kaiser. “Do Farmers Get an Equal Bang forTheir Buck from Generic Advertising Programs?” Journal of Agriculturaland Resource Economics. Volume 25, No. 1, July 2000, pp. 147-158.
Cotterill, R.W., and A.W. Franklin. “The Public Interest and PrivateEconomic Power: A Case of the Northeast Interstate Dairy Compact,” FoodMarketing Policy Center, University of Connecticut, Storrs, CT, 2001.
Cotterill, Ronald W., and Adam N. Rabinowitz. “Analysis of Two RelatedMilk Price Approaches to Address the Noncompetitive Pricing Problem inthe Milk Industry: The 40-40 Consumer Approach and the Farmer andConsumer Fair Share Approach.” Food Marketing Policy Center, Universityof Connecticut, Storrs, CT, January 10, 2003.
Cox, Thomas L., and Jean-Paul Chavas. “An Interregional Analysis of PriceDiscrimination and Domestic Policy Reform in the U.S. Dairy Sector.”American Journal of Agricultural Economics, Vol. 83, No. 1, February2001, pp. 89-106.
Cox, Tom, Bob Cropp, and Will Hughes. “Interregional Analysis of Inter-state Dairy Compacts.” Marketing and Policy Briefing Paper No. 69,University of Wisconsin-Madison, July 1999.
Cox, Tom, and Hooman Dabidia. “Interregional Impacts of 2002 U.S. DairyPolicies: NE/South/Western Dairy Compacts and Deregulation Scenarios.”Paper presented to Looking Ahead…or Looking Behind? 10th AnnualWorkshop for Dairy Economists and Policy Analysts. Memphis, Tennessee,April 23-24, 2003, http://www.dairy.cornell.edu/CPDMP/Pages/Work-shops/Memphis03/Cox.pdf.
Cropp, Bob. “Dairy Cooperatives and Federal Milk Marketing Orders.”Paper presented to Looking Ahead…or Looking Behind? 10th AnnualWorkshop for Dairy Economists and Policy Analysts. Memphis, Tennessee,April 23-24, 2003, http://www.dairy.cornell.edu/CPDMP/Pages/Work-shops/Memphis03/Cropp.pdf.
89Economic Effects of U.S. Dairy Policy and Alternative Approaches to Milk Pricing
U.S. Department of Agriculture
Cropp, Bob, and Mark Stephenson. “Dairy Policy Options and Issues for the2002 Farm Bill.” The 2002 Farm Bill: Policy Options and Consequences.The Farm Foundation, 2001, http://www.farmfoundation.org/2002FB/3-3.pdf.
Dobson, W. D., and Paul Christ. Structural Change in the U.S. DairyIndustry: Growth in Scale, Regional Shifts in Milk Production andProcessing, and Internationalism. Department of Agricultural and AppliedEconomics, University of Wisconsin-Madison, Staff Paper 438, December2000.
DuPuis, E. M. “Sub-National State Institutions and the Organization ofAgricultural Resource Use: The Case of the Dairy Industry.” Rural Soci-ology 58, 1993, pp. 440-460.
Eberle, Phillip R., Kenneth E. Griswold, William C. Peterson, C. MatthewRendleman and Manish Ruwali. “Economic Impacts of Alternative DairyProduction Systems on the Illinois Economy: A Procedure for EvaluatingAlternative Production Systems in IMPLAN.” Prepared for presentation atthe Missouri Valley Economic Association’s 39th Annual Meeting, St.Louis, MO, February 27-March 1, 2003.
Gardner, Bruce L. American Agriculture in the Twentieth Century—How itFlourished and What It Cost. Harvard University Press, Cambridge, MA,2002.
Gilbert, J., and R. Akor. “Increasing Structural Divergence in U.S. Dairying:California and Wisconsin Since 1950.” Rural Sociology 53, 1988, pp. 56-72.
Hall, Charles L., et al. Retail and Wholesale Prices for Produce. AFPCPolicy Research Report 93-3. Texas A&M University System, CollegeStation, TX, January 1993.
Hamm, Larry G. The 1990 Dairy Legislation: An Unfinished Dairy Policy.Michigan State University, Department of Agricultural Economics, StaffPaper No. 91-06, East Lansing, MI, January 1991.
Harris, Hal. “U.S. Dairy Programs and World Trade Policy Issues” inLooking Ahead. . . or Looking Behind? Proceedings of the 10th AnnualWorkshop for Dairy Economists and Policy Analysts. Memphis, TN, April23 and 24, 2003,http://www.dairy.cornell.edu/CPDMP/Pages/Workshops/Memphis03/Harris.pdf.
Harris, J. Michael, Phil R. Kaufman, Steve W. Martinez (coordinator), andCharlene Price. The U.S. Food Marketing System, 2002—Competition,Coordination, And Technological Innovations Into the 21st Century. U.S.Department of Agriculture, Economic Research Service, AgriculturalEconomic Report No. 811, June 2002.
90Economic Effects of U.S. Dairy Policy and Alternative Approaches to Milk Pricing
U.S. Department of Agriculture
Heien, D.M., and C. RoheimWessels. “The Demand for Dairy Products:Structure, Prediction and Decomposition.” American Journal of AgriculturalEconomics, Vol. 70, May 1988, pp. 219-228.
Helmberger, P., and Y. Chen. “Economic Effects of U.S. Dairy Programs.”Journal of Agricultural and Resource Economics, Vol. 19, December 1994,pp. 225-238.
Huang, K. S. U.S. Demand for Food: A Complete System of Price andIncome Effects. U.S. Department of Agriculture, Economic ResearchService. Technical Bulletin No. 1714, 1985.
Jackson-Smith, Douglas, and Bradford Barham. The Changing Face ofWisconsin Dairy Farms: A Summary of PATS’ Research on StructuralChange in the 1990s. PATS Research Report No. 7, University ofWisconsin-Madison, College of Agricultural and Life Sciences, August2000.
Jesse, E. “Section 102: The California Make Allowance Issue.” Universityof Wisconsin-Madison, Department of Agricultural Economics Staff PaperNo. 46. April 1994.
________________. U.S. Imports of Concentrated Milk Proteins: What WeKnow and Don’t Know. Market and Policy Briefing Paper 80. Dept. ofAgricultural and Applied Economics, University of Wisconsin-Madison.February, 2003.
Jesse, Edward V. “Facing Up to the Western Dairy Boom.” RethinkingDairyland: Background for Decisions About Wisconsin’s Dairy Industry,No. 3, September 2002,http://www.aae.wisc.edu/www/pub/dairyland/rd3.pdf.
Kaufman, Phil R. “Consolidation in Food Retailing: Prospects forConsumers & Grocery Suppliers.” Agricultural Outlook, U.S. Departmentof Agriculture, Economic Research Service, AGO-273, August 2000, pp.18-22.
Knutson, Ronald D., Oral Capps, and Robert B. Schwart. “An Assessmentof the Experience with and Future of Interstate Dairy Compacts.” LookingAhead . . . or Looking Behind? proceedings of 10th Annual Workshop forDairy Economists and Policy Analysts. Memphis, TN, April 23-24, 2003,http://www.dairy.cornell.edu/CPDMP/Pages/Workshops/Memphis03/Knutson.pdf.
Kraenzle, Charles A., and E. Eldon Eversull. “Co-ops increase share of farmmarketings; share of farm supply sales dips slightly.” Rural Cooperatives,U.S. Department of Agriculture, Rural Business-Cooperative Service,May/June 2003.
Kuminoff, Nicolai V., Daniel A. Sumner, and George Goldman. TheMeasure of California Agriculture, 2000, University of California, Davis,California Agricultural Issues Center, November 2000.
91Economic Effects of U.S. Dairy Policy and Alternative Approaches to Milk Pricing
U.S. Department of Agriculture
LaDue, Eddy, Brent Gloy, and Charles Cuykendall. “Future Structure of theDairy Industry: Historical Trends, Projections and Issues.” Cornell Programon Agricultural and Small Business Finance, Department of AppliedEconomics and Management, Cornell University Agricultural ExperimentStation, Ithaca, NY. R.B. 2003-01, June 2003,http://aem.cornell.edu/research/researchpdf/rb0301.pdf.
Lass, Daniel A., Mawunyo Adanu, and P. Geoffrey Allen. “Impacts of theNortheast Dairy Compact on New England Retail Prices,” Agricultural andResource Economics Review, 2001, pp. 83-92.
Legislative Analysts Office. Cal Facts: California Economy and Budget inPerspective, 1996.
Liebrand, Carolyn. Structural Change in the Dairy Cooperative Sector,1992-2000. U.S. Department of Agriculture, Rural Business-CooperativeService, RBS Research Report 187, October 2001.
Liebrand, Carolyn Betts, and Karen J. Spatz. DARIMAC: An ExportMarketing Agency-In-Common for Dairy Cooperatives. U.S. Department ofAgriculture, Agricultural Cooperative Service, ACS Research Report 126,December 1993.
Lin, Biing-Hwan, J.N. Variyam, J. Allshouse, and J. Cromartie. Food andAgricultural Commodity Consumption in the United States: Looking Aheadto 2020. U.S. Department of Agriculture, Economic Research Service.Agricultural Economic Report No. 820, February 2003.
Ling, K. Charles. “Dairy Co-ops Continue Dominant Role in MarketingNation’s Milk.” Rural Cooperatives, U.S. Department of Agriculture, RuralBusiness-Cooperative Service, March/April 2004.
______________. Marketing Operations of Dairy Cooperatives. U.S.Department of Agriculture, Rural Business-Cooperative Service, RBSResearch Report 173, June 1999.
Manchester, Alden C. The Public Role in the Dairy Economy. WestviewPress, Boulder, CO, 1983.
Manchester, Alden C., and Don P. Blayney. Milk Pricing in the UnitedStates. U.S. Department of Agriculture, Economic Research Service. Agri-culture Information Bulletin No. 761, February 2001.
_________________________________. The Structure of Dairy Markets:Past, Present, Future. U.S. Department of Agriculture, Economic ResearchService. Agricultural Economic Report No. 757, September 1997.
Matulich, Scott C. “Efficiencies in Large-Scale Dairying: Incentives forFuture Structural Change.” American Journal of Agricultural Economics,Vol. 60, No. 4, November 1978, pp. 642-647.
McElroy, Robert, Roger Strickland, Jim Ryan, Chris McGath, Robert Green,Ken Erickson, and William McBride. Agricultural Income and Finance
92Economic Effects of U.S. Dairy Policy and Alternative Approaches to Milk Pricing
U.S. Department of Agriculture
Outlook. U.S. Department of Agriculture, Economic Research Service, Agri-cultural Income and Finance Situation and Outlook No. 79, September2002.
Meadows, D. L. Dynamics of Commodity Production Cycles. Wright-AllenPress, Cambridge, MA, 1970.
Miller, James. “Tortoises Triumph: Gradual Changes Transform the DairyIndustry.” Agricultural Outlook. U.S. Department of Agriculture, EconomicResearch Service, December 2002, pp. 8-10.
Mishra, Ashok K., Hisham S. El-Osta, Michell J. Morehart, James D.Johnson, and Jeffrey W. Hopkins. Income, Wealth, and the Economic Well-Being of Farm Households. U.S. Department of Agriculture, EconomicResearch Service. Agricultural Economic Report No. 812, July 2002.
Morehart, M., Betsey Kuhn, and Susan Offutt. “A Fair Income forFarmers?” Agricultural Outlook, U.S. Department of Agriculture, EconomicResearch Service, May 2000, pp. 22-26.
Moschini, Giancarlo. “The Cost Structure of of Ontario Dairy Farms: AMicroeconomic Analysis.” Canadian Journal of Agricultural Economics,Vol. 36, 1998, pp. 187-206.
Natcher, W. C., and R. D. Weaver. “Price Volatility in the US Dairy Sector:Due to Week-of-Month Effects?” Selected paper presented at the AnnualMeetings, American Agricultural Economics Association, Chicago, IL.2001.
National Milk Producers Federation. Milk Protein Imports: Impacts on U.S.Dairy Producers. April 2001.
Newbury, D. M. G., and J. E. Stiglitz. The Theory of Commodity PriceStabilization: A Study in the Economics of Risk. Clarendon Press, Oxford,England, 1981.
Nicholson, Charles, and Thomas Fiddaman. “Dairy Policy and PriceVolatility.” Paper presented to Looking Ahead…or Looking Behind? 10thAnnual Workshop for Dairy Economists and Policy Analysts. Memphis,Tennessee, April 23-24, 2003, http://www.dairy.cornell.edu/CPDMP/Pages/Workshops/Memphis03/Nicholson.pdf.
Nicholson, C.F., B. Resosudarmo, and F.W. Wackernagel. “Impacts of theNortheast Interstate Dairy Compact on New England Milk Supply,” Agri-cultural and Resource Economics Review, 2001, pp. 93-103.
Nicholson, C.F., and R. Wackernagel, “Impacts of the Compact on NewEngland Milkshed Composition,” in The Northeast Interstate DairyCompact: Milk Market Impacts. Charles F. Nicholson, editor. University ofVermont Research Report 73, Burlington, VT, 2000.
Northeast Dairy Compact Commission, http://www.dairycompact.org.
93Economic Effects of U.S. Dairy Policy and Alternative Approaches to Milk Pricing
U.S. Department of Agriculture
Nubern, Chris A. “Evaluating Changes in Demand for Dairy Products,” U.S.Dairy Markets & Outlook, Vol. 3, No. 2, April 1998.
Outlaw, Joe L., David P. Anderson, and James W. Richardson. “Impacts ofRemoving Current Federal Regulations on U.S. representative Dairy Farms”Paper presented to Looking Ahead…or Looking Behind? 10th AnnualWorkshop for Dairy Economists and Policy Analysts. Memphis, TN, April23-24, 2003, http://www.dairy.cornell.edu/CPDMP/Pages/Workshops/Memphis03/Outlaw.pdf.
Outlaw, Joe L., Ronald D. Knutson, George B. Marek, Brian J. Eiting,Robert B. Schwart, Jr., and Jayantha R. Perera. A Case Study of RetailPricing Strategies in Two Texas Cities. AFPC Policy Research Report 94-3.Texas A&M University System, College Station, TX, July 26, 1994, p. 13.
Padberg, D.I., Ron Knutson, and S. Hussain Ali Jafri. Retail Food Pricing:Horizontal and Vertical Determinants. AFPC Policy Research Report 93-1.Texas A&M University System, College Station, TX, January 1993, p. 12.
Pratt, J. E., and M. W. Stephenson. “Motives for Storing ManufacturedDairy Products.” Paper presented at “Price Instability and Risk Manage-ment in the Dairy Industry,” August 20-21, 1998, Alexandria, VA, 1998.
Price, J. Michael. Effects of U.S. Dairy Policies on Markets for Milk andDairy Products. U.S. Department of Agriculture, Economic ResearchService, Technical Bulletin No. 1910, March 2004.
Putnam, Judy, and Jane Allshouse. “Trends in U.S. Per Capita Consumptionof Dairy Products, 1909 to 2001.” Amber Waves. U.S. Department of Agri-culture, Economic Research Service, June 2003.
Reynolds, Bruce J. Cooperative Marketing Agencies-in-Common. U.S.Department of Agriculture, Agricultural Cooperative Service, ACS ResearchReport 127, January 1994.
Richardson, J. W., J. L. Outlaw, D. P. Anderson, J. D. Sartwelle, III, P.Feldman, K. Schumann, J. M. Raulston, S. L. Klose, R. B. Schwart, Jr., andP. Zimmel. “Representative Farms Economic Outlook for the January 2003FAPRI/AFPC Baseline.” Texas Agricultural Experiment Station, Depart-ment of Agricultural Economics, Texas A&M University, College Station,TX, Agricultural and Food Policy Center Working Paper 03-1, March 2003.
Salathe, Larry. “The Implications of Offsetting Adjustments in GovernmentPurchase Prices for Butter and Nonfat Dry Milk.” The Journal of Agricul-tural Economics Research. Vol. 45, No. 1, 1993, pp. 18-26.
Salathe, L., and J.M. Price. “Implications of raising the nonfat solids stan-dards for beverage milk.” Southern Journal of Agricultural Economics, Vol.24, December 1992, pp. 197-209.
Schmit, Todd M., and Harry M. Kaiser. Measuring the Impacts of GenericFluid Milk and Cheese Advertising: A Time-Varying Parameter Application.
94Economic Effects of U.S. Dairy Policy and Alternative Approaches to Milk Pricing
U.S. Department of Agriculture
NICPRE 02-03 R.B. 2002-06. Department of Applied Economics andManagement, Cornell University, Ithaca, NY, May 2002.
Short, Sara D. Characteristics and Production Costs of U.S. Dairy Opera-tions. U.S. Department of Agriculture, Economic Research Service. Statis-tical Bulletin No. SB-974-6, February 2004,http://www.ers.usda.gov/publications/sb974-6/.
Southard, Leland (coordinator). Livestock, Dairy, and Poultry Outlook.U.S. Department of Agriculture, Economic Research Service. ElectronicOutlook Report (various), http://www.ers.usda.gov/publications/ldp/.
Sparks Companies, Inc. Imports of MPCs, Casein and Caseinates andMarket Impacts—A Special Study for the U.S. Coalition for NutritionalIngredients. May, 2003.
Stephenson, Mark. “Technology, Demand, and Lost Data.” Presentation toForces Shaping the Dairy Industry Workshop, U.S. Department of Agricul-ture, Economic Research Service, Washington, DC, September 25, 2002,http://www.farmfoundation.org/projects/03-36DairyPolicyForumpresenta-tions.htm.
Sumner, D.A., and N.L.Wilson. “The Development of California MilkMarketing Laws: In Pursuit of an Adequate Supply of Healthful Milk.”Paper presented at Agricultural History Symposium, Mississippi State, MS,June 1999.
Sumner, D.A., and C.A. Wolf. “Quotas Without Supply Control: Effects ofDairy Quota Policy in California.” American Journal of AgriculturalEconomics, Vol. 78, 1996, pp. 354-366.
Tillison, Jim. “What’s the answer for MPC imports?” Hoard’s Dairyman.April 10, 2002, p. 271.
Tomek, William G., and Kenneth L. Robinson. Agricultural Product Prices.Cornell University Press, Ithaca, NY, 1972.
U.S. Congress. “Review of the Dairy Termination Program and OtherOngoing Dairy Program Initiatives Mandated in the Food Security Act of1985.” Hearing before the Subcommittee on Livestock, Dairy and Poultry,Committee on Agriculture, House of Representatives, 100th Congress, 1stSession, Washington, DC, March 4, 1987.
U.S. Department of Agriculture, Agricultural Statistics Database,http://www.nass.usda.gov:81/ipedb/.
U.S. Department of Agriculture, Agricultural Marketing Service. FederalMilk Marketing Order Reform, New England et al. Final Decision—Regula-tory Impact Analysis, March 1999, http://www.ams.usda.gov/fmor/ria.pdf.
____________________________. “Federal Milk Marketing Orders,”http://www.ams.usda.gov/dairy/orders.htm.
95Economic Effects of U.S. Dairy Policy and Alternative Approaches to Milk Pricing
U.S. Department of Agriculture
____________________________. Federal Milk Order Market Statistics,Annual Summary (various years).
____________________________. “Milk Marketing Order Statistics,”http://www.ams.usda.gov/dyfmos/mib/price_form_2003.htm.
____________________________. Packaged Fluid Milk Sales in FederalMilk Order Markets: By Size and Type of Container and DistributionMethod During November 2001. December 2002.
___________________________. Report to Congress on the NationalDairy Promotion and Research Program and the National Fluid MilkProcessor Promotion Program. July 1, 2002. http://www.ams.usda.gov/dairy/prb/rtc_2002/total_rtc_2002.pdf.
U.S. Department of Agriculture, Economic Research Service. Dairy: Back-ground for 1985 Farm Legislation, Agricultural Information Bulletin No. 474.
___________________________. “Farm Financial Management Data:Selected Farm Operator Household Financial Characteristics,”http://www.ers.usda.gov/Data/farmfinancialmgmt/hhf_typmenu.htm.
__________________________. Food Consumption (Per Capita) DataSystem. http://www.ers.usda.gov/data/foodconsumption/.
___________________________. “Links to the General Economy andAgriculture,” Food and Nutrition Assistance Programs and the GeneralEconomy briefing room, http://ers.usda.gov/Briefing/GeneralEconomy/link-ages.htm.
_______________________. Livestock, Dairy, and Poultry Outlook. LDP-M-108, June 24, 2003.
U.S. Department of Agriculture, Foreign Agriculture Service. “FACTSHEET: Dairy Export Incentive Program,”http://www.fas.usda.gov/info/factsheets/deip.html.
U.S. Department of Agriculture, National Agricultural Statistics Service.Census of Agriculture, http://www.nass.usda.gov/census/.
_________________________. Dairy Products Annual Summary. Various issues.
_________________________. Milk Cows and Production. 1950-1998.
_________________________. Milk Production, February 2002.
U.S. Department of Agriculture, Rural Business-Cooperative Service. Coop-eratives in the Dairy Industry, Cooperative Information Report 1, Section16, July 2002.
96Economic Effects of U.S. Dairy Policy and Alternative Approaches to Milk Pricing
U.S. Department of Agriculture
U.S. Department of Commerce, Economic and Statistics Administration,Bureau of the Census. Concentration Ratios in Manufacturing. 1997Economic Census—Manufacturing. June 2001, and previous issues.
U.S. General Accounting Office. Dairy Industry Information on Milk Pricesand Changing Market Structure. GAO-01-561, June 2001.
__________________________. Dairy Products: Imports, DomesticProduction, and Regulation of Ultra-filtered Milk. GAO-01-326. March2001.
U.S. International Trade Commission. Conditions of Competition for MilkProtein Products in the U.S. Market. Investigation No. 332-453, USITCPublication 3692, May 2004.
Wisconsin Department of Agriculture Trade and Consumer Protection.Wisconsin Dairy Facts, various years.
Wisconsin State Journal, September 1993.
Wolf, Christopher A., and Larry G. Hamm. “The Role of Cooperatives inMilk Marketing.” Paper presented at the annual meeting of the AmericanAgricultural Economics Association, Salt Lake City, UT, August 2-5, 1998.
97Economic Effects of U.S. Dairy Policy and Alternative Approaches to Milk Pricing
U.S. Department of Agriculture
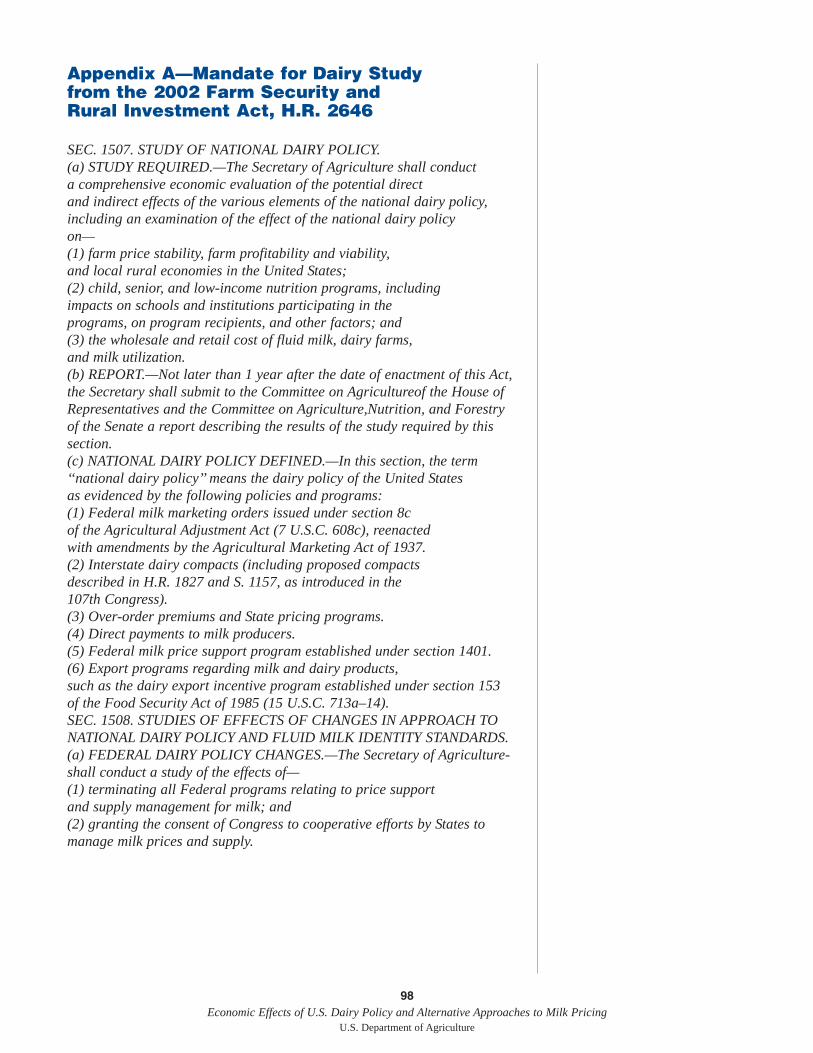
Appendix A—Mandate for Dairy Studyfrom the 2002 Farm Security andRural Investment Act, H.R. 2646
SEC. 1507. STUDY OF NATIONAL DAIRY POLICY.(a) STUDY REQUIRED.—The Secretary of Agriculture shall conducta comprehensive economic evaluation of the potential directand indirect effects of the various elements of the national dairy policy,including an examination of the effect of the national dairy policy on—(1) farm price stability, farm profitability and viability,and local rural economies in the United States;(2) child, senior, and low-income nutrition programs, includingimpacts on schools and institutions participating in theprograms, on program recipients, and other factors; and(3) the wholesale and retail cost of fluid milk, dairy farms,and milk utilization. (b) REPORT.—Not later than 1 year after the date of enactment of this Act,the Secretary shall submit to the Committee on Agricultureof the House ofRepresentatives and the Committee on Agriculture,Nutrition, and Forestryof the Senate a report describing the results of the study required by thissection.(c) NATIONAL DAIRY POLICY DEFINED.—In this section, the term‘‘national dairy policy’’ means the dairy policy of the United Statesas evidenced by the following policies and programs:(1) Federal milk marketing orders issued under section 8cof the Agricultural Adjustment Act (7 U.S.C. 608c), reenactedwith amendments by the Agricultural Marketing Act of 1937.(2) Interstate dairy compacts (including proposed compactsdescribed in H.R. 1827 and S. 1157, as introduced in the107th Congress).(3) Over-order premiums and State pricing programs.(4) Direct payments to milk producers.(5) Federal milk price support program established under section 1401.(6) Export programs regarding milk and dairy products,such as the dairy export incentive program established under section 153 of the Food Security Act of 1985 (15 U.S.C. 713a–14).SEC. 1508. STUDIES OF EFFECTS OF CHANGES IN APPROACH TONATIONAL DAIRY POLICY AND FLUID MILK IDENTITY STANDARDS.(a) FEDERAL DAIRY POLICY CHANGES.—The Secretary of Agriculture-shall conduct a study of the effects of—(1) terminating all Federal programs relating to price supportand supply management for milk; and(2) granting the consent of Congress to cooperative efforts by States tomanage milk prices and supply.
98Economic Effects of U.S. Dairy Policy and Alternative Approaches to Milk Pricing
U.S. Department of Agriculture
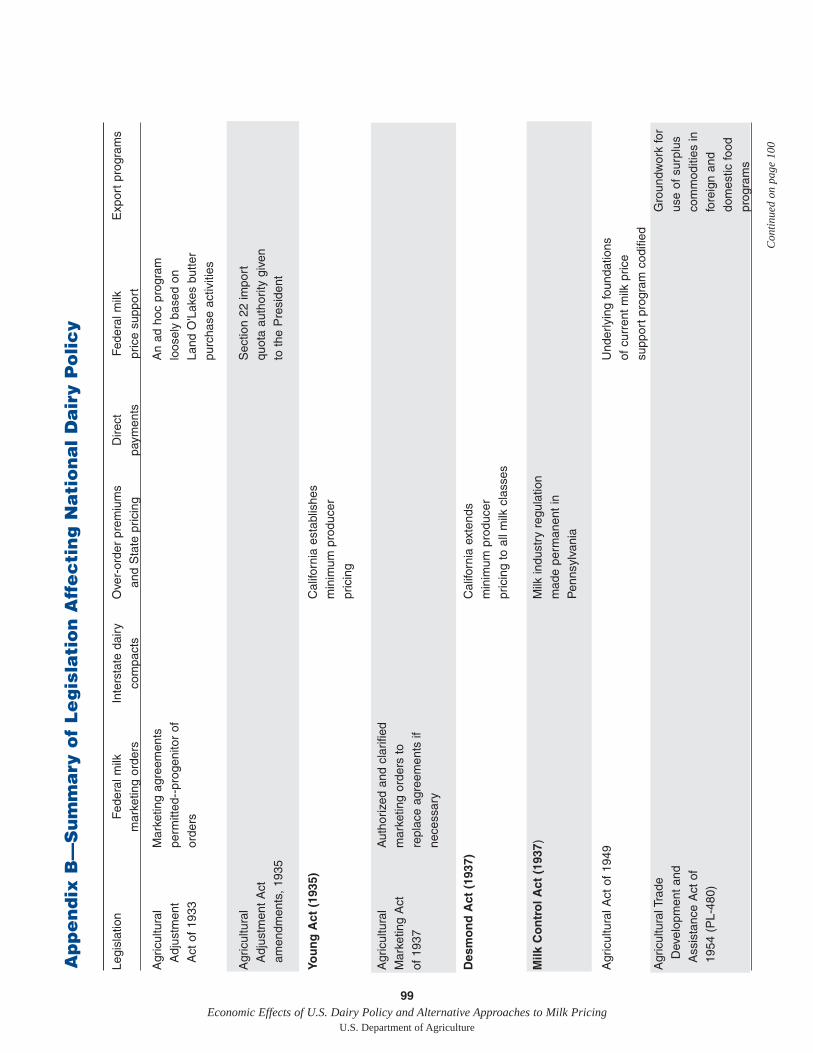
Legi
slat
ion
Fed
eral
milk
Inte
rsta
te d
airy
Ove
r-or
der
prem
ium
sD
irect
Fed
eral
milk
Exp
ort
prog
ram
sm
arke
ting
orde
rsco
mpa
cts
and
Sta
te p
ricin
gpa
ymen
tspr
ice
supp
ort
Agr
icul
tura
l M
arke
ting
agre
emen
tsA
n ad
hoc
pro
gram
A
djus
tmen
t pe
rmitt
ed--
prog
enito
r of
loos
ely
base
d on
Act
of
1933
orde
rsLa
nd O
'Lak
es b
utte
rpu
rcha
se a
ctiv
ities
Agr
icul
tura
l S
ectio
n 22
impo
rtA
djus
tmen
t A
ct
quot
a au
thor
ity g
iven
amen
dmen
ts,
1935
to t
he P
resi
dent
You
ng
Act
(19
35)
Cal
iforn
ia e
stab
lishe
s m
inim
um p
rodu
cer
pric
ing
Agr
icul
tura
l A
utho
rized
and
cla
rifie
dM
arke
ting
Act
m
arke
ting
orde
rs t
o of
193
7re
plac
e ag
reem
ents
ifne
cess
ary
Des
mo
nd
Act
(19
37)
Cal
iforn
ia e
xten
ds
min
imum
pro
duce
rpr
icin
g to
all
milk
cla
sses
Milk
Co
ntr
ol A
ct (
1937
)M
ilk in
dust
ry r
egul
atio
nm
ade
perm
anen
t in
Pen
nsyl
vani
a
Agr
icul
tura
l Act
of
1949
Und
erly
ing
foun
datio
nsof
cur
rent
milk
pric
esu
ppor
t pr
ogra
m c
odifi
edA
gric
ultu
ral T
rade
G
roun
dwor
k fo
r D
evel
opm
ent
and
use
of s
urpl
usA
ssis
tanc
e A
ct o
f co
mm
oditi
es in
19
54 (
PL-
480)
fore
ign
and
dom
estic
food
prog
ram
s
99Economic Effects of U.S. Dairy Policy and Alternative Approaches to Milk Pricing
U.S. Department of Agriculture
Con
tinue
d on
pag
e 10
0
Ap
pe
nd
ix B
—S
um
ma
ry o
f L
eg
isla
tio
n A
ffe
cti
ng
Na
tio
na
l D
air
y P
olic
y
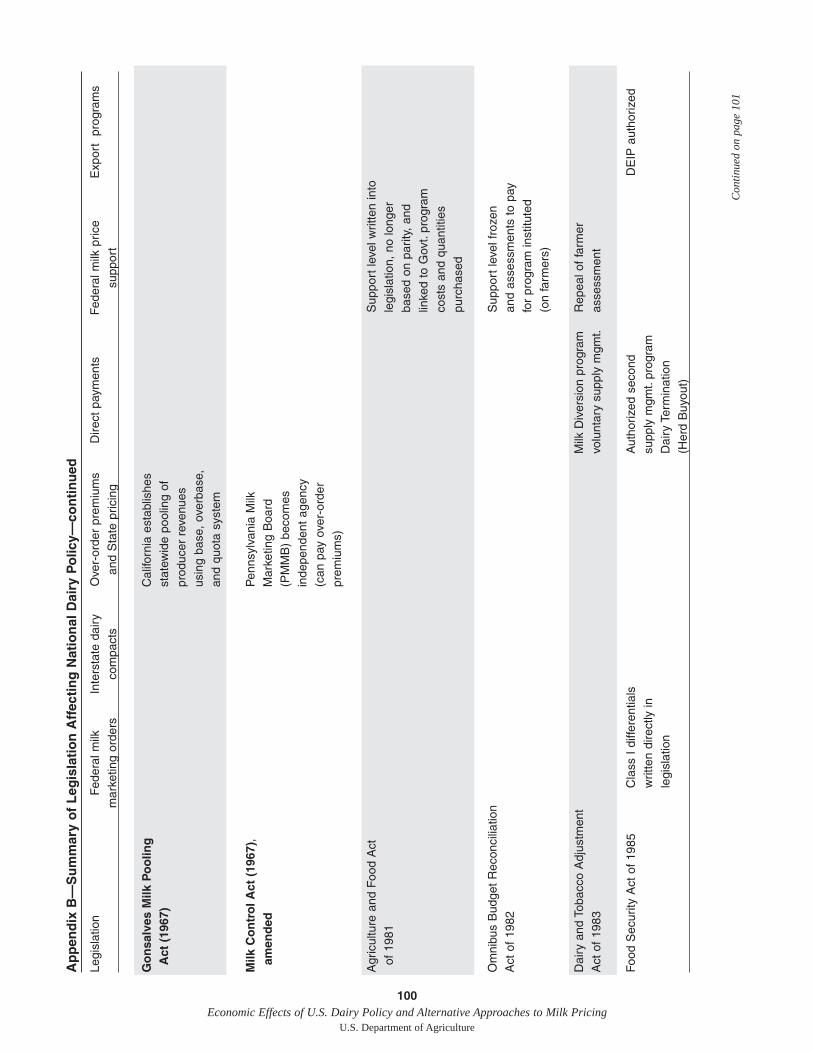
100Economic Effects of U.S. Dairy Policy and Alternative Approaches to Milk Pricing
U.S. Department of Agriculture
Ap
pen
dix
B—
Su
mm
ary
of
Leg
isla
tio
n A
ffec
tin
g N
atio
nal
Dai
ry P
olic
y—co
nti
nu
ed
Legi
slat
ion
Fed
eral
milk
Inte
rsta
te d
airy
Ove
r-or
der
prem
ium
sD
irect
pay
men
tsF
eder
al m
ilk p
rice
Exp
ort
pro
gram
sm
arke
ting
orde
rsco
mpa
cts
and
Sta
te p
ricin
gsu
ppor
t
Go
nsa
lves
Milk
Po
olin
g
Cal
iforn
ia e
stab
lishe
sA
ct (
1967
)st
atew
ide
pool
ing
ofpr
oduc
er r
even
ues
usin
g ba
se,
over
base
,an
d qu
ota
syst
em
Milk
Co
ntr
ol A
ct (
1967
),
Pen
nsyl
vani
a M
ilk
amen
ded
Mar
ketin
g B
oard
(PM
MB
) be
com
esin
depe
nden
t ag
ency
(can
pay
ove
r-or
der
prem
ium
s)
Agr
icul
ture
and
Foo
d A
ctS
uppo
rt le
vel w
ritte
n in
toof
198
1le
gisl
atio
n, n
o lo
nger
ba
sed
on p
arity
, an
d lin
ked
to G
ovt.
prog
ram
co
sts
and
quan
titie
spu
rcha
sed
Om
nibu
s B
udge
t R
econ
cilia
tion
Sup
port
leve
l fro
zen
Act
of
1982
and
asse
ssm
ents
to
pay
for
prog
ram
inst
itute
d (o
n fa
rmer
s)
Dai
ry a
nd T
obac
co A
djus
tmen
tM
ilk D
iver
sion
pro
gram
Rep
eal o
f fa
rmer
Act
of
1983
volu
ntar
y su
pply
mgm
t.as
sess
men
t
Foo
d S
ecur
ity A
ct o
f 19
85C
lass
I d
iffer
entia
lsA
utho
rized
sec
ond
DE
IP a
utho
rized
writ
ten
dire
ctly
insu
pply
mgm
t.pr
ogra
mle
gisl
atio
nD
airy
Ter
min
atio
n
(Her
d B
uyou
t)
Con
tinue
d on
pag
e 10
1
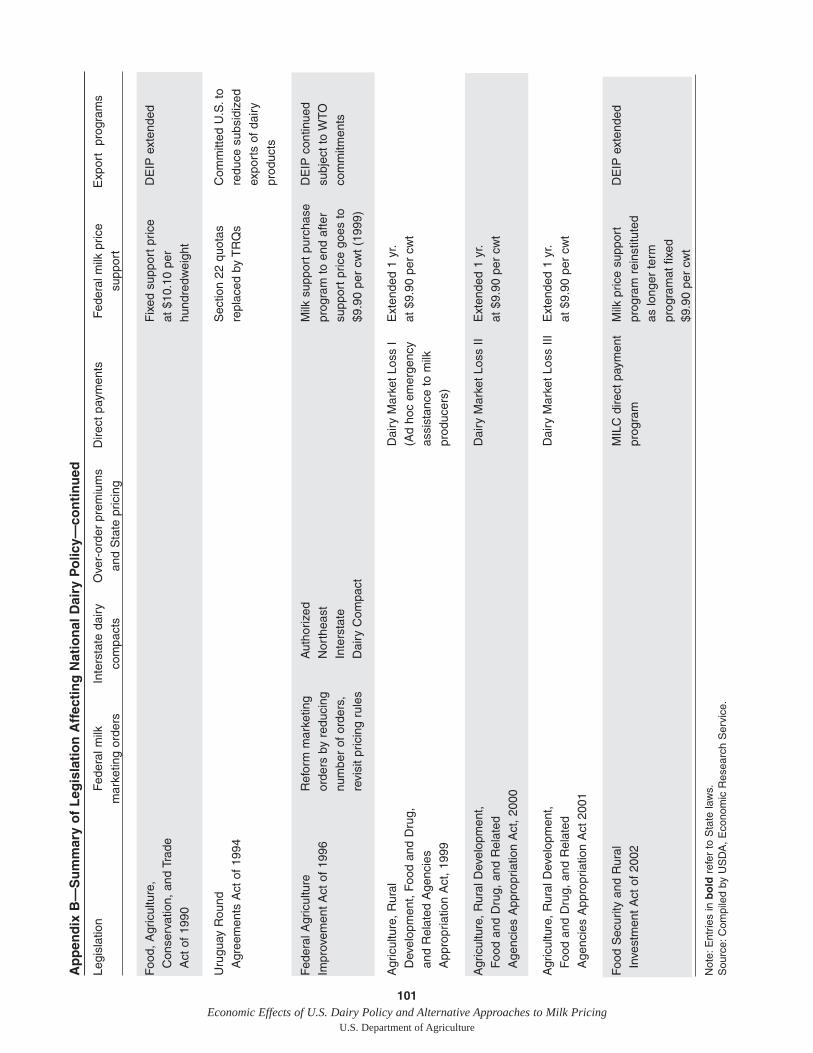
101Economic Effects of U.S. Dairy Policy and Alternative Approaches to Milk Pricing
U.S. Department of Agriculture
Ap
pen
dix
B—
Su
mm
ary
of
Leg
isla
tio
n A
ffec
tin
g N
atio
nal
Dai
ry P
olic
y—co
nti
nu
ed
Legi
slat
ion
Fed
eral
milk
Inte
rsta
te d
airy
Ove
r-or
der
prem
ium
sD
irect
pay
men
tsF
eder
al m
ilk p
rice
Exp
ort
pro
gram
sm
arke
ting
orde
rsco
mpa
cts
and
Sta
te p
ricin
gsu
ppor
t
Foo
d, A
gric
ultu
re,
Fix
ed s
uppo
rt p
rice
DE
IP e
xten
ded
Con
serv
atio
n, a
nd T
rade
at
$10
.10
per
Act
of
1990
hund
redw
eigh
t
Uru
guay
Rou
nd
Sec
tion
22 q
uota
s C
omm
itted
U.S
.to
Agr
eem
ents
Act
of
1994
repl
aced
by
TR
Qs
redu
ce s
ubsi
dize
d ex
port
s of
dai
ry
prod
ucts
Fed
eral
Agr
icul
ture
R
efor
m m
arke
ting
Aut
horiz
ed
Milk
sup
port
pur
chas
eD
EIP
con
tinue
dIm
prov
emen
t A
ct o
f 19
96or
ders
by
redu
cing
N
orth
east
pr
ogra
m t
o en
d af
ter
subj
ect
to W
TO
num
ber
of o
rder
s,
Inte
rsta
te
supp
ort
pric
e go
es t
oco
mm
itmen
tsre
visi
t pr
icin
g ru
les
Dai
ry C
ompa
ct$9
.90
per
cwt
(199
9)
Agr
icul
ture
, R
ural
D
airy
Mar
ket
Loss
IE
xten
ded
1 yr
.D
evel
opm
ent,
Foo
d an
d D
rug,
(A
d ho
c em
erge
ncy
at $
9.90
per
cw
tan
d R
elat
ed A
genc
ies
assi
stan
ce t
o m
ilkA
ppro
pria
tion
Act
, 19
99pr
oduc
ers)
Agr
icul
ture
, R
ural
Dev
elop
men
t,D
airy
Mar
ket
Loss
II
Ext
ende
d 1
yr.
Foo
d an
d D
rug,
and
Rel
ated
at $
9.90
per
cw
tA
genc
ies
App
ropr
iatio
n A
ct,
2000
Agr
icul
ture
, R
ural
Dev
elop
men
t,D
airy
Mar
ket
Loss
III
Ext
ende
d 1
yr.
Foo
d an
d D
rug,
and
Rel
ated
at $
9.90
per
cw
tA
genc
ies
App
ropr
iatio
n A
ct 2
001
Foo
d S
ecur
ity a
nd R
ural
MIL
C d
irect
pay
men
tM
ilk p
rice
supp
ort
D
EIP
ext
ende
dIn
vest
men
t A
ct o
f 20
02pr
ogra
mpr
ogra
m r
eins
titut
edas
long
er t
erm
pr
ogra
mat
fix
ed
$9.9
0 pe
r cw
t
Not
e:E
ntrie
s in
bo
ld r
efer
to
Sta
te la
ws.
Sou
rce:
Com
pile
d by
US
DA
, E
cono
mic
Res
earc
h S
ervi
ce.
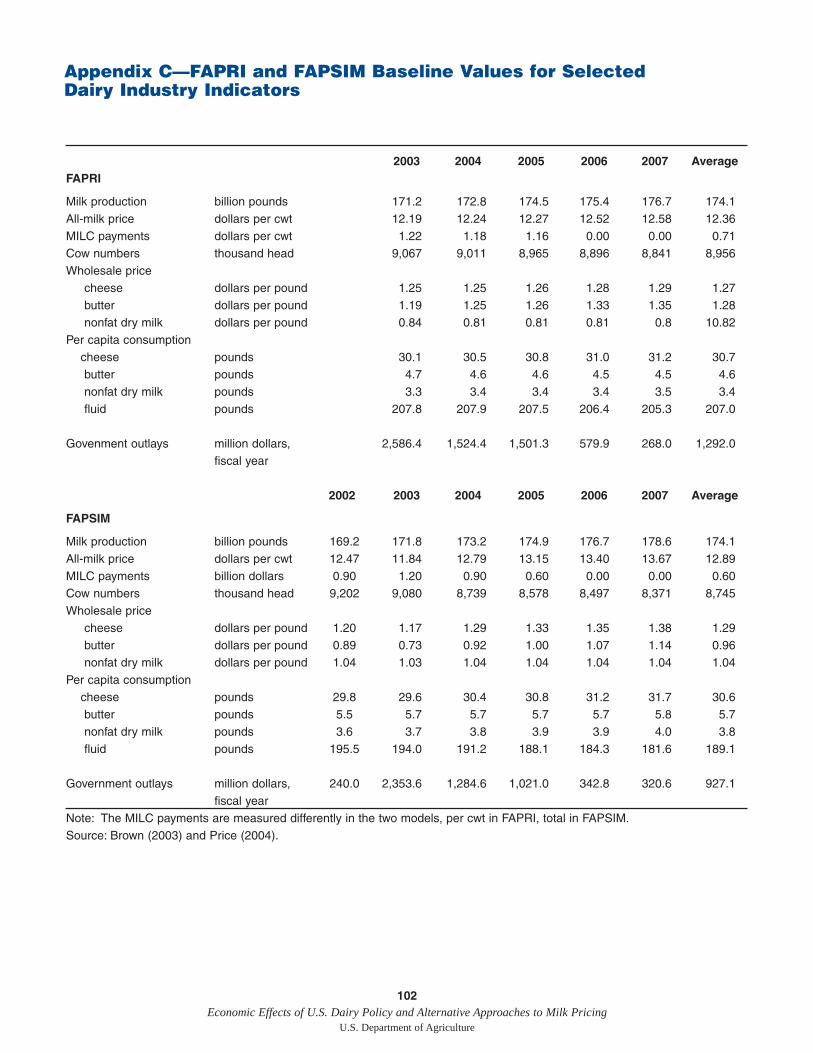
102Economic Effects of U.S. Dairy Policy and Alternative Approaches to Milk Pricing
U.S. Department of Agriculture
2003 2004 2005 2006 2007 AverageFAPRI
Milk production billion pounds 171.2 172.8 174.5 175.4 176.7 174.1All-milk price dollars per cwt 12.19 12.24 12.27 12.52 12.58 12.36MILC payments dollars per cwt 1.22 1.18 1.16 0.00 0.00 0.71Cow numbers thousand head 9,067 9,011 8,965 8,896 8,841 8,956Wholesale price
cheese dollars per pound 1.25 1.25 1.26 1.28 1.29 1.27butter dollars per pound 1.19 1.25 1.26 1.33 1.35 1.28nonfat dry milk dollars per pound 0.84 0.81 0.81 0.81 0.8 10.82
Per capita consumptioncheese pounds 30.1 30.5 30.8 31.0 31.2 30.7butter pounds 4.7 4.6 4.6 4.5 4.5 4.6nonfat dry milk pounds 3.3 3.4 3.4 3.4 3.5 3.4fluid pounds 207.8 207.9 207.5 206.4 205.3 207.0
Govenment outlays million dollars, 2,586.4 1,524.4 1,501.3 579.9 268.0 1,292.0fiscal year
2002 2003 2004 2005 2006 2007 Average
FAPSIM
Milk production billion pounds 169.2 171.8 173.2 174.9 176.7 178.6 174.1All-milk price dollars per cwt 12.47 11.84 12.79 13.15 13.40 13.67 12.89MILC payments billion dollars 0.90 1.20 0.90 0.60 0.00 0.00 0.60Cow numbers thousand head 9,202 9,080 8,739 8,578 8,497 8,371 8,745Wholesale price
cheese dollars per pound 1.20 1.17 1.29 1.33 1.35 1.38 1.29butter dollars per pound 0.89 0.73 0.92 1.00 1.07 1.14 0.96nonfat dry milk dollars per pound 1.04 1.03 1.04 1.04 1.04 1.04 1.04
Per capita consumptioncheese pounds 29.8 29.6 30.4 30.8 31.2 31.7 30.6butter pounds 5.5 5.7 5.7 5.7 5.7 5.8 5.7nonfat dry milk pounds 3.6 3.7 3.8 3.9 3.9 4.0 3.8fluid pounds 195.5 194.0 191.2 188.1 184.3 181.6 189.1
Government outlays million dollars, 240.0 2,353.6 1,284.6 1,021.0 342.8 320.6 927.1
fiscal yearNote: The MILC payments are measured differently in the two models, per cwt in FAPRI, total in FAPSIM.Source: Brown (2003) and Price (2004).
Appendix C—FAPRI and FAPSIM Baseline Values for SelectedDairy Industry Indicators
Appendix D—Overview ofNutrition ProgramsU.S. Government food assistance programs influence demand for dairyproducts. They target different populations with different needs. The FoodStamp Program and the Special Supplemental Nutrition Program forWomen, Infants, and Children (WIC), together with the child nutritionprograms—the National School Lunch, the School Breakfast, the Child andAdult Care Food, the Summer Food, and the Special Milk Programs—arelikely to be the most affected by changes in the national dairy policy.
The Food Stamp Program enables low-income participants to obtain amore nutritious diet by issuing monthly allotments of coupons or ElectronicBenefits redeemable for food at authorized retail food stores. The FoodStamp Program is available to most households that meet income and assetcriteria. Food Stamps can be used to purchase most types of foodsincluding dairy products, and recipients choose the combinations ofapproved foods they purchase.
Food stamp benefit levels are based on the cost of a market basketcontaining multiple food items that models how a low-income householdcan achieve a low-cost diet plan that meets dietary standards. Benefits levelsare sensitive to changes in the price of dairy products since milk accountsfor about 10 percent of the value of the market basket.
The Food Stamp Program entitles those who meet the eligibility criteria toreceive benefits, so changes in dairy product prices do not affect the provi-sion of benefits. An increase (decrease) in the price of dairy productsresulting from a change in dairy policy would increase (decrease) the cost ofthe market basket resulting in an increase (decrease) in cost of the FoodStamp Program to the Federal Government. In addition, the purchasingpower of individual food stamp households may be affected to the degreethat they purchase dairy products with their food stamps.
The Special Supplemental Nutrition Program for Women, Infants, andChildren (WIC) provides nutritious supplemental foods at no cost to low-income pregnant and postpartum women, as well as infants and children upto their fifth birthday who are determined by health professionals to benutritionally at risk. Participants can redeem WIC food vouchers at retailfood stores for specific foods that are rich in the nutrients typically lackingin the diets of the target population. In fiscal year 2000, dairy purchasesaccounted for almost 40 percent of the total (after rebates) WIC food costs.
WIC is a discretionary grant program funded by appropriations law on anannual basis. Therefore, the number of participants that can be served eachyear depends upon the annual appropriation and the cost of operating theprogram—the program provides services to as many eligible people asfunding allows. Consequently, an increase in WIC food costs resulting froman increase in dairy prices will not increase Federal costs. However, anincrease in the cost of the WIC food packages, if not offset by the Govern-ment, would result in fewer people being served if the composition of thefood packages remain unchanged. In the case of the Northeast InterstateDairy Compact (NEIDC), higher dairy prices did not increase government
103Economic Effects of U.S. Dairy Policy and Alternative Approaches to Milk Pricing
U.S. Department of Agriculture
costs or reduce benefits. The NEIDC compensated the WIC program in thesix New England States $3.8 million from 1997 through 2000 for increasedmilk costs due to the Compact.
The National School Lunch Program provides lunches to children inpublic schools, nonprofit private schools, and residential child care institu-tions. Schools receive cash and entitlement commodities from USDA tooffset the cost of food service. In return, the schools must serve lunchesthat meet Federal nutritional requirements and offer free or reduced-pricelunches to needy children. Schools that participate in the National SchoolLunch Program must offer milk with the lunch. Milk is also one of theoptions for a snack in the afternoon snack service in the National SchoolLunch Program.
The commodity subsidy is indexed to the Price Index of Foods Used inSchools and Institutions. This index is computed using five major foodcomponents in the Bureau of Labor Statistics Producer Price Index—including dairy products. Increases in the indices resulting from higherdairy prices would result in higher government costs. The NEIDC compen-sated the six New England States $662,606 for the 1998-1999 and 1999-2000 school years for increases in milk prices incurred by the NationalSchool Lunch, School Breakfast, and Special Milk Programs.
The School Breakfast Program provides low-cost breakfasts to schoolchildren, with students from low-income families receiving free or reduced-price meals. USDA provides schools with cash assistance to offset the costof food service. In return, the schools must serve breakfasts that meetFederal nutrition standards. Milk must be offered at each breakfast, and maybe served as a beverage, on cereal, or both. Reimbursements in the SchoolBreakfast Program are indexed to a Consumer Price Index, and increases inthe index resulting from higher dairy prices would result in higher govern-ment costs.
The Special Milk Program provides funding for milk in public andnonprofit schools, child care centers, summer camps, and similar institutionsthat do not participate in any other federally assisted nutrition program.Participating sites provide milk either free or at low cost to all children.USDA reimburses participating schools and institutions for part of the costof the milk served to children. Reimbursements are indexed to the ProducerPrice Index for Fluid Milk Products.
The Child and Adult Care Food Program (CACFP) provides healthymeals and snacks to children in participating child care centers and infamily and group day care homes as well as to adults in adult day carecenters. In child care and adult day care centers, children and adults fromlow-income families are eligible for free or reduced-price meals. Indepen-dent centers and sponsoring agencies receive cash reimbursement for eachmeal served. Child care centers participating in the CACFP have the optionof receiving commodities or cash in lieu of commodities. Milk must beoffered at each meal served in the child care segment of the CACFP andwith the adult breakfasts and lunches. Milk is also one of the options for a
104Economic Effects of U.S. Dairy Policy and Alternative Approaches to Milk Pricing
U.S. Department of Agriculture
snack in the CACFP. Cash reimbursements for meals and commodity subsi-dies are indexed to one of the Consumer Price Indices.
The Summer Food Service Program provides free meals to children (age18 and under) and handicapped people over age 18 during school vacationsin areas where at least half of the children are from low-income households.Milk must be offered at each meal and is an option for the snacks served inthe program. The program is operated at the local level by sponsors whoare reimbursed by USDA. Sponsors are reimbursed for each meal servedand for their documented operating costs. Reimbursements in the programare indexed to a Consumer Price Index.
USDA also buys and supplies surplus food to the National School LunchProgram, the Child and Adult Care Food Program, and the Summer FoodService Program. Schools participating in the National School LunchProgram receive commodity foods, called “entitlement” foods. Schools canalso get “bonus” commodities, through USDA’s price support and surplusremoval programs. Entitlement foods available for these Child NutritionPrograms in the 2002-2003 school year include cheese and nonfat dry milk.The type and quantity of bonus commodities distributed by USDA in agiven year is dictated by agricultural surpluses and market conditions.
105Economic Effects of U.S. Dairy Policy and Alternative Approaches to Milk Pricing
U.S. Department of Agriculture
106Economic Effects of U.S. Dairy Policy and Alternative Approaches to Milk Pricing
U.S. Department of Agriculture
GlossaryAll-milk price—The average price of all the milk sold to plants and dealers.The price received by the producer is lower, reflecting handling and othermarketing costs.
Balancing—A service, usually provided by cooperative associations of milkproducers, that involves directing milk movements between producers’farms and handlers’ plants and diverting supplies in excess of handlers’needs to alternative outlets such as manufactured dairy product plants.
Blend price—A weighted average price based on the proportion of Grade Amilk in a pool allocated to each of the use classes. Producers participating ina pool receive its blend price with adjustments for butterfat content andplant location.
Casein—The major protein contained in milk and the primary protein incheese. Also, a protein curd or dried product made from milk casein curd.
Class I differential—The amount added to the Class I price mover (thehigher of the advanced Class III or Class IV pricing factors) in a Federalmilk marketing order to obtain a county’s Class I price. Class I differentialsvary by location, with a differential specified for each county in the country.The purpose of the Class I differentials is to assure an adequate supply ofmilk for fluid use by encouraging movement of grade A milk for fluid usefrom production areas to fluid milk plants.
Classified pricing—A structure of prices that differ according to category ofuse; the Federal order pricing system under which regulated processors payfor Grade A milk according to the class in which it is used.
Commodity Credit Corporation (CCC)—A wholly owned federal corpora-tion within the U.S. Department of Agriculture, subject to the direction ofthe Secretary of Agriculture. Price support purchases, the Milk Income LossContract (MILC) program, and many other commodity program activitiesinvolving expenditures of funds are conducted by the CCC.
Compact—An agreement between or among States to regulate some area ofcommerce. A compact must be approved in identical form by each party(State) to it and authorized by the U.S. Congress.
Cooperative—A firm that is owned by its farmer-members, is operated fortheir benefit, and distributes earnings on the basis of volume of milk.
Dairy Export Incentive Program (DEIP)—Helps exporters of U.S. dairyproducts meet prevailing world prices for targeted dairy products and desti-nations by provding cash bonuses to exporters, allowing them to sell certainU.S. dairy products at prices lower than the costs of acquiring them.
Economies of scale/size— Economies of scale are increasing returns as allinputs are increased in equal proportions. Economies of size are increasingreturns as use of inputs is expanded in least-cost combinations.
Elasticity—A numerical measure of the proportional change in quantitydemanded (or quantity supplied) in response to a change in price or income.
FAPRI—Food and Agricultural Policy Research Institute. Refers both tothe research institute, located at both the University of Missouri and IowaState University, and, in this report, the modeling system used by thisresearch institute to analyze the effects of dairy policy.
FAPSIM—Food and Agricultural Policy SIMulator. FAPSIM is an annualeconometric model of the U.S. agricultural sector developed by theUSDA’s Economic Research Service and used to simulate the effects ofdifferent policies.
Farm Act—The omnibus agricultural legislation that sets farm policy for aperiod of 4 or 5 years.
Federal milk marketing order—A regulation issued by the Secretary ofAgriculture specifying minimum prices and conditions for the purchase ofmilk from dairy farmers within a specified geographic area.
FLIPSIM—Farm Level Income and Policy SIMulator. FLIPSIM is a simu-lation model developed at Texas A&M University used to simulate theeconomic activities of a representative or actual farm.
Fluid grade (Grade A) milk—Milk produced under sanitary conditions thatqualify it for fluid consumption. Only Grade A milk is regulated underFederal milk marketing orders.
Fluid milk—Packaged dairy products used as beverage milks.
Fluid products—A term traditionally used to define products includingbeverage milks, fluid cream items, and drinkable yogurts.
Grade A milk—Also called fluid grade milk. Milk produced and processedunder the strictest sanitary regulations prescribed, inspected and approvedby public health authorities. Milk used in any product intended forconsumption in fluid form must meet this inspection standard.
Grade B milk—Also called manufacturing grade milk. Milk produced andprocessed with sanitary regulations prescribed, inspected, and approved bypublic health authorities for milk to be used for manufactured products only.Not to be confused with “milk used in manufacturing,” which can includegrade A milk.
Handlers—Generally refers to fluid milk processors but can include manu-facturing plants and cooperatives that supply fluid processor needs.
Mailbox price—The price actually received by producers. Includes allpayments received for milk sold and all costs associated with the milk.
Make allowance—The allowance to cover the cost of manufacturing that isadministratively set to attain CCC purchase prices for butter, nonfat dry
107Economic Effects of U.S. Dairy Policy and Alternative Approaches to Milk Pricing
U.S. Department of Agriculture
milk, and cheese that will enable manufacturing plants to pay, on average,the support price of milk to farmers.
Manufactured dairy products—Includes all dairy products except fluidmilks: all cheeses, butter, evaporated whole milk, condensed whole milk,condensed skim milk, whole milk powder, nonfat dry milk, ice cream, icecream mix, frozen desserts, creams, and whey products.
Manufacturers—Generally refers to the producers of cheese, butter, nonfatdry milk, and other storable dairy products.
Manufacturing milk—Grade B milk or the Grade A milk used in theproduction of manufactured dairy products.
Market power—The ability of buyers or sellers to influence prices above orbelow the prices that would have been set in a competitive market.
Milkfat—The fat normally occurring in cow milk. Milkfat consists of short-chain fatty acids that make it easy to digest. Also referred to as butterfat.
Milk Income Loss Contract (MILC)—Compensates dairy producersthrough direct payments when domestic prices fall below a specified level.Payments are made to a producer up to a maximum of 2.4 million poundsof milk produced per fiscal year.
Milk marketing area—A geographically defined fluid milk demand areafor purposes of Federal milk marketing regulations. If a designated portionof a handler’s milk is sold in the milk marketing area, all milk of thathandler is “pooled.”
Milk protein concentrate (MPC)—Protein product derived from skim milk.
Milk-based fractions—Separated milk components with specific functionalproperties. By separating milk into different fractions, processors can selectthe specific functional and nutritional qualities needed for a particular foodproduct.
Multiple component pricing—A way of pricing milk that determines itsvalue based on the values of butterfat and nonfat solids (nonfat dry milk,protein, lactose, or other nonfat solids) used in manufactured dairy prod-ucts. Component values are related to the prices of butter, cheese, andnonfat dry milk.
Natural cheese—Cheese made directly from milk (or whey in someinstances). Processed cheese is made by combining natural cheese withother ingredients, heating and mixing them to make a creamy, smoothproduct.
Nonfat dry milk (NDM or NFDM)—Product obtained by removing waterfrom pasteurized skim milk. Also referred to as skimmed milk powder(SMP) in international markets.
108Economic Effects of U.S. Dairy Policy and Alternative Approaches to Milk Pricing
U.S. Department of Agriculture
Northeast Interstate Dairy Compact (NEIDC)—A formal agreementbetween the six New England States, enacted through State and Federallegislation, that allowed for the establishment of a regional pricing mecha-nism for fluid milk sold in the New England States.
Over-order premium—Payment or price above Federal (or California’s)order minimum prices. Over-order premiums that are generated by themarket could result from costs of services provided to handlers, tightenedsupply conditions, or market power. State-mandated over-order premiumsregulate payments or prices above Federal order minimum prices.
Parity price—The price which gives a unit of a commodity the samepurchasing power today as it had in a base period.
Pooling (revenue, price)—A method for determining how revenues gener-ated in a market are returned to producers. With a classified pricing systemsuch as that used in Federal and State orders, processors pay different pricesfor milk in each category of use. Producers are paid a weighted average, or“blend,” price for all uses of milk in a particular order or market.
Processors—Generally refers to firms that process raw Grade A milk intofluid dairy products.
Raw milk—Farm milk that has not been treated in any way. Raw milk is notpasteurized, separated, standardized, or homogenized.
Skim solids—The solids in milk other than milk fat; e.g., protein, lactose,and minerals. Sometimes referred to as nonfat solids or solids-not-fat(SNF).
Soft products—A category of manufactured products with relatively shortshelf life; i.e., cottage cheese, sour cream, ice cream, yogurt, buttermilk, etc.
Solids-not-fat—See skim solids.
Supply management—Variety of plans that attempt to keep milk produc-tion—either nationally or in a specific market—from exceeding commercialmarket needs. Can be used as an alternative to low prices as a way to controlproduction in periods of surplus or as a long-term approach to pricing.
Tariff-rate quota (TRQ)—A two-level tariff where the tariff rate chargeddepends on the volume of imports. A lower (in-quota) tariff is charged onimports within the quota volume and a higher (over-quota) tariff is chargedon imports in excess of the quota volume.
Utilization rates—The relative use of each class of milk in a region or order.
109Economic Effects of U.S. Dairy Policy and Alternative Approaches to Milk Pricing
U.S. Department of Agriculture